Embed Size (px)
Citation preview
ARTICLE IN PRESS
0378-4371/$ - se
doi:10.1016/j.ph
�CorrespondE-mail addr
Physica A 369 (2006) 655–678
www.elsevier.com/locate/physa
Regular and stochastic behavior of Parkinsonianpathological tremor signals
R.M. Yulmetyeva,b,�, S.A. Demina,b, O. Yu. Panischeva,b, Peter Hanggic,S.F. Timashevd, G.V. Vstovskye
aDepartment of Physics, Kazan State University, 420008 Kazan, Kremlevskaya Street, 18, Russian FederationbDepartment of Physics, Kazan State Pedagogical University, 420021 Kazan, Mezhlauk Street, 1, Russian Federation
cDepartment of Physics, University of Augsburg, Universitatsstrasse 1, D-86135 Augsburg, GermanydKarpov Institute of Physical Chemistry, 105064 Moskow, Vorontsovo Pole Street, 10, Russian Federation
eSemenov Institute of Chemical Physics, 117977 Moscow, Kosygina Street, 4, Russian Federation
Received 4 July 2005; received in revised form 11 January 2006
Available online 23 February 2006
Abstract
Regular and stochastic behavior in the time series of Parkinsonian pathological tremor velocity is studied on the basis of
the statistical theory of discrete non-Markov stochastic processes and flicker-noise spectroscopy. We have developed a new
method of analyzing and diagnosing Parkinson’s disease (PD) by taking into consideration discreteness, fluctuations, long-
and short-range correlations, regular and stochastic behavior, Markov and non-Markov effects and dynamic alternation
of relaxation modes in the initial time signals. The spectrum of the statistical non-Markovity parameter reflects Markovity
and non-Markovity in the initial time series of tremor. The relaxation and kinetic parameters used in the method allow us
to estimate the relaxation scales of diverse scenarios of the time signals produced by the patient in various dynamic states.
The local time behavior of the initial time correlation function and the first point of the non-Markovity parameter give
detailed information about the variation of pathological tremor in the local regions of the time series. The obtained results
can be used to find the most effective method of reducing or suppressing pathological tremor in each individual case of a
PD patient. Generally, the method allows one to assess the efficacy of the medical treatment for a group of PD patients.
r 2006 Elsevier B.V. All rights reserved.
Keywords: Discrete non-Markov processes; Flicker-noise spectroscopy; Time-series analysis; Parkinson’s disease; Complex systems
1. Introduction. Parkinson’s disease
Recently, much effort has been made in searching new alternative methods of diagnosing, treating andpreventing severe diseases of central nervous and locomotor systems. Among them, Parkinson’s disease (PD)is one of the most serious illnesses. PD, was called so by the French neurologist Pierre Marie Charcot in the19th century to honor Dr. James Parkinson, who first described the disease in 1817. Dr. Parkinson presentedthe account of the observation results made, about six patients in his book An essay on the shaking palsy.
e front matter r 2006 Elsevier B.V. All rights reserved.
ysa.2006.01.077
ing author.
esses: [email protected] (R.M. Yulmetyev), [email protected] (S.A. Demin).
ARTICLE IN PRESSR.M. Yulmetyev et al. / Physica A 369 (2006) 655–678656
The present paper deals with two physical methods used in combination to analyze, diagnose and treat PD.The possibilities of the methods are assessed and compared. The comparison allowed us to add extrainformation about the behavior of PD pathological tremor physical parameters.
The first method is based on the notions and concepts of the statistical theory of discrete non-Markovstochastic processes [1,2]. The method is connected with the studies of statistical non-Markov effects, long-and short-range statistical memory effects, regularity and stochastic behavior effects, and dynamic alternationof relaxation modes in the patient in various dynamic states. The study of non-Markov effects in complexsystems in biology [3–6], physics [6–9], seismology [10,11], and medicine [2,12–14] is of special interest forcorrelation analysis. The scale of time fluctuations, long-range effects, discreteness of various processes andstates, and the effects of dynamic alternation in the initial time series are important role in this respect. Thediscreteness of experimental data, statistical effects of long- and short-range memory and the constructive roleof fluctuations and correlations can be used to obtain information about the properties and parameters of thesystem under study. Within this method, a set of quantitative and qualitative parameters allows one todetermine typical distinctions between the natural and after treatment states of a patient, describes a detailedvariation in patient’s pathological tremor, and helps to choose the most effective treatment of separatepatients and statistical groups.
The second method, flicker-noise spectroscopy (FNS), is a general phenomenological approach to theanalysis of the behavior of complex nonlinear systems. It is designed to extract the informationcontained in chaotic signals of various natures: time series, spatial series, and complex power spectraproduced by the systems. Within the FNS method, the series of various irregularities (spikes, jumps,discontinuities of derivatives of various orders) of the dynamic variables of a system at all levels of its temporaland spatial hierarchy are analyzed to extract the information that can help to predict the behavior of thesystem. The use of irregularities in the dynamic variables as the information basis or ‘‘colors’’ of the FNSmethodology enables us not only to classify all the information contained in the chaotic series in the mostgeneral phenomenological form, but also to extract distinctively any desired portion of this information. TheFNS method can be used to solve three types of problems: to determine the parameters, or patterns,characterizing the behavior or structural features of open complex (physical, chemical, natural) systems; todetermine the precursors of the sharpest changes in the state of open dissipative systems of various naturesusing the prior information about the behavior of the systems; to determine the redistribution behavior ofexcitations in the distributed systems by analyzing dynamic correlations in chaotic signals measuredsimultaneously at different points.
PD is a progressing chronic brain disease manifesting itself in movement disorders. PD is caused by complexbiochemical processes accompanied by the lack of the chemical substance dopamine. Dopamine acts as atransmitter of signals from one nervous cell to another. The lack of the neurotransmitter dopamine causeschanges in the brain parts that control human motor functions.
The origin of PD is not clear. It is most frequently believed that this disease is caused by a combination ofthree factors: biological aging, heredity and exposure to some toxins. The major PD symptoms arehypokinesia, stiffness and tremor. New ideas and principles are required to solve the problems emerging inclassical treatment methods. The diagnostics of the disease in the early stages is one of these problems. Onlythe joint efforts of experts from different science areas can bring a solution to this kind of problems. Forexample, the modern methods of biophysics, biochemistry and neurophysiology enabled us to makeconsiderable progress in understanding PD reasons and developing the methods of its treatment.
Today, there are three methods of PD treatment: medicamentous therapy, neurologic surgery andelectromagnetic stimulation of certain brain areas. To obtain a more reliable picture of PD evolution, it isnecessary to use physical methods. In this case, statistical methods of analysis are of special importance. Theyare used to analyze experimental time series of various parameters of tremor in patient’s limbs. As a rule, theexperimental data are obtained by conventional biomechanical methods [15–17] such as recording of electricsignals in leg muscles when the patient is walking [18] or by laser recording of physiological and pathologicaltremor in human hands [19–23].
A nonlinear dynamical model is used to analyze a variety of human gaits [24]. The stride-interval time seriesin normal human gait is characterized by slightly multifractal fluctuations. The fractal nature of thefluctuations becomes more pronounced under both the increase and decrease in the average gait [24].
ARTICLE IN PRESSR.M. Yulmetyev et al. / Physica A 369 (2006) 655–678 657
Nonlinear time series analysis is applied in studying normal and pathological human walking [18]. Theproblems caused by age changes in a human gait [25–28], various movement disorders and locomotor systemdiseases [29,30] are studied by Hausdorff. A nonlinear signal, multimodal (independent) oscillations, and theperiodic pattern of time records in hand tremor and muscle activity in a PD patient are studied in Ref. [23]. PDpatients exhibit tremor, involuntary movements of the limbs. Typically the frequency spectrum of tremor hasbroad peaks at ‘‘harmonic’’ frequencies, much like that is seen in other physical processes. In general, this typeof harmonic structure in the frequency domain may be due to two possible mechanisms: a nonlinearoscillation or a superposition of (multiple) independent modes of oscillation [23]. Various dynamical states ofPD patients are also studied by means of the time series of pathological tremor in fingers [31–35].
At present special attention is attached to the problems of distinguishing and analyzing of the stochastic andregular components of experimental time series of biological systems. Thereto various methods of nonlinearphysics and simulation by nonlinear oscillators [36–40], the methods of fractal analysis of time series [41–46],the methods of detrended fluctuation analysis [47,48] are used.
In Ref. [36] Babloyantz et al. presented a simple graphical method that unveils subtle correlations betweenshort sequences of a chaotic time series. Similar events, even from noisy and nonstationary data, are clusteredtogether and appear as well-defined patterns on a two-dimensional diagram and can be quantified. The generalmethod is applied to the electrocardiogram of a patient with a malfunctioning pacemaker, the residence timesof trajectories in the Lorenz attractor as well as the logistic map. In this paper the authors introduced a simplegraphical method that projects the trajectories of chaotic attractors into various planes in a way mat unveilsvery subtle correlations between consecutive sequences of events. The merit of the method resides in the factthat these sequences may extend over more than ten events. The sequences with similar relationships but notthe same absolute values may appear as well-defined structures in a two-dimensional diagram. The advantageof this mapping is that, although the sequences may take into account more than three consecutive events, thetwo-dimensional projections are extremely helpful visual aides for elucidation of some aspects of chaoticdynamics.
Goldbeter et al. studied various biological rhythms which regulate the vital activity of living systems anddetermine the control mechanisms of these rhythms. In Ref. [38] the periodic oscillations at all levels ofbiological organization, with periods ranging from a fraction of a second to years were observed. The authorsof Ref. [39] examined the mechanisms of transitions from simple to complex oscillatory phenomena inmetabolic and genetic networks. The mechanisms underlying such transitions are examined in models for avariety of rhythmic processes in several live systems. Ref. [40] is devoted to the study of circadian oscillationsstochastic dynamics and the influences the gene expression exerts on it. Authors show the way robust circadianoscillations are produced from a ‘‘bar-code’’ pattern of gene expression.
Liebovitch et al. reveal the local features of dynamics of various biological systems by the methods of fractalanalysis and various methods of nonlinear physics. In Ref. [41] the question was examined: the way thedynamics of neural networks of the Hopfield type depends on the updating scheme, temperature dependence,degree of locality of connections between elements and the number of memories. Further the results wereapplied to interpret some features of protein dynamics. In Refs. [42,43] authors studied the self-organizing andthe synchronization of the trajectory of a coupled systems dynamics. In particular, in Ref. [42] the authorsintroduced a scheme of controlling the dynamics of deterministic systems by coupling it to the dynamics ofother similar systems. The controlled systems synchronized their dynamics with the control signal in periodicas well as chaotic regimes. In Ref. [44] the processes of transition from persistent to antipersistent correlationwas studied by means of fractal analysis methods of a time series: fractional Brownian motion, rescaled rangeanalysis, variance analysis, zero-crossing analysis. The authors discussed several simple random walk modelswhich produce such transitions (bounded correlated random walk, fractional Brownian motion with a longrelaxation time), and therefore are candidates for the mechanisms that may be present in some biologicalsystems. The authors have studied the way the pattern, seen in the experimental data of biological systems,persistent at short time intervals and antipersistent at long time intervals, could arise from dynamical systems.The comparison of Hurst coefficient, which was calculated on the basis of different fractal analysis methods,was carried out. The article [45] is devoted to the study of the cardiac rhythm abnormalities by means ofestimation of the probability density function and Hurst rescaled range analysis. In paper [46] the authorsexamined the effects of fractal ion-channel activity in modifications of two classical neuronal models:
ARTICLE IN PRESSR.M. Yulmetyev et al. / Physica A 369 (2006) 655–678658
Fitzhugh-Nagumo and Hodgkin-Huxley. The authors came to the conclusion that fractal ion channel gatingactivity was sufficient to account for the fractal-rate firing behavior.
In this paper a qualitatively new methodology of extracting the information from the time series on theunited basis of the theory of discrete non-Markov stochastic processes and the FNS for the case of PD issubmitted. This methodology presents a simple graphic and relatively inexpensive method of analysis ofvarious physiological and pathological patient’s states. In particular, it allows to make a quantitativeestimation of the quality of treatment and to define the most effective method of treatment in each individualcase and for a group of patients. We determine the structure of the initial time signal, and also the informationabout the nonstationary effects or about the dynamic alternation by a set of quantitative physicalcharacteristics. We give special attention to the analysis of correlations and fluctuations which determine thetime evolution in live systems.
In particular, the signals of PD pathological tremor are physically interpreted to answer the followingquestions:
(i) How can the study of the stochastic behavior and regularity in tremor signals help in evaluating the stateof a PD patient?
(ii) How do certain physical parameters related to Markov and non-Markov features, statistical memoryeffects and dynamic alternation of relaxation modes in the initial time signal change?
(iii) How do the low- and high-frequency components of the initial time signal respond to the changes ofpathological tremor in the patient under treatment?
2. Basic concepts and definition of statistical theory of discrete non-Markov random processes
The theory of discrete non-Markov stochastic processes [1,2] is based on the finite-difference representationof the kinetic Zwanzig–Mori’s [49–52] for condensed matters, which are well known in the statistical physics ofnonequilibrium processes. The theory is also widely used in analyzing complex biological and social systems.Dynamic, kinetic and relaxation parameters provided by this theory contain detailed information on a widerange of parameters and properties of complex systems.
Let the behavior of PD pathological tremor velocity be described by a discrete time series xj of variable X:
X ¼ fxðTÞ; xðT þ tÞ;xðT þ 2tÞ; . . . ;xðT þ tN � tÞg. (1)
Here T is the time at which the recording of the pathological tremor is started, ðN � 1Þt is the total time ofsignal recording, and t is the discretization time. In the system under study the discretization time is t ¼ 10�2 s.To describe the dynamic parameters of pathological tremor (correlation dynamics), it is convenient to use anormalized time correlation function (TCF):
aðtÞ ¼1
ðN �mÞs2XN�1�m
j¼0
dxjdxjþm ¼1
ðN �mÞs2XN�1�m
j¼0
dxðT þ jtÞdxðT þ ðj þmÞtÞ,
t ¼ mt; 1pmpN � 1. ð2Þ
TCF depending on current t ¼ mt can be conveniently used to analyze dynamic properties of complexsystems. TCF usage means that the developed method is true of complex systems, when correlation functionexists. The mean value hX i, fluctuations dxj , absolute (s2) and relative (d2) dispersion for a set of randomvariables (Eq. (1)) can be easily found by
hX i ¼1
N
XN�1j¼0
xðT þ jtÞ,
xj ¼ xðT þ jtÞ; dxj ¼ xj � hX i,
s2 ¼1
N
XN�1j¼0
dxj ; d2 ¼s2
hX i2.
ARTICLE IN PRESSR.M. Yulmetyev et al. / Physica A 369 (2006) 655–678 659
The function aðtÞ satisfies the normalization and relaxation conditions of correlations: limt!0 aðtÞ ¼ 1;limt!1 aðtÞ ¼ 0.
By using the Zwanzig–Mori’s technique of projection operators [49–52] it is possible to receive aninterconnected chain of finite-difference equations of a non-Markovian type [1,2] for the initial TCF aðtÞ andthe normalized memory functions in the following way:
DaðtÞ
Dt¼ l1aðtÞ � tL1
Xm�1j¼0
M1ðjtÞaðt� jtÞ. (3)
Here l1 is the eigenvalue and L1 is the relaxation parameter of Liouville’s quasioperator L. Function M1ðjtÞ isa normalized memory function of the first order:
l1 ¼ ihA0
kð0ÞLA0kð0Þi
hjA0kð0Þj
2i; L1 ¼
hA0kð0ÞL12L21A
0kð0Þi
hjA0kð0Þj
2i,
M1ðjtÞ ¼hA0
kð0ÞL12ð1þ itL22ÞjA0
kð0Þi
hA0kð0ÞL12L21A
0kð0Þi
; M1ð0Þ ¼ 1. (4)
Gram–Schmidt orthogonalization procedure hWn;Wmi ¼ dn;mhjWnj2i, where dn;m is Kronecker’s symbol,
can be used to rewrite the above equations in a compact form:
W0 ¼ A0kð0Þ; W1 ¼ ðiL� l1ÞW0; W2 ¼ ðiL� l2ÞW1 � L1W0; . . . ,
Wn ¼ ðiL� lnÞWn�1 � Ln�1Wn�2 � . . . .
Then the eigenvalue l1 of Liouville’s quasioperator and the relaxation parameter L1 in Eq. (3) take theform of:
l1 ¼ ihW0LW0i
hjW0j2i
; L1 ¼ ihW0LW1i
hjW0j2i
.
The normalized memory function of the first order in Eq. (3) is rewritten as
M1ðtÞ ¼hW1ð1þ itL22Þ
mW1i
hjW1ð0Þj2i
.
The finite-difference kinetic (3) represents the generalization of Zwanzig–Mori’s kinetic theory [49–52],which is well known in statistical physics, for complex discrete non-Hamiltonian statistical systems. Withinour method of the analysis of dynamics of the statistical time series we do not use Eq. (3) as an object for thesubsequent theoretical analysis. In this connection we do not use the equations such as Zwanzig–Mori’s formemory functions of the second and higher orders. We use the algorithm, which was above described, tocalculate the time dynamics aðtÞ, M1ðtÞ and parameters l1, L1. The dependences aðtÞ and M1ðtÞ are calculatedon the basis of the experimental data, independently of each other. At the same time we control the conformityof the calculated dependences aðtÞ, M1ðtÞ and parameters l1, L1 to Eq. (3) (the precision of the conformity is�2–5% for the cases described here). We use the dependences aðtÞ and M1ðtÞ to analyze the amplitude ofParkinsonian tremor velocity. We also use these dependences to calculate the non-Markovity parameter [1,2]which characterizes the degree of correlativity of the signal. The studies, which have been carried out earlier[2,12,13], show that this parameter contains detailed information about the physiological state of a system.
In this paper, we shall use the spectral dependence �1ðnÞ of the first point of the non-Markovity parameter[1,2]:
�1ðnÞ ¼m0ðnÞm1ðnÞ
� �1=2
, (5)
ARTICLE IN PRESSR.M. Yulmetyev et al. / Physica A 369 (2006) 655–678660
which is determined by means of Fourier transformations m0ðnÞ, m1ðnÞ of functions aðtÞ and M1ðtÞ, respectively:
m0ðnÞ ¼XN�1j¼0
aðtjÞ cosð2pntjÞ
����������2
; m1ðnÞ ¼XN�1j¼0
M1ðtjÞ cosð2pntjÞ
����������2
.
Further we shall show, that the application of the frequency-dependence �1ðnÞ and the values of this parameteron zero frequency:
�1ðn ¼ 0Þ ¼ �1ð0Þ ¼m0ð0Þm1ð0Þ
� �1=2
, (6)
allows to introduce the quantitative estimations for various dynamic states of a patient with PD. Inparticular, we shall show, that the values of parameter �1ð0Þ�10
1 for the analyzed system are chara-cteristic of stable physiological states (for the patient under treatment). The appearance of pathology in asystem leads to a sharp decrease in this parameter, approximately by one order. Thus, we cancompare quantitatively various dynamic states of the studied system considering the changes of the non-Markovity parameter.
3. Flicker-noise spectroscopy for analysis of time series of dynamic variables
New information about chaotic time signals can be obtained by the method of the FNS [53–57]. Itsadvantage consists in extracting information from the series of distinct irregularities (spikes, jumps,discontinuities of derivatives of various orders) by analyzing the behavior of time, spatial and power dynamicvariables at each existential level of the hierarchical organization of the system. Thus, the most valuableinformation is obtained by analyzing the power spectra and the difference moments (‘‘structural functions’’) ofvarious orders. It is necessary to point out, that the difference moments are formed exclusively by irregularitiesof a jump type. On the other hand, the power spectra are formed by the contributions of two types ofirregularities: peaks and jumps.
The FNS method was applied to analyze the dynamics of various physical and chemical processes [58–65].Among them are fluctuations of electric voltage in electrochemical systems (considered in the process offormation of porous silicon under conditions of anodic polarization, formation of molecular hydrogen onplatinum under cathodic polarization, initiation of hydrodynamical instability in the field of an over-limitingcurrent in electro-membrane systems), fluctuating dynamics of the solar activity, fluctuation of a velocitycomponent in turbulent streams. Unique abilities of the FNS method to locate the multipoint correlationinterrelations were shown in Refs. [66–68]. That was done on the basis of the analysis of simultaneouslymeasured signals at spaced points of the distributed systems.
The basic relations of FNS are given below. We analyze the chaotic series of dynamic variable xðtÞ over thetime interval Ttot ¼ Nt, where t is a sampling time.
1. We proceed from the notion of hierarchy of spatial-temporal levels of the organization of open dynamicdissipative systems.
2. The most valuable information in the chaotic series is stored in irregularities of various types, such aspeaks, jumps, breaks of derivatives of different orders. The parameters which characterize the properties ofirregularities, can be obtained by the analysis of power spectra Sðf Þ (f is a frequency):
Sðf Þ ¼1
N
XN
k¼1
dxk cosð2pfktÞ
" #2þ
1
N
XN
k¼1
dxk sinð2pfktÞ
" #2, (7)
where xk ¼ xðT þ tkÞ and tk ¼ kt,
dxk ¼ xk �1
N
XN
k¼1
xk
ARTICLE IN PRESSR.M. Yulmetyev et al. / Physica A 369 (2006) 655–678 661
and also by the analysis of transitive difference moments (‘‘transitive structural functions’’) Fð2ÞðtnÞ of thesecond order:
Fð2ÞðtnÞ ¼1
N � n
XN�n
k¼1
½xðtkÞ � xðtkþnÞ�2, (8)
where tn is a delay parameter. Further, when considering the dependence Fð2ÞðtnÞ we will not specify thebottom index.
It should be noted that the proposed averaging procedure differs from Gibbs’s procedure when averaging iscarried out by using the probability density. Actually, we do not consider the statistics of ensembles as it isdone in the statistical Gibbs’s thermodynamics which is based on ergodic hypothesis. We also generalizeEinstein’s approach to the analysis of fluctuation dynamics [69,70].
3. Parameters or ‘‘passport data’’, obtained by the analysis of dependences Sðf Þ and Fð2ÞðtnÞ, are correlationtimes and dimensionless parameters. These dimensionless parameters describe the loss of ‘‘memory’’(correlation relations) in irregularities of a ‘‘spikes’’ and ‘‘jumps’’ type.
4. For stationary processes in open dissipative systems the moment Fð2ÞðtnÞ depends only on the difference ofarguments nt. The self-similar structure is realized in this case. It means that the dependences Sðf Þ or Fð2ÞðtnÞ
are identical for each level of the system hierarchy.It should be noted, that the reverse transformations in the FNS methodology are not used in the way it
takes place in Fourier- or in wavelet-analysis. Therefore, no constraints are imposed on the character of thedependence xðtÞ except for the existence of average values.
3.1. Basic equations for stationary processes
Let us obtain approximations for Sðf Þ and Fð2ÞðtnÞ, which are determined by irregularities in the behavior ofdynamic variables. At the first stage the generalized d-functions are used to approximate the spikes of thedynamic variables, and Heavyside functions are used to approximate the jumps. At the same time the ‘‘low-frequency’’ limit f51=2pTi is considered, when the characteristic time intervals Ti between the nearestirregularities are much less than all the characteristic times of the considered system. In case of stationaryprocesses the obtained expressions are the same for each of the hierarchical levels. Then simple approximationdependence (see Refs. [53–57] for more information) can be obtained for Sðf Þ and Fð2ÞðtnÞ.
The approximation for the structural function of the second order reads:
Fð2ÞðtÞ ¼ 2 � s2 � ½1� G�1ðH1Þ � GðH1; t=T1Þ�2. (9)
Here GðsÞ and Gðs;xÞ are, respectively, the gamma-function and incomplete gamma-function ðxX0 and s40Þ;s is dispersion of the measured dynamic variable with dimension ½x�. Value H1 is a Hurst’s parameter. Itcharacterizes the rate of loss of ‘‘memory’’ during the time intervals shorter than the correlation time T1. Asfollows from Eq. (9), Fð2ÞðtÞ ! s2 for tbT1; parameter T1 actually characterizes the time interval duringwhich ‘‘forgetting’’ of the previous value of the dynamic variable occurs. Such ‘‘forgetting’’ is the consequenceof the ‘‘jumps’’ of the dynamic variable at each level of the spatio-temporal hierarchy. True, the structuralfunction is zero, Fð2ÞðtÞ ¼ 0, for the sequences of the irregularities-spikes, which are represented by a sequenceof d-functions (see Chapter 4.3 (Fig. 51) of Schuster’s monograph [70]). At the same time, a continuous powerspectrum Sðf Þ can be calculated for the correlated sequence of d-functions within a low-frequency limit atf51=2pTi, as was shown in Ref. [70]. Sðf Þ is determined by a correlation character of the analyzed sequenceof the generalized functions. In particular, Sðf Þ can have dependence of a flicker-noise type: Sðf Þ�1=f s, wheres�1. The conclusion about diverse information carried by the power spectra and the difference momentsunderlies the FNS method. Some artificial time series, generalizing the image of the signal as the sequence of d-functions, earlier introduced by Schuster is used in this case.
Any signal, formed exclusively by irregularities-jumps, can be subject to Fourier transformation to obtainthe power spectrum. Thus, the difference moment Fð2ÞðtÞ is formed only by jumps of a dynamic variable atdifferent spatio-temporal levels of the system hierarchy, and both spikes and jumps contribute to the powerspectrum Sðf Þ.
ARTICLE IN PRESSR.M. Yulmetyev et al. / Physica A 369 (2006) 655–678662
The standard notion about the identity of the information represented by Fð2ÞðtÞ and Sðf Þ, is validonly for ‘‘smooth’’ functions. However, real signals V ðtÞ are never smooth. Therefore, the FNSmethod focuses on giving the essence of information on sequences of irregularities latent in real signals andeliminates information discrepancy, making it possible to extract the information by considering variousfeatures.
Eq. (9) can be used to find the phenomenological parameters ½H1;T1;s�. Contribution SJðf Þ to the powerspectrum Sðf Þ, determined by the influence of irregularities, such as jumps, is expressed by the formula:
SJðf Þ � SJ ð0Þ1
1þ ð2pT1f Þ2H1þ1
, (10)
SJð0Þ ¼ 4s2T1H1 1�1
2H1G2ðH1Þ
Z 10
G2ðH1; xÞdx� �
.
Due to spikes the contribution SBðf Þ to power spectrum Sðf Þ can be generally presented as the expression:
SBðf Þ �SBð0Þ
1þ ð2pfT00Þn0, (11)
where parameter n0 characterizes the velocity of the ‘‘losses of memory’’ (correlation relations) in a sequenceof spikes during the time intervals shorter than the correlation time T00. Parameters ½n0;T00;SBð0Þ�characterize self-similarity in the correlation relations of the peaks. For the resulting power spectrum anapproximation is used:
Sðf Þ �Sð0Þ
1þ ð2pfT0Þn , (12)
where Sð0Þ, T0 and n are phenomenological parameters. The parameters which are determined in such a waydiffer from the parameters which are used in Eq. (10): SJð0ÞaSBð0Þ;T1aT0 and 2H1 þ 1an0. So, theparameters determined from the power spectra and the structural functions of the second order give differentinformation. The comparison of the parameters obtained by the analysis of the experimental series withnumerical values of the parameters for model cases (Fick diffusion, Levy diffusion, Kolmogorov turbulence,turbulent diffusion, see Ref. [57]) allows to estimate qualitatively the character of the studied evolution (seeRef. [57] for more information).
The use of irregularities such as spikes, jumps, discontinuities of derivatives as the information basis of theFNS method allows to classify and extract phenomenological information contained in chaotic series.However, evolution of real biological systems has a more complex and nonstationary nature. In particular, theresonance frequencies in the dependences described above, can be specific for the studied system. Theresonance frequencies appear as peaks in the power spectra Sðf Þ and the oscillatory character of functionFð2ÞðtÞ. Thus, the values of resonance frequencies can change during the nonstationary evolution. Thereforefor each state of the studied dynamics, the dependences Sðf Þ and Fð2ÞðtÞ are to be considered as ‘‘patterns’’ or‘‘cliche’’. These dependences allow to estimate individual informational characteristics of the state of thesystem: times of loss of correlation relations, sets of specific frequencies, factors of nonstationarity. This willbe demonstrated below in the analysis of Parkinsonian tremor dynamics.
3.2. Relaxation smoothing of signal, splitting into ‘‘low-frequency’’ and ‘‘high-frequency’’ components
In the analysis of the experimental series we frequently face the problem of smoothing of the initial signals.Usually the smoothing polynoms and wavelets are used to filtrate a signal and to extract a low-frequencycomponent. Here we will describe briefly the method [57] of splitting the signal into ‘‘low-frequency’’ xRðtÞ and‘‘high-frequency’’ xF ðtÞ components. The method is based on an iterative procedure of a numeric solution of aheat conductivity equation:
qx
qt¼ w
q2x
qt2. (13)
ARTICLE IN PRESSR.M. Yulmetyev et al. / Physica A 369 (2006) 655–678 663
It uses an elementary explicit finite difference scheme:
xjþ1k � x
jk
Dt¼ w
xjkþ1 þ x
jk�1 � 2x
jk
ðDtÞ2, (14)
that gives:
xjþ1k ¼ x
jk þ
wDt
ðDtÞ2ðx
jkþ1 þ x
jk�1 � 2x
jkÞ. (15a)
Using designation D ¼ wDt=ðDtÞ2, where D is a diffusion coefficient, we shall rewrite the last equation as
xjþ1k ¼ Dx
jkþ1 þDx
jk�1 þ ð1� 2DÞx
jk. (15b)
Iterations of this formula give a stable solution to Do 12[57]. For the smoothing procedure it is necessary to set
limiting conditions. Let smoothing be carried out for a series of M samples (points). At each step of iterationsextreme values for k ¼ 1 and M are calculated as
xjþ11 ¼ ð1� 2DÞx
j1 þ 2Dx
j2; x
jþ1M ¼ ð1� 2DÞxj
m þ 2DxjM�1. (15c)
When calculating new values of signal xjþ1k for j þ 1 ‘‘relaxation’’ step by the values x
jk (for j ¼ 0 the initial
signal xðtÞ is set) we can obtain ‘‘low-frequency’’ component xR. ‘‘High-frequency’’ component xF is obtainedby subtracting it from the initial signal. Actually, the smoothing procedure corresponds to the consecutivereduction of local gradients of values of variables with mutual rapprochement of points. The splitting of theinitial signal xðtÞ into two components xRðtÞ and xF ðtÞ enables us to calculate the dependences Sðf Þ and Fð2ÞðtÞfor three functions xJ ðtÞ ðJ ¼ R;F or G ¼ Rþ F Þ. Index G is used for the initial signal xðtÞ. In particular, thelow-frequency (‘‘flicker-noise’’) component, which is present in any chaotic signal, is effectively removed whencalculating dependence SF ðf Þ. Therefore, specific frequencies of the studied system come to light. This will beshown below in the analysis of the fluctuations of Parkinsonian tremor velocity. The analysis of dependencesSðf Þ and Fð2ÞðtÞ, which are calculated separately for each of components R and F, presents special interest forthe study of medical parameters.
4. Analysis of experimental data. Velocity of pathological tremor in patients with Parkinson’s disease
As the experimental data we use the time records of pathological tremor velocity in an index finger ofpatients with PD [71,72].
Sixteen subjects with PD participated in the study. All subjects were receiving chronic stimulation either uni-or bilaterally to relieve the symptoms of PD including tremor, dyskinesia or rigidity. The participants receiveddeep brain stimulation (DBS) of the internal globus pallidus (GPi) or subthalamic nucleus (STN), orventrointermediate nucleus of the thalamus (Vim). They were all under 70 years of age and the group included11 males and five females. All participants were clinically stable at the moment of the tests; they did not showcognitive impairment and did not suffer from a major depressive disorder. All subjects were under minimumdopaminergic therapy (ranging from 300 to 1200mg per day of L-Dopa) at the time of the study and tookother PD related medications.
The selected subjects were asked to refrain from taking their medication for at least 12 h before thebeginning of the tests and were allowed to have not more than one coffee for breakfast on the two testing days.Rest tremor was recorded on the most affected side with a velocity-transducing laser [73,74]. This laser is a safe(Class II) helium–neon laser. The laser beam is split, with one part directed at the finger and the other, calledthe reference, directed at a rotating disk inside the laser. Back scattered light from the rotating disk is used todetermine the sign of the velocity signal. Finger tremor was detected and converted into a calibrated voltageoutput proportional to finger velocity. Velocity is more sensitive to low-frequency components inherent inpathological and physiological tremor [74]. Than acceleration is the system did not require any specialcalibration procedure. The laser was placed at about 30 cm from the index finger tip and the laser beam wasdirected perpendicular to a piece of a reflective tape placed on the finger tip.
ARTICLE IN PRESSR.M. Yulmetyev et al. / Physica A 369 (2006) 655–678664
Tremor was recorded with a velocity laser under two conditions of DBS (on–off), under two conditions ofmedication (L-Dopa on–off) and under four conditions of 15, 30, 45, 60min periods after stopping DBS. Theconditions, counterbalanced among the subjects included the following.
1.
The ‘‘OFF–OFF’’ condition (no medication and no stimulation). 2. The ‘‘ON–ON’’ condition (on medication and on stimulation). 3. The DBS condition—the ‘‘ON–OFF’’ condition (stimulation only). 4. The L-Dopa condition—the ‘‘OFF–ON’’ condition (no stimulation).5–8.
The ‘‘15 OFF’’, ‘‘30 OFF’’, ‘‘45 OFF’’, ‘‘60 OFF’’ conditions—the patient’s states 15, 30, 45, 60min afterthe DBS is switched off, no medication.5. Discussion of results. Comparison of statistical theory of discrete non-Markov random processes and
Flicker-noise spectroscopy
In this section we present the results of the analysis of the experimental data [71–73], which are obtainedon the basis of the statistical theory of discrete non-Markov stochastic processes and the FNS. As andemonstrative example, we describe the results for one of the patients (the sixth patient, a woman, 61 years-old, deep brain stimulated bilaterally target structures: subthalamic nucleus, total daily medication 300mg).The analysis the of experimental data allows to reveal some dynamic properties of PD tremor in eachindividual case and a group of patients. The obtained results characterize the group of 16 patients in ageneral way.
5.1. Non-Markovity, randomness, dynamic alternation and pathological tremor caused by Parkinson’s disease
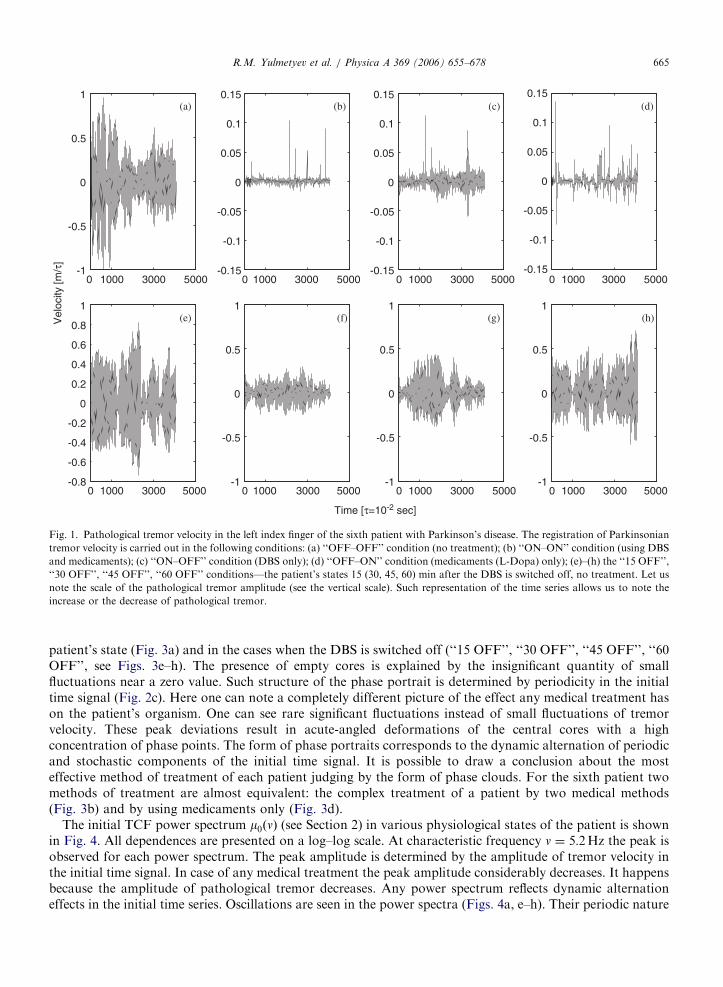
In Fig. 1 the initial time series of Parkinsonian tremor velocity of the patient’s (sixth patient) index fingertremor is shown. By this record it is possible to reveal great differences (see the vertical scale) in tremorvelocity of the patient’s state, when the treatment is not used (Fig. 1a) and under medical treatment(Figs. 1b–d). The amplitudes of the tremor velocity for the ‘‘OFF–OFF’’ patient’s state (Fig. 1a) and for the‘‘ON–ON’’ state (Fig. 1b) differ by 94 times on average. The amplitude of tremor velocity when the DBS isswitched off (‘‘15 OFF’’, ‘‘30 OFF’’, ‘‘45 OFF’’, ‘‘60 OFF’’ conditions) (Figs. 1e–h) has a residual periodiccharacter. The analysis of the initial time records does not allow to determine a method with the best medicaleffect. In some cases (Figs. 1e, h) a medical method produces a negative effect that results in the amplitudeincrease of tremor velocity and deterioration of the state of the patient. It is difficult to draw a conclusionabout the efficacy of this or that treatment and to explain the after effect of the DBS based on the initial timesignals.
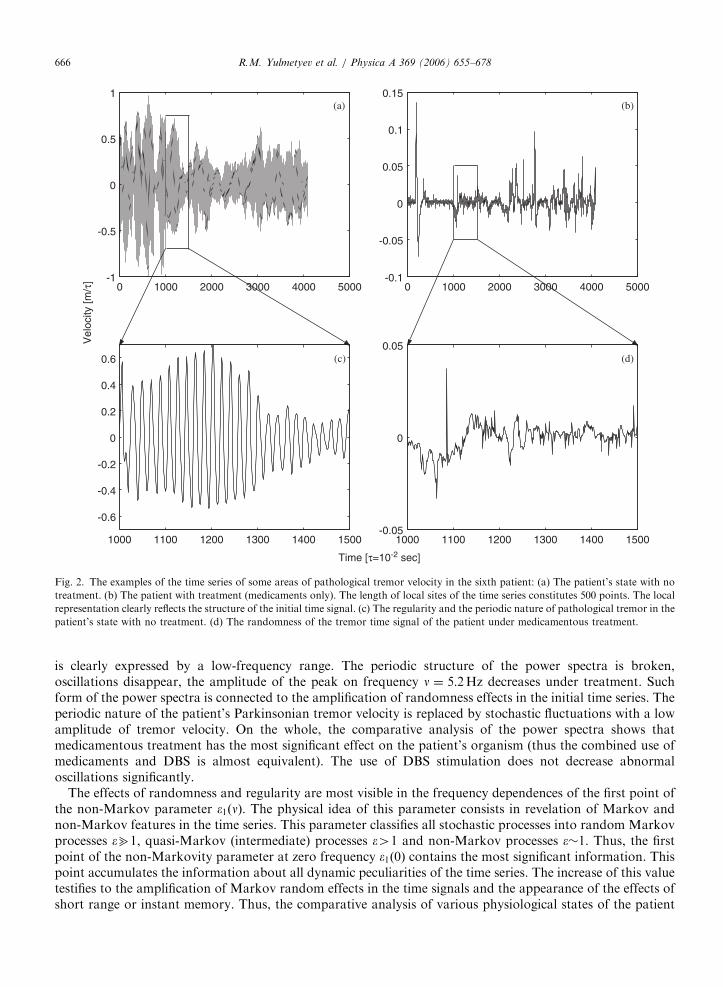
A different representation of the signal allows to reveal the effects of periodicity and randomness in theinitial time series. In Fig. 2 the initial time series of tremor velocity in two states of the patient (see Figs. 1a, d)are shown. We have chosen some local areas (500 points) of these time records. For the ‘‘OFF–OFF’’ patient’sstate (Fig. 2c) the initial time signal has a periodic structure. Similar periodicity of the initial time signal isconnected to pathological tremor of the patient’s limbs (with frequency n ¼ 5:2Hz). Retention of the structureis also observed when the DBS is switched off (see Figs. 1e–h). Medication produces a different effect on thepatient (‘‘OFF–ON’’ state, see Fig. 2d). The periodicity of the initial signal is replaced by randomness. Thesimilar picture is characteristic of all methods of treatment (see Figs. 1b–d). This conclusion confirms thegeneral idea about the transition of stochastic dynamic modes in case of the patient’s normal physiologicalstate to the periodic modes in a pathological state. This reasoning was confirmed by the analysis of the initialtime series of all 16 patients.
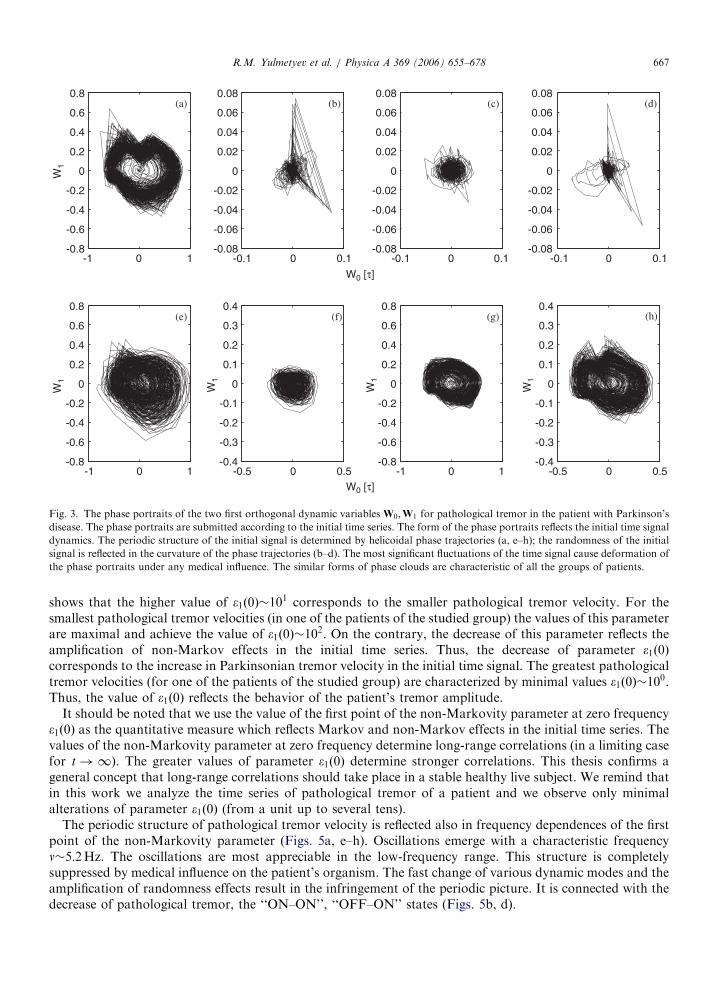
The plane projections of phase trajectories of the two first dynamic orthogonal variables W0; W1 (seeSection 2) in various states of the patient are shown in Fig. 3. All figures are submitted according to the initialtime series. The structure of the phase trajectories is determined by the presence of fluctuations in the initialtime series. The most significant fluctuations lead to deformation of phase clouds. The phase portraits consistof empty cores and helicoidal trajectories with a high concentration of phase points in the ‘‘OFF–OFF’’
ARTICLE IN PRESS
0 1000 3000 5000-1
-0.5
0
0.5
1
0 1000 3000 5000-0.15
-0.1
-0.05
0
0.05
0.1
0.15
0 1000 3000 5000-0.15
-0.1
-0.05
0
0.05
0.1
0.15
0 1000 3000 5000-0.15
-0.1
-0.05
0
0.05
0.1
0.15
0 1000 3000 5000-0.8
-0.6
-0.4
-0.2
0
0.2
0.4
0.6
0.8
1
0 1000 3000 5000-1
-0.5
0
0.5
1
0 1000 3000 5000-1
-0.5
0
0.5
1
0 1000 3000 5000-1
-0.5
0
0.5
1
Vel
ocity
[m/τ
]
Time [τ=10-2 sec]
(a) (b) (c) (d)
(e) (f) (g) (h)
Fig. 1. Pathological tremor velocity in the left index finger of the sixth patient with Parkinson’s disease. The registration of Parkinsonian
tremor velocity is carried out in the following conditions: (a) ‘‘OFF–OFF’’ condition (no treatment); (b) ‘‘ON–ON’’ condition (using DBS
and medicaments); (c) ‘‘ON–OFF’’ condition (DBS only); (d) ‘‘OFF–ON’’ condition (medicaments (L-Dopa) only); (e)–(h) the ‘‘15 OFF’’,
‘‘30 OFF’’, ‘‘45 OFF’’, ‘‘60 OFF’’ conditions—the patient’s states 15 (30, 45, 60) min after the DBS is switched off, no treatment. Let us
note the scale of the pathological tremor amplitude (see the vertical scale). Such representation of the time series allows us to note the
increase or the decrease of pathological tremor.
R.M. Yulmetyev et al. / Physica A 369 (2006) 655–678 665
patient’s state (Fig. 3a) and in the cases when the DBS is switched off (‘‘15 OFF’’, ‘‘30 OFF’’, ‘‘45 OFF’’, ‘‘60OFF’’, see Figs. 3e–h). The presence of empty cores is explained by the insignificant quantity of smallfluctuations near a zero value. Such structure of the phase portrait is determined by periodicity in the initialtime signal (Fig. 2c). Here one can note a completely different picture of the effect any medical treatment hason the patient’s organism. One can see rare significant fluctuations instead of small fluctuations of tremorvelocity. These peak deviations result in acute-angled deformations of the central cores with a highconcentration of phase points. The form of phase portraits corresponds to the dynamic alternation of periodicand stochastic components of the initial time signal. It is possible to draw a conclusion about the mosteffective method of treatment of each patient judging by the form of phase clouds. For the sixth patient twomethods of treatment are almost equivalent: the complex treatment of a patient by two medical methods(Fig. 3b) and by using medicaments only (Fig. 3d).
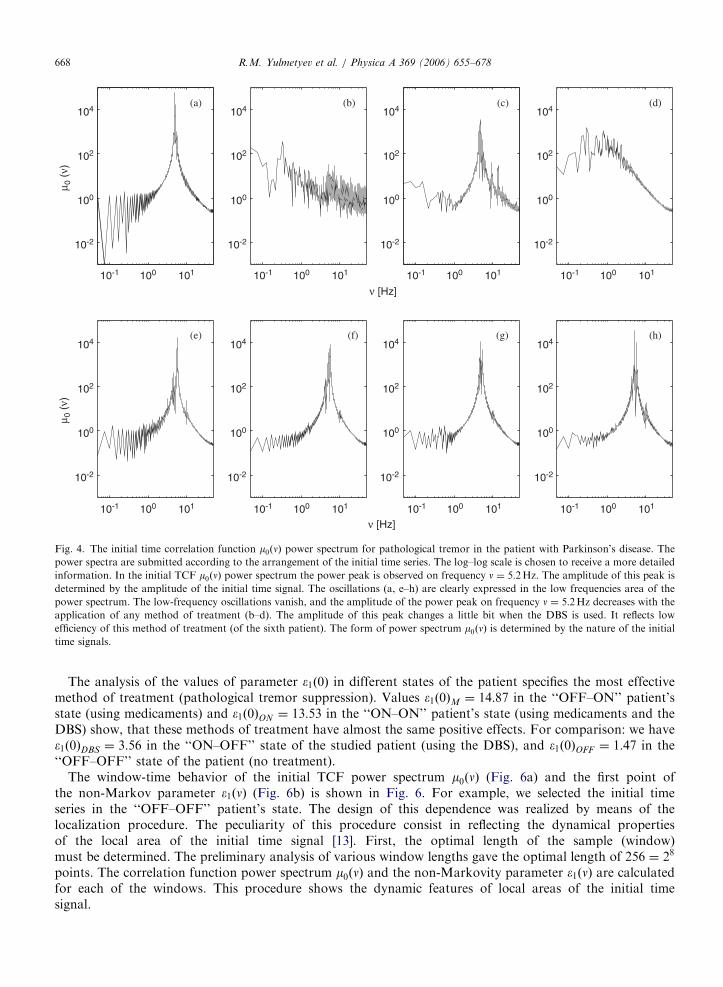
The initial TCF power spectrum m0ðnÞ (see Section 2) in various physiological states of the patient is shownin Fig. 4. All dependences are presented on a log–log scale. At characteristic frequency n ¼ 5:2Hz the peak isobserved for each power spectrum. The peak amplitude is determined by the amplitude of tremor velocity inthe initial time signal. In case of any medical treatment the peak amplitude considerably decreases. It happensbecause the amplitude of pathological tremor decreases. Any power spectrum reflects dynamic alternationeffects in the initial time series. Oscillations are seen in the power spectra (Figs. 4a, e–h). Their periodic nature
ARTICLE IN PRESS
0 1000 2000 3000 4000 5000-1
-0.5
0
0.5
1
1000 1100 1200 1300 1400 1500
-0.6
-0.4
-0.2
0
0.2
0.4
0.6
0 1000 2000 3000 4000 5000-0.1
-0.05
0
0.05
0.1
0.15
1000 1100 1200 1300 1400 1500-0.05
0
0.05
(a) (b)
(c) (d)
Time [τ=10-2 sec]
Vel
ocity
[m/τ
]
Fig. 2. The examples of the time series of some areas of pathological tremor velocity in the sixth patient: (a) The patient’s state with no
treatment. (b) The patient with treatment (medicaments only). The length of local sites of the time series constitutes 500 points. The local
representation clearly reflects the structure of the initial time signal. (c) The regularity and the periodic nature of pathological tremor in the
patient’s state with no treatment. (d) The randomness of the tremor time signal of the patient under medicamentous treatment.
R.M. Yulmetyev et al. / Physica A 369 (2006) 655–678666
is clearly expressed by a low-frequency range. The periodic structure of the power spectra is broken,oscillations disappear, the amplitude of the peak on frequency n ¼ 5:2Hz decreases under treatment. Suchform of the power spectra is connected to the amplification of randomness effects in the initial time series. Theperiodic nature of the patient’s Parkinsonian tremor velocity is replaced by stochastic fluctuations with a lowamplitude of tremor velocity. On the whole, the comparative analysis of the power spectra shows thatmedicamentous treatment has the most significant effect on the patient’s organism (thus the combined use ofmedicaments and DBS is almost equivalent). The use of DBS stimulation does not decrease abnormaloscillations significantly.
The effects of randomness and regularity are most visible in the frequency dependences of the first point ofthe non-Markov parameter �1ðnÞ. The physical idea of this parameter consists in revelation of Markov andnon-Markov features in the time series. This parameter classifies all stochastic processes into random Markovprocesses �b1, quasi-Markov (intermediate) processes �41 and non-Markov processes ��1. Thus, the firstpoint of the non-Markovity parameter at zero frequency �1ð0Þ contains the most significant information. Thispoint accumulates the information about all dynamic peculiarities of the time series. The increase of this valuetestifies to the amplification of Markov random effects in the time signals and the appearance of the effects ofshort range or instant memory. Thus, the comparative analysis of various physiological states of the patient
ARTICLE IN PRESS
-1 0 1-0.8
-0.6
-0.4
-0.2
0
0.2
0.4
0.6
0.8
W1
-0.1 0 0.1-0.08
-0.06
-0.04
-0.02
0
0.02
0.04
0.06
0.08
W0 [τ]
-0.1 0 0.1-0.08
-0.06
-0.04
-0.02
0
0.02
0.04
0.06
0.08
-0.1 0 0.1-0.08
-0.06
-0.04
-0.02
0
0.02
0.04
0.06
0.08
-1 0 1-0.8
-0.6
-0.4
-0.2
0
0.2
0.4
0.6
0.8
W1
-0.5 0 0.5-0.4
-0.3
-0.2
-0.1
0
0.1
0.2
0.3
0.4
W0 [τ]
W1
-1 0 1-0.8
-0.6
-0.4
-0.2
0
0.2
0.4
0.6
0.8
W1
-0.5 0 0.5-0.4
-0.3
-0.2
-0.1
0
0.1
0.2
0.3
0.4
W1
(a) (b) (c) (d)
(e) (f) (g) (h)
Fig. 3. The phase portraits of the two first orthogonal dynamic variables W0;W1 for pathological tremor in the patient with Parkinson’s
disease. The phase portraits are submitted according to the initial time series. The form of the phase portraits reflects the initial time signal
dynamics. The periodic structure of the initial signal is determined by helicoidal phase trajectories (a, e–h); the randomness of the initial
signal is reflected in the curvature of the phase trajectories (b–d). The most significant fluctuations of the time signal cause deformation of
the phase portraits under any medical influence. The similar forms of phase clouds are characteristic of all the groups of patients.
R.M. Yulmetyev et al. / Physica A 369 (2006) 655–678 667
shows that the higher value of �1ð0Þ�101 corresponds to the smaller pathological tremor velocity. For the
smallest pathological tremor velocities (in one of the patients of the studied group) the values of this parameterare maximal and achieve the value of �1ð0Þ�10
2. On the contrary, the decrease of this parameter reflects theamplification of non-Markov effects in the initial time series. Thus, the decrease of parameter �1ð0Þcorresponds to the increase in Parkinsonian tremor velocity in the initial time signal. The greatest pathologicaltremor velocities (for one of the patients of the studied group) are characterized by minimal values �1ð0Þ�10
0.Thus, the value of �1ð0Þ reflects the behavior of the patient’s tremor amplitude.
It should be noted that we use the value of the first point of the non-Markovity parameter at zero frequency�1ð0Þ as the quantitative measure which reflects Markov and non-Markov effects in the initial time series. Thevalues of the non-Markovity parameter at zero frequency determine long-range correlations (in a limiting casefor t!1). The greater values of parameter �1ð0Þ determine stronger correlations. This thesis confirms ageneral concept that long-range correlations should take place in a stable healthy live subject. We remind thatin this work we analyze the time series of pathological tremor of a patient and we observe only minimalalterations of parameter �1ð0Þ (from a unit up to several tens).
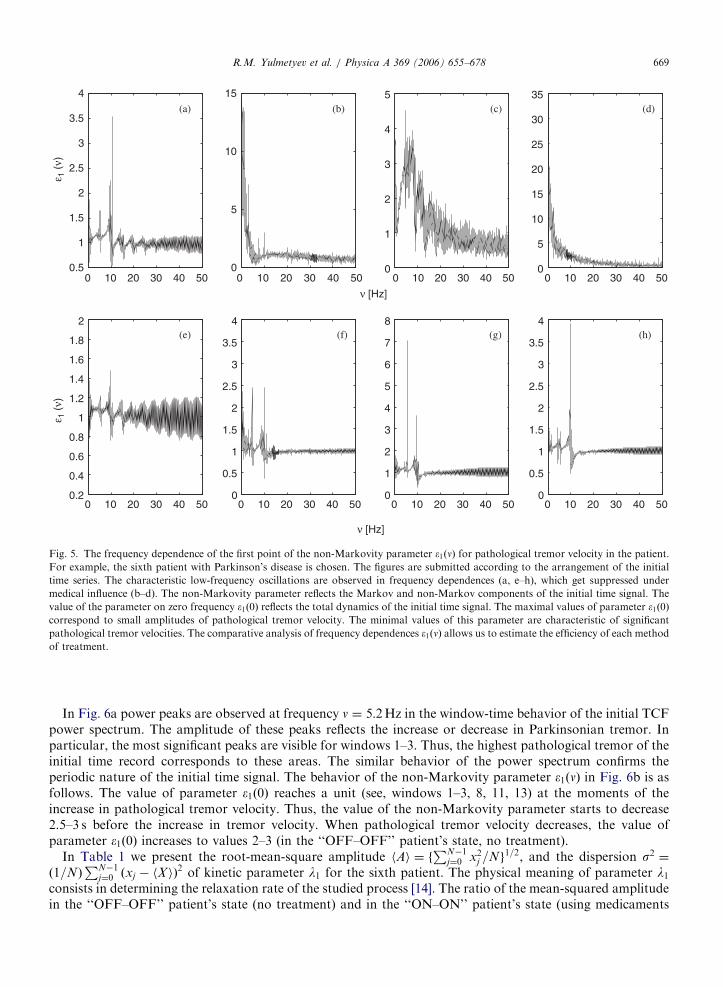
The periodic structure of pathological tremor velocity is reflected also in frequency dependences of the firstpoint of the non-Markovity parameter (Figs. 5a, e–h). Oscillations emerge with a characteristic frequencyn�5:2Hz. The oscillations are most appreciable in the low-frequency range. This structure is completelysuppressed by medical influence on the patient’s organism. The fast change of various dynamic modes and theamplification of randomness effects result in the infringement of the periodic picture. It is connected with thedecrease of pathological tremor, the ‘‘ON–ON’’, ‘‘OFF–ON’’ states (Figs. 5b, d).
ARTICLE IN PRESS
10-2
100
102
104
10-2
100
102
104
10-2
100
102
104
10-2
100
102
104
10-2
100
102
104
10-2
100
102
104
10-2
100
102
104
10-2
100
102
104
ν [Hz]
µ 0 (
ν)µ 0
(ν)
ν [Hz]
(a) (b) (c) (d)
(e) (f) (g) (h)
10-1 100 101
10-1 100 101 10-1 100 101 10-1 100 101 10-1 100 101
10-1 100 101 10-1 100 101 10-1 100 101
Fig. 4. The initial time correlation function m0ðnÞ power spectrum for pathological tremor in the patient with Parkinson’s disease. The
power spectra are submitted according to the arrangement of the initial time series. The log–log scale is chosen to receive a more detailed
information. In the initial TCF m0ðnÞ power spectrum the power peak is observed on frequency n ¼ 5:2Hz. The amplitude of this peak is
determined by the amplitude of the initial time signal. The oscillations (a, e–h) are clearly expressed in the low frequencies area of the
power spectrum. The low-frequency oscillations vanish, and the amplitude of the power peak on frequency n ¼ 5:2Hz decreases with the
application of any method of treatment (b–d). The amplitude of this peak changes a little bit when the DBS is used. It reflects low
efficiency of this method of treatment (of the sixth patient). The form of power spectrum m0ðnÞ is determined by the nature of the initial
time signals.
R.M. Yulmetyev et al. / Physica A 369 (2006) 655–678668
The analysis of the values of parameter �1ð0Þ in different states of the patient specifies the most effectivemethod of treatment (pathological tremor suppression). Values �1ð0ÞM ¼ 14:87 in the ‘‘OFF–ON’’ patient’sstate (using medicaments) and �1ð0ÞON ¼ 13:53 in the ‘‘ON–ON’’ patient’s state (using medicaments and theDBS) show, that these methods of treatment have almost the same positive effects. For comparison: we have�1ð0ÞDBS ¼ 3:56 in the ‘‘ON–OFF’’ state of the studied patient (using the DBS), and �1ð0ÞOFF ¼ 1:47 in the‘‘OFF–OFF’’ state of the patient (no treatment).
The window-time behavior of the initial TCF power spectrum m0ðnÞ (Fig. 6a) and the first point ofthe non-Markov parameter �1ðnÞ (Fig. 6b) is shown in Fig. 6. For example, we selected the initial timeseries in the ‘‘OFF–OFF’’ patient’s state. The design of this dependence was realized by means of thelocalization procedure. The peculiarity of this procedure consist in reflecting the dynamical propertiesof the local area of the initial time signal [13]. First, the optimal length of the sample (window)must be determined. The preliminary analysis of various window lengths gave the optimal length of 256 ¼ 28
points. The correlation function power spectrum m0ðnÞ and the non-Markovity parameter �1ðnÞ are calculatedfor each of the windows. This procedure shows the dynamic features of local areas of the initial timesignal.
ARTICLE IN PRESS
0 10 20 30 40 500.5
1
1.5
2
2.5
3
3.5
4
ε 1 (
ν)
0 10 20 30 40 500
5
10
15
ν [Hz]
0 10 20 30 40 500
1
2
3
4
5
0 10 20 30 40 500
5
10
15
20
25
30
35
0 10 20 30 40 500.2
0.4
0.6
0.8
1
1.2
1.4
1.6
1.8
2
ε 1 (
ν)
0 10 20 30 40 500
0.5
1
1.5
2
2.5
3
3.5
4
ν [Hz]
0 10 20 30 40 500
1
2
3
4
5
6
7
8
0 10 20 30 40 500
0.5
1
1.5
2
2.5
3
3.5
4
(a) (b) (c) (d)
(e) (f) (g) (h)
Fig. 5. The frequency dependence of the first point of the non-Markovity parameter �1ðnÞ for pathological tremor velocity in the patient.
For example, the sixth patient with Parkinson’s disease is chosen. The figures are submitted according to the arrangement of the initial
time series. The characteristic low-frequency oscillations are observed in frequency dependences (a, e–h), which get suppressed under
medical influence (b–d). The non-Markovity parameter reflects the Markov and non-Markov components of the initial time signal. The
value of the parameter on zero frequency �1ð0Þ reflects the total dynamics of the initial time signal. The maximal values of parameter �1ð0Þcorrespond to small amplitudes of pathological tremor velocity. The minimal values of this parameter are characteristic of significant
pathological tremor velocities. The comparative analysis of frequency dependences �1ðnÞ allows us to estimate the efficiency of each method
of treatment.
R.M. Yulmetyev et al. / Physica A 369 (2006) 655–678 669
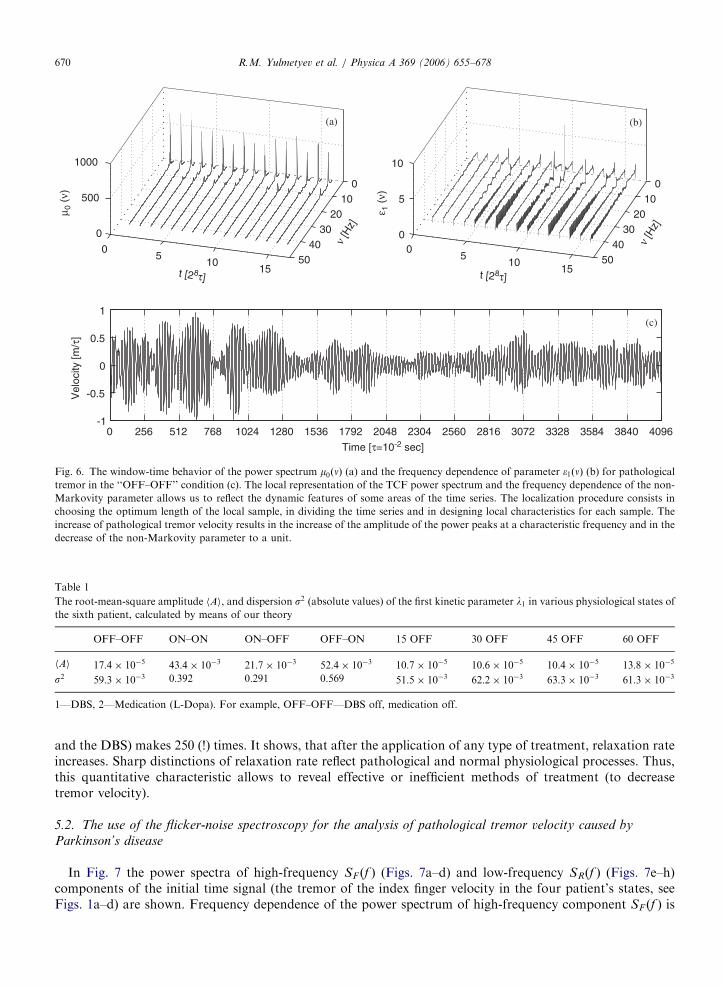
In Fig. 6a power peaks are observed at frequency n ¼ 5:2Hz in the window-time behavior of the initial TCFpower spectrum. The amplitude of these peaks reflects the increase or decrease in Parkinsonian tremor. Inparticular, the most significant peaks are visible for windows 1–3. Thus, the highest pathological tremor of theinitial time record corresponds to these areas. The similar behavior of the power spectrum confirms theperiodic nature of the initial time signal. The behavior of the non-Markovity parameter �1ðnÞ in Fig. 6b is asfollows. The value of parameter �1ð0Þ reaches a unit (see, windows 1–3, 8, 11, 13) at the moments of theincrease in pathological tremor velocity. Thus, the value of the non-Markovity parameter starts to decrease2.5–3 s before the increase in tremor velocity. When pathological tremor velocity decreases, the value ofparameter �1ð0Þ increases to values 2–3 (in the ‘‘OFF–OFF’’ patient’s state, no treatment).
In Table 1 we present the root-mean-square amplitude hAi ¼ fPN�1
j¼0 x2j =Ng1=2, and the dispersion s2 ¼
ð1=NÞPN�1
j¼0 ðxj � hX iÞ2 of kinetic parameter l1 for the sixth patient. The physical meaning of parameter l1
consists in determining the relaxation rate of the studied process [14]. The ratio of the mean-squared amplitudein the ‘‘OFF–OFF’’ patient’s state (no treatment) and in the ‘‘ON–ON’’ patient’s state (using medicaments
ARTICLE IN PRESS
0 256 512 768 1024 1280 1536 1792 2048 2304 2560 2816 3072 3328 3584 3840 4096-1
-0.5
0
0.5
1
010
2030
4050
05
1015
0
500
1000
ν [H
z]
µ 0 (
ν)
010
2030
4050
05
1015
0
5
10
ν [H
z]
ε 1 (
ν)
t [28τ] t [28τ]
Vel
ocity
[m/τ
]
Time [τ=10-2 sec]
(a) (b)
(c)
Fig. 6. The window-time behavior of the power spectrum m0ðnÞ (a) and the frequency dependence of parameter �1ðnÞ (b) for pathologicaltremor in the ‘‘OFF–OFF’’ condition (c). The local representation of the TCF power spectrum and the frequency dependence of the non-
Markovity parameter allows us to reflect the dynamic features of some areas of the time series. The localization procedure consists in
choosing the optimum length of the local sample, in dividing the time series and in designing local characteristics for each sample. The
increase of pathological tremor velocity results in the increase of the amplitude of the power peaks at a characteristic frequency and in the
decrease of the non-Markovity parameter to a unit.
Table 1
The root-mean-square amplitude hAi, and dispersion s2 (absolute values) of the first kinetic parameter l1 in various physiological states of
the sixth patient, calculated by means of our theory
OFF–OFF ON–ON ON–OFF OFF–ON 15 OFF 30 OFF 45 OFF 60 OFF
hAi 17:4� 10�5 43:4� 10�3 21:7� 10�3 52:4� 10�3 10:7� 10�5 10:6� 10�5 10:4� 10�5 13:8� 10�5
s2 59:3� 10�3 0:392 0:291 0:569 51:5� 10�3 62:2� 10�3 63:3� 10�3 61:3� 10�3
1—DBS, 2—Medication (L-Dopa). For example, OFF–OFF—DBS off, medication off.
R.M. Yulmetyev et al. / Physica A 369 (2006) 655–678670
and the DBS) makes 250 (!) times. It shows, that after the application of any type of treatment, relaxation rateincreases. Sharp distinctions of relaxation rate reflect pathological and normal physiological processes. Thus,this quantitative characteristic allows to reveal effective or inefficient methods of treatment (to decreasetremor velocity).
5.2. The use of the flicker-noise spectroscopy for the analysis of pathological tremor velocity caused by
Parkinson’s disease
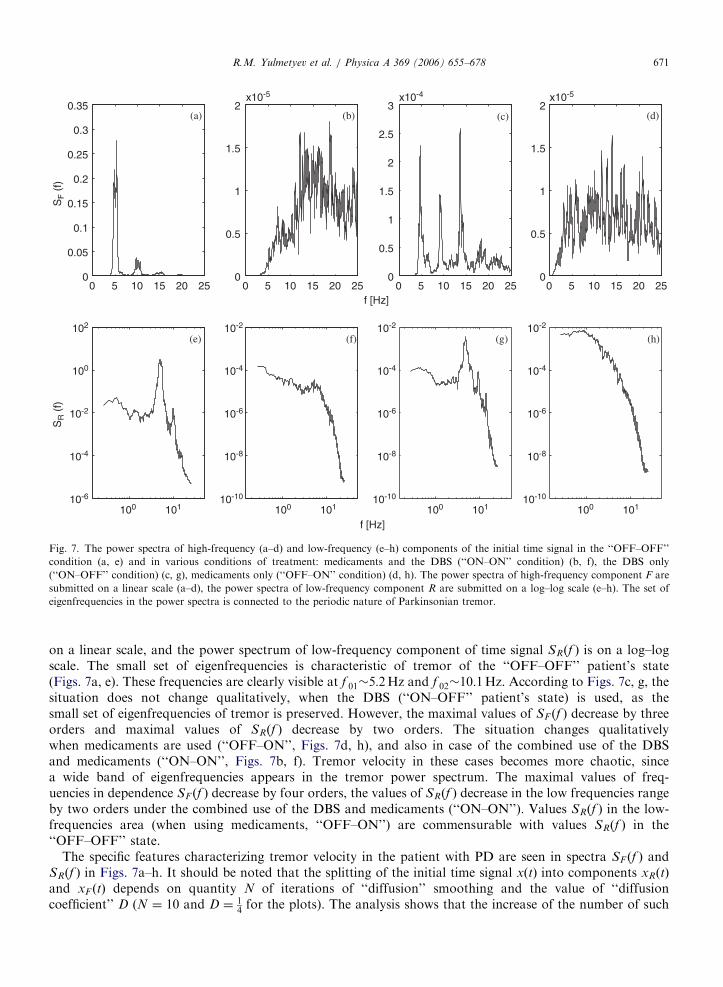
In Fig. 7 the power spectra of high-frequency SF ðf Þ (Figs. 7a–d) and low-frequency SRðf Þ (Figs. 7e–h)components of the initial time signal (the tremor of the index finger velocity in the four patient’s states, seeFigs. 1a–d) are shown. Frequency dependence of the power spectrum of high-frequency component SF ðf Þ is
ARTICLE IN PRESS
0 5 10 15 20 250
0.05
0.1
0.15
0.2
0.25
0.3
0.35
0 5 10 15 20 250
0.5
1
1.5
2x10⁻⁵
0 5 10 15 20 250
0.5
1
1.5
2
2.5
3x10⁻⁴
0 5 10 15 20 250
0.5
1
1.5
2x10⁻⁵
10-6
10-4
10-2
100
102
10-10
10-8
10-6
10-4
10-2
10-10
10-8
10-6
10-4
10-2
10-10
10-8
10-6
10-4
10-2
(a) (b) (c) (d)
(e) (f) (g) (h)
SF (
f)S
R (
f)
f [Hz]
f [Hz]100 101 100 101 100 101 100 101
Fig. 7. The power spectra of high-frequency (a–d) and low-frequency (e–h) components of the initial time signal in the ‘‘OFF–OFF’’
condition (a, e) and in various conditions of treatment: medicaments and the DBS (‘‘ON–ON’’ condition) (b, f), the DBS only
(‘‘ON–OFF’’ condition) (c, g), medicaments only (‘‘OFF–ON’’ condition) (d, h). The power spectra of high-frequency component F are
submitted on a linear scale (a–d), the power spectra of low-frequency component R are submitted on a log–log scale (e–h). The set of
eigenfrequencies in the power spectra is connected to the periodic nature of Parkinsonian tremor.
R.M. Yulmetyev et al. / Physica A 369 (2006) 655–678 671
on a linear scale, and the power spectrum of low-frequency component of time signal SRðf Þ is on a log–logscale. The small set of eigenfrequencies is characteristic of tremor of the ‘‘OFF–OFF’’ patient’s state(Figs. 7a, e). These frequencies are clearly visible at f 01�5:2Hz and f 02�10:1Hz. According to Figs. 7c, g, thesituation does not change qualitatively, when the DBS (‘‘ON–OFF’’ patient’s state) is used, as thesmall set of eigenfrequencies of tremor is preserved. However, the maximal values of SF ðf Þ decrease by threeorders and maximal values of SRðf Þ decrease by two orders. The situation changes qualitativelywhen medicaments are used (‘‘OFF–ON’’, Figs. 7d, h), and also in case of the combined use of the DBSand medicaments (‘‘ON–ON’’, Figs. 7b, f). Tremor velocity in these cases becomes more chaotic, sincea wide band of eigenfrequencies appears in the tremor power spectrum. The maximal values of freq-uencies in dependence SF ðf Þ decrease by four orders, the values of SRðf Þ decrease in the low frequencies rangeby two orders under the combined use of the DBS and medicaments (‘‘ON–ON’’). Values SRðf Þ in the low-frequencies area (when using medicaments, ‘‘OFF–ON’’) are commensurable with values SRðf Þ in the‘‘OFF–OFF’’ state.
The specific features characterizing tremor velocity in the patient with PD are seen in spectra SF ðf Þ andSRðf Þ in Figs. 7a–h. It should be noted that the splitting of the initial time signal xðtÞ into components xRðtÞ
and xF ðtÞ depends on quantity N of iterations of ‘‘diffusion’’ smoothing and the value of ‘‘diffusioncoefficient’’ D (N ¼ 10 and D ¼ 1
4for the plots). The analysis shows that the increase of the number of such
ARTICLE IN PRESS
0 5 10 15 20 250
0.05
0.1
0.15
0.2
0.25
0.3
0.35
0.4
0.45
0 5 10 15 20 250
0.01
0.02
0.03
0.04
0.05
0.06
0.07
0.08
0 5 10 15 20 250
0.01
0.02
0.03
0.04
0.05
0.06
0.07
0 5 10 15 20 250
0.1
0.2
0.3
0.4
0.5
10-8
10-6
10-4
10-2
100
102 105
100
10-5
10-10
105
100
10-5
10-10
105
100
10-5
10-10
(a) (b) (c) (d)
(e) (f) (g) (h)
SF (
f)S
R (
f)
f [Hz]
f [Hz]
100 101 100 101 100 101 100 101
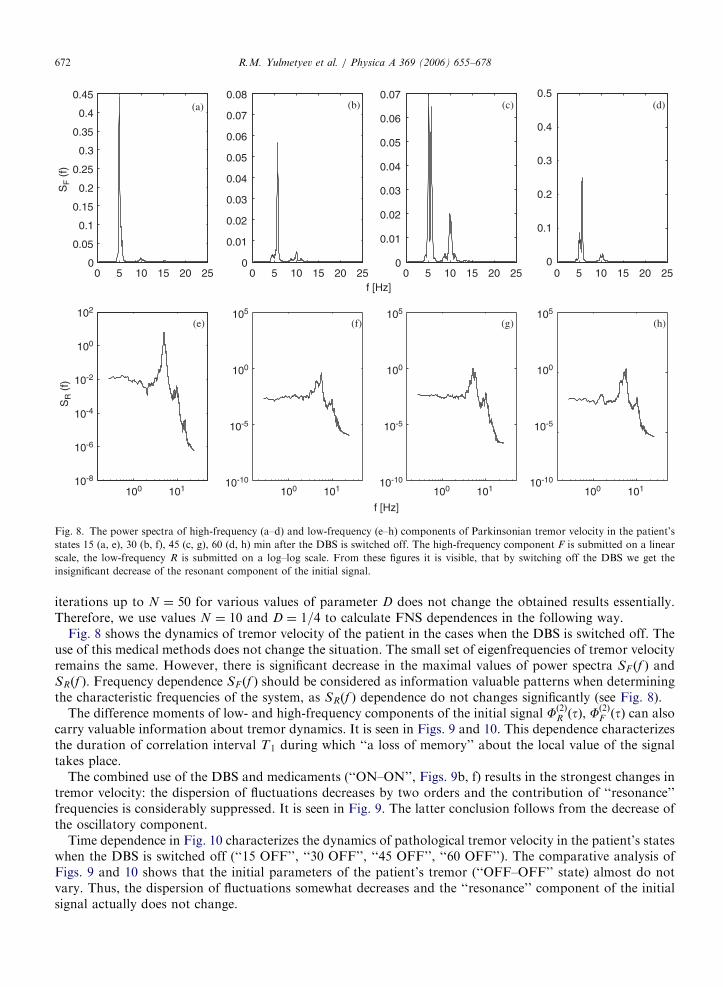
Fig. 8. The power spectra of high-frequency (a–d) and low-frequency (e–h) components of Parkinsonian tremor velocity in the patient’s
states 15 (a, e), 30 (b, f), 45 (c, g), 60 (d, h) min after the DBS is switched off. The high-frequency component F is submitted on a linear
scale, the low-frequency R is submitted on a log–log scale. From these figures it is visible, that by switching off the DBS we get the
insignificant decrease of the resonant component of the initial signal.
R.M. Yulmetyev et al. / Physica A 369 (2006) 655–678672
iterations up to N ¼ 50 for various values of parameter D does not change the obtained results essentially.Therefore, we use values N ¼ 10 and D ¼ 1=4 to calculate FNS dependences in the following way.
Fig. 8 shows the dynamics of tremor velocity of the patient in the cases when the DBS is switched off. Theuse of this medical methods does not change the situation. The small set of eigenfrequencies of tremor velocityremains the same. However, there is significant decrease in the maximal values of power spectra SF ðf Þ andSRðf Þ. Frequency dependence SF ðf Þ should be considered as information valuable patterns when determiningthe characteristic frequencies of the system, as SRðf Þ dependence do not changes significantly (see Fig. 8).
The difference moments of low- and high-frequency components of the initial signal Fð2ÞR ðtÞ, Fð2ÞF ðtÞ can also
carry valuable information about tremor dynamics. It is seen in Figs. 9 and 10. This dependence characterizesthe duration of correlation interval T1 during which ‘‘a loss of memory’’ about the local value of the signaltakes place.
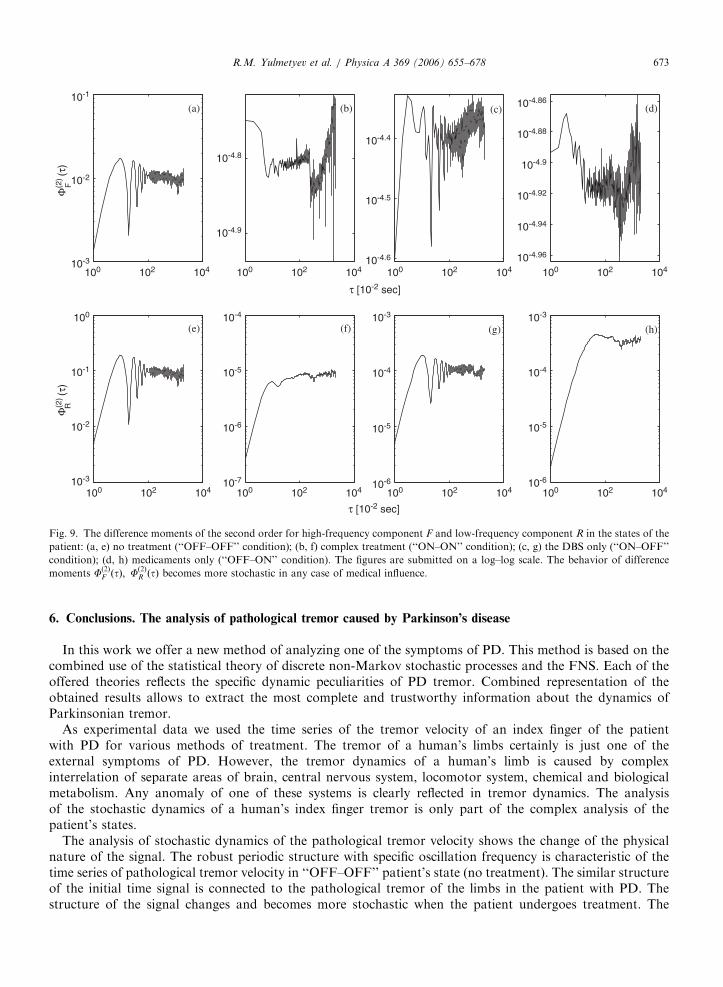
The combined use of the DBS and medicaments (‘‘ON–ON’’, Figs. 9b, f) results in the strongest changes intremor velocity: the dispersion of fluctuations decreases by two orders and the contribution of ‘‘resonance’’frequencies is considerably suppressed. It is seen in Fig. 9. The latter conclusion follows from the decrease ofthe oscillatory component.
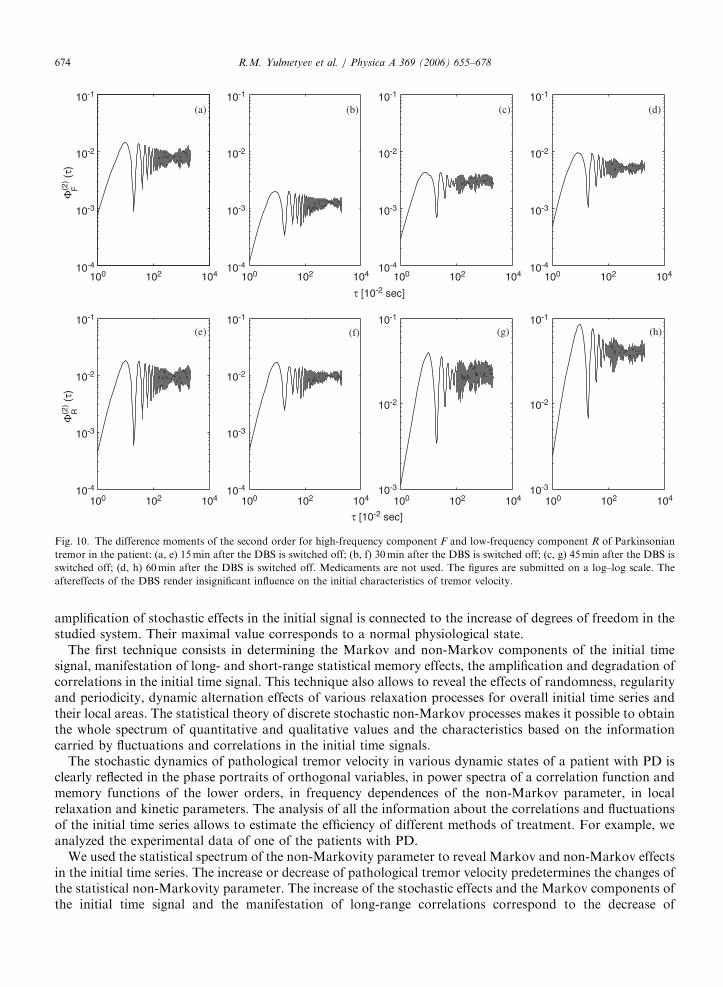
Time dependence in Fig. 10 characterizes the dynamics of pathological tremor velocity in the patient’s stateswhen the DBS is switched off (‘‘15 OFF’’, ‘‘30 OFF’’, ‘‘45 OFF’’, ‘‘60 OFF’’). The comparative analysis ofFigs. 9 and 10 shows that the initial parameters of the patient’s tremor (‘‘OFF–OFF’’ state) almost do notvary. Thus, the dispersion of fluctuations somewhat decreases and the ‘‘resonance’’ component of the initialsignal actually does not change.
ARTICLE IN PRESS
100 102 104 100 102 104 100 102 104 100 102 10410-3
10-2
10-1
Φ(2
) (τ
)
10-4.9
10-4.8
τ [10-2 sec]
10-4.6
10-4.5
10-4.4
10-4.96
10-4.94
10-4.92
10-4.9
10-4.88
10-4.86
100 102 104 100 102 104 100 102 104 100 102 10410-3
10-2
10-1
100
τ [10-2 sec]
Φ(2
) (τ
)
10-7
10-6
10-5
10-4
10-6
10-5
10-4
10-3
10-6
10-5
10-4
10-3
(a) (b) (c) (d)
(e) (f) (g) (h)
FR
Fig. 9. The difference moments of the second order for high-frequency component F and low-frequency component R in the states of the
patient: (a, e) no treatment (‘‘OFF–OFF’’ condition); (b, f) complex treatment (‘‘ON–ON’’ condition); (c, g) the DBS only (‘‘ON–OFF’’
condition); (d, h) medicaments only (‘‘OFF–ON’’ condition). The figures are submitted on a log–log scale. The behavior of difference
moments Fð2ÞF ðtÞ; Fð2ÞR ðtÞ becomes more stochastic in any case of medical influence.
R.M. Yulmetyev et al. / Physica A 369 (2006) 655–678 673
6. Conclusions. The analysis of pathological tremor caused by Parkinson’s disease
In this work we offer a new method of analyzing one of the symptoms of PD. This method is based on thecombined use of the statistical theory of discrete non-Markov stochastic processes and the FNS. Each of theoffered theories reflects the specific dynamic peculiarities of PD tremor. Combined representation of theobtained results allows to extract the most complete and trustworthy information about the dynamics ofParkinsonian tremor.
As experimental data we used the time series of the tremor velocity of an index finger of the patientwith PD for various methods of treatment. The tremor of a human’s limbs certainly is just one of theexternal symptoms of PD. However, the tremor dynamics of a human’s limb is caused by complexinterrelation of separate areas of brain, central nervous system, locomotor system, chemical and biologicalmetabolism. Any anomaly of one of these systems is clearly reflected in tremor dynamics. The analysisof the stochastic dynamics of a human’s index finger tremor is only part of the complex analysis of thepatient’s states.
The analysis of stochastic dynamics of the pathological tremor velocity shows the change of the physicalnature of the signal. The robust periodic structure with specific oscillation frequency is characteristic of thetime series of pathological tremor velocity in ‘‘OFF–OFF’’ patient’s state (no treatment). The similar structureof the initial time signal is connected to the pathological tremor of the limbs in the patient with PD. Thestructure of the signal changes and becomes more stochastic when the patient undergoes treatment. The
ARTICLE IN PRESS
100 102 104
100 102 104 100 102 104 100 102 104 100 102 104
100 102 104 100 102 104 100 102 10410-4
10-3
10-2
10-1
10-4
10-3
10-2
10-1
10-4
10-3
10-2
10-1
10-3
10-2
10-1
10-3
10-2
10-1
10-4
10-3
10-2
10-1
10-4
10-3
10-2
10-1
10-4
10-3
10-2
10-1
Φ(2
) (τ)
τ [10-2 sec]
Φ(2
) (τ)
τ [10-2 sec]
(a) (b) (c) (d)
(e) (f) (g) (h)
FR
Fig. 10. The difference moments of the second order for high-frequency component F and low-frequency component R of Parkinsonian
tremor in the patient: (a, e) 15min after the DBS is switched off; (b, f) 30min after the DBS is switched off; (c, g) 45min after the DBS is
switched off; (d, h) 60min after the DBS is switched off. Medicaments are not used. The figures are submitted on a log–log scale. The
aftereffects of the DBS render insignificant influence on the initial characteristics of tremor velocity.
R.M. Yulmetyev et al. / Physica A 369 (2006) 655–678674
amplification of stochastic effects in the initial signal is connected to the increase of degrees of freedom in thestudied system. Their maximal value corresponds to a normal physiological state.
The first technique consists in determining the Markov and non-Markov components of the initial timesignal, manifestation of long- and short-range statistical memory effects, the amplification and degradation ofcorrelations in the initial time signal. This technique also allows to reveal the effects of randomness, regularityand periodicity, dynamic alternation effects of various relaxation processes for overall initial time series andtheir local areas. The statistical theory of discrete stochastic non-Markov processes makes it possible to obtainthe whole spectrum of quantitative and qualitative values and the characteristics based on the informationcarried by fluctuations and correlations in the initial time signals.
The stochastic dynamics of pathological tremor velocity in various dynamic states of a patient with PD isclearly reflected in the phase portraits of orthogonal variables, in power spectra of a correlation function andmemory functions of the lower orders, in frequency dependences of the non-Markov parameter, in localrelaxation and kinetic parameters. The analysis of all the information about the correlations and fluctuationsof the initial time series allows to estimate the efficiency of different methods of treatment. For example, weanalyzed the experimental data of one of the patients with PD.
We used the statistical spectrum of the non-Markovity parameter to reveal Markov and non-Markov effectsin the initial time series. The increase or decrease of pathological tremor velocity predetermines the changes ofthe statistical non-Markovity parameter. The increase of the stochastic effects and the Markov components ofthe initial time signal and the manifestation of long-range correlations correspond to the decrease of
ARTICLE IN PRESSR.M. Yulmetyev et al. / Physica A 369 (2006) 655–678 675
pathological tremor velocity. At the same time the increase of pathological tremor velocity is accompanied bythe occurrence of the effects of periodicity and regularity, harmonic oscillations, non-Markov effects, themanifestation of memory effects and degradation of correlations in the initial time signals.
The described localization procedure reflects the dynamic properties of pathological tremor insome local areas of the initial time series. The window-time behavior of the initial TCF m0ðnÞ and the firstpoint of the non-Markovity parameter �1ðnÞ reflects the predictors of changes in pathological tremor velocity.Any changes of pathological tremor are instantly reflected in the window-time behavior of the dynamiccharacteristics.
Dynamic characteristics hAi and s2 of relaxation parameter l1 reflect relaxation rate in various dynamicpatient’s states. The use of any method of treatment results in acceleration of stabilization process. Significantdistinctions in the dynamic characteristics of parameter l1 in the state of the patient with no treatment(‘‘OFF–OFF’’ condition) and in the complex use of medicaments and the DBS (‘‘ON–ON’’ condition) allowto estimate the relaxation scales of physiological processes for healthy and sick people.
Finally, the change of the nature of the pathological tremor time signal results in the change of the whole setof quantitative and qualitative characteristics and exponents. The general algorithm of these changes can bedetermined in the following way. The structure of the initial time series becomes more stochastic withreduction of Parkinsonian tremor velocity. The increase of the number of degrees of freedom determinespredominance of Markov effects, manifestation of long-range correlations and more significant velocity ofrelaxation processes. The regularization of the initial time signal is observed with the increase of pathologicaltremor velocity (when this or that treatment is stopped), i.e., its structure becomes more robust. This fact isreflected in the behavior of the physical characteristics. The structure of phase clouds changes, the height ofthe peak on the characteristic frequency in the initial TCF power spectra increases, characteristic oscillationsin the frequency spectra of the non-Markovity parameter appear, the value of the first point of the non-Markovity parameter on zero frequency decreases to 1.
The use of the FNS confirms the conclusion about the resonant character of the amplitude of Parkinsoniantremor velocity. It is necessary to note that the influence of the resonant tremor component decreases, and thestochastic tremor component increases under treatment. At the same time the analysis of spectral dependencesand different moments of the second order, as well as the splitting of the signal into ‘‘high-frequency’’ and‘‘low-frequency’’ components have allowed to make the timely estimate of the patient’s state (Figs. 8 and 10)and the efficiency of different methods of treatment (Figs. 7 and 9). The estimates, which we have received, canbe used to choose the ‘‘treatment strategy’’ for the patient. It is necessary to note, that the high-frequencycomponent of pathological tremor velocity SF ðf Þ is most sensitive to the changes arising in the initial timesignal. On the whole, the method of the FNS allows to reveal the set of the eigenfrequencies and the resonantor the stochastic components of the initial time signal in various physiological states of the patient. Thismethod elicits additional information about the effects of dynamic alternation and the nonstationary effects inthe initial time series.
The methods of the time series analysis which are submitted in this paper, give a simple quantitative methodor a graphic scheme for the analysis of various physiological states of a patient with PD. Each of thesemethods is independent and reflects unique local information about the initial time signal structure.
The obtained results allow us to use the offered methods for the analysis of other complex systems ofbiological nature. In particular, the offered methods have already made it possible to receive significant resultsin the statistical analysis of the experimental data of epidemiology, cardiology, neurophysiology and of humanlocomotion.
Acknowledgments
This work was supported in part by the RFBR (Grants no. 05-02-16639-a, 04-02-16850, 05-02-17079),RHSF (Grant no. 03-06-00218a) and Grant of Federal Agency of Education of Ministry of Education andScience of RF. This work has been supported in part (P.H.) by the German Research Foundation, SFB-486,project A10. The authors acknowledge Professor, Dr. Anne Beuter and Dr. J.M. Hausdorff for stimulatingcriticism and valuable discussions, Dr. L.O. Svirina for technical assistance.
ARTICLE IN PRESSR.M. Yulmetyev et al. / Physica A 369 (2006) 655–678676
References
[1] R. Yulmetyev, P. Hanggi, F. Gafarov, Stochastic dynamics of time correlation in complex systems with discrete current time, Phys.
Rev. E 62 (2000) 6178–6194.
[2] R. Yulmetyev, P. Hanggi, F. Gafarov, Quantification of heart rate variability by discrete nonstationary non-Markov stochastic
processes, Phys. Rev. E 65 (2002) 046107-1-15.
[3] I. Goychuk, P. Hanggi, Stochastic resonance in ion channels characterized by information theory, Phys. Rev. E 61 (4) (2000)
4272–4280.
[4] I. Goychuk, P. Hanggi, Non-Markovian stochastic resonance, Phys. Rev. Lett. 91 (2003) 070601-1-4.
[5] I. Goychuk, P. Hanggi, Theory of non-Markovian stochastic resonance, Phys. Rev. E 69 (2004) 021104-1-15.
[6] L. Gammaitoni, P. Hanggi, P. Jung, F. Marchesoni, Stochastic resonance, Rev. Mod. Phys. 70 (1998) 223–288.
[7] R. Yulmetyev, A. Mokshin, P. Hanggi, Diffusion time-scale invariance, randomization processes, and memory effects in
Lennard–Jones liquids, Phys. Rev. E 68 (2003) 051201-1-5.
[8] R. Yulmetyev, A. Mokshin, M. Scopigno, P. Hanggi, New evidence for the idea of timescale invariance of relaxation processes in
simple liquids: the case of molten sodium, J. Phys.: Condens. Matter 15 (2003) 2235–2257.
[9] A.V. Mokshin, R.M. Yulmetyev, P. Hanggi, Diffusion processes and memory effects, New J. Phys. 7 (2005) 9-1-10.
[10] R. Yulmetyev, F. Gafarov, P. Hanggi, R. Nigmatullin, S. Kayumov, Possibility between earthquake and explosion seismogram
differentiation by discrete stochastic non-Markov processes and local Hurst exponent analysis, Phys. Rev. E 64 (2001) 066132-1-14.
[11] R.M. Yulmetyev, A.V. Mokshin, P. Hanggi, Universal approach to overcoming nonstationarity, unsteadiness and non-Markovity of
stochastic processes in complex systems, Physica A 345 (2005) 303–325.
[12] R.M. Yulmetyev, S.A. Demin, N.A. Emelyanova, F.M. Gafarov, P. Hanggi, Stratification of the phase clouds and statistical effects
of the non-Markovity in chaotic time series of human gait for healthy people and Parkinson patients, Physica A 319 (2003) 432–446.
[13] R.M. Yulmetyev, P. Hanggi, F.M. Gafarov, Stochastic processes of demarkovization and markovization in chaotic signals of the
human brain electric activity from EEGs at epilepsy, JETP 123 (3) (2003) 643–652.
[14] R.M. Yulmetyev, N.A. Emelyanova, S.A. Demin, F.M. Gafarov, P. Hanggi, D.G. Yulmetyeva, Non-Markov stochastic dynamics of
real epidemic process of respiratory infections, Physica A 331 (2004) 300–318.
[15] V.V. Smolyaninov, Spatio-temporal problems of locomotion control, Phys. Usp. 170 (10) (2000) 1063–1128.
[16] D.A. Winter, Biomechanics of normal and pathological gait: implications for understanding human locomotion control, J. Motor.
Behav. 21 (1989) 337–355.
[17] K.G. Holt, S.F. Jeng, R. Ratcliffe, J. Hamill, Energetic cost and stability during human walking at the preferred stride frequency, J.
Motor. Behav. 27 (2) (1995) 164–178.
[18] J.B. Dingwell, J.P. Cusumano, Nonlinear time series analysis of normal and pathological human walking, Chaos 10 (4) (2000)
848–863.
[19] J. Timmer, M. Lauk, W. Pfleger, G. Deuschl, Cross-spectral analysis of physiological tremor and muscle activity. I Theory and
application to unsynchronized electromyogram, Biol. Cybern. 78 (1998) 349–357.
[20] J. Timmer, M. Lauk, W. Pfleger, G. Deuschl, Cross-spectral analysis of physiological tremor and muscle activity. II Application to
synchronized electromyogram, Biol. Cybern. 78 (1998) 359–368.
[21] J. Timmer, Modeling noisy time series: Physiological tremor, Chaos Appl. Sci. Eng. 8 (1998) 1505–1516.
[22] J. Timmer, S. HauXler, M. Lauk, C.H. Lucking, Pathological tremors: deterministic chaos or nonlinear stochastic oscillators?, Chaos
10 (1) (2000) 278–288.
[23] N. Sapir, R. Karasik, S. Havlin, E. Simon, J.M. Hausdorff, Detecting scaling in the period dynamics of multimodal signals:
application to Parkinsonian tremor, Phys. Rev. E 67 (2003) 031903-1-8.
[24] B.J. West, N. Scafetta, Nonlinear dynamical model of human gait, Phys. Rev. E 67 (2003) 051917-1-10.
[25] J.M. Hausdorff, D.E. Forman, Z. Ladin, D.R. Rigney, A.L. Goldberger, J.Y. Wei, Increased walking variability in elderly persons
with congestive heart failure, J. Am. Geriatr. Soc. 42 (1994) 1056–1061.
[26] J.M. Hausdorff, C.K. Peng, Z. Ladin, J.Y. Wei, A.L. Goldberger, Fractal dynamics of human gait: stability of long-range
correlations in stride interval fluctuations, J. Appl. Physiol. 80 (1996) 1148–1457.
[27] J.M. Hausdorff, H.K. Edelberg, S.L. Mitchell, A.L. Goldberger, J.Y. Wei, Increased gait unsteadiness in community-dwelling elderly
fallers, Arch. Phys. Med. Rehabil. 78 (1997) 278–283.
[28] J.M. Hausdorff, L. Zemany, C.K. Peng, A.L. Goldberger, Maturation of gait dynamics: stride-to-stride variability and its temporal
organization in children, J. Appl. Physiol. 86 (1999) 1040–1047.
[29] J.M. Hausdorff, S.L. Mitchell, R. Firtion, C.K. Peng, M.E. Cudkowicz, J.Y. Wei, A.L. Goldberger, Altered fractal dynamics of gait:
reduced stride interval correlations with aging and Huntington’s disease, J. Appl. Physiol. 82 (1997) 262–269.
[30] J.M. Hausdorff, M.E. Cudkowicz, R. Firtion, H.K. Edelberg, J.Y. Wei, A.L. Goldberger, Gait variability and basal ganglia
disorders: stride-to-stride variations in gait cycle timing in Parkinson’s and Huntington’s disease, Mov. Disord. 13 (1998) 428–437.
[31] A. Beuter, R. Edwards, Using frequency domain characteristics to discriminate physiologic and parkinsonian tremors, J. Clin.
Neurophys. 16 (5) (1999) 484–494.
[32] R. Edwards, A. Beuter, Using time domain characteristics to discriminate physiologic and parkinsonian tremors, J. Clin. Neurophys.
17 (1) (2000) 87–100.
[33] A. Beuter, R. Edwards, Kinetic tremor during tracking movements in patients with Parkinson’s disease, Parkinsonism Relat. Disord.
8 (2002) 361–368.
ARTICLE IN PRESSR.M. Yulmetyev et al. / Physica A 369 (2006) 655–678 677
[34] D.E. Vaillancourt, K.M. Newell, Amplitude modulation of the 8–12Hz, 20–25Hz, and 40Hz oscillations in finger tremor, J. Clin.
Neurophys. 111 (2000) 1792–1801.
[35] D.E. Vaillancourt, A.B. Slifkin, K.M. Newell, Regularity of force tremor in Parkinson’s disease, J. Clin. Neurophys. 112 (2001)
1594–1603.
[36] P. Maurer, H.-D. Wang, A. Babloyantz, Time structure of chaotic attractors: a graphical view, Phys. Rev. E 56 (1997) 1188–1196.
[37] A. Babloyantz, A. Destexhe, Is the normal heart a periodic oscillator?, Biol. Cybern. 58 (1988) 203–211.
[38] A. Goldbeter, Biochemical Oscillations and Cellular Rhythms: The Molecular Bases of Periodic and Chaotic Behaviour, Cambridge
University Press, Cambridge, 1996.
[39] A. Goldbeter, D. Gonze, G. Houart, J.-C. Leloup, J. Halloy, G. Dupont, From simple to complex oscillatory behavior in metabolic
and genetic control networks, Chaos 11 (1) (2001) 247–260.
[40] D. Gonze, J. Halloy, A. Goldbeter, Emergence of coherent oscillations in stochastic models for circadian rhythms, Physica A 342
(2004) 221–223.
[41] L.S. Liebovitch, M. Zochowski, Dynamics of neural networks relevant to properties of proteins, Phys. Rev. E 56 (1997) 931–935.
[42] M. Zochowski, L.S. Liebovitch, Synchronization of the trajectory as a way to control the dynamics of a coupled system, Phys. Rev. E
56 (1997) 3701–3704.
[43] M. Zochowski, L.S. Liebovitch, Self-organizing dynamics of coupled map systems, Phys. Rev. E 59 (1999) 2830–2837.
[44] L.S. Liebovitch, W. Yang, Transition from persistent to antipersistent correlation in biological systems, Phys. Rev. E 56 (1997)
4557–4566.
[45] L.S. Liebovitch, A.T. Todorov, M. Zochowski, D. Scheurle, L. Colgin, M.A. Wood, K.A. Ellenbogen, J.M. Herre, R.C. Bernstein,
Nonlinear properties of cardiac rhythm abnormalities, Phys. Rev. E 59 (1999) 3312–3319.
[46] S.B. Lowen, L.S. Liebovitch, J.A. White, Fractal ion-channel behavior generates fractal firing patterns in neuronal models, Phys.
Rev. E 59 (1999) 5970–5980.
[47] C.K. Peng, S.V. Buldyrev, A.L. Goldberger, S. Havlin, M. Simons, H.E. Stanley, Finite size effects on long-range correlations:
implications for analyzing DNA sequences, Phys. Rev. E 47 (1993) 3730–3733.
[48] C.K. Peng, S. Havlin, H.E. Stanley, A.L. Goldberger, Quantification of scaling exponents and crossover phenomena in nonstationary
heartbeat time series, Chaos 6 (1995) 82–87.
[49] R. Zwanzig, Ensemble method in the theory of irreversibility, J. Chem. Phys. 3 (1960) 106–141.
[50] R. Zwanzig, Memory effects in irreversible thermodynamics, Phys. Rev. 124 (1961) 983–992.
[51] H. Mori, Transport, collective motion and brownian motion, Prog. Theor. Phys. 33 (1965) 423–455.
[52] H. Mori, A continued fraction representation of the time correlation functions, Prog. Theor. Phys. 34 (1965) 399–416.
[53] S.F. Timashev, Complexity and evolutionary law for natural systems, in: C. Rossi, S. Bastianoni, A. Donati, N. Marchettini (Eds.),
Tempos in Science and Nature: Structures, Relations, and Complexity, Annals of the New York Academy of Science, vol. 879, The
New York Academy of Science, 1999, pp. 129–143.
[54] S.F. Timashev, Science of complexity: phenomenological basis and possibility of application to problems of chemical engineering,
Theor. Found. Chem. Eng. 34 (2000) 301–312.
[55] S.F. Timashev, Flicker-noise spectroscopy as a tool for analysis of fluctuations in physical systems, in: G. Bosman (Ed.), Noise in
Physical Systems and 1/f Fluctuations—ICNF 2001, World Scientific, New Jersey, London, 2001, pp. 775–778.
[56] S.F. Timashev, Flicker-noise spectroscopy in analysis of chaotic fluxes in distributed dynamical dissipative systems, Russ. J. Phys.
Chem. 75 (10) (2001) 1742–1749.
[57] S.F. Timashev, G.V. Vstovskii, Flicker-noise spectroscopy of analyzing chaotic time series of dynamic variables: Problem of signal-
to-noise relation, Russ. J. Electrochem. 39 (2) (2003) 141–153.
[58] G.V. Vstovsky, A.V. Descherevsky, A.A. Lukk, A.Ya. Sidorin, S.F. Timashev, Search for electric earthquake precursors by the
method of flicker-noise spectroscopy, Izv. Phys. Solid Earth 41 (7) (2005) 513–524.
[59] S.F. Timashev, V.V. Grigor’ev, E.Yu. Budnikov, Flicker-noise spectroscopy in analysis of fluctuation dynamics of electric potential in
electromembrane system under ‘‘overlimiting’’ current density, Russ. J. Phys. Chem. 76 (3) (2002) 475–482.
[60] V. Parkhutik, S.F. Timashev, Informative essence of noise: New finding in the electrochemistry of silicon, Russ. J. Electrochem. 36
(11) (2000) 1221–1235.
[61] V. Parkhutik, E. Rayon, C. Ferrer, S. Timashev, G. Vstovsky, Forecasting of electrical breakdown in porous silicon using flicker-
noise spectroscopy, Phys. Status Solidi (A) 197 (2) (2003) 471–475.
[62] A.V. Descherevsky, A.A. Lukk, A.Ya. Sidorin, G.V. Vstovsky, S.F. Timashev, Flicker-noise spectroscopy in earthquake prediction
research, NHESS 3 (3/4) (2003) 159–164.
[63] L. Telesca, V. Lapenna, S. Timashev, G. Vstovsky, G. Martinelli, Flicker-noise spectroscopy as a new approach to investigate the
time dynamics of geoelectric signals measures in seismic areas, Phys. Chem. Earth, Parts A/B/C 29 (4–9) (2004) 389–395.
[64] V. Parkhutik, B. Collins, M. Sailor, G. Vstovsky, S. Timashev, Analysis of morphology of porous silicon layers using flicker-noise
spectroscopy, Phys. Status Solidi (A) 197 (1) (2003) 88–92.
[65] S.F. Timashev, A.B. Solovieva, G.V. Vstovsky, Informative ‘‘passport data’’ of surface nano- and microstructures, in: J. Sikula, M.
Levinshtein (Eds.), Advanced Experimental Method for Noise Research in Nanoscale Electronic Devices, Kluwer Academic
Publisher, The Netherlands, 2004, pp. 177–186.
[66] I.G. Kostuchenko, S.F. Timashev, The comparative analysis of dynamic characteristics of solar-terrestrial processes, in: V.G.
Gurzadyan, R. Ruffini (Eds.), Advanced Series in Astrophysics and Cosmology, The Chaotic Universe: Proceedings of the Second
ICRA Network Workshop, vol. 10, Singapore, World Scientific, River Edge, NJ, 2000, pp. 579–589.
ARTICLE IN PRESSR.M. Yulmetyev et al. / Physica A 369 (2006) 655–678678
[67] S.F. Timashev, G.V. Vstovsky, A.B. Solovieva, Informative essence of chaos, in: L. Reggiani, C. Penneta, V. Akimov, E. Alfinito, M.
Rosini (Eds.), Unsolved Problems of Noise and Fluctuations in Physics, Biology and High Technology, vol. 800, AIP Conference
Proceedings, Melville, New York, 2005, pp. 368–374.
[68] S.F. Timashev, G.V. Vstovsky, A.Ya. Kaplan, A.B. Solovieva, What information is hidden in chaotic signals of biological systems?
in: T. Gonzalez, J. Mateos, D. Pardo (Eds.), Noise and Fluctuations—ICNF-2005, AIP Conference Proceedings, vol. 780, Melville,
New York, 2005, pp. 579–582.
[69] S.F. Timashev, Generalization of the fluctuation-dissipation relations, Russ. J. Phys. Chem. 79 (11) (2005) 1720–1727.
[70] H.G. Schuster, Deterministic Chaos. An Introduction, Physik-Verlag, Weinheim, 1984.
[71] A. Beuter, M.S. Titcombe, F. Richer, Ch. Gross, D. Guehl, Effects of deep brain stimulation on amplitude and frequency
characteristics of rest tremor in Parkinson’s disease, Thalamus Relat. Syst. 1 (2001) 203–211.
[72] M.S. Titcombe, L. Glass, D. Guehl, A. Beuter, Dynamics of Parkinsonian tremor during deep brain stimulation, Chaos 11 (4) (2001)
766–773.
[73] A. Beuter, A. de Geoffroy, P. Cordo, The measurement of tremor using simple laser systems, J. Neurosci. Meth. 53 (1994) 47–54.
[74] K.E. Norman, R. Edwards, A. Beuter, The measurement of tremor using a velocity transducer: comparison to simultaneous
recordings using transducers of displacement, acceleration and muscle activity, J. Neurosci. Meth. 92 (1999) 41–54.