Embed Size (px)
Citation preview
THEORETICAL REVIEW
Regressive research: The pitfalls of post hoc data selectionin the study of unconscious mental processes
David R. Shanks1
# The Author(s) 2016. This article is published with open access at Springerlink.com
Abstract Many studies of unconscious processing involvecomparing a performance measure (e.g., some assessment ofperception or memory) with an awareness measure (such as averbal report or a forced-choice response) taken either concur-rently or separately. Unconscious processing is inferred whenabove-chance performance is combined with null awareness.Often, however, aggregate awareness is better than chance, anddata analysis therefore employs a form of extreme group anal-ysis focusing post hoc on participants, trials, or items whereawareness is absent or at chance. The pitfalls of this analyticapproach are described with particular reference to recent re-search on implicit learning and subliminal perception. Becauseof regression to the mean, the approach can mislead researchersinto erroneous conclusions concerning unconscious influenceson behavior. Recommendations are made about future use ofpost hoc selection in research on unconscious cognition.
Keywords Unconscious . Subliminal . Implicit . Regressionto themean . Error
Regression to the mean is as inevitable as death andtaxes.—Campbell and Kenny (1999, p. ix)
The study of unconscious or implicit cognition has becomea central research topic within experimental psychology. It
includes its own specialist journals, such as Consciousness& Cognition, has prompted the development of sophisticatedinstruments, such as the Implicit Association Test (Greenwald,McGhee, & Schwartz, 1998) for measuring unconscious pro-cesses, and has been fundamental in the specification andcharacterization of new neurological syndromes (e.g.,blindsight; Weiskrantz, 1986). It has also fostered a range oftailored research methods. This article explains and offers anextensive critique of one such widely used method, based on aform of extreme group analysis (Preacher, Rucker,MacCallum, & Nicewander, 2005), for purportedly demon-strating unconscious effects on behavior. In brief, this articleraises a major concern over a method that has been in use forover a century and which continues to flourish today.
In general terms the vast majority of studies of unconsciousmental processing involve comparing a performance measure(e.g., some assessment of perception or memory) with anawareness measure (such as a verbal report or a forced-choice response) taken either concurrently or separately. Forinstance, ten Brinke, Stimson, and Carney (2014) presentedparticipants with videos of actors either telling the truth orlying about a theft. Discrimination was at chance under con-scious conditions: participants were unable explicitly(directly) to judge which actors were lying and which weretelling the truth. In a performance (implicit, unconscious, in-direct) test involving speeded responding, in contrast, partici-pants reacted significantly faster following images of truthfulthan of deceptive actors. Thus, ten Brinke et al. interpreted thisas evidence that deceptive cues from the actors can be detectedand “leak” into unconscious but not conscious decisions.
Henceforth, the terms performance or performancemeasure will be used to refer to the target behavioral(implicit) measure, often a facilitation in the speed or ac-curacy of responding (priming). The terms awarenessmeasure and report will be used to refer to the assessment
* David R. [email protected]
1 Division of Psychology and Language Sciences, University CollegeLondon, 26 Bedford Way, London WC1H 0AP, England
Psychon Bull RevDOI 10.3758/s13423-016-1170-y
of conscious (explicit) knowledge. When parallel perfor-mance and awareness measures are collected, one patternthat might emerge is for performance to show some above-chance sensitivity to a task variable and for the awarenessmeasure to show null sensitivity. In the experiment justdescribed, the performance test showed sensitivity to themanipulated variable (truth/lie), but the awareness test didnot. Although the literature contains hundreds of resultsfitting this description (such as that of ten Brinke et al.,2014), there are rather fewer that have withstood indepen-dent replication attempts (Newell & Shanks, 2014; Shanks& St. John, 1994). Indeed the past half-century of researchon unconscious cognition, going back at least as far as theclassic debate between Greenspoon (1955) and Dulany(1961), has been characterized by repeated cycles in whichnew ways of demonstrating unconscious processes havebeen challenged by later investigations. For example,Vuilleumier, Schwartz, Duhoux, Dolan, and Driver(2005) and Butler and Klein (2009) reported evidence ofpure implicit memory using rapid serial visual presentation(RSVP). Line drawings of objects were superimposed(e.g., a red umbrella and a green horse) and presented inan RSVP stream, and participants were instructed to attendto one of the colors. Their subsequent consciousrecognition for unattended items was found to be notreliably better than chance, but these objects sustained arepetition priming effect that the authors interpreted as anunconscious process. Extensive efforts by Berry, Shanks,Li, Rains, and Henson (2010) to replicate these findingswere unsuccessful, however.
Moreover, when performance shows some above-chancesensitivity at the same time that a report measure shows nullsensitivity, there is often the concern that the absence of sta-tistically significant evidence for awareness is (mis)interpretedas evidence of absence (Reingold & Merikle, 1988; Schmidt& Vorberg, 2006). For example, many researchers have re-ported chance-level awareness in implicit learning studiesemploying a contextual cuing task (the task is described inmore detail later). Vadillo, Konstantinidis, and Shanks(2016) conducted a meta-analysis of 67 experiments, reportedwith sufficient data to be analyzed. Although all these studiesyielded nonsignificant awareness scores and hence concludedthat participants lacked awareness of the crucial variable,Vadillo et al. found a significant meta-analytic awareness ef-fect (Cohen’s d = 0.16, 95 % CI [0.10, 0.22]) when they werepooled, suggesting that participants’ learning in these experi-ments was in fact conscious. Vadillo et al. (2016) also foundthat the average power of these awareness tests was about 0.2.Overreliance on null hypothesis significance testing (NHST)can lead researchers to misinterpret null results from under-powered awareness tests as false negatives.
If there are very few studies of unconscious cognition inwhich above-chance performance is combined with
compelling evidence of chance-level scores on a high-powered awareness test, then what other methodological ap-proaches might provide evidence of unconscious cognition?Some researchers compute performance–report correlations(or the slope of the regression line) on the assumption that ifsuch correlations are close to zero, then it seems implausiblethat awareness is causally associated with behavioral perfor-mance. But once again, absence of evidence is not the same asevidence of absence: A nonsignificant correlation coefficientimplies that there is insufficient evidence to reject the nullhypothesis (no association); it does not prove that the nullhypothesis is true (see Miller, 2000).
As an illustration, Conci and von Mühlenen (2011,Experiment 2) estimated the correlation between the resultsof an awareness test and a performance (priming) measure andreported r = .14, p = .62. This lack of significant correlationseems on the face of it to provide support for the claim thatlearning was unconscious, but without knowing the confi-dence interval on the correlation coefficient, it is impossibleto judge how much weight to place on such a null result. Infact, the 95 % CI on the correlation coefficient has lower andupper limits of -.42 and .62. Thus, the data are compatible witha true correlation in excess of .6. Obviously, this estimation istoo imprecise to permit any strong conclusions to be drawn, aproblem that applies to many studies that rely on the samestrategy. A nonsignificant performance-report correlationwould only be theoretically relevant if the confidence intervalwas narrow (the estimate was precise) and included zero. This,in turn, requires high-powered tests, which are rarely under-taken (Vadillo et al., 2016). Tests of stochastic independence,once popular in research on implicit and explicit memory, fellout of favor for similar reasons (see Poldrack, 1996).
Moreover, correlations or regression slopes close to zerocan be generated by models which assume that the perfor-mance and report measures are based on a common underly-ing latent process (Miller, 2000). A more sophisticated ap-proach is to estimate the regression intercept, namely the levelof performance when awareness is zero (Greenwald, Klinger,& Schuh, 1995). I return to this method briefly in theConclusions section.
Post hoc data selection
As the limitations of the methods described previously havebecome clear, researchers have turned to other methods, in-cluding post hoc data selection, the major focus of this article.Post hoc selection has been in widespread use (as described ina later section) since the earliest days of experimental psychol-ogy (e.g., Lazarus &McCleary, 1951; Peirce & Jastrow, 1884;Williams, 1938).
In this procedure, data from participants whose awarenesstest score is below some cutoff are analyzed separately from
Psychon Bull Rev
the entire group. The cutoff can either be an appropriate base-line score (typically zero on an awareness questionnaire or50 % on a two-alternative forced-choice test) or could beapplied by a test of statistical significance. In the latter case,an appropriate test is applied participant by participant, anddata are only included from those whose awareness score isnot significantly greater than zero.1 For simplicity it is as-sumed in the following discussion that the former cutoff(zero) is employed. For this subset of unaware participants,their mean score on the performance measure is then calculat-ed. If this score is reliably greater than an appropriate baselinefor that test, then it is concluded that true unconscious cogni-tion has been demonstrated. In many studies, particularlythose assessing subliminal perception (see below), it is itemsor trials rather than participants to which the awareness cutoffis applied, but the rationale is the same. In these cases, items ortrials are selected post hoc for further analysis on the basis thatthe participant reported no awareness of the stimulus.
The post hoc method, as defined here, must be distin-guished from at least two other superficially similar methodsfor evaluating bivariate X–Y data. A common analytic tech-nique is to select individuals scoring at both extremes of Y—say the top and bottom quartiles—and evaluate the X–Y rela-tionship across these selected subgroups. Called extremegroups analysis, this method has considerable value whendata collection is costly. For example, researchers might mea-sure video-game playing across a large sample of individualsby means of a questionnaire, and then administer a time-consuming battery of cognitive ability tests only to thosereporting very high or very low hours per week spent playingvideo games. As well as providing a wider discussion of someof the issues raised by the extreme group approach, Preacheret al. (2005) noted, in passing, another method that theytermed post hoc subgrouping. This refers to performing ex-treme groups analysis—examining the X–Y relationshipacross subgroups defined by high and low scores onY—even when X data have already been collected across thefull range of Y. The method under consideration here, post hocdata selection, is similar to post hoc subgrouping except thatinterest is focused on a subgroup at only one extreme of Y.Evaluations show that the sacrifice of statistical power thatresults from dropping data from the middle of the distributionin the post hoc subgrouping method typically has minimalcompensating benefits, and accordingly Preacher et al.
(2005) were dismissive of the method. But post hoc dataselection is different in an important way: if the cutoff has atheoretical rationale established a priori (e.g., a zero-point onan awareness measurement scale), then the method may pro-vide a useful tool for investigators wishing to divide a distri-bution into qualitatively distinct components reflecting con-scious and unconscious processing.
The logic of the post hoc data selectionmethod is simple andintuitive, and this likely explains in part its growing usage in thefield. When one analyzes group data, there is always the chal-lenge to prove that awareness is at chance. As noted above,NHST is singularly unsuited to providing evidence for a nulleffect. But if a subgroup of participants is selected precisely onthe basis that each of them scores at or below chance on theawarenessmeasure, then it seems unarguable that this subgrouplacks awareness of the relevant feature or variable. And if thesubgroup is then shown to perform significantly above chanceon the associated performance measure, then it seems equallybeyond dispute that true unconscious cognition has been doc-umented. Researchers employing the method presume thatthere are true individual differences in perception, cognition,and learning such that, under the same conditions, one partic-ipant becomes aware of a regularity whereas another onedoesn’t. The post hoc selection method identifies the “sweetspot” conjunction between experimental conditions and indi-vidual differences such that true unconscious performance isrevealed in the selected sample of participants.
A highly cited (>700 citations on Google Scholar,June 2015) example of the use of the method illustrates itsintuitive appeal. Clark and Squire (1998) presented amnesicand control participants with an eye-blink conditioning proce-dure in which a tone (or white noise) conditioned stimulus (CS)preceded an air puff to the eye (unconditioned stimulus, US)and other trials in which the white noise (or a tone) occurredwithout the US. The behavioral measure was differential con-ditioned responding to the CS paired with the US in compari-son to the CS presented alone. After the conditioning phase,participants answered a questionnaire including 17 questionsabout the temporal relationships between the CSs and the US.Those scoring ≤12 items correct were classified as unaware ofthe critical conditioning contingency. Clark and Squire (1998)obtained reliable differential conditioning among the selectedsubgroup of participants and interpreted this as evidence thateye-blink conditioning can occur unconsciously.
Although never explicitly acknowledged by researchersemploying the method, it rests on a fundamental intrinsic as-sumption. Performance and report measures, like all othermeasures in psychology, are composed of some underlyingtrue score plus measurement error. When data from a groupof participants are collected, then all other things being equal,the measurement errors cancel out and the aggregate meanscore approximates the mean true score. The post hoc dataselection method assumes that this same principle applies to
1 Employing a statistical test applied participant by participant introducesa striking bias that can lead to spurious evidence for an unconsciouseffect. Suppose that a subgroup of apparently unaware participants isselected post hoc and is found to have a mean performance score signif-icantly greater than zero. Even though each individual participant’sawareness score might not be significantly greater than chance, it is themean awareness score from the entire subgroup that matters, and this maywell be significant. For example, Clark and Squire (1998) adopted suchan approach (see Lovibond & Shanks, 2002).
Psychon Bull Rev
the selected subgroup. As will be seen, a key testable predic-tion follows from this assumption.
Themajor aim of this article is to show that the logic behindthe post hoc data selection method is flawed and that it doesnot support the conclusions drawn from it. Indeed, because theassumption above is false, it will be argued that the methodcannot be used to make inferences about unconscious cogni-tion, or at least not in its uncorrected form. In a nutshell, theproblem is that the method must yield above-chance perfor-mance scores in participants scoring at or below chance in theawareness test, purely for statistical reasons. The key explan-atory phenomenon that undermines the logic of the method isregression to the mean.
In previous work (Berry, Shanks, Speekenbrink, & Henson,2012; Shanks, 2005; Shanks & Berry, 2012; Shanks &Perruchet, 2002; Shanks, Wilkinson, & Channon, 2003; Smyth& Shanks, 2008; Vadillo et al., 2016), we criticized particularuses of post hoc data selection and proposed that it cannot beemployed as a method for revealing evidence of unconsciousprocessing or of dissociations between unconscious and con-scious processing. The grounds for those claims were that com-putational models based on a single underlying variable wereable to reproduce the signature pattern obtained from the posthoc selection method, and that it therefore could not follow thatdemonstrations of above-chance performance in participants se-lected as scoring at or below chance on an awareness test repre-sent evidence for distinct conscious and unconscious processes.Others (Zeelenberg, Plomp, & Raaijmakers, 2003; Sand &Nilsson, 2016) have also highlighted flawed uses of the method.Here, I develop a much broader and more detailed critique of themethod and provide recommendations for future research.
Post hoc data selection and regression to the mean
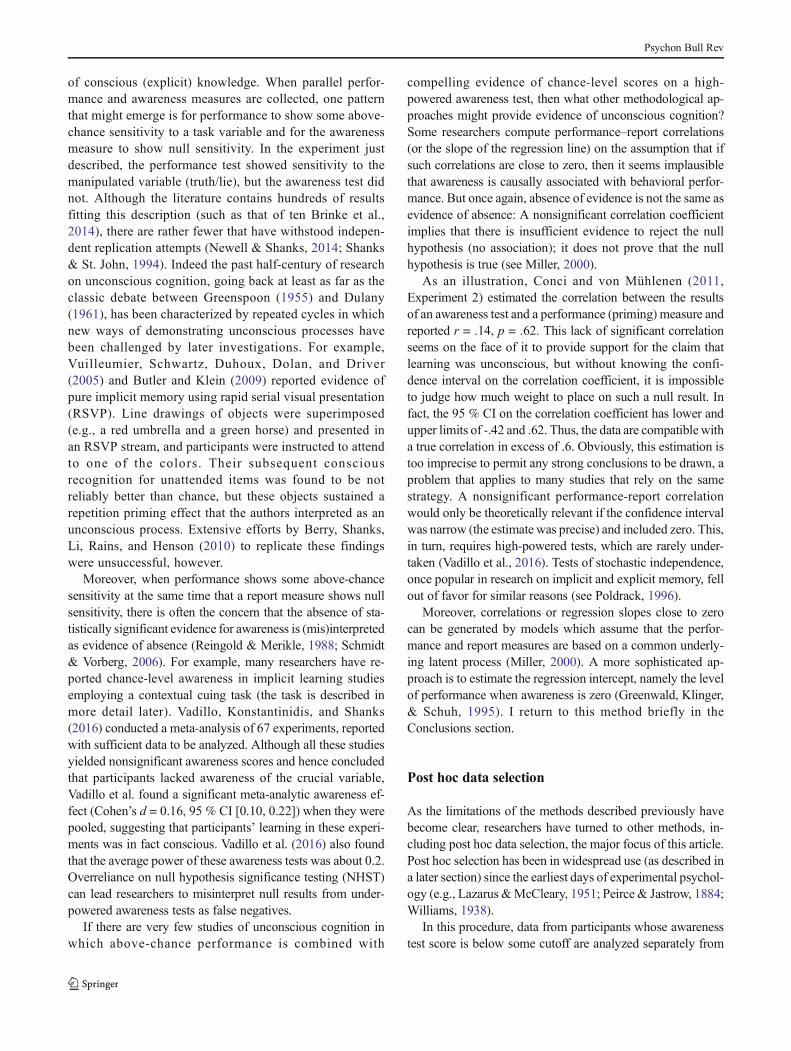
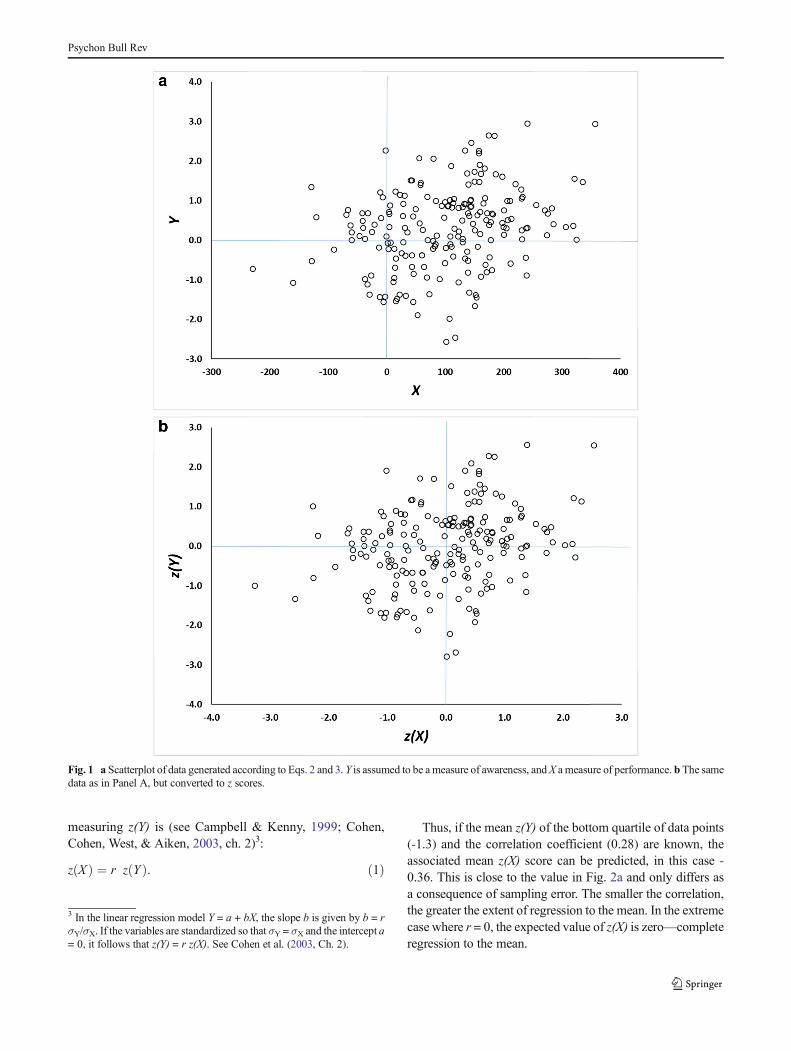
As an initial illustration of the problem, consider the datashown in Fig. 1a. This scatterplot represents data from aMonte Carlo simulation in which each point is a hypotheticalparticipant, and the x- and y-axes represent imaginary perfor-mance and awareness measures, respectively, collected foreach of 200 participants (throughout this article, awarenessis plotted on the y-axis and performance on the x-axis). Themeasures are moderately correlated, r = 0.28, and each yieldsa mean score greater than zero, which is taken to be the levelof chance or baseline responding.
The X values have a mean of approximately X = 100,which could reflect a priming score in ms, for example; the
Yvalues have a mean of about Y = 0.3 which could reflect anexplicit recognition d′ score, for instance. The exact nature ofthe measurement scales is not essential to the line of reasoningdescribed below, which is general and also does not depend onwhere the data points are located in relation to theoretically
motivated baseline or chance scores. It also does not dependon the distributional properties of the data (such as whetherthey are normally distributed), other than the correlation coef-ficient (Samuels, 1991). The exact model which generated thedata will be described later.
In order to carry out a standard post hoc selection analysison these data, only those simulated participants whose Y(awareness) score is less than or equal to zero are retainedfor further analysis. What is the accompanying mean X(performance) score for these participants, X |Y ≤ 0? It has avalue of 64, 95 % CI [43, 85], very substantially above zeroand not far below the group mean (which in this simulation is101). This is the essence of post hoc data selection: It revealsthat (simulated) unaware participants on average have above-chance performance scores.
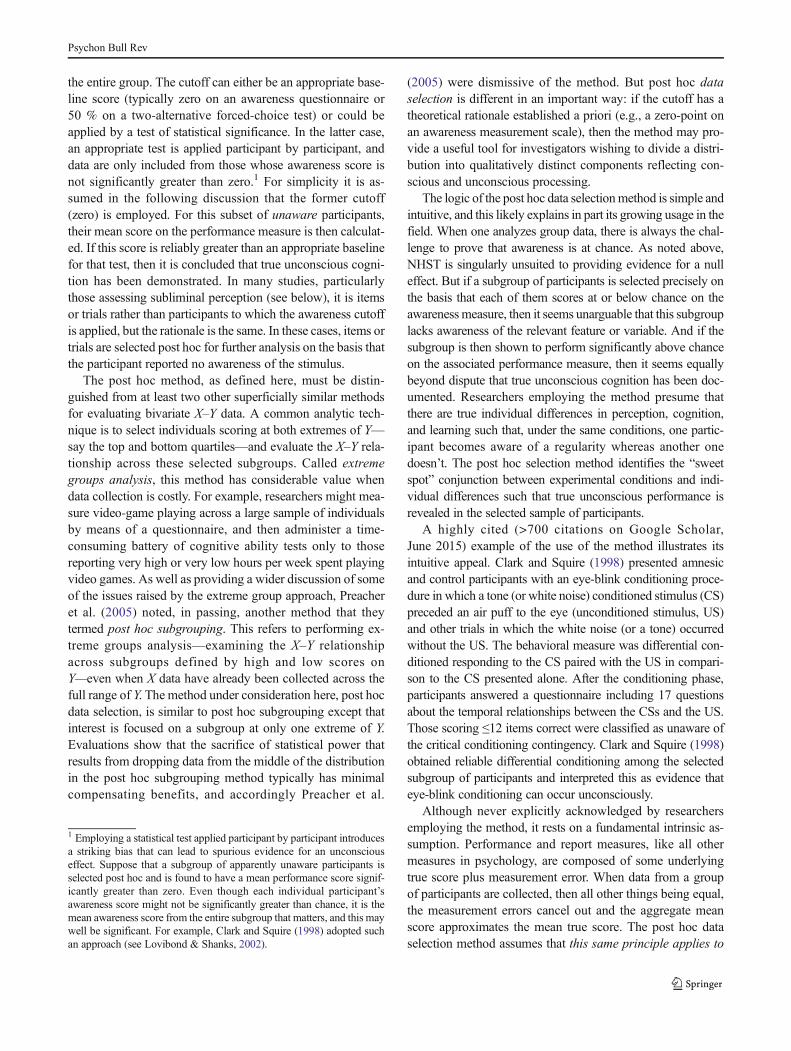
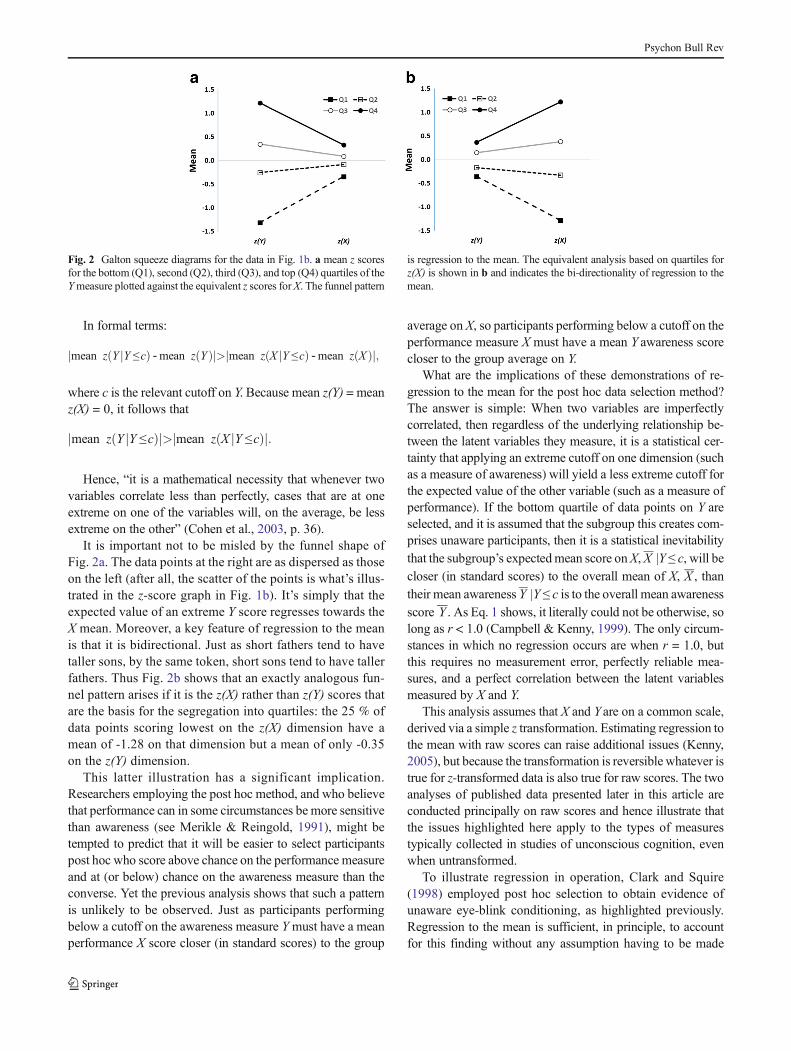
The data in Fig. 1a manifest regression to the mean, but asCampbell and Kenny (1999) noted in their classic monographon regression artifacts in behavioral research, a scatterplot is apoor method of visualizing this phenomenon. Instead, theybuilt on pioneering work by Francis Galton to devise a muchbetter method for illustrating regression to the mean, theGaltonsqueeze diagram. The first step in constructing such a diagramis to replot the original data in z-score space, as in Fig. 1b. Thisplaces the X and Y measures on a common scale and permitsthem to be compared more directly. Next, the data arepartitioned according to their scores on the z(Y) dimension.Here this is done by computing quartiles. Finally the meanz(X) value for each quartile is calculated and the mean z(Y)and z(X) for each quartile is plotted in a line graph as in Fig. 2a.
What this shows is that the 25% of data points from Fig. 1ascoring highest on Y have a mean z(Y) score of 1.22, but thesedata points are associated with much less extreme mean z(X)score, about 0.33. At the same time, the 25 % of data pointsscoring lowest on Y (mean z(Y) = -1.31) are also associatedwith a much less extreme mean z(X) score, about -0.34. This isregression to the mean: Values further away from z(Y) = 0 onthe left-hand axis regress toward the mean (z(X) = 0) on theright-hand axis.
Regression to the mean is an intrinsic property of any bi-variate data for which the correlation is less than 1.0(Campbell & Kenny, 1999). In Fig. 1a, it is reflected by thefact that data points which are extreme on Y (either high orlow) tend to be less extreme on X, and vice versa.2 When thevariables have the same mean and standard deviation (i.e., aretransformed into z scores), the magnitude of regression to themean is constrained by only one factor, namely, the correlationcoefficient. The predicted z(X) score for a data point
2 Note that statisticians (see Krause, 2009; Samuels, 1991) distinguishbetween “reversion” and “regression” to the mean, and indeed Samuels(1991) proposes that the term reversion to the mean should be used todescribe the property captured in Fig. 1a. I continue to use regression herebecause it is a term more familiar to behavioural researchers, andSamuels’ proposed usage is not universally accepted.
Psychon Bull Rev
measuring z(Y) is (see Campbell & Kenny, 1999; Cohen,Cohen, West, & Aiken, 2003, ch. 2)3:
z Xð Þ ¼ r z Yð Þ: ð1Þ
Thus, if the mean z(Y) of the bottom quartile of data points(-1.3) and the correlation coefficient (0.28) are known, theassociated mean z(X) score can be predicted, in this case -0.36. This is close to the value in Fig. 2a and only differs asa consequence of sampling error. The smaller the correlation,the greater the extent of regression to the mean. In the extremecase where r = 0, the expected value of z(X) is zero—completeregression to the mean.
3 In the linear regression model Y = a + bX, the slope b is given by b = rσY/σX. If the variables are standardized so that σY = σX and the intercept a= 0, it follows that z(Y) = r z(X). See Cohen et al. (2003, Ch. 2).
Fig. 1 a Scatterplot of data generated according to Eqs. 2 and 3. Y is assumed to be ameasure of awareness, andX ameasure of performance. b The samedata as in Panel A, but converted to z scores.
Psychon Bull Rev
In formal terms:
mean z Yð jY ≤cj Þ ‐mean z Yð Þ >j jmean z X jY ≤cð Þ ‐mean z Xð Þj;
where c is the relevant cutoff on Y. Because mean z(Y) = meanz(X) = 0, it follows that
mean z Yð jY ≤cj Þ >j jmean z X jY ≤cð Þj:
Hence, “it is a mathematical necessity that whenever twovariables correlate less than perfectly, cases that are at oneextreme on one of the variables will, on the average, be lessextreme on the other” (Cohen et al., 2003, p. 36).
It is important not to be misled by the funnel shape ofFig. 2a. The data points at the right are as dispersed as thoseon the left (after all, the scatter of the points is what’s illus-trated in the z-score graph in Fig. 1b). It’s simply that theexpected value of an extreme Y score regresses towards theX mean. Moreover, a key feature of regression to the meanis that it is bidirectional. Just as short fathers tend to havetaller sons, by the same token, short sons tend to have tallerfathers. Thus Fig. 2b shows that an exactly analogous fun-nel pattern arises if it is the z(X) rather than z(Y) scores thatare the basis for the segregation into quartiles: the 25 % ofdata points scoring lowest on the z(X) dimension have amean of -1.28 on that dimension but a mean of only -0.35on the z(Y) dimension.
This latter illustration has a significant implication.Researchers employing the post hoc method, and who believethat performance can in some circumstances be more sensitivethan awareness (see Merikle & Reingold, 1991), might betempted to predict that it will be easier to select participantspost hoc who score above chance on the performance measureand at (or below) chance on the awareness measure than theconverse. Yet the previous analysis shows that such a patternis unlikely to be observed. Just as participants performingbelow a cutoff on the awareness measure Ymust have a meanperformance X score closer (in standard scores) to the group
average on X, so participants performing below a cutoff on theperformance measure X must have a mean Y awareness scorecloser to the group average on Y.
What are the implications of these demonstrations of re-gression to the mean for the post hoc data selection method?The answer is simple: When two variables are imperfectlycorrelated, then regardless of the underlying relationship be-tween the latent variables they measure, it is a statistical cer-tainty that applying an extreme cutoff on one dimension (suchas a measure of awareness) will yield a less extreme cutoff forthe expected value of the other variable (such as a measure ofperformance). If the bottom quartile of data points on Y areselected, and it is assumed that the subgroup this creates com-prises unaware participants, then it is a statistical inevitability
that the subgroup’s expectedmean score onX, X |Y ≤ c, will becloser (in standard scores) to the overall mean of X, X , thantheir mean awareness Y |Y ≤ c is to the overall mean awareness
score Y . As Eq. 1 shows, it literally could not be otherwise, solong as r < 1.0 (Campbell & Kenny, 1999). The only circum-stances in which no regression occurs are when r = 1.0, butthis requires no measurement error, perfectly reliable mea-sures, and a perfect correlation between the latent variablesmeasured by X and Y.
This analysis assumes that X and Y are on a common scale,derived via a simple z transformation. Estimating regression tothe mean with raw scores can raise additional issues (Kenny,2005), but because the transformation is reversible whatever istrue for z-transformed data is also true for raw scores. The twoanalyses of published data presented later in this article areconducted principally on raw scores and hence illustrate thatthe issues highlighted here apply to the types of measurestypically collected in studies of unconscious cognition, evenwhen untransformed.
To illustrate regression in operation, Clark and Squire(1998) employed post hoc selection to obtain evidence ofunaware eye-blink conditioning, as highlighted previously.Regression to the mean is sufficient, in principle, to accountfor this finding without any assumption having to be made
Fig. 2 Galton squeeze diagrams for the data in Fig. 1b. a mean z scoresfor the bottom (Q1), second (Q2), third (Q3), and top (Q4) quartiles of theYmeasure plotted against the equivalent z scores for X. The funnel pattern
is regression to the mean. The equivalent analysis based on quartiles forz(X) is shown in b and indicates the bi-directionality of regression to themean.
Psychon Bull Rev
about unconscious mental processes. Equation 1 establishesthat participants who were selected as being extreme on onemeasure (awareness) must be less extreme on the other. If the
group mean conditioning score (X ) is greater than zero, thenthe score for participants who were selected on the basis ofextreme scores on Y will regress toward this mean condition-ing score.
Indeed, other aspects of Clark and Squire’s results pro-vide further support for this account. The keyconditioning-without-awareness pattern was obtained inonly some of the conditions they tested. Specifically, par-ticipants selected post hoc as unaware showed robust de-lay eye-blink conditioning (in delay conditioning the CSand US overlap temporally), but this pattern was not ob-served when a trace conditioning procedure (in which theCS and US do not overlap) was used. In the latter con-dition, aware but not unaware participants showed condi-tioning. Looking in detail at the conditioning–awarenesscorrelation in the different groups, this pattern followsnaturally. In delay conditioning, the conditioning–aware-ness correlation was negligible (r ≈ 0), and hence fromEq. 1, substantial regression is predicted and “unaware”participants should show conditioning. In trace condition-ing, in contrast, the conditioning–awareness correlationwas substantial (r ≈ 0.7), and hence little regression ispredicted. Consistent with the regression to the mean for-mula (Eq. 1), evidence of conditioning in participants whowere selected post hoc as being unaware was obtainedprecisely in those conditions where the X–Y correlationwas smallest. Admittedly, the regression account does notexplain why the conditioning–awareness correlations wereso different in the two cases, but then neither does Clarkand Squire’s theory, which is circular: The correlation islow for delay conditioning because learning was uncon-scious; but the post hoc method, in conjunction with thelow correlation, was guaranteed to identify apparently un-conscious learning in delay conditioning.
An extreme way of highlighting the pitfalls of the post hocselection method is to consider the conclusions it would pointto when a measure of awareness is completely unreliable.Imagine an awareness test that is equivalent to a coin toss.The selection method would segregate participants into thoseidentified as “aware” and “unaware” by this test, and becausethe X–Y correlation would necessarily be zero, there would becomplete regression to the mean on X. Hence, “unaware” par-ticipants would appear to show significant performance (X),but this, of course, would be a spurious conclusion.
This section has articulated the major point of this arti-cle. In the remaining sections, the regression artifact isfurther unpacked, generalized to a range of other situations(e.g., binary awareness measures), applied and tested onsome real rather than simulated data sets, and placed inhistorical context.
Why does regression to the mean occur?
As noted above, the post hoc selection method assumes thatthe measured variables are composed of some underlying truescore plus error, and that when data from a selected subgroupof participants are aggregated, the errors cancel out, and theensuing mean score approximates the mean true score. To seewhy this assumption is false, it is necessary to describe themodel that generated the data in Fig. 1a. The model beginswith a random, normally distributed variable S with mean andstandard deviation (σS) equal to 1, and with S = 0 representingthe baseline of no knowledge. This common underlying var-iable forms the basis of both the performance (X) and report(Y) measures. Specifically:
X ¼ 100 S þ 30 eX ; ð2ÞY ¼ 0:30 S þ eY : ð3Þ
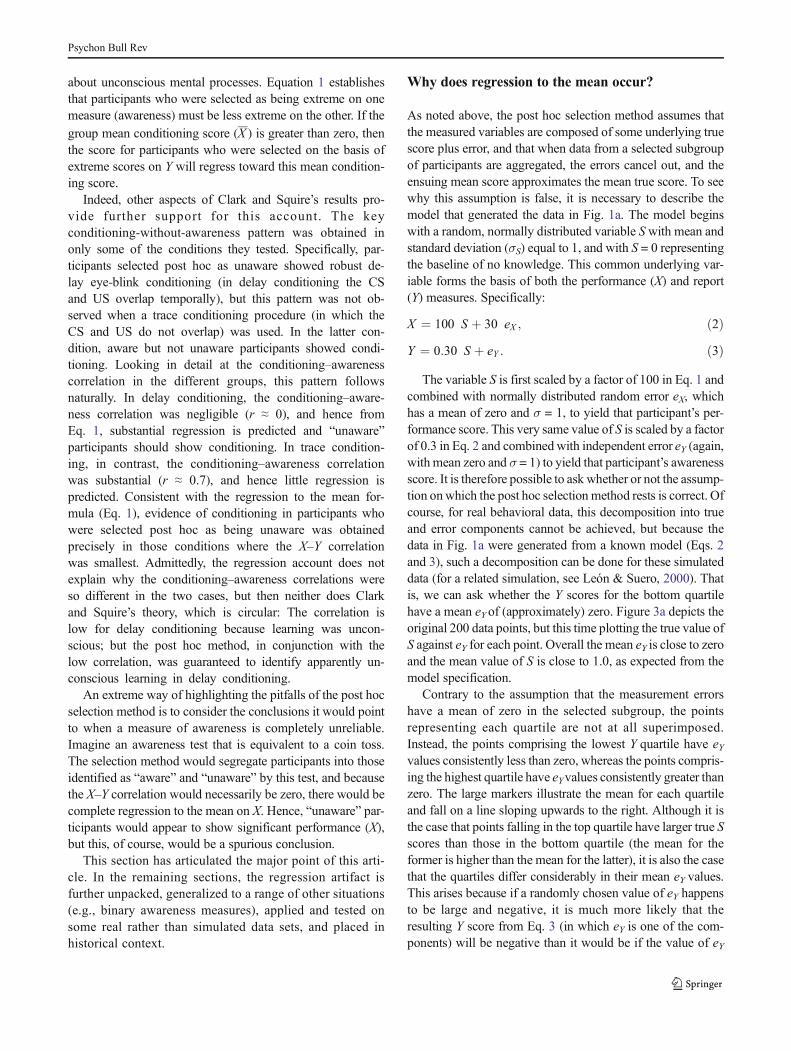
The variable S is first scaled by a factor of 100 in Eq. 1 andcombined with normally distributed random error eX, whichhas a mean of zero and σ = 1, to yield that participant’s per-formance score. This very same value of S is scaled by a factorof 0.3 in Eq. 2 and combined with independent error eY (again,with mean zero and σ = 1) to yield that participant’s awarenessscore. It is therefore possible to ask whether or not the assump-tion onwhich the post hoc selection method rests is correct. Ofcourse, for real behavioral data, this decomposition into trueand error components cannot be achieved, but because thedata in Fig. 1a were generated from a known model (Eqs. 2and 3), such a decomposition can be done for these simulateddata (for a related simulation, see León & Suero, 2000). Thatis, we can ask whether the Y scores for the bottom quartilehave a mean eYof (approximately) zero. Figure 3a depicts theoriginal 200 data points, but this time plotting the true value ofS against eY for each point. Overall the mean eY is close to zeroand the mean value of S is close to 1.0, as expected from themodel specification.
Contrary to the assumption that the measurement errorshave a mean of zero in the selected subgroup, the pointsrepresenting each quartile are not at all superimposed.Instead, the points comprising the lowest Y quartile have eYvalues consistently less than zero, whereas the points compris-ing the highest quartile have eYvalues consistently greater thanzero. The large markers illustrate the mean for each quartileand fall on a line sloping upwards to the right. Although it isthe case that points falling in the top quartile have larger true Sscores than those in the bottom quartile (the mean for theformer is higher than the mean for the latter), it is also the casethat the quartiles differ considerably in their mean eY values.This arises because if a randomly chosen value of eY happensto be large and negative, it is much more likely that theresulting Y score from Eq. 3 (in which eY is one of the com-ponents) will be negative than it would be if the value of eY
Psychon Bull Rev
were large and positive. The converse is the case if a randomlychosen value of eY happens to be large and positive. Put dif-ferently, although eY and S are necessarily uncorrelated, thesame is not true of eY and (0.30S + eY), which must be corre-lated because they incorporate a common term. This correla-tion means that high positive values of eY will be associatedwith high positive values of the measured variable Y (=0.30S+ eY), and similarly for large negative values. When eY is close
to zero, Y will tend to be too. Krause (2009) uses the termcaptures to describe participants who—because of an extremeamount of measurement error—are falsely selected for inclu-sion in the extreme group.
The net effect is that the Y scores of participants selectedpost hoc are systematically biased by error components whichon average are not zero. On average, the low awareness scoreof a participant selected by the post hoc method is made up of a
Fig. 3 aBasis of the regression effect illustrated in Fig. 2. The scatterplotrepresents the values of S and eY from Eq. 3 for the data points in Fig. 1a,for the bottom (Q1), second (Q2), third (Q3), and top (Q4) quartiles of Y.Large symbols are the means for each quartile. Although the overall meanvalue of eY is zero, for the data points in Q1, the values of eY aresystematically less than zero, while for those in Q4 they are
systematically greater than zero. b The figure reproduces all the bottomquartile Y data points from Fig. 1a, but decomposes them into their truescore and measurement error. The circles mark where each point wouldlie if eY is set to zero. The red line extends to the observed Ywhen eY takesits true value. Thus the tip of each red line lies at exactly the same value asdepicted in Fig. 1a. (Color figure online)
Psychon Bull Rev
“true” underlying score that is not particularly extreme (themean S values for the quartiles are not widely dispersed) andan error component that is extreme (the mean eYvalues for thequartiles are widely dispersed). When the true score S is thencombinedwith the error term eX (whichwill, on average, have amean of zero) in Eq. 3, regression to the mean must follow inthe resulting expected X score. Because eX and eY are uncorre-lated, when an observation has an extreme value of eY, it is veryunlikely that eX will be equally extreme. Once again, I stressthat this is not an empirical speculation, but a statistical inevi-tability. So long as measurement error is greater than zero, the“true” expected level of awareness of a selected participantmust, on average, be greater than his or her measured score.That it is error in Y scores (eY) that is crucial is confirmed by thefact that the key regression patterns in Figs. 2 and 3 persist if eXis fixed at zero, but are abolished if eY is zero.
Figure 3b depicts the biasing consequences of the post hocmethod in a particularly vivid manner. The figure reproducesall the bottom quartile Y data points from Fig. 1a, but decom-poses each into its true score and measurement error. Theunmarked tips of each red line lie at exactly the same valuesas depicted in Fig. 1a (hence, if this figure were overlain onFig. 1a, the tip of each red line would fall exactly on top of adata point in the figure). The circles mark where each pointwould lie if there were no measurement error associated withthe data point, calculated by setting eY to zero. The red linetherefore extends to the observed Y when eY takes its truevalue, and the lengths of the red lines represent exactly thesame set of eY values graphed for the equivalent (red) datapoints in Fig. 3a. As Fig. 3b illustrates, the measurement errorsare far from random. Instead, they systematically transformdata values for which true Y > 0 into ones for which observedY < 0. Paradoxically, most of a sample of simulated partici-pants, who all appear to lack any awareness whatsoever, ac-tually have above-chance awareness. The true values of Yshow an upward slope as X increases, and this pattern mani-fests itself because large values of X usually arise from largevalues of S, which in turn yield large values of Y.
It bears emphasizing that the model cannot predict above-chance performance in the true absence of awareness. To seethis, note that mean awareness Y in Eq. 3 can only be at chance
(zero) when S = 0. Because S is identical in Eqs. 2 and 3, then ifS = 0, X = 0 as well, and performance is predicted to be atchance. This confirms that the key qualitative pattern thatemerges when data are selected post hoc cannot be proof oftrue unconscious mental processes. In other words, this is ademonstration that the canonical data pattern that the post hocmethod interprets as evidence of unconscious processes canarise from a model in which no such processes exist.
When a researcher collects data from a group of partici-pants, it is entirely reasonable (and indeed correct) to assumethat random measurement errors across participants will can-cel each other out and that the aggregate measure for the group
approximates the true score. It also seems reasonable, but is infact fallacious, to assume that the same applies to a selectedsubgroup. The very fact of selecting participants on a nonran-dom basis immediately introduces bias in the errors for thatsubgroup, as participants with extreme error values will beoverrepresented. This is impossible to demonstrate in real be-havioral data where the generating model is unknown, but isevident when the model is known, as in the simulation de-scribed here.
The model analyzed above demonstrates that when disper-sion in X–Y data is caused solely by measurement error (X andY would be perfectly correlated if eX and eY were zero), thenwe can conceptually explain the ensuing regression to themean of Y on X via bias in the values of eY among the datapoints selected post hoc. Measurement error is only one po-tential cause of regression to the mean: Anything that contrib-utes to an imperfect correlation induces it (Campbell &Kenny, 1999, p. 30). Can the model be generalized to accom-modate cases where X–Y dispersion is caused at least in partby other, nonrandom factors? Imagine that participant i’sscores on X and Yare attributable partly to a common variableSiC, but also partly to factors (S
iX and S
iY) that are unique to the
performance and report tests, respectively:
X ¼ SiC þ SiX þ eX ; ð4ÞY ¼ SiC þ SiY þ eY : ð5Þ
Each term could beweighted differentially (as in Eqs. 2 and3), but these weights are omitted here for simplicity. This is amore realistic model of report and performance which as-sumes a factor common to both types of test as well as uniquefactors. For instance, general attentiveness (SiC) might varyacross participants in such a way that highly attentive individ-uals tend to score high on both types of test. At the same time,“intuitive” individuals might score high on unconscious pro-cessing (SiX) independently of conscious (S
iY) processing, and
“deliberative” individuals might score high on conscious pro-cessing independently of unconscious processing. The sim-pler model (Eqs. 2 and 3) is of course a special case of themore complex model specified by Eqs. 4 and 5.
In this model, SiX and SiY are independent, but constantwithin participants and will therefore tend to weaken the cor-relation between X and Y. With the error terms eX and eYfurther weakening that correlation, the model encapsulatedin Eqs. 4 and 5 thus predicts robust regression to the mean,of magnitude determined by Eq. 1. In the case where eX and eYare zero, the ensuing regression would not, of course, be at-tributable to the phenomenon illustrated in Fig. 3 (bias in eY),but to a related effect: The independent distribution of SiX andSiY means a below-chance-level score on Y selected post hocwould be likely to incorporate a negative value of SiY. For sucha score, it is bias in SiY rather than in eY that would createregression to the mean, and a result similar to that depicted
Psychon Bull Rev
in Fig. 3 would ensue, with SiY replacing eY. Although situa-tions where eX and eY are zero are unlikely to have any mean-ing within behavioral research, this example illustrates thatregression to the mean would still be a statistical inevitabilityeven if they were.
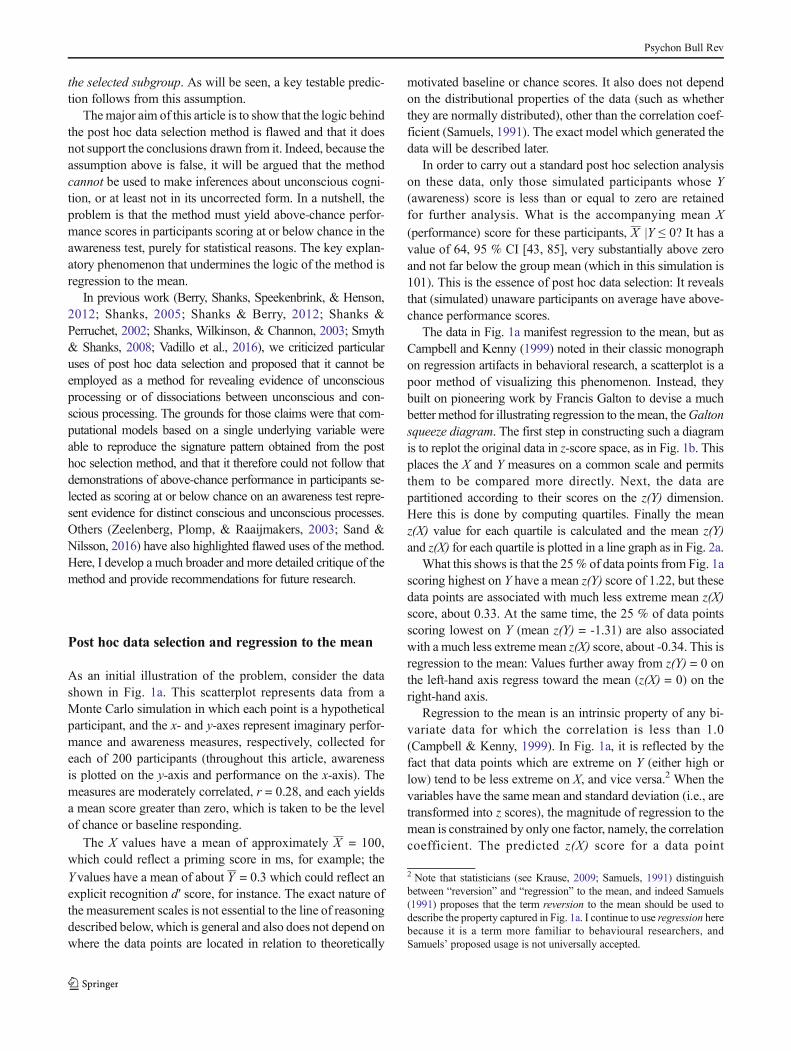
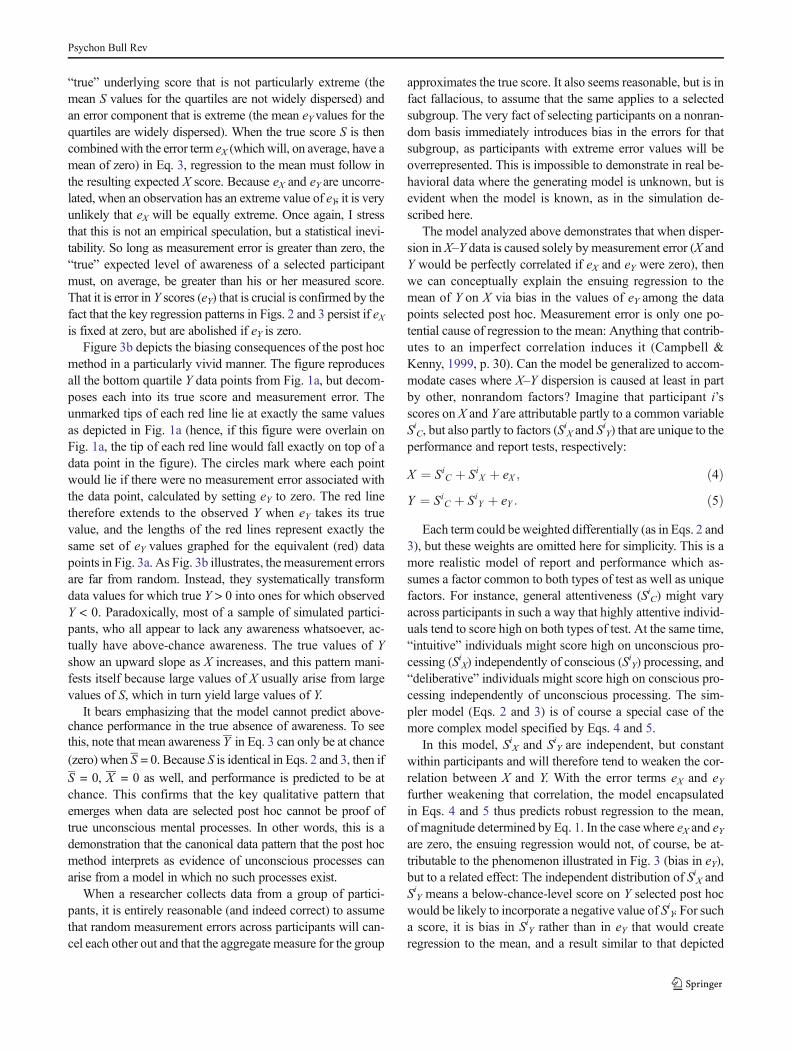
A further model variant is one in which there are genuinelytwo distinct subpopulations of participants, one in whichawareness and performance are correlated and another inwhich they are uncorrelated. Such a mixture model allowsus to ask whether the post hoc selection method has diagnosticvalue when at least some participants truly do show an uncon-scious performance effect. For instance, imagine that the per-formance of some participants (True Aware) is determined bya model similar to that of Eqs. 2 and 3, such that X = S + eXand Y = 2 + S + eY, where eX, eY ~ N(0,1) and S ~ N(1,1). Incontrast, the performance of other participants (TrueUnaware) is determined by a model in which X = S + eX andY = eY. Conscious (Y) and unconscious (X) measures will tendto be correlated in True Aware participants because each de-pends on the common variable S. But Y and X will be uncor-related in True Unaware participants, for whom Y is simply arandom value drawn from a distribution with mean zero.Figure 4 shows a resulting scatterplot for 200 simulated par-ticipants, 100 from each subgroup. Clearly, the True Unawareparticipants have on average no awareness (Y = 0), but above-
chance performance (X > 0).If the post hoc selection method is applied to these data,
with a cutoff at Y = 0, we obtain, naturally, evidence of un-conscious processing. In this case this would be a correctinference because the data are derived from participants inwhom true latent knowledge S influences performance, butnot awareness. However, unless the distribution of Y scoresshows evidence of bimodality, the method can provide no
proof that the data come from such a mixture model. As theexamples described previously show, the same qualitative pat-
tern (X > 0 when Y = 0) can arise even when the underlyingmodel does not permit a distinction between conscious andunconscious processes at the level of the latent processes. Solong as regression to the mean occurs, the pattern is inevitable.And the only condition required for regression to the mean isthat X and Y are imperfectly correlated.
To summarize, in this section I have shown that regressionto the mean is a statistical inevitability whenever X and Y areimperfectly correlated, and the magnitude of regression (in zspace) is determined solely by r. The reason it occurs is thatwhatever is the source of between-participants variation (be itmeasurement error or a nonrandom factor or both) will beunevenly distributed across a subsample formed on the basisof Y. As soon as one collects a sample post hoc on the basis ofa cutoff on the Yvariable, members of that sample will tend tohave biased values for the factor underlying that variation,because members for whom the values are extreme are morelikely to meet the cutoff criterion. The bias will disappear inthe X measure due to regression to the mean. Even if thesample includes truly unaware participants, the post hoc meth-od provides no mechanism for proving as much.
Regression to the mean for binary measures
The analysis provided above assumes continuous measuresof conscious and unconscious processing. However, aware-ness is frequently measured in a binary way. Many studieson subliminal perception, for example, present participantson each trial with a masked prime stimulus followed by a
Fig. 4 Scatterplot of data generated according to the mixture model described in the text. Y is assumed to be a measure of awareness and X a measure ofperformance. Crosses represent simulated participants whose performance is truly conscious and circles ones whose performance is truly unconscious.
Psychon Bull Rev
target stimulus and measure responding to the target. Suchstudies determine whether the prime exerts any influenceon the target response, compared to an unprimed baseline.At the end of each trial the participant reports whether theprime was seen (conscious) or unseen (unconscious). Theinvestigator then performs post hoc data selection at thelevel of items rather than participants. That is to say, allitems for which participants made “unseen” reports are ag-gregated and target responding is assessed for this subset ofitems.
In this section I show that this method is undermined byregression to the mean in an analogous way to that de-scribed previously (for other criticisms of this technique,see Schmidt, 2015). To demonstrate this I once again con-struct a simple model. In this case, the latent variable S is arandom Bernoulli variable akin to a coin toss and withvalues zero or one, each occurring with probability 0.5. Scan be thought of as the underlying true binary state of theparticipant when a given prime stimulus is presented. Next,it is assumed that the behavioral response X, which might,for example, be a dependent measure in milliseconds, isdetermined by
X ¼ 100 S þ 30 eX ; ð6Þwhere eX ~ N(0,1). From this it follows that X will have anoverall mean of zero (there will be no priming) when theparticipant is in the true “unseen” state (S = 0), but willhave a mean of 100 (substantial priming) when she is inthe true “seen” state (S = 1).
The model assumes that the participant’s binary verbalreport (“seen”/”unseen”) depends on the same latent statevariable S:
Y ¼ 1 if S þ wYeY ≥ 0:50 if S þ wYeY < 0:5;
�ð7Þ
where eY ~ N(0,1) and wY is a weight. Consider the casefirst of all where wY is zero. Under these conditions a sim-ple correspondence exists such that Y = S: measured aware-ness is perfectly aligned with the underlying true state.Next, consider the alternative case where wY = 1. If S = 0and the amount of error eY is close to zero, Y will also bezero. But on those trials when by chance eY is greater thanor equal to 0.5, Y will cross the 0.5 threshold and switchfrom zero to one. Conversely, if S = 1 and eY is close tozero, Y will also be 1, but on those trials where eY is lessthan -0.5, Y will cross the 0.5 threshold and switch fromone to zero. The error term eY introduces trials where themeasured and true states Y and S diverge. The weight wY
serves to modulate the impact of error: the larger wY, themore error trials there will be. As before, this model cannotpredict (subliminal) performance in the true absence of
awareness (S = 0). If S = 0, then X = 0 too.
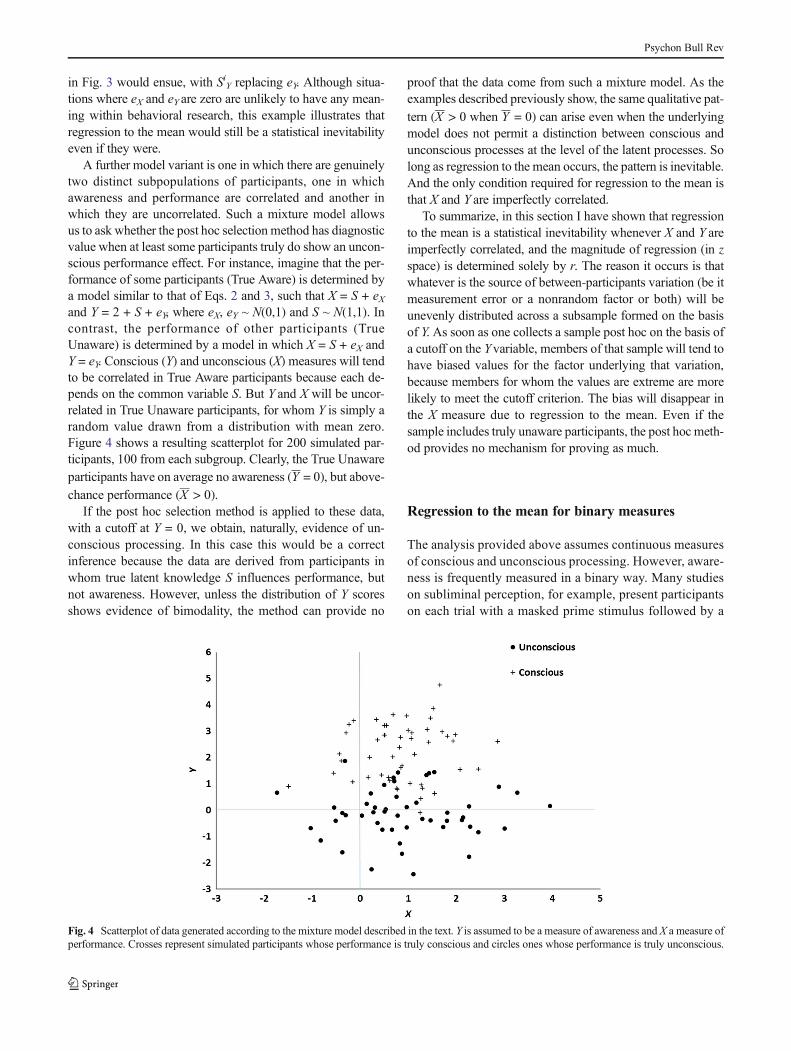
Figure 5a presents results from this model across 200 sim-
ulated participants, plotting the mean level of priming (X )obtained for different values of wY when post hoc selectionis applied. In the complete absence of error on Y, no priming isobtained on “unseen” trials, while substantial priming (=100)occurs on “seen” trials. AswY increases, so does the amount ofpriming on unseen trials. Thus, simply as a consequence ofmeasurement error, the model generates an apparent but infact wholly artifactual subliminal priming effect. When thecontribution of error on Y becomes quite large, the degree ofpriming on seen and unseen trials tends towards convergence.
In this example seen and unseen trials are assumed to beequally frequent, but this may be an unrealistic assumption. Inmany subliminal perception experiments the frequency of seentrials is much lower than 50 %, presumably because the stimuliare genuinely below or at least close to the awareness threshold.In the experiments on brightness discrimination by Harris,Schwarzkopf, Song, Bahrami, and Rees (2011), for instance,the proportion of seen trials was only 12 %–26 % in differentconditions. Although this alters the precise quantitative behav-ior of the model described in Eqs. 6 and 7, it does not alter itsqualitative predictions. Figure 5b shows the model’s outputwhen the probability of S having the value 1 is reduced from50 % to 10 %. When wY = 0.6, for example, the percentage ofseen trials is 22 % (this is larger than 10 % because many trialswith S = 0 become seen trials as a result of the error componentof Eq. 7). Although the expected mean level of priming (X)obtained for different values of wY is lower than in Fig. 5a, thelevel again is greater than zero and increases with wY, yieldingsubstantial priming on unseen trials.
Regression to the mean is sufficient to induce apparentunconscious priming in a model that does not permit trueunconscious effects at the level of the underlying latent psy-chological state. It does so because of the asymmetry of “cap-tures,” cases where as a result of measurement error true stateswith S = 1 become unseen reports (Y = 0). Such cases regresstowards the mean on X, yielding substantial priming scores.Only in the unrealistic case where measurement error iscompletely absent does this effect attenuate completely.
Testing a key prediction of the regression account
If the low awareness scores of participants selected post hoc insome sense reflect their true awareness, as researchersemploying the method assume, then a simple prediction canbe derived. Suppose such participants are tested a second timeon the awareness test. On this account their average awarenessscores should be similar to those in the first test. Their lowscores on Test 1 are assumed to reflect some true underlying(non)awareness, plus random measurement error. On Test 2the underlying awareness is the same, but combined with new
Psychon Bull Rev
and uncorrelated measurement error. Because the latter is un-biased (has a mean of zero), the mean awareness of a group ofparticipants selected by this method should be the same onTests 1 and 2.
The regression account makes a strongly contrasting pre-diction, namely that on Test 2 these participants will scorehigher than on Test 1. Because the post hoc selection methodcollects extreme data on the awareness measure, biased byextreme eY error components, and because scores on twoawareness subtests will invariably be imperfectly correlated,scores on Test 1 will regress to the mean on Test 2 (and viceversa). Thus, the regression account makes a testable predic-tion which is strongly at variance with an assumption of thepost hoc selection method.
To test this novel prediction, I reanalyzed data from acontextual cuing study by Smyth and Shanks (2008,Experiment 1). This experiment replicated and extendedan earlier one by Chun and Jiang (2003) that had employedpost hoc data selection among its analyses. Full details ofthe procedure are reported in the original article and in themain are not crucial here, but in brief the experiment com-prised the following elements. Forty participants complet-ed 24 blocks of a contextual cuing experiment, each com-prising 24 visual search trials in which participants locateda target (the letter T inverted by 90°) among 11 distractors(Ls). On locating the target, they pressed one of two re-sponse keys as fast as possible to indicate its orientation.The key manipulation is that some of the patterns of
Fig. 5 a Simulated results from the binary awareness model described inEqs. 6 and 7. Y is assumed to be a measure of awareness, and X a measureof performance. Squares represent trials in which participants report
conscious experience of the stimulus (Seen), and circles represent trialsin which they report no conscious experience (Unseen). b Predictions ofthe model when the probability of S = 1 is set to 0.1 rather than 0.5.
Psychon Bull Rev
distractors repeated during the experiment (once per block)and for these patterns the target was always in the samelocation (though its orientation was unpredictable).Contextual cuing experiments ask whether participantscan learn about the predictiveness of repeating configura-tions of objects, as indicated by faster RTs to repeatingcompared to random (nonrepeating) displays. The RT dif-ference for nonrepeating and repeating patterns was calcu-lated for each participant across the final six blocks of theexperiment, and this is taken as each individual’s perfor-mance score in the following discussion. Contextual cuingis a reliable phenomenon, and 30/40 (75 %) of the partic-ipants showed a numerical learning effect, M = 80.6 ms,95 % CI [37.9, 123.2].
At the end of the contextual cuing stage, participants’awareness was assessed via a generation test in which on eachtrial a display was presented, in which the target T had beenreplaced with another distractor L and the participant wasrequired (under no time pressure) to indicate which quadrantof the screen contained this “hidden” target. The test thereforeasks participants to make nonverbal reports about the keyexperimental variable.
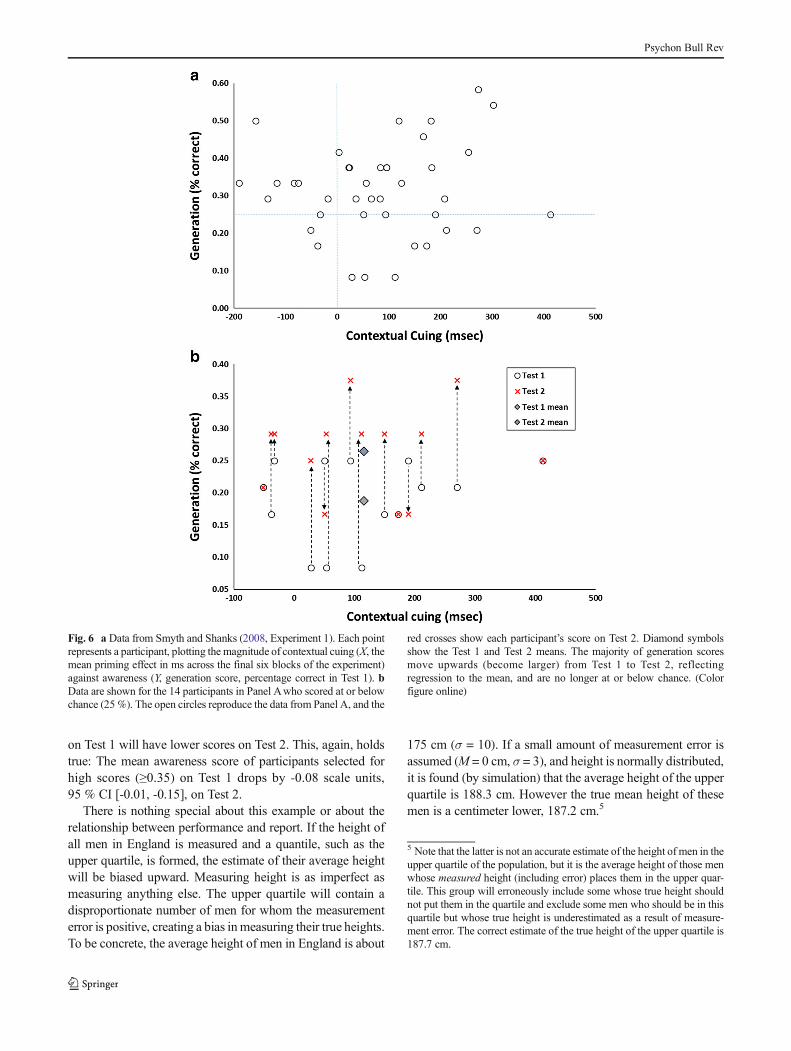
The generation test comprised four blocks of trials eachcomprising the 12 repeated configurations from the learningstage and 12 random configurations. The latter are ignored inthe following analysis, which focuses on performance on therepeated configurations. If contextual cuing yields pure un-conscious knowledge then participants should be unable toreport the quadrant containing the hidden target (Chun &Jiang, 2003). Because there are four quadrants, chance-levelproportion correct is .25. Each participant’s score combinedacross Blocks 1 and 2 of the generation test (Test 1) and acrossBlocks 3 and 4 (Test 2) was calculated. Figure 6a is ascatterplot with the performance score (contextual cuing) onthe x-axis and Test 1 awareness on the y-axis.
The group’s performance on Test 1 was .31, 95 % CI[.28, .35]. Consistent with the point made in the introduc-tion, this level is significantly above chance. Group-levelassessments of awareness in implicit learning experimentsrarely yield scores truly at chance (Vadillo et al., 2016).Thus, post hoc data selection may yield evidence for trueimplicit learning, even though group performance doesnot. Figure 6a indicates that 14/40 participants scored ator below chance on the awareness test (Test 1) and henceare selected for further analysis. These data arereproduced in Fig. 6b (note that the axes have been ad-justed to make visualization easier). These 14 participantsshow a strong performance effect, M = 115.9 ms, 95 % CI[40.7, 191.2], if anything, slightly greater than the meanfor the entire group. Thus, these participants, who appearto completely lack awareness of the target’s location andwho perform no better than chance in the generation test,nonetheless responded much faster to repeating than
random patterns in the earlier contextual cuing part ofthe experiment.4
This pattern is therefore a clear replication of the post hocselection method that has been used in many other contextualcuing experiments (e.g., Chun & Jiang, 2003). But is it evi-dence for true unconscious knowledge, or is it simply an in-evitable consequence of regression to the mean? We can ad-dress this question in two different ways. First, we can askwhether the observed degree of regression to the mean in theselected participants’ mean priming score (X), given theirmean awareness score (Y), is in line with Eq. 1. From the X–Y correlation (r = 0.10) and the awareness z score (-1.04), wecan calculate the expected priming z score if it were purely aconsequence of regression:
z Xð Þ ¼ r z Yð Þ ¼ 0:10� −1:04 ¼ −0:10:
This value falls inside the 95 % confidence interval of theobserved mean priming z score in the selected subgroup,M =0.27, 95 % CI [-0.30, 0.83]. Thus, the observed level of prim-ing in the unaware subgroup is consistent with regression tothe mean being the only causal process.
There is a second and even more compelling way of testingthe different predictions made by the two accounts, namely tocompare the selected participants’ scores on Tests 1 and 2.Recall that the regression account predicts that extreme scoreson Test 1 will regress to the mean on Test 2. In Fig. 6b, eachparticipant is depicted by two data points, one (open circles)showing their scores on Test 1 and the other (red crosses)showing Test 2, with each point having the same performancescore (X value). The green and blue diamonds show the sub-group’s mean scores for each test. It is clear that the regressionaccount is strongly supported: Most of the participants (9/14)score better on Test 2 than Test 1, with only two showing theopposite pattern (there were three ties). This improvement issignificant, M = .08, 95 % CI [0.02, 0.14], and provides nosupport for the assumption on which the post hoc selectionmethod rests. The method construes the selected participantsas being truly unaware and therefore predicts that their lowreport scores should be maintained from Test 1 to Test 2.
It is important to emphasize that regression is a nondirec-tional process. Thus, data selected on the basis of extreme lowscores on Test 1 will regress toward the mean on Test 2, but bythe same token extreme low scores on Test 2 will regresstoward the mean on Test 1: The mean change for the latter isabout the same size, M = 0.10, 95 % CI [0.04, 0.15].Moreover, the same applies to high scores. The regressionaccount predicts that participants with high awareness scores
4 Smyth and Shanks (2008) reported results of various post hoc selectionanalyses across both participants and trials. Lest the reader conclude thatwe were guilty of the analytic fallacy being highlighted in this article, itshould be pointed out that those analyses were only included at the re-quest of a reviewer.
Psychon Bull Rev
on Test 1 will have lower scores on Test 2. This, again, holdstrue: The mean awareness score of participants selected forhigh scores (≥0.35) on Test 1 drops by -0.08 scale units,95 % CI [-0.01, -0.15], on Test 2.
There is nothing special about this example or about therelationship between performance and report. If the height ofall men in England is measured and a quantile, such as theupper quartile, is formed, the estimate of their average heightwill be biased upward. Measuring height is as imperfect asmeasuring anything else. The upper quartile will contain adisproportionate number of men for whom the measurementerror is positive, creating a bias inmeasuring their true heights.To be concrete, the average height of men in England is about
175 cm (σ = 10). If a small amount of measurement error isassumed (M = 0 cm, σ = 3), and height is normally distributed,it is found (by simulation) that the average height of the upperquartile is 188.3 cm. However the true mean height of thesemen is a centimeter lower, 187.2 cm.5
5 Note that the latter is not an accurate estimate of the height of men in theupper quartile of the population, but it is the average height of those menwhose measured height (including error) places them in the upper quar-tile. This group will erroneously include some whose true height shouldnot put them in the quartile and exclude some men who should be in thisquartile but whose true height is underestimated as a result of measure-ment error. The correct estimate of the true height of the upper quartile is187.7 cm.
Fig. 6 a Data from Smyth and Shanks (2008, Experiment 1). Each pointrepresents a participant, plotting the magnitude of contextual cuing (X, themean priming effect in ms across the final six blocks of the experiment)against awareness (Y, generation score, percentage correct in Test 1). bData are shown for the 14 participants in Panel Awho scored at or belowchance (25%). The open circles reproduce the data from Panel A, and the
red crosses show each participant’s score on Test 2. Diamond symbolsshow the Test 1 and Test 2 means. The majority of generation scoresmove upwards (become larger) from Test 1 to Test 2, reflectingregression to the mean, and are no longer at or below chance. (Colorfigure online)
Psychon Bull Rev
The reason for this (just as in the use of post hoc selectionin studies of unconscious cognition) is that the measurementof height in this example is being used for two purposes: toconstruct the subsample and to estimate the mean in the sub-sample. If two independent height measures were taken forthese two purposes, then regression would be allowed to takeits natural course, and the estimate of height in the subsamplewould be unbiased. This leads to the obvious recommendationabout future use of post hoc selection in research on uncon-scious cognition: It must be based on two independent mea-sures of awareness. I amplify this recommendation later.
The reliability of the awareness measure in the data de-scribed above, calculated as the correlation across participantsbetween their awareness scores on Tests 1 and 2, is a mere0.37. This means that the measurement error on Y, eY, issubstantial. The reliability estimate is low, but it is importantto highlight that other research has also obtained reliabilityestimates far below 1.0 for tests of reportable knowledge.For instance, Buchner and Wippich (2000) reported valuesbetween and 0.41 and 0.88 for explicit recognition and recalltests in memory experiments. The figures they obtained forpriming tests were even lower: 0.13–0.44 (see also LeBel &Paunonen, 2011; Ward, Berry, & Shanks, 2013).
The prevalence of post hoc data selection in researchon unconscious cognition
In this section I briefly describe the extent to which themethoddescribed above has been employed in research on uncon-scious cognition. This review highlights the fact that posthoc selection has been in regular use for over a century toaddress a broad range of specific questions about unconsciousprocessing. It would be impossible to systematically collect allsuch studies (in part because no consistent name for the meth-od is used) and because it is applied in so many differentcontexts, but it is clear that dozens of studies have based theirconclusions in whole or part on this analytic technique.
The first use was by Peirce and Jastrow (1884), in one ofthe most famous experiments from the early history of psy-chology. In tests of pressure discrimination, Peirce andJastrow used an apparatus that allowed weights to induce dif-ferent pressures on the finger. Two pressures were presented insuccession and followed by a judgment about which wasgreater, and, finally, a confidence rating from 0–3, where 0“denoted absence of any preference for one answer over itsopposite, so that it seemed nonsensical to answer at all,” and 3“denoted as strong a confidence as one would have about suchsensations” (p. 77). Peirce and Jastrow found that very similarpressures could be reliably discriminated better than pureguessing, even on those occasions when a rating of zero wasmade. An early use in vision was an analogous experiment byWilliams (1938), who presented one of three stimuli (a circle,
triangle, or square) at near-threshold intensity for participantsto identify at a distance of about 10 feet (~3 m). Each responsewas accompanied by one of three reports: that the figure wasclearly seen, that something was seen, or that nothing wasseen. Williams observed that identification was reliably betterthan chance, even for unseen stimuli.
It is instructive to consider these studies alongside those ofSidis (1898). Although the research of Peirce and Jastrow(1884) and Sidis (1898) is often discussed together, theirmethods were—for present purposes—different in a crucialrespect. Sidis placed participants far enough away from a cardthat they could not consciously make out the letter or numberprinted on it. He reports that
“he saw nothing but a dim, blurred spot or dot. Thesubject had to name some character which that particulardot shown might possibly be. ‘It is nothing but mereguess,’ commented the subjects” Sidis (1898, p. 170).
Nevertheless, the characters were identified with accuracymuch greater than would be expected by pure guessing.Although the empirical conclusion is the same, Sidis’s find-ings are not susceptible to a regression-to-the-mean artifactbecause no selection was required: By removing the card toa sufficient distance, Sidis ensured that all trials were uncon-scious ones, not just those chosen post hoc on the basis of theparticipant’s report.
In a famous and influential study, Lazarus and McCleary(1951) first paired nonwords with a shock unconditioned stim-ulus and subsequently observed reliable skin conductance re-sponses when the nonwords were briefly presented, and evenon trials (selected post hoc) where the participant was unableto report the stimulus. Many early examples are reviewed byDixon (1971), in the case of subliminal perception, andBrewer (1974), in the case of Pavlovian and instrumental con-ditioning. Brewer notes the existence of at least 31 experi-ments published during the 1950s on just one particular topic,which divided aware and unaware participants to study verbaloperant conditioning.
The studies described in Table 1, which include articles inhighly prestigious journals such as Science and Nature, high-light the breadth of applications of the post hoc method. Forexample, selection has been applied to participants and totrials. It has been applied in primates (Supèr, Spekreijse, &Lamme, 2001) as well as humans, with “reports” made non-verbally. It has been employed in studies of social learning(Heerey & Velani, 2010), language (Paciorek & Williams,2015), and emotion processing (Sweeny, Grabowecky,Suzuki, & Paller, 2009), as well as in the clinical domain(Mogg, Bradley, & Williams, 1995).
Trial-based selection has been applied not only when bina-ry awareness measures have been made but also with finercategorizations: in the study by Koivisto, Mäntylä, and
Psychon Bull Rev
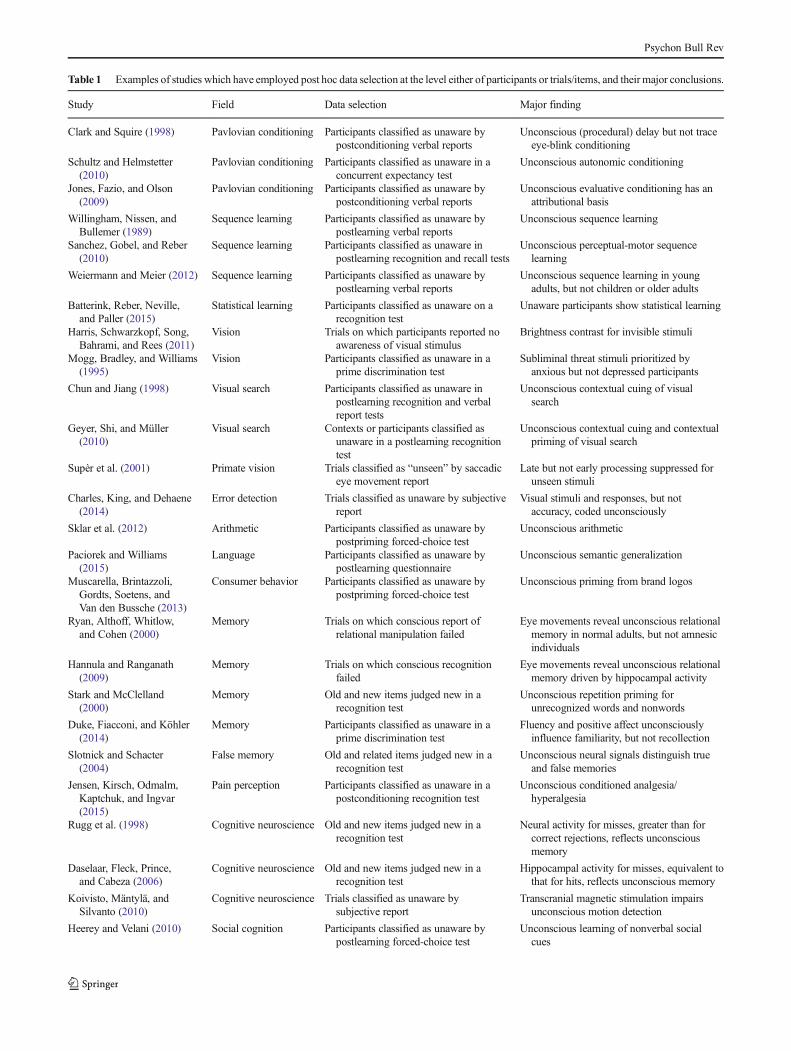
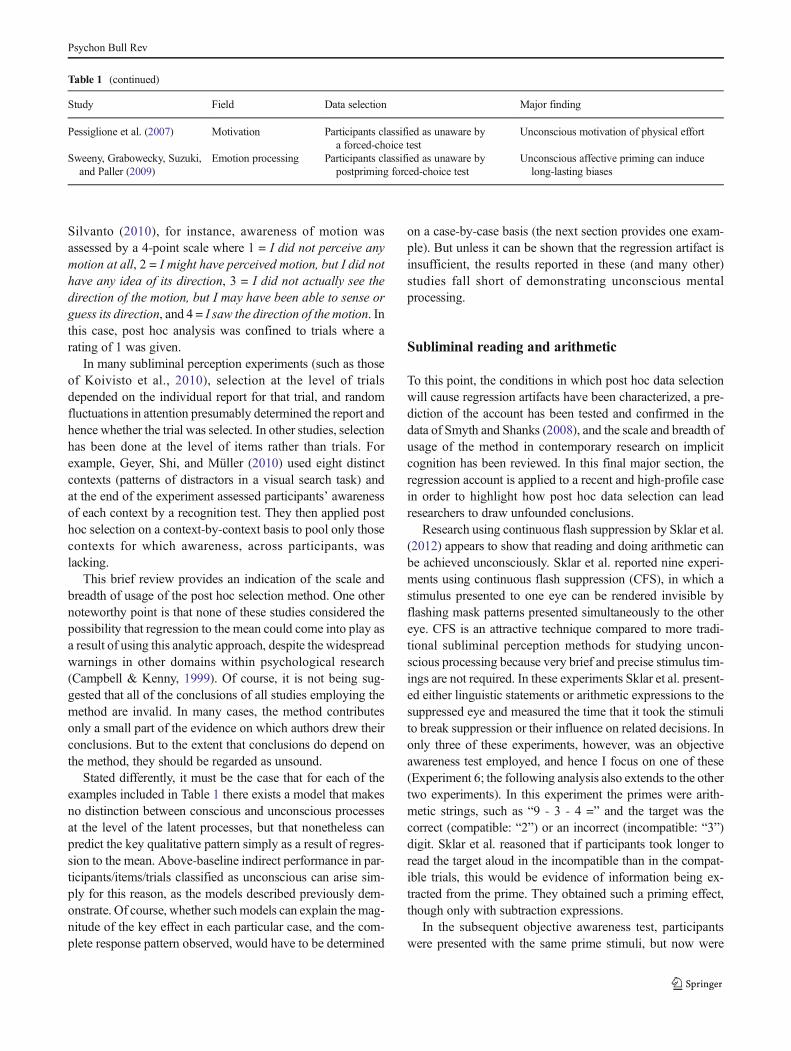
Table 1 Examples of studies which have employed post hoc data selection at the level either of participants or trials/items, and their major conclusions.
Study Field Data selection Major finding
Clark and Squire (1998) Pavlovian conditioning Participants classified as unaware bypostconditioning verbal reports
Unconscious (procedural) delay but not traceeye-blink conditioning
Schultz and Helmstetter(2010)
Pavlovian conditioning Participants classified as unaware in aconcurrent expectancy test
Unconscious autonomic conditioning
Jones, Fazio, and Olson(2009)
Pavlovian conditioning Participants classified as unaware bypostconditioning verbal reports
Unconscious evaluative conditioning has anattributional basis
Willingham, Nissen, andBullemer (1989)
Sequence learning Participants classified as unaware bypostlearning verbal reports
Unconscious sequence learning
Sanchez, Gobel, and Reber(2010)
Sequence learning Participants classified as unaware inpostlearning recognition and recall tests
Unconscious perceptual-motor sequencelearning
Weiermann and Meier (2012) Sequence learning Participants classified as unaware bypostlearning verbal reports
Unconscious sequence learning in youngadults, but not children or older adults
Batterink, Reber, Neville,and Paller (2015)
Statistical learning Participants classified as unaware on arecognition test
Unaware participants show statistical learning
Harris, Schwarzkopf, Song,Bahrami, and Rees (2011)
Vision Trials on which participants reported noawareness of visual stimulus
Brightness contrast for invisible stimuli
Mogg, Bradley, and Williams(1995)
Vision Participants classified as unaware in aprime discrimination test
Subliminal threat stimuli prioritized byanxious but not depressed participants
Chun and Jiang (1998) Visual search Participants classified as unaware inpostlearning recognition and verbalreport tests
Unconscious contextual cuing of visualsearch
Geyer, Shi, and Müller(2010)
Visual search Contexts or participants classified asunaware in a postlearning recognitiontest
Unconscious contextual cuing and contextualpriming of visual search
Supèr et al. (2001) Primate vision Trials classified as “unseen” by saccadiceye movement report
Late but not early processing suppressed forunseen stimuli
Charles, King, and Dehaene(2014)
Error detection Trials classified as unaware by subjectivereport
Visual stimuli and responses, but notaccuracy, coded unconsciously
Sklar et al. (2012) Arithmetic Participants classified as unaware bypostpriming forced-choice test
Unconscious arithmetic
Paciorek and Williams(2015)
Language Participants classified as unaware bypostlearning questionnaire
Unconscious semantic generalization
Muscarella, Brintazzoli,Gordts, Soetens, andVan den Bussche (2013)
Consumer behavior Participants classified as unaware bypostpriming forced-choice test
Unconscious priming from brand logos
Ryan, Althoff, Whitlow,and Cohen (2000)
Memory Trials on which conscious report ofrelational manipulation failed
Eye movements reveal unconscious relationalmemory in normal adults, but not amnesicindividuals
Hannula and Ranganath(2009)
Memory Trials on which conscious recognitionfailed
Eye movements reveal unconscious relationalmemory driven by hippocampal activity
Stark and McClelland(2000)
Memory Old and new items judged new in arecognition test
Unconscious repetition priming forunrecognized words and nonwords
Duke, Fiacconi, and Köhler(2014)
Memory Participants classified as unaware in aprime discrimination test
Fluency and positive affect unconsciouslyinfluence familiarity, but not recollection
Slotnick and Schacter(2004)
False memory Old and related items judged new in arecognition test
Unconscious neural signals distinguish trueand false memories
Jensen, Kirsch, Odmalm,Kaptchuk, and Ingvar(2015)
Pain perception Participants classified as unaware in apostconditioning recognition test
Unconscious conditioned analgesia/hyperalgesia
Rugg et al. (1998) Cognitive neuroscience Old and new items judged new in arecognition test
Neural activity for misses, greater than forcorrect rejections, reflects unconsciousmemory
Daselaar, Fleck, Prince,and Cabeza (2006)
Cognitive neuroscience Old and new items judged new in arecognition test
Hippocampal activity for misses, equivalent tothat for hits, reflects unconscious memory
Koivisto, Mäntylä, andSilvanto (2010)
Cognitive neuroscience Trials classified as unaware bysubjective report
Transcranial magnetic stimulation impairsunconscious motion detection
Heerey and Velani (2010) Social cognition Participants classified as unaware bypostlearning forced-choice test
Unconscious learning of nonverbal socialcues
Psychon Bull Rev
Silvanto (2010), for instance, awareness of motion wasassessed by a 4-point scale where 1 = I did not perceive anymotion at all, 2 = I might have perceived motion, but I did nothave any idea of its direction, 3 = I did not actually see thedirection of the motion, but I may have been able to sense orguess its direction, and 4 = I saw the direction of the motion. Inthis case, post hoc analysis was confined to trials where arating of 1 was given.
In many subliminal perception experiments (such as thoseof Koivisto et al., 2010), selection at the level of trialsdepended on the individual report for that trial, and randomfluctuations in attention presumably determined the report andhence whether the trial was selected. In other studies, selectionhas been done at the level of items rather than trials. Forexample, Geyer, Shi, and Müller (2010) used eight distinctcontexts (patterns of distractors in a visual search task) andat the end of the experiment assessed participants’ awarenessof each context by a recognition test. They then applied posthoc selection on a context-by-context basis to pool only thosecontexts for which awareness, across participants, waslacking.
This brief review provides an indication of the scale andbreadth of usage of the post hoc selection method. One othernoteworthy point is that none of these studies considered thepossibility that regression to the mean could come into play asa result of using this analytic approach, despite the widespreadwarnings in other domains within psychological research(Campbell & Kenny, 1999). Of course, it is not being sug-gested that all of the conclusions of all studies employing themethod are invalid. In many cases, the method contributesonly a small part of the evidence on which authors drew theirconclusions. But to the extent that conclusions do depend onthe method, they should be regarded as unsound.
Stated differently, it must be the case that for each of theexamples included in Table 1 there exists a model that makesno distinction between conscious and unconscious processesat the level of the latent processes, but that nonetheless canpredict the key qualitative pattern simply as a result of regres-sion to the mean. Above-baseline indirect performance in par-ticipants/items/trials classified as unconscious can arise sim-ply for this reason, as the models described previously dem-onstrate. Of course, whether suchmodels can explain the mag-nitude of the key effect in each particular case, and the com-plete response pattern observed, would have to be determined
on a case-by-case basis (the next section provides one exam-ple). But unless it can be shown that the regression artifact isinsufficient, the results reported in these (and many other)studies fall short of demonstrating unconscious mentalprocessing.
Subliminal reading and arithmetic
To this point, the conditions in which post hoc data selectionwill cause regression artifacts have been characterized, a pre-diction of the account has been tested and confirmed in thedata of Smyth and Shanks (2008), and the scale and breadth ofusage of the method in contemporary research on implicitcognition has been reviewed. In this final major section, theregression account is applied to a recent and high-profile casein order to highlight how post hoc data selection can leadresearchers to draw unfounded conclusions.
Research using continuous flash suppression by Sklar et al.(2012) appears to show that reading and doing arithmetic canbe achieved unconsciously. Sklar et al. reported nine experi-ments using continuous flash suppression (CFS), in which astimulus presented to one eye can be rendered invisible byflashing mask patterns presented simultaneously to the othereye. CFS is an attractive technique compared to more tradi-tional subliminal perception methods for studying uncon-scious processing because very brief and precise stimulus tim-ings are not required. In these experiments Sklar et al. present-ed either linguistic statements or arithmetic expressions to thesuppressed eye and measured the time that it took the stimulito break suppression or their influence on related decisions. Inonly three of these experiments, however, was an objectiveawareness test employed, and hence I focus on one of these(Experiment 6; the following analysis also extends to the othertwo experiments). In this experiment the primes were arith-metic strings, such as “9 - 3 - 4 =” and the target was thecorrect (compatible: “2”) or an incorrect (incompatible: “3”)digit. Sklar et al. reasoned that if participants took longer toread the target aloud in the incompatible than in the compat-ible trials, this would be evidence of information being ex-tracted from the prime. They obtained such a priming effect,though only with subtraction expressions.
In the subsequent objective awareness test, participantswere presented with the same prime stimuli, but now were
Table 1 (continued)
Study Field Data selection Major finding
Pessiglione et al. (2007) Motivation Participants classified as unaware bya forced-choice test
Unconscious motivation of physical effort
Sweeny, Grabowecky, Suzuki,and Paller (2009)
Emotion processing Participants classified as unaware bypostpriming forced-choice test
Unconscious affective priming can inducelong-lasting biases
Psychon Bull Rev
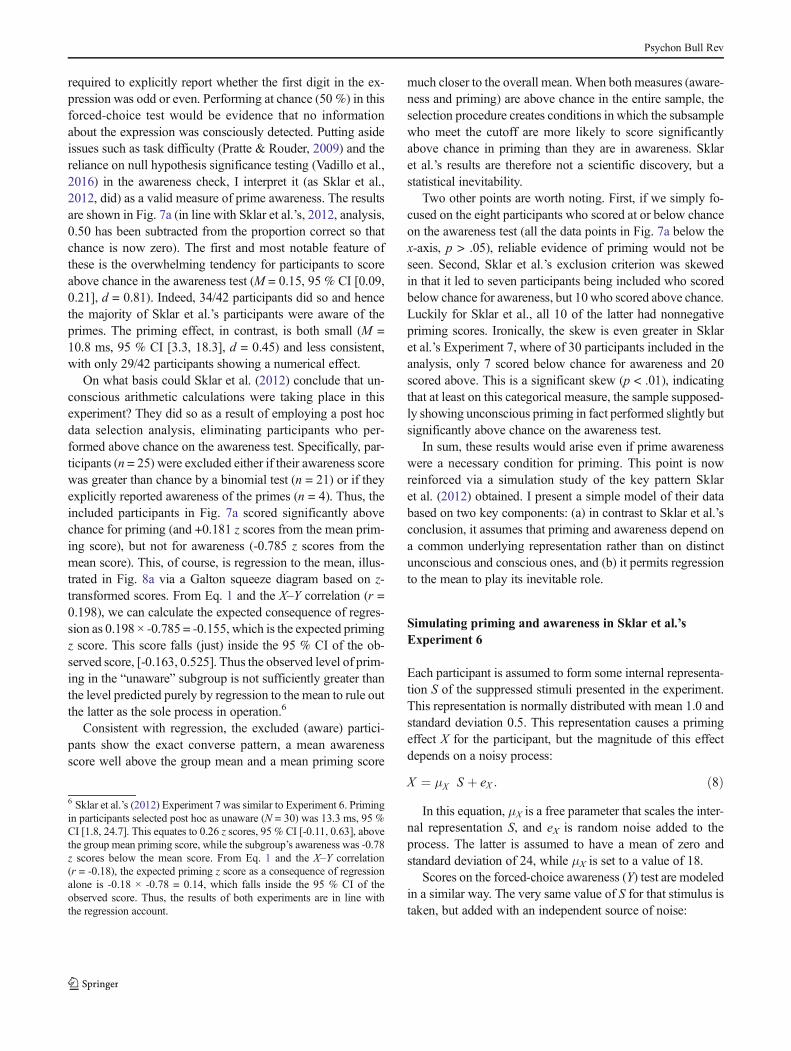
required to explicitly report whether the first digit in the ex-pression was odd or even. Performing at chance (50 %) in thisforced-choice test would be evidence that no informationabout the expression was consciously detected. Putting asideissues such as task difficulty (Pratte & Rouder, 2009) and thereliance on null hypothesis significance testing (Vadillo et al.,2016) in the awareness check, I interpret it (as Sklar et al.,2012, did) as a valid measure of prime awareness. The resultsare shown in Fig. 7a (in line with Sklar et al.’s, 2012, analysis,0.50 has been subtracted from the proportion correct so thatchance is now zero). The first and most notable feature ofthese is the overwhelming tendency for participants to scoreabove chance in the awareness test (M = 0.15, 95 % CI [0.09,0.21], d = 0.81). Indeed, 34/42 participants did so and hencethe majority of Sklar et al.’s participants were aware of theprimes. The priming effect, in contrast, is both small (M =10.8 ms, 95 % CI [3.3, 18.3], d = 0.45) and less consistent,with only 29/42 participants showing a numerical effect.
On what basis could Sklar et al. (2012) conclude that un-conscious arithmetic calculations were taking place in thisexperiment? They did so as a result of employing a post hocdata selection analysis, eliminating participants who per-formed above chance on the awareness test. Specifically, par-ticipants (n = 25) were excluded either if their awareness scorewas greater than chance by a binomial test (n = 21) or if theyexplicitly reported awareness of the primes (n = 4). Thus, theincluded participants in Fig. 7a scored significantly abovechance for priming (and +0.181 z scores from the mean prim-ing score), but not for awareness (-0.785 z scores from themean score). This, of course, is regression to the mean, illus-trated in Fig. 8a via a Galton squeeze diagram based on z-transformed scores. From Eq. 1 and the X–Y correlation (r =0.198), we can calculate the expected consequence of regres-sion as 0.198 × -0.785 = -0.155, which is the expected primingz score. This score falls (just) inside the 95 % CI of the ob-served score, [-0.163, 0.525]. Thus the observed level of prim-ing in the “unaware” subgroup is not sufficiently greater thanthe level predicted purely by regression to the mean to rule outthe latter as the sole process in operation.6
Consistent with regression, the excluded (aware) partici-pants show the exact converse pattern, a mean awarenessscore well above the group mean and a mean priming score
much closer to the overall mean.When both measures (aware-ness and priming) are above chance in the entire sample, theselection procedure creates conditions in which the subsamplewho meet the cutoff are more likely to score significantlyabove chance in priming than they are in awareness. Sklaret al.’s results are therefore not a scientific discovery, but astatistical inevitability.
Two other points are worth noting. First, if we simply fo-cused on the eight participants who scored at or below chanceon the awareness test (all the data points in Fig. 7a below thex-axis, p > .05), reliable evidence of priming would not beseen. Second, Sklar et al.’s exclusion criterion was skewedin that it led to seven participants being included who scoredbelow chance for awareness, but 10 who scored above chance.Luckily for Sklar et al., all 10 of the latter had nonnegativepriming scores. Ironically, the skew is even greater in Sklaret al.’s Experiment 7, where of 30 participants included in theanalysis, only 7 scored below chance for awareness and 20scored above. This is a significant skew (p < .01), indicatingthat at least on this categorical measure, the sample supposed-ly showing unconscious priming in fact performed slightly butsignificantly above chance on the awareness test.
In sum, these results would arise even if prime awarenesswere a necessary condition for priming. This point is nowreinforced via a simulation study of the key pattern Sklaret al. (2012) obtained. I present a simple model of their databased on two key components: (a) in contrast to Sklar et al.’sconclusion, it assumes that priming and awareness depend ona common underlying representation rather than on distinctunconscious and conscious ones, and (b) it permits regressionto the mean to play its inevitable role.
Simulating priming and awareness in Sklar et al.’sExperiment 6
Each participant is assumed to form some internal representa-tion S of the suppressed stimuli presented in the experiment.This representation is normally distributed with mean 1.0 andstandard deviation 0.5. This representation causes a primingeffect X for the participant, but the magnitude of this effectdepends on a noisy process:
X ¼ μX S þ eX : ð8Þ
In this equation, μX is a free parameter that scales the inter-nal representation S, and eX is random noise added to theprocess. The latter is assumed to have a mean of zero andstandard deviation of 24, while μX is set to a value of 18.
Scores on the forced-choice awareness (Y) test are modeledin a similar way. The very same value of S for that stimulus istaken, but added with an independent source of noise:
6 Sklar et al.’s (2012) Experiment 7 was similar to Experiment 6. Primingin participants selected post hoc as unaware (N = 30) was 13.3 ms, 95 %CI [1.8, 24.7]. This equates to 0.26 z scores, 95 % CI [-0.11, 0.63], abovethe group mean priming score, while the subgroup’s awareness was -0.78z scores below the mean score. From Eq. 1 and the X–Y correlation(r = -0.18), the expected priming z score as a consequence of regressionalone is -0.18 × -0.78 = 0.14, which falls inside the 95 % CI of theobserved score. Thus, the results of both experiments are in line withthe regression account.
Psychon Bull Rev
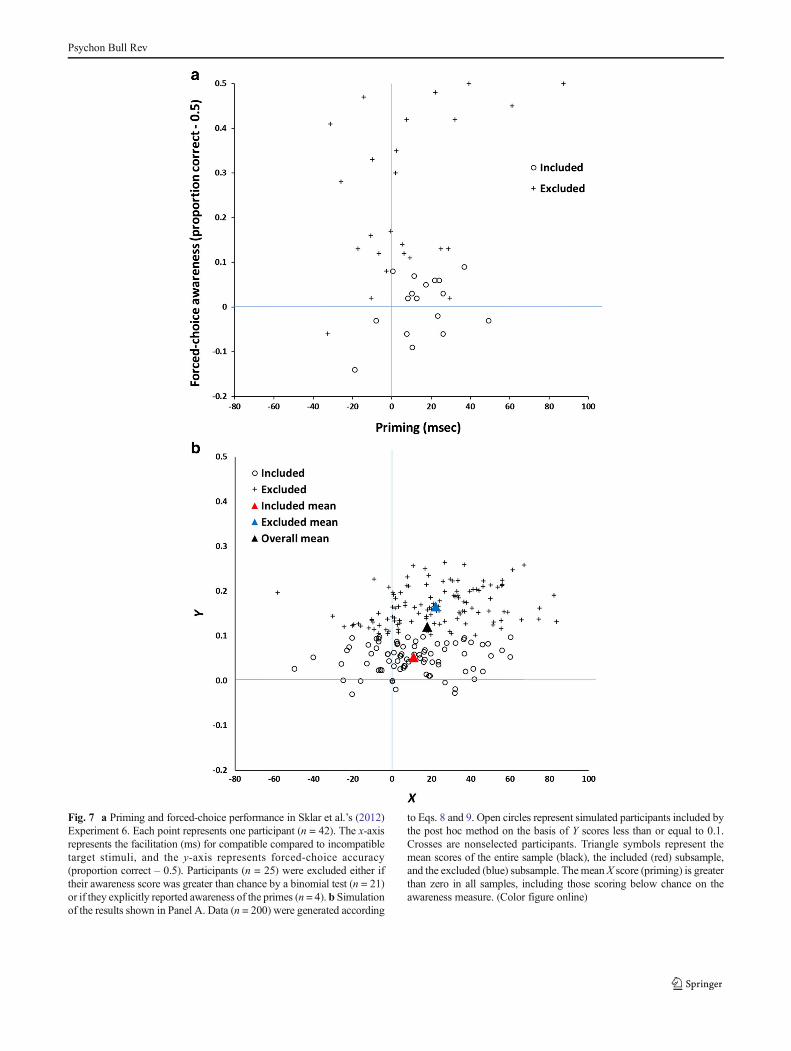
Fig. 7 a Priming and forced-choice performance in Sklar et al.’s (2012)Experiment 6. Each point represents one participant (n = 42). The x-axisrepresents the facilitation (ms) for compatible compared to incompatibletarget stimuli, and the y-axis represents forced-choice accuracy(proportion correct – 0.5). Participants (n = 25) were excluded either iftheir awareness score was greater than chance by a binomial test (n = 21)or if they explicitly reported awareness of the primes (n = 4). b Simulationof the results shown in Panel A. Data (n = 200) were generated according
to Eqs. 8 and 9. Open circles represent simulated participants included bythe post hoc method on the basis of Y scores less than or equal to 0.1.Crosses are nonselected participants. Triangle symbols represent themean scores of the entire sample (black), the included (red) subsample,and the excluded (blue) subsample. Themean X score (priming) is greaterthan zero in all samples, including those scoring below chance on theawareness measure. (Color figure online)
Psychon Bull Rev
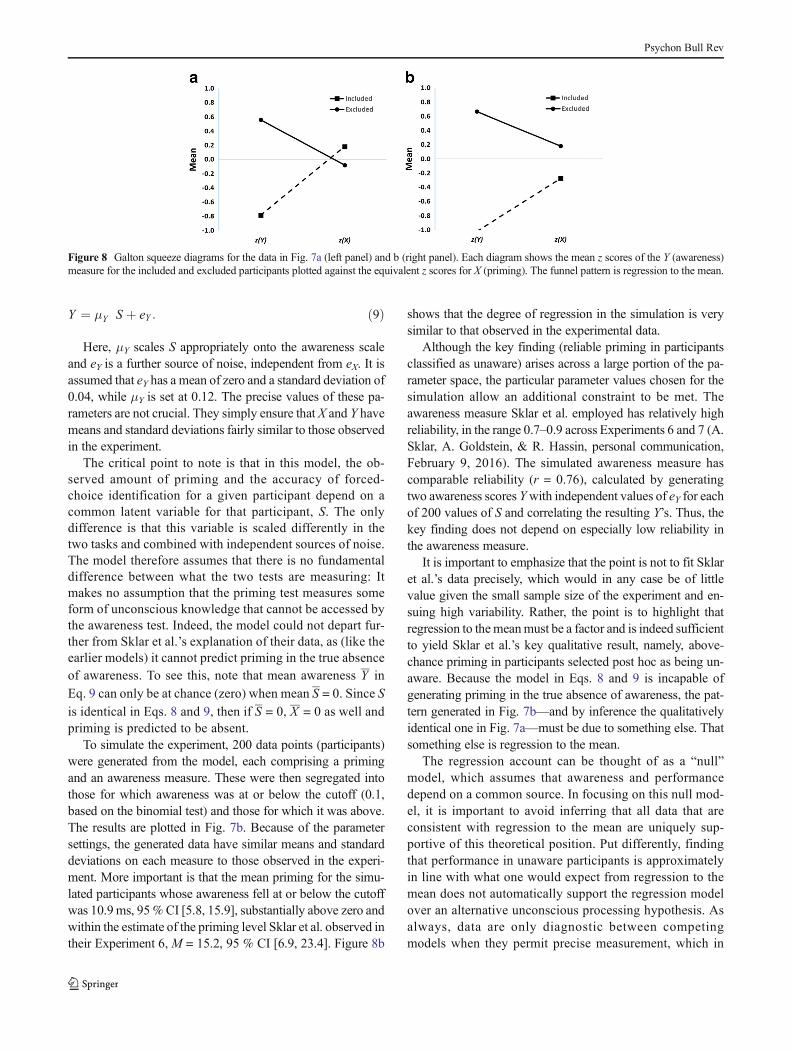
Y ¼ μY S þ eY : ð9Þ
Here, μY scales S appropriately onto the awareness scaleand eY is a further source of noise, independent from eX. It isassumed that eY has a mean of zero and a standard deviation of0.04, while μY is set at 0.12. The precise values of these pa-rameters are not crucial. They simply ensure that X and Y havemeans and standard deviations fairly similar to those observedin the experiment.
The critical point to note is that in this model, the ob-served amount of priming and the accuracy of forced-choice identification for a given participant depend on acommon latent variable for that participant, S. The onlydifference is that this variable is scaled differently in thetwo tasks and combined with independent sources of noise.The model therefore assumes that there is no fundamentaldifference between what the two tests are measuring: Itmakes no assumption that the priming test measures someform of unconscious knowledge that cannot be accessed bythe awareness test. Indeed, the model could not depart fur-ther from Sklar et al.’s explanation of their data, as (like theearlier models) it cannot predict priming in the true absenceof awareness. To see this, note that mean awareness Y in
Eq. 9 can only be at chance (zero) when mean S = 0. Since Sis identical in Eqs. 8 and 9, then if S = 0, X = 0 as well andpriming is predicted to be absent.
To simulate the experiment, 200 data points (participants)were generated from the model, each comprising a primingand an awareness measure. These were then segregated intothose for which awareness was at or below the cutoff (0.1,based on the binomial test) and those for which it was above.The results are plotted in Fig. 7b. Because of the parametersettings, the generated data have similar means and standarddeviations on each measure to those observed in the experi-ment. More important is that the mean priming for the simu-lated participants whose awareness fell at or below the cutoffwas 10.9ms, 95%CI [5.8, 15.9], substantially above zero andwithin the estimate of the priming level Sklar et al. observed intheir Experiment 6, M = 15.2, 95 % CI [6.9, 23.4]. Figure 8b
shows that the degree of regression in the simulation is verysimilar to that observed in the experimental data.
Although the key finding (reliable priming in participantsclassified as unaware) arises across a large portion of the pa-rameter space, the particular parameter values chosen for thesimulation allow an additional constraint to be met. Theawareness measure Sklar et al. employed has relatively highreliability, in the range 0.7–0.9 across Experiments 6 and 7 (A.Sklar, A. Goldstein, & R. Hassin, personal communication,February 9, 2016). The simulated awareness measure hascomparable reliability (r = 0.76), calculated by generatingtwo awareness scores Ywith independent values of eY for eachof 200 values of S and correlating the resulting Y’s. Thus, thekey finding does not depend on especially low reliability inthe awareness measure.
It is important to emphasize that the point is not to fit Sklaret al.’s data precisely, which would in any case be of littlevalue given the small sample size of the experiment and en-suing high variability. Rather, the point is to highlight thatregression to themeanmust be a factor and is indeed sufficientto yield Sklar et al.’s key qualitative result, namely, above-chance priming in participants selected post hoc as being un-aware. Because the model in Eqs. 8 and 9 is incapable ofgenerating priming in the true absence of awareness, the pat-tern generated in Fig. 7b—and by inference the qualitativelyidentical one in Fig. 7a—must be due to something else. Thatsomething else is regression to the mean.
The regression account can be thought of as a “null”model, which assumes that awareness and performancedepend on a common source. In focusing on this null mod-el, it is important to avoid inferring that all data that areconsistent with regression to the mean are uniquely sup-portive of this theoretical position. Put differently, findingthat performance in unaware participants is approximatelyin line with what one would expect from regression to themean does not automatically support the regression modelover an alternative unconscious processing hypothesis. Asalways, data are only diagnostic between competingmodels when they permit precise measurement, which in
Figure 8 Galton squeeze diagrams for the data in Fig. 7a (left panel) and b (right panel). Each diagram shows the mean z scores of the Y (awareness)measure for the included and excluded participants plotted against the equivalent z scores for X (priming). The funnel pattern is regression to the mean.
Psychon Bull Rev
turn requires adequate sample sizes and careful experimen-tal design.
In sum, the model predicts a priming effect in participantswhose awareness is near chance. It does this despite the factthat it embodies no distinction between conscious and uncon-scious processing. Crucial to the explanation is that themodel’s predictions incorporate regression to the mean. Dataselected on one dimension show regression in their scores onthe other dimension.
Relative ordering of means
A final observation about the regression analysis concerns itspredictions for the relative mean performance scores of awareand unaware samples, versus the group mean. If z(Y|Y ≤ 0) andz(Y|Y > 0) are the z-transformed awareness measures of un-aware and aware subgroups, and z(Y) is the group mean, thenwe know that these are ordered z(Y|Y > 0) > z(Y) > z(Y|Y ≤ 0).That is, average awareness in the aware subgroup is greaterthan the overall mean, while that in the unaware subgroup islower. From Eq. 1 it follows that z(X|Y > 0) > z(X) > z(X|Y ≤ 0)if r > 0. Performance should be greatest in the aware subgroupand lowest for the unaware subgroup, with the overall groupmean falling in between. This pattern is evident in Fig. 7b,where performance is greatest for the aware (included) partic-ipants and lowest for the unaware (excluded) ones. The pre-dicted ordering is reversed for negative r.
Some of the empirical results analyzed in this article areclearly at variance with this predicted ordering. For example,in the reanalysis of the data from Smyth and Shanks (2008,Experiment 1), contextual cuing was greater in the unawareparticipants than the overall mean (116 vs. 81 ms). Likewise,in Sklar et al.’s (2012) Experiment 6, mean priming was 15msin unaware participants, compared to an overall groupmean of11 ms. In neither of these cases is the difference statisticallysignificant, but they do, nonetheless, violate the predicted or-dering and must, if regression is the only process operating, beattributed to sampling error. Future studies, employing suffi-ciently large samples to permit high-powered tests of the rel-ative ordering of performance scores in aware and unawaresubgroups, will be of considerable interest.
Conclusions
It has been appreciated for many years that regression to themean must be carefully taken into account when evaluatinginterventions in clinical and educational psychology and else-where (see Campbell & Kenny, 1999; Fiedler & Unkelbach,2014). This article demonstrates that an entirely different fieldwithin psychology, concerned with characterizing uncon-scious mental processes, regularly uses an analytic technique
in which regression to the mean inevitably complicates theinferences that can be drawn. Indeed once regression is con-sidered, the results of many of these studies may turn out notto require postulating distinct unconscious processes at all.
What recommendations can be made about future use ofpost hoc selection in research on unconscious cognition? Thisanalysis points to an obvious suggestion: If it is to be used atall, it should ideally be based on two independent measures ofawareness. If one measure is used to select the “unaware”sample and the second to provide an independent estimate ofawareness in this sample, regression to the mean will tend toeliminate bias in the second measure. This recommendationshould not be onerous to implement. It does not require twocompletely different awareness tests; the odd and even trialsfrom a single test, for example, would be adequate. What onetherefore asks is whether a subgroup created by applying acutoff on Test 1 (a) shows a significant performance effect and(b) continues to score at or below chance on Test 2.
Use of two independent awareness measures should be the“gold standard”. But if only one awareness measure is avail-able, then a simple test, as used above in the reanalyses of theSmyth and Shanks (2008) and Sklar et al. (2012) datasets, is tocompare the observed performance measure in the “unaware”sample against the score that would be predicted by regressionto the mean alone (i.e., Eq. 1). Thus, one can estimate themagnitude of a performance effect X if it arose purely fromregression to the mean and compare this to the observed mag-nitude. If the latter is substantially larger than the former, thena true performance effect can be inferred. Of course, a high-powered test is required if this comparison is to be diagnostic:In the analyses reported above, the confidence intervals on theperformance scores were very wide. Other methods are alsoavailable but are less satisfactory because they rely on as-sumptions that may be difficult to validate. For instance,methods for statistically correcting for regression to the meanhave been developed (see Hsu, 1995, for discussion).
Better still is to avoid use of post hoc selection entirely. Oneapproach is to employ experimental manipulations to ensurethat the entire group is unaware, or on a participant-by-participant basis. For example, in an implicit learning experi-ment, the length of the training phase could be titrated toensure that group-level awareness is not significantly greaterthan chance. Under such circumstances no post hoc selectionis required. Of course, care must be taken to ensure that scoreson the awareness test really are very close to chance: A largesample is likely to be required to ensure narrow confidenceintervals, or a clear Bayes factor favoring the null, on theawareness measure (Dienes, 2015; Vadillo et al., 2016).
With this in mind, it is clear how Sklar et al. (2012) couldobtain stronger evidence for unconscious arithmetic. In theirexperiments, the prime stimulus was presented in continuousflash suppression for 1,700 or 2,000 ms and, as noted previ-ously, participants performed as a group significantly better
Psychon Bull Rev
than chance in the forced-choice awareness test. Thus, onestrategy would be to reduce the prime presentation time forall participants to try to find an exposure duration at which agroup-level priming effect could still be detected, but withchance-level awareness. Under such conditions, no post hocselection would be required.
It is interesting to note that, at least in the field of subliminalperception, participant-by-participant stimulus calibration wasonce the norm (see Holender, 1986). Researchers routinelyemployed staircase methods in which the duration of a primestimulus was increased and decreased in order for each partic-ipant’s awareness threshold to be determined. Then, in themain subliminal perception task, the stimulus was presentedbelow each participant’s threshold. Under these circum-stances, no post hoc selection is required, and any group-level priming can legitimately be taken as evidence for uncon-scious processing. Gradually, however, this practice dwindled,perhaps because it is time-consuming to determine each par-ticipant’s individual threshold, and was replaced by group-level subjective and objective tests and, in some cases, posthoc data selection. Thus, another way in which researcherssuch as Sklar et al. (2012) could obtain stronger evidence isto determine each participant’s awareness thresholdindividually, and ask whether priming occurs when stimuliare presented below threshold.
Preacher et al. (2005) cautioned “that the conclusions that canbe based on the results of EGA [extreme groups analysis], al-though sometimes useful, are limited relative to those based onanalysis of full-range, continuous data” (p. 190). Given the con-cerns identified in this article, it is reasonable to ask whethertraditional regression techniques applied to the entireX–Y datasetmight answer the key questions researchers are interested inconcerning unconscious processing, without all the problemsassociated with regression to the mean. Rather than excludingdata, analytic techniques can be employed that retain all data andadopt different logic to estimate unconscious processing.
An example is the development by Greenwald et al. (1995)of a regressionmethod that tests for the value of theX interceptwhen Y = 0. If this intercept is positive, then it seems reason-able to infer that performance must be driven at least in part byunconscious information. Greenwald and colleagues foundevidence of subliminal perception by this method in a largestudy including 1,431 participants. Unfortunately even thistechnique is not immune to problems of measurement errorand regression to the mean. Miller (2000; see also Dosher,1998; Sand & Nilsson, 2016) conducted a series of simula-tions and concluded that measurement error systematicallybiases the estimation of the intercept upward, such that it ap-pears positive when it should truly be zero. The present criticalappraisal of the post hoc method parallels Miller’s (2000)equivalent appraisal of the regression method.
Alternatively, instead of focusing solely on examining therelationship between manifest variables assumed to accurately
measure different forms (conscious and unconscious) of men-tal processing, a much more powerful approach is to measurethe relationships between the latent variables assumed to un-derlie these manifest variables, using well-established tech-niques such as structural equation modeling or confirmatoryfactor analysis. Some examples of this approach show that ithas considerable promise (Kaufman et al., 2010; Rünger,Nagy, & Frensch, 2009; Salthouse, McGuthry, & Hambrick,1999; Woltz & Shute, 1993).
Acknowledgments Programs for running all the simulations reportedin this article are available in both Excel and MATLAB versions(https://osf.io/6h2qj/). All statistical analyses were computed in JASP(Love et al., 2015). I am indebted to Ran Hassin for kindly providingthe data from Experiments 6 and 7 in Sklar et al. (2012), and to BenNewell, Chris Berry, Zoltan Dienes, Peter Lovibond, SamSchwarzkopf, Maarten Speekenbrink, Miguel Vadillo, and Andy Willsfor helpful advice and comments.
Compliance with ethical standards
Conflict of interest The author declares no conflict of interest.
Open Access This article is distributed under the terms of the CreativeCommons At t r ibut ion 4 .0 In te rna t ional License (h t tp : / /creativecommons.org/licenses/by/4.0/), which permits unrestricted use,distribution, and reproduction in any medium, provided you give appro-priate credit to the original author(s) and the source, provide a link to theCreative Commons license, and indicate if changes were made.
References
Batterink, L. J., Reber, P. J., Neville, H. J., & Paller, K. A. (2015). Implicitand explicit contributions to statistical learning. Journal of Memoryand Language, 83, 62–78. doi:10.1016/j.jml.2015.04.004
Berry, C. J., Shanks, D. R., Li, S., Rains, L. S., & Henson, R. N. A. (2010).Can “pure” implicit memory be isolated? A test of a single-systemmodel of recognition and repetition priming. Canadian Journal ofExperimental Psychology, 64, 241–255. doi:10.1037/a0021525
Berry, C. J., Shanks, D. R., Speekenbrink, M., & Henson, R. N. A.(2012). Models of recognition, repetition priming, and fluency:Exploring a new framework. Psychological Review, 119, 40–79.doi:10.1037/a0025464
Brewer, W. F. (1974). There is no convincing evidence for operant orclassical conditioning in adult humans. In W. B. Weimer & D. S.Palermo (Eds.), Cognition and the symbolic processes (pp. 1–42).Hillsdale, NJ: Erlbaum.
Buchner, A., & Wippich, W. (2000). On the reliability of implicit andexplicit memory measures. Cognitive Psychology, 40, 227–259.doi:10.1006/cogp.1999.0731
Butler, B. C., &Klein, R. (2009). Inattentional blindness for ignored words:Comparison of explicit and implicit memory tasks. Consciousnessand Cognition, 18, 811–819. doi:10.1016/j.concog.2009.02.009
Campbell, D. T., &Kenny, D. A. (1999). A primer on regression artifacts.New York, NY: Guilford Press.
Charles, L., King, J.-R., &Dehaene, S. (2014). Decoding the dynamics ofaction, intention, and error detection for conscious and subliminalstimuli. Journal of Neuroscience, 34, 1158–1170. doi:10.1523/jneurosci.2465-13.2014
Psychon Bull Rev
Chun, M. M., & Jiang, Y. (1998). Contextual cueing: Implicit learningand memory of visual context guides spatial attention. CognitivePsychology, 36, 28–71. doi:10.1006/cogp.1998.0681
Chun, M. M., & Jiang, Y. (2003). Implicit, long-term spatial contextualmemory. Journal of Experimental Psychology: Learning, Memory,and Cognition, 29, 224–234. doi:10.1037/0278-7393.29.2.224
Clark, R. E., & Squire, L. R. (1998). Classical conditioning and brainsystems: The role of awareness. Science, 280, 77–81. doi:10.1126/science.280.5360.77
Cohen, J., Cohen, P., West, S. G., & Aiken, L. S. (2003). Applied multipleregression/correlation analysis for the behavioral sciences (3rd ed.).Mahwah, NJ: Erlbaum.
Conci, M., & von Mühlenen, A. (2011). Limitations of perceptual seg-mentation on contextual cueing in visual search. Visual Cognition,19, 203–233. doi:10.1080/13506285.2010.518574
Daselaar, S. M., Fleck, M. S., Prince, S. E., & Cabeza, R. (2006). Themedial temporal lobe distinguishes old from new independently ofconsciousness. Journal of Neuroscience, 26, 5835–5839.doi:10.1523/JNEUROSCI.0258-06.2006
Dienes, Z. (2015). How Bayesian statistics are needed to determinewhether mental states are unconscious. In M. Overgaard (Ed.),Behavioural methods in consciousness research (pp. 199–220).Oxford, UK: Oxford University Press.
Dixon, N. F. (1971). Subliminal perception: The nature of a controversy.London, UK: McGraw-Hill.
Dosher, B. A. (1998). The response-window regression method—Someproblematic assumptions: Comment on Draine and Greenwald(1998). Journal of Experimental Psychology: General, 127, 311–317. doi:10.1037/0096-3445.127.3.311
Duke, D., Fiacconi, C. M., & Köhler, S. (2014). Parallel effects of pro-cessing fluency and positive affect on familiarity-based recognitiondecisions for faces. Frontiers in Psychology, 5. doi:10.3389/fpsyg.2014.00328
Dulany, D. E. (1961). Hypotheses and habits in verbal “operant condi-tioning”. Journal of Abnormal and Social Psychology, 63, 251–263.doi:10.1037/h0047703
Fiedler, K., & Unkelbach, C. (2014). Regressive judgment: Implications of auniversal property of the empirical world. Current Directions inPsychological Science, 23, 361–367. doi:10.1177/0963721414546330
Geyer, T., Shi, Z. H., & Müller, H. J. (2010). Contextual cueing inmulticonjunction visual search is dependent on color- andconfiguration-based intertrial contingencies. Journal ofExperimental Psychology: Human Perception and Performance,36, 515–532. doi:10.1037/a0017448
Greenspoon, J. (1955). The reinforcing effect of two spoken sounds onthe frequency of two responses. American Journal of Psychology,68, 409–416. doi:10.2307/1418524
Greenwald, A. G., Klinger, M. R., & Schuh, E. S. (1995). Activation bymarginally perceptible (“subliminal”) stimuli: Dissociations of un-conscious from conscious cognition. Journal of ExperimentalPsychology: General, 124, 22–42. doi:10.1037/0096-3445.124.1.22
Greenwald, A. G., McGhee, D. E., & Schwartz, J. L. K. (1998).Measuring individual differences in implicit cognition: The implicitassociation test. Journal of Personality and Social Psychology, 74,1464–1480. doi:10.1037/0022-3514.74.6.1464
Hannula, D. E., & Ranganath, C. (2009). The eyes have it: Hippocampalactivity predicts expression of memory in eye movements. Neuron,63, 592–599. doi:10.1016/j.neuron.2009.08.025
Harris, J. J., Schwarzkopf, D. S., Song, C., Bahrami, B., & Rees, G.(2011). Contextual illusions reveal the limit of unconscious visualprocessing. Psychological Science, 22, 399–405. doi:10.1177/0956797611399293
Heerey, E. A., &Velani, H. (2010). Implicit learning of social predictions.Journal of Experimental Social Psychology, 46, 577–581.doi:10.1016/j.jesp.2010.01.003
Holender, D. (1986). Semantic activationwithout conscious identificationin dichotic listening, parafoveal vision, and visual masking: A sur-vey and appraisal. Behavioral and Brain Sciences, 9, 1–66.doi:10.1017/S0140525X00021269
Hsu, L. M. (1995). Regression toward the mean associated with measure-ment error and the identification of improvement and deteriorationin psychotherapy. Journal of Consulting and Clinical Psychology,63, 141–144. doi:10.1037/0022-006X.63.1.141
Jensen, K., Kirsch, I., Odmalm, S., Kaptchuk, T. J., & Ingvar, M. (2015).Classical conditioning of analgesic and hyperalgesic pain responseswithout conscious awareness. Proceedings of the National Academyof Sciences, 112, 7863–7867. doi:10.1073/pnas.1504567112
Jones, C. R., Fazio, R. H., &Olson,M. A. (2009). Implicit misattribution as amechanism underlying evaluative conditioning. Journal of Personalityand Social Psychology, 96, 933–948. doi:10.1037/a0014747
Kaufman, S. B., DeYoung, C. G., Gray, J. R., Jiménez, L., Brown, J., &Mackintosh, N. (2010). Implicit learning as an ability. Cognition,116, 321–340. doi:10.1016/j.cognition.2010.05.011
Kenny, D. A. (2005). Regression artifacts. In B. S. Everitt &D. C. Howell(Eds.), Encyclopedia of statistics in behavioral science (pp. 1723–1725). Chichester, UK: Wiley.
Koivisto, M., Mäntylä, T., & Silvanto, J. (2010). The role of early visualcortex (V1/V2) in conscious and unconscious visual perception.NeuroImage, 51, 828–834. doi:10.1016/j.neuroimage.2010.02.042
Krause, M. S. (2009). Reversion toward the mean independently of re-gression toward the mean. Methodology: European Journal ofResearch Methods for the Behavioral and Social Sciences, 5, 3–6.doi:10.1027/1614-2241.5.1.3
Lazarus, R. S., & McCleary, R. A. (1951). Autonomic discriminationwithout awareness: A study of subception. Psychological Review,58, 113–122. doi:10.1037/h0054104
LeBel, E. P., & Paunonen, S. V. (2011). Sexy but often unreliable: Theimpact of unreliability on the replicability of experimental findingswith implicit measures. Personality and Social Psychology Bulletin,37, 570–583. doi:10.1177/0146167211400619
León, O. G., & Suero, M. (2000). Regression toward the mean associatedwith extreme groups and the evaluation of improvement.Psicothema, 12, 145–149.
Love, J., Selker, R., Marsman, M., Jamil, T., Verhagen, A. J., Ly, A., …Wagenmakers, E.-J. (2015). JASP (Version 0.6.5) [Computer soft-ware]. Available at https://jasp-stats.org/
Lovibond, P. F., & Shanks, D. R. (2002). The role of awareness inPavlovian conditioning: Empirical evidence and theoretical implica-tions. Journal of Experimental Psychology: Animal BehaviorProcesses, 28, 3–26. doi:10.1037//0097-7403.28.1.3
Merikle, P. M., & Reingold, E. M. (1991). Comparing direct (explicit)and indirect (implicit) measures to study unconscious memory.Journal of Experimental Psychology: Learning, Memory, andCognition, 17, 224–233. doi:10.1037/0278-7393.17.2.224
Miller, J. (2000). Measurement error in subliminal perception experi-ments: Simulation analyses of two regression methods. Journal ofExperimental Psychology: Human Perception and Performance,26, 1461–1477. doi:10.1037/0096-1523.26.4.1461
Mogg, K., Bradley, B. P., &Williams, R. (1995). Attentional bias in anxietyand depression: The role of awareness. British Journal of ClinicalPsychology, 34, 17–36. doi:10.1111/j.2044-8260.1995.tb01434.x
Muscarella, C., Brintazzoli, G., Gordts, S., Soetens, E., & Van denBussche, E. (2013). Short- and long-term effects of conscious, min-imally conscious and unconscious brand logos. PLoS ONE, 8,e57738. doi:10.1371/journal.pone.0057738
Newell, B. R., & Shanks, D. R. (2014). Unconscious influences on deci-sion making: A critical review. Behavioral and Brain Sciences, 37,1–19. doi:10.1017/S0140525X12003214
Paciorek, A., & Williams, J. N. (2015). Semantic generalization in implicitlanguage learning. Journal of Experimental Psychology: Learning,Memory, and Cognition, 41, 989–1002. doi:10.1037/xlm0000100
Psychon Bull Rev
Peirce, C. S., & Jastrow, J. (1884). On small differences of sensation.Memoirs of the National Academy of Sciences, 3, 75–83.
Pessiglione, M., Schmidt, L., Draganski, B., Kalisch, R., Lau, H., Dolan,R. J., & Frith, C. D. (2007). How the brain translates money intoforce: A neuroimaging study of subliminal motivation. Science, 316,904–906. doi:10.1126/science.1140459
Poldrack, R. A. (1996). On testing for stochastic dissociations. PsychonomicBulletin & Review, 3, 434–448. doi:10.3758/BF03214547
Pratte, M. S., & Rouder, J. N. (2009). A task-difficulty artifact in sublim-inal priming. Attention, Perception, & Psychophysics, 71, 1276–1283. doi:10.3758/APP.71.6.1276
Preacher, K. J., Rucker, D. D., MacCallum, R. C., & Nicewander, W. A.(2005). Use of the extreme groups approach: A critical reexamina-tion and new recommendations. Psychological Methods, 10, 178–192. doi:10.1037/1082-989X.10.2.178
Reingold, E. M., & Merikle, P. M. (1988). Using direct and indirectmeasures to study perception without awareness. Perception &Psychophysics, 44, 563–575. doi:10.3758/BF03207490
Rugg, M. D., Mark, R. E., Walla, P., Schloerscheidt, A. M., Birch, C. S.,& Allan, K. (1998). Dissociation of the neural correlates of implicitand explicit memory. Nature, 392, 595–598. doi:10.1038/33396
Rünger, D., Nagy, G., & Frensch, P. A. (2009). Do recognition and prim-ing index a unitary knowledge base? Comment on Shanks et al.(2003). Journal of Experimental Psychology: Learning, Memory,and Cognition, 35, 572–585. doi:10.1037/a0014543
Ryan, J. D., Althoff, R. R., Whitlow, S., & Cohen, N. J. (2000). Amnesiais a deficit in relational memory. Psychological Science, 11, 454–461. doi:10.1111/1467-9280.00288
Salthouse, T. A., McGuthry, K. E., & Hambrick, D. Z. (1999). A frameworkfor analyzing and interpreting differential aging patterns: Application tothree measures of implicit learning. Aging, Neuropsychology, andCognition, 6, 1–18. doi:10.1076/anec.6.1.1.789
Samuels, M. L. (1991). Statistical reversion toward the mean: More uni-versal than regression toward the mean. American Statistician, 45,344–346. doi:10.2307/2684474
Sanchez, D. J., Gobel, E. W., & Reber, P. J. (2010). Performing theunexplainable: Implicit task performance reveals individually reli-able sequence learning without explicit knowledge. PsychonomicBulletin & Review, 17, 790–796. doi:10.3758/pbr.17.6.790
Sand, A., & Nilsson, M. E. (2016). Subliminal or not? Comparing null-hypothesis and Bayesian methods for testing subliminal priming.Consciousness and Cognition, 44, 29–40. doi:10.1016/j.concog.2016.06.012
Schmidt, T. (2015). Invisible stimuli, implicit thresholds: Why invisibilityjudgments cannot be interpreted in isolation. Advances in CognitivePsychology, 11, 31–41. doi:10.5709/acp-0169-3
Schmidt, T., & Vorberg, D. (2006). Criteria for unconscious cognition:Three types of dissociation. Perception & Psychophysics, 68, 489–504. doi:10.3758/bf03193692
Schultz, D. H., & Helmstetter, F. J. (2010). Classical conditioning ofautonomic fear responses is independent of contingency awareness.Journal of Experimental Psychology: Animal Behavior Processes,36, 495–500. doi:10.1037/a0020263
Shanks, D. R. (2005). Implicit learning. In K. Lamberts & R. L. Goldstone(Eds.), Handbook of cognition (pp. 202–220). London, UK: Sage.
Shanks, D. R., &Berry, C. J. (2012). Are theremultiplememory systems?Tests of models of implicit and explicit memory. Quarterly Journalof Experimental Psychology, 65, 1449–1474. doi:10.1080/17470218.2012.691887
Shanks, D. R., & Perruchet, P. (2002). Dissociation between priming andrecognition in the expression of sequential knowledge.Psychonomic Bulletin & Review, 9, 362–367. doi:10.3758/bf03196294
Shanks, D. R., & St. John, M. F. (1994). Characteristics of dissociablehuman learning systems. Behavioral and Brain Sciences, 17, 367–395. doi:10.1017/S0140525X00035032
Shanks, D. R., Wilkinson, L., & Channon, S. (2003). Relationship be-tween priming and recognition in deterministic and probabilisticsequence learning. Journal of Experimental Psychology: Learning,Memory, and Cognition, 29, 248–261. doi:10.1037/0278-7393.29.2.248
Sidis, B. (1898). The psychology of suggestion: A research into the sub-conscious nature of man and society. New York, NY: Appleton.
Sklar, A. Y., Levy, N., Goldstein, A., Mandel, R., Maril, A., & Hassin, R.R. (2012). Reading and doing arithmetic nonconsciously.Proceedings of the National Academy of Sciences, 109, 19614–19619. doi:10.1073/pnas.1211645109
Slotnick, S. D., & Schacter, D. L. (2004). A sensory signature that dis-tinguishes true from false memories. Nature Neuroscience, 7, 664–672. doi:10.1038/nn1252
Smyth, A. C., & Shanks, D. R. (2008). Awareness in contextual cuingwith extended and concurrent explicit tests. Memory & Cognition,36, 403–415. doi:10.3758/mc.36.2.403
Stark, C. E. L., & McClelland, J. L. (2000). Repetition priming of words,pseudowords, and nonwords. Journal of Experimental Psychology:Learning, Memory, and Cognition, 26, 945–972. doi:10.1037/0278-7393.26.4.945
Supèr, H., Spekreijse, H., & Lamme, V. A. F. (2001). Two distinct modesof sensory processing observed in monkey primary visual cortex(V1). Nature Neuroscience, 4, 304–310. doi:10.1038/85170
Sweeny, T. D., Grabowecky, M., Suzuki, S., & Paller, K. A. (2009).Long-lasting effects of subliminal affective priming from facial ex-pressions.Consciousness and Cognition, 18, 929–938. doi:10.1016/j.concog.2009.07.011
ten Brinke, L., Stimson, D., & Carney, D. R. (2014). Some evidence forunconscious lie detection. Psychological Science, 25, 1098–1105.doi:10.1177/0956797614524421
Vadillo, M. A., Konstantinidis, E., & Shanks, D. R. (2016).Underpowered samples, false negatives, and unconscious learning.Psychonomic Bulletin & Review, 23(1), 87–102. doi:10.3758/s13423-015-0892-6
Vuilleumier, P., Schwartz, S., Duhoux, S., Dolan, R. J., & Driver, J.(2005). Selective attention modulates neural substrates of repetitionprinting and “implicit” visual memory: Suppressions and enhance-ments revealed by fMRI. Journal of Cognitive Neuroscience, 17,1245–1260. doi:10.1162/0898929055002409
Ward, E. V., Berry, C. J., & Shanks, D. R. (2013). An effect of age onimplicit memory that is not due to explicit contamination:Implications for single and multiple-systems theories. Psychologyand Aging, 28(2), 429–442. doi:10.1037/a0031888
Weiermann, B., & Meier, B. (2012). Incidental sequence learning acrossthe lifespan. Cognition, 123, 380–391. doi:10.1016/j.cognition.2012.02.010
Weiskrantz, L. (1986). Blindsight: A case study and implications. Oxford,UK: Oxford University Press.
Williams, A. C. (1938). Perception of subliminal visual stimuli. Journalof Psychology, 6, 187–199. doi:10.1080/00223980.1938.9917596
Willingham, D. B., Nissen, M. J., & Bullemer, P. (1989). On the devel-opment of procedural knowledge. Journal of ExperimentalPsychology: Learning, Memory, and Cognition, 15, 1047–1060.doi:10.1037/0278-7393.15.6.1047
Woltz, D. J., & Shute, V. J. (1993). Individual difference in repetitionpriming and its relationship to declarative knowledge acquisition.Intelligence, 17, 333–359. doi:10.1016/0160-2896(93)90004-O
Zeelenberg, R., Plomp, G., & Raaijmakers, J. G.W. (2003). Can false mem-ories be created through nonconscious processes? Consciousness andCognition, 12, 403–412. doi:10.1016/s1053-8100(03)00021-7
Psychon Bull Rev