Embed Size (px)
Citation preview

Regression, Correlation

Research
• Theoretical
• empirical
• Usually combination of the two

Proportionality Constant (who cares?)
• Evaporation is a function of temperature.
• Evaporation is proportional to temperature (as temperature goes up so does evaporation)
• E T
• But this just tell us they are related to one another qualitatively
• How can they be quantified?

Regression Equations
• Foundation of empirical equations
• Most hydrology is to chaotic to model based on physics alone
• Therefore most hydrologic equations are empirical (and therefore regression equations)

Regression
• Calculation of the regression line is straightforward. The best-fit line has the form y = bx + a, where b is the slope of the line and a is the y-intercept.

“Best Fit”
• Method of Least Squares– The best curve minimizes the sum of the
squares of the vertical distance from a point to the curve. The vertical distances are usually called "error" (because the curve differs from the data by that amount) and so this method minimizes the "squared error."

Problem 1: Outliers and Extremes
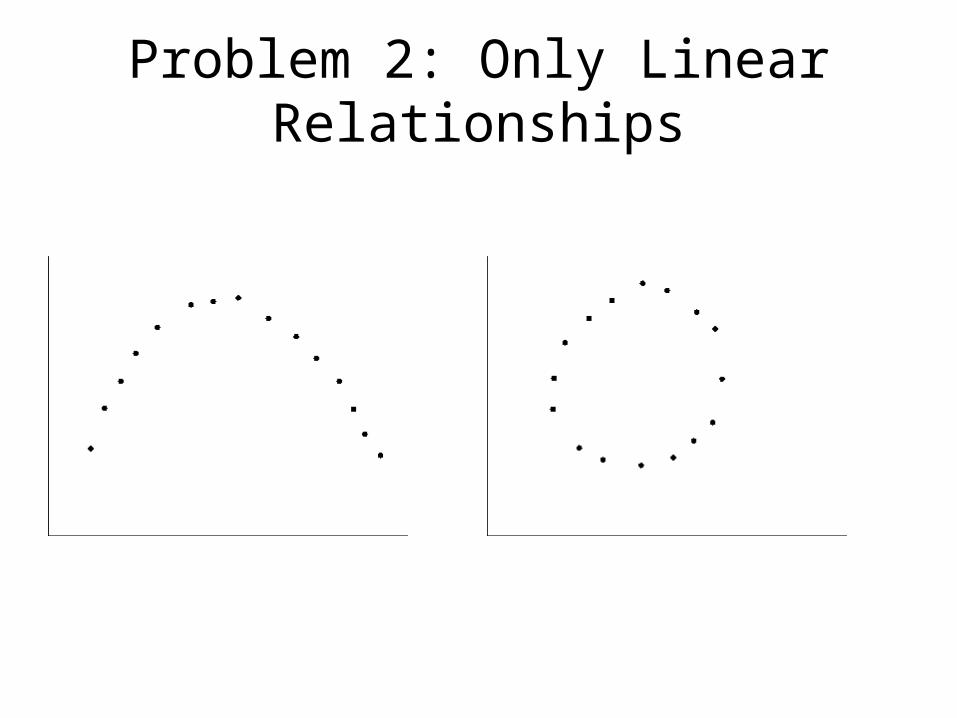
Problem 2: Only Linear Relationships

How do we establish if we are successful
• Questions:– Is the model useful?– When is it better to use the average vs. a
model?

Correlation Coefficient
• r is always between -1 and 1
• r = 0 means no correlation
• r = 1 is perfect positive correlation
• r = -1 is perfect negative positive correlation
• r2 is the percent variation explained by the linear correlation
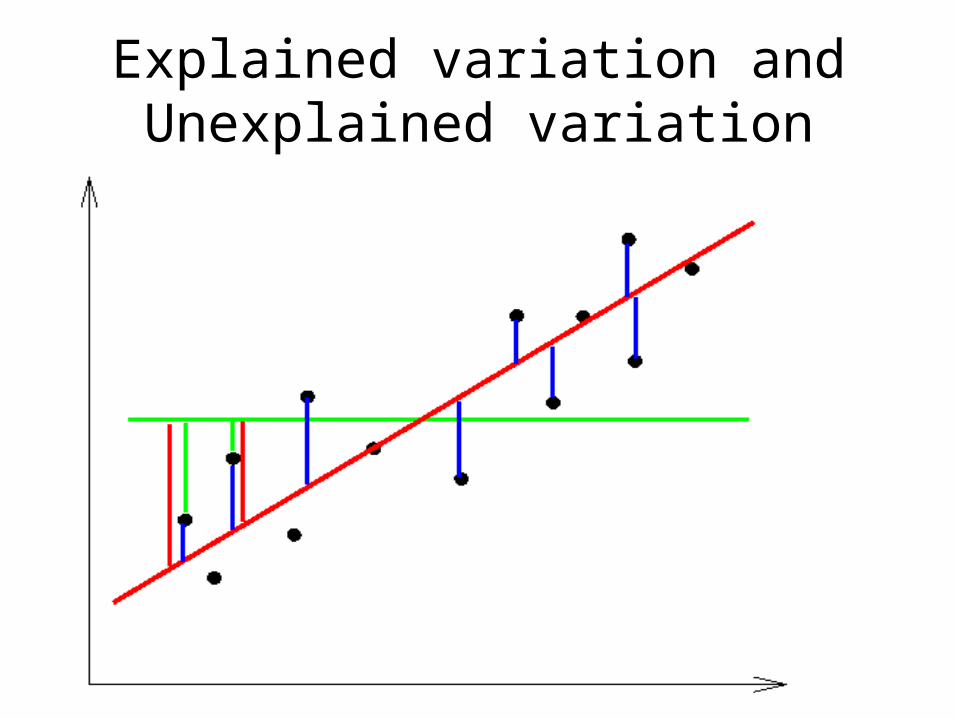
Explained variation and Unexplained variation

• Red line represents predicted values
• Green line is the average
• Black dots are observed values
• Green lines represent predicted-average
• Blue lines represent observed minus the predicted

Total Varation
• Total variation is given by the following equation:
average
predicted
21
ii
n
i
yyTV Total
variation is related to the data’s spread.

Explained variation
• Explained variation is the
average
predicted
21
ˆ ii
n
i
yyEV Explained
variation is fundamental to the spread of the data and is therefore “explained.” If your data have a high standard deviation, then you will expect your model reflect this as well.

Unexplained Variation• Unexplained variation in the model is
given by equation:
average
predicted
21
ˆii
n
i
yyUV You want
unexplained variation to be low. In other words, your predicted valuesshould be close to your observed values. Otherwise why are you botheringpeople with your model?

Summary of Variation
• High Total variation does not reflect poorly on your model
• High explained variation does not reflect poorly on your model
• High unexplained variation means your observed and predicted do not match…which makes us wonder why you have a model at all

Regression Coefficeint
• Pearson divided up variation as follows:
TV
UV
TV
EV1
UVEVTV

Pearson Correlation Coefficient
• If observed and predicted have same spread about the mean (or difference from the mean) the correlation coefficient will be close to one using the following formula:
TV
EVR 2

R2 values
• The average of your data is approximately 0.5 so your model needs to be higher than this
• 0.7 is acceptable in most empirical models and suggests the model is better than using the average
• 0.9 and greater is ideal

Standard Error of Estimate (Se)
• V = n-p-1 where n is the number of data points, p is the number of unknowns (number of x’s…usually one)
• V = n-2 for bivariate models (p=1, one x)
5.0
2
1
ˆ1
ii
n
ie yyS

Standard Error of Estimate (Se)
• The standard error of the estimate is a measure of the accuracy of predictions made with a regression line
• More sensitive to sample size, generally as sample size increases, standard error decreases
• Physical indicator or error and has same units as criterion variable (aka y)