Embed Size (px)
Citation preview

Registered nurses in the adult social care sector Analysis from the National Minimum Data Set for Social Care (NMDS-SC)
March 2016
Produced by Skills for Care

Registered nurses in the adult social care sector, 2016
Published by Skills for Care, West Gate, 6 Grace Street, Leeds, LS1 2RP
www.skillsforcare.org.uk
© Skills for Care 2016
Copies of this report may be made for non-commercial distribution to aid social care
workforce development. Any other copying requires the permission of Skills for Care. Skills
for Care is the employer-led strategic body for workforce development in social care for
adults in England.
This work was researched and complied by Skills for Care’s data analysis team.
Bibliographic reference for Harvard-style author/date referencing system:
Short: Skills for Care [or SfC] 2016
Long: Skills for Care, Registered nurses in the adult social care sector, (Leeds, 2016).
Available at www.skillsforcare.org.uk

1
Contents
█ 01 Introduction 3
Policy context 4
█ 02 Estimated number of registered nurses and trends 5
Estimated number of registered nurses 5
Trends from 2011 to 2014 7
Forecasts of demand for social care services 8
█ 03 Employment overview 9
Nursing specialisms 9
Employment status 10
Full/part-time status 10
Zero hours contracts 11
█ 04 Recruitment and retention 12
Starters rate and source of recruitment 12
Experience 13
Turnover rate 15
Influencing factors of registered nurse turnover rates 15
Sickness rates 16
Vacancy rates 17
█ 05 Workforce demographics 19
Gender 19
Age 19
Ethnicity 20
Nationality 21
Country of birth 22
█ 06 Pay rates 23
Annual pay 23
Variations of pay rates 23
█ 07 Conclusion 26
█ 08 Uses and users of NMDS-SC data and further resources 27

2
Foreword
This report, based on estimates and analysis from Skill for Care’s National Minimum Data
Set for Social Care (NMDS-SC), focuses on a role that very much highlights the need for
integrated health and social care workforce planning – registered nurses. Modelling of
NMDS-SC data shows there to be an estimated 49,500 registered nurses1 working in adult
social care. While making up only a small part of the overall workforce (circa 1.55m), it is
absolutely vital that the sector can attract and retain these professionals. This paper looks
at some of the characteristics of nurses working in adult social care.
Population and workforce demographics give a strong indication that the current pressure
on recruitment and retention, especially with regard to nursing provision in adult social care,
poses significant challenges in providing professional, clinical and leadership skills. In
presenting the data alongside that of the whole workforce and other regulated
professionals, this report provides information which will help workforce planners and
commissioners of both services and education and training to consider the skill mix needed
to deliver an integrated workforce able to deliver high quality personalised services and
outcomes for people who need care and support, and their careers.
Graham Woodham
Programme Head, Regulated Professional Workforce
Summary of key findings
There were an estimated 49,500 registered nurses working in the adult social care
sector as at 2014.
85% of these nurses were working in care home services with nursing
Nurses were employed almost entirely within the independent sector
The number of registered nurses working in the adult social care sector has been fairly
consistent in the past 4 years, increasing by 1% from 2011 to 2014
54% of nurses were full time, 29% part time and 17% neither of these
Almost a fifth of nurses (18%) were estimated to be working on zero hours contracts,
14% in residential care services and 55% in domiciliary care services
Over a third (36%) of nurses started in their current role within the past 12 months, this
is approximately 17,900 nurses new to their role/ employer
Nurses have on average 13 years of experience working in the adult social care sector
Just over a third of nurses (34%) were estimated to have left their role within the past 12
months, this was approximately 16,800 leavers. Nurses turnover rates increased year
on year from 2013 to 2015
There was an estimated vacancy rate of 9% for nurses; this gives an average of 4,500
vacancies at any one time.
The average age of a registered nurse was 47 years old and almost a third of registered
nurses are aged over 55 so may retire within the next 10 years
61% of nurses had a British nationality and 39% non-British, this varies by region
The mean annual pay rate for registered nurses in 2015 was £24,300
1 For the purpose of this paper, registered nurse refers to all those occupying the role of registered nurse as
specified within the NMDS-SC. Fulfilling this role means the occupants hold a nursing qualification.

01 Introduction 3
This report provides an overview of registered nurses working in the
adult social care sector. The information in this report is
predominantly derived from the National Minimum Data Set for Social
Care (NMDS-SC). Due to the high quality and coverage of adult
social care employers held by the NMDS-SC, the estimates within
this report are the most detailed and reliable available. This report is
aimed at anyone with an interest in registered nurses working in the
adult social care sector.
1. Introduction
1.1. About Skills for Care
Skills for Care is the employer-led workforce development body for adult social care in
England, a growing sector that currently has around 18,000 organisations, 39,500 care
providing locations, and a workforce of around 1.55 million jobs contributing an estimated
£46 billion per annum to the English economy.
Skills for Care works with employers across England to: make sure their people have the
right skills and values to deliver high quality care, share best practice, to understand the
bigger picture, to set the standards for quality care and look ahead. For more information
about Skills for Care please see our website www.skillsforcare.org.uk.
1.2. About the NMDS-SC
The National Minimum Data Set for Social Care (NMDS-SC) is an online workforce data
collection system for the social care sector. It is the leading source of robust workforce
intelligence for adult social care. The NMDS-SC is managed by Skills for Care on behalf of
the Department of Health and has been collecting information about social care providers
and workforce since early 2006.
The NMDS-SC collects information on the size and structure of the whole adult social care
sector including:
Types of care services that are provided
How much care provision there is
A detailed picture of the workforce, including demographics, pay rates and qualifications
Social care employers/providers use the NMDS-SC to help ensure their information better
supports business and workforce planning. They register, maintain and access their
business information through their online account; they can use it to view their workforce
information with personalised reports and dashboards. For more information about the
NMDS-SC please visit www.skillsforcare.org.uk/nmds-sc.

01 4
1.3. About the data
At the start of 2016 (when this report was written) the NMDS-SC had around 23,000
establishments/ care providing locations and 730,000 individual worker records. This
included over 55% of CQC regulated providers and information from all 152 statutory local
authority services.
This report uses data collected by the NMDS-SC to create workforce models that, in turn,
allow for estimates of the whole adult social care workforce to be produced. For a full
methodology of how Skills for Care model NMDS-SC data please see Appendix 1 of the
‘Size and Structure of the Adult Social Care Sector and Workforce in England 2015’ report2.
1.4. Policy context
At the time of writing it is commonly held that there is a significant recruitment and retention
problem facing employers of registered nurses. This has led to the inclusion of nurses on
the Migration Advisory Committee’s shortage occupation list (SOL) pending a review of all
the evidence. The outcome of the review may mean that some specific areas of nursing
may remain on the SOL and others not. The decision that is made regarding nurses in the
adult social care sector will be crucial to future workforce planning and recruitment.
The integration of health and social care services is one of the key political drivers for future
planning and has a direct impact on workforce planning. Consideration will need to be given
to the roles that nurses play in the delivery of integrated adult social care services through
key policy and planning processes, including the current development of Sustainability and
Transformation plans.
As part of addressing the skills needs of the workforce a new ‘nursing associate role’ has
been proposed. The proposal, subject to consultation, is to create a new role within the
wider nursing workforce between health and care assistants and registered nurses,
allowing for a number of clinical skills currently undertaken by nurses to be met through the
new role. An appropriate level of qualification will be set, and it is hoped the role will be part
of the career pathway for aspiring nurses.
Further challenges are likely to be placed on the system by the changes to the funding
arrangements for registered nurse training. It is being proposed that the current bursary
arrangements, which provide free degree level qualifications leading to registration as a
nurse, will be stopped in favour of a system of loans similar to that already in place for all
other graduate programmes. The impact of these proposed changes on the numbers of
nurses being trained will need to be monitored closely to determine the impact on future
workforce supply.
2 www.skillsforcare.org.uk/sizeandstructure

02 Estimated number of registered 5 nurses and trends
Overview
There were an estimated 49,500 registered nurses working in the adult social care
sector as at 2014
Over three quarters of these nurses (85%) were working in care home services with
nursing
Nurses were employed almost entirely within the independent sector
The number of registered nurses working in the adult social care sector has been fairly
consistent in the past 4 years, increasing by 1% from 2011 to 2014
2. Estimated number of registered nurses and trends
This section provides an overview of the estimated number of registered nurses working in
the adult social care, trends of nurse numbers from 2011 to 2014 and future forecasts of
nursing demand.
Skills for Care estimates that the number of adult social care jobs in England as at 2014
was 1.55 million, and that there were 1.48 million people doing these jobs. This paper is
based on the estimated 1.3 million jobs, and 49,500 nurses, working within the private,
voluntary and statutory sectors in adult social care.
2.1. Estimated number of registered nurses
In 2014 there were an estimated 49,500 registered nurses working in the adult social care
sector. Chart 1 and Table 1 shows where nurses were employed by service group, care
home services with and without nursing make up the bulk of adult residential services and
can also be seen in chart 1.
Three quarters of these nurses (85%) were working in care home services with nursing,
which are regulated by the Care Quality Commission (CQC).
Chart 1: Estimated number of registered nurses by service type
88%
<1%
11%
2%
85%
1%
0% 20% 40% 60% 80% 100%
Adult residential
Adult day
Adult domiciliary
Adult community care
Care home services with nursing
Care home services without nursing

02 6
Table 1: Estimated number of regulated professionals by service type
All services
Adult residential
Adult day Adult
domiciliary
Adult community
care
All job roles 1,550,000 655,500 35,500 651,000 206,500
Regulated profession 90,000 45,500 500 6,500 37,500
Registered nurse 49,500 43,750 <250 5,250 750
Occupational therapist* 21,500 1,000 <250 250 20,500
Social worker 16,500 250 250 500 15,500
*Includes Occupational therapists employed by the NHS
Table 1 shows that registered nurses made up over half (55%) of all regulated
professionals working in the adult social care sector. Occupational therapists made up
almost a quarter (24%) and social workers almost a fifth (18%). The remainder of regulated
professional roles are made up of allied health professionals and safeguarding and
reviewing officers.
Chart 2 shows that nurses were employed almost entirely within the independent sector,
with three quarters of registered nurse (85%) in the private sector and 15% in voluntary
sector. Less than 1% were employed within statutory local authorities.
Chart 2: Estimated number of registered nurses by sector of employment
The chart below shows the estimated number of registered nurses by region. The
proportion of nurses working in each region is very similar to the proportion of the
population of England, i.e. the South East region has the largest population and the North
East has the smallest.
Chart 3: Estimated number of registered nurses by region of employment
0.5%
85.4%
14.6%
0% 20% 40% 60% 80% 100%
Statutory local authority
Private
Voluntary
4,750
4,000
5,750
2,750
7,250
9,250
6,000
5,250
4,750
0 2,000 4,000 6,000 8,000 10,000
Eastern
East Midlands
London
North East
North West
South East
South West
West Midlands
Yorkshire & Humber

02 7
2.2. 2011 to 2014 registered nurse trends
The number of registered nurses working in the adult social care sector has been fairly
consistent in the past 4 years. Increasing by 1% from 2011 (49,000) to 2014 (49,500).
Chart 4: Estimated number of registered nurses from 2011 to 2014
The adult social care workforce as a whole has been estimated to have grown by 2.6%
between 2013 and 2014 (from 1.51 to 1.55 million). Chart 5 shows the estimated number of
staff (all staff, not just registered nurses) working in care homes with nursing services
between 2011 and 2014, this number has increased by 7% over this period. Therefore the
number of roles within care homes with nursing services has increased at a higher rate than
the number of nursing roles in the sector. In addition to this, there have been consistently
high turnover and vacancy rates of nurses over the same period. These numbers support
the notion that recruitment and retention of nurses in the health and social care system is
under significant pressure. Please see section 4 for more information about recruitment and
retention.
Chart 5: Estimated number of staff working in care homes with nursing services from
2011 to 2014
49,000 50,500 50,500 49,500
0
10,000
20,000
30,000
40,000
50,000
60,000
2011 2012 2013 2014
263,500 276,000 270,000 280,500
0
50,000
100,000
150,000
200,000
250,000
300,000
2011 2012 2013 2014

02 8
2.3. Forecasts of demand for social care services
The Centre for Workforce Intelligence published a report in October 2015 called
‘Forecasting the adult social care workforce’3. This report forecasts that the demand for
social care services, due to population growth and demographic change alone, is forecast
to increase by a third (33%) by 2030.
Table 2: Population driven change in demand over three, five, 10 and 15 year timescales Source: Forecasting the adult social care workforce 2015 report, CfWI analysis of ONS
(2012) and Emerson et al. (2012) data
2018 2020 2025 2030
Population driven demand change across all service users
9% 12% 21% 33%
The report says that “population increases will change the relative demand for different
types of social care services, with demand for domiciliary care and residential care (with or
without nursing) more closely mirroring the overall population increase amongst the over
65-year-olds than other service types.” p30 and goes on to say that “the ONS 2012
population projections suggests that by 2030 there will be 45% more people over the age of
65 than there were in 2012” p31.
Although registered nurses are not mentioned specifically in the demand model used in this
report, it does show that demand is forecast to increase by 33% across all service users
and 45% in people ages 65 and over, and that residential care services are likely to mirror
this growth. We know that the majority of registered nurses work within residential services.
The reported increase will not necessarily translate into an increase in the adult social care
workforce and nurses by the same amount, as there are many other factors involved. It
does, however, at least indicate a potentially large increase in demand for care services
and therefore on the number of nurses required in the future.
3 http://www.cfwi.org.uk/publications/forecasting-the-adult-social-care-workforce-workforce-intelligence-report

03 Employment overview 9
Overview
The majority of the nurses (85%) recorded in the NMDS-SC were registered with the
Nursing and Midwifery council as an ‘adult nurse’
‘Older people’ was the most frequently selected nursing specialism (78%)
4 out of 5 nurses (80%) were directly employed on a permanent or temporary basis
54% were working full time hours, with 29% classed as part time
Almost a fifth of nurses (18%) were estimated to be working on zero hours contracts,
14% in residential care services and 55% in domiciliary care services
3. Employment overview
Section 3 of this report looks at the registered nurses employment information, including, for
the first time, registrations and specialisms, employment status, full/ part-time status and
zero hours contracts.
3.1. Nursing registrations and specialisms
In July 2015 two new questions were added to the NMDS-SC to collect information about
which category nurses were registered with the Nursing and Midwifery Council and which
specialisms nurses most used in their current roles.
Of the 23,500 registered nurses recorded in the NMDS-SC at the end of January 2016,
8,500 (36%) had recorded a category of registration and 8,000 (34%) had recorded
specialisms. There was not enough information in the NMDS-SC at the time of writing this
report to make estimates about the whole nursing workforce; therefore the information
below is based on the raw data that was held in the NMDS-SC.
The majority of the nurses (85%) recorded in the NMDS-SC were registered with the
Nursing and Midwifery council as an ‘adult nurse’, the remainder of nurses were registered
as mental health nurse (8%), learning disability nurses (3%) and enrolled nurses (3%).
Chart 6: Category of registration with the Nursing and Midwifery Council
Source: NMDS-SC raw data, January 2016
Employers completing the NMDS-SC were asked to select which specialisms nurses most
used in their current roles, ‘Older people, including dementia, elderly care and end of life
85%
8%
3%
3%
<1%
0% 10% 20% 30% 40% 50% 60% 70% 80% 90%
Adult Nurse
Mental Health Nurse
Learning Disabilities Nurse
Enrolled Nurse
Childrens Nurse

03 10
care’ was the most frequently selected (78%), followed by ‘adults’ with 28%, ‘mental health’
with (10%) and ‘learning disabilities’ with 6%. Employers can select more than one nursing
specialism so numbers in chart 7 sum to more than 100%.
Chart 7: Which specialisms nurses most use in their current roles
Source: NMDS-SC raw data, January 2016
* (including dementia, elderly care and end of life care)
3.2. Employment status
In terms of employment status, 4 out of 5 nurses (80%) were directly employed on a
permanent or temporary basis, while around 16% were part of a bank or pool of nursing
staff. Bank and pool nurses were replied upon much more than other regulated professional
roles, social workers at 2% and occupational therapists at 1%.
Chart 8: Estimated employment status
3.3. Full/part-time status
Also of interest is that only 54% are working full time hours, with 29% classed as part time
and 17% as ‘neither of these’. Many of those selecting ‘neither of these’ were on zero hours
contracts, please see section 3.4 below.
78%
28%
10%
6%
2%
1%
0% 10% 20% 30% 40% 50% 60% 70% 80% 90%
Older people*
Adults
Mental Health
Learning Disability
Community Care
Other
85%
4% 7% 2% 2%
81%
3% 12%
3% 1%
78%
3%
16%
3% 0% 0%
20%
40%
60%
80%
100%
Permanent Temporary Bank or pool Agency Other
All job roles Regulated profession Registered nurse

03 11
Chart 9: Estimated full/ part-time status
3.4. Zero hour contract
Almost a fifth of nurses (18%) were estimated to be working on zero hours contracts, this
was much higher than social workers and occupational therapists.
Chart 10: Estimated proportion of workers on zero hours contracts
Chart 11 shows the proportion of nurses on zero hours contracts by employment type. As
seen in Chart 1, the majority of nurses work in residential services (88%), however 11%, an
estimated 5,250, nurses work in domiciliary care service. And just over half of these nurses
working in domiciliary care services (55%) were estimated to be working on zero hours
contracts.
Chart 11: Estimated proportion of nurses on zero hours contracts by service type
53%
58%
54%
71%
57%
36%
29%
29%
26%
41%
11%
13%
17%
3%
2%
0% 20% 40% 60% 80% 100%
All job roles
Regulated profession
Registered nurse
Social worker
Occupational therapist
Full-time Part-time Neither of these
25%
14%
18%
3%
2%
0% 5% 10% 15% 20% 25% 30%
All job roles
Regulated profession
Registered nurse
Social worker
Occupational therapist
14%
17%
55%
15%
0% 10% 20% 30% 40% 50% 60%
Adult residential
Adult day
Adult domiciliary
Adult community care

04 Recruitment and retention 12
Re
cru
itm
en
t an
d
rete
ntion
Overview
Over a third (36.1%) of nurses started in their current role within the past 12 months,
this was approximately 17,900 nurses new to their role/ employer
The average age of a nurse joining the sector was 34 years old
Two fifths (41%) of nurses were recruited from within the adult social care independent
sector and a further fifth from the health sector
Nurses had, on average, 13 years of experience in the sector and four years of
experience in their current role
Just over a third of nurses (33.9%) were estimated to have left their role within the past
12 months, this was approximately 16,800 leavers
There was an estimated vacancy rate of 9.0% for nurses; this gives an average of
4,500 vacancies at any one time
The average number of sickness days taken by nurses in the past 12 months was 2.5.
This was at least 124,000 days lost to sickness in the past year
4. Recruitment and retention
Section 4 of this report looks at recruitment and retention issues for registered nurses in
the adult social care sector, including information about new starters, experience, leavers,
vacancies and sickness rates. This section also looks at some influencing factors of
turnover rates.
4.1. Starters rate and source of recruitment
Skills for Care estimated that approximately 36% of nurses started in their current role
within the past 12 months. This was approximately 17,900 nurses new to their role/
employer each year.
Chart 12: Estimated proportion of directly employed staff who had started their role
in the past 12 months
4.1.1. Start age
The average age of a registered nurse joining the adult social care sector was 34 years
old. Almost a third of nurses (30%) who started in the sector were under the age of 24, a
further 28% were aged between 25 and 34. A fifth of nurses joined the sector when they
were over the age of 45, suggesting a possible move from the health sector.
32.7%
29.0%
36.1%
13.5%
14.9%
0.0% 5.0% 10.0% 15.0% 20.0% 25.0% 30.0% 35.0% 40.0%
All job roles
Regulated profession
Registered nurse
Social worker
Occupational therapist
04 13
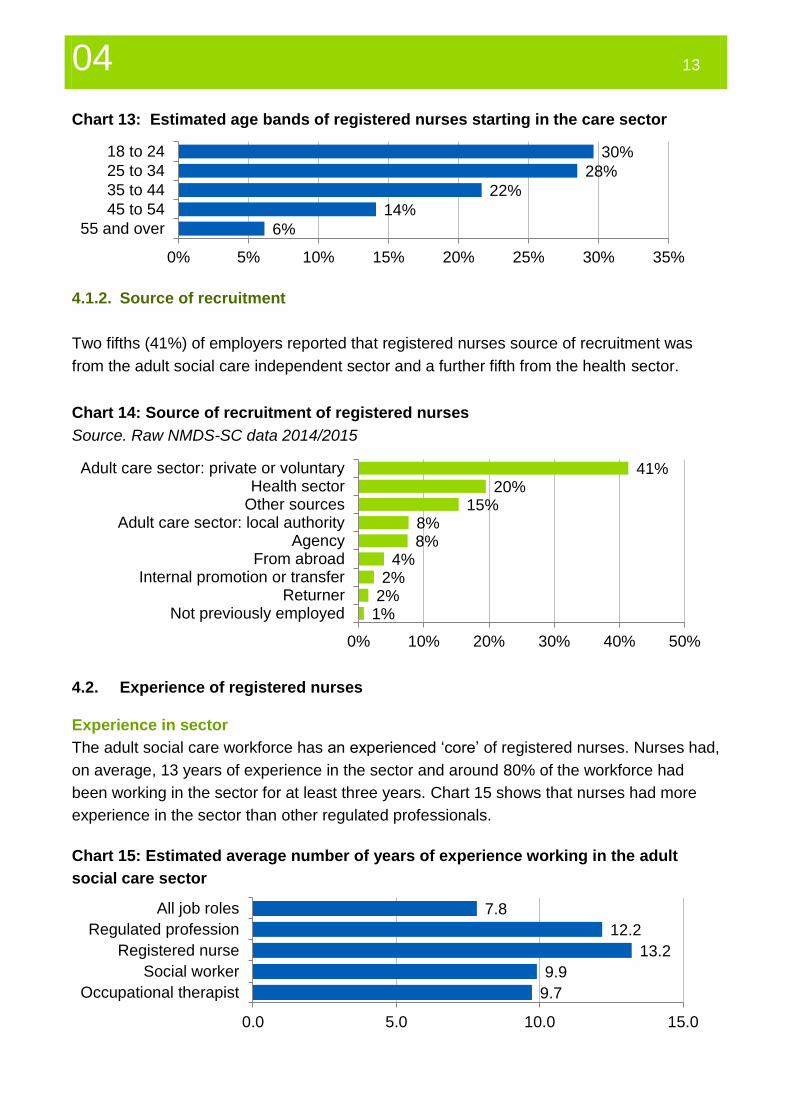
4.1.2. Source of recruitment
Two fifths (41%) of employers reported that registered nurses source of recruitment was
from the adult social care independent sector and a further fifth from the health sector.
Chart 14: Source of recruitment of registered nurses
Source. Raw NMDS-SC data 2014/2015
4.2. Experience of registered nurses
Experience in sector
The adult social care workforce has an experienced ‘core’ of registered nurses. Nurses had,
on average, 13 years of experience in the sector and around 80% of the workforce had
been working in the sector for at least three years. Chart 15 shows that nurses had more
experience in the sector than other regulated professionals.
41% 20%
15% 8% 8%
4% 2%
2% 1%
0% 10% 20% 30% 40% 50%
Adult care sector: private or voluntaryHealth sector
Other sourcesAdult care sector: local authority
AgencyFrom abroad
Internal promotion or transferReturner
Not previously employed
Chart 13: Estimated age bands of registered nurses starting in the care sector
Chart 15: Estimated average number of years of experience working in the adult
social care sector
30%
28%
22%
14%
6%
0% 5% 10% 15% 20% 25% 30% 35%
18 to 24
25 to 34
35 to 44
45 to 54
55 and over
7.8
12.2
13.2
9.9
9.7
0.0 5.0 10.0 15.0
All job roles
Regulated profession
Registered nurse
Social worker
Occupational therapist

04 14
Chart 16: Estimated number of years of experience of registered nurses working in
the adult social care sector
Experience in role
Nurses had, on average, four years of experience in their current role. Over half of nurses
(54%) had been in their role for less than three years, 36% for three to ten years and 10%
for more than ten years.
Chart 17: Estimated average number of years of experience working in current role
Chart 18: Estimated number of years of experience of registered nurses working in
their current role
6%
15%
10%
8%
15%
20%
25%
0% 5% 10% 15% 20% 25% 30%
Less than 1 year
1 to 2 years
3 to 4 years
5 to 6 years
7 to 10 years
11 to 20 years
Over 20 years
4.6
5.2
4.4
7.2
6.8
0.0 1.0 2.0 3.0 4.0 5.0 6.0 7.0 8.0
All job roles
Regulated profession
Registered nurse
Social worker
Occupational therapist
26%
28%
15%
9%
13%
9%
1%
0% 5% 10% 15% 20% 25% 30%
Less than 1 year
1 to 2 years
3 to 4 years
5 to 6 years
7 to 10 years
11 to 20 years
Over 20 years

04 15
4.3. Leavers and staff turnover
Skills for Care estimated that the turnover rate of directly employed nurses was 33.9%, this
was approximately 16,800 a year. The turnover rate of other regulated professional roles
was lower, please see Chart 19.
Chart 19: Estimated proportion of staff leaving their role each year in the past 12
months
The turnover rate of nurses working in the independent sector only was 35.5% in 2015. The
chart below shows that the turnover rate in the independent sector (private and voluntary
sector combined) has increased year on year from 2013.
Chart 20: Estimated registered nurse turnover trends in the independent sector from
2013 to 2015
4.4. Influencing factors of registered nurse turnover rates
Turnover rates varied between sector and service type, with the statutory local authority
sector having a lower turnover rate than the private and voluntary sectors.4 Domically care
services also had a lower turnover rate than residential and community services. See chart
below for details. It should be noted that the majority of nurses work in residential services
in the private sector.
4 It should be noted these figures do not include workers from establishments that ceased to operate during
the period as leavers. This is especially relevant for local authorities as outsourcing and closures were common in 2014.
26.0%
27.1%
33.9%
12.0%
15.3%
0.0% 10.0% 20.0% 30.0% 40.0%
All job roles
Regulated profession
Registered nurse
Social worker
Occupational therapist
31.3% 33.5% 35.5%
0.0%
10.0%
20.0%
30.0%
40.0%
2013 2014 2015

04 16
Chart 21: Estimated proportion of staff leaving their role each year by sector and
service
An analysis of factors that influence/ affect registered nurses turnover rates found that the
most important workforce factor was pay. Those nurses paid at a higher rate had a lower
turnover rate than those paid less, showing that those paid more were less likely to leave.
Those with more experience working in the adult social care sector were also less likely to
leave than those new to the sector. Employment type also had an effect on turnover rates,
with those on zero hours contract being more likely to leave compared to those on other
contract types.
Nurse turnover, like other roles in the adult social care sector is likely to be influenced by
non-workforce factors, such as relationship with managers and other colleagues, job
satisfaction, and ease of travel to work.
4.5. Sickness rates
The average number of days absent due to sickness per nurse in the past 12 months was
2.5 days; this was lower than other regulated professional roles and the sector as a whole.
However, on average sickness rates are lower within the independent sector than statutory
local authorities, and most nurses are employed within the independent sector. With an
estimated 49,500 nurses and an average of 2.5 sickness days, that is a total of at least
124,000 days lost to sickness every year.
Chart 22: Estimated average number of sickness days in the past 12 months
33.9% 18.2%
34.4% 31.8%
33.9% 34.9%
24.1% 30.0%
0.0% 5.0% 10.0% 15.0% 20.0% 25.0% 30.0% 35.0% 40.0%
All sectorsStatutory local authority
PrivateVoluntary
All servicesAdult residentialAdult domiciliary
Adult community care
4.7 4.3 2.5 9.0
6.1
0.0
5.0
10.0
All job roles Regulatedprofession
Registerednurse
Social worker Occupationaltherapist

04 17
4.6. Vacancies
Skills for Care estimated that 9.0% of the registered nurse roles in the adult social care
sector were vacant, this gives an average of approximately 4,500 vacancies at any one
time. When comparing the vacancy rate of nurses (9.0%) to the vacancy rate of the sector
as a whole (6.2%) the nursing vacancy rate is high.
Chart 23: Estimated proportion of vacant posts
The chart below shows that the vacancy rate for registered nurses in the independent
sector only was 9.5% in 2015. Although this percentage was higher in 2014 than 2013 and
2015, the number has remained consistently high.
Chart 24: Estimated proportion of vacant posts
The following is an extract from Skills for Care’s NMDS-SC trend briefing about vacancy
rates in the adult social care sector, published March 2016.5
“In adult social care, the jobs with the highest vacancy rate as at September 2015 were:
registered managers at CQC-regulated organisations (12%), registered nurses in the
independent sector (10%), social workers and occupational therapists at adult social
services departments (12% and 10% respectively). These roles have high entry
requirements compared to other roles in social care (e.g. independent sector care workers,
8% vacancy rate) and they tend to require specialised qualifications and experience. As a
5 www.skillsforcare.org.uk/briefings
6.2%
8.7%
9.0%
8.5%
6.7%
0.0% 2.0% 4.0% 6.0% 8.0% 10.0%
All job roles
Regulated profession
Registered nurse
Social worker
Occupational therapist
9.0%
10.8% 9.5%
0.0%
2.0%
4.0%
6.0%
8.0%
10.0%
12.0%
14.0%
2013 2014 2015

04 18
result, candidates for these roles are in relatively low supply compared to care workers
where entry requirements are not as stringent.
Vacancy rates for selected job roles
Reports on the health sector also demonstrate that vacancy rates of skilled professional
roles have increased in recent years. Health Education England (HEE) report that the
vacancy rate for nurses in acute and community settings was 6.5%6 which, according to a
recent King’s Fund report7, highlights “a general cross-sectoral difficulty in nurse
recruitment”. Similarly, NHS Employers8 report that more than 90% of NHS provider trusts
are experiencing a supply shortage of nurses and that almost 80% of vacancies
categorised as being ‘hard-to-fill ‘are in the field of nursing. This survey also reports a 10%
vacancy rate for nurses at NHS provider trusts, comparable to the rate for those in adult
social care.”
In October 2015 the government announced temporary changes to restrictions on nurse
recruitment from outside the European Economic Area (EEA) by adding the role to the
shortage occupation list. As a longer term solution to the nursing shortage the government
are increasing nursing training places, estimating that an additional 23,000 nurses will be in
post, in both health and social care, by 20199.
There is lots of information on the Skills for Care website about recruiting and retaining
workers, including information about attract more people, take on the right people, develop
talent and skills, and keep your people. Please visit the finding and keeping workers
resources and values based recruitment and retention resources here
www.skillsforcare.org.uk/Finding-and-keeping-workers.
6 https://www.hee.nhs.uk/our-work/planning-commissioning/workforce-planning
7 http://www.kingsfund.org.uk/sites/files/kf/field/field_publication_file/Workforce-planning-NHS-Kings-Fund-
Apr-15.pdf 8 http://www.nhsemployers.org/case-studies-and-resources/2016/01/2015-nhs-registered-nurse-supply-and-
demand-survey-findings 9 https://www.gov.uk/government/news/restrictions-on-nurse-recruitment-from-overseas-changed
12%
10%
10%
8%
3%
0% 5% 10% 15%
Social worker
Occupational therapist
Registered nurse
Care worker
Ancillary and admin roles
Loca
la
uth
ori
ties
Ind
epe
nde
nt
se
cto
r

05 Workforce demographics 19
Overview
The majority (87%) of nurses were female
The average age of a registered nurse working in the adult social care sector was 47
years old and almost a third of registered nurses were aged over 55 so may retire within
the next 10 years
59% of nurses had a white ethnicity and 41% BME, with large regional differences
61% of nurses had a British nationality and 39% non-British, also with large regional
differences
Half of registered nurses were recorded as being non-UK born
21% of non-UK born nurses had arrived in the UK since 2011
5. Workforce demographics
Section 5 of this report looks at the demographics of registered nurses in the adult social
care workforce, including a look at gender, age, ethnicity, nationality, country of birth and
year of entry if not from the UK.
5.1. Gender
Overall, the adult social care workforce remains one where females make up over 80% of
the workforce and this is also true for registered nurses. Chart 25 shows the proportion of
male and female workers.
Chart 25: Estimated gender of workers in the adult social care sector
5.2. Age
The average age of a registered nurse working in the adult social care sector was 47 years
old. This was older than other regulated professionals, with social worker and occupational
therapists both having an average age of 45 years old. The overall average of a worker in
the sector was 43 years old. Chart 26 shows age bands. Almost a third of registered nurses
were aged over 55 so may retire within the next 10 years.
18%
15%
13%
20%
10%
82%
85%
87%
80%
90%
0% 20% 40% 60% 80% 100%
All job roles
Regulated profession
Registered nurse
Social worker
Occupational therapist
Male Female

05 20
Chart 26: Estimated age bands of workers in the adult social care sector
A closer look at age bands shows that 14% of registered nurses were aged between 55 and
59, 10% aged between 60 and 64 and 6% were aged over 65 years old, this was
approximately 3,000 nurses over 65 years old.
Chart 27: Estimated age bands of registered nurses
5.3. Ethnicity
The ethnicity profile of the population of England is similar to that of the adult social care
workforce as a whole, with 85% white and 15% black minority ethnic (BME) compared to
80% white and 20% BME within adult social care. The ethnicity profile of registered nurses
is fairly different to the sector as a whole, with a larger proportion of BME nurses. Chart 28
shows that 41% of nurses have a BME ethnicity and 59% a white ethnicity.
Chart 28: Estimated ethnicity of workers in the adult social care sector
11%
2%
2%
2%
2%
68%
70%
68%
76%
77%
21%
28%
30%
22%
21%
0% 20% 40% 60% 80% 100%
All job roles
Regulated profession
Registered nurse
Social worker
Occupational therapist
18 to 24 25 to 54 55 and over
<1% 2%
7% 7% 11%
13% 14% 15% 14%
10%
4% 2%
0%
5%
10%
15%
20%
Under20
20 to24
25 to29
30 to34
35 to39
40 to44
45 to49
50 to54
55 to59
60 to64
65 to69
Over70
80% 66% 59% 79% 91%
20% 34% 41% 21%
9%
0%
50%
100%
All job roles Regulatedprofession
Registerednurse
Social worker Occupationaltherapist
White BME

05 21
Ethnicity of nurses, like other roles within social care, differs by region, notably with London
having the largest proportion of BME nurses compared to the rest of the country.
Chart 29: Estimated ethnicity of registered nurses by region
5.4. Nationality
Unsurprisingly the nationality profile of nurses working in the sector is similar to that of the
ethnicity profile, with 61% of nurses having a British nationality and 39% non-British. Similar
regional differences are also seen.
Chart 30: Estimated nationality of workers in the adult social care sector
Chart 31: Estimated nationality of registered nurses by region
57%
65%
17%
81%
74%
54%
68%
60%
66%
43%
35%
83%
19%
26%
46%
32%
40%
34%
0% 20% 40% 60% 80% 100%
Eastern
East Midlands
London
North East
North West
South East
South West
West Midlands
Yorkshire & Humber
White BME
82%
69%
61%
18%
31%
39%
0% 20% 40% 60% 80% 100%
All job roles
Regulated profession
Registered nurse
British Non-British
58% 64% 36%
80% 75% 48%
64% 69% 69%
42% 36% 64%
20% 25% 52%
36% 31% 31%
0%
20%
40%
60%
80%
100%
Eastern EastMidlands
London NorthEast
NorthWest
SouthEast
SouthWest
WestMidlands
Yorkshire& Humber
British Non-British

05 22
The top four nationalities of registered nurses who were non-British were Indian (18%),
Filipino (16%) Romanian (10%) and Zimbabwean (9%). In London the top four were Filipino
(15%), Nigerian (13%), Romanian (8%) and Zimbabwean (7%).
5.5. Country of birth
Looking at the country of birth of workers provides a slightly different perspective to that of
nationality. Chart 32 shows that a greater proportion of nurses were born outside the UK
(61%) than the proportion of non-British workers (50%) – suggesting that some workers
have gained British nationality since arriving in the UK.
Chart 32: Country of birth group of workers in the adult social care sector
Source. Raw NMDS-SC data 2014/2015
The NMDS-SC allows analysis of workers born outside the UK by their year of entry into the
UK. Chart 33 shows that just over a fifth (21%) of non-UK born nurses have arrived in the
UK in since 2011, while 11% have been in the UK since pre-1995 and may now hold a
British passport or have indefinite leave to remain. Half of all non-UK born nurses arrived in
the UK between 2000 and 2006.
Chart 33: Registered nurses year of entry to the UK, of non-UK born
Source. Raw NMDS-SC data 2014/2015
It should be noted that employers did not always know the year of arrival for their workers
and therefore these figures are based on fewer responses than other areas of this report.
77%
59%
50%
23%
41%
50%
0% 20% 40% 60% 80% 100%
All job roles
Regulated profession
Registered nurse
UK born Non-UK born
11%
4%
25%
25%
14%
21%
0% 5% 10% 15% 20% 25% 30%
Pre 1995
1995-1999
2000-2003
2004-2006
2007-2010
2011- present
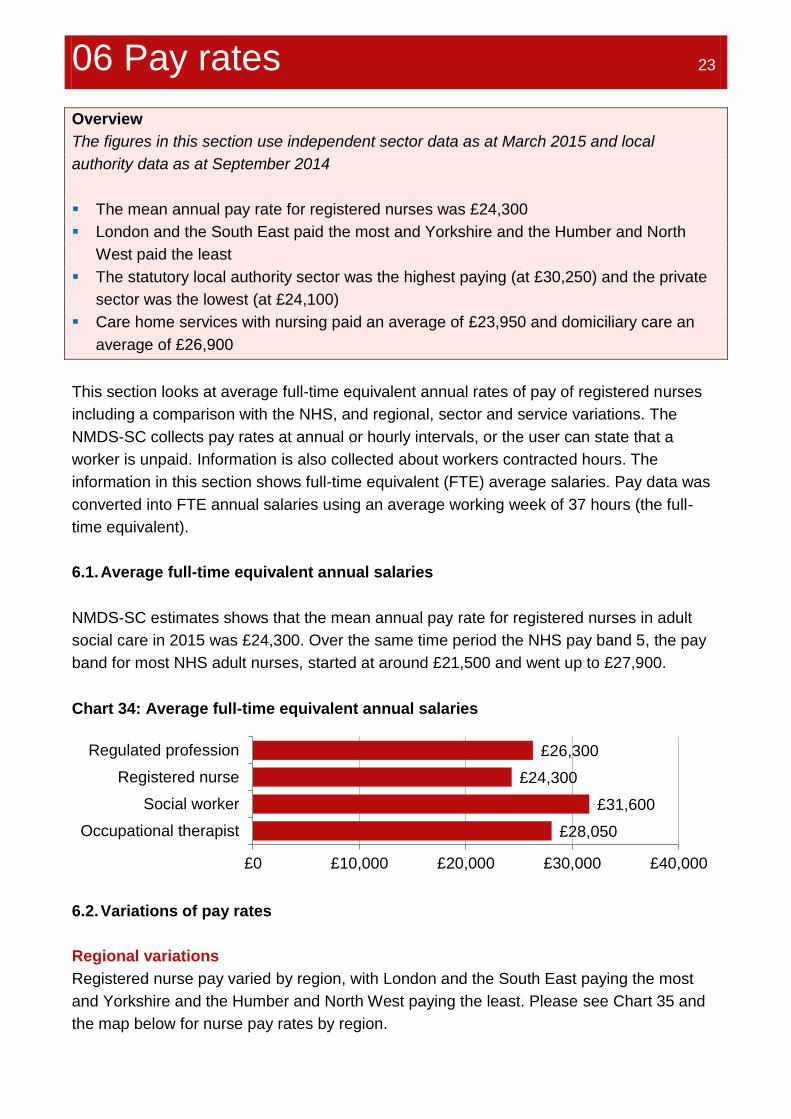
06 Pay rates 23
Overview
The figures in this section use independent sector data as at March 2015 and local
authority data as at September 2014
The mean annual pay rate for registered nurses was £24,300
London and the South East paid the most and Yorkshire and the Humber and North
West paid the least
The statutory local authority sector was the highest paying (at £30,250) and the private
sector was the lowest (at £24,100)
Care home services with nursing paid an average of £23,950 and domiciliary care an
average of £26,900
6. Pay rates
This section looks at average full-time equivalent annual rates of pay of registered nurses
including a comparison with the NHS, and regional, sector and service variations. The
NMDS-SC collects pay rates at annual or hourly intervals, or the user can state that a
worker is unpaid. Information is also collected about workers contracted hours. The
information in this section shows full-time equivalent (FTE) average salaries. Pay data was
converted into FTE annual salaries using an average working week of 37 hours (the full-
time equivalent).
6.1. Average full-time equivalent annual salaries
NMDS-SC estimates shows that the mean annual pay rate for registered nurses in adult
social care in 2015 was £24,300. Over the same time period the NHS pay band 5, the pay
band for most NHS adult nurses, started at around £21,500 and went up to £27,900.
Chart 34: Average full-time equivalent annual salaries
6.2. Variations of pay rates
Regional variations
Registered nurse pay varied by region, with London and the South East paying the most
and Yorkshire and the Humber and North West paying the least. Please see Chart 35 and
the map below for nurse pay rates by region.
£26,300
£24,300
£31,600
£28,050
£0 £10,000 £20,000 £30,000 £40,000
Regulated profession
Registered nurse
Social worker
Occupational therapist

06 24
Chart 35: Registered nurses average FTE annual pay rates by region
£25,550
£24,800
£24,750
£24,400
£24,150
£24,000
£23,600
£23,450
£23,350
£0 £10,000 £20,000 £30,000 £40,000
London
South East
West Midlands
South West
Eastern
North East
East Midlands
Yorkshire & Humber
North West

06 25
Sector variations
When looking at sector variations of pay it should be noted the majority of nurses are
employed in the independent sector, the estimated number of nurses in each sector is
shown in brackets to the left of the bar.
Similarly to the sector as a whole, the statutory local authority sector was the highest paying
(at £30,250) and the private sector paid the least (£24,100).
Chart 36: Registered nurses average FTE annual pay rates by sector
Service variations
When looking at pay variations by service it should be noted that the majority of nurses
(88%) are employed by adult residential services. Care home services with nursing paid an
average FTE annual pay rate of £23,950 and domiciliary care services paid an average of
£26,900.
Chart 37: Registered nurses average FTE annual pay rates by service
£24,300
£30,250
£24,100
£25,150
£0 £10,000 £20,000 £30,000 £40,000
All sectors
Statutory local authority (250)
Private (42,250)
Voluntary (7,250)
£24,300
£23,900
£24,200
£26,900
£29,150
£0 £10,000 £20,000 £30,000 £40,000
All services
Adult residential (43,750)
Adult day (<250)
Adult domiciliary (5,250)
Adult community care (750)

07 Conclusion 26
In 2014 there were an estimated 49,500 registered nurses working
in the adult social care sector. The number of registered nursing
roles in the adult social care sector has been fairly consistent over
the past 4 years, increasing by 1% from 2011 to 2014. However,
this growth was slower than the growth of all staff within care homes
with nursing services, at 7% over the same time period.
The mean annual pay rate for registered nurses in the adult social
care sector in 2015 was £24,300, over the same time period the
NHS pay band 5 started at around £21,500 and went up to £27,900.
7. Conclusion
The recruitment and retention of nurses in the health and social care system is under
significant pressure. The turnover rate of nurses has risen year on year from 2013-2015
and just over a third of nurses (34%) were estimated to have left their role within the past 12
months, this was approximately 16,800 leavers in the past year. The vacancy rate of
registered nurses is high, at 9%, giving an average of 4,500 vacancies at any one time. A
study of NHS employers found skills shortages are the most reported reason for recruitment
difficulties. Although nurses have an average of 13 years of experience in the sector,
these recruitment and retention figures show a high level of movement within the sector.
The policy landscape is focused around the integration of health and social care
services as one of the key political drivers for future planning and this has a direct impact
on workforce planning. Developing an integrated workforce is a key element of
personalised and integrated services.
In October 2015 the government announced temporary changes to restrictions on nurse
recruitment from outside the EEA and have added the role to the shortage occupation
list. As a longer term solution to the nursing shortage the government are increasing
nursing training places, estimating that an additional 23,000 nurses will be on post, in
both health and social care, by 2019. In addition major changes to the funding of nurse
training have been proposed. The government have also announced proposals for the
development of a ‘nursing associate’ role.
This report suggests that there will continue to be significant pressures on the adult
social care nursing workforce in the short to medium term. It is vital that adult social care
can attract and retain nurses with the right skills and values, to raise and deliver quality
and standards for people using social care services. Whilst a number of initiatives are
being implemented to meet the demand for nurses the high level of movement within the
current workforce will also remain a challenge, and will continue to have an impact on
service delivery and continuity of care.

08 Users and uses of the 27
NMDS-SC and further resources
8. Users and uses of the NMDS-SC and further resources
Skills for Care provides outstanding workforce intelligence relied upon by government,
strategic bodies, employers and individuals to make decisions that will improve outcomes
for people who use services. NMDS-SC is recognised as the leading source of workforce
intelligence for adult social care. This chapter provides an overview of some of the reports
and resources published by Skills for Care that use NMDS-SC information.
8.1. The size and structure of the adult social care sector and workforce in England
The annual ‘Size and Structure of the Adult Social Care Sector and
Workforce in England’ includes estimates of the number of care providing
organisations, establishments/ care providing locations, people and job
estimates, trend data and future projections. To access this report please
visit www.skillsforcare.org.uk/sizeandstructure
8.2. The state of the adult social care sector and workforce in England
This report uses data from the NMDS-SC to explore characteristics of
the adult social care sector, including demographic information,
recruitment and retention issues, pay rates, and qualifications and
training information. This report also includes a chapter about recent
research that has been conducted, the economic contribution of the
sector and a review of how policy changes may affect it. To access this
report please visit www.skillsforcare.org.uk/stateof2014
8.3. Local and regional information reports
The adult social care sector and workforce by region
These nine regional information reports provide an overview of the size
and structure of the adult social care sector in your area. They include;
demographics, recruitment and retention, pay rates, qualifications and
training. And, for the first time, takes a closer look at the diverse range of
jobs carried out in the sector.
Local authority area summary reports
You can download one of 152 two page summary reports, which focus on care workers and
registered managers within each local authority area of England.
To access any of these reports please visit www.skillsforcare.org.uk/regionalreports

08 28
8.4. NMDS-SC briefings and trend briefings
Skills for Care publishes four to five short reports each year which highlight specific issues
in the adult social care sector. Examples of briefing topics that have been covered in
2014/2015 include:
Registered managers in the adult social care sector
Experience of the adult social care workforce
Social workers in the adult social care sector
Diversity of the adult social care sector
Care worker pay trends
To access these briefings please visit www.skillsforcare.org.uk/briefings.
8.5. NMDS-SC Dashboards
Dashboards act as a diagnostic tool to shine light on issues affecting the adult social care
sector and workforce. NMDS-SC data is graphically presented in an easy to understand
format with tailored interpretation, simple guidance and links to related resources.
Dashboards allow you to explore the following areas:
There are two sets of Dashboard available:
My NMDS-SC Dashboards- available to social care providers registered with the
NMDS-SC.
Open Access NMDS-SC Dashboards- These are available to anyone with an interest
in the social care sector, workforce planning, service commissioning or labour market
intelligence.
To access the NMDS-SC Dashboards and supporting materials please visit www.nmds-sc-online.org.uk/reportengine/dashboard.aspx.

08 29
8.6. Analytical service
The Skills for Care analysis team provide an external analysis service and can produce a
range of in-depth reports depending on your specific requirements. Skills for Care’s highly
experienced analysts can work with you to identify your requirements, and design and
deliver bespoke workforce intelligence reports. We use NMDS-SC data to provide essential
data in the form of reports or within a broader consultancy package to inform business
decision making.
Our data services can be used when you need:
Evidence to help you make an important decision or develop a strategy
Information/analysis and a report that’s more in-depth and tailored to your needs
Trend information or help looking ahead with forecasts
Information for a bid
Benchmarking social care organisations/the workforce
Contributions to health and social care workforce integration projects
All available at the geographical level most relevant to your needs
A review from a recent user said “‘Skills for Care provided a professional, expert service to
support our workforce development project. Their approach was flexible and
accommodating. Our nominated analyst produced a report of excellent quality that made
the data very accessible to those without a workforce data background. We are very
pleased with the work completed by Skills for Care in support of our project and would be
happy to work with them again should the need arise.’
For more information about this service please email [email protected] or call
0113 2410969.
8.7. Keeping informed
To be kept up to date with Workforce Intelligence news follow us on twitter
@SfC_NMDS_SC.

Twitter.com/skillsforcare
Facebook.com/skillsforcare
Linkedin.com/company.skills-for-care
Skills for Care
West Gate
6 Grace Street
Leeds
LS1 2RP
T: 0113 245 1716
Skillsforcare.org.uk
© Skills for Care 2016