Embed Size (px)
Citation preview
Annual Report andUnited Kingdom Statutory Accounts
Ensco plc6 Chesterfield GardensLondon W1J 5BQ
Registered in England No. 7023598
2013
SHAREHOLDER INFORMATION
ANNUAL GENERAL MEETINGThe annual general meeting of shareholders will be held at Grosvenor House, the Apsley Suite, Park Lane, London, W1K 7TN, United Kingdom at 8:00 a.m. London time on Monday, 19 May 2014.
TRANSFER AGENTRegistered holders of our shares may direct their questions to Computershare.
Computershare Trust Company, N.A.P.O. Box 43001 Providence, RI 02940-3001Within USA, US territories & Canada: +1 888-926-3470 Outside USA, US territories & Canada: +1 732-491-0636 Fax: +1 781-575-3605Email: [email protected]: Monday through Friday, 8:30 a.m. to 6 p.m. (ET)
CORPORATE GOVERNANCE, BOARD AND BOARD COMMITTEES The corporate governance section of our website, www.enscoplc.com, contains information regarding (i) the composition of our Board of Directors and board committees, (ii) corporate governance in general, (iii) shareholder communications with the Board, (iv) the Ensco Code of Business Conduct Policy, (v) the Ensco Corporate Governance Policy, (vi) Ethics Hotline reporting provisions, (vii) the charters of the board committees and (viii) a direct link to the company’s SEC filings, including reports required under Section 16 of the Securities Exchange Act of 1934. Copies of these documents may be obtained without charge by contacting Ensco’s Investor Relations Department. Reasonable expenses will be charged for copies of exhibits listed in the back of Forms 10-K and 10-Q. Please list the exhibits you would like to receive and submit your request in writing to Ensco’s Investor Relations Department at the address below. We will notify you of the cost and furnish the requested exhibits upon receipt of payment.
CEO AND CFO CERTIFICATIONSThe Annual CEO Certification pursuant to the New York Stock Exchange (NYSE) Listed Company Manual (Section 303A.12(a)) was filed with the NYSE on 19 June 2013. Additionally, certifications of the CEO and CFO pursuant to Rule 13a-14 or 15d-14 of the Securities Exchange Act of 1934, as adopted pursuant to Section 302 of the Sarbanes-Oxley Act of 2002, were filed with the SEC on 26 February 2014 as exhibits to the Company’s 2013 Form 10-K. All of the aforementioned certifications were fully compliant and without qualification.
ENSCO INVESTOR RELATIONS DEPARTMENT5847 San Felipe, Suite 3300Houston, Texas 77057-3008(713) 789-1400www.enscoplc.com
(1) Audit Committee (2) Nominating and Governance Committee (3) Compensation Committee (4) Lead Director
BOARD OF DIRECTORS
DANIEL W. RABUN Chairman, President and Chief Executive Officer Ensco plc
DAVID A. B. BROWN (2)
ChairmanLayne Christensen Company
J. RODERICK CLARK (3)
Former President and Chief Operating OfficerBaker Hughes Incorporated (Retired)
ROXANNE J. DECYK (3)
Former Executive Vice President of Global GovernmentRelations Royal Dutch Shell plc (Retired)
MARY E. FRANCIS CBE (1)
Former Senior Civil Servant in British Treasury and Prime Minister’s Office (Retired)
C. CHRISTOPHER GAUT (3)
Chairman and Chief Executive OfficerForum Energy Technologies, Inc.
GERALD W. HADDOCK (1) (2)
Private Investor
FRANCIS S. KALMAN (1)
Former Executive Vice PresidentMcDermott International, Inc. (Retired)
KEITH O. RATTIE (1)
Former Chairman, President and Chief Executive OfficerQuestar Corporation (Retired)
PAUL E. ROWSEY, III (2) (4)
Chief Executive OfficerCompatriot Capital, Inc.
CORPORATE OFFICERS
DANIEL W. RABUNChairman, President and Chief Executive Officer
J. MARK BURNSExecutive Vice President and Chief Operating Officer
JAMES W. SWENT IIIExecutive Vice President and Chief Financial Officer
STEVEN J. BRADYSenior Vice President – Western Hemisphere
DAVID HENSELSenior Vice President – Marketing
JOHN S. KNOWLTONSenior Vice President – Technical
P. CAREY LOWE Senior Vice President – Eastern Hemisphere
DAVID A. ARMOUR Vice President – Tax
JON BAKSHTVice President and Treasurer
MARK T. DIEHL Vice President – Capital Projects
MICHAEL B. HOWEVice President – Human Resources
BRADY K. LONGVice President – General Counsel and Secretary
GILLES LUCAVice President – Business Development and Strategic Planning
DOUGLAS J. MANKO Vice President – Finance
SACHIN MEHRAVice President – Asset Management
SEAN P. O’NEILLVice President – Investor Relations and Communications
RICHARD ROPERVice President – Engineering
PAUL WILDBERGERVice President – Safety, Health & Environment
ROBERT W. EDWARDS, IIIController
(in millions of $, except EPS and percentages)
(1) Includes the results of Pride International, Inc. from the acquisition date of 31 May 2011. (2) Total Capital includes Long-term Debt plus Ensco Shareholders’ Equity.
FINANCIAL HIGHLIGHTS 2009 2010 2011(1) 2012
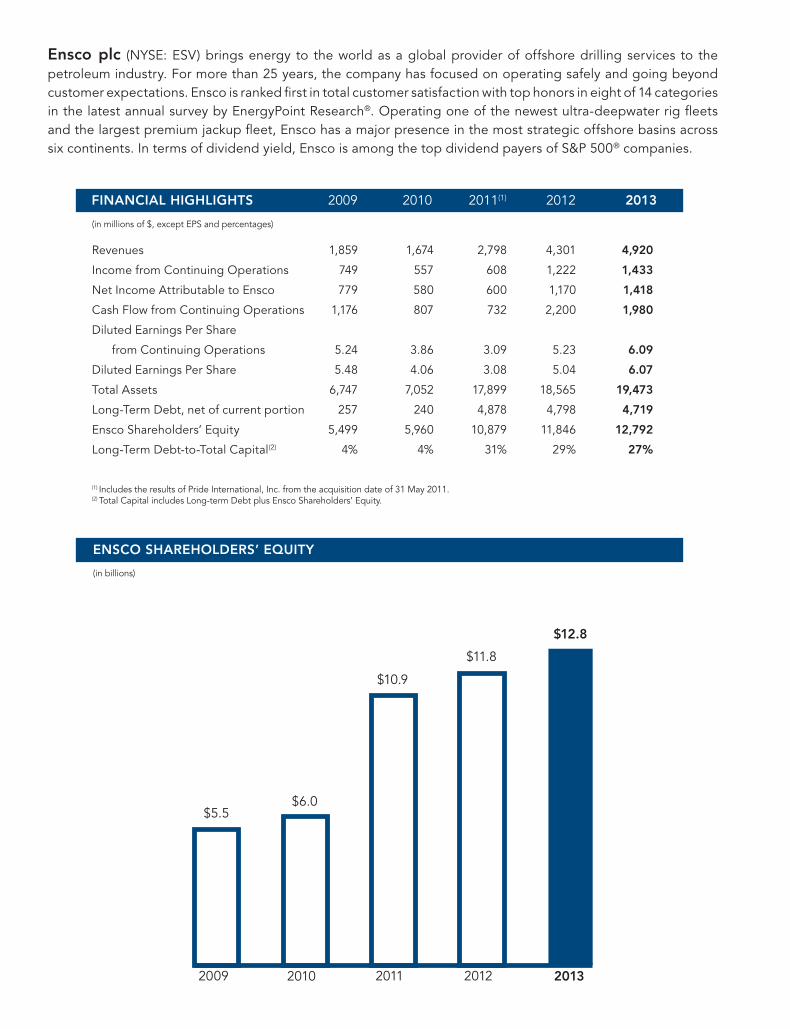
Ensco plc (NYSE: ESV) brings energy to the world as a global provider of offshore drilling services to the petroleum industry. For more than 25 years, the company has focused on operating safely and going beyond customer expectations. Ensco is ranked first in total customer satisfaction with top honors in eight of 14 categories in the latest annual survey by EnergyPoint Research®. Operating one of the newest ultra-deepwater rig fleets and the largest premium jackup fleet, Ensco has a major presence in the most strategic offshore basins across six continents. In terms of dividend yield, Ensco is among the top dividend payers of S&P 500® companies.
Revenues 1,859 1,674 2,798 4,301 4,920
Income from Continuing Operations 749 557 608 1,222 1,433
Net Income Attributable to Ensco 779 580 600 1,170 1,418
Cash Flow from Continuing Operations 1,176 807 732 2,200 1,980
Diluted Earnings Per Share
from Continuing Operations 5.24 3.86 3.09 5.23 6.09
Diluted Earnings Per Share 5.48 4.06 3.08 5.04 6.07
Total Assets 6,747 7,052 17,899 18,565 19,473
Long-Term Debt, net of current portion 257 240 4,878 4,798 4,719
Ensco Shareholders’ Equity 5,499 5,960 10,879 11,846 12,792
Long-Term Debt-to-Total Capital(2) 4% 4% 31% 29% 27%
$5.5$6.0
$10.9
$11.8
$12.8
2009 2010 2011 2012 2013
ENSCO SHAREHOLDERS’ EQUITY
(in billions)
2013
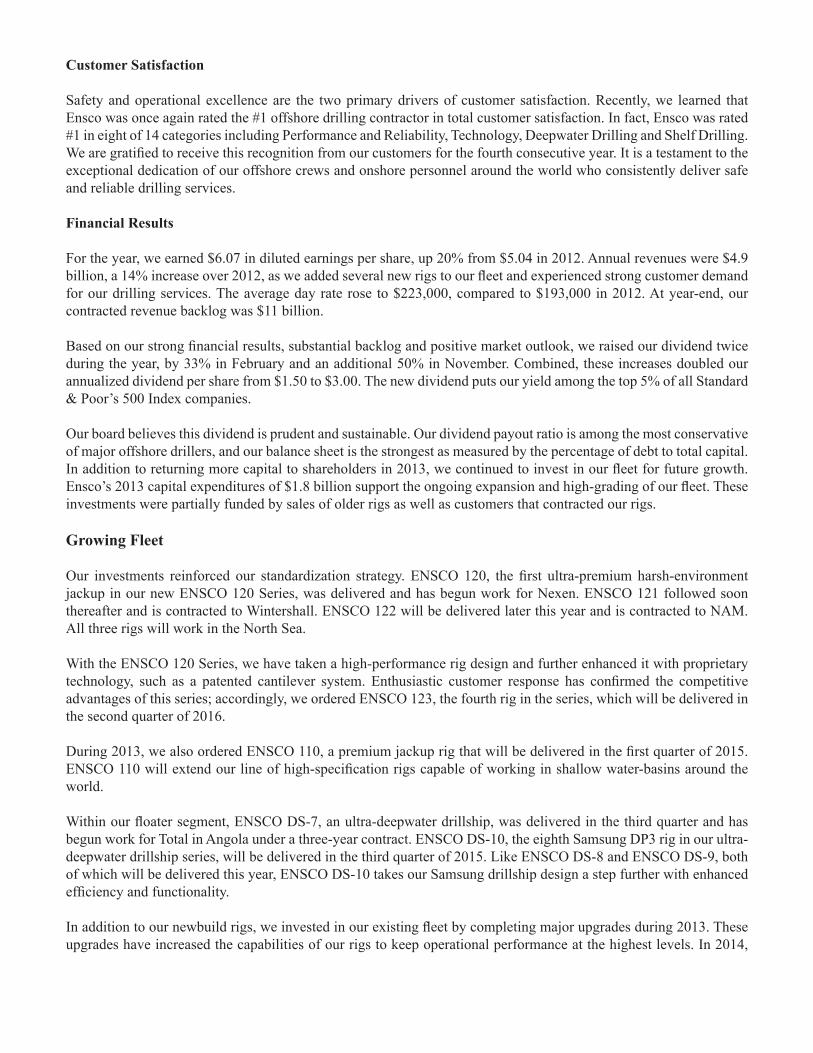
Dear Fellow Shareholders:
Ensco’s vision is that we will “go beyond what is expected,” and our performance in 2013 lived up to that commitment. We set a new benchmark for safety, maintained our #1 customer satisfaction rating and achieved record revenues and earnings.
Safety
We continue to advance toward our goal of zero incidents. In 2013, we recorded our lowest-ever total recordable incident rate (TRIR), an industry safety metric, at 0.39. This TRIR represents a dramatic improvement in our recordable incident rate over the past several years.
In the North Sea, we were awarded first place for safety among large jackup operators by the International Association of Drilling Contractors (IADC). Also, in the Middle East and Africa business unit, our jackup rigs achieved a remarkable safety milestone – operating an entire year without a single recordable incident.
Our positive momentum toward improving our incident rate has continued in 2014. We will continue to invest in our safety management systems and training programs as we continue on our journey to achieve a safe zero-incident workplace.
Operational Excellence
Our seven ENSCO 8500 Series® ultra-deepwater semisubmersible rigs illustrate the advantages of standardization on a differentiated rig design. The 8500 Series rigs have consistently achieved high uptime performance and extraordinary levels of customer satisfaction, evident in the number of repeat customers. For 2013, these rigs averaged 95% operational utilization, and several made news during the year:
• In March, ENSCO 8506 drilled Anadarko’s successful Shenandoah-2 well, which they described as one of its largest oil discoveries in the Gulf of Mexico. Anadarko also noted in its announcement that the Shenandoah Basin has the potential to become one of the most prolific new areas in the deepwater Gulf of Mexico.
• In May, ENSCO 8502 hosted the U.S. Secretary of the Interior and the Director of the Bureau of Safety and Environmental Enforcement (BSEE), on the Secretary’s first offshore rig visit.
• In July, ENSCO 8503 drilled to more than 36,000 feet for Cobalt International, setting a new total depth record for the U.S. Gulf of Mexico. Cobalt’s North Platte #1 deepwater discovery, also drilled by ENSCO 8503, was recognized as one of the best new discoveries by Oil and Gas Investor magazine.
Other rigs in our global fleet also received special recognition from customers. PEMEX rated Ensco #1 among all of their offshore drilling contractors for our four jackups in Mexico. ENSCO 82, in the U.S. Gulf of Mexico, received the “Energy XXI Distinguished Contractor Award” for stellar safety performance, minimal downtime and zero findings during a recent BSEE Safety and Environmental Management Systems audit. ENSCO 76, the first rig to commence drilling operations for Saudi Aramco in the Red Sea, was visited by Saudi Aramco’s President and CEO to congratulate the Aramco and Ensco team for their safety record and operational excellence.
Customer Satisfaction
Safety and operational excellence are the two primary drivers of customer satisfaction. Recently, we learned that Ensco was once again rated the #1 offshore drilling contractor in total customer satisfaction. In fact, Ensco was rated #1 in eight of 14 categories including Performance and Reliability, Technology, Deepwater Drilling and Shelf Drilling. We are gratified to receive this recognition from our customers for the fourth consecutive year. It is a testament to the exceptional dedication of our offshore crews and onshore personnel around the world who consistently deliver safe and reliable drilling services.
Financial Results
For the year, we earned $6.07 in diluted earnings per share, up 20% from $5.04 in 2012. Annual revenues were $4.9 billion, a 14% increase over 2012, as we added several new rigs to our fleet and experienced strong customer demand for our drilling services. The average day rate rose to $223,000, compared to $193,000 in 2012. At year-end, our contracted revenue backlog was $11 billion.
Based on our strong financial results, substantial backlog and positive market outlook, we raised our dividend twice during the year, by 33% in February and an additional 50% in November. Combined, these increases doubled our annualized dividend per share from $1.50 to $3.00. The new dividend puts our yield among the top 5% of all Standard & Poor’s 500 Index companies.
Our board believes this dividend is prudent and sustainable. Our dividend payout ratio is among the most conservative of major offshore drillers, and our balance sheet is the strongest as measured by the percentage of debt to total capital.In addition to returning more capital to shareholders in 2013, we continued to invest in our fleet for future growth. Ensco’s 2013 capital expenditures of $1.8 billion support the ongoing expansion and high-grading of our fleet. These investments were partially funded by sales of older rigs as well as customers that contracted our rigs.
Growing Fleet
Our investments reinforced our standardization strategy. ENSCO 120, the first ultra-premium harsh-environment jackup in our new ENSCO 120 Series, was delivered and has begun work for Nexen. ENSCO 121 followed soon thereafter and is contracted to Wintershall. ENSCO 122 will be delivered later this year and is contracted to NAM. All three rigs will work in the North Sea.
With the ENSCO 120 Series, we have taken a high-performance rig design and further enhanced it with proprietary technology, such as a patented cantilever system. Enthusiastic customer response has confirmed the competitive advantages of this series; accordingly, we ordered ENSCO 123, the fourth rig in the series, which will be delivered in the second quarter of 2016.
During 2013, we also ordered ENSCO 110, a premium jackup rig that will be delivered in the first quarter of 2015. ENSCO 110 will extend our line of high-specification rigs capable of working in shallow water-basins around the world.
Within our floater segment, ENSCO DS-7, an ultra-deepwater drillship, was delivered in the third quarter and has begun work for Total in Angola under a three-year contract. ENSCO DS-10, the eighth Samsung DP3 rig in our ultra-deepwater drillship series, will be delivered in the third quarter of 2015. Like ENSCO DS-8 and ENSCO DS-9, both of which will be delivered this year, ENSCO DS-10 takes our Samsung drillship design a step further with enhanced efficiency and functionality.
In addition to our newbuild rigs, we invested in our existing fleet by completing major upgrades during 2013. These upgrades have increased the capabilities of our rigs to keep operational performance at the highest levels. In 2014,
major upgrades are planned for several rigs, including ENSCO 5006 as well as two of our jackups, ENSCO 54 and ENSCO 70. For each of these rigs, customers are funding a portion of the upgrades and we expect these rigs to commence multi-year contracts later this year.
Looking Ahead
In November, we announced that I plan to retire after nearly eight years as CEO. A well-defined succession process is in place to ensure a smooth transition.
I have truly enjoyed leading Ensco. We have a highly talented management team and exceptionally dedicated employees who have made our many achievements possible, including record safety performance, the highest levels of customer satisfaction and record revenues and earnings.
While short-term market conditions can fluctuate, I believe the fundamental drivers of our business are strong. Successful new discoveries by our customers over the past several years support future demand for additional drilling rigs and healthy commodity prices continue to support investment by our clients in oil and gas exploration and development.
The future is bright for Ensco as we transition to a new CEO. With a solid and experienced management team in place, we are prepared to continue our positive momentum.
I want to extend special thanks to our employees for their commitment to “go beyond” every day, to our customers who have consistently rated Ensco #1 in total satisfaction, and to our Board of Directors for their counsel and wisdom.
Sincerely,
Daniel W. RabunChairman, President and CEO28 March 2014
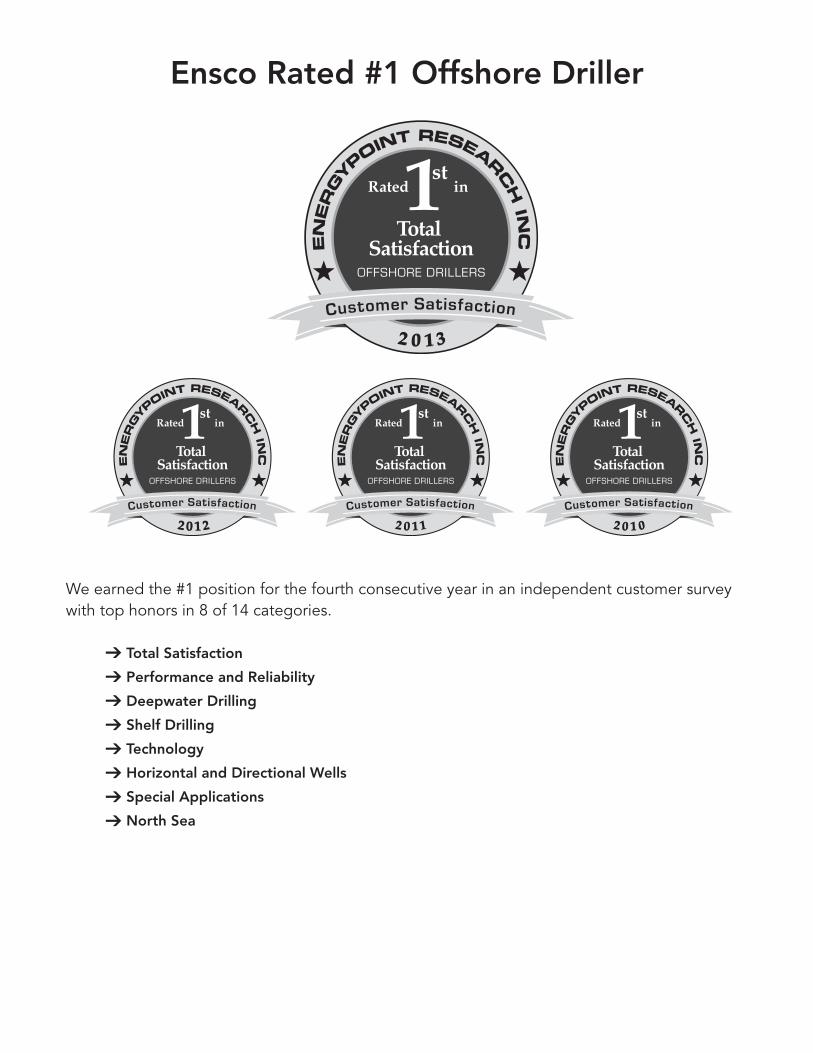
Ensco Rated #1 Offshore Driller
Total Satisfaction
Performance and Reliability
Deepwater Drilling
Shelf Drilling
Technology
Horizontal and Directional Wells
Special Applications
North Sea
We earned the #1 position for the fourth consecutive year in an independent customer survey with top honors in 8 of 14 categories.
TABLE OF CONTENTS
SEC Form 10-KBUSINESS 4RISK FACTORS 14UNRESOLVED STAFF COMMENTS 33PROPERTIES 34LEGAL PROCEEDINGS 36MINE SAFETY DISCLOSURES 38MARKET FOR REGISTRANT’S COMMON EQUITY, RELATED SHAREHOLDER MATTERS AND ISSUER PURCHASES OF EQUITY SECURITIES 39SELECTED FINANCIAL DATA 45MANAGEMENT’S DISCUSSION AND ANALYSIS OF FINANCIAL CONDITION AND RESULTS OF OPERATIONS 47QUANTITATIVE AND QUALITATIVE DISCLOSURES ABOUT MARKET RISK 70FINANCIAL STATEMENTS AND SUPPLEMENTARY DATA 70CHANGES IN AND DISAGREEMENTS WITH ACCOUNTANTS ON ACCOUNTING AND FINANCIAL DISCLOSURE 123CONTROLS AND PROCEDURES 123OTHER INFORMATION 123DIRECTORS, EXECUTIVE OFFICERS AND CORPORATE GOVERNANCE 123EXECUTIVE COMPENSATION 124SECURITY OWNERSHIP OF CERTAIN BENEFICIAL OWNERS AND MANAGEMENT AND RELATED SHAREHOLDER MATTERS 124CERTAIN RELATIONSHIPS AND RELATED TRANSACTIONS, AND DIRECTOR INDEPENDENCE 124PRINCIPAL ACCOUNTING FEES AND SERVICES 124EXHIBITS, FINANCIAL STATEMENT SCHEDULES 125SIGNATURES 133 UK Statutory Accounts – Annual Report and Financial StatementsSTRATEGIC REPORT 1 DIRECTORS’ REPORT 10 DIRECTORS’ RENUMERATION REPORT 13 STATEMENT OF DIRECTORS’ RESPONSIBILITIES IN RESPECT OF THE ANNUAL REPORT AND THE FINANCIAL STATEMENTS 30 INDEPENDENT AUDITORS’ REPORT TO THE MEMBERS OF ENSCO PLC 31 CONSOLIDATED PROFIT AND LOSS ACCOUNT 32 CONSOLIDATED BALANCE SHEET 33 COMPANY BALANCE SHEET 34 CONSOLIDATED CASH FLOW STATEMENT 35 RECONCILIATIONS OF MOVEMENTS IN SHAREHOLDERS’ FUNDS 36 NOTES 37
Shareholder Information
Board of Directors and Corporate Officers
UNITED STATESSECURITIES AND EXCHANGE COMMISSION
Washington, D.C. 20549
FORM 10-K(Mark One)
ANNUAL REPORT PURSUANT TO SECTION 13 OR 15(d) OF THE SECURITIES EXCHANGE ACT OF 1934
For the fiscal year ended December 31, 2013
OR
TRANSITION REPORT PURSUANT TO SECTION 13 OR 15(d) OF THESECURITIES EXCHANGE ACT OF 1934For the transition period from to
Commission File Number 1-8097
Ensco plc(Exact name of registrant as specified in its charter)
England and Wales(State or other jurisdiction ofincorporation or organization)
6 Chesterfield Gardens
London, England(Address of principal executive offices)
98-0635229(I.R.S. Employer
Identification No.)
W1J5BQ(Zip Code)
Registrant's telephone number, including area code: +44 (0) 20 7659 4660
Securities registered pursuant to Section 12(b) of the Act:
Title of each class
Class A Ordinary Shares, U.S. $0.10 par value
Name of each exchange on which registered
New York Stock Exchange Securities registered pursuant to Section 12(g) of the Act: None
Indicate by check mark if the registrant is a well-known seasoned issuer as defined in Rule 405 of the Securities Act. Yes No Indicate by check mark if the registrant is not required to file reports pursuant to Section 13 or Section 15(d) of the Act. Yes No Indicate by check mark whether the registrant (1) has filed all reports required to be filed by Section 13 or 15 (d) of the Securities Exchange Act of 1934 during the preceding 12 months (or for such shorter period that the registrant was required to file such reports), and (2) has been subject to such filing requirements for the past 90 days. Yes No Indicate by check mark whether the registrant has submitted electronically and posted on its corporate Web site, if any, every Interactive Data File required to be submitted and posted pursuant to Rule 405 of Regulation S-T (S232.405 of this chapter) during the preceding 12 months (or for such shorter period that the registrant was required to submit and post such files). Yes No Indicate by check mark if disclosure of delinquent filers pursuant to Item 405 of Regulation S-K (S229.405) is not contained herein, and will not be contained, to the best of registrant's knowledge, in definitive proxy or information statements incorporated by reference in Part III of this Form 10-K or any amendment to this Form 10-K. Indicate by check mark whether the registrant is a large accelerated filer, an accelerated filer, a non-accelerated filer, or a smaller reporting company. See the definitions of "large accelerated filer," "accelerated filer" and "smaller reporting company" in Rule 12b-2 of the Exchange Act (Check one):
Large accelerated filer Accelerated filer
Non-Accelerated filer (Do not check if a smaller reporting company) Smaller reporting company
Indicate by check mark whether the registrant is a shell company (as defined in Rule 12b-2 of the Act).Yes No The aggregate market value of the Class A ordinary shares (based upon the closing price on the New York Stock Exchange on June 30, 2013 of $58.12) of Ensco plc held by non-affiliates of Ensco plc at that date was approximately $11,730,723,000. As of February 10, 2014, there were 233,568,357 Class A ordinary shares of Ensco plc issued and outstanding.
DOCUMENTS INCORPORATED BY REFERENCE
Portions of the Company's Proxy Statement for the 2014 General Meeting of Shareholders are incorporated by reference into Part III of this report.
TABLE OF CONTENTS
PART I ITEM 1. BUSINESS 4
ITEM 1A. RISK FACTORS 14
ITEM 1B. UNRESOLVED STAFF COMMENTS 33
ITEM 2. PROPERTIES 34
ITEM 3. LEGAL PROCEEDINGS 36
ITEM 4. MINE SAFETY DISCLOSURES 38
PART II ITEM 5.
MARKET FOR REGISTRANT'S COMMON EQUITY, RELATED SHAREHOLDER MATTERS AND ISSUER PURCHASES OF EQUITY SECURITIES
39
ITEM 6. SELECTED FINANCIAL DATA 45
ITEM 7.
MANAGEMENT'S DISCUSSION AND ANALYSIS OF FINANCIAL CONDITIONAND RESULTS OF OPERATIONS
47
ITEM 7A. QUANTITATIVE AND QUALITATIVE DISCLOSURES ABOUT MARKET RISK 70
ITEM 8. FINANCIAL STATEMENTS AND SUPPLEMENTARY DATA 70
ITEM 9.
CHANGES IN AND DISAGREEMENTS WITH ACCOUNTANTS ONACCOUNTING AND FINANCIAL DISCLOSURE
123
ITEM 9A. CONTROLS AND PROCEDURES 123
ITEM 9B. OTHER INFORMATION 123
PART III ITEM 10. DIRECTORS, EXECUTIVE OFFICERS AND CORPORATE GOVERNANCE 123
ITEM 11. EXECUTIVE COMPENSATION 124
ITEM 12. SECURITY OWNERSHIP OF CERTAIN BENEFICIAL OWNERS ANDMANAGEMENT AND RELATED SHAREHOLDER MATTERS
124
ITEM 13. CERTAIN RELATIONSHIPS AND RELATED TRANSACTIONS, AND DIRECTORINDEPENDENCE
124
ITEM 14. PRINCIPAL ACCOUNTING FEES AND SERVICES 124
PART IV ITEM 15. EXHIBITS, FINANCIAL STATEMENT SCHEDULES 125SIGNATURES 133
2
FORWARD-LOOKING STATEMENTS
Statements contained in this report that are not historical facts are forward-looking statements within the meaning of Section 27A of the Securities Act of 1933, as amended, and Section 21E of the Securities Exchange Act of 1934, as amended. Forward-looking statements include words or phrases such as "anticipate," "believe," "estimate," "expect," "intend," "plan," "project," "could," "may," "might," "should," "will" and similar words and specifically include statements regarding expected financial performance; expected utilization, day rates, revenues, operating expenses, contract term, contract backlog, capital expenditures, insurance, financing and funding; the timing of availability, delivery, mobilization, contract commencement or relocation or other movement of rigs; future rig construction (including construction in progress and completion thereof), enhancement, upgrade or repair and timing thereof; the suitability of rigs for future contracts; general market, business and industry conditions, trends and outlook; future operations; the impact of increasing regulatory complexity; expected contributions from our rig fleet expansion program and our program to high-grade the rig fleet by investing in new equipment and divesting selected assets and underutilized rigs; expense management; and the likely outcome of litigation, legal proceedings, investigations or insurance or other claims and the timing thereof.
Such statements are subject to numerous risks, uncertainties and assumptions that may cause actual results to vary materially from those indicated, including:
• downtime and other risks associated with offshore rig operations or rig relocations, including rig or equipment failure, damage and other unplanned repairs, the limited availability of transport vessels, hazards, self-imposed drilling limitations and other delays due to severe storms and hurricanes and the limited availability or high cost of insurance coverage for certain offshore perils, such as hurricanes in the Gulf of Mexico or associated removal of wreckage or debris;
• changes in worldwide rig supply and demand, competition or technology, including changes as a result of delivery of newbuild drilling rigs;
• changes in future levels of drilling activity and expenditures, whether as a result of global capital markets and liquidity, prices of oil and natural gas or otherwise, which may cause us to idle or stack additional rigs;
• governmental action, terrorism, piracy, military action and political and economic uncertainties, including uncertainty or instability resulting from civil unrest, political demonstrations, mass strikes, or an escalation or additional outbreak of armed hostilities or other crises in oil or natural gas producing areas of the Middle East, North Africa, West Africa or other geographic areas, which may result in expropriation, nationalization, confiscation or deprivation of our assets or result in claims of a force majeure situation;
• risks inherent to shipyard rig construction, repair or enhancement, including risks associated with concentration of our construction contracts with two shipyards, unexpected delays in equipment delivery and engineering or design issues following delivery, or changes in the commencement, completion or service dates;
• possible cancellation or suspension of drilling contracts as a result of mechanical difficulties, performance or other reasons;
• the outcome of litigation, legal proceedings, investigations or other claims or contract disputes, including any inability to collect receivables or resolve significant contractual or day rate disputes, any purported renegotiation, nullification, cancellation or breach of contracts with customers or other parties and any failure to negotiate or complete definitive contracts following announcements of receipt of letters of intent;
3
• governmental regulatory, legislative and permitting requirements affecting drilling operations, including limitations on drilling locations (such as the Gulf of Mexico during hurricane season);
• new and future regulatory, legislative or permitting requirements, future lease sales, changes in laws, rules and regulations that have or may impose increased financial responsibility, additional oil spill abatement contingency plan capability requirements and other governmental actions that may result in claims of force majeure or otherwise adversely affect our existing drilling contracts;
• our ability to attract and retain skilled personnel on commercially reasonable terms, whether due to labor regulations, unionization or otherwise;
• environmental or other liabilities, risks or losses, whether related to storm or hurricane damage, losses or liabilities (including wreckage or debris removal), collisions, groundings, blowouts, fires, explosions and other accidents or terrorism or otherwise, for which insurance coverage and contractual indemnities may be insufficient, unenforceable or otherwise unavailable;
• our ability to obtain financing and pursue other business opportunities may be limited by our debt levels and debt agreement restrictions;
• our ability to realize expected benefits from the December 2009 redomestication as a U.K. public limited company and the related reorganization of Ensco’s corporate structure, including the effect of any changes in laws, rules and regulations, or the interpretation thereof, or in the applicable facts, that could adversely affect our status as a non-U.S. corporation for U.S. tax purposes or otherwise adversely affect our anticipated consolidated effective income tax rate;
• delays in actual contract commencement dates;
• adverse changes in foreign currency exchange rates, including their effect on the fair value measurement of our derivative instruments; and
• potential long-lived asset or goodwill impairments.
In addition to the numerous risks, uncertainties and assumptions described above, you should also carefully read and consider "Item 1A. Risk Factors" in Part I and "Item 7. Management’s Discussion and Analysis of Financial Condition and Results of Operations" in Part II of this Form 10-K. Each forward-looking statement speaks only as of the date of the particular statement, and we undertake no obligation to publicly update or revise any forward looking statements, except as required by law.
4
PART I
Item 1. Business
General
Ensco plc is a global offshore contract drilling company. Unless the context requires otherwise, the terms "Ensco," "Company," "we," "us" and "our" refer to Ensco plc together with all its subsidiaries and predecessors.
We own the world's second largest offshore drilling rig fleet amongst competitive rigs, our ultra-deepwater fleet is the newest in the industry, and our premium jackup fleet is the largest of any offshore drilling company. We currently own and operate an offshore drilling rig fleet of 74 rigs, including six rigs under construction, spanning most of the strategic, high-growth markets around the globe. Our rig fleet includes ten drillships, 13 dynamically positioned semisubmersible rigs, six moored semisubmersible rigs and 45 jackup rigs.
Our customers include most of the leading national and international oil companies, in addition to many independent operators. We are among the most geographically diverse offshore drilling companies, with current operations and drilling contracts spanning approximately 20 countries on six continents in nearly every major offshore basin around the world. The markets in which we operate include the U.S. Gulf of Mexico, Mexico, Brazil, the Mediterranean, the North Sea, the Middle East, West Africa, Australia and Southeast Asia.
We provide drilling services on a "day rate" contract basis. Under day rate contracts, we provide a drilling rig and rig crews and receive a fixed amount per day for drilling a well. Our customers bear substantially all of the ancillary costs of constructing the well and supporting drilling operations, as well as the economic risk relative to the success of the well. In addition, our customers may pay all or a portion of the cost of moving our equipment and personnel to and from the well site. We do not provide "turnkey" or other risk-based drilling services.
Acquisitions
We have grown our rig fleet through corporate acquisitions, rig acquisitions and new rig construction. A total of seven drillships, 11 semisubmersible rigs and 28 jackup rigs in our current fleet were obtained through the acquisitions of Penrod Holding Corporation during 1993, Dual Drilling Company during 1996, Chiles Offshore Inc. during 2002 and Pride International, Inc. ("Pride") during 2011. During 2010, we acquired ENSCO 109, an ultra-high specification jackup rig constructed during 2008.
On May 31, 2011 (the "Merger Date"), Ensco plc completed a merger transaction (the "Merger") with Pride, pursuant to which Pride became an indirect, wholly-owned subsidiary of Ensco plc. The total consideration delivered in the Merger was $7.4 billion, consisting of $2.8 billion of cash, 85.8 million of Ensco American depositary shares ("ADS") with an aggregate value of $4.6 billion based on the closing price of Ensco ADSs of $53.32 on the Merger Date and the estimated fair value of $35.4 million of vested Pride employee stock options assumed by Ensco. The Merger added drillships to our asset base, increased our presence in Angola and Brazil as well as various other major offshore drilling markets and established our fleet as the world's second largest competitive offshore drilling rig fleet.
Drilling Rig Construction and Delivery
We remain focused on our long-established strategy of high-grading and expanding the size of our fleet. During the three-year period ended December 31, 2013, we invested $3.0 billion in the construction of new drilling rigs.
We previously contracted Keppel FELS Limited ("KFELS") to construct seven ENSCO 8500 Series® ultra-deepwater semisubmersible rigs (the "ENSCO 8500 Series®" rigs) based on our proprietary design. The ENSCO 8500 Series® rigs are enhanced versions of ENSCO 7500 and are capable of drilling in up to 8,500 feet of water. ENSCO 8506, the final rig in the ENSCO 8500 Series®, was delivered during 2012 and commenced drilling operations in the U.S. Gulf of Mexico under a long-term contract during the first quarter of 2013.
In connection with the Merger, we acquired seven drillships, two of which were under construction at the time of the Merger. ENSCO DS-6 was delivered in January 2012, underwent customer specified upgrades and commenced
5
drilling operations in Angola under a long-term contract during the first quarter of 2013. ENSCO DS-7 was delivered in September 2013 and commenced a long-term contract in Angola during the fourth quarter of 2013. These newbuild drillships are based on a Samsung Heavy Industries ("SHI") proprietary hull design capable of drilling in water depths of up to 10,000 feet of water.
During 2012, we entered into agreements with SHI to construct two additional ultra-deepwater drillships (ENSCO DS-8 and ENSCO DS-9). ENSCO DS-8 is currently uncontracted and scheduled for delivery during the third quarter of 2014. ENSCO DS-9 is currently scheduled for delivery during the fourth quarter of 2014 and is committed under a long-term contract. During 2013, we entered into an agreement with SHI to construct our eighth ultra-deepwater drillship (ENSCO DS-10), which is uncontracted and scheduled for delivery during the third quarter of 2015.
We previously entered into agreements with KFELS to construct three ultra-premium harsh environment jackup rigs (ENSCO 120, ENSCO 121 and ENSCO 122). ENSCO 120 was delivered in September 2013 and is expected to commence drilling operations under a long-term contract in the North Sea during the first quarter of 2014. ENSCO 121 was delivered during the fourth quarter of 2013 and is expected to commence drilling operations under a long-term contract in the North Sea during the second quarter of 2014. ENSCO 122 is currently scheduled for delivery during the third quarter 2014 and is committed under a long-term drilling contract. During 2013, we entered into agreements with KFELS to construct a premium jackup rig (ENSCO 110) and an ultra-premium harsh environment jackup rig (ENSCO 123). These rigs are scheduled for delivery during the first quarter of 2015 and second quarter of 2016, respectively. Both of these rigs are currently uncontracted.
A substantial portion of our projected cash flows will continue to be invested in the expansion and enhancement of our fleet of drilling rigs. We also intend to continue paying quarterly dividends for the foreseeable future. However, our Board of Directors may change the timing and payment amount depending on several factors including our profitability, liquidity, financial condition, reinvestment opportunities and capital requirements. We believe our strong balance sheet, $10.7 billion of contract backlog and borrowing capacity under our commercial paper program and revolving credit facility provide flexibility to make additional investments in our fleet and sustain an adequate level of liquidity during 2014 and beyond.
Divestitures
Our business strategy has been to focus on ultra-deepwater floater and premium jackup operations, and de-emphasize other assets and operations considered to be non-core or that do not meet our standards for financial performance. Consistent with this strategy, we sold five jackup rigs, one moored semisubmersible rig and our last remaining barge rig during the three-year period ended December 31, 2013. We sold two additional jackup rigs in January 2014.
Redomestication
Our predecessor, ENSCO International Incorporated ("Ensco Delaware"), was formed as a Texas corporation during 1975 and reincorporated in Delaware during 1987. During 2009, we completed a reorganization of the corporate structure of the group of companies controlled by Ensco Delaware, pursuant to which an indirect, wholly-owned subsidiary merged with Ensco Delaware, and Ensco plc became our publicly-held parent company incorporated under English law (the "redomestication").
The redomestication was accounted for as an internal reorganization of entities under common control and, therefore, Ensco Delaware's assets and liabilities were accounted for at their historical cost basis and not revalued in the transaction. We remain subject to the U.S. Securities and Exchange Commission ("SEC") reporting requirements, the mandates of the Sarbanes-Oxley Act of 2002, as amended, and the applicable corporate governance rules of the New York Stock Exchange ("NYSE"), and we continue to report our consolidated financial results in U.S. dollars and in accordance with U.S. generally accepted accounting principles ("GAAP"). We also must comply with additional reporting requirements of English law.
6
Our principal executive office is located at 6 Chesterfield Gardens, London W1J5BQ, England, United Kingdom, and our telephone number is +44 (0) 20 7659 4660. Our website is www.enscoplc.com. Information contained on our website is not included as part of, or incorporated by reference into, this report.
Contract Drilling Operations
Our business consists of three operating segments: (1) Floaters, which includes our drillships and semisubmersible rigs, (2) Jackups and (3) Other, which consists of management services on rigs owned by third-parties. Our two reportable segments, Floaters and Jackups, provide one service, contract drilling.
We currently own an offshore drilling rig fleet of 74 rigs, including six rigs under construction. Our rig fleet includes ten drillships, 13 dynamically positioned semisubmersible rigs, six moored semisubmersible rigs and 45 jackup rigs. Of our 74 rigs, 20 are currently located in the North and South America region (excluding Brazil), seven are located in Brazil, 11 are located in the Europe and Mediterranean region, 16 are located in the Middle East and Africa region and 20 are located in the Asia Pacific rim region. Our drilling rigs drill and complete oil and natural gas wells. Demand for our drilling services is based upon many factors beyond our control. See “Item 1A. Risk Factors - The success of our business largely depends on the level of activities in the oil and gas industry, which can be significantly affected by volatile oil and natural gas prices.”
Our drilling contracts are the result of negotiations with our customers, and most contracts are awarded upon competitive bidding. Our drilling contracts generally contain the following commercial terms:
• contract duration extending over a specific period of time or a period necessary to drill one or more wells,
• term extension options in favor of our customer, generally exercisable upon advance notice to us, at mutually agreed, indexed or fixed rates,
• provisions permitting early termination of the contract (i) if the rig is lost or destroyed or (ii) by the customer if operations are suspended for a specified period of time due to breakdown of major rig equipment, unsatisfactory performance, "force majeure" events beyond the control of either party or other specified conditions,
• payment of compensation to us (generally in U.S. dollars although some contracts require a portion of the compensation to be paid in local currency) on a "day work" basis such that we receive a fixed amount for each day ("day rate") that the drilling unit is operating under contract (lower rates or no payments ("zero rate") generally apply during periods of equipment breakdown and repair or in the event operations are suspended or interrupted by other specified conditions, some of which may be beyond our control),
• payment by us of the operating expenses of the drilling unit, including crew labor and incidental rig supply costs, and
• provisions in term contracts allowing us to recover certain labor and other operating cost increases from our customers through day rate adjustment or otherwise.
In addition, some of our drilling contracts permit early termination of the contract by the customer for convenience (without cause), generally exercisable upon advance notice and in some cases without making an early termination payment to us. Financial information regarding our operating segments and geographic regions is presented in Note 13 to our consolidated financial statements included in "Item 8. Financial Statements and Supplementary Data." Additional financial information regarding our operating segments is presented in "Item 7. Management's Discussion and Analysis of Financial Condition and Results of Operations."
7
Backlog Information
Our contract drilling backlog reflects firm commitments, typically represented by signed drilling contracts, and was calculated by multiplying the contracted day rate by the contract period. The contracted day rate excludes certain types of lump sum fees for rig mobilization, demobilization, contract preparation, as well as customer reimbursables, bonus opportunities and amortization of drilling contract intangibles included in “Item 8. Financial Statements and Supplementary Data.” Contract backlog includes drilling contracts signed after each respective balance sheet date but prior to filing each of our annual reports on Form 10-K on February 26, 2014 and February 21, 2013, respectively.
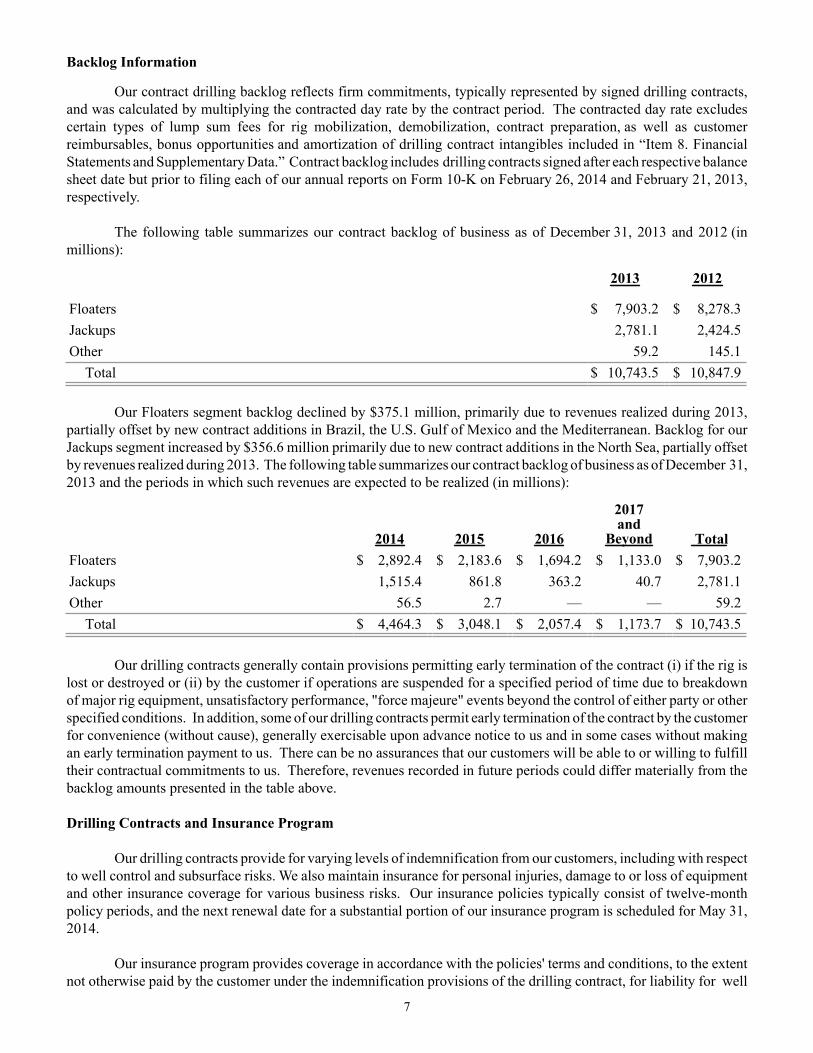
The following table summarizes our contract backlog of business as of December 31, 2013 and 2012 (in millions):
2013 2012
Floaters $ 7,903.2 $ 8,278.3Jackups 2,781.1 2,424.5Other 59.2 145.1
Total $ 10,743.5 $ 10,847.9
Our Floaters segment backlog declined by $375.1 million, primarily due to revenues realized during 2013, partially offset by new contract additions in Brazil, the U.S. Gulf of Mexico and the Mediterranean. Backlog for our Jackups segment increased by $356.6 million primarily due to new contract additions in the North Sea, partially offset by revenues realized during 2013. The following table summarizes our contract backlog of business as of December 31, 2013 and the periods in which such revenues are expected to be realized (in millions):
2014 2015 2016
2017and
Beyond TotalFloaters $ 2,892.4 $ 2,183.6 $ 1,694.2 $ 1,133.0 $ 7,903.2Jackups 1,515.4 861.8 363.2 40.7 2,781.1Other 56.5 2.7 — — 59.2
Total $ 4,464.3 $ 3,048.1 $ 2,057.4 $ 1,173.7 $ 10,743.5 Our drilling contracts generally contain provisions permitting early termination of the contract (i) if the rig is lost or destroyed or (ii) by the customer if operations are suspended for a specified period of time due to breakdown of major rig equipment, unsatisfactory performance, "force majeure" events beyond the control of either party or other specified conditions. In addition, some of our drilling contracts permit early termination of the contract by the customer for convenience (without cause), generally exercisable upon advance notice to us and in some cases without making an early termination payment to us. There can be no assurances that our customers will be able to or willing to fulfill their contractual commitments to us. Therefore, revenues recorded in future periods could differ materially from the backlog amounts presented in the table above.
Drilling Contracts and Insurance Program
Our drilling contracts provide for varying levels of indemnification from our customers, including with respect to well control and subsurface risks. We also maintain insurance for personal injuries, damage to or loss of equipment and other insurance coverage for various business risks. Our insurance policies typically consist of twelve-month policy periods, and the next renewal date for a substantial portion of our insurance program is scheduled for May 31, 2014.
Our insurance program provides coverage in accordance with the policies' terms and conditions, to the extent not otherwise paid by the customer under the indemnification provisions of the drilling contract, for liability for well
8
control events, third-party claims arising from named windstorms and other third-party claims relating to our operations, including wrongful death and other personal injury claims by our personnel as well as claims brought on behalf of individuals who are not our employees. Generally, our program provides liability coverage up to $740.0 million, with a per occurrence deductible of $10.0 million or less.
Well control events generally include an unintended flow from the well that cannot be contained by using equipment on site (e.g., a blowout preventer), by increasing the weight of drilling fluid or by diverting the fluids safely into production. Our program provides coverage for third-party liability claims relating to pollution from a well control event up to $890.0 million per occurrence, with the first $150.0 million of such coverage also covering re-drilling of the well and well control costs. Our program also provides coverage for liability resulting from pollution originating from our rigs up to $740.0 million per occurrence. We retain the risk for liability not indemnified by the customer in excess of our insurance coverage. In addition, our insurance program covers only sudden and accidental pollution.
Our insurance program also provides coverage for physical damage to, including total loss or constructive total loss of, our rigs, generally excluding damage arising from a named windstorm in the U.S. Gulf of Mexico. This coverage is based on an agreed amount for each rig, and has a per occurrence deductible for losses ranging from $15.0 million to $25.0 million. With respect to hull and machinery losses arising from U.S. Gulf of Mexico windstorm damage, our insurance program provides $800.0 million of aggregate coverage for ultra-deepwater drillship and semisubmersible hull and machinery losses with a $50.0 million per occurrence deductible. However, due to the significant premium, high deductible and limited coverage, we decided not to purchase windstorm insurance for our jackup rigs in the U.S. Gulf of Mexico. Accordingly, we have retained the risk for windstorm damage to our eight jackup rigs in the U.S. Gulf of Mexico.
Our drilling contracts provide for varying levels of indemnification and allocation of liabilities between our customers and us with respect to loss or damage to property and injury or death to persons arising out of the drilling operations we perform. Under our drilling contracts, liability with respect to personnel and property customarily is allocated so that we and our customers each assume liability for our respective personnel and property. However, in certain drilling contracts we assume liability for damage to our customers' property and the property of other contractors of our customers resulting from our negligence, subject to negotiated caps on a per occurrence or per event basis. In other contracts, we are not indemnified by our customers for damage to their property and the property of their other contractors, or the enforceability of our indemnity may be limited or prohibited by applicable law in cases of gross negligence or willful misconduct. Accordingly, we could be liable for any such damage under applicable law. In addition, our customers typically indemnify us, generally based on replacement cost minus some level of depreciation, for damage to our down-hole equipment, and in some cases for all or a limited amount of the replacement cost of our subsea equipment, unless the damage is caused by our negligence, normal wear and tear, or defects in the equipment.
Our customers typically assume most of the responsibility for and indemnify us from any loss, damage or other liability resulting from pollution or contamination arising from operations under the contract when the source of the pollution originates from the well or reservoir, including clean-up and removal, third-party damages, and fines and penalties, including as a result of blow-outs or cratering of the well. In some drilling contracts, however, we may have liability for third-party damages (including punitive damages) resulting from such pollution or contamination caused by our gross negligence, or, in some cases, ordinary negligence, subject to negotiated caps on a per occurrence or per event basis and/or for the term of the contract or our indemnity may be limited or unenforceable under applicable law in cases of gross negligence or willful misconduct. As a result, we may not be indemnified by our customers for losses or damages caused by pollution or contamination, and we could be liable for such losses or damages under applicable law and for fines and penalties imposed by regulatory authorities, each of which could be substantial. In addition, in substantially all of our contracts, the customer assumes responsibility and indemnifies us for loss or damage to the reservoir, for loss of hydrocarbons escaping from the reservoir and for the costs of bringing the well under control. Further, most of our contracts provide that the customer assumes responsibility and indemnifies us for loss or damage to the well, except when the loss or damage to the well is due to our negligence, in which case most of our contracts provide that the customer's sole remedy is to require us to redrill the lost or damaged portion of the well at a substantially reduced rate.
9
In certain cases, vendors who provide equipment or services to us limit their pollution liability to a specific monetary cap, and we assume the liability above that cap. Typically, in the case of original equipment manufacturers, the cap is a negotiated amount based on mutual agreement of the parties considering the risk profiles and thresholds of each party. However, for smaller vendors, the liability is usually limited to the value, or double the value, of the contract.
We generally indemnify the customer for legal and financial consequences of spills of waste oil, fuels, lubricants, motor oils, pipe dope, paint, solvents, ballast, bilge, garbage, debris, sewage, hazardous waste and other liquids, the discharge of which originates from our rigs or equipment above the surface of the water and in some cases from our subsea equipment. Our contracts generally provide that, in the event of any such spill from our rigs, we are responsible for fines and penalties.
The above description of our insurance program and the indemnification provisions of our drilling contracts is only a summary as of the date hereof and is general in nature. In addition, our drilling contracts are individually negotiated, and the degree of indemnification we receive from operators against the liabilities discussed above can vary from contract to contract, based on market conditions and customer requirements existing when the contract was negotiated and the interpretation and enforcement of applicable law when the claim is adjudicated. Notwithstanding a contractual indemnity from a customer, there can be no assurance that our customers will be financially able to indemnify us or will otherwise honor their contractual indemnity obligations. Our insurance program and the terms of our drilling contracts may change in the future. In addition, the indemnification provisions of our drilling contracts may be subject to differing interpretations, and such provisions may be unenforceable, void or limited by public policy considerations, primarily in situations where the cause of the underlying loss or damage is due to our gross negligence, where punitive damages are attributable to us, or where any fines and/or penalties are imposed directly against us, especially if the fines and/or penalties are punitive in nature. In addition, under the laws of certain jurisdictions, the courts may enforce an indemnity obligation between the contracting parties with respect to claims by a third party where the underlying claim is the result of gross negligence, but will not enforce an indemnity and allow a party to be indemnified for its gross negligence for claims of the other contracting party that is deemed to be a release. The question may ultimately need to be decided by a court or other proceeding taking into consideration the specific contract language, the facts and applicable laws. The law with respect to the enforceability of indemnities varies from jurisdiction to jurisdiction and is unsettled under certain laws that are applicable to our contracts.
Major Customers
We provide our contract drilling services to major international, government-owned and independent oil and gas companies. During 2013, our five largest customers accounted for 45% of consolidated revenues, and Petrobras, our largest customer, accounted for 17% of consolidated revenues.
Competition
The offshore contract drilling industry is highly competitive. Drilling contracts are, for the most part, awarded on a competitive bid basis. Price competition is often the primary factor in determining which contractor is awarded a contract, although quality of service, operational and safety performance, equipment suitability and availability, location of equipment, reputation and technical expertise also are factors. We have numerous competitors in the offshore contract drilling industry that have significant resources.
Governmental Regulation
Our operations are affected by political developments and by laws and regulations that relate directly to the oil and gas industry, including laws and regulations that have or may impose increased financial responsibility and oil spill abatement contingency plan capability requirements. Accordingly, we will be directly affected by the approval and adoption of laws and regulations curtailing exploration and development drilling for oil and natural gas for economic, environmental, safety or other policy reasons. It is also possible that these laws and regulations could adversely affect our operations in the future by significantly increasing our operating costs. See "Item 1A. Risk Factors - Increasing regulatory complexity could adversely impact the costs associated with our offshore drilling operations."
10
Environmental Matters
Our operations are subject to laws and regulations controlling the discharge of materials into the environment, pollution, contamination and hazardous waste disposal or otherwise relating to the protection of the environment. Environmental laws and regulations specifically applicable to our business activities could impose significant liability on us for damages, clean-up costs, fines and penalties in the event of oil spills or similar discharges of pollutants or contaminants into the environment or improper disposal of hazardous waste generated in the course of our operations, which may not be covered by contractual indemnification or insurance and could have a material adverse effect on our financial position, operating results and cash flows. To date, such laws and regulations have not had a material adverse effect on our operating results, and we have not experienced an accident that has exposed us to material liability arising out of or relating to discharges of pollutants into the environment. However, the legislative, judicial and regulatory response to the Macondo well incident could substantially increase our customers' liabilities in respect of oil spills and also could increase our liabilities. In addition to potential increased liabilities, such legislative, judicial or regulatory action could impose increased financial, insurance or other requirements that may adversely impact the entire offshore drilling industry.
The International Convention on Oil Pollution Preparedness, Response and Cooperation, the U.K. Merchant Shipping Act 1995, Marpol 73/78, the U.K. Merchant Shipping (Oil Pollution Preparedness, Response and Cooperation Convention) Regulations 1998 and other related legislation and regulations and the Oil Pollution Act of 1990 ("OPA 90"), as amended, The Clean Water Act, and other U.S. federal statutes applicable to us and our operations, as well as similar statutes in Texas, Louisiana, other coastal states and other non-U.S. jurisdictions, address oil spill prevention, reporting and control and significantly expand liability, fine and penalty exposure across many segments of the oil and gas industry. Such statutes and related regulations impose a variety of obligations on us related to the prevention of oil spills, disposal of waste and liability for resulting damages. For instance, OPA 90 imposes strict and, with limited exceptions, joint and several liability upon each responsible party for oil removal costs as well as a variety of fines, penalties and damages. Similar environmental laws apply in our other areas of operation. Failure to comply with these statutes and regulations, including OPA 90, may subject us to civil or criminal enforcement action, which may not be covered by contractual indemnification or insurance and could have a material adverse effect on our financial position, operating results and cash flows.
Events in recent years, including the Macondo well incident, have heightened governmental and environmental concerns about the oil and gas industry. From time to time, legislative proposals have been introduced that would materially limit or prohibit offshore drilling in certain areas. We are adversely affected by restrictions on drilling in certain areas of the U.S. Gulf of Mexico and elsewhere, including the conditions for lifting the recent moratorium/suspension in the U.S. Gulf of Mexico, the adoption of associated new safety requirements and policies regarding the approval of drilling permits, restrictions on development and production activities in the U.S. Gulf of Mexico and associated Notices to Lessees ("NTLs") that have and may further impact our operations. If new laws are enacted or other government action is taken that restrict or prohibit offshore drilling in our principal areas of operation or impose environmental protection requirements that materially increase the liabilities, financial requirements or operating or equipment costs associated with offshore drilling, exploration, development or production of oil and natural gas, our financial position, operating results and cash flows could be materially adversely affected. See "Item 1A. Risk Factors - Compliance with or breach of environmental laws can be costly and could limit our operations."
Non-U.S. Operations
Revenues from non-U.S. operations were 65%, 70% and 73% of our total consolidated revenues during 2013, 2012 and 2011, respectively. Our non-U.S. operations and shipyard rig construction and enhancement projects are subject to political, economic and other uncertainties, including:
• terrorist acts, war and civil disturbances,
• expropriation, nationalization, deprivation or confiscation of our equipment,
• expropriation or nationalization of a customer's property or drilling rights,
11
• repudiation or nationalization of contracts,
• assaults on property or personnel,
• piracy, kidnapping and extortion demands,
• significant governmental influence over many aspects of local economies,
• unexpected changes in law and regulatory requirements, including changes in interpretation or enforcement of existing laws,
• work stoppages,
• complications associated with repairing and replacing equipment in remote locations,
• limitations on insurance coverage, such as war risk coverage, in certain areas,
• imposition of trade barriers,
• wage and price controls,
• import-export quotas,
• exchange restrictions,
• currency fluctuations,
• changes in monetary policies,
• uncertainty or instability resulting from hostilities or other crises in the Middle East, West Africa, Latin America or other geographic areas in which we operate,
• changes in the manner or rate of taxation,
• limitations on our ability to recover amounts due,
• increased risk of government and vendor/supplier corruption,
• changes in political conditions, and
• other forms of government regulation and economic conditions that are beyond our control.
See "Item 1A. Risk Factors - Our non-U.S. operations involve additional risks not associated with U.S. operations."
12
Executive Officers
Officers generally serve for a one-year term or until successors are elected and qualified to serve. The table below sets forth certain information regarding our principal officers, including our executive officers:
Name Age Position Daniel W. Rabun 59 Chairman, President and Chief Executive OfficerJ. Mark Burns 57 Executive Vice President - Chief Operating OfficerJames W. Swent III 63 Executive Vice President and Chief Financial Officer
(principal financial officer)Steven J. Brady 54 Senior Vice President - Western HemisphereJohn S. Knowlton 54 Senior Vice President - TechnicalP. Carey Lowe 55 Senior Vice President - Eastern HemisphereDavid E. Hensel 47 Senior Vice President - MarketingBrady K. Long 41 Vice President - General Counsel and SecretaryRobert W. Edwards, III 36 Controller (principal accounting officer)
Set forth below is certain additional information on our executive officers, including the business experience of each executive officer for at least the last five years:
Daniel W. Rabun joined Ensco in March 2006 as President and as a member of the Board of Directors. Mr. Rabun was appointed to serve as our Chief Executive Officer effective January 1, 2007 and elected Chairman of the Board of Directors in 2007. Prior to joining Ensco, Mr. Rabun was a partner at the international law firm of Baker & McKenzie LLP where he had practiced law since 1986, except for one year when he served as Vice President, General Counsel and Secretary of a company in Dallas, Texas. Mr. Rabun provided legal advice and counsel to us for over fifteen years before joining Ensco and served as one of our directors during 2001. He has been a Certified Public Accountant since 1976 and a member of the Texas Bar since 1983. Mr. Rabun holds a Bachelor of Business Administration Degree in Accounting from the University of Houston and a Juris Doctorate Degree from Southern Methodist University. He also served as Chairman of the International Association of Drilling Contractors in 2012. On November 13, 2013, we announced Mr. Rabun's retirement. Mr. Rabun will continue to serve in his current role as Chairman of the Board of Directors, President and Chief Executive Officer until the Board of Directors has completed the succession process and a new Chief Executive Officer has been appointed. Mr. Rabun will remain Chairman and a member of the Board through at least the 2014 Annual General Meeting.
J. Mark Burns joined Ensco in 2008 and was appointed to his current position of Executive Vice President and Chief Operating Officer in September 2012. Prior to his current position, Mr. Burns served Ensco as Senior Vice President—Western Hemisphere, Senior Vice President and as President of ENSCO Offshore International Company, a subsidiary of Ensco. Prior to joining Ensco, Mr. Burns served in various international capacities with Noble Corporation (a leading offshore drilling contractor), including his most recent position as Vice President & Division Manager responsible for offshore units located in the Gulf of Mexico. In 2007, Mr. Burns was named IADC Drilling Contractor of the Year. Mr. Burns holds a Bachelor of Arts Degree in Business and Political Science from Sam Houston State University.
James W. Swent III joined Ensco in 2003 and was appointed to his current position of Executive Vice President – Chief Financial Officer in July 2012. Prior to his current position, Mr. Swent served as Senior Vice President – Chief Financial Officer. Prior to joining Ensco, Mr. Swent served as Co-Founder and Managing Director of Amrita Holdings, LLC since 2001. Mr. Swent previously held various financial executive positions in the information technology, telecommunications and manufacturing industries, including positions with Memorex Corporation and Nortel Networks. He served as Chief Financial Officer and Chief Executive Officer of Cyrix Corporation from 1996 to 1997 and Chief Financial Officer and Chief Executive Officer of American Pad and Paper Company from 1998 to 2000. Mr. Swent holds a Bachelor of Science Degree in Finance and a Master Degree in Business Administration from the University of California at Berkeley.
13
Steven J. Brady joined Ensco in 2002 and was appointed to his current position of Senior Vice President – Western Hemisphere in August 2012. Prior to his current position, Mr. Brady served as Vice President – Europe and Mediterranean, General Manager – Middle East and Asia Pacific, and in other leadership positions in the Eastern Hemisphere. Prior to joining Ensco, Mr. Brady spent 18 years in various technical and managerial roles for ConocoPhillips in locations around the world. Mr. Brady holds a Bachelor of Science Degree in Petroleum Engineering from Mississippi State University.
John S. Knowlton joined Ensco in 1998 and was appointed to his current position of Senior Vice President – Technical in May 2011. Prior to his current position, Mr. Knowlton served Ensco as Vice President – Engineering & Capital Projects, General Manager – North & South America, Operations Manager – Asia Pacific Rim, and Operations Manager overseeing the construction and operation of our first ultra-deepwater semisubmersible rig, ENSCO 7500. Before joining Ensco, Mr. Knowlton served in various domestic and international capacities with Ocean Drilling & Exploration Company and Diamond Offshore Drilling, Inc. Mr. Knowlton holds a Bachelor of Science Degree in Civil Engineering from Tulane University.
P. Carey Lowe joined Ensco in 2008 and was appointed to his current position of Senior Vice President – Eastern Hemisphere in May 2011. Prior to his current position, Mr. Lowe served Ensco as Senior Vice President with responsibilities including the Deepwater Business Unit, safety, health and environmental matters, capital projects, engineering and strategic planning. Prior to joining Ensco, Mr. Lowe served as Vice President – Latin America for Occidental Oil & Gas. He also served as President & General Manager, Occidental Petroleum of Qatar Ltd. from 2001 to 2007. Mr. Lowe held various drilling-related management positions with Sedco Forex and Schlumberger Oilfield Services from 1980 to 2000, including Business Manager – Drilling, North and South America and General Manager – Oilfield Services, Saudi Arabia, Bahrain and Kuwait. Following Schlumberger, he was associated with a business-to-business e-procurement company until he joined Occidental during 2001. Mr. Lowe holds a Bachelor of Science Degree in Civil Engineering from Tulane University.
David E. Hensel joined Ensco in 2003 as Director - Marketing. Prior to his current position, he served as Vice President – North and South America (excluding Brazil), General Manager - Administration and Marketing of the Deepwater Business Unit and General Manager - Europe and Africa Business Unit. Before joining the Company, Mr. Hensel served in various senior management positions with Helmerich & Payne International Drilling and Nabors Industries. Mr. Hensel holds a Masters of Business Administration degree in Finance from Rice University and a Bachelor Degree in Materials and Logistic Management from Michigan State University.
Brady K. Long joined Ensco in 2011 as Vice President - General Counsel and Secretary in connection with the acquisition of Pride. Prior to joining Ensco, Mr. Long served as Vice President – General Counsel and Secretary with Pride from 2009 to 2011. He joined Pride in 2005 as Assistant General Counsel and served as Chief Compliance Officer from 2006 to 2009. Mr. Long previously practiced corporate and securities law for BJ Services Company and with the law firm of Bracewell & Giuliani LLP. He holds a Bachelor of Arts Degree from Brigham Young University and a Juris Doctorate Degree from The University of Texas School of Law. Robert W. Edwards, III joined Ensco in September 2007 and was appointed to his current position of Controller in November 2012. Prior to his current position, he served as Director – Corporate Accounting, Director of Finance and Administration – Deepwater Business Unit and Manager- Accounting Public Reporting. From 2001 to 2007, Mr. Edwards served in various capacities as an employee in the audit practice at Deloitte & Touche LLP. Mr. Edwards holds a Bachelor of Science Degree in Business Administration and a Master Degree in Accounting from Trinity University.
Employees
We employed approximately 9,000 personnel worldwide as of February 1, 2014. The majority of our personnel work on rig crews and are compensated on an hourly basis.
14
Available Information
Our Annual Reports on Form 10-K, Quarterly Reports on Form 10-Q, Current Reports on Form 8-K and amendments to these reports that we file or furnish to the SEC in accordance with the Securities Exchange Act of 1934, as amended, are available on our website at www.enscoplc.com. These reports also are available in print without charge by contacting our Investor Relations Department at 713-430-4607 as soon as reasonably practicable after we electronically file the information with, or furnish it to, the SEC. The information contained on our website is not included as part of, or incorporated by reference into, this report. Item 1A. Risk Factors Risks Related to Our Business There are numerous factors that affect our business and operating results, many of which are beyond our control. The following is a description of significant factors that might cause our future operating results to differ materially from those currently expected. The risks described below are not the only risks facing our Company. Additional risks and uncertainties not specified herein, not currently known to us or currently deemed to be immaterial also may materially adversely affect our business, financial position, operating results and/or cash flows.
We may have difficulty obtaining or maintaining insurance in the future on terms we find acceptable and our insurance coverage may not protect us against all of the risks and hazards we face, including those specific to offshore operations.
Our operations are subject to hazards inherent in the offshore drilling industry, such as blowouts, reservoir damage, loss of production, loss of well control, uncontrolled formation pressures, lost or stuck drill strings, equipment failures and mechanical breakdowns, punch throughs, craterings, industrial accidents, fires, explosions, oil spills and pollution. These hazards can cause personal injury or loss of life, severe damage to or destruction of property and equipment, pollution or environmental damage, which could lead to claims by third parties or customers, suspension of operations and contract terminations. Our fleet is also subject to hazards inherent in marine operations, either while on-site or during mobilization, such as capsizing, sinking, grounding, collision, damage from severe weather and marine life infestations. Additionally, a security breach of our information systems or other technological failure could lead to a material disruption of our operations, information systems, and/or loss of business information, which could result in an adverse impact to our business. Our drilling contracts provide for varying levels of indemnification from our customers, including with respect to well control and subsurface risks. We also maintain insurance for personal injuries, damage to or loss of equipment and other insurance coverage for various business risks.
We generally identify the operational hazards for which we will procure insurance coverage based on the likelihood of loss, the potential magnitude of loss, the cost of coverage, the requirements of our customer contracts and applicable legal requirements. Although we maintain what we believe to be an appropriate level of insurance covering hazards and risks we currently encounter during our operations, no assurance can be given that we will be able to obtain insurance against all potential risks and hazards.
Furthermore, our insurance carriers may interpret our insurance policies such that they do not cover losses for which we make claims. Our insurance policies may also have exclusions of coverage for some losses. Uninsured exposures may include radiation hazards, certain loss or damage to property onboard our rigs and losses relating to shore-based terrorist acts or strikes.
If we are unable to obtain or maintain adequate insurance at rates and with deductibles or retention amounts that we consider commercially reasonable, we may choose to forgo insurance coverage and retain the associated risk of loss or damage.
15
If a significant accident or other event occurs and is not fully covered by insurance or contractual indemnity, it could adversely affect our financial position, results of operations or cash flows.
The potential for U.S. Gulf of Mexico hurricane related windstorm damage or liabilities could result in uninsured losses and may cause us to alter our operating procedures during hurricane season, which could adversely affect our business.
Certain areas in and near the U.S. Gulf of Mexico experience hurricanes and other extreme weather conditions on a relatively frequent basis. Some of our drilling rigs in the U.S. Gulf of Mexico are located in areas that could cause them to be susceptible to damage and/or total loss by these storms, and we have a larger concentration of jackup rigs in the U.S. Gulf of Mexico than most of our competitors. We currently have eight jackup rigs and eight floaters in the U.S. Gulf of Mexico. Damage caused by high winds and turbulent seas could result in rig loss or damage, termination of drilling contracts for lost or severely damaged rigs or curtailment of operations on damaged drilling rigs with reduced or suspended day rates for significant periods of time until the damage can be repaired. Moreover, even if our drilling rigs are not directly damaged by such storms, we may experience disruptions in our operations due to damage to our customers' platforms and other related facilities in the area. Our drilling operations in the U.S. Gulf of Mexico have been impacted by hurricanes, including the total loss of one jackup rig during 2004, one platform rig during 2005 and two jackup rigs during 2008, with associated losses of contract revenues and potential liabilities.
Insurance companies incurred substantial losses in the offshore drilling, exploration and production industries as a consequence of hurricanes that occurred in the U.S. Gulf of Mexico during 2004, 2005 and 2008. Accordingly, insurance companies have substantially reduced the nature and amount of insurance coverage available for losses arising from named tropical storm or hurricane damage in the U.S. Gulf of Mexico ("windstorm damage") and have dramatically increased the cost of available windstorm coverage. The tight insurance market not only applies to coverage related to U.S. Gulf of Mexico windstorm damage or loss of our drilling rigs, but also impacts coverage for any potential liabilities to third parties associated with property damage, personal injury or death and environmental liabilities, as well as coverage for removal of wreckage and debris associated with hurricane losses. We have no assurance that the tight insurance market for windstorm damage, liabilities and removal of wreckage and debris will not continue into the foreseeable future.
Upon renewal of our annual insurance policies effective May 31, 2013, we obtained $800.0 million of aggregate coverage for floater hull and machinery losses arising from U.S. Gulf of Mexico windstorm damage with a $50.0 million per occurrence deductible. However, due to the significant premium, high deductible and limited coverage, we decided not to purchase windstorm insurance for our jackup rigs in the U.S. Gulf of Mexico. Accordingly, we have retained the risk for loss or damage of our eight jackup rigs in the U.S. Gulf of Mexico arising out of windstorm damage. Our limited windstorm insurance coverage exposes us to a significant level of risk due to jackup rig damage or loss related to severe weather conditions caused by U.S. Gulf of Mexico tropical storms or hurricanes.
We have established operational procedures designed to mitigate risk to our jackup rigs in the U.S. Gulf of Mexico during hurricane season. In addition to procedures designed to better secure the drilling package on jackup rigs, improve jackup leg stability and increase the air gap to position the hull above waves, our procedures involve analysis of prospective drilling locations, which may include enhanced bottom surveys. These procedures may result in a decision to decline to operate on a customer-designated location during hurricane season notwithstanding that the location, water depth and other standard operating conditions are within a rig's normal operating range. Our procedures and the associated regulatory requirements addressing Mobile Offshore Drilling Unit operations in the U.S. Gulf of Mexico during hurricane season, coupled with our decision to retain (self-insure) certain windstorm-related risks, may result in a significant reduction in the utilization of our jackup rigs in the U.S. Gulf of Mexico.
Our annual insurance policies are up for renewal effective May 31, 2014, and any retained exposures for property loss or damage and wreckage and debris removal or other liabilities associated with U.S. Gulf of Mexico tropical storms or hurricanes could have a material adverse effect on our financial position, operating results and cash flows if we sustain significant uninsured or underinsured losses or liabilities as a result of U.S. Gulf of Mexico tropical storms or hurricanes.
16
The success of our business largely depends on the level of activity in the oil and gas industry, which can be significantly affected by volatile oil and natural gas prices.
The success of our business largely depends on the level of activity in offshore oil and natural gas exploration, development and production. Oil and natural gas prices, and market expectations of potential changes in these prices, may significantly affect the level of drilling activity. An actual decline, or the perceived risk of a decline, in oil and/or natural gas prices could cause oil and gas companies to reduce their overall level of activity or spending, in which case demand for our services may decline and revenues may be adversely affected through lower rig utilization and/or lower day rates. Numerous factors may affect oil and natural gas prices and the level of demand for our services, including:
• demand for oil and natural gas,
• expectations regarding future energy prices,
• the ability of the Organization of Petroleum Exporting Countries ("OPEC") to set and maintain production levels and pricing,
• the level of production by non-OPEC countries,
• U.S. and non-U.S. tax policy,
• laws and government regulations that limit, restrict or prohibit exploration and development of oil and natural gas in various jurisdictions,
• advances in exploration and development technology,
• disruption to exploration and development activities due to hurricanes and other severe weather conditions and the risk thereof,
• the cost of exploring for, developing, producing and delivering oil and natural gas,
• rate of discovery of new reserves,
• local and international political, economic and weather conditions,
• the development and exploitation of alternative fuels,
• the worldwide military or political environment, including uncertainty or instability resulting from an escalation or additional outbreak of armed hostilities or other crises in oil or natural gas producing areas of the Middle East or geographic areas in which we operate, or acts of terrorism, and
• global economic conditions.
Any prolonged reduction in oil and natural gas prices will depress the levels of exploration, development and production activity. In addition, continued hostilities in foreign countries and the occurrence or threat of terrorist attacks against the United States or other countries could create downward pressure on the economies of the United States and other countries. Moreover, even during periods of high commodity prices, customers may cancel or curtail their drilling programs, or reduce their levels of capital expenditures for exploration and production for a variety of reasons, including their lack of success in exploration efforts. Advances in onshore exploration and development technologies, particularly with respect to onshore shale plays, could result in our customers allocating more of their capital expenditure budgets to onshore exploration and production activities and less to offshore activities. These factors could cause our revenues and margins to decline, as a result of declines in utilization and day rates, and limit our future growth prospects. Any significant decrease in day rates or utilization of our rigs, particularly our high-specification floaters, could materially reduce our revenues and profitability. In addition, these risks could increase instability in the financial and insurance markets and make it more difficult for us to access capital and to obtain insurance coverage that we consider adequate or are otherwise required by our contracts.
17
Deterioration of the global economy and/or a decline in oil and natural gas prices could cause our customers to reduce spending on exploration and development drilling. These conditions also could cause our customers and/or vendors to fail to fulfill their commitments and/or fund their future operations and obligations, which could have a material adverse effect on our business.
The success of our business largely depends on the level of activity in offshore oil and natural gas exploration and development drilling worldwide. Oil and natural gas prices, and market expectations of potential changes in these prices, significantly impact the level of worldwide drilling activity.
A decline in oil and natural gas prices, whether caused by economic conditions, international or national climate change and/or environmental regulations or other factors, could cause oil and gas companies to reduce their overall level of drilling activity and spending. Disruption in the capital markets could also cause oil and gas companies to reduce their overall level of drilling activity and spending. These conditions could cause our customers and vendors to fail to fulfill their commitments to us.
Historically, when drilling activity and spending decline, utilization and day rates also decline and drilling may be reduced or discontinued, resulting in an oversupply of drilling rigs. The oversupply of drilling rigs will be exacerbated by the entry of newbuild rigs into the market. When idled or stacked, drilling rigs do not earn revenues, but continue to require cash expenditures for crews, fuel, insurance, berthing and associated items.
A decline in oil and natural gas prices, together with a deterioration of the global economy, could substantially reduce demand for drilling rigs and result in a material adverse effect on our financial position, operating results or cash flows.
We may incur asset impairments as a result of future declining demand for offshore drilling rigs. As of December 31, 2013, the carrying value of our property and equipment totaled $14.3 billion, which represented 73% of our total assets. See Note 4 to our consolidated financial statements for additional information on our property and equipment. We evaluate the carrying value of our property and equipment, primarily our drilling rigs, when events or changes in circumstances indicate that the carrying value of such rigs may not be recoverable. The offshore drilling industry historically has been highly cyclical, and it is not unusual for rigs to be unutilized or underutilized for significant periods of time and subsequently resume full or near full utilization when business cycles change. Likewise, during periods of supply and demand imbalance, rigs are frequently contracted at or near cash break-even rates for extended periods of time until day rates increase when the supply/demand balance is restored. However, if the global economy were to deteriorate and/or the offshore drilling industry were to incur a significant prolonged downturn, impairment charges may occur with respect to specific individual rigs, groups of rigs, such as a specific type of drilling rig, or rigs in a certain geographic location. As of December 31, 2013, the carrying value of our goodwill totaled $3.3 billion, which represented 17% of total assets. See Note 1 to our consolidated financial statements for additional information on our goodwill. We test goodwill for impairment on an annual basis or when events or changes in circumstances indicate that a potential impairment exists. The goodwill impairment test requires us to identify reporting units, perform a qualitative assessment of the likelihood that a reporting unit’s carrying value exceeds its estimated fair value, and in certain circumstances estimate each reporting unit's fair value as of the testing date. In most instances, our calculation of the fair value of our reporting units is based on estimates of future discounted cash flows to be generated by our drilling rigs, which reflect management's judgments and assumptions regarding the appropriate risk-adjusted discount rate, as well as future industry conditions and operations, including expected utilization, day rates, expense levels, capital requirements and terminal values for each of our rigs. If the aggregate fair value of our reporting units exceeds our market capitalization, we evaluate the reasonableness of the implied control premium. If we determine the implied control premium is not reasonable, we adjust the discount rate or other assumptions used in our discounted cash flow model and reduce the estimated fair values of our reporting units. If the global economy were to deteriorate and the offshore drilling industry were to incur a significant prolonged downturn, our expectations of future cash flows may decline
18
and could ultimately result in a goodwill impairment. Additionally, a significant decline in the market value of our shares could result in a goodwill impairment.
The offshore contract drilling industry historically has been highly competitive and cyclical, with periods of low demand and excess rig availability that could result in adverse effects on our business.
Our industry is highly competitive, and our contracts are traditionally awarded on a competitive bid basis. Pricing, safety records and competency are key factors in determining which qualified contractor is awarded a job. Rig availability, location and technical ability also can be significant factors in the determination. In addition, consolidations within the oil and gas industry have reduced the number of available customers, resulting in increased competition for projects. Our potential inability to compete successfully may reduce our revenues and profitability.
Financial operating results in the offshore contract drilling industry historically have been very cyclical and primarily are related to the demand for drilling rigs and the available supply of drilling rigs. Demand for rigs is directly related to the regional and worldwide levels of offshore exploration and development spending by oil and gas companies, which is beyond our control. Offshore exploration and development spending may fluctuate substantially from year-to-year and from region-to-region. The supply of offshore drilling rigs has increased in recent years. There are 232 newbuild drillships, semisubmersibles and jackup rigs reported to be on order or under construction with delivery expected by the end of 2020. Approximately 70 of these rigs are scheduled for delivery during 2014 representing an approximate 9% increase in the total worldwide fleet of offshore drilling rigs. There are no assurances that the market in general or a geographic region in particular will be able to fully absorb the supply of new rigs in future periods.
The increase in supply of offshore drilling rigs during 2014 and future periods could result in an oversupply of offshore drilling rigs and could cause a decline in utilization and/or day rates, a situation which could be exacerbated by a decline in demand for drilling rigs. Lower utilization and/or day rates in one or more of the regions in which we operate could adversely affect our revenues and profitability.
Certain events, such as limited availability or non-availability of insurance for certain perils in some geographic areas, rig loss or damage due to hurricanes, blowouts, craterings, punchthroughs and other operational events, may also impact the supply of rigs in a particular market and cause rapid fluctuations in utilization and day rates.
Future periods of reduced demand and/or excess rig supply may require us to idle additional rigs or enter into lower day rate contracts or contracts with less favorable terms. There can be no assurance that the current demand for drilling rigs will not decline in future periods. A decline in demand for drilling rigs or an oversupply of drilling rigs could adversely affect our financial position, operating results and cash flows.
Our non-U.S. operations involve additional risks not associated with U.S. operations.
Revenues from non-U.S. operations were 65%, 70% and 73% of our total revenues during 2013, 2012 and 2011, respectively. Our non-U.S. operations and shipyard rig construction and enhancement projects are subject to political, economic and other uncertainties, including:
• terrorist acts, war and civil disturbances,
• expropriation, nationalization, deprivation or confiscation of our equipment,
• expropriation or nationalization of a customer's property or drilling rights,
• repudiation or nationalization of contracts,
• assaults on property or personnel,
• piracy, kidnapping and extortion demands,
19
• significant governmental influence over many aspects of local economies,
• unexpected changes in law and regulatory requirements, including changes in interpretation or enforcement of existing laws,
• work stoppages, often due to strikes over which we have little or no control,
• complications associated with repairing and replacing equipment in remote locations,
• limitations on insurance coverage, such as war risk coverage, in certain areas,
• imposition of trade barriers,
• wage and price controls,
• import-export quotas,
• exchange restrictions,
• currency fluctuations,
• changes in monetary policies,
• uncertainty or instability resulting from hostilities or other crises in the Middle East, West Africa, Latin America or other geographic areas in which we operate,
• changes in the manner or rate of taxation,
• limitations on our ability to recover amounts due,
• increased risk of government and vendor/supplier corruption,
• increased local content requirements,
• changes in political conditions, and
• other forms of government regulation and economic conditions that are beyond our control.
We historically have maintained insurance coverage and obtained contractual indemnities that protect us from some, but not all, of the risks associated with our non-U.S. operations such as nationalization, deprivation, confiscation, political and war risks. However, there can be no assurance that any particular type of contractual or insurance protection will be available in the future or that we will be able to purchase our desired level of insurance coverage at commercially feasible rates. Moreover, we may initiate a self-insurance program through one or more captive insurance subsidiaries. In circumstances where we have insurance protection for some or all of the risks associated with non-U.S. operations, such insurance may be subject to cancellation on short notice, and it is unlikely that we would be able to remove our rig or rigs from the affected area within the notice period. Accordingly, a significant event for which we are uninsured, underinsured or self-insured, or for which we have not received an enforceable contractual indemnity from a customer, could cause a material adverse effect on our financial position, operating results and cash flows.
We are subject to various tax laws and regulations in substantially all countries in which we operate or have a legal presence. We evaluate applicable tax laws and employ various business structures and operating strategies to obtain the optimal level of taxation on our revenues, income, assets and personnel. Actions by tax authorities that impact our business structures and operating strategies, such as changes to tax treaties, laws and regulations, or the interpretation or repeal of any of the foregoing, changes in the administrative practices and precedents of tax authorities, adverse rulings in connection with audits or otherwise, or other challenges may substantially increase our tax expense.
As required by law, we file periodic tax returns that are subject to review and examination by various revenue agencies within the jurisdictions in which we operate. We cannot predict or provide assurance as to the ultimate outcome of existing or future tax assessments.
20
Our non-U.S. operations also face the risk of fluctuating currency values, which may impact our revenues, operating costs and capital expenditures. We currently conduct contract drilling operations in certain countries that have experienced substantial fluctuations in the value of their currency compared to the U.S. dollar. In addition, some of the countries in which we operate have occasionally enacted exchange controls. Historically, these risks have been limited by invoicing and receiving payment in U.S. dollars (our functional currency) or freely convertible currency and, to the extent possible, by limiting our acceptance of foreign currency to amounts which approximate our expenditure requirements in such currencies. However, there is no assurance that our contracts will contain such terms in the future.
A portion of the costs and expenditures incurred by our non-U.S. operations, including a portion of the construction payments for new rigs, are settled in local currencies, exposing us to risks associated with fluctuation in the value of these currencies relative to the U.S. dollar. We use foreign currency forward contracts to reduce this exposure. However, a relative weakening in the value of the U.S. dollar in relation to the local currencies in these countries may increase our costs and expenditures.
Our non-U.S. operations are also subject to various laws and regulations in countries in which we operate, including laws and regulations relating to the operation of drilling rigs and the requirements for equipment. We may be required to make significant capital expenditures to operate in such countries, which may not be reimbursed by our customers. Governments in some non-U.S. countries have become increasingly active in regulating and controlling the ownership of oil, natural gas and mineral concessions and companies holding concessions, the exploration of oil and natural gas and other aspects of the oil and gas industry in their countries. In addition, government action, including initiatives by OPEC, may continue to cause oil and/or natural gas price volatility. In some areas of the world, government activity has adversely affected the amount of exploration and development work performed by major international oil companies and may continue to do so. Moreover, certain countries accord preferential treatment to local contractors or joint ventures or impose specific quotas for local goods and services, which can increase our operational costs and place us at a competitive disadvantage. There can be no assurance that such laws and regulations or activities will not have a material adverse effect on our future operations. The shipment of goods, services and technology across international borders subjects us to extensive trade laws and regulations. Our import activities are governed by unique customs laws and regulations in each of the countries where we operate. Moreover, many countries, including the United States, control the export and re-export of certain goods, services and technology and impose related export recordkeeping and reporting obligations. Governments also may impose express or de facto economic sanctions against certain countries, persons and other entities that may restrict or prohibit transactions involving such countries, persons and entities.
The laws and regulations concerning import activity, export recordkeeping and reporting, export control and economic sanctions are complex and constantly changing. These laws and regulations may be enacted, amended, enforced or interpreted in a manner materially impacting our operations. Shipments can be delayed and denied export or entry for a variety of reasons, some of which are outside our control and some of which may result from failure to comply with existing legal and regulatory regimes. Shipping delays or denials could cause unscheduled operational downtime. Any failure to comply with applicable legal and regulatory trading obligations also could result in criminal and civil penalties and sanctions, such as fines, imprisonment, exclusion from government contracts, seizure of shipments and loss of import and export privileges.
Our employees, contractors and agents may take actions in violation of our policies and procedures designed to promote compliance with the laws of the jurisdictions in which we operate. Any such violation, even if prohibited by our policies, could have a material adverse effect on our financial position, operating results or cash flows.
21
Rig construction, upgrade and enhancement projects are subject to risks, including delays and cost overruns, which could have a material adverse effect on our operating results. The risks are concentrated because our three ultra-deepwater drillships currently under construction are at a single shipyard in South Korea and our three jackup rigs currently under construction are at a single shipyard in Singapore.
There are 232 new offshore drilling rigs reported to be on order or under construction with expected delivery dates through 2020. As a result, shipyards and third-party equipment vendors are under significant resource constraints to meet delivery obligations. Such constraints may lead to substantial delivery and commissioning delays and/or equipment failures and/or quality deficiencies. Furthermore, new drilling rigs may face start-up or other operational complications following completion of construction work or other unexpected difficulties including equipment failures, design or engineering problems that could result in significant downtime at reduced or zero day rates or the cancellation or termination of drilling contracts.
We currently have three ultra-deepwater drillships and three jackup rigs under construction. In addition, we may construct additional rigs and continue to upgrade the capability and extend the service lives of our existing rigs. Some of these expenditures are unplanned.
Rig construction, upgrade, life extension and repair projects are subject to the risks of delay or cost overruns inherent in any large construction project, including the following:
• failure of third-party equipment to meet quality and/or performance standards,
• delays in equipment deliveries or shipyard construction,
• shortages of materials or skilled labor,
• damage to shipyard facilities or construction work in progress, including damage resulting from fire, explosion, flooding, severe weather, terrorism, war or other armed hostilities,
• unforeseen design or engineering problems, including those relating to the commissioning of newly designed equipment,
• unanticipated actual or purported change orders,
• strikes, labor disputes or work stoppages,
• financial or operating difficulties of equipment vendors or the shipyard while constructing, enhancing, upgrading, improving or repairing a rig or rigs,
• unanticipated cost increases,
• foreign currency exchange rate fluctuations impacting overall cost,
• inability to obtain the requisite permits or approvals,
• client acceptance delays,
• disputes with shipyards and suppliers,
• latent damages or deterioration to hull, equipment and machinery in excess of engineering estimates and assumptions,
• claims of force majeure events, and
• additional risks inherent to shipyard projects in a non-U.S. location.
Our risks are concentrated because our six rigs currently under construction are at two shipyards.
22
Two of our six rigs currently under construction have secured a drilling contract upon completion of construction. These rigs are scheduled to be delivered beginning in the second half of 2014 through first half of 2016. There is no assurance that we will secure drilling contracts for these rigs or future rigs or that the drilling contracts we may be able to secure will be based upon rates and terms that will provide a reasonable rate of return on these investments. Our failure to secure contractual commitments for these rigs at rates and terms that result in a reasonable return upon completion of construction may result in a material adverse effect on our financial position, operating results and cash flows. With respect to our rigs under construction, we are subject to the risk of delays and other hazards that could impact the viability of the contracts and could have a material adverse effect on our financial position, operating results and cash flows.
Our drilling contracts with national oil companies may expose us to greater risks than we normally assume in drilling contracts with non-governmental customers.
We currently have 22 rigs contracted with national oil companies. The terms of these contracts are often non-negotiable and may expose us to greater commercial, political and operational risks than we assume in other contracts, such as exposure to materially greater environmental liability and other claims for damages (including consequential damages) and personal injury related to our operations, or the risk that the contract may be terminated by our customer without cause on short-term notice, contractually or by governmental action, under certain conditions that may not provide us an early termination payment, collection risks and political risks. While we believe that the financial, commercial and risk allocation terms of these contracts and our operating safeguards mitigate these risks, we can provide no assurance that the increased risk exposure will not have an adverse impact on our future operations or that we will not increase the number of rigs contracted to national oil companies with commensurate additional contractual risks.
Legal and regulatory proceedings could affect us adversely.
We are involved in litigation, including various claims, disputes and regulatory proceedings that arise in the ordinary course of business, many of which are uninsured and relate to intellectual property, commercial, operational, employment, regulatory, or other activities. We operate in a number of countries throughout the world, including countries known to have a reputation for corruption and are subject to the U.S. Foreign Corrupt Practices Act of 1977 (“FCPA”), the U.S. Treasury Department's Office of Foreign Assets Control ("OFAC") regulations, the U.K. Bribery Act ("UKBA"), other U.S. laws and regulations governing our international operations and similar laws in other countries.
In 2010, Pride and its subsidiaries resolved with the U.S. Department of Justice (“DOJ”) and the SEC their previously disclosed investigations into potential violations of the FCPA. However, Pride has received preliminary inquiries from governmental authorities of certain of the countries referenced in its settlements with the DOJ and SEC. We could face additional fines, sanctions and other penalties from authorities in these and other relevant jurisdictions, including prohibition of our participating in or curtailment of business operations in those jurisdictions and the seizure of our rigs or other assets. At this early stage of such inquiries, we are unable to determine what, if any, legal liability may result. Our customers in those jurisdictions could seek to impose penalties or take other actions adverse to our interests. We could also face other third-party claims by directors, officers, employees, affiliates, advisors, attorneys, agents, stockholders, debt holders, or other interest holders or constituents of our Company. In addition, disclosure of the subject matter of the investigations and settlements could adversely affect our reputation and our ability to obtain new business or retain existing business from our current clients and potential clients, to attract and retain employees and to access the capital markets.
Any violation of the FCPA, OFAC regulations, the UKBA or other applicable anti-corruption laws, by us, our affiliated entities or their respective officers, directors, employees and agents could result in substantial fines, sanctions, civil and/or criminal penalties and curtailment of operations in certain jurisdictions and could adversely affect our financial condition, results of operations, cash flows or our availability of funds under our revolving credit facility. Further, detecting, investigating, and resolving actual or alleged violations is expensive and can consume significant time and attention of our senior management.
23
Increasing regulatory complexity could adversely impact the costs associated with our offshore drilling operations.
Increases in regulatory requirements, particularly in the U.S. Gulf of Mexico, could significantly increase our costs. In recent years, we have seen several significant regulatory changes that have affected the way we operate in the U.S. Gulf of Mexico.
Hurricanes Katrina and Rita in 2005 and Hurricanes Gustav and Ike in 2008 caused damage to a number of rigs in the Gulf of Mexico. Rigs that were moved off location by the storms damaged platforms, pipelines, wellheads and other drilling rigs. The U.S. Bureau of Ocean Energy Management, Regulation and Enforcement ("BOEMRE"), and one of its successor agencies, the Bureau of Safety and Environmental Enforcement ("BSEE"), have issued guidelines for jackup rig fitness requirements during hurricane seasons, which shall be in effect through at least the 2014 hurricane season. As a result of these BOEMRE guidelines, jackup rigs in the U.S. Gulf of Mexico are required to operate with a higher air gap (the space between the water level and the bottom of the rig's hull) during hurricane season, effectively reducing the water depth in which they can operate. The guidelines also provide for enhanced information and data requirements from oil and gas companies operating in the U.S. Gulf of Mexico. BSEE may take other steps that could increase the cost of operations or reduce the area of operations. Implementation of BSEE guidelines and regulations may subject us to increased costs and limit the operational capabilities of our rigs.
Similarly, as a result of the Macondo well incident in the U.S. Gulf of Mexico, the U.S. Department of the Interior issued Notices to Lessees (“NTLs"), implementing new regulations applicable to drilling operations in the U.S. Gulf of Mexico. In 2011, BSEE issued an interim drilling safety rule formalizing many of the requirements in the NTLs. These regulations provide for certification and verification requirements applicable to drilling activities in the U.S. Gulf of Mexico, and requirements with respect to exploration, development and production activities in the U.S. Gulf of Mexico, including regulations relating to the design of wells and testing of the integrity of wellbores, the use of drilling fluids, the functionality and compatibility of blowout preventers with drilling rigs and rig designs and testing of well control equipment (including third-party inspections), minimum requirements for personnel operating blowout preventers and training in deepwater well control and other safety regulations.
In 2012, BSEE issued the final drilling safety rule, which finalized and made certain revisions to the interim safety rule, including enhancing the description and classification of well-control barriers, defining testing requirements for cement, clarifying requirements for cement, clarifying requirements for installation of dual mechanical barriers and extending requirements for blowout preventers and well-control fluids to well completions, workovers and de-commissioning operations. Current or future NTLs or other rules, directives and regulations may further impact our customers' ability to obtain permits and commence or continue deep or shallow water operations in the U.S. Gulf of Mexico. Future legislative or regulatory enactments may impose new requirements for well control and blowout prevention equipment that could increase our costs and cause delays in our operations due to unavailability of associated equipment.
Also as a result of the Macondo well incident, BOEMRE and BSEE have promulgated regulations regarding safety and environmental management systems ("SEMS"). In 2013, BSEE adopted a final rule modifying the SEMS requirements. Although the SEMS requirements are directed primarily at operators, they have an indirect impact on contractors, including requirements for personnel training, written safe work practices and written agreements with operators regarding the application of the operators and contractors safety and environmental policies at the worksite. In addition, BSEE has stated that it is considering requiring contractors to have their own SEMS programs and that it might address that possibility in future rulemaking. The current SEMS regulations and the possibility of additional SEMS rules for contractors could expose us to increased costs.
In 2012, BSEE also issued an interim policy document for use by BSEE inspectors in issuing incidents of noncompliance (“INCs”) to contractors conducting operations under BSEE jurisdiction on the Outer Continental Shelf of the U.S. Gulf of Mexico. The stated purpose of the policy is to provide for consistency in application of BSEE enforcement authority by establishing guidelines for issuance of INCs to contractors in addition to operators. The policy indicates that BSEE's enforcement actions will continue to focus primarily on lessees and operators, but makes it clear that BSEE will “in appropriate circumstances” also issue INCs to contractors for serious violations of BSEE
24
regulations. It also notes that BSEE began issuing INCs to contractors in 2011, following the Macondo incident. Further, the industry has adopted new standards, including API Standard 53 relating to the maintenance, inspection and testing of well control equipment. The imposition of INCs on contractors exposes us to fines and penalties for violation of BSEE regulations and the new standards expose us to increased costs and loss of revenue.
New regulatory, legislative, permitting or certification requirements in the U.S., including laws and regulations that have or may impose increased financial responsibility, oil spill abatement contingency plan capability requirements, or additional operational requirements and certifications, could materially adversely affect our financial condition, operating results or cash flows.
We anticipate that government regulation in other countries where we operate may follow the U.S. in regard to enhanced safety and environmental regulation, which could also result in governments imposing sanctions on contractors for operators not complying with regulations that impact drilling operations. Even if not a requirement in these countries, most international operating companies, and many others, are voluntarily complying with some or all of the U.S. inspections and safety and environmental guidelines when operating outside the U.S. Such additional governmental regulation and voluntary compliance by operators could increase the cost of our operations and expose us to greater liability.
Laws and governmental regulations may add to costs, limit our drilling activity or reduce demand for our drilling services.
Our operations are affected by political developments and by laws and regulations that relate directly to the oil and gas industry, including initiatives to limit greenhouse gas emissions. The offshore contract drilling industry is dependent on demand for services from the oil and gas industry. Accordingly, we will be directly affected by the approval and adoption of laws and regulations limiting or curtailing exploration and development drilling for oil and natural gas for economic, environmental, safety and other policy reasons. We may be exposed to risks related to new laws or regulations pertaining to climate change, carbon emissions or energy use that could reduce the use of oil or natural gas, thus reducing demand for hydrocarbon-based fuel and our drilling services. Governments also may pass laws or regulations encouraging or mandating the use of alternative energy sources, such as wind power and solar energy, which may reduce demand for oil and natural gas and our drilling services. Furthermore, we may be required to make significant capital expenditures or incur substantial additional costs to comply with new governmental laws and regulations. It is also possible that legislative and regulatory activity could adversely affect our operations by limiting drilling opportunities or significantly increasing our operating costs.
Geopolitical events, terrorist attacks, piracy and military action could affect the markets for our services and have a material adverse effect on our business and cost and availability of insurance.
Geopolitical events have resulted in military actions, terrorist, pirate and other armed attacks, civil unrest, political demonstrations, mass strikes and government responses. Military action by the United States or other nations could escalate, and acts of terrorism, piracy, kidnapping, extortion, acts of war, violence, civil war, or general disorder may initiate or continue. Such acts could be directed against companies such as ours. Such developments have caused instability in the world’s financial and insurance markets in the past. In addition, these developments could lead to increased volatility in prices for oil and natural gas and could affect the markets for our products and services. Insurance premiums could increase and coverage for these kinds of events may be unavailable in the future. Any or all of these effects could have a material adverse effect on our financial position, operating results or cash flows.
25
We may suffer losses if our customers terminate or seek to renegotiate our contracts, if operations are suspended or interrupted or if a rig becomes a total loss.
Our drilling contracts often are subject to termination without cause upon notice by the customer. Although contracts may require the customer to pay an early termination payment in the event of a termination for convenience (without cause), such payment may not fully compensate for the loss of the contract and some of our contracts permit termination by the customer without an early termination payment. In periods of rapid market downturn, our customers may not honor the terms of existing contracts (including contracts for new rigs under construction), may terminate contracts or may seek to renegotiate contract day rates and terms to conform to depressed market conditions.
Drilling contracts customarily specify automatic termination or termination at the option of the customer in the event of a total loss of the drilling rig and often include provisions addressing termination rights or reduction or cessation of day rates if operations are suspended or interrupted for extended periods due to breakdown of major rig equipment, unsatisfactory performance, "force majeure" events beyond the control of either party or other specified conditions. Our financial position, operating results and cash flows may be adversely affected by early termination of contracts, contract renegotiations or cessation of day rates while operations are suspended.
The loss of a significant customer could adversely affect us.
We provide our services to major international, government-owned and independent oil and gas companies. During 2013, our five largest customers accounted for 45% of our consolidated revenues in the aggregate, with our largest customer representing 17% of our consolidated revenues. Our financial position, operating results and cash flows may be materially adversely affected if a major customer terminates its contracts with us, fails to renew its existing contracts with us, requires renegotiation of our contracts or declines to award new contracts to us.
Failure to recruit and retain skilled personnel could adversely affect our operations and financial results.
We require skilled personnel to operate our drilling rigs and to provide technical services and support for our business. Competition for skilled and other labor has intensified as additional, more technically advanced, rigs are added to the worldwide fleet. There are 232 newbuild offshore drilling rigs reported to be on order or under construction with delivery expected by the end of 2020. These rigs will require more workers with specialized training and skills to operate. In periods of high utilization, it is more difficult and costly to recruit and retain qualified employees, especially in foreign countries that require a certain percentage of national employees. Competition for such personnel could increase our future operating expenses, with a resulting reduction in net income, or impact our ability to fully staff and operate our rigs. We may also incur additional costs to provide training for prospective employees for skilled positions on our newer rigs.
We may be required to maintain or increase existing levels of compensation to retain our skilled workforce, especially if our competitors raise their wage rates. Much of the skilled workforce is nearing retirement age, which may impact the availability of skilled personnel. We also are subject to potential legislative or regulatory action that may impact working conditions, paid time off or other conditions of employment. If such labor trends continue, they could further increase our costs or limit our ability to fully staff and operate our rigs and create the potential for more work stoppages, which may be beyond our control.
Unionization efforts and labor regulations in certain countries in which we operate could materially increase our costs or limit our flexibility.
A large percentage of our employees in non-U.S. markets are protected by collective bargaining agreements that require periodic salary negotiations, which usually result in higher personnel expenses and other benefits. Efforts have been made from time to time to unionize other portions of our workforce. In addition, we have been subjected to strikes or work stoppages and other labor disruptions in certain countries. Additional unionization efforts, new collective bargaining agreements or work stoppages could materially increase our costs, reduce our revenues or limit our flexibility.
26
Certain legal obligations require us to contribute certain amounts to retirement funds or other benefit plans and restrict our ability to dismiss employees. Future regulations or court interpretations established in the countries in which we conduct our operations could increase our costs and materially adversely affect our business, financial condition, operating results or cash flows.
Compliance with or breach of environmental laws can be costly and could limit our operations.
Our operations are subject to laws and regulations controlling the discharge of materials into the environment, pollution, contamination and hazardous waste disposal or otherwise relating to the protection of the environment. Environmental laws and regulations specifically applicable to our business activities could impose significant liability on us for damages, clean-up costs, fines and penalties in the event of oil spills or similar discharges of pollutants or contaminants into the environment or improper disposal of hazardous waste generated in the course of our operations. To date, such laws and regulations have not had a material adverse effect on our operating results, and we have not experienced an accident that has exposed us to material liability arising out of or relating to discharges of pollutants into the environment. However, the legislative, judicial and regulatory response to the Macondo well incident could substantially increase our and our customers' liabilities. In addition to potential increased liabilities, such legislative, judicial or regulatory action could impose increased financial, insurance or other requirements that may adversely impact the entire offshore drilling industry. The International Convention on Oil Pollution Preparedness, Response and Cooperation, Marpol 73/78, the U.K. Merchant Shipping Act 1995, the U.K. Merchant Shipping (Oil Pollution Preparedness, Response and Cooperation Convention) Regulations 1998, and other related legislation and regulations and Oil Pollution Act of 1990 ("OPA 90"), the Clean Water Act and other U.S. federal statutes applicable to us and our operations, as well as similar statutes in Texas, Louisiana, other coastal states and other non-U.S. jurisdictions, address oil spill prevention and control and significantly expand liability, fine and penalty exposure across many segments of the oil and gas industry. Such statutes and related regulations impose a variety of obligations on us related to the prevention of oil spills, disposal of waste and liability for resulting damages. For instance, OPA 90 imposes strict and, with limited exceptions, joint and several liability upon each responsible party for oil removal costs as well as a variety of fines, penalties and damages. Although the OPA 90 provides for certain limits of liability, such limits are not applicable where there is any safety violation or where gross negligence is involved. Failure to comply with these statutes and regulations, including OPA 90, may subject us to civil or criminal enforcement action, which may not be covered by contractual indemnification or insurance and could have a material adverse effect on our financial position, operating results and cash flows. Further, remedies under the Clean Water Act and related legislation and the OPA 90 do not preclude claims under state regulations or civil claims for damages to third parties under state laws.
Events in recent years, including the Macondo well incident, have heightened governmental and environmental concerns about the oil and gas industry. From time to time, legislative proposals have been introduced that would materially limit or prohibit offshore drilling in certain areas. We are adversely affected by restrictions on drilling in certain areas of the U.S. Gulf of Mexico and elsewhere, including the conditions for lifting the recent moratorium/ suspension in the U.S. Gulf of Mexico, the adoption of associated new safety requirements and policies regarding the approval of drilling permits, restrictions on development and production activities in the U.S. Gulf of Mexico and associated NTLs, rules, directives and regulations that have and may further impact our operations. If new laws are enacted or other government action is taken that restrict or prohibit offshore drilling in our principal areas of operation or impose environmental protection requirements that materially increase the liabilities, financial requirements or operating or equipment costs associated with offshore drilling, exploration, development or production of oil and natural gas, our financial position, operating results and cash flows could be materially adversely affected.
27
Our debt levels and debt agreement restrictions may limit our liquidity and flexibility in obtaining additional financing and in pursuing other business opportunities. As of December 31, 2013, we had $4.8 billion in total debt outstanding, representing approximately 27% of our total capitalization. Our current indebtedness may have several important effects on our future operations, including:
• a portion of our cash flows from operations will be dedicated to the payment of principal and interest;
• covenants contained in our debt arrangements require us to meet certain financial tests, which may affect our flexibility in planning for, and reacting to, changes in our business and may limit our ability to dispose of assets or place restrictions on the use of proceeds from such dispositions, withstand current or future economic or industry downturns and compete with others in our industry for strategic opportunities; and
• our ability to obtain additional financing to fund working capital requirements, capital expenditures, acquisitions, dividend payments and general corporate or other cash requirements may be limited.
Our ability to maintain a sufficient level of liquidity to meet our financial obligations will be dependent upon our future performance, which will be subject to general economic conditions, industry cycles and financial, business and other factors affecting our operations, many of which are beyond our control. Our future cash flows may be insufficient to meet all of our working capital requirements, debt obligations and contractual commitments, and any insufficiency could negatively impact our business. To the extent we are unable to repay our indebtedness as it becomes due or at maturity with cash on hand or from other sources, we will need to refinance our debt, sell assets or repay the debt with the proceeds from equity offerings. Additional indebtedness or equity financing may not be available to us in the future for the refinancing or repayment of existing indebtedness, or if available, such additional indebtedness or equity financing may not be available on a timely basis, or on terms acceptable to us and within the limitations specified in our then existing debt instruments. In addition, in the event we decide to sell assets, we can provide no assurance as to the timing of any asset sales or the proceeds that could be realized by us from any such asset sale.
We have historically made substantial capital and operating expenditures to maintain our fleet, and we may be required to make significant capital expenditures to maintain our competitiveness, to comply with laws and the applicable regulations and standards of governmental authorities and organizations, or to expand our fleet, each of which could adversely affect our financial condition, result of operations and cash flows.
We have historically made substantial capital and operating expenditures to maintain our fleet. These expenditures could increase as a result of changes in:
• offshore drilling technology
• the cost of labor and materials;
• customer requirements;
• fleet size;
• the cost of replacement parts for existing drilling rigs;
• the geographic location of the drilling rigs;
• length of drilling contracts;
• governmental regulations and maritime self-regulatory organization and technical standards relating to safety, security or the environment; and
• industry standards.
28
Changes in offshore drilling technology, customer requirements for new or upgraded equipment and competition within our industry may require us to make significant capital expenditures in order to maintain our competitiveness. In addition, changes in governmental regulations, relating to safety or equipment standards, as well as compliance with standards imposed by maritime self-regulatory organizations, may require us to make additional unforeseen capital expenditures. As a result, we may be required to take our rigs out of service for extended periods of time, with corresponding losses of revenues, in order to make such alterations or to add such equipment. In the future, market conditions may not justify these expenditures or enable us to operate our older rigs profitably during the remainder of their economic lives.
Additionally, in order to expand our fleet, we may require additional capital in the future. If we are unable to fund capital with cash flows from operations or sales of non-core assets, we may be required to either incur additional borrowings or raise capital through the sale of debt or equity securities. Our ability to access the capital markets may be limited by our financial condition at the time, by changes in laws and regulations (or interpretation thereof) and by adverse market conditions resulting from, among other things, general economic conditions and contingencies and uncertainties that are beyond our control. If we raise funds by issuing equity securities, existing shareholders may experience dilution. Our failure to obtain the funds for necessary future capital expenditures could have a material adverse effect on our business and on our financial condition, results of operations and cash flows.
Significant part or equipment shortages, supplier capacity constraints, supplier production disruptions, supplierquality and sourcing issues or price increases could increase our operating costs, decrease our revenues and adversely impact our operations.
Our reliance on third-party suppliers, manufacturers and service providers to secure equipment, parts, components and sub-systems used in our operations exposes us to potential volatility in the quality, prices and availability of such items. Certain high-specification parts and equipment that we use in our operations may be available only from a small number of suppliers, manufacturers or service providers, or in some cases must be sourced through a single supplier, manufacturer or service provider. Recent industry consolidation has reduced the number of available suppliers. A disruption in the deliveries from such third-party suppliers, manufacturers or service providers, capacity constraints, production disruptions, price increases, quality control issues, recalls or other decreased availability of parts and equipment could adversely affect our ability to meet our commitments to customers, thus adversely impacting our operations and revenues or increase our operating costs.
Our current backlog of contract drilling revenue may not be fully realized, which may have a material adverse effect on our financial position, results of operations or cash flows.
At December 31, 2013, the contract backlog associated with our operations was approximately $10.7 billion. This amount reflects the remaining contractual terms multiplied by the applicable contractual day rate. The contractual day rate may be higher than the actual day rate we receive because of a number of factors, including rig downtime or suspension of operations. Several factors could cause rig downtime or a suspension of operations, many of which are beyond our control, including:
• breakdowns of equipment;
• work stoppages, including labor strikes;
• shortages of material and skilled labor;
• surveys by government and maritime authorities;
• periodic classification surveys;
• severe weather, strong ocean currents or harsh operating conditions; and
• force majeure events.
29
Liquidity issues could lead our customers to go into bankruptcy or could encourage our customers to seek to repudiate, cancel or renegotiate our drilling contracts for various reasons. Some of our drilling contracts permit early termination of the contract by the customer for convenience (without cause), generally exercisable upon advance notice to us and in some cases without making an early termination payment to us. There can be no assurances that our customers will be able to or willing to fulfill their contractual commitments to us. Our inability to realize the full amount of our contract backlog may have a material adverse effect on our financial position, results of operations or cash flows.
Our business will be adversely affected if we are unable to secure contracts on economically favorable terms.
The drilling markets in which we compete frequently experience significant fluctuations in the demand for drilling services, as measured by the level of exploration and development expenditures, and the supply of capable drilling equipment. Our ability to renew expiring contracts or obtain new contracts and the terms of any such contracts will depend on market conditions. We may be unable to renew our expiring contracts or obtain new contracts for the rigs under contracts that have expired or been terminated, and the day rates under any new contracts may be substantially below the existing day rates, which could adversely affect our revenues and profitability.
Our long-term contracts are subject to the risk of cost increases, which could adversely impact our profitability.
In general, our costs increase as the demand for contract drilling services and skilled labor increases. While many of our contracts include cost escalation provisions that allow changes to our day rate based on stipulated cost increases or decreases, the timing and amount earned from these day rate adjustments may differ from our actual increase in costs. During times of reduced demand, reductions in costs may not be immediate as portions of the crew may be required to prepare our rigs for stacking, after which time the crew members are assigned to active rigs or dismissed. Moreover, as our rigs are mobilized from one geographic location to another, the labor and other operating and maintenance costs can vary significantly. In general, labor costs increase primarily due to higher salary levels and inflation. Equipment maintenance expenses fluctuate depending upon the type of activity a drilling rig is performing and the age and condition of the equipment. Contract preparation expenses vary based on the scope and length of contract preparation required.
Risks Related to Our Redomestication to the U.K.
There are risks associated with the issuance and trading of our Class A ordinary shares that were not associated with our ADSs.
In connection with the termination in May 2012 of our ADS facility and the conversion of our outstanding ADSs into Class A ordinary shares, we entered into arrangements with The Depository Trust Company ("DTC") whereby DTC has accepted such shares for deposit, book entry and clearing services. The facilities of DTC are widely-used for rapid electronic transfers of securities between participants within the DTC system, which include numerous major international financial institutions and brokerage firms.
We entered into this structure in part so that transfers of our shares held in book entry form through DTC will not be subject to a charge for stamp duty or stamp duty reserve tax (“SDRT”) in the U.K. Generally, stamp duty and/or SDRT are imposed in the U.K. on certain transfers of chargeable securities (which include shares in companies incorporated in the U.K.) at a rate of 0.5% of the consideration paid for the transfer. Certain transfers of shares to depositaries or into clearance systems, such as DTC, are charged at a higher rate of 1.5%. Eligibility for acceptance of foreign securities for deposit, book entry, clearing or other services is at the discretion of DTC and may be revoked by DTC under the terms of our agreement and in accordance with the rules, procedures and bylaws of DTC. A condition for continued eligibility of our shares is that DTC and its affiliates will not be liable for stamp duty or SDRT. We have indemnified DTC for any liability arising from stamp duty or SDRT.
We have obtained a favorable ruling from Her Majesty's Revenue & Customs ("HMRC") in respect of stamp duty and SDRT in relation to both the conversion and also our arrangement with DTC. Furthermore, following decisions
30
of the European Court of Justice and the U.K. First-tier Tax Tribunal, HMRC has announced that they will not seek to apply a charge to stamp duty or SDRT on the issuance of shares (or, where it is integral to the raising of new capital, the transfer of new shares) into depository receipt or clearance systems, such as DTC. However, it is possible that the U.K. government may change or enact laws applicable to stamp duty or SDRT in response to this decision, which could have a material effect on the cost of trading in our shares. If DTC determines at any time that our shares are not eligible for continued deposit and clearance within its facilities, our shares may become ineligible for continued listing on a U.S. securities exchange or inclusion in the S&P 500, and trading in such shares would be disrupted. In this event, DTC has agreed it will provide us advance notice and assist us, to the extent possible, with efforts to mitigate adverse consequences. While we would pursue alternative arrangements to preserve our listing and maintain trading, any such disruption could have a material adverse effect on the trading price of our Class A ordinary shares and a resulting adverse effect on our financial position, operating results and/or cash flows.
Tax authorities may challenge our tax positions, and we may not be able to realize expected tax benefits. Our tax positions are subject to audit by U.K., U.S. and other foreign tax authorities. Such tax authorities may disagree with our interpretations or assessments of the effects of tax laws, treaties, or regulations or their applicability to our corporate structure or certain transactions we have undertaken. Even if we are successful in maintaining our positions, we may incur significant expenses in defending our position and contesting claims or positions asserted by tax authorities. If we are unsuccessful in defending them, such audits could significantly impact our consolidated effective income tax rate in past or future periods.
We cannot provide any assurances as to what our consolidated effective income tax rate will be because of, among other matters, uncertainty regarding the nature and extent of our business activities in any particular jurisdiction in the future and the tax laws of such jurisdictions, as well as potential changes in U.K., U.S. and other foreign tax laws, regulations or treaties or the interpretation or enforcement thereof, changes in the administrative practices and precedents of tax authorities or any reclassification or other matter (such as changes in applicable accounting rules) that increases the amounts we have provided for income taxes or deferred tax assets and liabilities in our consolidated financial statements. If we are unable to mitigate the negative consequences of any change in law, audit or other matter, this could cause our consolidated effective income tax rate to increase and cause a material adverse effect on our financial position, operating results and/or cash flows.
We have not requested a ruling from HMRC on the U.K. tax aspects of the redomestication, and HMRC may disagree with our conclusion.
We believe that our redomestication to the U.K. in December 2009 did not result in any material U.K. corporation tax liability to Ensco plc, based on relevant U.K. corporation tax law and the current U.K.-U.S. income tax treaty. Further, we believe that we have satisfied all SDRT payment and filing obligations in connection with the issuance and deposit of our Class A ordinary shares into the ADS facility pursuant to the deposit agreement governing the ADS facility.
However, if HMRC disagrees with this view, it may take the position that material U.K. corporation tax or SDRT liabilities or amounts on account thereof are payable by Ensco plc as a result of the redomestication, in which case we expect that we would contest such assessment. If we were unsuccessful in disputing the assessment, the implications could be materially adverse to our financial position, operating results and/or cash flows. We have not requested an HMRC ruling on the U.K. tax aspects of the redomestication, and there can be no assurance that HMRC will agree with our interpretations of U.K. corporation tax law or any related matters associated therewith.
31
Expected financial, logistical and operational benefits of our redomestication to the U.K. may not be realized.
We cannot be assured that all of the goals of the redomestication will be achieved, particularly as achievement of our goals is in many important respects subject to factors that we do not control. These factors include the reactions of U.K. and U.S. tax authorities, the reactions of third parties with whom we enter into contracts and conduct business and the reactions of investors and analysts.
Whether we realize other expected financial benefits of the redomestication will depend on a variety of factors, many of which are beyond our control. These factors include changes in the relative rate of economic growth in the U.K. compared to the U.S., our financial performance in jurisdictions with lower tax rates, foreign currency exchange rate fluctuations, and significant changes in trade, monetary or fiscal policies of the U.K. or the U.S., including changes in taxation or interest rates. It is difficult to predict or quantify the effect of these factors, individually and in the aggregate, in part because the occurrence of any of these events or circumstances may be interrelated. If any of these events or circumstances occur, we may not be able to realize the expected financial benefits of the redomestication, and our expenses may increase to a greater extent than if we had not completed the redomestication.
Realization of the logistical and operational benefits of the redomestication is also dependent on a variety of factors including the geographic regions in which our drilling rigs are deployed, the location of the business unit offices that oversee our global offshore contract drilling operations, the locations of our customers' corporate offices and principal areas of operation and the location of our investors. If events or changes in circumstances occur affecting the aforementioned factors, we may not be able to realize the expected logistical and operational benefits of the redomestication.
Investor enforcement of civil judgments against us may be more difficult.
Because our parent company is now a public limited company incorporated under English law, investors could experience more difficulty enforcing judgments obtained against us in U.S. courts than would have been the case for U.S. judgments obtained against us prior to the redomestication. In addition, it may be more difficult (or impossible) to bring some types of claims against us in courts in England than it would be to bring similar claims against a U.S. company in a U.S. court. We have less flexibility as a U.K. public limited company with respect to certain aspects of capital management than U.S. corporations due to increased shareholder approval requirements.
Directors of a Delaware and other U.S. corporations may issue, without further shareholder approval, shares of common stock authorized in its certificate of incorporation that were not already issued or reserved. The business corporation laws of Delaware and other U.S. states also provide substantial flexibility in establishing the terms of preferred stock. However, English law provides that a board of directors may only allot shares with the prior authorization of an ordinary resolution of the shareholders, which authorization must state the maximum amount of shares that may be allotted under it and specify the date on which it will expire, which must not be more than five years from the date on which the shareholder resolution is passed. An ordinary resolution was passed prior to the effective time of the redomestication in December 2009 to authorize the allotment of additional shares for a five-year term. As this authority will expire in December 2014, an ordinary resolution will be put to shareholders at our next annual shareholder meeting seeking their approval to renew the board's authority to allot additional shares for an additional five-year term.
English law also generally provides shareholders pre-emption rights over new shares that are issued for cash. However, it is possible, where the board of directors is generally authorized to allot shares, to exclude pre-emption rights by a special resolution of the shareholders or by a provision in the articles of association. Such exclusion of pre-emption rights will cease to have effect when the general allotment authority to which it relates is revoked or expires. If the general allotment authority is renewed, the authority excluding pre-emption rights may also be renewed by a special resolution of the shareholders. A special resolution was passed, in conjunction with an allotment authority, to exclude pre-emption rights prior to the effective time of the redomestication in December 2009 for a five-year term. As this
32
authority will expire in December 2014, a special resolution will be put to shareholders at our next annual shareholder meeting seeking their approval to renew the board's authority to exclude pre-emption rights for an additional five-year term.
English law prohibits us from conducting "on-market purchases" as our shares will not be traded on a recognized investment exchange in the U.K. English law also generally prohibits a company from repurchasing its own shares by way of "off-market purchases" without the approval by a special resolution of the shareholders of the terms of the contract by which the purchase(s) is affected. Such approval may only last for a maximum period of five years after the date on which the resolution is passed. A special resolution was passed at the Company's annual shareholder meeting in May 2013 to permit the Company to make "off-market" purchases of its own shares pursuant to certain purchase agreements for a five-year term.
We have no assurances that situations will not arise where such shareholder approval requirements for any of these actions would deprive our shareholders of substantial benefits.
Our articles of association contain anti-takeover provisions.
Certain provisions of our articles of association have anti-takeover effects, such as the ability to issue shares under the Rights Plan (as defined therein). These provisions are intended to ensure that any takeover or change of control of the Company is conducted in an orderly manner, all members of the Company are treated equally and fairly and receive an optimum price for their shares and the long-term success of the Company is safeguarded. Under English law, it may not be possible to implement these provisions in all circumstances.
The Company is not subject to the U.K.'s Code on Takeovers and Mergers (the “Code”).
The Code only applies to an offer for a public company that is registered in the U.K. (or the Channel Islands or the Isle of Man) and securities of which are not admitted to trading on a regulated market in the U.K. (or the Channel Islands or the Isle of Man) if the company is considered by the Takeover Panel to have its place of central management and control in the U.K. (or the Channel Islands or the Isle of Man). This is known as the "residency test." The test for central management and control under the Takeover Code is different from that used by the U.K. tax authorities. Under the Takeover Code, the Panel will look to where the majority of the directors of the company are themselves resident for the purposes of determining where the company has its place of central management and control. Accordingly, the Code does not currently apply to the Company and the Company therefore does not have the benefit of the protections the Code affords, including, but not limited to, the requirement that a person who acquires an interest in shares carrying 30% or more of the voting rights in the Company must make a cash offer to all other shareholders at the highest price paid in the 12 months before the offer was announced.
English law requires that we meet certain additional financial requirements before we declare dividends and return funds to shareholders.
Under English law, we are only able to declare dividends and return funds to our shareholders out of the accumulated distributable reserves on our statutory balance sheet. Distributable reserves are a company’s accumulated, realized profits, so far as not previously utilized by distribution or capitalization, less its accumulated, realized losses, so far as not previously written off in a reduction or reorganization of capital duly made. Realized profits are created through the remittance of profits of certain subsidiaries to our parent company in the form of dividends.
English law also provides that a public company can only make a distribution if, among other things (a) the amount of its net assets (that is, the total excess of assets over liabilities) is not less than the total of its called up share capital and non-distributable reserves and (b) if, and to the extent that, the distribution does not reduce the amount of its net assets to less than that total.
33
We may be unable to remit the profits of our subsidiaries in a timely or tax efficient manner. If at any time we do not have sufficient distributable reserves to declare and pay quarterly dividends, we may undertake a reduction in the capital of the Company to reduce the amount of our share capital and non-distributable reserves and to create a corresponding increase in our distributable reserves out of which future distributions to shareholders can be made. To comply with English law, a reduction of capital would be subject to (a) approval of shareholders at the annual shareholder meeting by special resolution; (b) confirmation by an order of the English Courts and (c) the Court order being delivered to and registered by the Registrar of Companies in England. If we were to pursue a reduction of capital of the Company as a course of action, and failed to obtain the necessary approvals from shareholders and the English Courts, we may undertake other efforts to allow the Company to declare dividends and return funds to shareholders.
The U.K. government has proposed changes to the taxation of oil and gas bareboat chartering which could adversely affect our financial position, results of operations and cash flows.
The U.K. government has proposed tax reforms to ensure that more of the profits generated by offshore drilling contractors in the U.K. are subject to U.K. taxation. As currently proposed, the reforms would limit the amount of certain types of lease payments that can be deducted for U.K. tax purposes. In addition, the reforms would prohibit taxable profits from operations on the U.K. Continental Shelf from being reduced by unrelated losses or expenses. If the proposed tax reforms are implemented, they could adversely affect our financial position, results of operations and cash flows.
Item 1B. Unresolved Staff Comments
None.
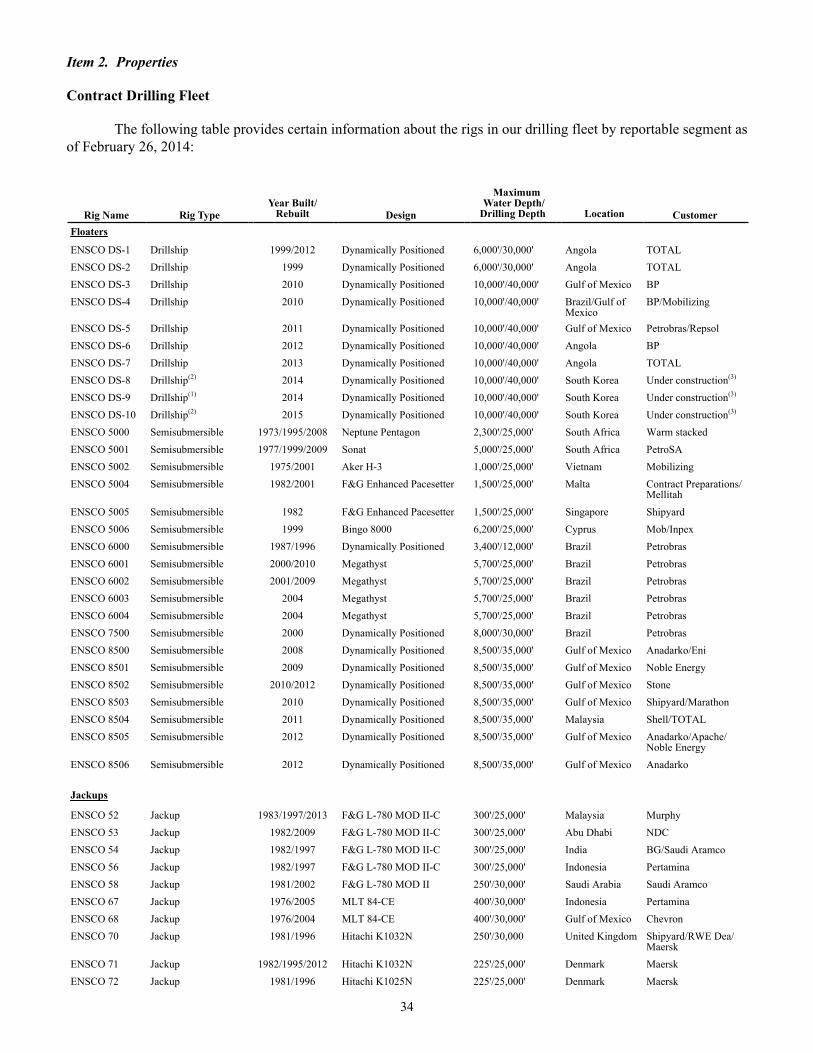
34
Item 2. Properties
Contract Drilling Fleet
The following table provides certain information about the rigs in our drilling fleet by reportable segment as of February 26, 2014:
Rig Name
Rig Type
Year Built/
Rebuilt
Design
Maximum Water Depth/Drilling Depth
Location
Customer Floaters ENSCO DS-1 Drillship 1999/2012 Dynamically Positioned 6,000'/30,000' Angola TOTALENSCO DS-2 Drillship 1999 Dynamically Positioned 6,000'/30,000' Angola TOTALENSCO DS-3 Drillship 2010 Dynamically Positioned 10,000'/40,000' Gulf of Mexico BPENSCO DS-4 Drillship 2010 Dynamically Positioned 10,000'/40,000' Brazil/Gulf of
MexicoBP/Mobilizing
ENSCO DS-5 Drillship 2011 Dynamically Positioned 10,000'/40,000' Gulf of Mexico Petrobras/RepsolENSCO DS-6 Drillship 2012 Dynamically Positioned 10,000'/40,000' Angola BPENSCO DS-7 Drillship 2013 Dynamically Positioned 10,000'/40,000' Angola TOTALENSCO DS-8 Drillship(2) 2014 Dynamically Positioned 10,000'/40,000' South Korea Under construction(3)
ENSCO DS-9 Drillship(1) 2014 Dynamically Positioned 10,000'/40,000' South Korea Under construction(3)
ENSCO DS-10 Drillship(2) 2015 Dynamically Positioned 10,000'/40,000' South Korea Under construction(3)
ENSCO 5000 Semisubmersible 1973/1995/2008 Neptune Pentagon 2,300'/25,000' South Africa Warm stackedENSCO 5001 Semisubmersible 1977/1999/2009 Sonat 5,000'/25,000' South Africa PetroSAENSCO 5002 Semisubmersible 1975/2001 Aker H-3 1,000'/25,000' Vietnam MobilizingENSCO 5004 Semisubmersible 1982/2001 F&G Enhanced Pacesetter 1,500'/25,000' Malta Contract Preparations/
MellitahENSCO 5005 Semisubmersible 1982 F&G Enhanced Pacesetter 1,500'/25,000' Singapore ShipyardENSCO 5006 Semisubmersible 1999 Bingo 8000 6,200'/25,000' Cyprus Mob/InpexENSCO 6000 Semisubmersible 1987/1996 Dynamically Positioned 3,400'/12,000' Brazil PetrobrasENSCO 6001 Semisubmersible 2000/2010 Megathyst 5,700'/25,000' Brazil PetrobrasENSCO 6002 Semisubmersible 2001/2009 Megathyst 5,700'/25,000' Brazil PetrobrasENSCO 6003 Semisubmersible 2004 Megathyst 5,700'/25,000' Brazil PetrobrasENSCO 6004 Semisubmersible 2004 Megathyst 5,700'/25,000' Brazil PetrobrasENSCO 7500 Semisubmersible 2000 Dynamically Positioned 8,000'/30,000' Brazil PetrobrasENSCO 8500 Semisubmersible 2008 Dynamically Positioned 8,500'/35,000' Gulf of Mexico Anadarko/EniENSCO 8501 Semisubmersible 2009 Dynamically Positioned 8,500'/35,000' Gulf of Mexico Noble EnergyENSCO 8502 Semisubmersible 2010/2012 Dynamically Positioned 8,500'/35,000' Gulf of Mexico StoneENSCO 8503 Semisubmersible 2010 Dynamically Positioned 8,500'/35,000' Gulf of Mexico Shipyard/MarathonENSCO 8504 Semisubmersible 2011 Dynamically Positioned 8,500'/35,000' Malaysia Shell/TOTALENSCO 8505 Semisubmersible 2012 Dynamically Positioned 8,500'/35,000' Gulf of Mexico Anadarko/Apache/
Noble EnergyENSCO 8506 Semisubmersible 2012 Dynamically Positioned 8,500'/35,000' Gulf of Mexico Anadarko
Jackups ENSCO 52 Jackup 1983/1997/2013 F&G L-780 MOD II-C 300'/25,000' Malaysia MurphyENSCO 53 Jackup 1982/2009 F&G L-780 MOD II-C 300'/25,000' Abu Dhabi NDCENSCO 54 Jackup 1982/1997 F&G L-780 MOD II-C 300'/25,000' India BG/Saudi AramcoENSCO 56 Jackup 1982/1997 F&G L-780 MOD II-C 300'/25,000' Indonesia PertaminaENSCO 58 Jackup 1981/2002 F&G L-780 MOD II 250'/30,000' Saudi Arabia Saudi AramcoENSCO 67 Jackup 1976/2005 MLT 84-CE 400'/30,000' Indonesia PertaminaENSCO 68 Jackup 1976/2004 MLT 84-CE 400'/30,000' Gulf of Mexico ChevronENSCO 70 Jackup 1981/1996 Hitachi K1032N 250'/30,000 United Kingdom Shipyard/RWE Dea/
MaerskENSCO 71 Jackup 1982/1995/2012 Hitachi K1032N 225'/25,000' Denmark MaerskENSCO 72 Jackup 1981/1996 Hitachi K1025N 225'/25,000' Denmark Maersk
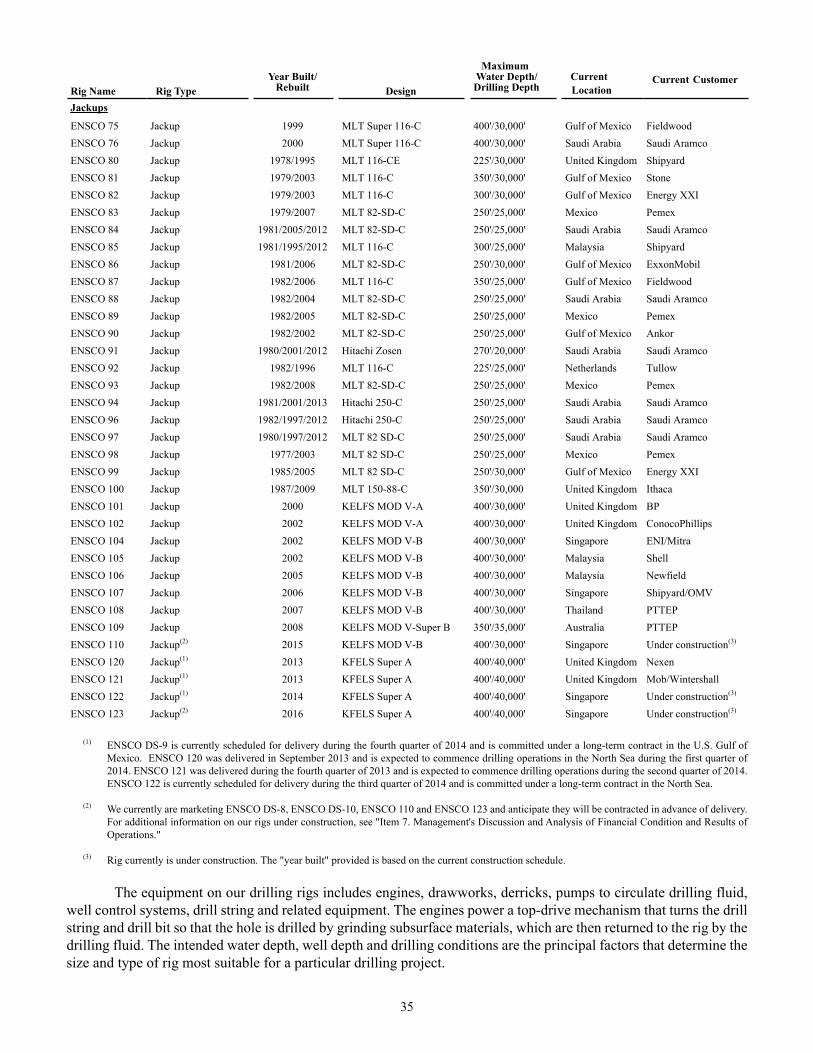
35
Rig Name
Rig Type
Year Built/
Rebuilt
Design
Maximum Water Depth/Drilling Depth
Current Location
Current Customer
Jackups ENSCO 75 Jackup 1999 MLT Super 116-C 400'/30,000' Gulf of Mexico FieldwoodENSCO 76 Jackup 2000 MLT Super 116-C 400'/30,000' Saudi Arabia Saudi AramcoENSCO 80 Jackup 1978/1995 MLT 116-CE 225'/30,000' United Kingdom ShipyardENSCO 81 Jackup 1979/2003 MLT 116-C 350'/30,000' Gulf of Mexico StoneENSCO 82 Jackup 1979/2003 MLT 116-C 300'/30,000' Gulf of Mexico Energy XXIENSCO 83 Jackup 1979/2007 MLT 82-SD-C 250'/25,000' Mexico PemexENSCO 84 Jackup 1981/2005/2012 MLT 82-SD-C 250'/25,000' Saudi Arabia Saudi AramcoENSCO 85 Jackup 1981/1995/2012 MLT 116-C 300'/25,000' Malaysia ShipyardENSCO 86 Jackup 1981/2006 MLT 82-SD-C 250'/30,000' Gulf of Mexico ExxonMobilENSCO 87 Jackup 1982/2006 MLT 116-C 350'/25,000' Gulf of Mexico FieldwoodENSCO 88 Jackup 1982/2004 MLT 82-SD-C 250'/25,000' Saudi Arabia Saudi AramcoENSCO 89 Jackup 1982/2005 MLT 82-SD-C 250'/25,000' Mexico PemexENSCO 90 Jackup 1982/2002 MLT 82-SD-C 250'/25,000' Gulf of Mexico AnkorENSCO 91 Jackup 1980/2001/2012 Hitachi Zosen 270'/20,000' Saudi Arabia Saudi AramcoENSCO 92 Jackup 1982/1996 MLT 116-C 225'/25,000' Netherlands TullowENSCO 93 Jackup 1982/2008 MLT 82-SD-C 250'/25,000' Mexico PemexENSCO 94 Jackup 1981/2001/2013 Hitachi 250-C 250'/25,000' Saudi Arabia Saudi AramcoENSCO 96 Jackup 1982/1997/2012 Hitachi 250-C 250'/25,000' Saudi Arabia Saudi AramcoENSCO 97 Jackup 1980/1997/2012 MLT 82 SD-C 250'/25,000' Saudi Arabia Saudi AramcoENSCO 98 Jackup 1977/2003 MLT 82 SD-C 250'/25,000' Mexico PemexENSCO 99 Jackup 1985/2005 MLT 82 SD-C 250'/30,000' Gulf of Mexico Energy XXIENSCO 100 Jackup 1987/2009 MLT 150-88-C 350'/30,000 United Kingdom IthacaENSCO 101 Jackup 2000 KELFS MOD V-A 400'/30,000' United Kingdom BPENSCO 102 Jackup 2002 KELFS MOD V-A 400'/30,000' United Kingdom ConocoPhillipsENSCO 104 Jackup 2002 KELFS MOD V-B 400'/30,000' Singapore ENI/MitraENSCO 105 Jackup 2002 KELFS MOD V-B 400'/30,000' Malaysia ShellENSCO 106 Jackup 2005 KELFS MOD V-B 400'/30,000' Malaysia NewfieldENSCO 107 Jackup 2006 KELFS MOD V-B 400'/30,000' Singapore Shipyard/OMVENSCO 108 Jackup 2007 KELFS MOD V-B 400'/30,000' Thailand PTTEPENSCO 109 Jackup 2008 KELFS MOD V-Super B 350'/35,000' Australia PTTEPENSCO 110 Jackup(2) 2015 KELFS MOD V-B 400'/30,000' Singapore Under construction(3)
ENSCO 120 Jackup(1) 2013 KFELS Super A 400'/40,000' United Kingdom NexenENSCO 121 Jackup(1) 2013 KFELS Super A 400'/40,000' United Kingdom Mob/WintershallENSCO 122 Jackup(1) 2014 KFELS Super A 400'/40,000' Singapore Under construction(3)
ENSCO 123 Jackup(2) 2016 KFELS Super A 400'/40,000' Singapore Under construction(3)
(1) ENSCO DS-9 is currently scheduled for delivery during the fourth quarter of 2014 and is committed under a long-term contract in the U.S. Gulf of Mexico. ENSCO 120 was delivered in September 2013 and is expected to commence drilling operations in the North Sea during the first quarter of 2014. ENSCO 121 was delivered during the fourth quarter of 2013 and is expected to commence drilling operations during the second quarter of 2014. ENSCO 122 is currently scheduled for delivery during the third quarter of 2014 and is committed under a long-term contract in the North Sea.
(2) We currently are marketing ENSCO DS-8, ENSCO DS-10, ENSCO 110 and ENSCO 123 and anticipate they will be contracted in advance of delivery. For additional information on our rigs under construction, see "Item 7. Management's Discussion and Analysis of Financial Condition and Results of Operations."
(3) Rig currently is under construction. The "year built" provided is based on the current construction schedule.
The equipment on our drilling rigs includes engines, drawworks, derricks, pumps to circulate drilling fluid, well control systems, drill string and related equipment. The engines power a top-drive mechanism that turns the drill string and drill bit so that the hole is drilled by grinding subsurface materials, which are then returned to the rig by the drilling fluid. The intended water depth, well depth and drilling conditions are the principal factors that determine the size and type of rig most suitable for a particular drilling project.
36
Floater rigs consist of drillship rigs and semisubmersible rigs. Drillship rigs are maritime vessels that have been outfitted with drilling apparatus. Drillships are self-propelled and can be positioned over a drill site through the use of a computer-controlled propeller or "thruster" (dynamic positioning) system. Our drillships are capable of drilling in water depths of 10,000 feet or less and are suitable for deepwater drilling in remote locations because of their mobility and large load-carrying capacity. Although drillships are most often used for deepwater drilling and exploratory well drilling, drillships can also be used as a platform to carry out well maintenance or completion work such as casing and tubing installation or subsea tree installations. Semisubmersible rigs are floating offshore drilling units with pontoons and columns that partially submerge to a predetermined depth when sea water is permitted to enter the hull. Semisubmersible rigs can be held in a fixed location over the ocean floor either by being anchored to the sea bottom with mooring chains (moored semisubmersible rig) or dynamically positioned by computer-controlled propellers or "thrusters" (dynamically positioned semisubmersible rig) similar to that used by our drillships. Moored semisubmersible rigs are most commonly used for drilling in water depths of 4,499 feet or less. However, ENSCO 5001 and ENSCO 5006, which are moored semisubmersible rigs, are capable of deepwater drilling in water depths greater than 5,000 feet. ENSCO 7500, which is capable of drilling in water depths up to 8,000 feet, is a dynamically positioned rig that also can be adapted for moored operations. The rig uses a riser system to manage the drilling fluid and well control equipment located on the ocean floor. Dynamically positioned semisubmersible rigs generally are outfitted for drilling in deeper water depths and are well-suited for deepwater development and exploratory well drilling. Jackup rigs stand on the ocean floor with their hull and drilling equipment elevated above the water on connected leg supports. Jackup rigs are generally preferred over other rig types in shallow water depths of 400 feet or less, primarily because jackup rigs provide a more stable drilling platform with above water well control equipment. Our jackup rigs are of the independent leg design where each leg can be fixed into the ocean floor at varying depths and equipped with a cantilever that allows the drilling equipment to extend outward from the hull over fixed platforms enabling safer drilling of both exploratory and development wells. The jackup rig hull supports the drilling equipment, jacking system, crew quarters, storage and loading facilities, helicopter landing pad and related equipment and supplies. Over the life of a typical rig, many of the major systems are replaced due to normal wear and tear or technological advancements in drilling equipment. We believe all of our rigs are in good condition. As of February 26, 2014, we owned all of the rigs in our fleet. We also manage the drilling operations for two rigs owned by a third-party. We lease our executive offices in London, England in addition to office space in Houston, Texas, Angola, Australia, Denmark, Dubai, Indonesia, Korea, Malaysia, Mexico, Saudi Arabia, Scotland, Singapore, Switzerland and several additional international locations. We own offices and other facilities in Louisiana, Brazil, France and Scotland.
Item 3. Legal Proceedings
Pride FCPA Investigation
During 2010, Pride and its subsidiaries resolved their previously disclosed investigations into potential violations of the FCPA with the DOJ and the SEC. The settlement with the DOJ included a deferred prosecution agreement (the "DPA") between Pride and the DOJ and a guilty plea by Pride Forasol, S.A.S., one of Pride’s subsidiaries, to FCPA-related charges. In November 2012, the DOJ moved (i) to dismiss the charges against Pride and end the DPA one year prior to its scheduled expiration; and (ii) to terminate the unsupervised probation of Pride Forasol, S.A.S. The Court granted the motions.
Pride has received preliminary inquiries from governmental authorities of certain countries referenced in its settlements with the DOJ and SEC. We could face additional fines, sanctions and other penalties from authorities in these and other relevant jurisdictions, including prohibition of our participating in or curtailment of business operations in those jurisdictions and the seizure of rigs or other assets. At this early stage of such inquiries, we are unable to determine what, if any, legal liability may result. Our customers in those jurisdictions could seek to impose penalties
37
or take other actions adverse to our business. We could also face other third-party claims by directors, officers, employees, affiliates, advisors, attorneys, agents, stockholders, debt holders, or other interest holders or constituents of our Company. In addition, disclosure of the subject matter of the investigations and settlements could adversely affect our reputation and our ability to obtain new business or retain existing business from our current clients and potential clients, to attract and retain employees and to access the capital markets.
We cannot currently predict what, if any, actions may be taken by any other applicable government or other authorities or our customers or other third parties or the effect any such actions may have on our financial position, operating results or cash flows.
Asbestos Litigation We and certain subsidiaries have been named as defendants, along with numerous third-party companies as co-defendants, in multi-party lawsuits filed in Mississippi and Louisiana by approximately 100 plaintiffs. The lawsuits seek an unspecified amount of monetary damages on behalf of individuals alleging personal injury or death, primarily under the Jones Act, purportedly resulting from exposure to asbestos on drilling rigs and associated facilities during the 1960s through the 1980s.
In December 2013, we reached an agreement in principle with 58 of the plaintiffs to settle lawsuits filed in Mississippi for a nominal amount. The settlements are subject to the approval of a special master to be appointed by the Court. While we believe the special master's recommendations will be accepted by the plaintiffs and approved by the Court, there can be no assurances as to the ultimate outcome.
We intend to vigorously defend against the remaining claims and have filed responsive pleadings preserving all defenses and challenges to jurisdiction and venue. However, discovery is still ongoing and, therefore, available information regarding the nature of all pending claims is limited. At present, we cannot reasonably determine how many of the claimants may have valid claims under the Jones Act or estimate a range of potential liability exposure, if any. In addition to the pending cases in Mississippi and Louisiana, we have other asbestos or lung injury claims pending against us in litigation in other jurisdictions. Although we do not expect the final disposition of these asbestos or lung injury lawsuits to have a material adverse effect upon our financial position, operating results or cash flows, there can be no assurances as to the ultimate outcome of the lawsuits.
Environmental Matters We are currently subject to pending notices of assessment relating to spills of drilling fluids, oil, chemicals, grease or fuel from drilling rigs operating offshore Brazil from 2008 to 2013, pursuant to which the governmental authorities have assessed, or are anticipated to assess, fines in an aggregate amount of approximately $250,000. We have contested these notices and appealed certain adverse decisions and are awaiting decisions in these cases. Although we do not expect final disposition of these assessments to have a material adverse effect on our financial position, operating results or cash flows, there can be no assurance as to the ultimate outcome of these assessments. A $250,000 liability related to these matters was included in accrued liabilities and other on our consolidated balance sheet as of December 31, 2013. We currently are subject to a pending administrative proceeding initiated during 2009 by a Spanish government authority seeking payment in an aggregate amount of approximately $4.0 million for an alleged environmental spill originating from ENSCO 5006 while it was operating offshore Spain. Our customer has posted guarantees with the Spanish government to cover potential penalties. Additionally, we expect to be indemnified for any payments resulting from this incident by our customer under the terms of the drilling contract. A criminal investigation of the incident was initiated during 2010 by a prosecutor in Tarragona, Spain, and the administrative proceedings have been suspended pending the outcome of this investigation. We do not know at this time what, if any, involvement we may have in this investigation.
38
We intend to vigorously defend ourselves in the administrative proceeding and any criminal investigation. At this time, we are unable to predict the outcome of these matters or estimate the extent to which we may be exposed to any resulting liability. Although we do not expect final disposition of this matter to have a material adverse effect on our financial position, operating results or cash flows, there can be no assurance as to the ultimate outcome of the proceedings.
Other Matters
In addition to the foregoing, we are named defendants or parties in certain other lawsuits, claims or proceedings incidental to our business and are involved from time to time as parties to governmental investigations or proceedings, including matters related to taxation, arising in the ordinary course of business. Although the outcome of such lawsuits or other proceedings cannot be predicted with certainty and the amount of any liability that could arise with respect to such lawsuits or other proceedings cannot be predicted accurately, we do not expect these matters to have a material adverse effect on our financial position, operating results or cash flows.
Item 4. Mine Safety Disclosures Not applicable.
39
PART II
Item 5. Market for Registrant's Common Equity, Related Shareholder Matters and Issuer Purchases of Equity Securities
Market Information The following table provides the high and low sales price of our American depositary shares ("ADSs"), each representing one Class A ordinary share, par value U.S. $0.10 per share, until May 22, 2012 and of our Class A ordinary shares thereafter for each period indicated during the last two fiscal years:
FirstQuarter
SecondQuarter
ThirdQuarter
FourthQuarter
Year
2013 High $ 65.82 $ 64.14 $ 61.96 $ 62.25 $ 65.822013 Low $ 56.78 $ 51.01 $ 53.64 $ 53.49 $ 51.01
2012 High $ 59.90 $ 55.66 $ 61.48 $ 60.73 $ 61.482012 Low $ 46.28 $ 41.63 $ 45.95 $ 53.53 $ 41.63
On May 22, 2012, we terminated our ADS facility and converted our outstanding ADSs into Class A ordinary shares on a one-for-one basis. Our Class A ordinary shares are traded on the NYSE under the ticker symbol "ESV." In connection with the conversion, many of our shareholders now hold shares electronically, all of which are owned by a nominee of The Depository Trust Company. We had 73 holders of record of our shares on February 1, 2014. Dividends The following table provides the quarterly cash dividend per share declared and paid during the last two fiscal years:
FirstQuarter
SecondQuarter
ThirdQuarter
FourthQuarter
Year
2013 $ .50 $ .50 $ .50 $ .75 $ 2.252012 $ .375 $ .375 $ .375 $ .375 $ 1.50 We currently intend to continue paying quarterly dividends for the foreseeable future. However, our Board of Directors may change the timing and payment amount depending on several factors including our profitability, liquidity, financial condition, reinvestment opportunities and capital requirements.
Exchange Controls
There are no U.K. government laws, decrees or regulations that restrict or affect the export or import of capital, including but not limited to, foreign exchange controls on remittance of dividends on our ordinary shares or on the conduct of our operations.
U.K. Taxation The following paragraphs are intended to be a general guide to current U.K. tax law and what is understood to be HMRC practice applying as of the date of this report (both of which are subject to change at any time, possibly with retrospective effect) in respect of the taxation of capital gains, the taxation of dividends paid by us and stamp duty and SDRT on the transfer of our shares. In addition, the following paragraphs relate only to persons who for U.K. tax purposes are beneficial owners of the shares (“shareholders”).
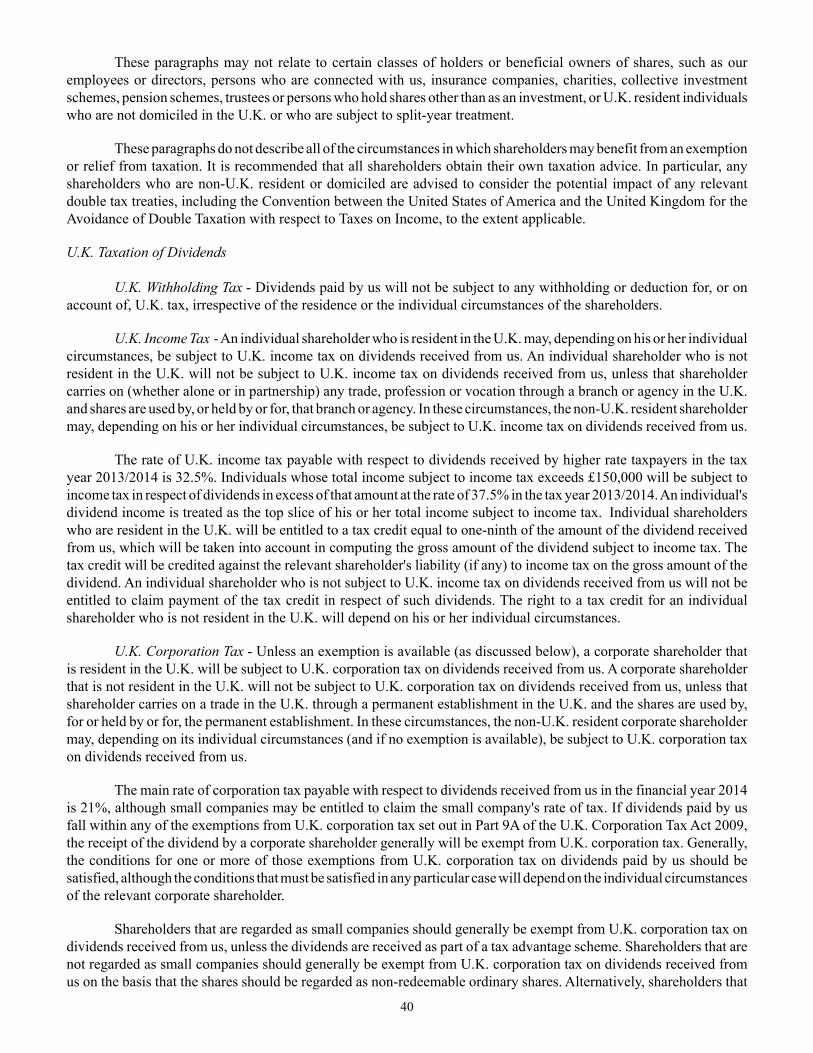
40
These paragraphs may not relate to certain classes of holders or beneficial owners of shares, such as our employees or directors, persons who are connected with us, insurance companies, charities, collective investment schemes, pension schemes, trustees or persons who hold shares other than as an investment, or U.K. resident individuals who are not domiciled in the U.K. or who are subject to split-year treatment.
These paragraphs do not describe all of the circumstances in which shareholders may benefit from an exemption or relief from taxation. It is recommended that all shareholders obtain their own taxation advice. In particular, any shareholders who are non-U.K. resident or domiciled are advised to consider the potential impact of any relevant double tax treaties, including the Convention between the United States of America and the United Kingdom for the Avoidance of Double Taxation with respect to Taxes on Income, to the extent applicable.
U.K. Taxation of Dividends U.K. Withholding Tax - Dividends paid by us will not be subject to any withholding or deduction for, or on account of, U.K. tax, irrespective of the residence or the individual circumstances of the shareholders.
U.K. Income Tax - An individual shareholder who is resident in the U.K. may, depending on his or her individual circumstances, be subject to U.K. income tax on dividends received from us. An individual shareholder who is not resident in the U.K. will not be subject to U.K. income tax on dividends received from us, unless that shareholder carries on (whether alone or in partnership) any trade, profession or vocation through a branch or agency in the U.K. and shares are used by, or held by or for, that branch or agency. In these circumstances, the non-U.K. resident shareholder may, depending on his or her individual circumstances, be subject to U.K. income tax on dividends received from us.
The rate of U.K. income tax payable with respect to dividends received by higher rate taxpayers in the tax year 2013/2014 is 32.5%. Individuals whose total income subject to income tax exceeds £150,000 will be subject to income tax in respect of dividends in excess of that amount at the rate of 37.5% in the tax year 2013/2014. An individual's dividend income is treated as the top slice of his or her total income subject to income tax. Individual shareholders who are resident in the U.K. will be entitled to a tax credit equal to one-ninth of the amount of the dividend received from us, which will be taken into account in computing the gross amount of the dividend subject to income tax. The tax credit will be credited against the relevant shareholder's liability (if any) to income tax on the gross amount of the dividend. An individual shareholder who is not subject to U.K. income tax on dividends received from us will not be entitled to claim payment of the tax credit in respect of such dividends. The right to a tax credit for an individual shareholder who is not resident in the U.K. will depend on his or her individual circumstances. U.K. Corporation Tax - Unless an exemption is available (as discussed below), a corporate shareholder that is resident in the U.K. will be subject to U.K. corporation tax on dividends received from us. A corporate shareholder that is not resident in the U.K. will not be subject to U.K. corporation tax on dividends received from us, unless that shareholder carries on a trade in the U.K. through a permanent establishment in the U.K. and the shares are used by, for or held by or for, the permanent establishment. In these circumstances, the non-U.K. resident corporate shareholder may, depending on its individual circumstances (and if no exemption is available), be subject to U.K. corporation tax on dividends received from us.
The main rate of corporation tax payable with respect to dividends received from us in the financial year 2014 is 21%, although small companies may be entitled to claim the small company's rate of tax. If dividends paid by us fall within any of the exemptions from U.K. corporation tax set out in Part 9A of the U.K. Corporation Tax Act 2009, the receipt of the dividend by a corporate shareholder generally will be exempt from U.K. corporation tax. Generally, the conditions for one or more of those exemptions from U.K. corporation tax on dividends paid by us should be satisfied, although the conditions that must be satisfied in any particular case will depend on the individual circumstances of the relevant corporate shareholder.
Shareholders that are regarded as small companies should generally be exempt from U.K. corporation tax on dividends received from us, unless the dividends are received as part of a tax advantage scheme. Shareholders that are not regarded as small companies should generally be exempt from U.K. corporation tax on dividends received from us on the basis that the shares should be regarded as non-redeemable ordinary shares. Alternatively, shareholders that
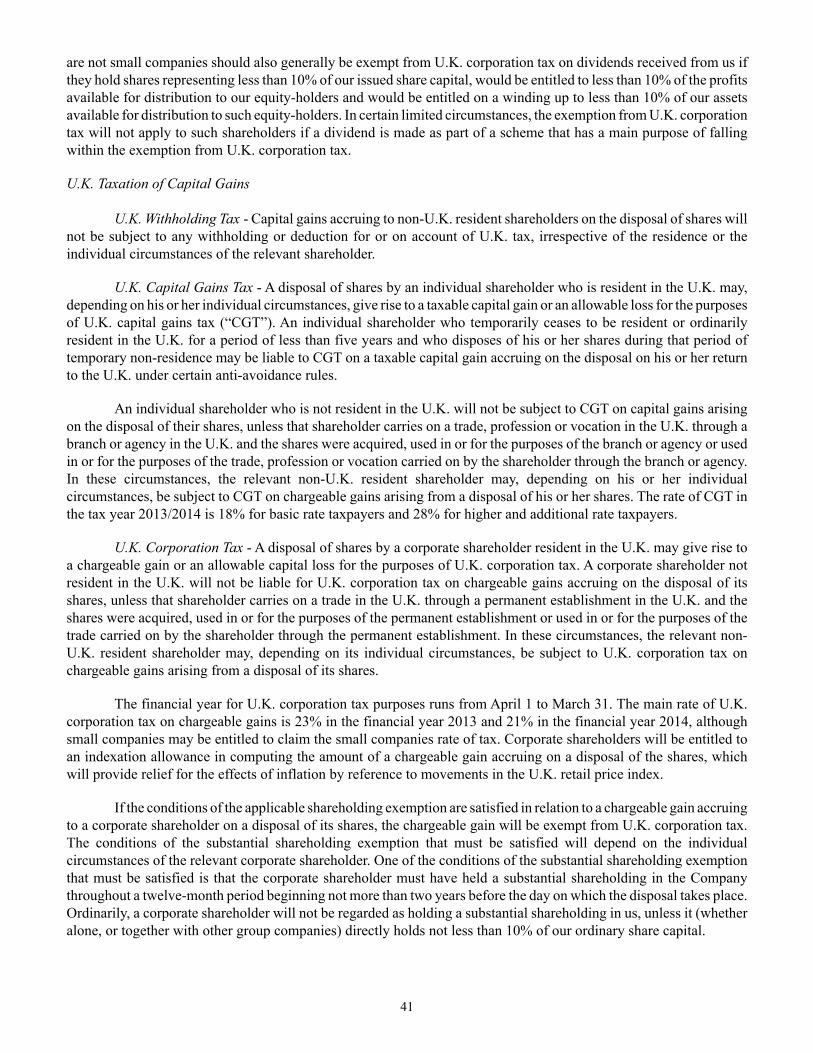
41
are not small companies should also generally be exempt from U.K. corporation tax on dividends received from us if they hold shares representing less than 10% of our issued share capital, would be entitled to less than 10% of the profits available for distribution to our equity-holders and would be entitled on a winding up to less than 10% of our assets available for distribution to such equity-holders. In certain limited circumstances, the exemption from U.K. corporation tax will not apply to such shareholders if a dividend is made as part of a scheme that has a main purpose of falling within the exemption from U.K. corporation tax.
U.K. Taxation of Capital Gains U.K. Withholding Tax - Capital gains accruing to non-U.K. resident shareholders on the disposal of shares will not be subject to any withholding or deduction for or on account of U.K. tax, irrespective of the residence or the individual circumstances of the relevant shareholder.
U.K. Capital Gains Tax - A disposal of shares by an individual shareholder who is resident in the U.K. may, depending on his or her individual circumstances, give rise to a taxable capital gain or an allowable loss for the purposes of U.K. capital gains tax (“CGT”). An individual shareholder who temporarily ceases to be resident or ordinarily resident in the U.K. for a period of less than five years and who disposes of his or her shares during that period of temporary non-residence may be liable to CGT on a taxable capital gain accruing on the disposal on his or her return to the U.K. under certain anti-avoidance rules.
An individual shareholder who is not resident in the U.K. will not be subject to CGT on capital gains arising on the disposal of their shares, unless that shareholder carries on a trade, profession or vocation in the U.K. through a branch or agency in the U.K. and the shares were acquired, used in or for the purposes of the branch or agency or used in or for the purposes of the trade, profession or vocation carried on by the shareholder through the branch or agency. In these circumstances, the relevant non-U.K. resident shareholder may, depending on his or her individual circumstances, be subject to CGT on chargeable gains arising from a disposal of his or her shares. The rate of CGT in the tax year 2013/2014 is 18% for basic rate taxpayers and 28% for higher and additional rate taxpayers.
U.K. Corporation Tax - A disposal of shares by a corporate shareholder resident in the U.K. may give rise to a chargeable gain or an allowable capital loss for the purposes of U.K. corporation tax. A corporate shareholder not resident in the U.K. will not be liable for U.K. corporation tax on chargeable gains accruing on the disposal of its shares, unless that shareholder carries on a trade in the U.K. through a permanent establishment in the U.K. and the shares were acquired, used in or for the purposes of the permanent establishment or used in or for the purposes of the trade carried on by the shareholder through the permanent establishment. In these circumstances, the relevant non-U.K. resident shareholder may, depending on its individual circumstances, be subject to U.K. corporation tax on chargeable gains arising from a disposal of its shares.
The financial year for U.K. corporation tax purposes runs from April 1 to March 31. The main rate of U.K. corporation tax on chargeable gains is 23% in the financial year 2013 and 21% in the financial year 2014, although small companies may be entitled to claim the small companies rate of tax. Corporate shareholders will be entitled to an indexation allowance in computing the amount of a chargeable gain accruing on a disposal of the shares, which will provide relief for the effects of inflation by reference to movements in the U.K. retail price index.
If the conditions of the applicable shareholding exemption are satisfied in relation to a chargeable gain accruing to a corporate shareholder on a disposal of its shares, the chargeable gain will be exempt from U.K. corporation tax. The conditions of the substantial shareholding exemption that must be satisfied will depend on the individual circumstances of the relevant corporate shareholder. One of the conditions of the substantial shareholding exemption that must be satisfied is that the corporate shareholder must have held a substantial shareholding in the Company throughout a twelve-month period beginning not more than two years before the day on which the disposal takes place. Ordinarily, a corporate shareholder will not be regarded as holding a substantial shareholding in us, unless it (whether alone, or together with other group companies) directly holds not less than 10% of our ordinary share capital.
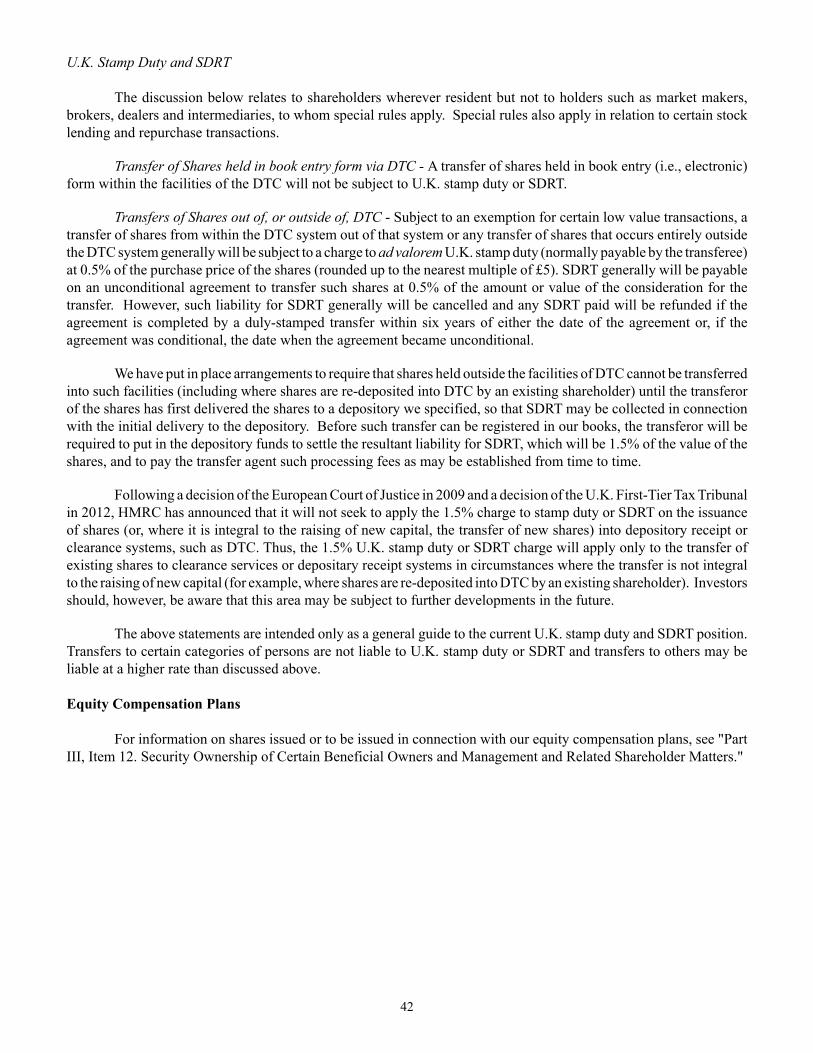
42
U.K. Stamp Duty and SDRT The discussion below relates to shareholders wherever resident but not to holders such as market makers, brokers, dealers and intermediaries, to whom special rules apply. Special rules also apply in relation to certain stock lending and repurchase transactions.
Transfer of Shares held in book entry form via DTC - A transfer of shares held in book entry (i.e., electronic) form within the facilities of the DTC will not be subject to U.K. stamp duty or SDRT.
Transfers of Shares out of, or outside of, DTC - Subject to an exemption for certain low value transactions, a transfer of shares from within the DTC system out of that system or any transfer of shares that occurs entirely outside the DTC system generally will be subject to a charge to ad valorem U.K. stamp duty (normally payable by the transferee) at 0.5% of the purchase price of the shares (rounded up to the nearest multiple of £5). SDRT generally will be payable on an unconditional agreement to transfer such shares at 0.5% of the amount or value of the consideration for the transfer. However, such liability for SDRT generally will be cancelled and any SDRT paid will be refunded if the agreement is completed by a duly-stamped transfer within six years of either the date of the agreement or, if the agreement was conditional, the date when the agreement became unconditional.
We have put in place arrangements to require that shares held outside the facilities of DTC cannot be transferred into such facilities (including where shares are re-deposited into DTC by an existing shareholder) until the transferor of the shares has first delivered the shares to a depository we specified, so that SDRT may be collected in connection with the initial delivery to the depository. Before such transfer can be registered in our books, the transferor will be required to put in the depository funds to settle the resultant liability for SDRT, which will be 1.5% of the value of the shares, and to pay the transfer agent such processing fees as may be established from time to time.
Following a decision of the European Court of Justice in 2009 and a decision of the U.K. First-Tier Tax Tribunal in 2012, HMRC has announced that it will not seek to apply the 1.5% charge to stamp duty or SDRT on the issuance of shares (or, where it is integral to the raising of new capital, the transfer of new shares) into depository receipt or clearance systems, such as DTC. Thus, the 1.5% U.K. stamp duty or SDRT charge will apply only to the transfer of existing shares to clearance services or depositary receipt systems in circumstances where the transfer is not integral to the raising of new capital (for example, where shares are re-deposited into DTC by an existing shareholder). Investors should, however, be aware that this area may be subject to further developments in the future.
The above statements are intended only as a general guide to the current U.K. stamp duty and SDRT position. Transfers to certain categories of persons are not liable to U.K. stamp duty or SDRT and transfers to others may be liable at a higher rate than discussed above. Equity Compensation Plans For information on shares issued or to be issued in connection with our equity compensation plans, see "Part III, Item 12. Security Ownership of Certain Beneficial Owners and Management and Related Shareholder Matters."
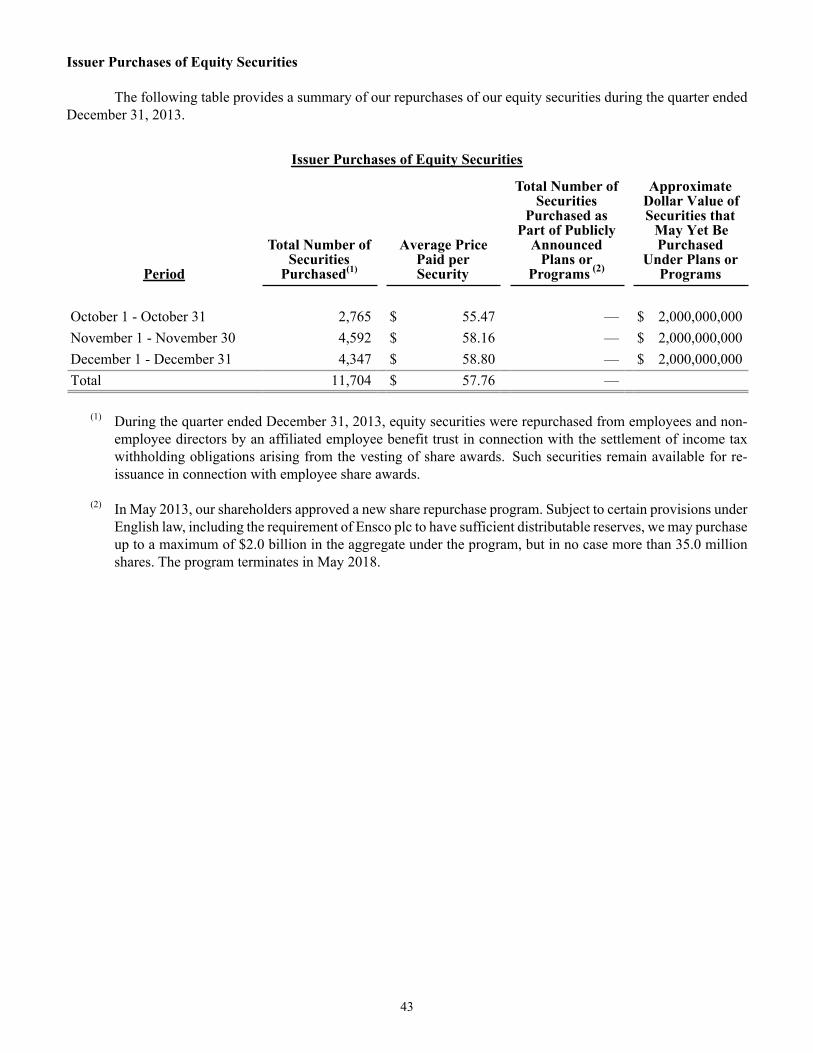
43
Issuer Purchases of Equity Securities The following table provides a summary of our repurchases of our equity securities during the quarter ended December 31, 2013.
Issuer Purchases of Equity Securities
Period
Total Number of Securities
Purchased(1)
Average PricePaid perSecurity
Total Number of Securities
Purchased as Part of Publicly
Announced Plans or
Programs (2)
ApproximateDollar Value ofSecurities that
May Yet BePurchased
Under Plans orPrograms
October 1 - October 31 2,765 $ 55.47 — $ 2,000,000,000November 1 - November 30 4,592 $ 58.16 — $ 2,000,000,000December 1 - December 31 4,347 $ 58.80 — $ 2,000,000,000Total 11,704 $ 57.76 —
(1) During the quarter ended December 31, 2013, equity securities were repurchased from employees and non-employee directors by an affiliated employee benefit trust in connection with the settlement of income tax withholding obligations arising from the vesting of share awards. Such securities remain available for re-issuance in connection with employee share awards.
(2) In May 2013, our shareholders approved a new share repurchase program. Subject to certain provisions under English law, including the requirement of Ensco plc to have sufficient distributable reserves, we may purchase up to a maximum of $2.0 billion in the aggregate under the program, but in no case more than 35.0 million shares. The program terminates in May 2018.
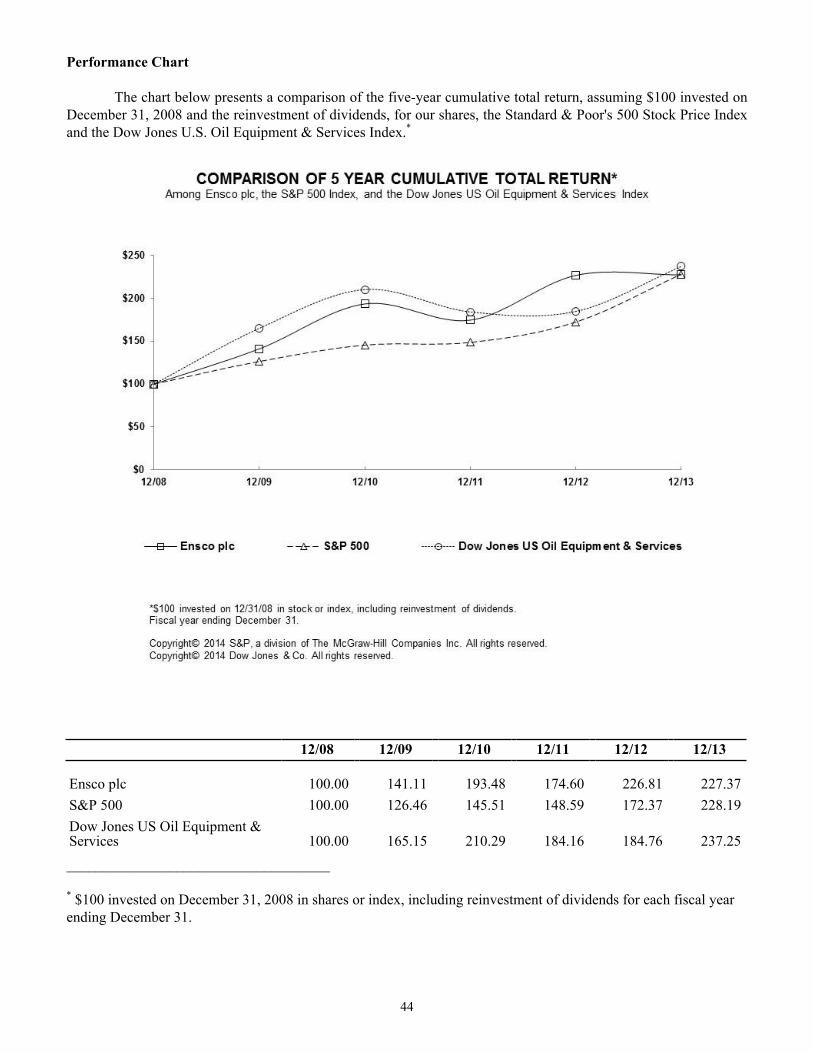
44
Performance Chart The chart below presents a comparison of the five-year cumulative total return, assuming $100 invested on December 31, 2008 and the reinvestment of dividends, for our shares, the Standard & Poor's 500 Stock Price Index and the Dow Jones U.S. Oil Equipment & Services Index.*
12/08 12/09 12/10 12/11 12/12 12/13
Ensco plc 100.00 141.11 193.48 174.60 226.81 227.37S&P 500 100.00 126.46 145.51 148.59 172.37 228.19Dow Jones US Oil Equipment &Services 100.00 165.15 210.29 184.16 184.76 237.25____________________________________ * $100 invested on December 31, 2008 in shares or index, including reinvestment of dividends for each fiscal year ending December 31.
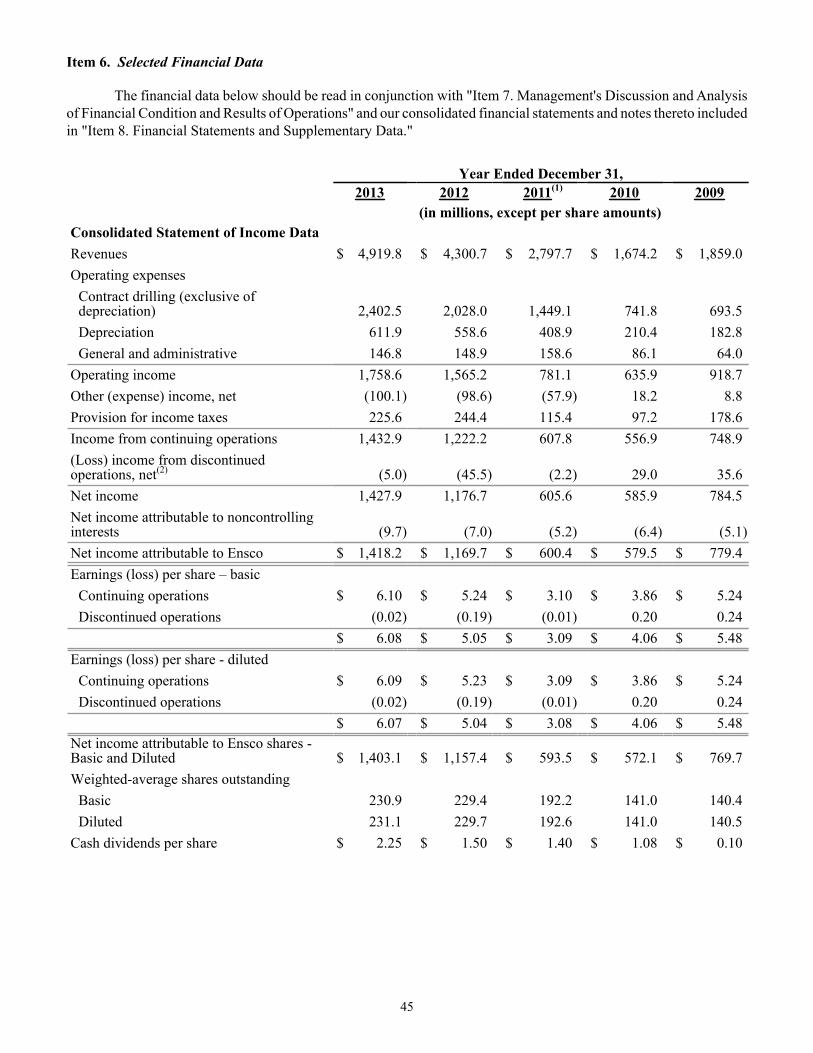
45
Item 6. Selected Financial Data
The financial data below should be read in conjunction with "Item 7. Management's Discussion and Analysis of Financial Condition and Results of Operations" and our consolidated financial statements and notes thereto included in "Item 8. Financial Statements and Supplementary Data."
Year Ended December 31,2013 2012 2011(1) 2010 2009
(in millions, except per share amounts)Consolidated Statement of Income Data Revenues $ 4,919.8 $ 4,300.7 $ 2,797.7 $ 1,674.2 $ 1,859.0Operating expenses
Contract drilling (exclusive ofdepreciation) 2,402.5 2,028.0 1,449.1 741.8 693.5Depreciation 611.9 558.6 408.9 210.4 182.8General and administrative 146.8 148.9 158.6 86.1 64.0
Operating income 1,758.6 1,565.2 781.1 635.9 918.7Other (expense) income, net (100.1) (98.6) (57.9) 18.2 8.8Provision for income taxes 225.6 244.4 115.4 97.2 178.6Income from continuing operations 1,432.9 1,222.2 607.8 556.9 748.9(Loss) income from discontinued operations, net(2) (5.0) (45.5) (2.2) 29.0 35.6Net income 1,427.9 1,176.7 605.6 585.9 784.5Net income attributable to noncontrollinginterests (9.7) (7.0) (5.2) (6.4) (5.1)Net income attributable to Ensco $ 1,418.2 $ 1,169.7 $ 600.4 $ 579.5 $ 779.4Earnings (loss) per share – basic
Continuing operations $ 6.10 $ 5.24 $ 3.10 $ 3.86 $ 5.24Discontinued operations (0.02) (0.19) (0.01) 0.20 0.24
$ 6.08 $ 5.05 $ 3.09 $ 4.06 $ 5.48Earnings (loss) per share - diluted
Continuing operations $ 6.09 $ 5.23 $ 3.09 $ 3.86 $ 5.24Discontinued operations (0.02) (0.19) (0.01) 0.20 0.24
$ 6.07 $ 5.04 $ 3.08 $ 4.06 $ 5.48Net income attributable to Ensco shares -Basic and Diluted $ 1,403.1 $ 1,157.4 $ 593.5 $ 572.1 $ 769.7Weighted-average shares outstanding
Basic 230.9 229.4 192.2 141.0 140.4Diluted 231.1 229.7 192.6 141.0 140.5
Cash dividends per share $ 2.25 $ 1.50 $ 1.40 $ 1.08 $ 0.10
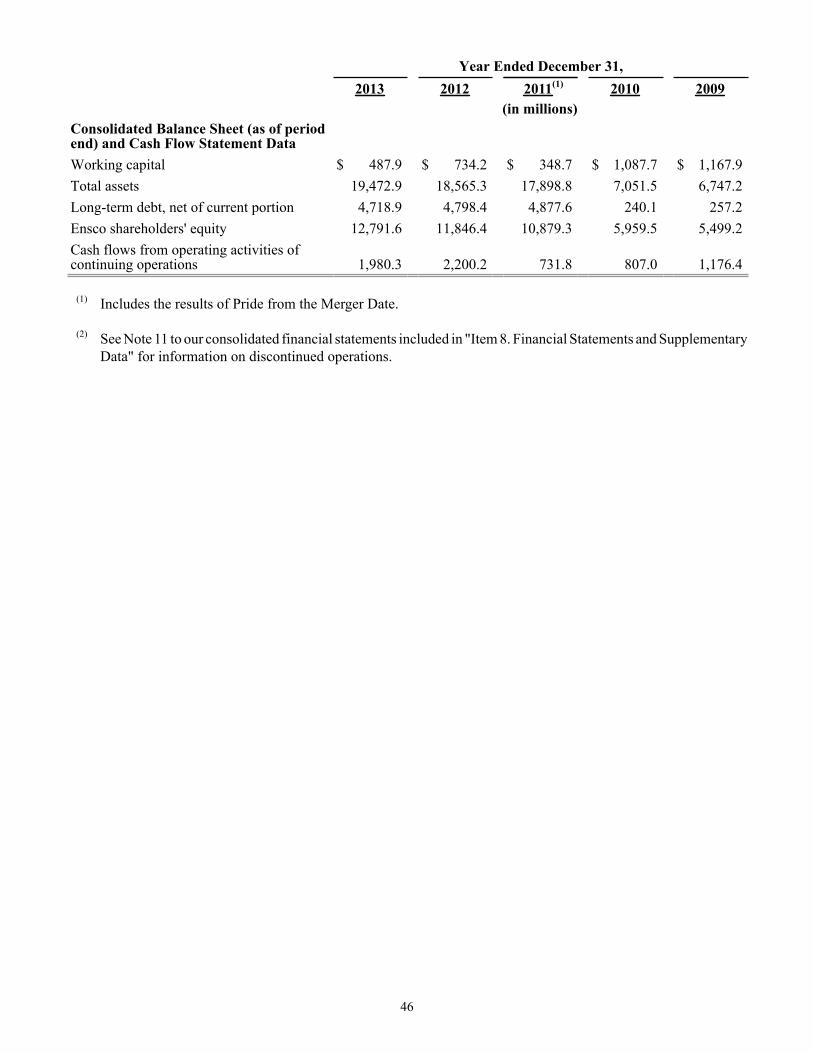
46
Year Ended December 31, 2013 2012 2011(1) 2010 2009 (in millions)Consolidated Balance Sheet (as of periodend) and Cash Flow Statement DataWorking capital $ 487.9 $ 734.2 $ 348.7 $ 1,087.7 $ 1,167.9Total assets 19,472.9 18,565.3 17,898.8 7,051.5 6,747.2Long-term debt, net of current portion 4,718.9 4,798.4 4,877.6 240.1 257.2Ensco shareholders' equity 12,791.6 11,846.4 10,879.3 5,959.5 5,499.2Cash flows from operating activities ofcontinuing operations 1,980.3 2,200.2 731.8 807.0 1,176.4
(1) Includes the results of Pride from the Merger Date.
(2) See Note 11 to our consolidated financial statements included in "Item 8. Financial Statements and Supplementary Data" for information on discontinued operations.
47
Item 7. Management's Discussion and Analysis of Financial Condition and Results of Operations
INTRODUCTION
Our Business We own the world's second largest offshore drilling rig fleet amongst competitive rigs, our ultra-deepwater fleet is the newest in the industry, and our premium jackup fleet is the largest of any offshore drilling company. We currently own and operate an offshore drilling rig fleet of 74 rigs, including six rigs under construction, spanning most of the strategic, high-growth markets around the globe. Our rig fleet includes ten drillships, 13 dynamically positioned semisubmersible rigs, six moored semisubmersible rigs and 45 jackup rigs.
Our customers include most of the leading national and international oil companies, in addition to many independent operators. We are among the most geographically diverse offshore drilling companies, with current operations and drilling contracts spanning approximately 20 countries on six continents in nearly every major offshore basin around the world. The markets in which we operate include Australia, Brazil, the Mediterranean, Mexico, the Middle East, the North Sea, Southeast Asia, the U.S. Gulf of Mexico and West Africa.
We provide drilling services on a "day rate" contract basis. Under day rate contracts, we provide a drilling rig and rig crews and receive a fixed amount per day for drilling a well. Our customers bear substantially all of the ancillary costs of constructing the well and supporting drilling operations, as well as the economic risk relative to the success of the well. In addition, our customers may pay all or a portion of the cost of moving our equipment and personnel to and from the well site. We do not provide "turnkey" or other risk-based drilling services.
Our Industry
Operating results in the offshore contract drilling industry are cyclical and directly related to the demand for drilling rigs and the available supply of drilling rigs. While the cost of moving a rig and the availability of rig-moving vessels may cause the balance of supply and demand to vary somewhat between regions, significant variations between regions are generally of a short-term nature due to rig mobility.
Drilling Rig Demand
Demand for drilling rigs is directly related to the regional and worldwide levels of offshore exploration and development spending by oil and gas companies, which is beyond our control. The markets for our contract drilling services are cyclical. Offshore exploration and development spending may fluctuate substantially from year-to-year and from region-to-region. Such spending fluctuations result from many factors, including:
• demand for oil and natural gas,
• regional and global economic conditions and changes therein,
• political, social and legislative environments in major oil-producing countries,
• production and inventory levels and related activities of the Organization of Petroleum Exporting Countries ("OPEC") and other oil and natural gas producers,
• technological advancements that impact the methods or cost of oil and natural gas exploration and development,
• disruption to exploration and development activities due to hurricanes and other severe weather conditions and the risk thereof, and
• the impact that these and other events, whether caused by economic conditions, international or national climate change regulations or other factors, may have on the current and expected future prices of oil and natural gas.
48
Utilization and day rates stabilized during 2011 as deepwater permitting activity increased in the U.S. Gulf of Mexico and global demand for shallow-water and deepwater drilling improved. During 2012, the permitting process in the U.S. Gulf of Mexico continued to improve and demand growth for floater and jackup rigs resulted in increased utilization and day rates. Day rates strengthened further during 2013 as demand remained strong in most regions, due in part to favorable commodity prices and the announcement of new oil and gas discoveries in regions around the world. Since factors that affect offshore exploration and development spending are beyond our control and because rig demand can change quickly, it is difficult for us to predict future industry conditions, demand trends or future operating results. Periods of low rig demand often result in excess rig supply, which generally results in reductions in utilization and day rates; conversely, periods of high rig demand often result in a shortage of rigs, which generally results in increased utilization and day rates.
Drilling Rig Supply
During the current newbuild cycle, various industry participants ordered the construction of 381 new drillships, semisubmersible rigs and jackup rigs, 149 of which were delivered during the last three years.
Worldwide rig supply in the Floaters segment continues to increase as a result of newbuild construction programs. Currently there are 99 newbuild drillships and semisubmersible rigs under construction, over 30 of which are scheduled for delivery during 2014. Approximately half of all newbuild floater rigs scheduled for delivery during 2014 are contracted. We expect these newbuild floaters to be absorbed into the market; however, utilization and day rates for less capable floaters will likely be negatively impacted.
Worldwide rig supply in the Jackups segment continues to increase as a result of newbuild construction programs. Currently there are 133 newbuild jackup rigs under construction, over 35 of which are scheduled for delivery during 2014. The majority of all newbuild jackup rigs scheduled for delivery during 2014 are not contracted. Although we expect these newbuild jackup rigs to be absorbed into the market, utilization and day rates in certain regions may come under pressure in the near to intermediate term depending upon the rate at which older jackups are retired.
Rig loss or damage due to hurricanes, blowouts, craterings, punchthroughs and other operational events, and the limited availability of insurance for certain perils in some geographic regions, may impact the supply of offshore drilling rigs in a particular market and cause fluctuations in utilization and day rates.
Drilling Rig Construction and Delivery
We remain focused on our long-established strategy of high-grading and expanding the size of our fleet. During the three-year period ended December 31, 2013, we invested $3.0 billion in the construction of new drilling rigs.
We previously contracted Keppel FELS Limited ("KFELS") to construct seven ENSCO 8500 Series® ultra-deepwater semisubmersible rigs based on our proprietary design. The ENSCO 8500 Series® rigs are enhanced versions of ENSCO 7500 and are capable of drilling in up to 8,500 feet of water. ENSCO 8506, the final rig in the ENSCO 8500 Series®, was delivered during 2012 and commenced drilling operations in the U.S. Gulf of Mexico under a long-term contract during the first quarter of 2013.
In connection with the Merger, we acquired seven drillships, two of which were under construction at the time of the Merger. ENSCO DS-6 was delivered in January 2012, underwent customer specified upgrades and commenced drilling operations in Angola under a long-term contract during the first quarter of 2013. ENSCO DS-7 was delivered in September 2013 and commenced a long-term contract in Angola during the fourth quarter of 2013. These newbuild drillships are based on a Samsung Heavy Industries ("SHI") proprietary hull design capable of drilling in up to 10,000 feet of water.
During 2012, we entered into agreements with SHI to construct two additional ultra-deepwater drillships (ENSCO DS-8 and ENSCO DS-9). ENSCO DS-8 is currently uncontracted and scheduled for delivery during the third
49
quarter of 2014. ENSCO DS-9 is currently scheduled for delivery during the fourth quarter of 2014 and is committed under a long-term contract. During 2013, we entered into an agreement with SHI to construct our eighth ultra-deepwater drillship (ENSCO DS-10), which is uncontracted and scheduled for delivery during the third quarter of 2015.
We previously entered into agreements with KFELS to construct three ultra-premium harsh environment jackup rigs (ENSCO 120, ENSCO 121 and ENSCO 122). ENSCO 120 was delivered in September 2013 and is expected to commence drilling operations under a long-term contract in the North Sea during the first quarter of 2014. ENSCO 121 was delivered during the fourth quarter of 2013 and is expected to commence drilling operations under a long-term contract in the North Sea during the second quarter of 2014. ENSCO 122 is currently scheduled for delivery during the third quarter 2014 and is committed under a long-term drilling contract.
During 2013, we entered into agreements with KFELS to construct a premium jackup rig (ENSCO 110) and a fourth ultra-premium harsh environment jackup rig in the ENSCO 120 Series (ENSCO 123). These rigs are scheduled for delivery during the first quarter of 2015 and the second quarter of 2016, respectively. Both of these rigs are currently uncontracted.
A substantial portion of our projected cash flows will continue to be invested in the expansion and enhancement of our fleet of drilling rigs. We also intend to continue paying quarterly dividends for the foreseeable future. However, our Board of Directors may change the timing and payment amount depending on several factors including our profitability, liquidity, financial condition, reinvestment opportunities and capital requirements. We believe our strong balance sheet, $10.7 billion of contract backlog and borrowing capacity under our commercial paper program and revolving credit facility will provide flexibility to make additional investments in our fleet and sustain an adequate level of liquidity during 2014 and beyond.
Divestitures
Our business strategy has been to focus on ultra-deepwater floater and premium jackup operations and de-emphasize other assets and operations considered to be non-core or that do not meet our standards for financial performance. Consistent with this strategy, we sold five jackup rigs, one moored semisubmersible rig and our last remaining barge rig during the three-year period ended December 31, 2013. See Note 17 to our consolidated financial statements for information about two additional jackup rigs sold in January 2014.
Segment Highlights
Floaters Operating results for our Floaters segment improved during 2013, primarily due to commencement of ENSCO 8506 and ENSCO DS-6 drilling operations as well as a full year of operations for ENSCO 8505. During the first quarter of 2013, ENSCO 8506 and ENSCO DS-6 commenced drilling operations under long-term contracts at day rates of approximately $530,000. ENSCO 8505 commenced drilling operations under a long-term contract during the second quarter of 2012 at a day rate of approximately $475,000.
ENSCO DS-7 was delivered in September 2013 and commenced a long-term contract in Angola during the fourth quarter of 2013. The day rate averages approximately $648,000 over the term of the contract. In January 2014, ENSCO DS-9 was contracted to ConocoPhillips and is expected to commence a long-term contract in the U.S. Gulf of Mexico during the third quarter of 2015 at an average day rate of approximately $550,000.
ENSCO 8501 received a one-year contract extension from Noble Energy in the U.S. Gulf of Mexico that commenced in August 2013 at a day rate of approximately $525,000. ENSCO 5004 was contracted to Mellitah during the third quarter of 2013 and is expected to commence drilling operations in the Mediterranean during the second quarter of 2014 at an average day rate of approximately $310,000 over the term of the contract.
50
ENSCO 6001 and ENSCO 6002 received five-year contract extensions from Petrobras in Brazil that commenced in June and July 2013, respectively, at day rates of approximately $370,000, significantly higher than the day rates earned under the expiring contracts.
During 2013, we entered into an agreement with SHI to construct our eighth ultra-deepwater drillship, ENSCO DS-10, which is currently uncontracted and scheduled for delivery during the third quarter of 2015.
Jackups An increase in average day rates resulted in improved operating results for our Jackups segment during 2013. In particular, premium jackup rigs earned significantly higher day rates during 2013 due to increasing customer demand for more technically capable rigs. The jackup market remains tight, and as of December 31, 2013, all of our marketed jackup rigs were contracted.
In the U.S. Gulf of Mexico, multiple jackup rigs were contracted for longer terms and higher day rates than the expiring contracts. Energy XXI extended the ENSCO 82 contract for one year through September 2014 and the ENSCO 99 contract for nine months through July 2014. Both rigs will receive higher day rates under the contract extensions. Chevron contracted ENSCO 68 and ENSCO 81 for one year and 11 month terms, respectively, at day rates of approximately $145,000, significantly higher than the day rates earned under the expiring contracts. Additionally, Fieldwood extended the ENSCO 87 contract for one year through January 2015 at a day rate of approximately $147,000.
The jackup market was also strong in other regions. ENSCO 54 was contracted to Saudi Aramco in the Middle East through October 2017 at an average day rate of approximately $115,000. ENSCO 105 was contracted to Shell in Malaysia through November 2014 at a day rate of approximately $161,000.
Ultra-premium harsh environment jackup rigs ENSCO 120 and ENSCO 121 were delivered during 2013. ENSCO 120 is expected to commence drilling operations under a long-term contract in the North Sea at a day rate of approximately $230,000 during the first quarter of 2014. ENSCO 121 is expected to commence drilling operations under a long-term contract in the North Sea at a day rate of approximately $230,000 during the second quarter of 2014.
In response to strong demand, we recently entered into agreements with KFELS to construct a premium jackup rig (ENSCO 110) and an ultra-premium harsh environment jackup rig (ENSCO 123). These rigs are scheduled for delivery during the first quarter 2015 and second quarter 2016, respectively. Both of these rigs are currently uncontracted.
BUSINESS ENVIRONMENT
Floaters
Demand for high-specification floaters is expected to remain healthy during 2014. We believe commodity prices will remain at favorable levels making it economic for customers to continue to drill. Approximately two-thirds of wells in progress are focused on development, and recent discoveries are anticipated to prompt additional appraisal and development drilling. Increasing rig supply from newbuild floaters and rigs coming off contract is expected to temper utilization, day rates and contract duration, but retirements of older, less capable floaters should alleviate some of this pressure. Drilling contractors will likely be challenged to contract older, less capable floaters that are not retired.
Rig supply in the U.S. Gulf of Mexico is expected to increase as more than 12 rigs will mobilize to the region during 2014. Although the majority of these newbuild rigs are contracted, utilization for existing floaters in the region may be negatively impacted, and some of these rigs may mobilize to other regions. In Mexico, the government is taking steps to expand deepwater drilling that could lead to incremental demand in future years.
51
We believe there will be incremental demand in Brazil as customers come to the market for rigs to drill their new exploration acreage awarded in licensing rounds held during 2013. Petrobras has open tenders and inquiries to contract floaters, and contract extension negotiations for multiple rigs with contracts expiring in 2015 are ongoing.
In West Africa, multiple newbuild drillships are projected to enter the region during 2014; however, these rigs are expected to be absorbed by incremental demand. We expect demand in the Asia Pacific market to remain stable, with incremental requirements in Australia, Indonesia, Myanmar and Vietnam.
Supply and demand in the North Sea market are balanced, and we believe there will be incremental demand for harsh environment floaters. The Mediterranean market is also expected to present additional drilling opportunities. Jackups
Demand for jackups is robust, supporting current day rates and contract terms. Utilization for the worldwide jackup fleet continues to be strong. Utilization and day rates in certain regions may come under pressure as more newbuild rigs enter the market, however, retirements of older jackups should balance the market.
Demand is strong in the U.S. Gulf of Mexico, and we expect a balanced market during 2014. The national oil company of Mexico, Petróleos Mexicanos ("PEMEX"), continues to expand its rig fleet, and we believe there will be incremental demand in Mexico as PEMEX contracts additional jackups.
The Asia Pacific market remains balanced, and the majority of contracted newbuild rigs being built in the region will mobilize to other regions during 2014 to begin their initial contracts. Uncontracted newbuild rigs scheduled for delivery from Asian shipyards during 2014 may put pressure on utilization and day rates in the region depending upon the rate at which older jackups are retired.
The Middle East market is expected to remain strong, and we believe there will be incremental demand from operators in the region. Demand in West Africa increased during 2013, and there are currently open tenders for incremental rigs for multi-year terms.
We expect the North Sea market to remain tight. Significant contracted backlog exists for 2014, and operators are issuing tenders to secure rigs for work beginning in 2015 and beyond.
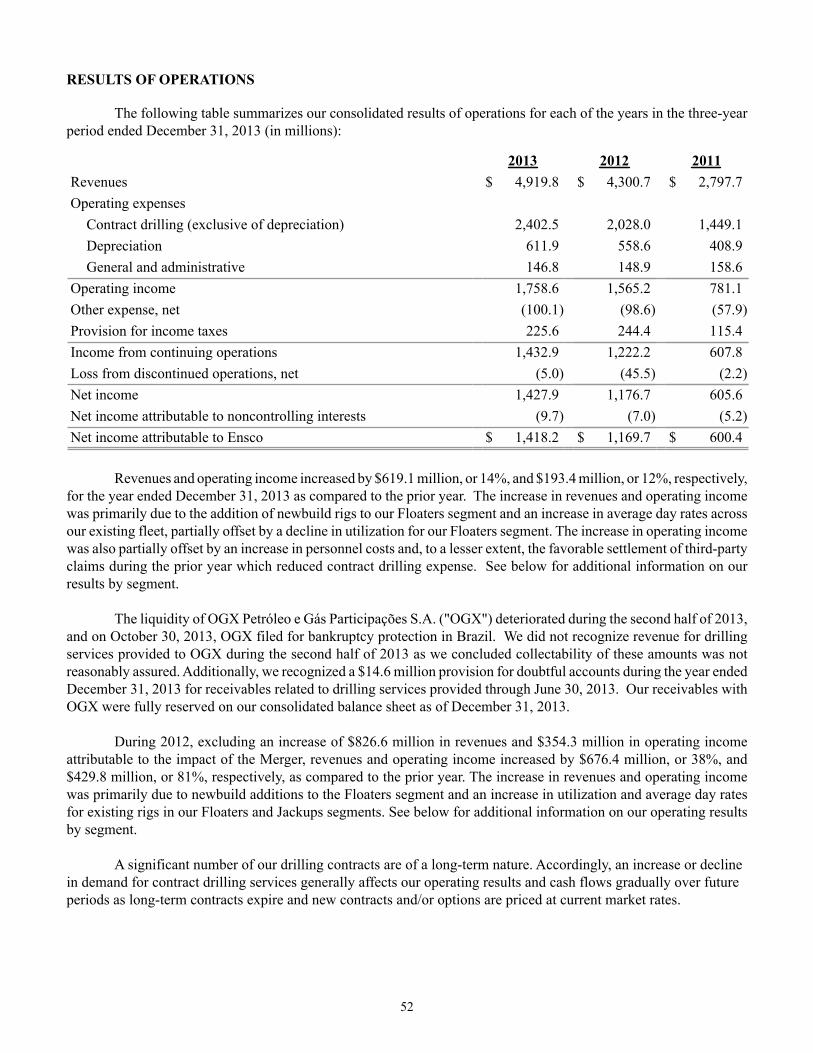
52
RESULTS OF OPERATIONS
The following table summarizes our consolidated results of operations for each of the years in the three-year period ended December 31, 2013 (in millions):
2013 2012 2011Revenues $ 4,919.8 $ 4,300.7 $ 2,797.7Operating expenses
Contract drilling (exclusive of depreciation) 2,402.5 2,028.0 1,449.1Depreciation 611.9 558.6 408.9General and administrative 146.8 148.9 158.6
Operating income 1,758.6 1,565.2 781.1Other expense, net (100.1) (98.6) (57.9)Provision for income taxes 225.6 244.4 115.4Income from continuing operations 1,432.9 1,222.2 607.8Loss from discontinued operations, net (5.0) (45.5) (2.2)Net income 1,427.9 1,176.7 605.6Net income attributable to noncontrolling interests (9.7) (7.0) (5.2)Net income attributable to Ensco $ 1,418.2 $ 1,169.7 $ 600.4
Revenues and operating income increased by $619.1 million, or 14%, and $193.4 million, or 12%, respectively, for the year ended December 31, 2013 as compared to the prior year. The increase in revenues and operating income was primarily due to the addition of newbuild rigs to our Floaters segment and an increase in average day rates across our existing fleet, partially offset by a decline in utilization for our Floaters segment. The increase in operating income was also partially offset by an increase in personnel costs and, to a lesser extent, the favorable settlement of third-party claims during the prior year which reduced contract drilling expense. See below for additional information on our results by segment.
The liquidity of OGX Petróleo e Gás Participações S.A. ("OGX") deteriorated during the second half of 2013, and on October 30, 2013, OGX filed for bankruptcy protection in Brazil. We did not recognize revenue for drilling services provided to OGX during the second half of 2013 as we concluded collectability of these amounts was not reasonably assured. Additionally, we recognized a $14.6 million provision for doubtful accounts during the year ended December 31, 2013 for receivables related to drilling services provided through June 30, 2013. Our receivables with OGX were fully reserved on our consolidated balance sheet as of December 31, 2013.
During 2012, excluding an increase of $826.6 million in revenues and $354.3 million in operating income attributable to the impact of the Merger, revenues and operating income increased by $676.4 million, or 38%, and $429.8 million, or 81%, respectively, as compared to the prior year. The increase in revenues and operating income was primarily due to newbuild additions to the Floaters segment and an increase in utilization and average day rates for existing rigs in our Floaters and Jackups segments. See below for additional information on our operating results by segment.
A significant number of our drilling contracts are of a long-term nature. Accordingly, an increase or decline in demand for contract drilling services generally affects our operating results and cash flows gradually over future periods as long-term contracts expire and new contracts and/or options are priced at current market rates.
53
Rig Counts, Utilization and Average Day Rates The following table sets forth our offshore drilling rigs by reportable segment and rigs under construction as of December 31, 2013, 2012 and 2011:
2013 2012 2011Floaters(1) 26 25 22Jackups(1) 44 42 42Under construction(1)(2) 6 6 7Total(3) 76 73 71
(1) During 2013, we accepted delivery of one ultra-deepwater drillship (ENSCO DS-7) and two ultra-premium harsh environment jackup rigs (ENSCO 120 and ENSCO 121). ENSCO DS-7 commenced a long-term contract during the fourth quarter of 2013. ENSCO 120 is expected to commence drilling operations under a long-term contract during the first quarter of 2014, and ENSCO 121 is expected to commence drilling operations under a long-term contract during the second quarter of 2014.
During 2012, we accepted delivery of two ultra-deepwater semisubmersible rigs (ENSCO 8505 and ENSCO 8506) and one ultra-deepwater drillship (ENSCO DS-6). ENSCO 8505 commenced drilling operations under a long-term contract during the second quarter of 2012. ENSCO 8506 and ENSCO DS-6 commenced drilling operations under long-term contracts during the first quarter of 2013.
(2) During 2013, we entered into an agreement with SHI to construct our eighth ultra-deepwater drillship (ENSCO DS-10), which is uncontracted and scheduled for delivery during the third quarter of 2015. During 2013, we also entered into agreements with KFELS to construct one premium jackup rig (ENSCO 110) and one ultra-premium harsh environment jackup rig (ENSCO 123). These rigs are scheduled for delivery during the first quarter 2015 and second quarter 2016, respectively. Both of these rigs are currently uncontracted.
During 2012, we entered into agreements with SHI to construct our sixth and seventh ultra-deepwater drillships (ENSCO DS-8 and ENSCO DS-9). ENSCO DS-8 is currently uncontracted and scheduled for delivery during third quarter of 2014. ENSCO DS-9 is committed under a long-term drilling contract and is scheduled for delivery during the fourth quarter of 2014.
(3) The total number of rigs for each period excludes rigs reclassified as discontinued operations.
The following table summarizes our rig utilization and average day rates from continuing operations by reportable segment for each of the years in the three-year period ended December 31, 2013:
2013 2012 2011Rig Utilization(1) Floaters 80% 87% 80%Jackups 88% 89% 80%Total 85% 88% 80%
Average Day Rates(2) Floaters $ 407,187 $ 358,336 $ 339,017Jackups 122,900 106,212 98,249Total $ 223,099 $ 193,407 $ 160,717
(1) Rig utilization is derived by dividing the number of days under contract by the number of days in the period. Days under contract equals the total number of days that rigs have earned and recognized day rate revenue, including days associated with compensated downtime and mobilizations. When revenue is earned but is deferred and
54
amortized over a future period, for example when a rig earns revenue while mobilizing to commence a new contract or while being upgraded in a shipyard, the related days are excluded from days under contract.
For newly-constructed or acquired rigs, the number of days in the period begins upon commencement of drilling operations for rigs with a contract or when the rig becomes available for drilling operations for rigs without a contract.
(2) Average day rates are derived by dividing contract drilling revenues, adjusted to exclude certain types of non-recurring reimbursable revenues, lump sum revenues and revenues attributable to amortization of drilling contract intangibles, by the aggregate number of contract days, adjusted to exclude contract days associated with certain mobilizations, demobilizations, shipyard contracts and standby contracts.
Detailed explanations of our operating results, including discussions of revenues, contract drilling expense and depreciation expense by segment, are provided below. Operating Income
Our business consists of three operating segments: (1) Floaters, which includes our drillships and semisubmersible rigs, (2) Jackups and (3) Other, which consists of management services on rigs owned by third-parties. Our two reportable segments, Floaters and Jackups, provide one service, contract drilling.
Segment information for each of the years in the three-year period ended December 31, 2013 is presented below (in millions). General and administrative expense and depreciation expense incurred by our corporate office are not allocated to our operating segments for purposes of measuring segment operating income and were included in "Reconciling Items." Year Ended December 31, 2013
Floaters Jackups Other
OperatingSegments
TotalReconciling
ItemsConsolidated
Total
Revenues $ 3,109.5 $ 1,735.2 $ 75.1 $ 4,919.8 $ — $ 4,919.8Operating expenses Contract drilling (exclusive of depreciation) 1,509.4 834.6 58.5 2,402.5 — 2,402.5 Depreciation 441.9 163.5 — 605.4 6.5 611.9 General and administrative — — — — 146.8 146.8Operating income (loss) $ 1,158.2 $ 737.1 $ 16.6 $ 1,911.9 $ (153.3) $ 1,758.6
Year Ended December 31, 2012
Floaters Jackups Other
OperatingSegments
TotalReconciling
ItemsConsolidated
Total
Revenues $ 2,707.8 $ 1,510.1 $ 82.8 $ 4,300.7 $ — $ 4,300.7Operating expenses Contract drilling (exclusive of depreciation) 1,225.1 741.8 61.1 2,028.0 — 2,028.0 Depreciation 382.3 167.4 — 549.7 8.9 558.6 General and administrative — — — — 148.9 148.9Operating income (loss) $ 1,100.4 $ 600.9 $ 21.7 $ 1,723.0 $ (157.8) $ 1,565.2
55
Year Ended December 31, 2011
Floaters Jackups Other
OperatingSegments
TotalReconciling
ItemsConsolidated
Total
Revenues $ 1,532.8 $ 1,212.5 $ 52.4 $ 2,797.7 $ — $ 2,797.7Operating expenses Contract drilling (exclusive of depreciation) 785.1 621.1 42.9 1,449.1 — 1,449.1 Depreciation 235.9 168.6 — 404.5 4.4 408.9 General and administrative — — — — 158.6 158.6Operating income (loss) $ 511.8 $ 422.8 $ 9.5 $ 944.1 $ (163.0) $ 781.1
Floaters
During 2013, Floater revenues increased by $401.7 million, or 15%, as compared to the prior year. The increase in revenues was primarily due to commencement of ENSCO 8506 and ENSCO DS-6 drilling operations during the first quarter of 2013 and commencement of ENSCO 8505 drilling operations during the second quarter of 2012. To a lesser extent, the increase in revenues was attributable to an increase in average day rates for various rigs in our Floater fleet. These increases were partially offset by a decline in utilization, primarily due to ENSCO 5005, which was in the shipyard for a capital enhancement project during 2013, shipyard related downtime incurred by ENSCO DS-2 and downtime prompted by a vendor notice regarding inspection and replacement of connector bolts on various rigs during the first quarter of 2013. ENSCO 5000, which was warm stacked during 2013, and ENSCO 5002 and ENSCO 5004 drilling services provided to OGX that were not recognized as revenue also adversely impacted utilization.
Contract drilling expense increased by $284.3 million, or 23%, as compared to the prior year, primarily due to the additions to our Floater fleet and increased personnel costs. These increases were partially offset by lower contract drilling expense for ENSCO 5005, which was in the shipyard for a capital enhancement project during 2013. The prior year also included the favorable settlement of third-party claims which reduced contract drilling expense by $63.3 million. Depreciation expense increased by $59.6 million, or 16%, primarily due to the aforementioned additions to our Floater fleet. During 2012, excluding an increase of $785.9 million attributable to the impact of the Merger, Floater revenues increased by $389.1 million, or 67%, as compared to the prior year. The increase in revenues was primarily due to commencement of ENSCO 8503, ENSCO 8504 and ENSCO 8505 drilling operations during the first and third quarters of 2011 and the second quarter of 2012, respectively. Increased utilization, primarily attributable to ENSCO 7500, which was undergoing a shipyard enhancement project during 2011, and an increase in average day rates, also contributed to the increase in revenues. The increase in average day rates was primarily attributable to ENSCO 8502 and ENSCO 8503, which were sublet during 2011 before commencing original two-year contracts in the U.S. Gulf of Mexico in June 2011 and January 2012, respectively.
Excluding an increase of $319.9 million attributable to the impact of the Merger, contract drilling expense increased by $120.1 million, or 53%, as compared to the prior year, primarily due to the additions to our Floater fleet and completion of the ENSCO 7500 shipyard enhancement project as previously noted. The increase in contract drilling expense attributable to the impact of the Merger is net of $63.3 million related to the favorable settlement of third-party claims during 2012. Depreciation expense increased by $27.0 million, or 34%, excluding an increase of $119.4 million in expense attributable to the impact of the Merger. The increase in depreciation expense was primarily due to the aforementioned additions to our Floater fleet and depreciation on ENSCO 7500 enhancements completed in late 2011.
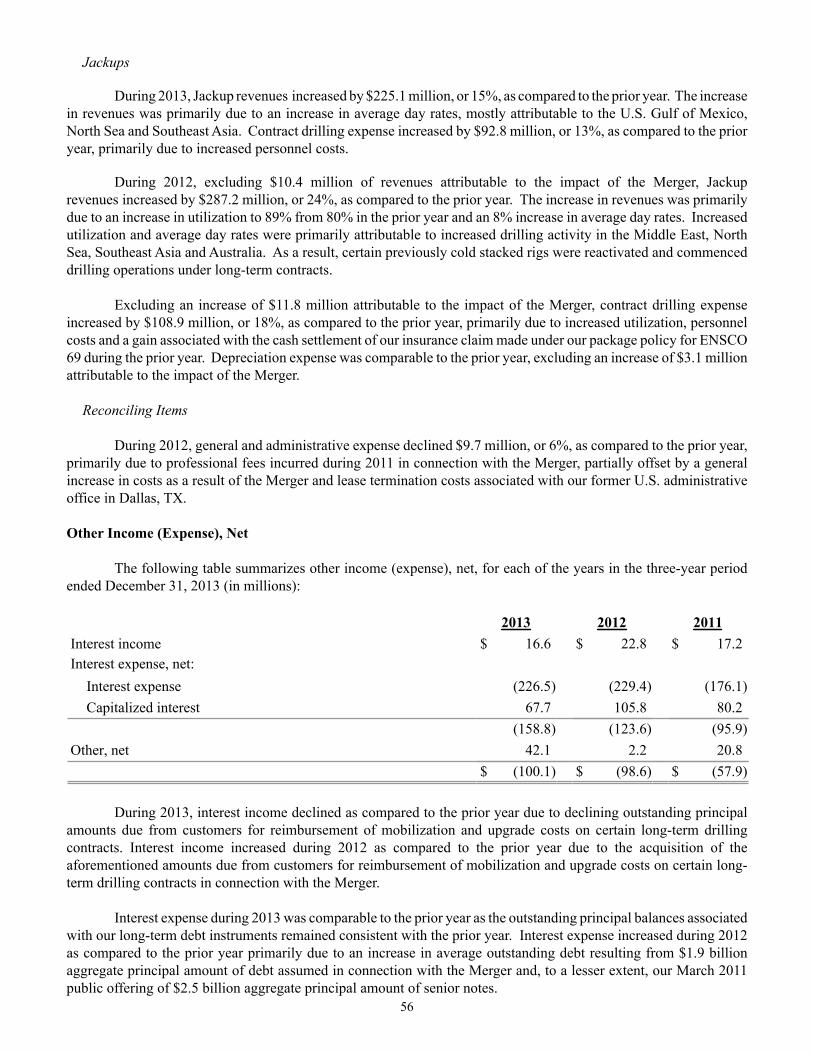
56
Jackups
During 2013, Jackup revenues increased by $225.1 million, or 15%, as compared to the prior year. The increase in revenues was primarily due to an increase in average day rates, mostly attributable to the U.S. Gulf of Mexico, North Sea and Southeast Asia. Contract drilling expense increased by $92.8 million, or 13%, as compared to the prior year, primarily due to increased personnel costs.
During 2012, excluding $10.4 million of revenues attributable to the impact of the Merger, Jackup revenues increased by $287.2 million, or 24%, as compared to the prior year. The increase in revenues was primarily due to an increase in utilization to 89% from 80% in the prior year and an 8% increase in average day rates. Increased utilization and average day rates were primarily attributable to increased drilling activity in the Middle East, North Sea, Southeast Asia and Australia. As a result, certain previously cold stacked rigs were reactivated and commenced drilling operations under long-term contracts.
Excluding an increase of $11.8 million attributable to the impact of the Merger, contract drilling expense increased by $108.9 million, or 18%, as compared to the prior year, primarily due to increased utilization, personnel costs and a gain associated with the cash settlement of our insurance claim made under our package policy for ENSCO 69 during the prior year. Depreciation expense was comparable to the prior year, excluding an increase of $3.1 million attributable to the impact of the Merger.
Reconciling Items
During 2012, general and administrative expense declined $9.7 million, or 6%, as compared to the prior year, primarily due to professional fees incurred during 2011 in connection with the Merger, partially offset by a general increase in costs as a result of the Merger and lease termination costs associated with our former U.S. administrative office in Dallas, TX. Other Income (Expense), Net The following table summarizes other income (expense), net, for each of the years in the three-year period ended December 31, 2013 (in millions):
2013 2012 2011Interest income $ 16.6 $ 22.8 $ 17.2Interest expense, net:
Interest expense (226.5) (229.4) (176.1)Capitalized interest 67.7 105.8 80.2
(158.8) (123.6) (95.9)Other, net 42.1 2.2 20.8 $ (100.1) $ (98.6) $ (57.9)
During 2013, interest income declined as compared to the prior year due to declining outstanding principal amounts due from customers for reimbursement of mobilization and upgrade costs on certain long-term drilling contracts. Interest income increased during 2012 as compared to the prior year due to the acquisition of the aforementioned amounts due from customers for reimbursement of mobilization and upgrade costs on certain long-term drilling contracts in connection with the Merger.
Interest expense during 2013 was comparable to the prior year as the outstanding principal balances associated with our long-term debt instruments remained consistent with the prior year. Interest expense increased during 2012 as compared to the prior year primarily due to an increase in average outstanding debt resulting from $1.9 billion aggregate principal amount of debt assumed in connection with the Merger and, to a lesser extent, our March 2011 public offering of $2.5 billion aggregate principal amount of senior notes.
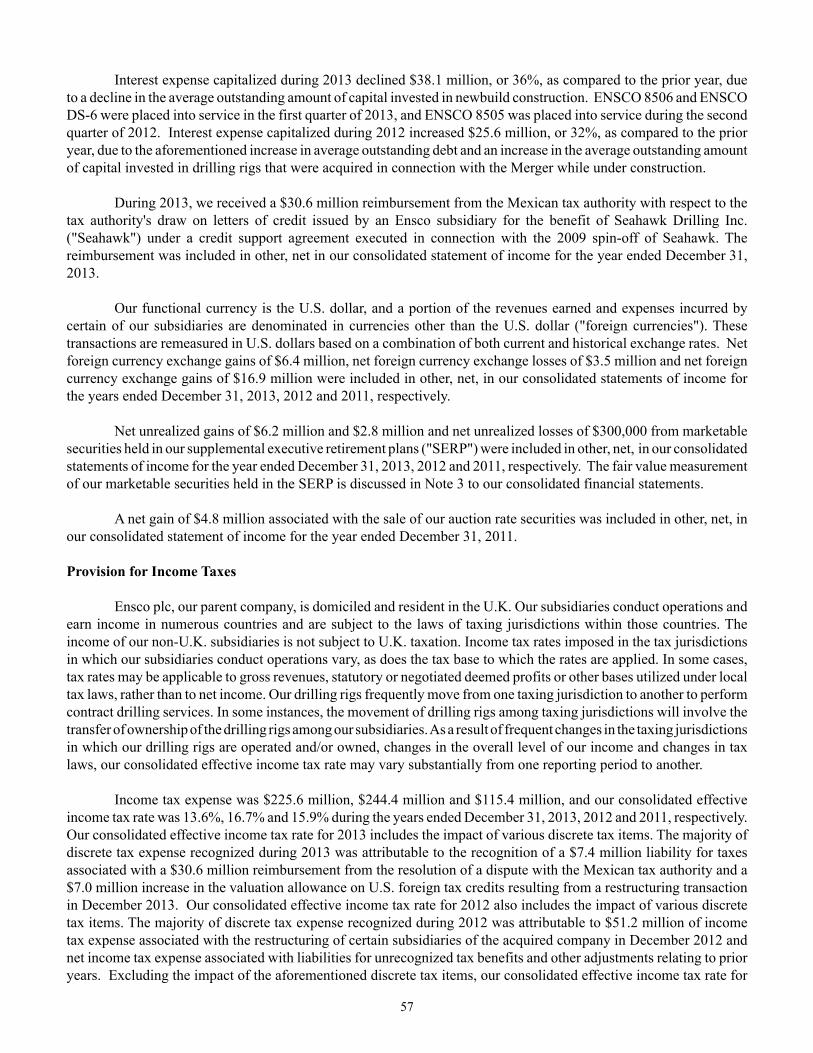
57
Interest expense capitalized during 2013 declined $38.1 million, or 36%, as compared to the prior year, due to a decline in the average outstanding amount of capital invested in newbuild construction. ENSCO 8506 and ENSCO DS-6 were placed into service in the first quarter of 2013, and ENSCO 8505 was placed into service during the second quarter of 2012. Interest expense capitalized during 2012 increased $25.6 million, or 32%, as compared to the prior year, due to the aforementioned increase in average outstanding debt and an increase in the average outstanding amount of capital invested in drilling rigs that were acquired in connection with the Merger while under construction. During 2013, we received a $30.6 million reimbursement from the Mexican tax authority with respect to the tax authority's draw on letters of credit issued by an Ensco subsidiary for the benefit of Seahawk Drilling Inc. ("Seahawk") under a credit support agreement executed in connection with the 2009 spin-off of Seahawk. The reimbursement was included in other, net in our consolidated statement of income for the year ended December 31, 2013.
Our functional currency is the U.S. dollar, and a portion of the revenues earned and expenses incurred by certain of our subsidiaries are denominated in currencies other than the U.S. dollar ("foreign currencies"). These transactions are remeasured in U.S. dollars based on a combination of both current and historical exchange rates. Net foreign currency exchange gains of $6.4 million, net foreign currency exchange losses of $3.5 million and net foreign currency exchange gains of $16.9 million were included in other, net, in our consolidated statements of income for the years ended December 31, 2013, 2012 and 2011, respectively.
Net unrealized gains of $6.2 million and $2.8 million and net unrealized losses of $300,000 from marketable securities held in our supplemental executive retirement plans ("SERP") were included in other, net, in our consolidated statements of income for the year ended December 31, 2013, 2012 and 2011, respectively. The fair value measurement of our marketable securities held in the SERP is discussed in Note 3 to our consolidated financial statements.
A net gain of $4.8 million associated with the sale of our auction rate securities was included in other, net, in our consolidated statement of income for the year ended December 31, 2011.
Provision for Income Taxes Ensco plc, our parent company, is domiciled and resident in the U.K. Our subsidiaries conduct operations and earn income in numerous countries and are subject to the laws of taxing jurisdictions within those countries. The income of our non-U.K. subsidiaries is not subject to U.K. taxation. Income tax rates imposed in the tax jurisdictions in which our subsidiaries conduct operations vary, as does the tax base to which the rates are applied. In some cases, tax rates may be applicable to gross revenues, statutory or negotiated deemed profits or other bases utilized under local tax laws, rather than to net income. Our drilling rigs frequently move from one taxing jurisdiction to another to perform contract drilling services. In some instances, the movement of drilling rigs among taxing jurisdictions will involve the transfer of ownership of the drilling rigs among our subsidiaries. As a result of frequent changes in the taxing jurisdictions in which our drilling rigs are operated and/or owned, changes in the overall level of our income and changes in tax laws, our consolidated effective income tax rate may vary substantially from one reporting period to another.
Income tax expense was $225.6 million, $244.4 million and $115.4 million, and our consolidated effective income tax rate was 13.6%, 16.7% and 15.9% during the years ended December 31, 2013, 2012 and 2011, respectively. Our consolidated effective income tax rate for 2013 includes the impact of various discrete tax items. The majority of discrete tax expense recognized during 2013 was attributable to the recognition of a $7.4 million liability for taxes associated with a $30.6 million reimbursement from the resolution of a dispute with the Mexican tax authority and a $7.0 million increase in the valuation allowance on U.S. foreign tax credits resulting from a restructuring transaction in December 2013. Our consolidated effective income tax rate for 2012 also includes the impact of various discrete tax items. The majority of discrete tax expense recognized during 2012 was attributable to $51.2 million of income tax expense associated with the restructuring of certain subsidiaries of the acquired company in December 2012 and net income tax expense associated with liabilities for unrecognized tax benefits and other adjustments relating to prior years. Excluding the impact of the aforementioned discrete tax items, our consolidated effective income tax rate for
58
the years ended December 31, 2013 and 2012 was 12.7% and 12.2%, respectively. The increase in our consolidated effective income tax rate, excluding discrete tax items, was due to the change in taxing jurisdictions in which our drilling rigs are operated and/or owned that resulted in an increase in the relative components of our earnings generated in tax jurisdictions with higher tax rates. Our consolidated effective income tax rate for 2011 includes the impact of various discrete tax items. The majority of discrete tax expense recognized during 2011 was attributable to the recognition of a liability for unrecognized tax benefits associated with a tax position taken in a prior year. Excluding the impact of the aforementioned discrete tax items, our consolidated effective income tax rate for the year ended December 31, 2011 was 15.1%. The decrease in our 2012 consolidated effective income tax rate, excluding discrete tax items, to 12.2% from 15.1% in 2011 was due to unrecognized benefits related to net operating losses and foreign tax credits of certain acquired subsidiaries in 2011 and changes in taxing jurisdictions in which our drilling rigs are operated and/or owned that resulted in an increase in the relative components of our earnings generated in tax jurisdictions with lower tax rates.
Discontinued Operations
Our business strategy has been to focus on ultra-deepwater floater and premium jackup operations, and de-emphasize other assets and operations considered to be non-core or that do not meet our standards for financial performance. Consistent with this strategy, we sold the following rigs during the three-year period ended December 31, 2013 (in millions):
Rig Date of Rig Sale Segment(1)Net
ProceedsNet Book Value(2)
Pre-tax (Loss)/Gain(3)
Pride Pennsylvania March 2013 Jackups $ 15.5 $ 15.7 $ (.2)ENSCO 5003 December 2012 Floaters 68.2 89.4 (21.2)Pride Hawaii October 2012 Jackups 18.8 16.8 2.0ENSCO I September 2012 Other 4.5 12.3 (7.8)ENSCO 61 June 2012 Jackups 31.7 19.6 12.1ENSCO 59 May 2012 Jackups 22.8 21.9 .9ENSCO 95 June 2011 Jackups 41.5 28.8 12.7 $ 203.0 $ 204.5 $ (1.5)
(1) The rigs' operating results were reclassified to discontinued operations in our consolidated statements of income for each of the years in the three-year period ended December 31, 2013 and previously were included within the operating segment noted in the above table.
(2) Includes the rig's net book value as well as inventory and other assets on the date of the sale.(3) The pre-tax (loss)/gain was included in loss from discontinued operations, net in our consolidated statements of
income in the year of sale. Income tax expense of $900,000 and $10.9 million was recognized in connection with the sale of assets during the years ended December 31, 2013 and December 31, 2011, respectively. There was no net income tax expense recognized in connection with the sale of assets during the year ended December 31, 2012.
During 2012, we classified jackup rig Pride Pennsylvania as held for sale, and the rig was written down to fair value less estimated cost to sell. We recognized a $2.5 million loss for assets classified as held for sale during the year ended December 31, 2012.
59
The following table summarizes loss from discontinued operations for each of the years in the three-year period ended December 31, 2013 (in millions):
2013 2012 2011Revenues $ — $ 6.7 $ 45.0Operating expenses 6.5 44.3 44.4Operating (loss) income (6.5) (37.6) .6Other income .3 1.3 .2Income tax benefit (expense) 2.3 7.3 (4.8)(Loss) gain on disposal of discontinued operations, net (1.1) (16.5) 1.8Loss from discontinued operations $ (5.0) $ (45.5) $ (2.2)
Debt and interest expense are not allocated to our discontinued operations.
During 2008, ENSCO 74 was lost as a result of Hurricane Ike in the U.S. Gulf of Mexico. The owner of a pipeline filed claims alleging that ENSCO 74 caused the pipeline to rupture during Hurricane Ike. We have incurred $3.6 million in professional fees in connection with this matter, which we have applied against our $10.0 million per occurrence deductible under our liability insurance policy.
We recently reached an agreement in principle to settle with the pipeline owner for $9.6 million. Accordingly, we recorded a $6.4 million charge for our remaining obligation under our liability insurance policy in loss from discontinued operations in our consolidated statement of income for the year ended December 31, 2013. The remaining $3.2 million will be settled by our underwriters. See Note 12 to our consolidated financial statements for additional information on the ENSCO 74 loss.
LIQUIDITY AND CAPITAL RESOURCES Although our business is cyclical, we have historically relied on our cash flows from continuing operations to meet liquidity needs and fund the majority of our cash requirements. We have maintained a strong financial position through the disciplined and conservative use of debt, which has provided us the ability to achieve future growth potential through acquisitions and newbuild rig construction. A substantial portion of our cash flows have been invested in the expansion and enhancement of our fleet of drilling rigs, through newbuild construction and upgrade projects, and the return of capital to shareholders through dividend payments.
We expect that our operating cash flows will be dedicated to finance newbuild construction and upgrade projects and service our long-term debt. We also intend to continue paying quarterly dividends for the foreseeable future. However, our Board of Directors may change the timing and payment amount depending on several factors including our profitability, liquidity, financial condition, reinvestment opportunities and capital requirements. Based on our balance sheet and current contractual backlog of $10.7 billion, we believe future capital project, debt service and dividend payment obligations will primarily be funded from future operating cash flows and borrowings under our commercial paper program and/or revolving credit facility. We may decide to access debt and/or equity markets to raise additional capital or increase liquidity as necessary.
During the three-year period ended December 31, 2013, our primary source of cash was an aggregate $4.9 billion generated from operating activities of continuing operations, $2.5 billion in proceeds from the issuance of our senior notes and $203.0 million in proceeds from rig sales. Our primary uses of cash during the same period included $4.3 billion for the construction, enhancement and other improvement of our drilling rigs, including $3.0 billion invested in our newbuild construction, $2.8 billion paid for the cash consideration of the Merger, $1.2 billion for dividend payments and $308.3 million for long-term debt payments.
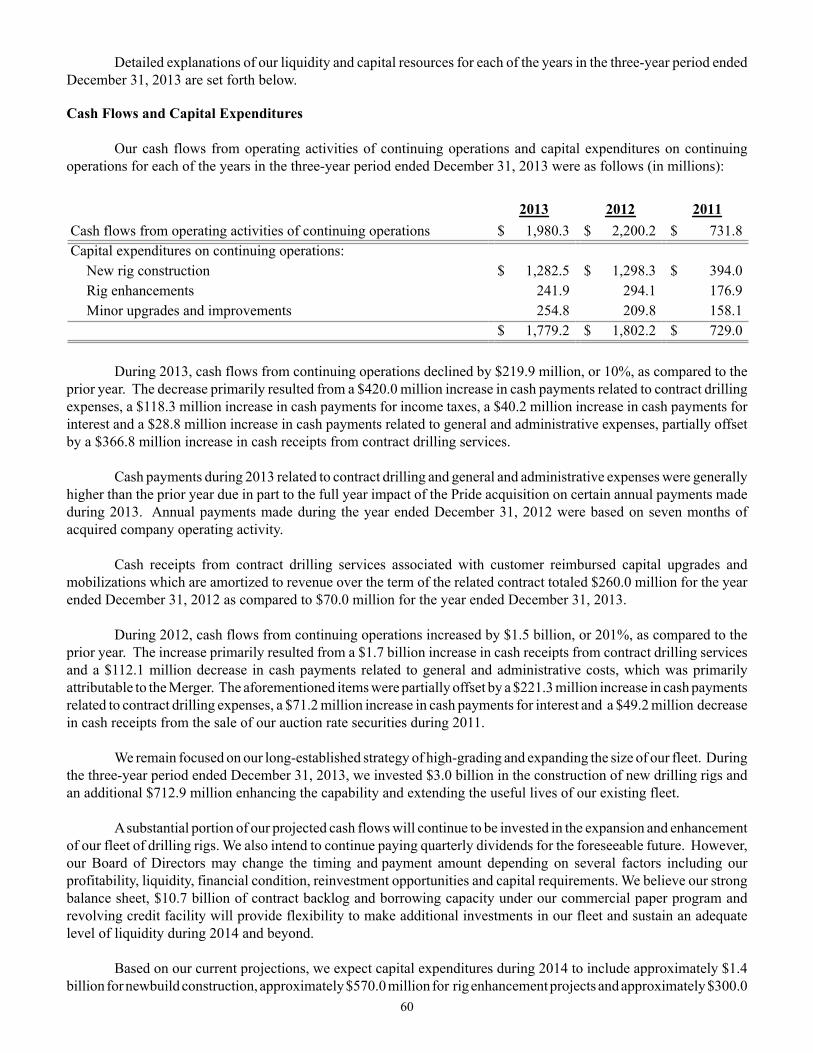
60
Detailed explanations of our liquidity and capital resources for each of the years in the three-year period ended December 31, 2013 are set forth below.
Cash Flows and Capital Expenditures Our cash flows from operating activities of continuing operations and capital expenditures on continuing operations for each of the years in the three-year period ended December 31, 2013 were as follows (in millions):
2013 2012 2011Cash flows from operating activities of continuing operations $ 1,980.3 $ 2,200.2 $ 731.8Capital expenditures on continuing operations:
New rig construction $ 1,282.5 $ 1,298.3 $ 394.0Rig enhancements 241.9 294.1 176.9Minor upgrades and improvements 254.8 209.8 158.1
$ 1,779.2 $ 1,802.2 $ 729.0 During 2013, cash flows from continuing operations declined by $219.9 million, or 10%, as compared to the prior year. The decrease primarily resulted from a $420.0 million increase in cash payments related to contract drilling expenses, a $118.3 million increase in cash payments for income taxes, a $40.2 million increase in cash payments for interest and a $28.8 million increase in cash payments related to general and administrative expenses, partially offset by a $366.8 million increase in cash receipts from contract drilling services. Cash payments during 2013 related to contract drilling and general and administrative expenses were generally higher than the prior year due in part to the full year impact of the Pride acquisition on certain annual payments made during 2013. Annual payments made during the year ended December 31, 2012 were based on seven months of acquired company operating activity.
Cash receipts from contract drilling services associated with customer reimbursed capital upgrades and mobilizations which are amortized to revenue over the term of the related contract totaled $260.0 million for the year ended December 31, 2012 as compared to $70.0 million for the year ended December 31, 2013.
During 2012, cash flows from continuing operations increased by $1.5 billion, or 201%, as compared to the prior year. The increase primarily resulted from a $1.7 billion increase in cash receipts from contract drilling services and a $112.1 million decrease in cash payments related to general and administrative costs, which was primarily attributable to the Merger. The aforementioned items were partially offset by a $221.3 million increase in cash payments related to contract drilling expenses, a $71.2 million increase in cash payments for interest and a $49.2 million decrease in cash receipts from the sale of our auction rate securities during 2011. We remain focused on our long-established strategy of high-grading and expanding the size of our fleet. During the three-year period ended December 31, 2013, we invested $3.0 billion in the construction of new drilling rigs and an additional $712.9 million enhancing the capability and extending the useful lives of our existing fleet. A substantial portion of our projected cash flows will continue to be invested in the expansion and enhancement of our fleet of drilling rigs. We also intend to continue paying quarterly dividends for the foreseeable future. However, our Board of Directors may change the timing and payment amount depending on several factors including our profitability, liquidity, financial condition, reinvestment opportunities and capital requirements. We believe our strong balance sheet, $10.7 billion of contract backlog and borrowing capacity under our commercial paper program and revolving credit facility will provide flexibility to make additional investments in our fleet and sustain an adequate level of liquidity during 2014 and beyond. Based on our current projections, we expect capital expenditures during 2014 to include approximately $1.4 billion for newbuild construction, approximately $570.0 million for rig enhancement projects and approximately $300.0
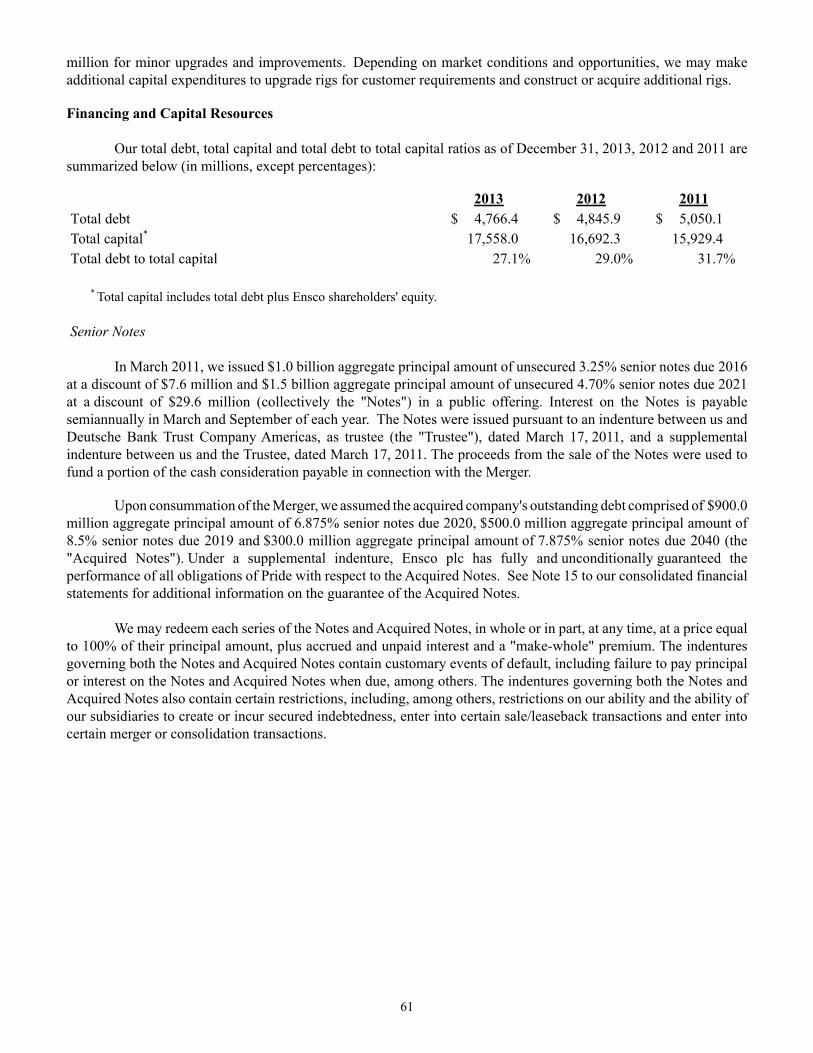
61
million for minor upgrades and improvements. Depending on market conditions and opportunities, we may make additional capital expenditures to upgrade rigs for customer requirements and construct or acquire additional rigs.
Financing and Capital Resources Our total debt, total capital and total debt to total capital ratios as of December 31, 2013, 2012 and 2011 are summarized below (in millions, except percentages):
2013 2012 2011Total debt $ 4,766.4 $ 4,845.9 $ 5,050.1Total capital* 17,558.0 16,692.3 15,929.4Total debt to total capital 27.1% 29.0% 31.7%
* Total capital includes total debt plus Ensco shareholders' equity. Senior Notes In March 2011, we issued $1.0 billion aggregate principal amount of unsecured 3.25% senior notes due 2016 at a discount of $7.6 million and $1.5 billion aggregate principal amount of unsecured 4.70% senior notes due 2021 at a discount of $29.6 million (collectively the "Notes") in a public offering. Interest on the Notes is payable semiannually in March and September of each year. The Notes were issued pursuant to an indenture between us and Deutsche Bank Trust Company Americas, as trustee (the "Trustee"), dated March 17, 2011, and a supplemental indenture between us and the Trustee, dated March 17, 2011. The proceeds from the sale of the Notes were used to fund a portion of the cash consideration payable in connection with the Merger.
Upon consummation of the Merger, we assumed the acquired company's outstanding debt comprised of $900.0 million aggregate principal amount of 6.875% senior notes due 2020, $500.0 million aggregate principal amount of 8.5% senior notes due 2019 and $300.0 million aggregate principal amount of 7.875% senior notes due 2040 (the "Acquired Notes"). Under a supplemental indenture, Ensco plc has fully and unconditionally guaranteed the performance of all obligations of Pride with respect to the Acquired Notes. See Note 15 to our consolidated financial statements for additional information on the guarantee of the Acquired Notes. We may redeem each series of the Notes and Acquired Notes, in whole or in part, at any time, at a price equal to 100% of their principal amount, plus accrued and unpaid interest and a "make-whole" premium. The indentures governing both the Notes and Acquired Notes contain customary events of default, including failure to pay principal or interest on the Notes and Acquired Notes when due, among others. The indentures governing both the Notes and Acquired Notes also contain certain restrictions, including, among others, restrictions on our ability and the ability of our subsidiaries to create or incur secured indebtedness, enter into certain sale/leaseback transactions and enter into certain merger or consolidation transactions.
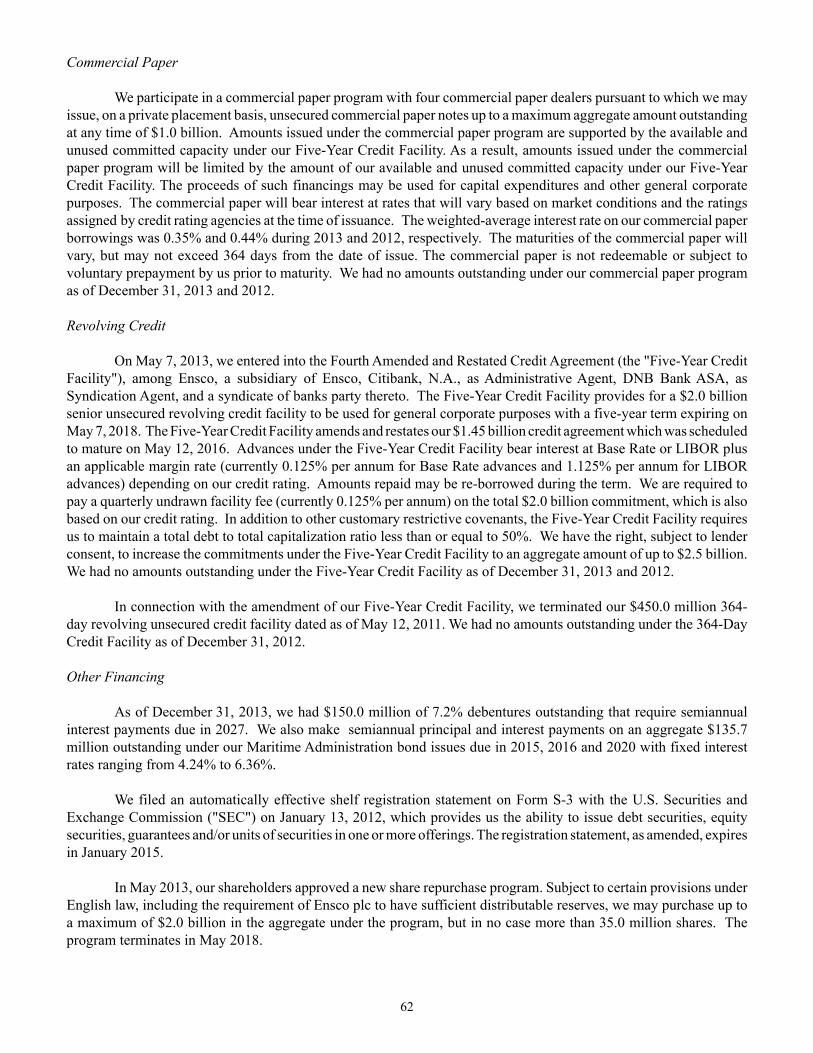
62
Commercial Paper We participate in a commercial paper program with four commercial paper dealers pursuant to which we may issue, on a private placement basis, unsecured commercial paper notes up to a maximum aggregate amount outstanding at any time of $1.0 billion. Amounts issued under the commercial paper program are supported by the available and unused committed capacity under our Five-Year Credit Facility. As a result, amounts issued under the commercial paper program will be limited by the amount of our available and unused committed capacity under our Five-Year Credit Facility. The proceeds of such financings may be used for capital expenditures and other general corporate purposes. The commercial paper will bear interest at rates that will vary based on market conditions and the ratings assigned by credit rating agencies at the time of issuance. The weighted-average interest rate on our commercial paper borrowings was 0.35% and 0.44% during 2013 and 2012, respectively. The maturities of the commercial paper will vary, but may not exceed 364 days from the date of issue. The commercial paper is not redeemable or subject to voluntary prepayment by us prior to maturity. We had no amounts outstanding under our commercial paper program as of December 31, 2013 and 2012.
Revolving Credit
On May 7, 2013, we entered into the Fourth Amended and Restated Credit Agreement (the "Five-Year Credit Facility"), among Ensco, a subsidiary of Ensco, Citibank, N.A., as Administrative Agent, DNB Bank ASA, as Syndication Agent, and a syndicate of banks party thereto. The Five-Year Credit Facility provides for a $2.0 billion senior unsecured revolving credit facility to be used for general corporate purposes with a five-year term expiring on May 7, 2018. The Five-Year Credit Facility amends and restates our $1.45 billion credit agreement which was scheduled to mature on May 12, 2016. Advances under the Five-Year Credit Facility bear interest at Base Rate or LIBOR plus an applicable margin rate (currently 0.125% per annum for Base Rate advances and 1.125% per annum for LIBOR advances) depending on our credit rating. Amounts repaid may be re-borrowed during the term. We are required to pay a quarterly undrawn facility fee (currently 0.125% per annum) on the total $2.0 billion commitment, which is also based on our credit rating. In addition to other customary restrictive covenants, the Five-Year Credit Facility requires us to maintain a total debt to total capitalization ratio less than or equal to 50%. We have the right, subject to lender consent, to increase the commitments under the Five-Year Credit Facility to an aggregate amount of up to $2.5 billion. We had no amounts outstanding under the Five-Year Credit Facility as of December 31, 2013 and 2012.
In connection with the amendment of our Five-Year Credit Facility, we terminated our $450.0 million 364-day revolving unsecured credit facility dated as of May 12, 2011. We had no amounts outstanding under the 364-Day Credit Facility as of December 31, 2012.
Other Financing As of December 31, 2013, we had $150.0 million of 7.2% debentures outstanding that require semiannual interest payments due in 2027. We also make semiannual principal and interest payments on an aggregate $135.7 million outstanding under our Maritime Administration bond issues due in 2015, 2016 and 2020 with fixed interest rates ranging from 4.24% to 6.36%.
We filed an automatically effective shelf registration statement on Form S-3 with the U.S. Securities and Exchange Commission ("SEC") on January 13, 2012, which provides us the ability to issue debt securities, equity securities, guarantees and/or units of securities in one or more offerings. The registration statement, as amended, expires in January 2015.
In May 2013, our shareholders approved a new share repurchase program. Subject to certain provisions under English law, including the requirement of Ensco plc to have sufficient distributable reserves, we may purchase up to a maximum of $2.0 billion in the aggregate under the program, but in no case more than 35.0 million shares. The program terminates in May 2018.
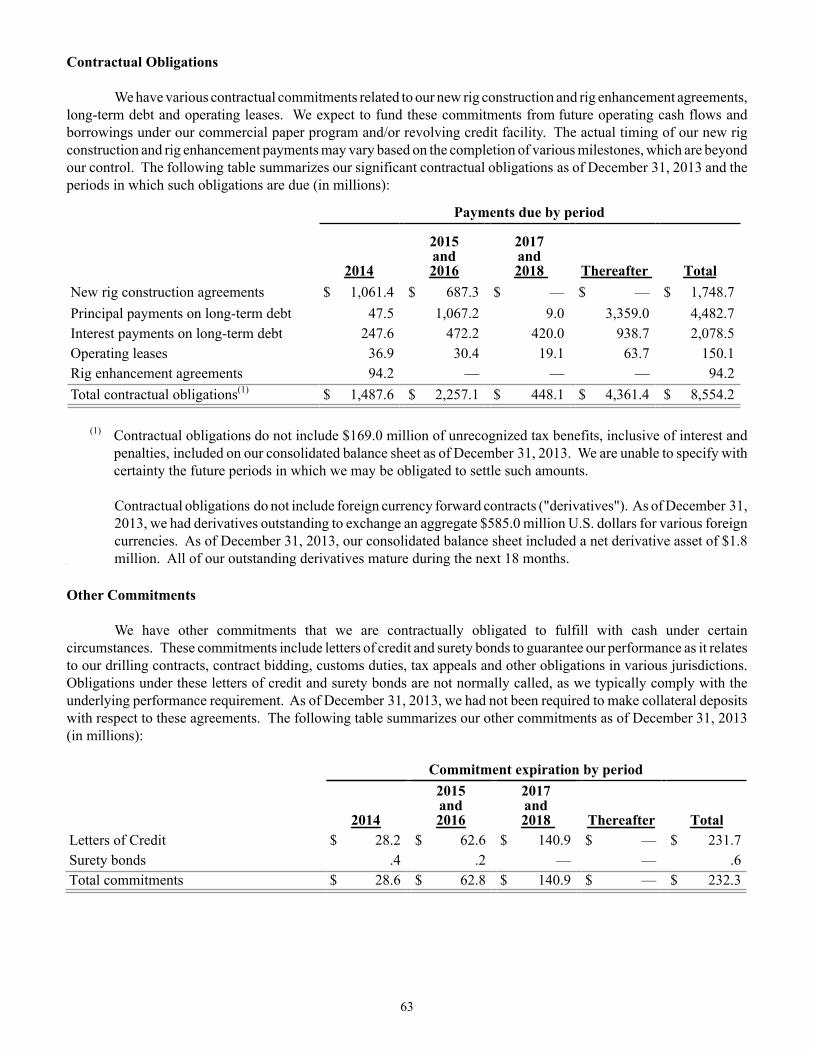
63
Contractual Obligations
We have various contractual commitments related to our new rig construction and rig enhancement agreements, long-term debt and operating leases. We expect to fund these commitments from future operating cash flows and borrowings under our commercial paper program and/or revolving credit facility. The actual timing of our new rig construction and rig enhancement payments may vary based on the completion of various milestones, which are beyond our control. The following table summarizes our significant contractual obligations as of December 31, 2013 and the periods in which such obligations are due (in millions):
Payments due by period
2014
2015and 2016
2017and 2018 Thereafter Total
New rig construction agreements $ 1,061.4 $ 687.3 $ — $ — $ 1,748.7Principal payments on long-term debt 47.5 1,067.2 9.0 3,359.0 4,482.7Interest payments on long-term debt 247.6 472.2 420.0 938.7 2,078.5Operating leases 36.9 30.4 19.1 63.7 150.1Rig enhancement agreements 94.2 — — — 94.2Total contractual obligations(1) $ 1,487.6 $ 2,257.1 $ 448.1 $ 4,361.4 $ 8,554.2
(1) Contractual obligations do not include $169.0 million of unrecognized tax benefits, inclusive of interest and
penalties, included on our consolidated balance sheet as of December 31, 2013. We are unable to specify with certainty the future periods in which we may be obligated to settle such amounts.
Contractual obligations do not include foreign currency forward contracts ("derivatives"). As of December 31, 2013, we had derivatives outstanding to exchange an aggregate $585.0 million U.S. dollars for various foreign currencies. As of December 31, 2013, our consolidated balance sheet included a net derivative asset of $1.8 million. All of our outstanding derivatives mature during the next 18 months.
a
Other Commitments
We have other commitments that we are contractually obligated to fulfill with cash under certain circumstances. These commitments include letters of credit and surety bonds to guarantee our performance as it relates to our drilling contracts, contract bidding, customs duties, tax appeals and other obligations in various jurisdictions. Obligations under these letters of credit and surety bonds are not normally called, as we typically comply with the underlying performance requirement. As of December 31, 2013, we had not been required to make collateral deposits with respect to these agreements. The following table summarizes our other commitments as of December 31, 2013 (in millions):
Commitment expiration by period
2014
2015and 2016
2017and 2018 Thereafter Total
Letters of Credit $ 28.2 $ 62.6 $ 140.9 $ — $ 231.7Surety bonds .4 .2 — — .6Total commitments $ 28.6 $ 62.8 $ 140.9 $ — $ 232.3
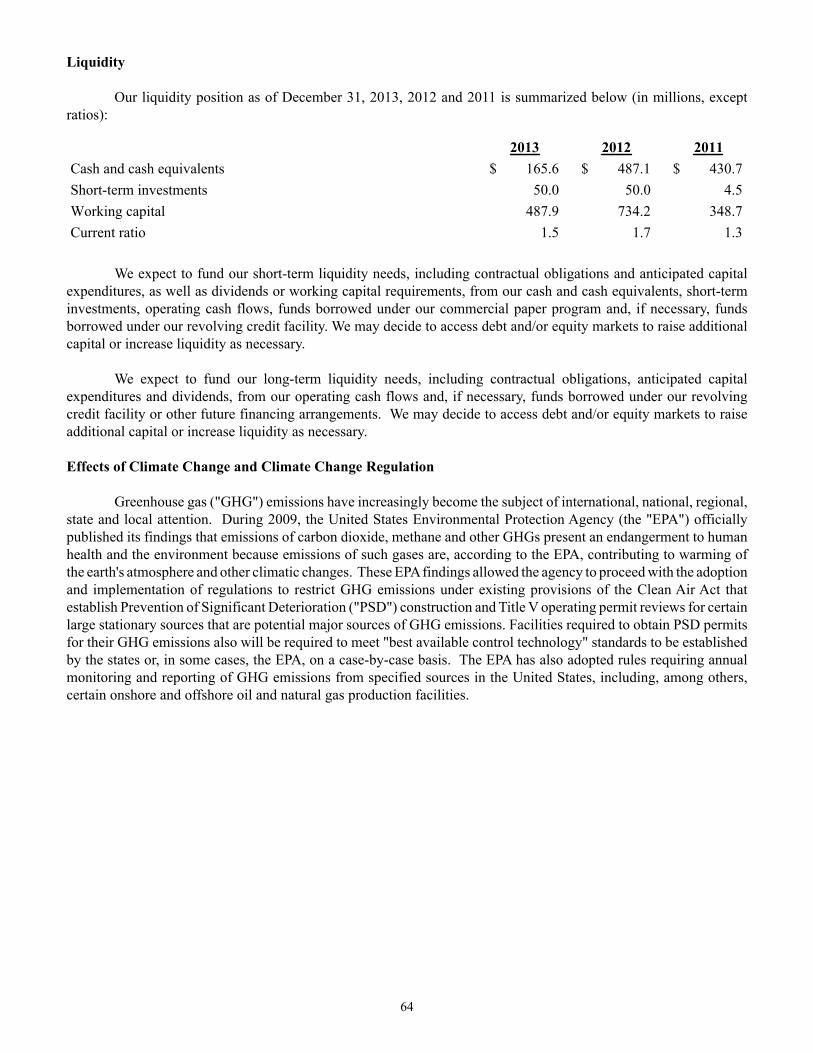
64
Liquidity Our liquidity position as of December 31, 2013, 2012 and 2011 is summarized below (in millions, except ratios):
2013 2012 2011Cash and cash equivalents $ 165.6 $ 487.1 $ 430.7Short-term investments 50.0 50.0 4.5Working capital 487.9 734.2 348.7Current ratio 1.5 1.7 1.3
We expect to fund our short-term liquidity needs, including contractual obligations and anticipated capital expenditures, as well as dividends or working capital requirements, from our cash and cash equivalents, short-term investments, operating cash flows, funds borrowed under our commercial paper program and, if necessary, funds borrowed under our revolving credit facility. We may decide to access debt and/or equity markets to raise additional capital or increase liquidity as necessary.
We expect to fund our long-term liquidity needs, including contractual obligations, anticipated capital expenditures and dividends, from our operating cash flows and, if necessary, funds borrowed under our revolving credit facility or other future financing arrangements. We may decide to access debt and/or equity markets to raise additional capital or increase liquidity as necessary.
Effects of Climate Change and Climate Change Regulation Greenhouse gas ("GHG") emissions have increasingly become the subject of international, national, regional, state and local attention. During 2009, the United States Environmental Protection Agency (the "EPA") officially published its findings that emissions of carbon dioxide, methane and other GHGs present an endangerment to human health and the environment because emissions of such gases are, according to the EPA, contributing to warming of the earth's atmosphere and other climatic changes. These EPA findings allowed the agency to proceed with the adoption and implementation of regulations to restrict GHG emissions under existing provisions of the Clean Air Act that establish Prevention of Significant Deterioration ("PSD") construction and Title V operating permit reviews for certain large stationary sources that are potential major sources of GHG emissions. Facilities required to obtain PSD permits for their GHG emissions also will be required to meet "best available control technology" standards to be established by the states or, in some cases, the EPA, on a case-by-case basis. The EPA has also adopted rules requiring annual monitoring and reporting of GHG emissions from specified sources in the United States, including, among others, certain onshore and offshore oil and natural gas production facilities.
65
Beginning this year, the Companies Act 2006 (Strategic and Directors' Reports) Regulations 2013 now requires all quoted U.K. companies to report their annual GHG emissions in the company's directors' report. Additionally, in recent years, cap and trade initiatives to limit GHG emissions have been introduced in the European Union. Similarly, a number of bills related to climate change have been introduced in the U.S. Congress. If these or similar bills were to be adopted, such legislation could adversely impact many industries. However, it appears unlikely that comprehensive federal climate legislation will be passed by Congress in the foreseeable future. In the absence of federal legislation, almost half of the states have begun to address GHG emissions, primarily through the development or planned development of emission inventories or regional GHG cap and trade programs. Future regulation of GHG emissions could occur pursuant to future treaty obligations, statutory or regulatory changes or new climate change legislation in the jurisdictions in which we operate. If Congress undertakes comprehensive tax reform in the future, it is possible that such reform may include a carbon tax, which could impose additional direct costs on operations and reduce demand for refined products. Depending on the particular program, we, or our customers, could be required to control GHG emissions or to purchase and surrender allowances for GHG emissions resulting from our operations. It is uncertain whether any of these initiatives will be implemented. If such initiatives are implemented, we do not believe that such initiatives would have a direct, material adverse effect on our financial condition, operating results or cash flows in a manner different than our competitors.
Restrictions on GHG emissions or other related legislative or regulatory enactments could have an indirect effect in those industries that use significant amounts of petroleum products, which could potentially result in a reduction in demand for petroleum products and, consequently, our offshore contract drilling services. We are currently unable to predict the manner or extent of any such effect. Furthermore, one of the long-term physical effects of climate change may be an increase in the severity and frequency of adverse weather conditions, such as hurricanes, which may increase our insurance costs or risk retention, limit insurance availability or reduce the areas in which, or the number of days during which, our customers would contract for our drilling rigs in general and in the Gulf of Mexico in particular. We are currently unable to predict the manner or extent of any such effect.
MARKET RISK We use derivatives to reduce our exposure to foreign currency exchange rate risk. Our functional currency is the U.S. dollar. As is customary in the oil and gas industry, a majority of our revenues and expenses are denominated in U.S. dollars; however, a portion of the revenues earned and expenses incurred by certain of our subsidiaries are denominated in currencies other than the U.S. dollar. We maintain a foreign currency exchange rate risk management strategy that utilizes derivatives to reduce our exposure to unanticipated fluctuations in earnings and cash flows caused by changes in foreign currency exchange rates.
We utilize cash flow hedges to hedge forecasted foreign currency denominated transactions, primarily to reduce our exposure to foreign currency exchange rate risk on future expected contract drilling expenses and capital expenditures denominated in various foreign currencies. We predominantly structure our drilling contracts in U.S. dollars, which significantly reduces the portion of our cash flows and assets denominated in foreign currencies. As of December 31, 2013, we had cash flow hedges outstanding to exchange an aggregate $376.1 million for various foreign currencies.
We have net assets and liabilities denominated in numerous foreign currencies and use various strategies to manage our exposure to changes in foreign currency exchange rates. We occasionally enter into derivatives that hedge the fair value of recognized foreign currency denominated assets or liabilities, thereby reducing exposure to earnings fluctuations caused by changes in foreign currency exchange rates. We do not designate such derivatives as hedging instruments. In these situations, a natural hedging relationship generally exists whereby changes in the fair value of the derivatives offset changes in the fair value of the underlying hedged items. As of December 31, 2013, we held derivatives not designated as hedging instruments to exchange an aggregate $208.9 million for various foreign currencies.
If we were to incur a hypothetical 10% adverse change in foreign currency exchange rates, net unrealized losses associated with our foreign currency denominated assets and liabilities as of December 31, 2013 would
66
approximate $24.2 million. Approximately $18.1 million of these unrealized losses would be offset by corresponding gains on the derivatives utilized to offset changes in the fair value of net assets and liabilities denominated in foreign currencies.
We utilize derivatives and undertake foreign currency exchange rate hedging activities in accordance with our established policies for the management of market risk. We mitigate our credit risk relating to counterparties of our derivatives through a variety of techniques, including transacting with multiple, high-quality financial institutions, thereby limiting our exposure to individual counterparties and by entering into International Swaps and Derivatives Association, Inc. (“ISDA”) Master Agreements, which include provisions for a legally enforceable master netting agreement, with almost all of our derivative counterparties. The terms of the ISDA agreements may also include credit support requirements, cross default provisions, termination events, or set-off provisions. Legally enforceable master netting agreements reduce credit risk by providing protection in bankruptcy in certain circumstances and generally permitting the closeout and netting of transactions with the same counterparty upon the occurrence of certain events.
We do not enter into derivatives for trading or other speculative purposes. We believe that our use of derivatives and related hedging activities reduces our exposure to foreign currency exchange rate risk and does not expose us to material credit risk or any other material market risk. All of our derivatives mature during the next 18 months. See Note 6 to our consolidated financial statements for additional information on our derivative instruments.
CRITICAL ACCOUNTING POLICIES AND ESTIMATES The preparation of financial statements and related disclosures in conformity with accounting principles generally accepted in the United States of America requires our management to make estimates, judgments and assumptions that affect the amounts reported in our consolidated financial statements and accompanying notes. Our significant accounting policies are included in Note 1 to our consolidated financial statements. These policies, along with our underlying judgments and assumptions made in their application, have a significant impact on our consolidated financial statements. We identify our critical accounting policies as those that are the most pervasive and important to the portrayal of our financial position and operating results and that require the most difficult, subjective and/or complex judgments by management regarding estimates in matters that are inherently uncertain. Our critical accounting policies are those related to property and equipment, impairment of long-lived assets and goodwill and income taxes.
Property and Equipment
As of December 31, 2013, the carrying value of our property and equipment totaled $14.3 billion, which represented 73% of total assets. This carrying value reflects the application of our property and equipment accounting policies, which incorporate management's estimates, judgments and assumptions relative to the capitalized costs, useful lives and salvage values of our rigs. We develop and apply property and equipment accounting policies that are designed to appropriately and consistently capitalize those costs incurred to enhance, improve and extend the useful lives of our assets and expense those costs incurred to repair or maintain the existing condition or useful lives of our assets. The development and application of such policies requires estimates, judgments and assumptions by management relative to the nature of, and benefits from, expenditures on our assets. We establish property and equipment accounting policies that are designed to depreciate our assets over their estimated useful lives. The judgments and assumptions used by management in determining the useful lives of our property and equipment reflect both historical experience and expectations regarding future operations, utilization and performance of our assets. The use of different estimates, judgments and assumptions in the establishment of our property and equipment accounting policies, especially those involving the useful lives of our rigs, would likely result in materially different asset carrying values and operating results. The useful lives of our drilling rigs are difficult to estimate due to a variety of factors, including technological advances that impact the methods or cost of oil and natural gas exploration and development, changes in market or economic conditions and changes in laws or regulations affecting the drilling industry. We evaluate the remaining useful lives of our rigs on a periodic basis, considering operating condition, functional capability and market and
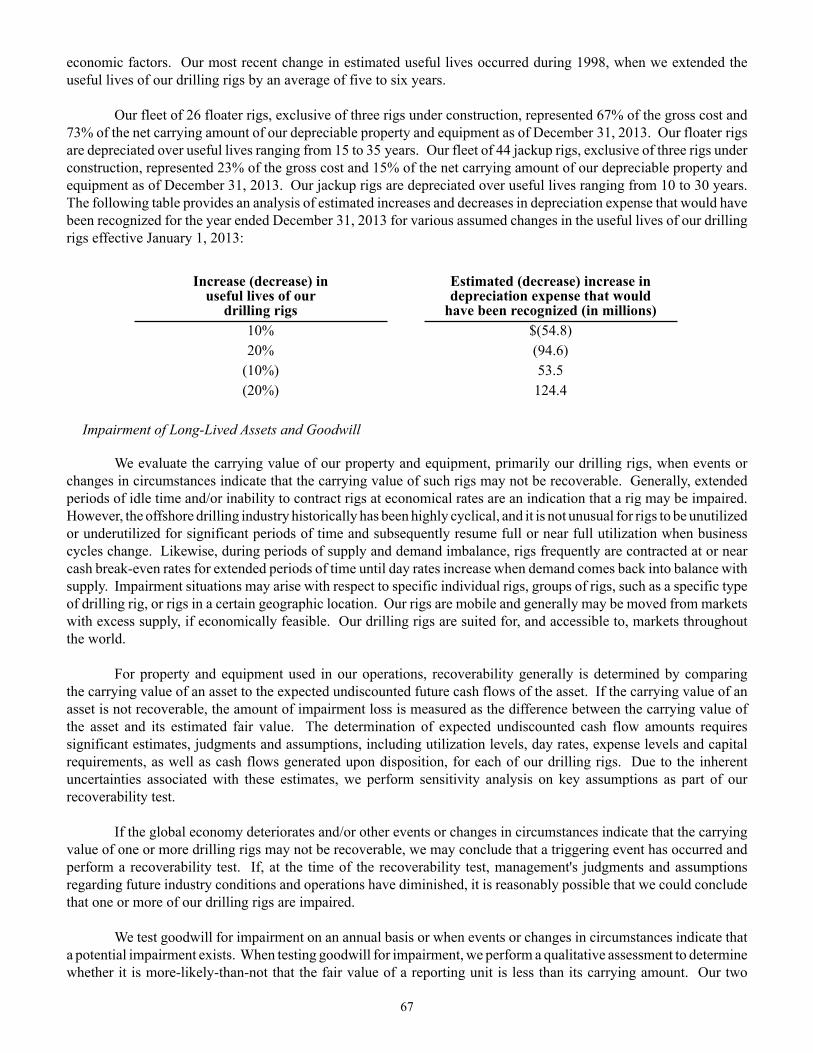
67
economic factors. Our most recent change in estimated useful lives occurred during 1998, when we extended the useful lives of our drilling rigs by an average of five to six years. Our fleet of 26 floater rigs, exclusive of three rigs under construction, represented 67% of the gross cost and 73% of the net carrying amount of our depreciable property and equipment as of December 31, 2013. Our floater rigs are depreciated over useful lives ranging from 15 to 35 years. Our fleet of 44 jackup rigs, exclusive of three rigs under construction, represented 23% of the gross cost and 15% of the net carrying amount of our depreciable property and equipment as of December 31, 2013. Our jackup rigs are depreciated over useful lives ranging from 10 to 30 years. The following table provides an analysis of estimated increases and decreases in depreciation expense that would have been recognized for the year ended December 31, 2013 for various assumed changes in the useful lives of our drilling rigs effective January 1, 2013:
Increase (decrease) inuseful lives of our
drilling rigs
Estimated (decrease) increase indepreciation expense that would
have been recognized (in millions)10% $(54.8)20% (94.6)
(10%) 53.5(20%) 124.4
Impairment of Long-Lived Assets and Goodwill
We evaluate the carrying value of our property and equipment, primarily our drilling rigs, when events or changes in circumstances indicate that the carrying value of such rigs may not be recoverable. Generally, extended periods of idle time and/or inability to contract rigs at economical rates are an indication that a rig may be impaired. However, the offshore drilling industry historically has been highly cyclical, and it is not unusual for rigs to be unutilized or underutilized for significant periods of time and subsequently resume full or near full utilization when business cycles change. Likewise, during periods of supply and demand imbalance, rigs frequently are contracted at or near cash break-even rates for extended periods of time until day rates increase when demand comes back into balance with supply. Impairment situations may arise with respect to specific individual rigs, groups of rigs, such as a specific type of drilling rig, or rigs in a certain geographic location. Our rigs are mobile and generally may be moved from markets with excess supply, if economically feasible. Our drilling rigs are suited for, and accessible to, markets throughout the world.
For property and equipment used in our operations, recoverability generally is determined by comparing the carrying value of an asset to the expected undiscounted future cash flows of the asset. If the carrying value of an asset is not recoverable, the amount of impairment loss is measured as the difference between the carrying value of the asset and its estimated fair value. The determination of expected undiscounted cash flow amounts requires significant estimates, judgments and assumptions, including utilization levels, day rates, expense levels and capital requirements, as well as cash flows generated upon disposition, for each of our drilling rigs. Due to the inherent uncertainties associated with these estimates, we perform sensitivity analysis on key assumptions as part of our recoverability test.
If the global economy deteriorates and/or other events or changes in circumstances indicate that the carrying value of one or more drilling rigs may not be recoverable, we may conclude that a triggering event has occurred and perform a recoverability test. If, at the time of the recoverability test, management's judgments and assumptions regarding future industry conditions and operations have diminished, it is reasonably possible that we could conclude that one or more of our drilling rigs are impaired.
We test goodwill for impairment on an annual basis or when events or changes in circumstances indicate that a potential impairment exists. When testing goodwill for impairment, we perform a qualitative assessment to determine whether it is more-likely-than-not that the fair value of a reporting unit is less than its carrying amount. Our two
68
reportable segments represent our reporting units. If we determine it is more-likely-than-not that the fair value of a reporting unit exceeds its carrying value after qualitatively assessing all facts and circumstances, its goodwill is considered not impaired.
If the global economy deteriorates and/or our expectations relative to future offshore drilling industry conditions decline, we may conclude that the fair value of one or both of our reporting units has more-likely-than-not declined below its carrying amount and perform a quantitative assessment whereby we estimate the fair value of each reporting unit. If, at the time of the goodwill impairment test, management's judgments and assumptions regarding future industry conditions and operations have diminished, or if the market value of our shares has declined, we could conclude that the goodwill of one or both of our reporting units has been impaired. In most instances, our calculation of the fair values of our reporting units is based on estimates of future discounted cash flows to be generated by our drilling rigs, which reflect management's judgments and assumptions regarding the appropriate risk-adjusted discount rate, as well as future industry conditions and operations, including expected utilization levels, day rates, expense levels, capital requirements and terminal values for each of our rigs. Due to the inherent uncertainties associated with these estimates, we perform sensitivity analysis on key assumptions as part of our goodwill impairment test. It is reasonably possible that the judgments and assumptions inherent in our goodwill impairment test may change in response to future market conditions.
If the aggregate fair value of our reporting units exceeds our market capitalization, we evaluate the reasonableness of the implied control premium which includes a comparison to implied control premiums from recent market transactions within our industry or other relevant benchmark data. To the extent that the implied control premium based on the aggregate fair value of our reporting units is not reasonable, we adjust the discount rate or other assumptions used in our discounted cash flow model and reduce the estimated fair values of our reporting units.
If the estimated fair value of a reporting unit exceeds its carrying value, its goodwill is considered not impaired. If the estimated fair value of a reporting unit is less than its carrying value, we estimate the implied fair value of the reporting unit's goodwill. If the carrying amount of the reporting unit's goodwill exceeds the implied fair value of the goodwill, an impairment loss is recognized in an amount equal to such excess. In the event we dispose of drilling rig operations that constitute a business, goodwill would be allocated in the determination of gain or loss on disposal.
Based on a qualitative assessment performed as of December 31, 2013 for our annual goodwill impairment test, we concluded it was more-likely-than-not that the fair value of our reporting units exceeded their carrying amount and there was no impairment of goodwill. However, if the market value of our shares declines for a prolonged period, and if management's judgments and assumptions regarding future industry conditions and operations diminish, it is reasonably possible that our expectations of future cash flows may decline and ultimately result in a goodwill impairment for our Floaters reporting unit. Asset impairment evaluations are highly subjective. In most instances, they involve expectations of future cash flows to be generated by our drilling rigs, which reflect management's judgments and assumptions regarding future industry conditions and operations, as well as management's estimates of expected utilization levels, day rates, expense levels and capital requirements. The estimates, judgments and assumptions used by management in the application of our asset impairment policies reflect both historical experience and an assessment of current operational, industry, market, economic and political environments. The use of different estimates, judgments, assumptions and expectations regarding future industry conditions and operations would likely result in materially different asset carrying values and operating results.
Income Taxes We conduct operations and earn income in numerous countries and are subject to the laws of numerous tax jurisdictions. As of December 31, 2013, our consolidated balance sheet included a $295.0 million net deferred income tax liability, a $63.1 million liability for income taxes currently payable and a $169.0 million liability for unrecognized tax benefits, inclusive of interest and penalties.
69
The carrying values of deferred income tax assets and liabilities reflect the application of our income tax accounting policies and are based on management's estimates, judgments and assumptions regarding future operating results and levels of taxable income. Carryforwards and tax credits are assessed for realization as a reduction of future taxable income by using a more-likely-than-not determination. We do not offset deferred tax assets and deferred tax liabilities attributable to different tax paying jurisdictions. We do not provide deferred taxes on the undistributed earnings of certain subsidiaries because our policy and intention is to reinvest such earnings indefinitely. Should we make a distribution from these subsidiaries in the form of dividends or otherwise, we would be subject to additional income taxes.
The carrying values of liabilities for income taxes currently payable and unrecognized tax benefits are based on management's interpretation of applicable tax laws and incorporate management's estimates, judgments and assumptions regarding the use of tax planning strategies in various taxing jurisdictions. The use of different estimates, judgments and assumptions in connection with accounting for income taxes, especially those involving the deployment of tax planning strategies, may result in materially different carrying values of income tax assets and liabilities and operating results.
We operate in several jurisdictions where tax laws relating to the offshore drilling industry are not well developed. In jurisdictions where available statutory law and regulations are incomplete or underdeveloped, we obtain professional guidance and consider existing industry practices before utilizing tax planning strategies and meeting our tax obligations. Tax returns are routinely subject to audit in most jurisdictions and tax liabilities occasionally are finalized through a negotiation process. In some jurisdictions, income tax payments may be required before a final income tax obligation is determined in order to avoid significant penalties and/or interest. While we historically have not experienced significant adjustments to previously recognized tax assets and liabilities as a result of finalizing tax returns, there can be no assurance that significant adjustments will not arise in the future. In addition, there are several factors that could cause the future level of uncertainty relating to our tax liabilities to increase, including the following:
• During recent years, the number of tax jurisdictions in which we conduct operations has increased, and we currently anticipate that this trend will continue.
• In order to utilize tax planning strategies and conduct operations efficiently, our subsidiaries frequently enter into transactions with affiliates that are generally subject to complex tax regulations and are frequently reviewed and challenged by tax authorities.
• We may conduct future operations in certain tax jurisdictions where tax laws are not well developed, and it may be difficult to secure adequate professional guidance.
• Tax laws, regulations, agreements, treaties and the administrative practices and precedents of tax authorities change frequently, requiring us to modify existing tax strategies to conform to such changes.
70
NEW ACCOUNTING PRONOUNCEMENTS In July 2013, the Financial Accounting Standards Board ("FASB") issued Accounting Standards Update 2013-11, Presentation of an Unrecognized Tax Benefit When a Net Operating Loss Carryforward, a Similar Tax Loss, or a Tax Credit Carryforward Exists ("Update 2013-11"), an amendment to FASB ASC Topic 740. The new guidance requires an unrecognized tax benefit be presented in the financial statements as a reduction to a deferred tax asset for a net operating loss carryforward, similar tax loss or a tax credit carryforward. To the extent the tax benefit is not available at the reporting date under the governing tax law or if the entity does not intend to use the deferred tax asset for such purpose, the unrecognized tax benefit should be presented as a liability and not combined with deferred tax assets. Update 2013-11 is effective for annual and interim periods for fiscal years beginning after December 15, 2013. We will adopt the accounting standard on a prospective basis effective January 1, 2014. We do not expect the adoption to have a material effect on our consolidated financial statements.
Item 7A. Quantitative and Qualitative Disclosures About Market Risk
Information required under Item 7A. has been incorporated into "Item 7. Management's Discussion and Analysis of Financial Condition and Results of Operations - Market Risk."
Item 8. Financial Statements and Supplementary Data
MANAGEMENT'S REPORT ON INTERNAL CONTROL OVER FINANCIAL REPORTING
Our management is responsible for establishing and maintaining adequate internal control over financial reporting, as such term is defined in Exchange Act Rules 13a-15(f) or 15d-15(f). Our internal control over financial reporting system is designed to provide reasonable assurance to our management and Board of Directors regarding the preparation and fair presentation of published financial statements. Because of its inherent limitations, internal control over financial reporting may not prevent or detect misstatements. Therefore, even those systems determined to be effective can provide only reasonable assurance with respect to financial statement preparation and presentation. Projections of any evaluation of effectiveness to future periods are subject to the risk that controls may become inadequate because of changes in conditions, or that the degree of compliance with the policies or procedures may deteriorate.
Under the supervision and with the participation of management, including the Chief Executive Officer and Chief Financial Officer, we have conducted an evaluation of the effectiveness of our internal control over financial reporting based on the framework in Internal Control - Integrated Framework (1992) issued by the Committee of Sponsoring Organizations of the Treadway Commission. Based on this evaluation, we have concluded that our internal control over financial reporting is effective as of December 31, 2013 to provide reasonable assurance regarding the reliability of financial reporting and the preparation of financial statements for external purposes in accordance with generally accepted accounting principles.
KPMG LLP, the independent registered public accounting firm who audited our consolidated financial statements, has issued an audit report on our internal control over financial reporting. KPMG LLP's audit report on our internal control over financial reporting is included herein.
February 26, 2014
71
REPORT OF INDEPENDENT REGISTERED PUBLIC ACCOUNTING FIRM
The Board of Directors and ShareholdersEnsco plc: We have audited the accompanying consolidated balance sheets of Ensco plc and subsidiaries (the Company) as of December 31, 2013 and 2012, and the related consolidated statements of income, comprehensive income, and cash flows for each of the years in the three-year period ended December 31, 2013. These consolidated financial statements are the responsibility of the Company's management. Our responsibility is to express an opinion on these consolidated financial statements based on our audits.
We conducted our audits in accordance with the standards of the Public Company Accounting Oversight Board (United States). Those standards require that we plan and perform the audit to obtain reasonable assurance about whether the financial statements are free of material misstatement. An audit includes examining, on a test basis, evidence supporting the amounts and disclosures in the financial statements. An audit also includes assessing the accounting principles used and significant estimates made by management, as well as evaluating the overall financial statement presentation. We believe that our audits provide a reasonable basis for our opinion.
In our opinion, the consolidated financial statements referred to above present fairly, in all material respects, the financial position of Ensco plc and subsidiaries as of December 31, 2013 and 2012, and the results of their operations and their cash flows for each of the years in the three-year period ended December 31, 2013, in conformity with U.S. generally accepted accounting principles.
We also have audited, in accordance with the standards of the Public Company Accounting Oversight Board (United States), Ensco plc's internal control over financial reporting as of December 31, 2013, based on criteria established in Internal Control - Integrated Framework (1992) issued by the Committee of Sponsoring Organizations of the Treadway Commission (COSO), and our report dated February 26, 2014, expressed an unqualified opinion on the effectiveness of Ensco plc's internal control over financial reporting.
/s/ KPMG LLP Houston, TexasFebruary 26, 2014
72
REPORT OF INDEPENDENT REGISTERED PUBLIC ACCOUNTING FIRM
The Board of Directors and ShareholdersEnsco plc:
We have audited Ensco plc's (the Company) internal control over financial reporting as of December 31, 2013, based on criteria established in Internal Control - Integrated Framework (1992) issued by the Committee of Sponsoring Organizations of the Treadway Commission (COSO). The Company's management is responsible for maintaining effective internal control over financial reporting and for its assessment of the effectiveness of internal control over financial reporting, included in the accompanying Management's Report on Internal Control over Financial Reporting. Our responsibility is to express an opinion on the Company's internal control over financial reporting based on our audit.
We conducted our audit in accordance with the standards of the Public Company Accounting Oversight Board (United States). Those standards require that we plan and perform the audit to obtain reasonable assurance about whether effective internal control over financial reporting was maintained in all material respects. Our audit included obtaining an understanding of internal control over financial reporting, assessing the risk that a material weakness exists, and testing and evaluating the design and operating effectiveness of internal control based on the assessed risk. Our audit also included performing such other procedures as we considered necessary in the circumstances. We believe that our audit provides a reasonable basis for our opinion.
A company's internal control over financial reporting is a process designed to provide reasonable assurance regarding the reliability of financial reporting and the preparation of financial statements for external purposes in accordance with generally accepted accounting principles. A company's internal control over financial reporting includes those policies and procedures that (1) pertain to the maintenance of records that, in reasonable detail, accurately and fairly reflect the transactions and dispositions of the assets of the company; (2) provide reasonable assurance that transactions are recorded as necessary to permit preparation of financial statements in accordance with generally accepted accounting principles, and that receipts and expenditures of the company are being made only in accordance with authorizations of management and directors of the company; and (3) provide reasonable assurance regarding prevention or timely detection of unauthorized acquisition, use, or disposition of the company's assets that could have a material effect on the financial statements.
Because of its inherent limitations, internal control over financial reporting may not prevent or detect misstatements. Also, projections of any evaluation of effectiveness to future periods are subject to the risk that controls may become inadequate because of changes in conditions, or that the degree of compliance with the policies or procedures may deteriorate.
In our opinion, Ensco plc maintained, in all material respects, effective internal control over financial reporting as of December 31, 2013, based on criteria established in Internal Control - Integrated Framework (1992) issued by the Committee of Sponsoring Organizations of the Treadway Commission. We also have audited, in accordance with the standards of the Public Company Accounting Oversight Board (United States), the consolidated balance sheets of Ensco plc and subsidiaries as of December 31, 2013 and 2012, and the related consolidated statements of income, comprehensive income, and cash flows for each of the years in the three-year period ended December 31, 2013, and our report dated February 26, 2014 expressed an unqualified opinion on those consolidated financial statements.
/s/ KPMG LLP
Houston, TexasFebruary 26, 2014
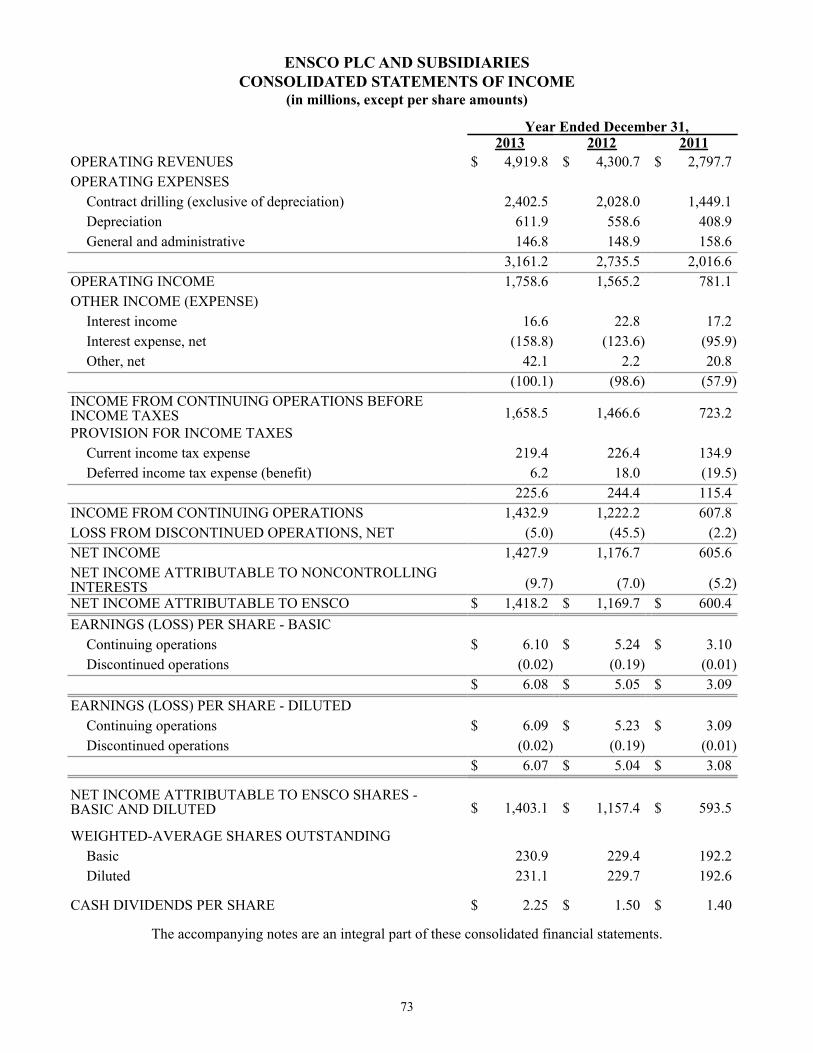
73
ENSCO PLC AND SUBSIDIARIESCONSOLIDATED STATEMENTS OF INCOME
(in millions, except per share amounts)
Year Ended December 31, 2013 2012 2011
OPERATING REVENUES $ 4,919.8 $ 4,300.7 $ 2,797.7OPERATING EXPENSES
Contract drilling (exclusive of depreciation) 2,402.5 2,028.0 1,449.1Depreciation 611.9 558.6 408.9General and administrative 146.8 148.9 158.6
3,161.2 2,735.5 2,016.6OPERATING INCOME 1,758.6 1,565.2 781.1OTHER INCOME (EXPENSE)
Interest income 16.6 22.8 17.2Interest expense, net (158.8) (123.6) (95.9)Other, net 42.1 2.2 20.8
(100.1) (98.6) (57.9)INCOME FROM CONTINUING OPERATIONS BEFOREINCOME TAXES 1,658.5 1,466.6 723.2PROVISION FOR INCOME TAXES
Current income tax expense 219.4 226.4 134.9Deferred income tax expense (benefit) 6.2 18.0 (19.5)
225.6 244.4 115.4INCOME FROM CONTINUING OPERATIONS 1,432.9 1,222.2 607.8LOSS FROM DISCONTINUED OPERATIONS, NET (5.0) (45.5) (2.2)NET INCOME 1,427.9 1,176.7 605.6NET INCOME ATTRIBUTABLE TO NONCONTROLLINGINTERESTS (9.7) (7.0) (5.2)NET INCOME ATTRIBUTABLE TO ENSCO $ 1,418.2 $ 1,169.7 $ 600.4EARNINGS (LOSS) PER SHARE - BASIC
Continuing operations $ 6.10 $ 5.24 $ 3.10Discontinued operations (0.02) (0.19) (0.01)
$ 6.08 $ 5.05 $ 3.09EARNINGS (LOSS) PER SHARE - DILUTED
Continuing operations $ 6.09 $ 5.23 $ 3.09Discontinued operations (0.02) (0.19) (0.01)
$ 6.07 $ 5.04 $ 3.08
NET INCOME ATTRIBUTABLE TO ENSCO SHARES -BASIC AND DILUTED $ 1,403.1 $ 1,157.4 $ 593.5
WEIGHTED-AVERAGE SHARES OUTSTANDING Basic 230.9 229.4 192.2Diluted 231.1 229.7 192.6
CASH DIVIDENDS PER SHARE $ 2.25 $ 1.50 $ 1.40
The accompanying notes are an integral part of these consolidated financial statements.
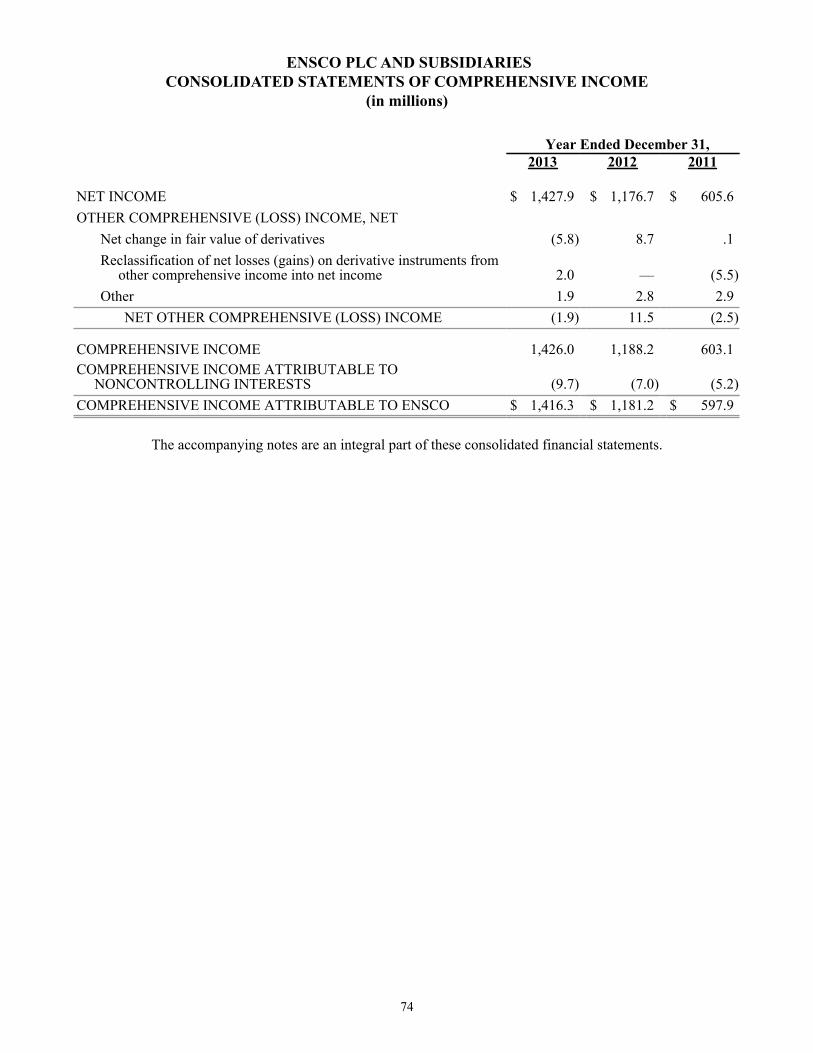
74
ENSCO PLC AND SUBSIDIARIESCONSOLIDATED STATEMENTS OF COMPREHENSIVE INCOME
(in millions)
Year Ended December 31, 2013 2012 2011
NET INCOME $ 1,427.9 $ 1,176.7 $ 605.6OTHER COMPREHENSIVE (LOSS) INCOME, NET
Net change in fair value of derivatives (5.8) 8.7 .1Reclassification of net losses (gains) on derivative instruments from
other comprehensive income into net income 2.0 — (5.5)Other 1.9 2.8 2.9
NET OTHER COMPREHENSIVE (LOSS) INCOME (1.9) 11.5 (2.5)
COMPREHENSIVE INCOME 1,426.0 1,188.2 603.1COMPREHENSIVE INCOME ATTRIBUTABLE TO
NONCONTROLLING INTERESTS (9.7) (7.0) (5.2)COMPREHENSIVE INCOME ATTRIBUTABLE TO ENSCO $ 1,416.3 $ 1,181.2 $ 597.9
The accompanying notes are an integral part of these consolidated financial statements.
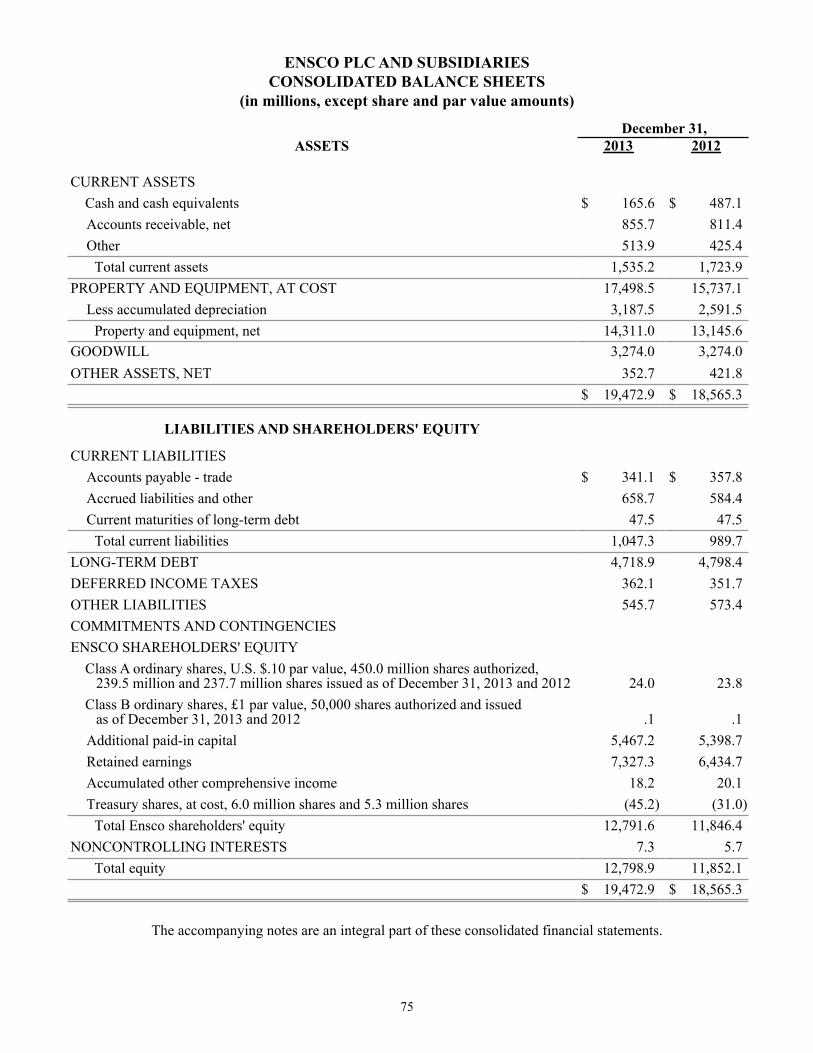
75
ENSCO PLC AND SUBSIDIARIESCONSOLIDATED BALANCE SHEETS
(in millions, except share and par value amounts)
December 31,ASSETS 2013 2012
CURRENT ASSETS Cash and cash equivalents $ 165.6 $ 487.1
Accounts receivable, net 855.7 811.4Other 513.9 425.4
Total current assets 1,535.2 1,723.9PROPERTY AND EQUIPMENT, AT COST 17,498.5 15,737.1
Less accumulated depreciation 3,187.5 2,591.5Property and equipment, net 14,311.0 13,145.6
GOODWILL 3,274.0 3,274.0OTHER ASSETS, NET 352.7 421.8 $ 19,472.9 $ 18,565.3
LIABILITIES AND SHAREHOLDERS' EQUITY CURRENT LIABILITIES
Accounts payable - trade $ 341.1 $ 357.8Accrued liabilities and other 658.7 584.4Current maturities of long-term debt 47.5 47.5
Total current liabilities 1,047.3 989.7LONG-TERM DEBT 4,718.9 4,798.4DEFERRED INCOME TAXES 362.1 351.7OTHER LIABILITIES 545.7 573.4COMMITMENTS AND CONTINGENCIESENSCO SHAREHOLDERS' EQUITY Class A ordinary shares, U.S. $.10 par value, 450.0 million shares authorized, 239.5 million and 237.7 million shares issued as of December 31, 2013 and 2012 24.0 23.8 Class B ordinary shares, £1 par value, 50,000 shares authorized and issued as of December 31, 2013 and 2012 .1 .1
Additional paid-in capital 5,467.2 5,398.7Retained earnings 7,327.3 6,434.7Accumulated other comprehensive income 18.2 20.1Treasury shares, at cost, 6.0 million shares and 5.3 million shares (45.2) (31.0)
Total Ensco shareholders' equity 12,791.6 11,846.4NONCONTROLLING INTERESTS 7.3 5.7
Total equity 12,798.9 11,852.1 $ 19,472.9 $ 18,565.3
The accompanying notes are an integral part of these consolidated financial statements.
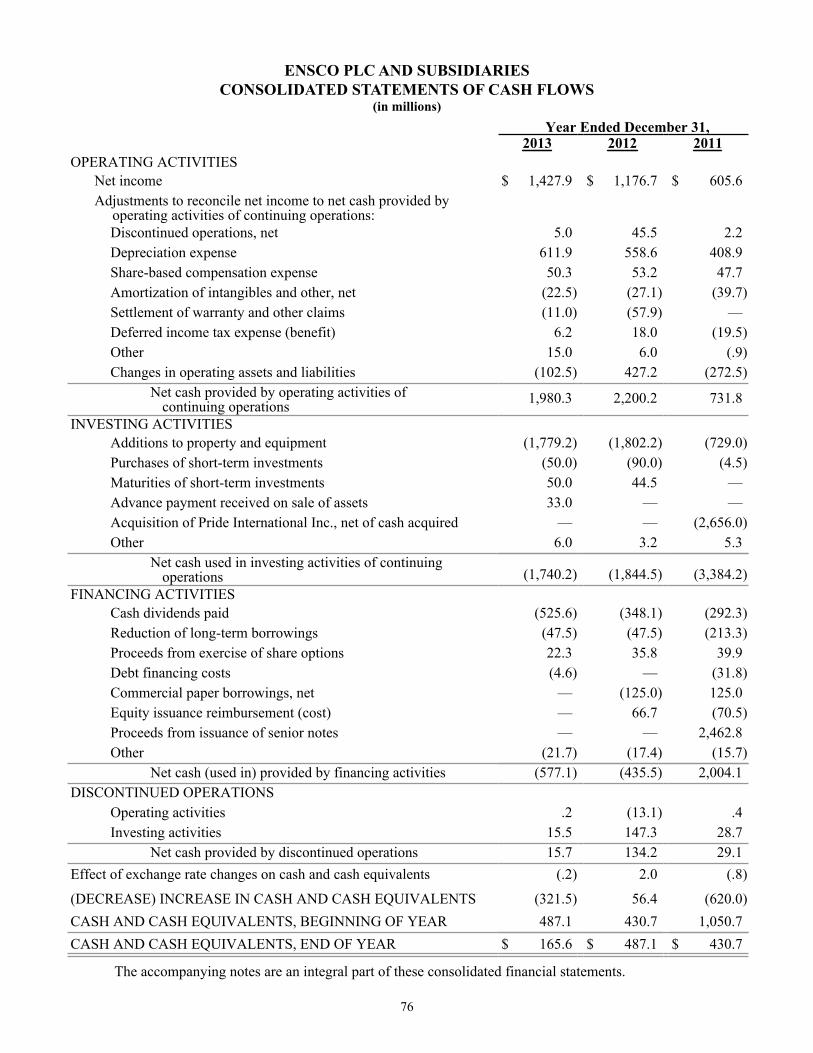
76
ENSCO PLC AND SUBSIDIARIESCONSOLIDATED STATEMENTS OF CASH FLOWS
(in millions)Year Ended December 31,
2013 2012 2011OPERATING ACTIVITIES
Net income $ 1,427.9 $ 1,176.7 $ 605.6Adjustments to reconcile net income to net cash provided by
operating activities of continuing operations: Discontinued operations, net 5.0 45.5 2.2Depreciation expense 611.9 558.6 408.9Share-based compensation expense 50.3 53.2 47.7Amortization of intangibles and other, net (22.5) (27.1) (39.7)Settlement of warranty and other claims (11.0) (57.9) —Deferred income tax expense (benefit) 6.2 18.0 (19.5)Other 15.0 6.0 (.9)Changes in operating assets and liabilities (102.5) 427.2 (272.5)
Net cash provided by operating activities ofcontinuing operations 1,980.3 2,200.2 731.8
INVESTING ACTIVITIES Additions to property and equipment (1,779.2) (1,802.2) (729.0)Purchases of short-term investments (50.0) (90.0) (4.5)Maturities of short-term investments 50.0 44.5 —Advance payment received on sale of assets 33.0 — —Acquisition of Pride International Inc., net of cash acquired — — (2,656.0)Other 6.0 3.2 5.3
Net cash used in investing activities of continuingoperations (1,740.2) (1,844.5) (3,384.2)
FINANCING ACTIVITIES Cash dividends paid (525.6) (348.1) (292.3)Reduction of long-term borrowings (47.5) (47.5) (213.3)Proceeds from exercise of share options 22.3 35.8 39.9Debt financing costs (4.6) — (31.8)Commercial paper borrowings, net — (125.0) 125.0Equity issuance reimbursement (cost) — 66.7 (70.5)Proceeds from issuance of senior notes — — 2,462.8Other (21.7) (17.4) (15.7)
Net cash (used in) provided by financing activities (577.1) (435.5) 2,004.1DISCONTINUED OPERATIONS
Operating activities .2 (13.1) .4Investing activities 15.5 147.3 28.7
Net cash provided by discontinued operations 15.7 134.2 29.1Effect of exchange rate changes on cash and cash equivalents (.2) 2.0 (.8)
(DECREASE) INCREASE IN CASH AND CASH EQUIVALENTS (321.5) 56.4 (620.0)CASH AND CASH EQUIVALENTS, BEGINNING OF YEAR 487.1 430.7 1,050.7CASH AND CASH EQUIVALENTS, END OF YEAR $ 165.6 $ 487.1 $ 430.7
The accompanying notes are an integral part of these consolidated financial statements.
77
ENSCO PLC AND SUBSIDIARIESNOTES TO CONSOLIDATED FINANCIAL STATEMENTS
1. DESCRIPTION OF THE BUSINESS AND SUMMARY OF SIGNIFICANT ACCOUNTING POLICIES Business We are one of the leading providers of offshore contract drilling services to the international oil and gas industry. We own an offshore drilling rig fleet of 74 rigs, including six rigs under construction, spanning most of the strategic, high-growth markets around the globe. Our rig fleet includes ten drillships, 13 dynamically positioned semisubmersible rigs, six moored semisubmersible rigs and 45 jackup rigs. Our fleet is the world's second largest amongst competitive rigs, our ultra-deepwater fleet is the newest in the industry, and our premium jackup fleet is the largest of any offshore drilling company.
Our customers include most of the leading national and international oil companies, in addition to many independent operators. We are among the most geographically diverse offshore drilling companies, with current operations and drilling contracts spanning approximately 20 countries on six continents in nearly every major offshore basin around the world. The markets in which we operate include the U.S. Gulf of Mexico, Mexico, Brazil, the Mediterranean, the North Sea, the Middle East, West Africa, Australia and Southeast Asia.
We provide drilling services on a "day rate" contract basis. Under day rate contracts, we provide a drilling rig and rig crews and receive a fixed amount per day for drilling a well. Our customers bear substantially all of the ancillary costs of constructing the well and supporting drilling operations, as well as the economic risk relative to the success of the well. In addition, our customers may pay all or a portion of the cost of moving our equipment and personnel to and from the well site. We do not provide "turnkey" or other risk-based drilling services.
Redomestication
During 2009, we completed a reorganization of the corporate structure of the group of companies controlled by our predecessor, ENSCO International Incorporated ("Ensco Delaware"), pursuant to which an indirect, wholly-owned subsidiary merged with Ensco Delaware, and Ensco plc became our publicly-held parent company incorporated under English law (the "redomestication"). The redomestication was accounted for as an internal reorganization of entities under common control and, therefore, Ensco Delaware's assets and liabilities were accounted for at their historical cost basis and not revalued in the transaction. We remain subject to the U.S. Securities and Exchange Commission (the "SEC") reporting requirements, the mandates of the Sarbanes-Oxley Act of 2002, as amended, and the applicable corporate governance rules of the New York Stock Exchange ("NYSE"), and we will continue to report our consolidated financial results in U.S. dollars and in accordance with U.S. generally accepted accounting principles ("GAAP"). We also must comply with additional reporting requirements of English law.
Basis of Presentation—U.K. Companies Act 2006 Section 435 Statement
The accompanying consolidated financial statements have been prepared in accordance with GAAP, which the directors consider to be the most meaningful presentation of our results of operations and financial position. The accompanying consolidated financial statements do not constitute statutory accounts required by the U.K. Companies Act 2006, which for the year ended December 31, 2013 will be prepared in accordance with generally accepted accounting principles in the U.K. and delivered to the Registrar of Companies in the U.K. following the annual general meeting of shareholders. The U.K. statutory accounts are expected to include an unqualified auditor’s report, which is not expected to contain any references to matters on which the auditors drew attention by way of emphasis without qualifying the report or any statements under Sections 498(2) or 498(3) of the U.K. Companies Act 2006.
78
Principles of Consolidation
The accompanying consolidated financial statements include the accounts of Ensco plc and its majority-owned subsidiaries. All significant intercompany accounts and transactions have been eliminated. Certain previously reported amounts have been reclassified to conform to the current year presentation.
Pervasiveness of Estimates
The preparation of financial statements in conformity with GAAP requires management to make certain estimates, judgments and assumptions that affect the reported amounts of assets and liabilities, the related revenues and expenses and disclosures of gain and loss contingencies as of the date of the financial statements. Actual results could differ from those estimates.
Foreign Currency Remeasurement and Translation
Our functional currency is the U.S. dollar. As is customary in the oil and gas industry, a majority of our revenues and expenses are denominated in U.S. dollars; however, a portion of the revenues earned and expenses incurred by certain of our subsidiaries are denominated in currencies other than the U.S. dollar ("foreign currencies"). These transactions are remeasured in U.S. dollars based on a combination of both current and historical exchange rates. Most transaction gains and losses, including certain gains and losses on our derivative instruments, are included in other, net, in our consolidated statement of income. Certain gains and losses from the translation of foreign currency balances of our non-U.S. dollar functional currency subsidiaries are included in accumulated other comprehensive income on our consolidated balance sheet. We incurred net foreign currency exchange gains of $6.4 million, net foreign currency exchange losses of $3.5 million and net foreign currency exchange gains of $16.9 million for the years ended December 31, 2013, 2012 and 2011, respectively.
Cash Equivalents and Short-Term Investments
Highly liquid investments with maturities of three months or less at the date of purchase are considered cash equivalents. Highly liquid investments with maturities of greater than three months but less than one year at the date of purchase are classified as short-term investments.
Short-term investments, consisting of time deposits with initial maturities in excess of three months but less than one year, were included in other current assets on our consolidated balance sheets and totaled $50.0 million as of December 31, 2013 and 2012. Cash flows from purchases and maturities of short-term investments were classified as investing activities in our consolidated statements of cash flows for the years ended December 31, 2013, 2012 and 2011.
Property and Equipment
All costs incurred in connection with the acquisition, construction, major enhancement and improvement of assets are capitalized, including allocations of interest incurred during periods that our drilling rigs are under construction or undergoing major enhancements and improvements. Repair and maintenance costs are charged to contract drilling expense in the period in which they occur. Upon sale or retirement of assets, the related cost and accumulated depreciation are removed from the balance sheet, and the resulting gain or loss is included in contract drilling expense, unless reclassified to discontinued operations.
Our property and equipment is depreciated on a straight-line basis, after allowing for salvage values, over the estimated useful lives of our assets. Drilling rigs and related equipment are depreciated over estimated useful lives ranging from four to 35 years. Buildings and improvements are depreciated over estimated useful lives ranging from two to 30 years. Other equipment, including computer and communications hardware and software costs, is depreciated over estimated useful lives ranging from two to six years.
79
We evaluate the carrying value of our property and equipment for impairment when events or changes in circumstances indicate that the carrying value of such assets may not be recoverable. For property and equipment used in our operations, recoverability generally is determined by comparing the carrying value of an asset to the expected undiscounted future cash flows of the asset. If the carrying value of an asset is not recoverable, the amount of impairment loss is measured as the difference between the carrying value of the asset and its estimated fair value. Property and equipment held for sale is recorded at the lower of net book value or net realizable value. If the global economy were to deteriorate and/or the offshore drilling industry were to incur a significant prolonged downturn, it is reasonably possible that impairment charges may occur with respect to specific individual rigs, groups of rigs, such as a specific type of drilling rig, or rigs in a certain geographic location.
Goodwill Our business consists of three operating segments: (1) Floaters, which includes our drillships and semisubmersible rigs, (2) Jackups and (3) Other, which consists of management services on rigs owned by third-parties. Our two reportable segments, Floaters and Jackups, provide one service, contract drilling.
We test goodwill for impairment on an annual basis as of December 31 of each year or when events or changes in circumstances indicate that a potential impairment exists. When testing goodwill for impairment, we perform a qualitative assessment to determine whether it is more-likely-than-not that the fair value of a reporting unit is less than its carrying amount.
If we conclude that the fair value of one or both of our reporting units has more-likely-than-not declined below its carrying amount after qualitatively assessing existing facts and circumstances, we perform a quantitative assessment whereby we estimate the fair value of each reporting unit. In most instances, our calculation of the fair value of our reporting units is based on estimates of future discounted cash flows to be generated by our drilling rigs in the reporting unit.
Based on a qualitative assessment performed as of December 31, 2013, we concluded it was more-likely-than-not that the fair value of our reporting units exceeded their carrying amount, and there was no impairment of goodwill. However, if the market value of our shares declines for a prolonged period, and if management's judgments and assumptions regarding future industry conditions and operations diminish, it is reasonably possible that our expectations of future cash flows may decline and ultimately result in a goodwill impairment for our Floaters reporting unit. See "Note 9 - Goodwill and Other Intangible Assets and Liabilities" for additional information on our goodwill.
Operating Revenues and Expenses
Substantially all of our drilling contracts ("contracts") are performed on a day rate basis, and the terms of such contracts are typically for a specific period of time or the period of time required to complete a specific task, such as drill a well. Contract revenues and expenses are recognized on a per day basis, as the work is performed. Day rate revenues are typically earned, and contract drilling expense is typically incurred, on a uniform basis over the terms of our contracts.
In connection with some contracts, we receive lump-sum fees or similar compensation for the mobilization of equipment and personnel prior to the commencement of drilling services or the demobilization of equipment and personnel upon contract completion. Fees received for the mobilization or demobilization of equipment and personnel are included in operating revenues. The costs incurred in connection with the mobilization and demobilization of equipment and personnel are included in contract drilling expense.
Mobilization fees received and costs incurred prior to commencement of drilling operations are deferred and recognized on a straight-line basis over the period that the related drilling services are performed. Demobilization fees and related costs are recognized as incurred upon contract completion. Costs associated with the mobilization of equipment and personnel to more promising market areas without contracts are expensed as incurred.
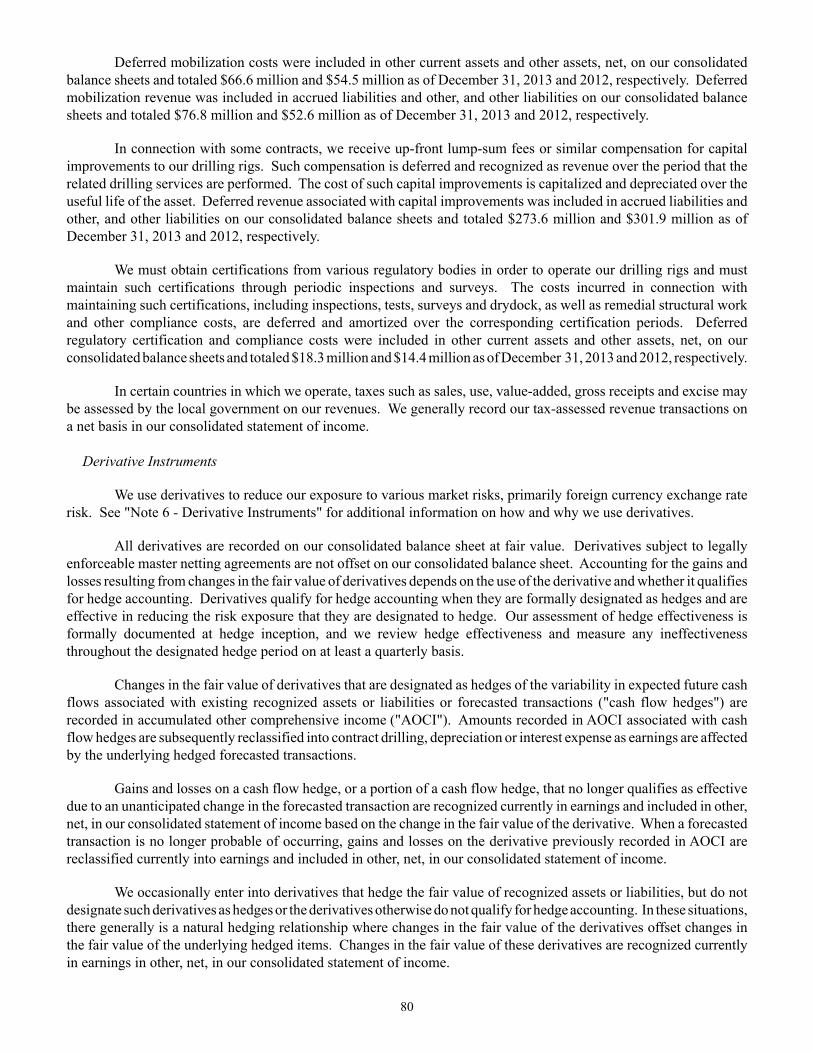
80
Deferred mobilization costs were included in other current assets and other assets, net, on our consolidated balance sheets and totaled $66.6 million and $54.5 million as of December 31, 2013 and 2012, respectively. Deferred mobilization revenue was included in accrued liabilities and other, and other liabilities on our consolidated balance sheets and totaled $76.8 million and $52.6 million as of December 31, 2013 and 2012, respectively.
In connection with some contracts, we receive up-front lump-sum fees or similar compensation for capital improvements to our drilling rigs. Such compensation is deferred and recognized as revenue over the period that the related drilling services are performed. The cost of such capital improvements is capitalized and depreciated over the useful life of the asset. Deferred revenue associated with capital improvements was included in accrued liabilities and other, and other liabilities on our consolidated balance sheets and totaled $273.6 million and $301.9 million as of December 31, 2013 and 2012, respectively.
We must obtain certifications from various regulatory bodies in order to operate our drilling rigs and must maintain such certifications through periodic inspections and surveys. The costs incurred in connection with maintaining such certifications, including inspections, tests, surveys and drydock, as well as remedial structural work and other compliance costs, are deferred and amortized over the corresponding certification periods. Deferred regulatory certification and compliance costs were included in other current assets and other assets, net, on our consolidated balance sheets and totaled $18.3 million and $14.4 million as of December 31, 2013 and 2012, respectively.
In certain countries in which we operate, taxes such as sales, use, value-added, gross receipts and excise may be assessed by the local government on our revenues. We generally record our tax-assessed revenue transactions on a net basis in our consolidated statement of income.
Derivative Instruments
We use derivatives to reduce our exposure to various market risks, primarily foreign currency exchange rate risk. See "Note 6 - Derivative Instruments" for additional information on how and why we use derivatives.
All derivatives are recorded on our consolidated balance sheet at fair value. Derivatives subject to legally enforceable master netting agreements are not offset on our consolidated balance sheet. Accounting for the gains and losses resulting from changes in the fair value of derivatives depends on the use of the derivative and whether it qualifies for hedge accounting. Derivatives qualify for hedge accounting when they are formally designated as hedges and are effective in reducing the risk exposure that they are designated to hedge. Our assessment of hedge effectiveness is formally documented at hedge inception, and we review hedge effectiveness and measure any ineffectiveness throughout the designated hedge period on at least a quarterly basis.
Changes in the fair value of derivatives that are designated as hedges of the variability in expected future cash flows associated with existing recognized assets or liabilities or forecasted transactions ("cash flow hedges") are recorded in accumulated other comprehensive income ("AOCI"). Amounts recorded in AOCI associated with cash flow hedges are subsequently reclassified into contract drilling, depreciation or interest expense as earnings are affected by the underlying hedged forecasted transactions.
Gains and losses on a cash flow hedge, or a portion of a cash flow hedge, that no longer qualifies as effective due to an unanticipated change in the forecasted transaction are recognized currently in earnings and included in other, net, in our consolidated statement of income based on the change in the fair value of the derivative. When a forecasted transaction is no longer probable of occurring, gains and losses on the derivative previously recorded in AOCI are reclassified currently into earnings and included in other, net, in our consolidated statement of income.
We occasionally enter into derivatives that hedge the fair value of recognized assets or liabilities, but do not designate such derivatives as hedges or the derivatives otherwise do not qualify for hedge accounting. In these situations, there generally is a natural hedging relationship where changes in the fair value of the derivatives offset changes in the fair value of the underlying hedged items. Changes in the fair value of these derivatives are recognized currently in earnings in other, net, in our consolidated statement of income.
81
Derivatives with asset fair values are reported in other current assets or other assets, net, on our consolidated balance sheet depending on maturity date. Derivatives with liability fair values are reported in accrued liabilities and other, or other liabilities on our consolidated balance sheet depending on maturity date.
Income Taxes
We conduct operations and earn income in numerous countries. Current income taxes are recognized for the amount of taxes payable or refundable based on the laws and income tax rates in the taxing jurisdictions in which operations are conducted and income is earned. Deferred tax assets and liabilities are recognized for the anticipated future tax effects of temporary differences between the financial statement basis and the tax basis of our assets and liabilities using the enacted tax rates in effect at year-end. A valuation allowance for deferred tax assets is recorded when it is more-likely-than-not that the benefit from the deferred tax asset will not be realized. We do not offset deferred tax assets and deferred tax liabilities attributable to different tax paying jurisdictions. We operate in certain jurisdictions where tax laws relating to the offshore drilling industry are not well developed and change frequently. Furthermore, we may enter into transactions with affiliates or employ other tax planning strategies that generally are subject to complex tax regulations. As a result of the foregoing, the tax liabilities and assets we recognize in our financial statements may differ from the tax positions taken, or expected to be taken, in our tax returns. Our tax positions are evaluated for recognition using a more-likely-than-not threshold, and those tax positions requiring recognition are measured as the largest amount of tax benefit that is greater than 50% likely of being realized upon effective settlement with a taxing authority that has full knowledge of all relevant information. Interest and penalties relating to income taxes are included in current income tax expense in our consolidated statement of income.
Our drilling rigs frequently move from one taxing jurisdiction to another based on where they are contracted to perform drilling services. The movement of drilling rigs among taxing jurisdictions may involve a transfer of drilling rig ownership among our subsidiaries (“intercompany rig sale”). The pre-tax profit resulting from an intercompany rig sale is eliminated from our consolidated financial statements and the carrying value of a rig sold in an intercompany transaction remains at historical net depreciated cost prior to the transaction. Our consolidated financial statements do not reflect the asset disposition transaction of the selling subsidiary or the asset acquisition transaction of the acquiring subsidiary. Income taxes resulting from an intercompany rig sale, as well as the tax effect of any reversing temporary differences resulting from the sale, are deferred and amortized on a straight-line basis over the remaining useful life of the rig.
In some instances, we may determine that certain temporary differences will not result in a taxable or deductible amount in future years, as it is more-likely-than-not we will commence operations and depart from a given taxing jurisdiction without such temporary differences being recovered or settled. Under these circumstances, no future tax consequences are expected and no deferred taxes are recognized in connection with such operations. We evaluate these determinations on a periodic basis and, in the event our expectations relative to future tax consequences change, the applicable deferred taxes are recognized or derecognized. We do not provide deferred taxes on the undistributed earnings of certain subsidiaries because our policy and intention is to reinvest such earnings indefinitely. See "Note 10 - Income Taxes" for additional information on our deferred taxes, unrecognized tax benefits, intercompany transfers of drilling rigs and undistributed earnings.
Share-Based Compensation
We sponsor share-based compensation plans that provide equity compensation to our key employees, officers and non-employee directors. Share-based compensation cost is measured at fair value on the date of grant and recognized on a straight-line basis over the requisite service period (usually the vesting period). The amount of compensation cost recognized in our consolidated statement of income is based on the awards ultimately expected to vest and, therefore, reduced for estimated forfeitures. All changes in estimated forfeitures are based on historical
82
experience and are recognized as a cumulative adjustment to compensation cost in the period in which they occur. See "Note 8 - Benefit Plans" for additional information on our share-based compensation.
Fair Value Measurements
We measure certain of our assets and liabilities based on a fair value hierarchy that prioritizes the inputs to valuation techniques used to measure fair value. The hierarchy assigns the highest priority to unadjusted quoted prices in active markets for identical assets or liabilities ("Level 1") and the lowest priority to unobservable inputs ("Level 3"). Level 2 measurements represent inputs that are observable for similar assets or liabilities, either directly or indirectly, other than quoted prices included within Level 1. See "Note 3 - Fair Value Measurements" for additional information on the fair value measurement of certain of our assets and liabilities.
Earnings Per Share We compute basic and diluted earnings per share ("EPS") in accordance with the two-class method. Net income attributable to Ensco used in our computations of basic and diluted EPS is adjusted to exclude net income allocated to non-vested shares granted to our employees and non-employee directors. Weighted-average shares outstanding used in our computation of diluted EPS is calculated using the treasury stock method and excludes non-vested shares. The following table is a reconciliation of net income attributable to Ensco shares used in our basic and diluted EPS computations for each of the years in the three-year period ended December 31, 2013 (in millions):
2013 2012 2011
Net income attributable to Ensco $1,418.2 $1,169.7 $600.4Net income allocated to non-vested share awards (15.1) (12.3) (6.9)Net income attributable to Ensco shares $1,403.1 $1,157.4 $593.5
The following table is a reconciliation of the weighted-average shares used in our basic and diluted earnings per share computations for each of the years in the three-year period ended December 31, 2013 (in millions):
2013 2012 2011
Weighted-average shares - basic 230.9 229.4 192.2Potentially dilutive shares .2 .3 .4Weighted-average shares - diluted 231.1 229.7 192.6
Antidilutive share options totaling 300,000 for the year ended December 31, 2013 and 400,000 for the years ended December 31, 2012 and 2011 were excluded from the computation of diluted EPS.
Noncontrolling Interests
Third parties hold a noncontrolling ownership interest in certain of our non-U.S. subsidiaries. Noncontrolling interests are classified as equity on our consolidated balance sheet and net income attributable to noncontrolling interests is presented separately in our consolidated statement of income.
83
Income from continuing operations attributable to Ensco for each of the years in the three-year period ended December 31, 2013 was as follows (in millions):
2013 2012 2011
Income from continuing operations $ 1,432.9 $ 1,222.2 $ 607.8Income from continuing operations attributable to noncontrollinginterests (9.7) (7.0) (5.2)Income from continuing operations attributable to Ensco $ 1,423.2 $ 1,215.2 $ 602.6
Loss from discontinued operations, net, for each of the years in the three-year period ended December 31, 2013 was attributable to Ensco.
2. ACQUISITION OF PRIDE INTERNATIONAL, INC. On May 31, 2011 (the "Merger Date"), Ensco plc completed a merger transaction (the "Merger") with Pride International, Inc., a Delaware corporation ("Pride"), pursuant to which Pride became an indirect, wholly-owned subsidiary of Ensco plc.
The Merger added drillships to our asset base, increased our presence in Angola and Brazil as well as various other major offshore drilling markets and established our fleet as the world's second largest competitive offshore drilling rig fleet.
Pro Forma Impact of the Merger The following unaudited supplemental pro forma results for the year ended December 31, 2011 includes pro forma results for the period prior to the closing date of May 31, 2011 and actual results for the period from May 31, 2011 through December 31, 2011. The pro forma results include, among others, (i) the amortization associated with the acquired intangible assets and liabilities; (ii) interest expense associated with debt used to fund a portion of the Merger; and (iii) the impact of certain fair value adjustments such as additional depreciation expense for adjustments to property and equipment and reductions to interest expense for adjustments to debt. The pro forma results do not include any potential synergies, non-recurring charges resulting directly from the Merger, cost savings or other expected benefits of the Merger. The pro forma results should not be considered indicative of future results.
(In millions, except per share amounts) 2011*
Revenues $ 3,451.8Net income 604.8Earnings per share - basic 2.61Earnings per share - diluted 2.60
* Supplemental pro forma earnings were adjusted to exclude an aggregate $157.6 million of merger-related costs incurred by Ensco and Pride during 2011.
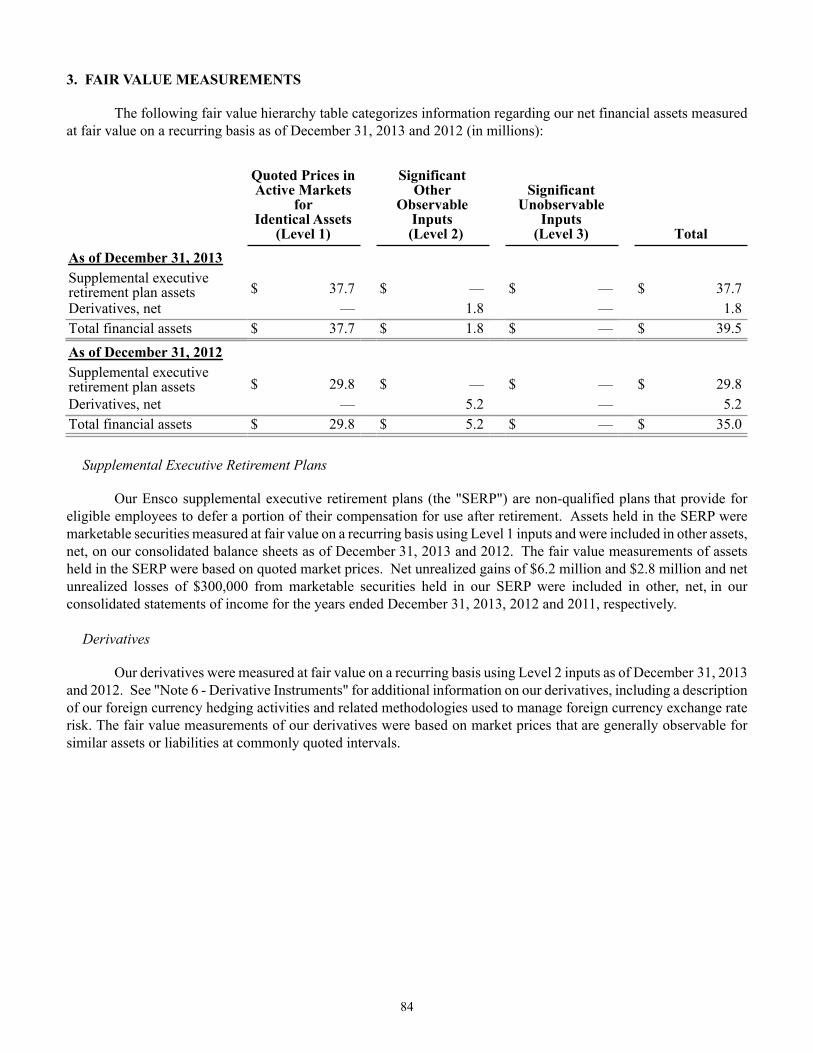
84
3. FAIR VALUE MEASUREMENTS
The following fair value hierarchy table categorizes information regarding our net financial assets measured at fair value on a recurring basis as of December 31, 2013 and 2012 (in millions):
Quoted Prices inActive Markets
forIdentical Assets
(Level 1)
SignificantOther
ObservableInputs
(Level 2)
SignificantUnobservable
Inputs(Level 3) Total
As of December 31, 2013 Supplemental executiveretirement plan assets $ 37.7 $ — $ — $ 37.7Derivatives, net — 1.8 — 1.8Total financial assets $ 37.7 $ 1.8 $ — $ 39.5As of December 31, 2012 Supplemental executiveretirement plan assets $ 29.8 $ — $ — $ 29.8Derivatives, net — 5.2 — 5.2Total financial assets $ 29.8 $ 5.2 $ — $ 35.0
Supplemental Executive Retirement Plans
Our Ensco supplemental executive retirement plans (the "SERP") are non-qualified plans that provide for eligible employees to defer a portion of their compensation for use after retirement. Assets held in the SERP were marketable securities measured at fair value on a recurring basis using Level 1 inputs and were included in other assets, net, on our consolidated balance sheets as of December 31, 2013 and 2012. The fair value measurements of assets held in the SERP were based on quoted market prices. Net unrealized gains of $6.2 million and $2.8 million and net unrealized losses of $300,000 from marketable securities held in our SERP were included in other, net, in our consolidated statements of income for the years ended December 31, 2013, 2012 and 2011, respectively.
Derivatives
Our derivatives were measured at fair value on a recurring basis using Level 2 inputs as of December 31, 2013 and 2012. See "Note 6 - Derivative Instruments" for additional information on our derivatives, including a description of our foreign currency hedging activities and related methodologies used to manage foreign currency exchange rate risk. The fair value measurements of our derivatives were based on market prices that are generally observable for similar assets or liabilities at commonly quoted intervals.
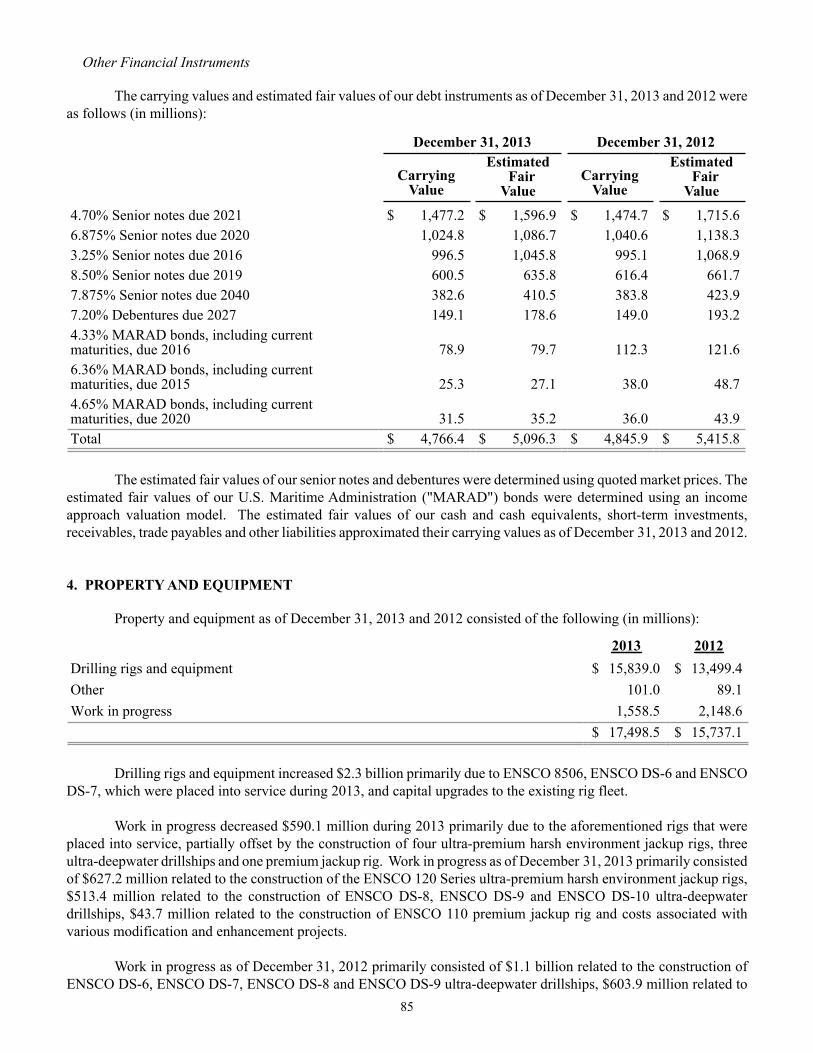
85
Other Financial Instruments
The carrying values and estimated fair values of our debt instruments as of December 31, 2013 and 2012 were as follows (in millions):
December 31, 2013 December 31, 2012
CarryingValue
Estimated FairValue
CarryingValue
Estimated FairValue
4.70% Senior notes due 2021 $ 1,477.2 $ 1,596.9 $ 1,474.7 $ 1,715.66.875% Senior notes due 2020 1,024.8 1,086.7 1,040.6 1,138.33.25% Senior notes due 2016 996.5 1,045.8 995.1 1,068.98.50% Senior notes due 2019 600.5 635.8 616.4 661.77.875% Senior notes due 2040 382.6 410.5 383.8 423.97.20% Debentures due 2027 149.1 178.6 149.0 193.24.33% MARAD bonds, including currentmaturities, due 2016 78.9 79.7 112.3 121.66.36% MARAD bonds, including currentmaturities, due 2015 25.3 27.1 38.0 48.74.65% MARAD bonds, including currentmaturities, due 2020 31.5 35.2 36.0 43.9Total $ 4,766.4 $ 5,096.3 $ 4,845.9 $ 5,415.8
The estimated fair values of our senior notes and debentures were determined using quoted market prices. The estimated fair values of our U.S. Maritime Administration ("MARAD") bonds were determined using an income approach valuation model. The estimated fair values of our cash and cash equivalents, short-term investments, receivables, trade payables and other liabilities approximated their carrying values as of December 31, 2013 and 2012.
4. PROPERTY AND EQUIPMENT
Property and equipment as of December 31, 2013 and 2012 consisted of the following (in millions):
2013 2012Drilling rigs and equipment $ 15,839.0 $ 13,499.4Other 101.0 89.1Work in progress 1,558.5 2,148.6 $ 17,498.5 $ 15,737.1
Drilling rigs and equipment increased $2.3 billion primarily due to ENSCO 8506, ENSCO DS-6 and ENSCO DS-7, which were placed into service during 2013, and capital upgrades to the existing rig fleet. Work in progress decreased $590.1 million during 2013 primarily due to the aforementioned rigs that were placed into service, partially offset by the construction of four ultra-premium harsh environment jackup rigs, three ultra-deepwater drillships and one premium jackup rig. Work in progress as of December 31, 2013 primarily consisted of $627.2 million related to the construction of the ENSCO 120 Series ultra-premium harsh environment jackup rigs, $513.4 million related to the construction of ENSCO DS-8, ENSCO DS-9 and ENSCO DS-10 ultra-deepwater drillships, $43.7 million related to the construction of ENSCO 110 premium jackup rig and costs associated with various modification and enhancement projects.
Work in progress as of December 31, 2012 primarily consisted of $1.1 billion related to the construction of ENSCO DS-6, ENSCO DS-7, ENSCO DS-8 and ENSCO DS-9 ultra-deepwater drillships, $603.9 million related to
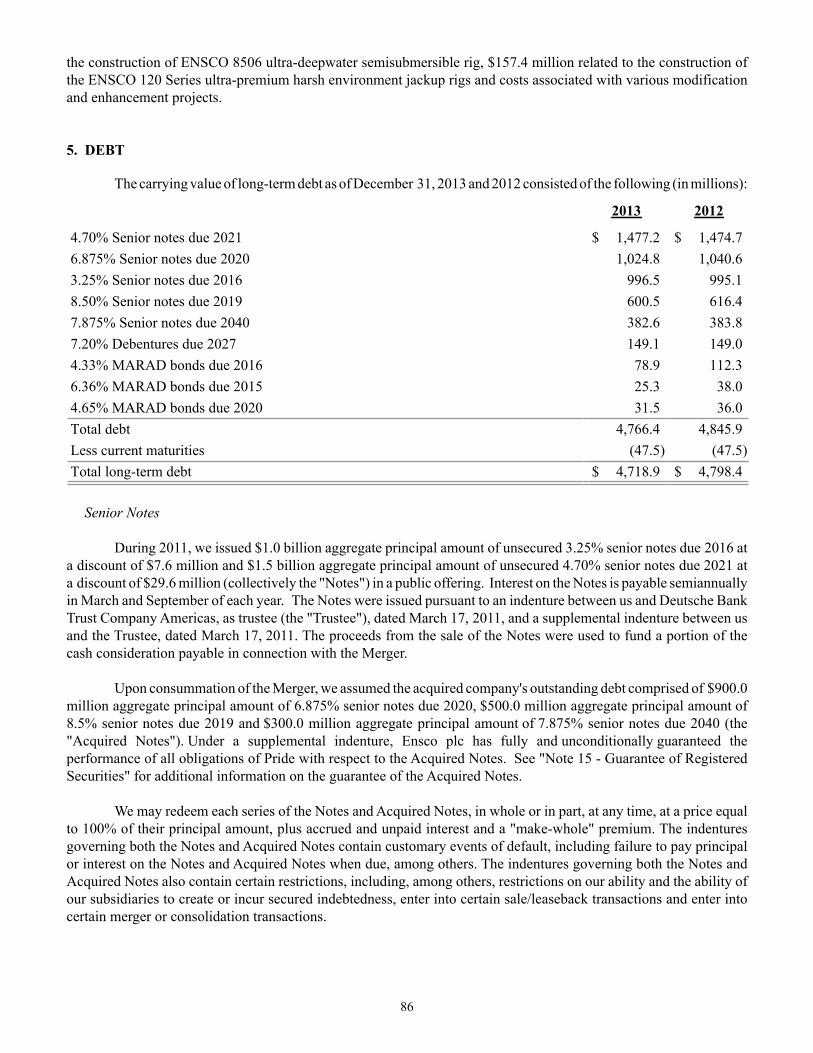
86
the construction of ENSCO 8506 ultra-deepwater semisubmersible rig, $157.4 million related to the construction of the ENSCO 120 Series ultra-premium harsh environment jackup rigs and costs associated with various modification and enhancement projects.
5. DEBT
The carrying value of long-term debt as of December 31, 2013 and 2012 consisted of the following (in millions):
2013 2012
4.70% Senior notes due 2021 $ 1,477.2 $ 1,474.76.875% Senior notes due 2020 1,024.8 1,040.63.25% Senior notes due 2016 996.5 995.18.50% Senior notes due 2019 600.5 616.47.875% Senior notes due 2040 382.6 383.87.20% Debentures due 2027 149.1 149.04.33% MARAD bonds due 2016 78.9 112.36.36% MARAD bonds due 2015 25.3 38.04.65% MARAD bonds due 2020 31.5 36.0Total debt 4,766.4 4,845.9Less current maturities (47.5) (47.5)Total long-term debt $ 4,718.9 $ 4,798.4
Senior Notes During 2011, we issued $1.0 billion aggregate principal amount of unsecured 3.25% senior notes due 2016 at a discount of $7.6 million and $1.5 billion aggregate principal amount of unsecured 4.70% senior notes due 2021 at a discount of $29.6 million (collectively the "Notes") in a public offering. Interest on the Notes is payable semiannually in March and September of each year. The Notes were issued pursuant to an indenture between us and Deutsche Bank Trust Company Americas, as trustee (the "Trustee"), dated March 17, 2011, and a supplemental indenture between us and the Trustee, dated March 17, 2011. The proceeds from the sale of the Notes were used to fund a portion of the cash consideration payable in connection with the Merger.
Upon consummation of the Merger, we assumed the acquired company's outstanding debt comprised of $900.0 million aggregate principal amount of 6.875% senior notes due 2020, $500.0 million aggregate principal amount of 8.5% senior notes due 2019 and $300.0 million aggregate principal amount of 7.875% senior notes due 2040 (the "Acquired Notes"). Under a supplemental indenture, Ensco plc has fully and unconditionally guaranteed the performance of all obligations of Pride with respect to the Acquired Notes. See "Note 15 - Guarantee of Registered Securities" for additional information on the guarantee of the Acquired Notes. We may redeem each series of the Notes and Acquired Notes, in whole or in part, at any time, at a price equal to 100% of their principal amount, plus accrued and unpaid interest and a "make-whole" premium. The indentures governing both the Notes and Acquired Notes contain customary events of default, including failure to pay principal or interest on the Notes and Acquired Notes when due, among others. The indentures governing both the Notes and Acquired Notes also contain certain restrictions, including, among others, restrictions on our ability and the ability of our subsidiaries to create or incur secured indebtedness, enter into certain sale/leaseback transactions and enter into certain merger or consolidation transactions.
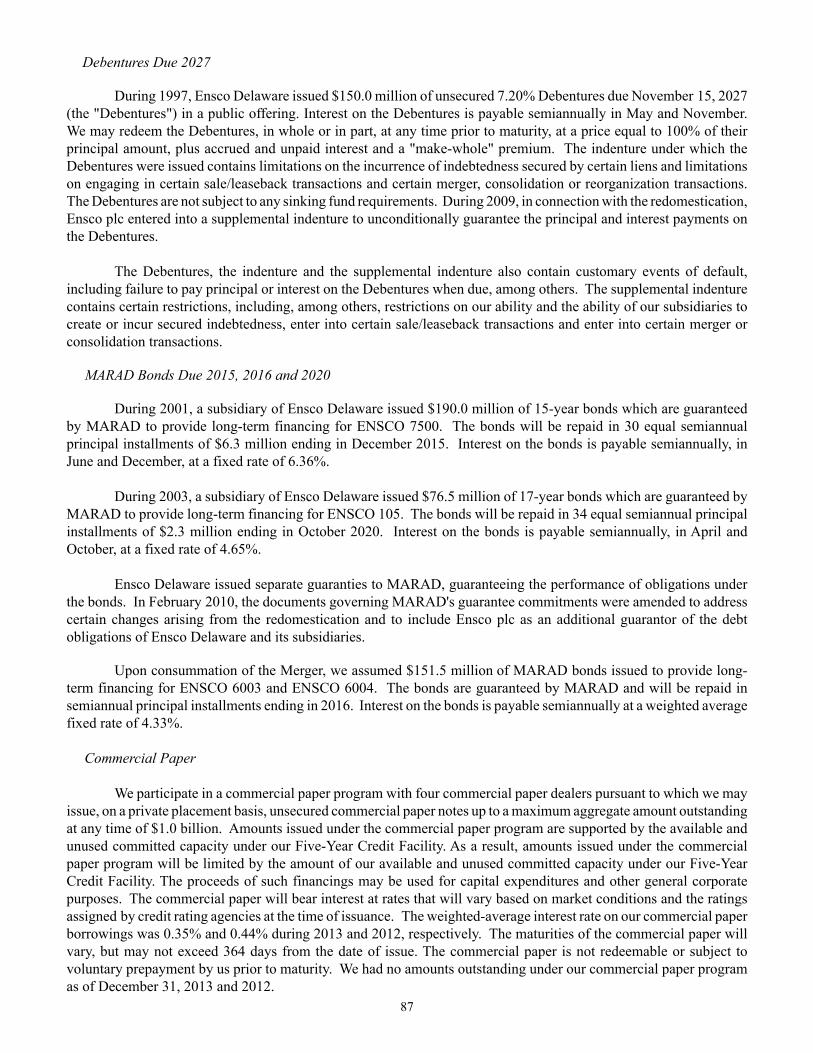
87
Debentures Due 2027
During 1997, Ensco Delaware issued $150.0 million of unsecured 7.20% Debentures due November 15, 2027 (the "Debentures") in a public offering. Interest on the Debentures is payable semiannually in May and November. We may redeem the Debentures, in whole or in part, at any time prior to maturity, at a price equal to 100% of their principal amount, plus accrued and unpaid interest and a "make-whole" premium. The indenture under which the Debentures were issued contains limitations on the incurrence of indebtedness secured by certain liens and limitations on engaging in certain sale/leaseback transactions and certain merger, consolidation or reorganization transactions. The Debentures are not subject to any sinking fund requirements. During 2009, in connection with the redomestication, Ensco plc entered into a supplemental indenture to unconditionally guarantee the principal and interest payments on the Debentures.
The Debentures, the indenture and the supplemental indenture also contain customary events of default, including failure to pay principal or interest on the Debentures when due, among others. The supplemental indenture contains certain restrictions, including, among others, restrictions on our ability and the ability of our subsidiaries to create or incur secured indebtedness, enter into certain sale/leaseback transactions and enter into certain merger or consolidation transactions.
MARAD Bonds Due 2015, 2016 and 2020
During 2001, a subsidiary of Ensco Delaware issued $190.0 million of 15-year bonds which are guaranteed by MARAD to provide long-term financing for ENSCO 7500. The bonds will be repaid in 30 equal semiannual principal installments of $6.3 million ending in December 2015. Interest on the bonds is payable semiannually, in June and December, at a fixed rate of 6.36%.
During 2003, a subsidiary of Ensco Delaware issued $76.5 million of 17-year bonds which are guaranteed by MARAD to provide long-term financing for ENSCO 105. The bonds will be repaid in 34 equal semiannual principal installments of $2.3 million ending in October 2020. Interest on the bonds is payable semiannually, in April and October, at a fixed rate of 4.65%.
Ensco Delaware issued separate guaranties to MARAD, guaranteeing the performance of obligations under the bonds. In February 2010, the documents governing MARAD's guarantee commitments were amended to address certain changes arising from the redomestication and to include Ensco plc as an additional guarantor of the debt obligations of Ensco Delaware and its subsidiaries.
Upon consummation of the Merger, we assumed $151.5 million of MARAD bonds issued to provide long-term financing for ENSCO 6003 and ENSCO 6004. The bonds are guaranteed by MARAD and will be repaid in semiannual principal installments ending in 2016. Interest on the bonds is payable semiannually at a weighted average fixed rate of 4.33%.
Commercial Paper We participate in a commercial paper program with four commercial paper dealers pursuant to which we may issue, on a private placement basis, unsecured commercial paper notes up to a maximum aggregate amount outstanding at any time of $1.0 billion. Amounts issued under the commercial paper program are supported by the available and unused committed capacity under our Five-Year Credit Facility. As a result, amounts issued under the commercial paper program will be limited by the amount of our available and unused committed capacity under our Five-Year Credit Facility. The proceeds of such financings may be used for capital expenditures and other general corporate purposes. The commercial paper will bear interest at rates that will vary based on market conditions and the ratings assigned by credit rating agencies at the time of issuance. The weighted-average interest rate on our commercial paper borrowings was 0.35% and 0.44% during 2013 and 2012, respectively. The maturities of the commercial paper will vary, but may not exceed 364 days from the date of issue. The commercial paper is not redeemable or subject to voluntary prepayment by us prior to maturity. We had no amounts outstanding under our commercial paper program as of December 31, 2013 and 2012.
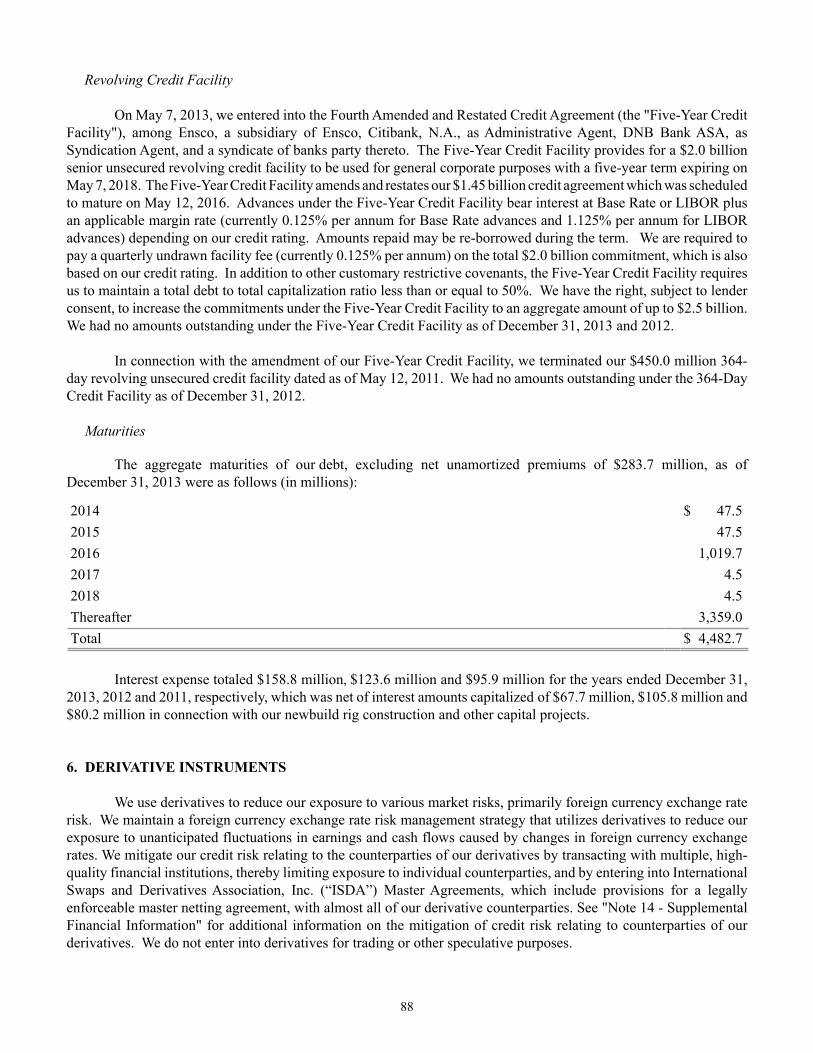
88
Revolving Credit Facility
On May 7, 2013, we entered into the Fourth Amended and Restated Credit Agreement (the "Five-Year Credit Facility"), among Ensco, a subsidiary of Ensco, Citibank, N.A., as Administrative Agent, DNB Bank ASA, as Syndication Agent, and a syndicate of banks party thereto. The Five-Year Credit Facility provides for a $2.0 billion senior unsecured revolving credit facility to be used for general corporate purposes with a five-year term expiring on May 7, 2018. The Five-Year Credit Facility amends and restates our $1.45 billion credit agreement which was scheduled to mature on May 12, 2016. Advances under the Five-Year Credit Facility bear interest at Base Rate or LIBOR plus an applicable margin rate (currently 0.125% per annum for Base Rate advances and 1.125% per annum for LIBOR advances) depending on our credit rating. Amounts repaid may be re-borrowed during the term. We are required to pay a quarterly undrawn facility fee (currently 0.125% per annum) on the total $2.0 billion commitment, which is also based on our credit rating. In addition to other customary restrictive covenants, the Five-Year Credit Facility requires us to maintain a total debt to total capitalization ratio less than or equal to 50%. We have the right, subject to lender consent, to increase the commitments under the Five-Year Credit Facility to an aggregate amount of up to $2.5 billion. We had no amounts outstanding under the Five-Year Credit Facility as of December 31, 2013 and 2012.
In connection with the amendment of our Five-Year Credit Facility, we terminated our $450.0 million 364-day revolving unsecured credit facility dated as of May 12, 2011. We had no amounts outstanding under the 364-Day Credit Facility as of December 31, 2012.
Maturities
The aggregate maturities of our debt, excluding net unamortized premiums of $283.7 million, as of December 31, 2013 were as follows (in millions):
2014 $ 47.52015 47.52016 1,019.72017 4.52018 4.5Thereafter 3,359.0Total $ 4,482.7
Interest expense totaled $158.8 million, $123.6 million and $95.9 million for the years ended December 31, 2013, 2012 and 2011, respectively, which was net of interest amounts capitalized of $67.7 million, $105.8 million and $80.2 million in connection with our newbuild rig construction and other capital projects.
6. DERIVATIVE INSTRUMENTS We use derivatives to reduce our exposure to various market risks, primarily foreign currency exchange rate risk. We maintain a foreign currency exchange rate risk management strategy that utilizes derivatives to reduce our exposure to unanticipated fluctuations in earnings and cash flows caused by changes in foreign currency exchange rates. We mitigate our credit risk relating to the counterparties of our derivatives by transacting with multiple, high-quality financial institutions, thereby limiting exposure to individual counterparties, and by entering into International Swaps and Derivatives Association, Inc. (“ISDA”) Master Agreements, which include provisions for a legally enforceable master netting agreement, with almost all of our derivative counterparties. See "Note 14 - Supplemental Financial Information" for additional information on the mitigation of credit risk relating to counterparties of our derivatives. We do not enter into derivatives for trading or other speculative purposes.
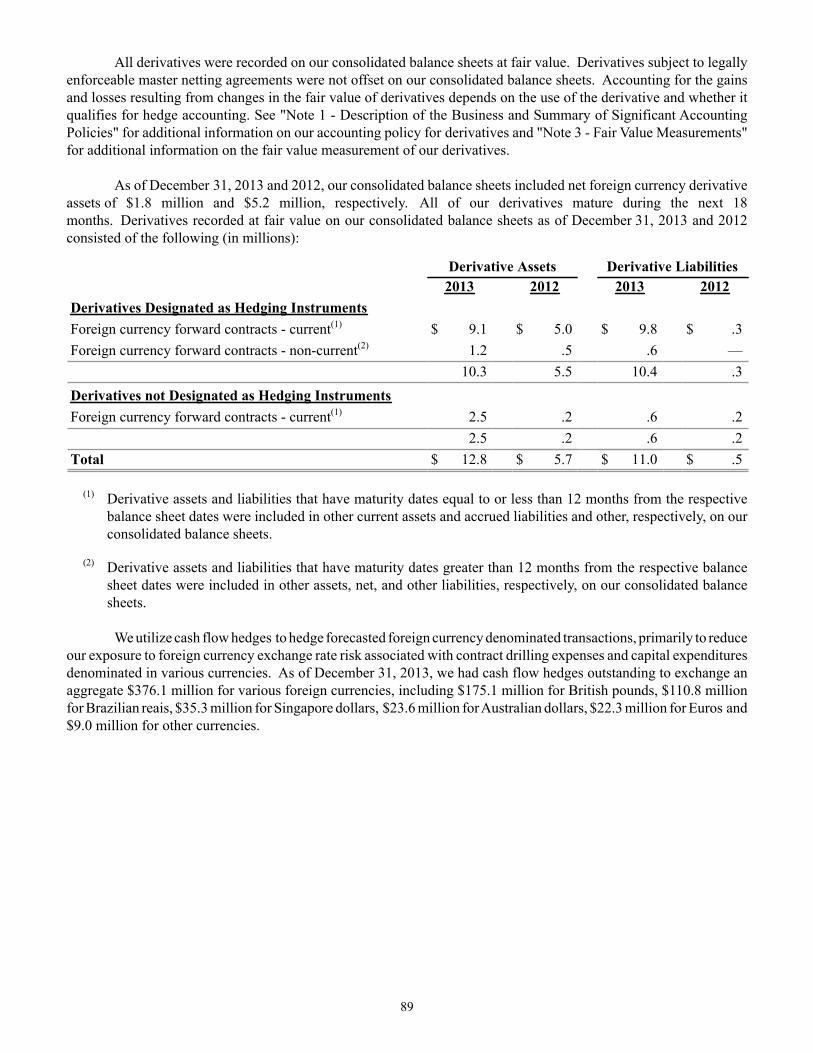
89
All derivatives were recorded on our consolidated balance sheets at fair value. Derivatives subject to legally enforceable master netting agreements were not offset on our consolidated balance sheets. Accounting for the gains and losses resulting from changes in the fair value of derivatives depends on the use of the derivative and whether it qualifies for hedge accounting. See "Note 1 - Description of the Business and Summary of Significant Accounting Policies" for additional information on our accounting policy for derivatives and "Note 3 - Fair Value Measurements" for additional information on the fair value measurement of our derivatives. As of December 31, 2013 and 2012, our consolidated balance sheets included net foreign currency derivative assets of $1.8 million and $5.2 million, respectively. All of our derivatives mature during the next 18 months. Derivatives recorded at fair value on our consolidated balance sheets as of December 31, 2013 and 2012 consisted of the following (in millions):
Derivative Assets Derivative Liabilities 2013 2012 2013 2012Derivatives Designated as Hedging Instruments Foreign currency forward contracts - current(1) $ 9.1 $ 5.0 $ 9.8 $ .3Foreign currency forward contracts - non-current(2) 1.2 .5 .6 —
10.3 5.5 10.4 .3Derivatives not Designated as Hedging Instruments Foreign currency forward contracts - current(1) 2.5 .2 .6 .2 2.5 .2 .6 .2Total $ 12.8 $ 5.7 $ 11.0 $ .5
(1) Derivative assets and liabilities that have maturity dates equal to or less than 12 months from the respective balance sheet dates were included in other current assets and accrued liabilities and other, respectively, on our consolidated balance sheets.
(2) Derivative assets and liabilities that have maturity dates greater than 12 months from the respective balance sheet dates were included in other assets, net, and other liabilities, respectively, on our consolidated balance sheets.
We utilize cash flow hedges to hedge forecasted foreign currency denominated transactions, primarily to reduce our exposure to foreign currency exchange rate risk associated with contract drilling expenses and capital expenditures denominated in various currencies. As of December 31, 2013, we had cash flow hedges outstanding to exchange an aggregate $376.1 million for various foreign currencies, including $175.1 million for British pounds, $110.8 million for Brazilian reais, $35.3 million for Singapore dollars, $23.6 million for Australian dollars, $22.3 million for Euros and $9.0 million for other currencies.
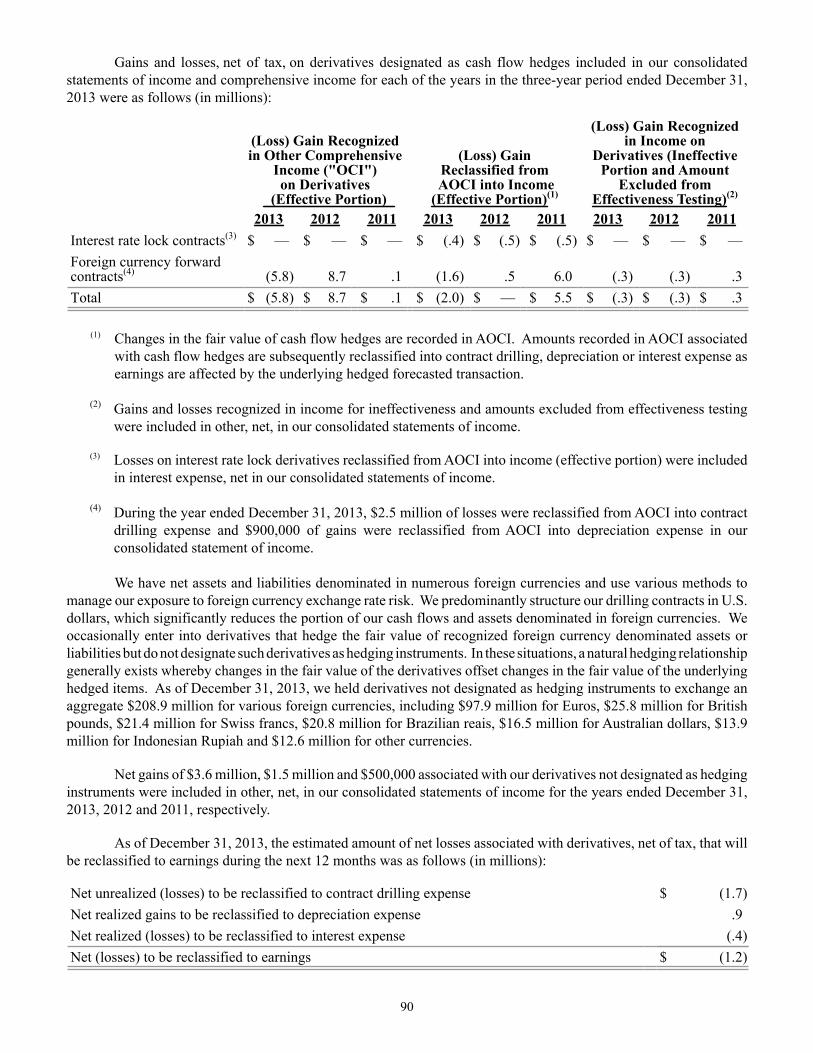
90
Gains and losses, net of tax, on derivatives designated as cash flow hedges included in our consolidated statements of income and comprehensive income for each of the years in the three-year period ended December 31, 2013 were as follows (in millions):
(Loss) Gain Recognized in Other Comprehensive
Income ("OCI")on Derivatives
(Effective Portion)
(Loss) GainReclassified from
AOCI into Income(Effective Portion)(1)
(Loss) Gain Recognizedin Income on
Derivatives (IneffectivePortion and Amount
Excluded fromEffectiveness Testing)(2)
2013 2012 2011 2013 2012 2011 2013 2012 2011Interest rate lock contracts(3) $ — $ — $ — $ (.4) $ (.5) $ (.5) $ — $ — $ —Foreign currency forward contracts(4) (5.8) 8.7 .1 (1.6) .5 6.0 (.3) (.3) .3Total $ (5.8) $ 8.7 $ .1 $ (2.0) $ — $ 5.5 $ (.3) $ (.3) $ .3
(1) Changes in the fair value of cash flow hedges are recorded in AOCI. Amounts recorded in AOCI associated
with cash flow hedges are subsequently reclassified into contract drilling, depreciation or interest expense as earnings are affected by the underlying hedged forecasted transaction.
(2) Gains and losses recognized in income for ineffectiveness and amounts excluded from effectiveness testing were included in other, net, in our consolidated statements of income.
(3) Losses on interest rate lock derivatives reclassified from AOCI into income (effective portion) were included in interest expense, net in our consolidated statements of income.
(4) During the year ended December 31, 2013, $2.5 million of losses were reclassified from AOCI into contract drilling expense and $900,000 of gains were reclassified from AOCI into depreciation expense in our consolidated statement of income.
We have net assets and liabilities denominated in numerous foreign currencies and use various methods to manage our exposure to foreign currency exchange rate risk. We predominantly structure our drilling contracts in U.S. dollars, which significantly reduces the portion of our cash flows and assets denominated in foreign currencies. We occasionally enter into derivatives that hedge the fair value of recognized foreign currency denominated assets or liabilities but do not designate such derivatives as hedging instruments. In these situations, a natural hedging relationship generally exists whereby changes in the fair value of the derivatives offset changes in the fair value of the underlying hedged items. As of December 31, 2013, we held derivatives not designated as hedging instruments to exchange an aggregate $208.9 million for various foreign currencies, including $97.9 million for Euros, $25.8 million for British pounds, $21.4 million for Swiss francs, $20.8 million for Brazilian reais, $16.5 million for Australian dollars, $13.9 million for Indonesian Rupiah and $12.6 million for other currencies.
Net gains of $3.6 million, $1.5 million and $500,000 associated with our derivatives not designated as hedging instruments were included in other, net, in our consolidated statements of income for the years ended December 31, 2013, 2012 and 2011, respectively.
As of December 31, 2013, the estimated amount of net losses associated with derivatives, net of tax, that will be reclassified to earnings during the next 12 months was as follows (in millions):
Net unrealized (losses) to be reclassified to contract drilling expense $ (1.7)Net realized gains to be reclassified to depreciation expense .9Net realized (losses) to be reclassified to interest expense (.4)Net (losses) to be reclassified to earnings $ (1.2)
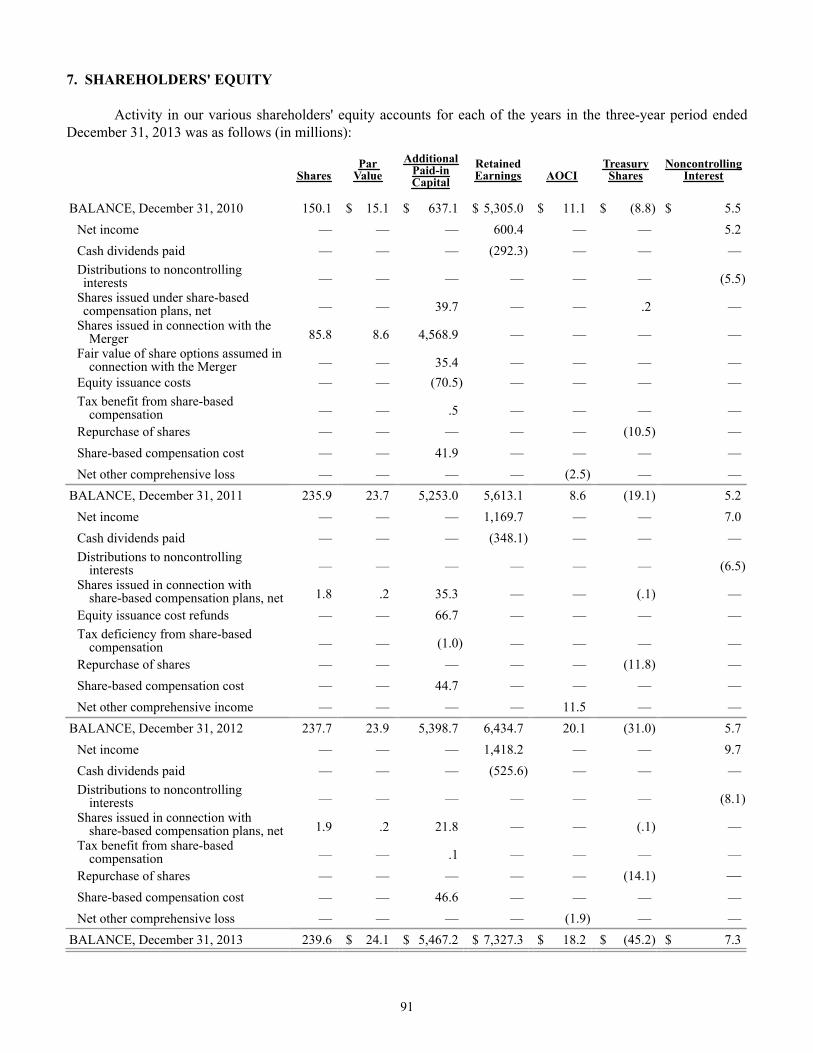
91
7. SHAREHOLDERS' EQUITY Activity in our various shareholders' equity accounts for each of the years in the three-year period ended December 31, 2013 was as follows (in millions):
Shares
Par Value
AdditionalPaid-inCapital
RetainedEarnings AOCI
TreasuryShares
NoncontrollingInterest
BALANCE, December 31, 2010 150.1 $ 15.1 $ 637.1 $ 5,305.0 $ 11.1 $ (8.8) $ 5.5Net income — — — 600.4 — — 5.2Cash dividends paid — — — (292.3) — — —Distributions to noncontrollinginterests — — — — — — (5.5)
Shares issued under share-basedcompensation plans, net — — 39.7 — — .2 —
Shares issued in connection with theMerger 85.8 8.6 4,568.9 — — — —
Fair value of share options assumed inconnection with the Merger — — 35.4 — — — —
Equity issuance costs — — (70.5) — — — —Tax benefit from share-based
compensation — — .5 — — — —Repurchase of shares — — — — — (10.5) —Share-based compensation cost — — 41.9 — — — —Net other comprehensive loss — — — — (2.5) — —
BALANCE, December 31, 2011 235.9 23.7 5,253.0 5,613.1 8.6 (19.1) 5.2Net income — — — 1,169.7 — — 7.0Cash dividends paid — — — (348.1) — — —Distributions to noncontrolling
interests — — — — — — (6.5)Shares issued in connection with
share-based compensation plans, net 1.8 .2 35.3 — — (.1) —Equity issuance cost refunds — — 66.7 — — — —Tax deficiency from share-based
compensation — — (1.0) — — — —Repurchase of shares — — — — — (11.8) —Share-based compensation cost — — 44.7 — — — —Net other comprehensive income — — — — 11.5 — —
BALANCE, December 31, 2012 237.7 23.9 5,398.7 6,434.7 20.1 (31.0) 5.7Net income — — — 1,418.2 — — 9.7Cash dividends paid — — — (525.6) — — —Distributions to noncontrolling
interests — — — — — — (8.1)Shares issued in connection with
share-based compensation plans, net 1.9 .2 21.8 — — (.1) —Tax benefit from share-based
compensation — — .1 — — — —Repurchase of shares — — — — — (14.1) —Share-based compensation cost — — 46.6 — — — —Net other comprehensive loss — — — — (1.9) — —
BALANCE, December 31, 2013 239.6 $ 24.1 $ 5,467.2 $ 7,327.3 $ 18.2 $ (45.2) $ 7.3
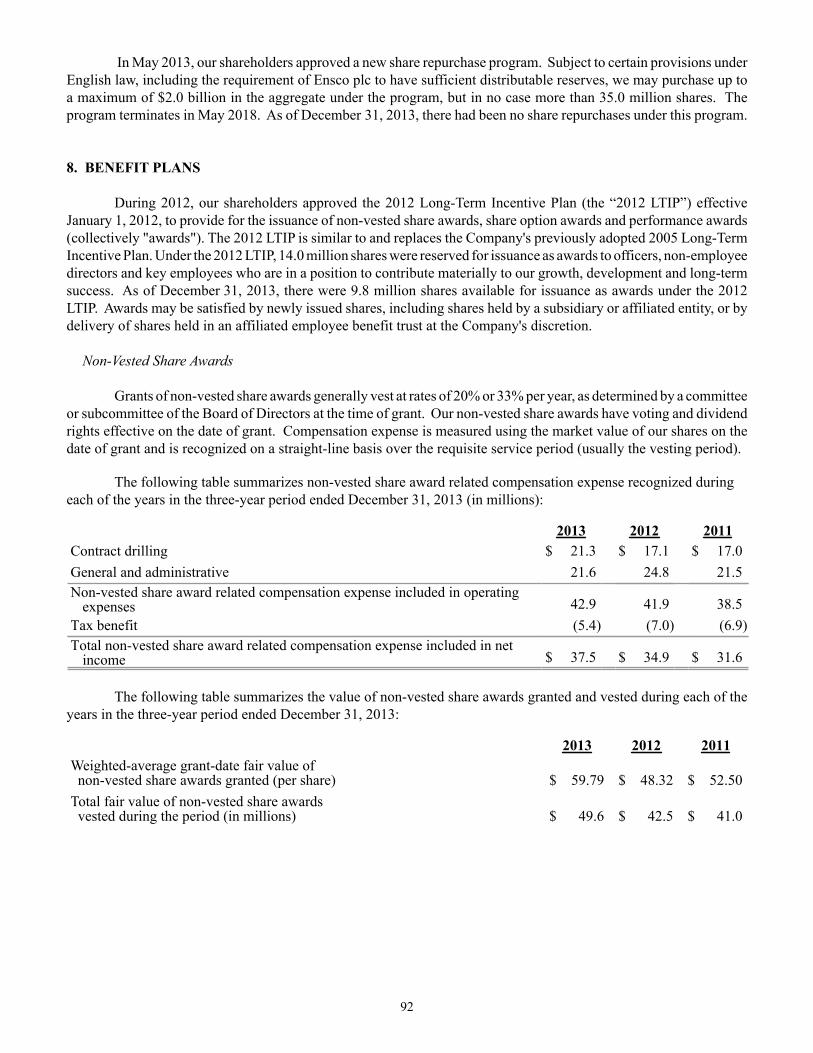
92
In May 2013, our shareholders approved a new share repurchase program. Subject to certain provisions under English law, including the requirement of Ensco plc to have sufficient distributable reserves, we may purchase up to a maximum of $2.0 billion in the aggregate under the program, but in no case more than 35.0 million shares. The program terminates in May 2018. As of December 31, 2013, there had been no share repurchases under this program.
8. BENEFIT PLANS During 2012, our shareholders approved the 2012 Long-Term Incentive Plan (the “2012 LTIP”) effective January 1, 2012, to provide for the issuance of non-vested share awards, share option awards and performance awards (collectively "awards"). The 2012 LTIP is similar to and replaces the Company's previously adopted 2005 Long-Term Incentive Plan. Under the 2012 LTIP, 14.0 million shares were reserved for issuance as awards to officers, non-employee directors and key employees who are in a position to contribute materially to our growth, development and long-term success. As of December 31, 2013, there were 9.8 million shares available for issuance as awards under the 2012 LTIP. Awards may be satisfied by newly issued shares, including shares held by a subsidiary or affiliated entity, or by delivery of shares held in an affiliated employee benefit trust at the Company's discretion.
Non-Vested Share Awards Grants of non-vested share awards generally vest at rates of 20% or 33% per year, as determined by a committee or subcommittee of the Board of Directors at the time of grant. Our non-vested share awards have voting and dividend rights effective on the date of grant. Compensation expense is measured using the market value of our shares on the date of grant and is recognized on a straight-line basis over the requisite service period (usually the vesting period).
The following table summarizes non-vested share award related compensation expense recognized during each of the years in the three-year period ended December 31, 2013 (in millions):
2013 2012 2011Contract drilling $ 21.3 $ 17.1 $ 17.0General and administrative 21.6 24.8 21.5Non-vested share award related compensation expense included in operating
expenses 42.9 41.9 38.5Tax benefit (5.4) (7.0) (6.9)Total non-vested share award related compensation expense included in net
income $ 37.5 $ 34.9 $ 31.6
The following table summarizes the value of non-vested share awards granted and vested during each of the years in the three-year period ended December 31, 2013:
2013 2012 2011Weighted-average grant-date fair value of non-vested share awards granted (per share) $ 59.79 $ 48.32 $ 52.50Total fair value of non-vested share awards vested during the period (in millions) $ 49.6 $ 42.5 $ 41.0
93
The following table summarizes non-vested share award activity for the year ended December 31, 2013 (shares in thousands):
Shares
Weighted-Average
Grant-DateFair Value
Non-vested share awards as of December 31, 2012 2,491 $ 46.52Granted 1,018 59.79Vested (829) 49.96Forfeited (184) 49.16
Non-vested share awards as of December 31, 2013 2,496 $ 52.95
As of December 31, 2013, there was $100.5 million of total unrecognized compensation cost related to non-vested share awards, which is expected to be recognized over a weighted-average period of 2.2 years.
Share Option Awards
Share option awards ("options") granted to officers and employees generally become exercisable in 25% increments over a four-year period or 33% increments over a three-year period and, to the extent not exercised, expire on the seventh anniversary of the date of grant. Options granted to non-employee directors are immediately exercisable and, to the extent not exercised, expire on the seventh anniversary of the date of grant. The exercise price of options granted under the 2012 LTIP equals the market value of the underlying shares on the date of grant. As of December 31, 2013, options granted under predecessor or acquired plans to purchase 814,000 shares were outstanding under the 2012 LTIP.
The following table summarizes option related compensation expense recognized during each of the years in the three-year period ended December 31, 2013 (in millions):
2013 2012 2011General and administrative $ .8 $ 1.6 $ 2.5Option related compensation expense included in operating expenses .8 1.6 2.5Tax benefit (.1) (.3) (.5)Total option related compensation expense included in net income $ .7 $ 1.3 $ 2.0
The fair value of each option is estimated on the date of grant using the Black-Scholes option valuation model. We did not grant share option awards during the years ended December 31, 2013 and 2012. The following weighted-average assumptions were utilized in the Black-Scholes model for options granted during the year ended December 31, 2011:
2011Risk-free interest rate 1.4%Expected term (in years) 3.7Expected volatility 50.2%Dividend yield 2.6%
Expected volatility is based on the historical volatility in the market price of our shares over the period of time equivalent to the expected term of the options granted. The expected term of options granted is derived from historical exercise patterns over a period of time equivalent to the contractual term of the options granted. We have not experienced significant differences in the historical exercise patterns among officers, employees and non-employee directors for them to be considered separately for valuation purposes. The risk-free interest rate is based on the implied yield of
94
U.S. Treasury zero-coupon issues on the date of grant with a remaining term approximating the expected term of the options granted. The following table summarizes option activity for the year ended December 31, 2013 (shares and intrinsic value in thousands, term in years):
Shares
Weighted-AverageExercise
Price
Weighted-Average
ContractualTerm
IntrinsicValue
Outstanding as of December 31, 2012 1,346 $ 46.05 Granted — — Exercised (506) 43.96 Forfeited — — Expired (26) 51.24
Outstanding as of December 31, 2013 814 $ 47.18 2.5 $ 9,065Exercisable as of December 31, 2013 780 $ 46.85 2.4 $ 8,986
The following table summarizes the value of options granted and exercised during each of the years in the three-year period ended December 31, 2013:
2013 2012 2011Weighted-average grant-date fair value ofoptions granted (per share) $ — $ — $ 19.05
Intrinsic value of options exercised duringthe year (in millions) $ 8.7 $ 17.8 $ 17.2
The following table summarizes information about options outstanding as of December 31, 2013 (shares in thousands):
Options Outstanding Options Exercisable
Number Weighted-Average
Remaining Weighted-Average Number Weighted-AverageExercise Prices Outstanding Contractual Life Exercise Price Exercisable Exercise Price
$21.54 - $40.99 247 3.1 years $33.51 247 $33.5141.18 - 54.30 229 3.5 years 43.77 217 43.2255.34 - 60.74 338 1.3 years 59.50 316 59.79
814 2.5 years $47.18 780 $46.85
As of December 31, 2013, there was $200,000 of total unrecognized compensation cost related to options, which is expected to be recognized over a weighted-average period of 0.3 years.
Performance Awards
Under the 2012 LTIP, performance awards may be issued to our senior executive officers. Performance awards granted prior to 2013 are payable in Ensco shares, cash or a combination thereof upon attainment of specified performance goals based on relative total shareholder return ("TSR") and absolute and relative return on capital employed ("ROCE"). Performance awards granted during 2013 are payable in Ensco shares upon attainment of specified performance goals based on relative TSR and relative ROCE. The performance goals are determined by a committee or subcommittee of the Board of Directors.
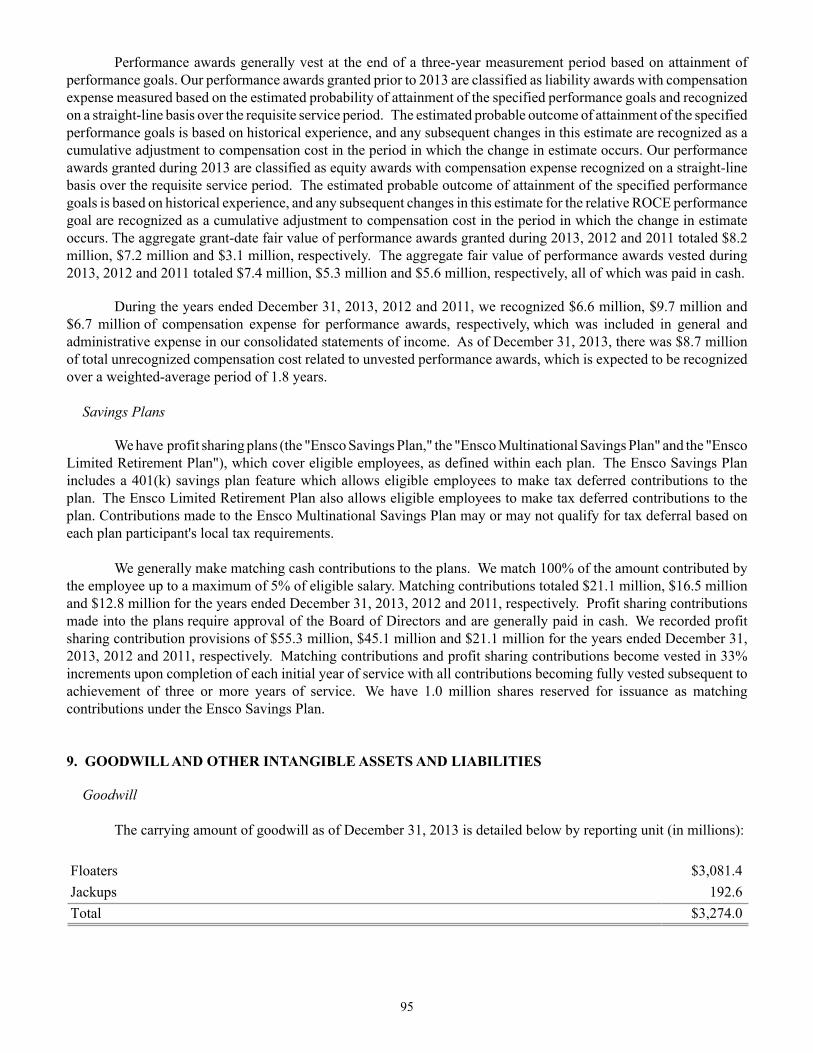
95
Performance awards generally vest at the end of a three-year measurement period based on attainment of performance goals. Our performance awards granted prior to 2013 are classified as liability awards with compensation expense measured based on the estimated probability of attainment of the specified performance goals and recognized on a straight-line basis over the requisite service period. The estimated probable outcome of attainment of the specified performance goals is based on historical experience, and any subsequent changes in this estimate are recognized as a cumulative adjustment to compensation cost in the period in which the change in estimate occurs. Our performance awards granted during 2013 are classified as equity awards with compensation expense recognized on a straight-line basis over the requisite service period. The estimated probable outcome of attainment of the specified performance goals is based on historical experience, and any subsequent changes in this estimate for the relative ROCE performance goal are recognized as a cumulative adjustment to compensation cost in the period in which the change in estimate occurs. The aggregate grant-date fair value of performance awards granted during 2013, 2012 and 2011 totaled $8.2 million, $7.2 million and $3.1 million, respectively. The aggregate fair value of performance awards vested during 2013, 2012 and 2011 totaled $7.4 million, $5.3 million and $5.6 million, respectively, all of which was paid in cash.
During the years ended December 31, 2013, 2012 and 2011, we recognized $6.6 million, $9.7 million and $6.7 million of compensation expense for performance awards, respectively, which was included in general and administrative expense in our consolidated statements of income. As of December 31, 2013, there was $8.7 million of total unrecognized compensation cost related to unvested performance awards, which is expected to be recognized over a weighted-average period of 1.8 years.
Savings Plans
We have profit sharing plans (the "Ensco Savings Plan," the "Ensco Multinational Savings Plan" and the "Ensco Limited Retirement Plan"), which cover eligible employees, as defined within each plan. The Ensco Savings Plan includes a 401(k) savings plan feature which allows eligible employees to make tax deferred contributions to the plan. The Ensco Limited Retirement Plan also allows eligible employees to make tax deferred contributions to the plan. Contributions made to the Ensco Multinational Savings Plan may or may not qualify for tax deferral based on each plan participant's local tax requirements. We generally make matching cash contributions to the plans. We match 100% of the amount contributed by the employee up to a maximum of 5% of eligible salary. Matching contributions totaled $21.1 million, $16.5 million and $12.8 million for the years ended December 31, 2013, 2012 and 2011, respectively. Profit sharing contributions made into the plans require approval of the Board of Directors and are generally paid in cash. We recorded profit sharing contribution provisions of $55.3 million, $45.1 million and $21.1 million for the years ended December 31, 2013, 2012 and 2011, respectively. Matching contributions and profit sharing contributions become vested in 33% increments upon completion of each initial year of service with all contributions becoming fully vested subsequent to achievement of three or more years of service. We have 1.0 million shares reserved for issuance as matching contributions under the Ensco Savings Plan.
9. GOODWILL AND OTHER INTANGIBLE ASSETS AND LIABILITIES
Goodwill
The carrying amount of goodwill as of December 31, 2013 is detailed below by reporting unit (in millions):
Floaters $3,081.4Jackups 192.6Total $3,274.0
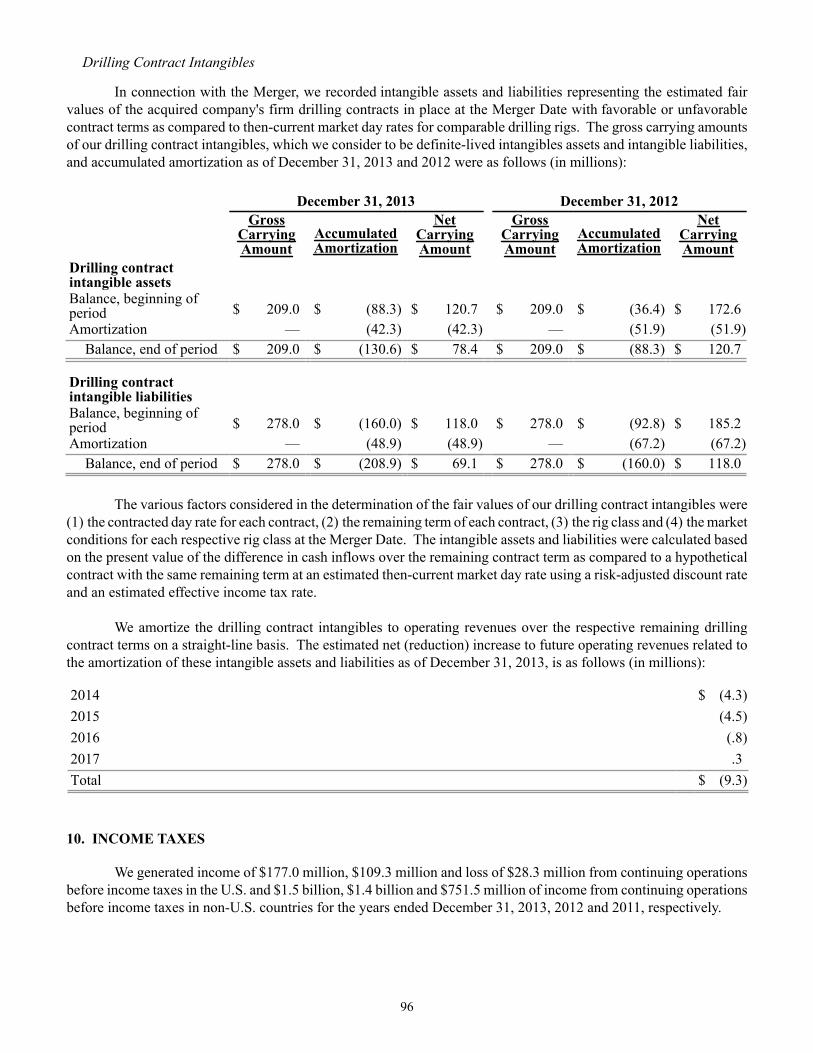
96
Drilling Contract Intangibles
In connection with the Merger, we recorded intangible assets and liabilities representing the estimated fair values of the acquired company's firm drilling contracts in place at the Merger Date with favorable or unfavorable contract terms as compared to then-current market day rates for comparable drilling rigs. The gross carrying amounts of our drilling contract intangibles, which we consider to be definite-lived intangibles assets and intangible liabilities, and accumulated amortization as of December 31, 2013 and 2012 were as follows (in millions):
December 31, 2013 December 31, 2012Gross
CarryingAmount
AccumulatedAmortization
NetCarryingAmount
GrossCarryingAmount
AccumulatedAmortization
NetCarryingAmount
Drilling contractintangible assets Balance, beginning ofperiod $ 209.0 $ (88.3) $ 120.7 $ 209.0 $ (36.4) $ 172.6Amortization — (42.3) (42.3) — (51.9) (51.9)
Balance, end of period $ 209.0 $ (130.6) $ 78.4 $ 209.0 $ (88.3) $ 120.7
Drilling contractintangible liabilitiesBalance, beginning ofperiod $ 278.0 $ (160.0) $ 118.0 $ 278.0 $ (92.8) $ 185.2Amortization — (48.9) (48.9) — (67.2) (67.2)
Balance, end of period $ 278.0 $ (208.9) $ 69.1 $ 278.0 $ (160.0) $ 118.0
The various factors considered in the determination of the fair values of our drilling contract intangibles were (1) the contracted day rate for each contract, (2) the remaining term of each contract, (3) the rig class and (4) the market conditions for each respective rig class at the Merger Date. The intangible assets and liabilities were calculated based on the present value of the difference in cash inflows over the remaining contract term as compared to a hypothetical contract with the same remaining term at an estimated then-current market day rate using a risk-adjusted discount rate and an estimated effective income tax rate.
We amortize the drilling contract intangibles to operating revenues over the respective remaining drilling contract terms on a straight-line basis. The estimated net (reduction) increase to future operating revenues related to the amortization of these intangible assets and liabilities as of December 31, 2013, is as follows (in millions):
2014 $ (4.3)2015 (4.5)2016 (.8)2017 .3Total $ (9.3)
10. INCOME TAXES
We generated income of $177.0 million, $109.3 million and loss of $28.3 million from continuing operations before income taxes in the U.S. and $1.5 billion, $1.4 billion and $751.5 million of income from continuing operations before income taxes in non-U.S. countries for the years ended December 31, 2013, 2012 and 2011, respectively.
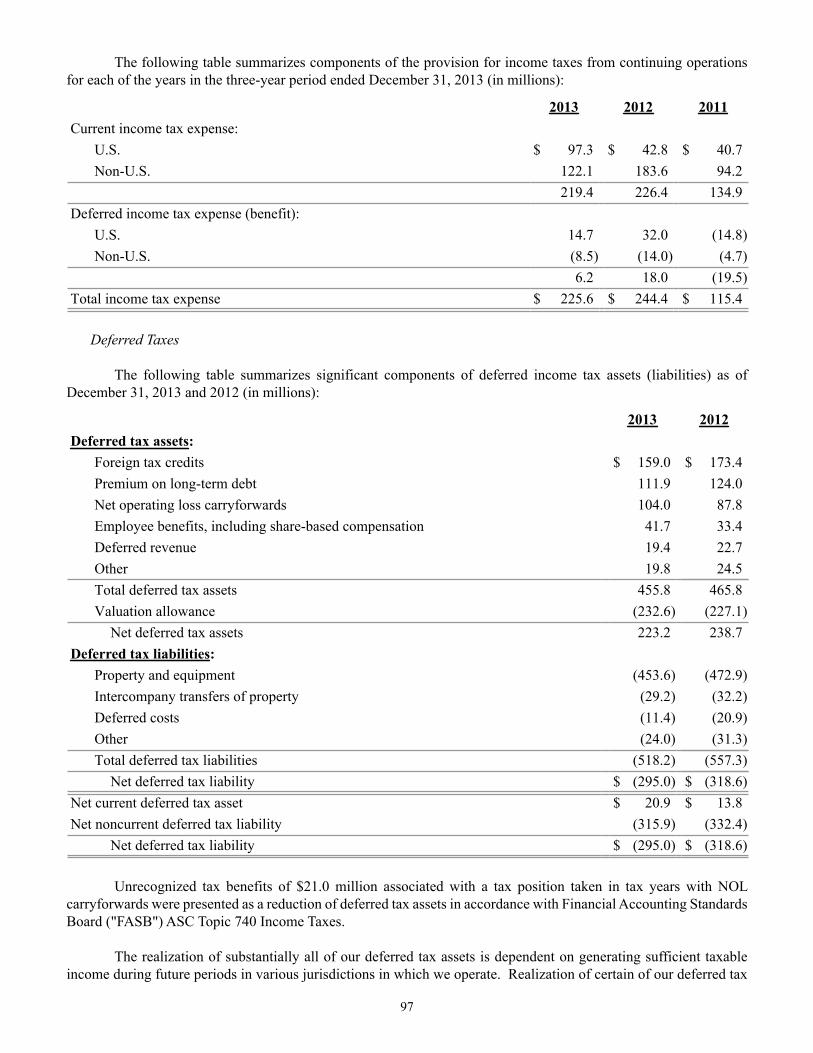
97
The following table summarizes components of the provision for income taxes from continuing operations for each of the years in the three-year period ended December 31, 2013 (in millions):
2013 2012 2011Current income tax expense:
U.S. $ 97.3 $ 42.8 $ 40.7Non-U.S. 122.1 183.6 94.2
219.4 226.4 134.9Deferred income tax expense (benefit):
U.S. 14.7 32.0 (14.8)Non-U.S. (8.5) (14.0) (4.7)
6.2 18.0 (19.5)Total income tax expense $ 225.6 $ 244.4 $ 115.4
Deferred Taxes
The following table summarizes significant components of deferred income tax assets (liabilities) as of December 31, 2013 and 2012 (in millions):
2013 2012Deferred tax assets:
Foreign tax credits $ 159.0 $ 173.4Premium on long-term debt 111.9 124.0Net operating loss carryforwards 104.0 87.8Employee benefits, including share-based compensation 41.7 33.4Deferred revenue 19.4 22.7Other 19.8 24.5Total deferred tax assets 455.8 465.8Valuation allowance (232.6) (227.1)
Net deferred tax assets 223.2 238.7Deferred tax liabilities:
Property and equipment (453.6) (472.9)Intercompany transfers of property (29.2) (32.2)Deferred costs (11.4) (20.9)Other (24.0) (31.3)Total deferred tax liabilities (518.2) (557.3)
Net deferred tax liability $ (295.0) $ (318.6)Net current deferred tax asset $ 20.9 $ 13.8Net noncurrent deferred tax liability (315.9) (332.4)
Net deferred tax liability $ (295.0) $ (318.6) Unrecognized tax benefits of $21.0 million associated with a tax position taken in tax years with NOL carryforwards were presented as a reduction of deferred tax assets in accordance with Financial Accounting Standards Board ("FASB") ASC Topic 740 Income Taxes.
The realization of substantially all of our deferred tax assets is dependent on generating sufficient taxable income during future periods in various jurisdictions in which we operate. Realization of certain of our deferred tax
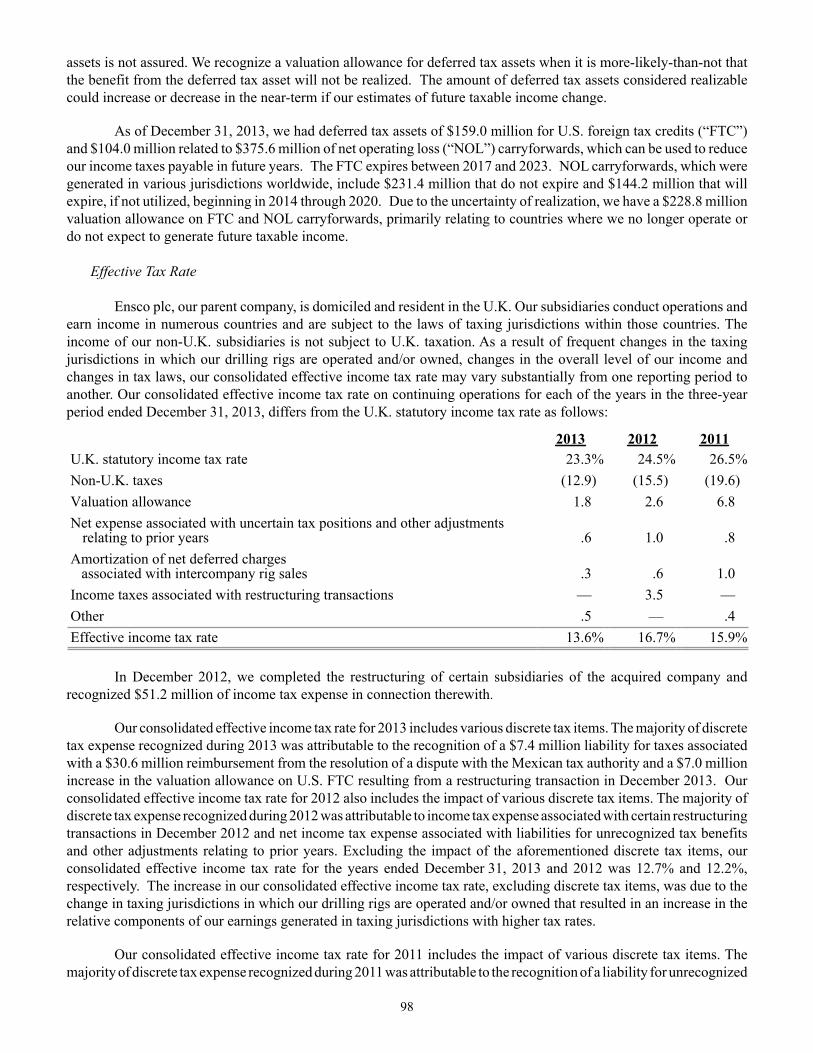
98
assets is not assured. We recognize a valuation allowance for deferred tax assets when it is more-likely-than-not that the benefit from the deferred tax asset will not be realized. The amount of deferred tax assets considered realizable could increase or decrease in the near-term if our estimates of future taxable income change.
As of December 31, 2013, we had deferred tax assets of $159.0 million for U.S. foreign tax credits (“FTC”) and $104.0 million related to $375.6 million of net operating loss (“NOL”) carryforwards, which can be used to reduce our income taxes payable in future years. The FTC expires between 2017 and 2023. NOL carryforwards, which were generated in various jurisdictions worldwide, include $231.4 million that do not expire and $144.2 million that will expire, if not utilized, beginning in 2014 through 2020. Due to the uncertainty of realization, we have a $228.8 million valuation allowance on FTC and NOL carryforwards, primarily relating to countries where we no longer operate or do not expect to generate future taxable income.
Effective Tax Rate
Ensco plc, our parent company, is domiciled and resident in the U.K. Our subsidiaries conduct operations and earn income in numerous countries and are subject to the laws of taxing jurisdictions within those countries. The income of our non-U.K. subsidiaries is not subject to U.K. taxation. As a result of frequent changes in the taxing jurisdictions in which our drilling rigs are operated and/or owned, changes in the overall level of our income and changes in tax laws, our consolidated effective income tax rate may vary substantially from one reporting period to another. Our consolidated effective income tax rate on continuing operations for each of the years in the three-year period ended December 31, 2013, differs from the U.K. statutory income tax rate as follows:
2013 2012 2011U.K. statutory income tax rate 23.3% 24.5% 26.5%Non-U.K. taxes (12.9) (15.5) (19.6)Valuation allowance 1.8 2.6 6.8Net expense associated with uncertain tax positions and other adjustments
relating to prior years .6 1.0 .8Amortization of net deferred charges associated with intercompany rig sales .3 .6 1.0Income taxes associated with restructuring transactions — 3.5 —Other .5 — .4Effective income tax rate 13.6% 16.7% 15.9%
In December 2012, we completed the restructuring of certain subsidiaries of the acquired company and recognized $51.2 million of income tax expense in connection therewith.
Our consolidated effective income tax rate for 2013 includes various discrete tax items. The majority of discrete tax expense recognized during 2013 was attributable to the recognition of a $7.4 million liability for taxes associated with a $30.6 million reimbursement from the resolution of a dispute with the Mexican tax authority and a $7.0 million increase in the valuation allowance on U.S. FTC resulting from a restructuring transaction in December 2013. Our consolidated effective income tax rate for 2012 also includes the impact of various discrete tax items. The majority of discrete tax expense recognized during 2012 was attributable to income tax expense associated with certain restructuring transactions in December 2012 and net income tax expense associated with liabilities for unrecognized tax benefits and other adjustments relating to prior years. Excluding the impact of the aforementioned discrete tax items, our consolidated effective income tax rate for the years ended December 31, 2013 and 2012 was 12.7% and 12.2%, respectively. The increase in our consolidated effective income tax rate, excluding discrete tax items, was due to the change in taxing jurisdictions in which our drilling rigs are operated and/or owned that resulted in an increase in the relative components of our earnings generated in taxing jurisdictions with higher tax rates.
Our consolidated effective income tax rate for 2011 includes the impact of various discrete tax items. The majority of discrete tax expense recognized during 2011 was attributable to the recognition of a liability for unrecognized
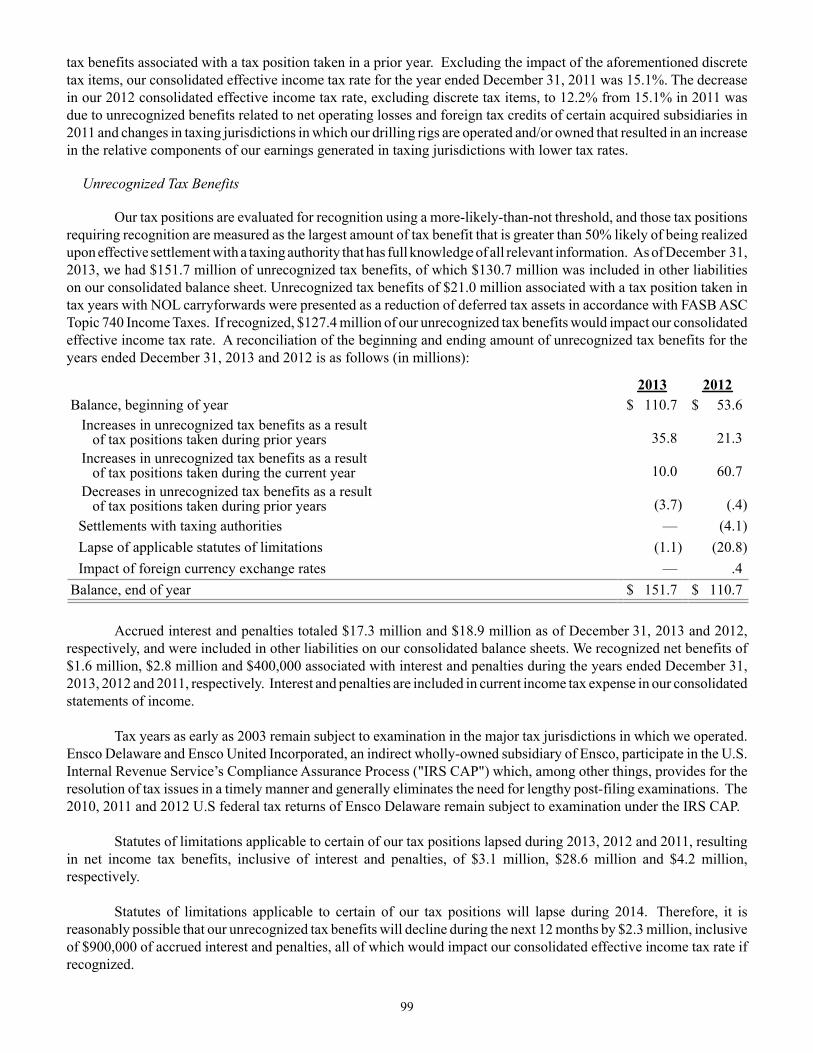
99
tax benefits associated with a tax position taken in a prior year. Excluding the impact of the aforementioned discrete tax items, our consolidated effective income tax rate for the year ended December 31, 2011 was 15.1%. The decrease in our 2012 consolidated effective income tax rate, excluding discrete tax items, to 12.2% from 15.1% in 2011 was due to unrecognized benefits related to net operating losses and foreign tax credits of certain acquired subsidiaries in 2011 and changes in taxing jurisdictions in which our drilling rigs are operated and/or owned that resulted in an increase in the relative components of our earnings generated in taxing jurisdictions with lower tax rates.
Unrecognized Tax Benefits
Our tax positions are evaluated for recognition using a more-likely-than-not threshold, and those tax positions requiring recognition are measured as the largest amount of tax benefit that is greater than 50% likely of being realized upon effective settlement with a taxing authority that has full knowledge of all relevant information. As of December 31, 2013, we had $151.7 million of unrecognized tax benefits, of which $130.7 million was included in other liabilities on our consolidated balance sheet. Unrecognized tax benefits of $21.0 million associated with a tax position taken in tax years with NOL carryforwards were presented as a reduction of deferred tax assets in accordance with FASB ASC Topic 740 Income Taxes. If recognized, $127.4 million of our unrecognized tax benefits would impact our consolidated effective income tax rate. A reconciliation of the beginning and ending amount of unrecognized tax benefits for the years ended December 31, 2013 and 2012 is as follows (in millions):
2013 2012Balance, beginning of year $ 110.7 $ 53.6 Increases in unrecognized tax benefits as a result of tax positions taken during prior years 35.8 21.3 Increases in unrecognized tax benefits as a result of tax positions taken during the current year 10.0 60.7 Decreases in unrecognized tax benefits as a result of tax positions taken during prior years (3.7) (.4)
Settlements with taxing authorities — (4.1)Lapse of applicable statutes of limitations (1.1) (20.8)Impact of foreign currency exchange rates — .4
Balance, end of year $ 151.7 $ 110.7 Accrued interest and penalties totaled $17.3 million and $18.9 million as of December 31, 2013 and 2012, respectively, and were included in other liabilities on our consolidated balance sheets. We recognized net benefits of $1.6 million, $2.8 million and $400,000 associated with interest and penalties during the years ended December 31, 2013, 2012 and 2011, respectively. Interest and penalties are included in current income tax expense in our consolidated statements of income. Tax years as early as 2003 remain subject to examination in the major tax jurisdictions in which we operated. Ensco Delaware and Ensco United Incorporated, an indirect wholly-owned subsidiary of Ensco, participate in the U.S. Internal Revenue Service’s Compliance Assurance Process ("IRS CAP") which, among other things, provides for the resolution of tax issues in a timely manner and generally eliminates the need for lengthy post-filing examinations. The 2010, 2011 and 2012 U.S federal tax returns of Ensco Delaware remain subject to examination under the IRS CAP.
Statutes of limitations applicable to certain of our tax positions lapsed during 2013, 2012 and 2011, resulting in net income tax benefits, inclusive of interest and penalties, of $3.1 million, $28.6 million and $4.2 million, respectively. Statutes of limitations applicable to certain of our tax positions will lapse during 2014. Therefore, it is reasonably possible that our unrecognized tax benefits will decline during the next 12 months by $2.3 million, inclusive of $900,000 of accrued interest and penalties, all of which would impact our consolidated effective income tax rate if recognized.
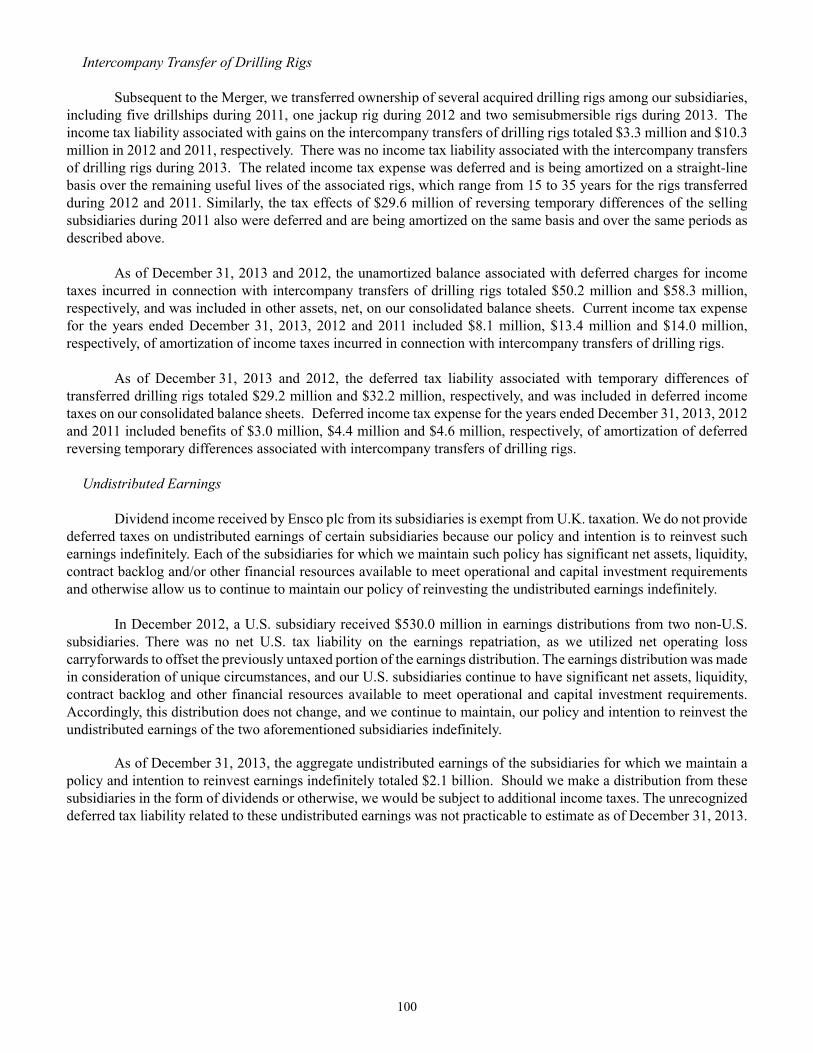
100
Intercompany Transfer of Drilling Rigs Subsequent to the Merger, we transferred ownership of several acquired drilling rigs among our subsidiaries, including five drillships during 2011, one jackup rig during 2012 and two semisubmersible rigs during 2013. The income tax liability associated with gains on the intercompany transfers of drilling rigs totaled $3.3 million and $10.3 million in 2012 and 2011, respectively. There was no income tax liability associated with the intercompany transfers of drilling rigs during 2013. The related income tax expense was deferred and is being amortized on a straight-line basis over the remaining useful lives of the associated rigs, which range from 15 to 35 years for the rigs transferred during 2012 and 2011. Similarly, the tax effects of $29.6 million of reversing temporary differences of the selling subsidiaries during 2011 also were deferred and are being amortized on the same basis and over the same periods as described above.
As of December 31, 2013 and 2012, the unamortized balance associated with deferred charges for income taxes incurred in connection with intercompany transfers of drilling rigs totaled $50.2 million and $58.3 million, respectively, and was included in other assets, net, on our consolidated balance sheets. Current income tax expense for the years ended December 31, 2013, 2012 and 2011 included $8.1 million, $13.4 million and $14.0 million, respectively, of amortization of income taxes incurred in connection with intercompany transfers of drilling rigs. As of December 31, 2013 and 2012, the deferred tax liability associated with temporary differences of transferred drilling rigs totaled $29.2 million and $32.2 million, respectively, and was included in deferred income taxes on our consolidated balance sheets. Deferred income tax expense for the years ended December 31, 2013, 2012 and 2011 included benefits of $3.0 million, $4.4 million and $4.6 million, respectively, of amortization of deferred reversing temporary differences associated with intercompany transfers of drilling rigs.
Undistributed Earnings Dividend income received by Ensco plc from its subsidiaries is exempt from U.K. taxation. We do not provide deferred taxes on undistributed earnings of certain subsidiaries because our policy and intention is to reinvest such earnings indefinitely. Each of the subsidiaries for which we maintain such policy has significant net assets, liquidity, contract backlog and/or other financial resources available to meet operational and capital investment requirements and otherwise allow us to continue to maintain our policy of reinvesting the undistributed earnings indefinitely.
In December 2012, a U.S. subsidiary received $530.0 million in earnings distributions from two non-U.S. subsidiaries. There was no net U.S. tax liability on the earnings repatriation, as we utilized net operating loss carryforwards to offset the previously untaxed portion of the earnings distribution. The earnings distribution was made in consideration of unique circumstances, and our U.S. subsidiaries continue to have significant net assets, liquidity, contract backlog and other financial resources available to meet operational and capital investment requirements. Accordingly, this distribution does not change, and we continue to maintain, our policy and intention to reinvest the undistributed earnings of the two aforementioned subsidiaries indefinitely.
As of December 31, 2013, the aggregate undistributed earnings of the subsidiaries for which we maintain a policy and intention to reinvest earnings indefinitely totaled $2.1 billion. Should we make a distribution from these subsidiaries in the form of dividends or otherwise, we would be subject to additional income taxes. The unrecognized deferred tax liability related to these undistributed earnings was not practicable to estimate as of December 31, 2013.
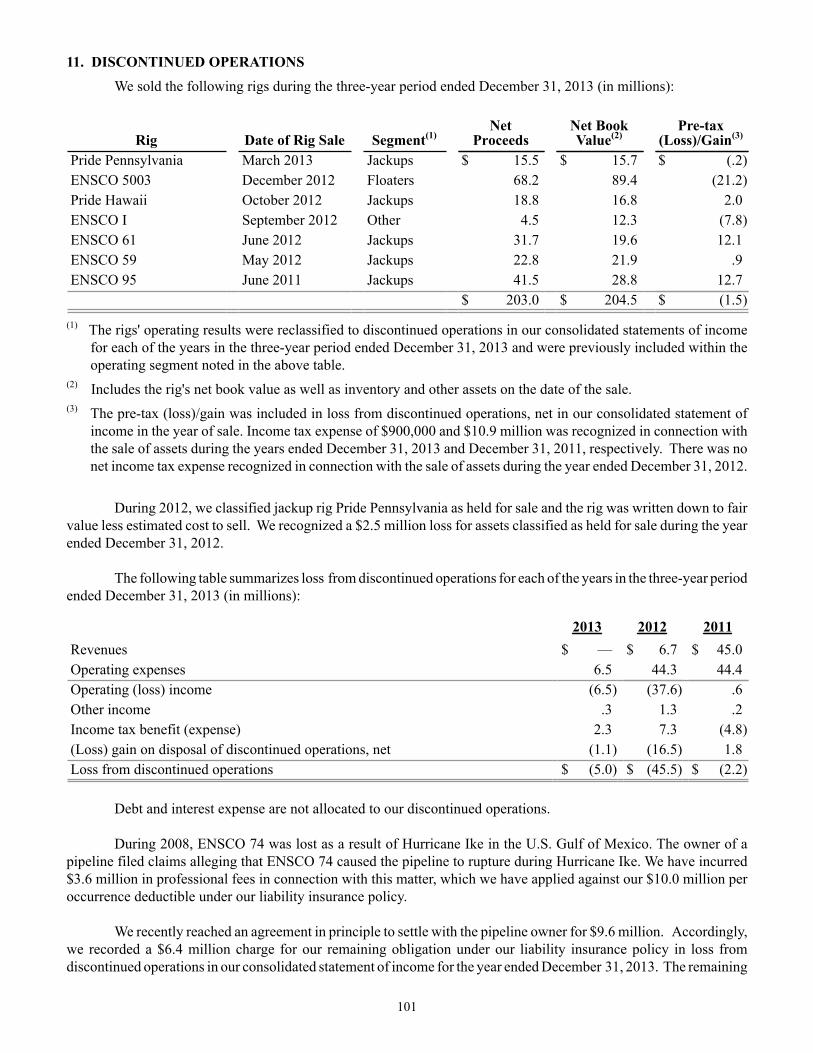
101
11. DISCONTINUED OPERATIONS We sold the following rigs during the three-year period ended December 31, 2013 (in millions):
Rig Date of Rig Sale Segment(1)Net
ProceedsNet Book Value(2)
Pre-tax (Loss)/Gain(3)
Pride Pennsylvania March 2013 Jackups $ 15.5 $ 15.7 $ (.2)ENSCO 5003 December 2012 Floaters 68.2 89.4 (21.2)Pride Hawaii October 2012 Jackups 18.8 16.8 2.0ENSCO I September 2012 Other 4.5 12.3 (7.8)ENSCO 61 June 2012 Jackups 31.7 19.6 12.1ENSCO 59 May 2012 Jackups 22.8 21.9 .9ENSCO 95 June 2011 Jackups 41.5 28.8 12.7 $ 203.0 $ 204.5 $ (1.5)
(1) The rigs' operating results were reclassified to discontinued operations in our consolidated statements of income for each of the years in the three-year period ended December 31, 2013 and were previously included within the operating segment noted in the above table.
(2) Includes the rig's net book value as well as inventory and other assets on the date of the sale.(3) The pre-tax (loss)/gain was included in loss from discontinued operations, net in our consolidated statement of
income in the year of sale. Income tax expense of $900,000 and $10.9 million was recognized in connection with the sale of assets during the years ended December 31, 2013 and December 31, 2011, respectively. There was no net income tax expense recognized in connection with the sale of assets during the year ended December 31, 2012.
During 2012, we classified jackup rig Pride Pennsylvania as held for sale and the rig was written down to fair value less estimated cost to sell. We recognized a $2.5 million loss for assets classified as held for sale during the year ended December 31, 2012.
The following table summarizes loss from discontinued operations for each of the years in the three-year period ended December 31, 2013 (in millions):
2013 2012 2011Revenues $ — $ 6.7 $ 45.0Operating expenses 6.5 44.3 44.4Operating (loss) income (6.5) (37.6) .6Other income .3 1.3 .2Income tax benefit (expense) 2.3 7.3 (4.8)(Loss) gain on disposal of discontinued operations, net (1.1) (16.5) 1.8Loss from discontinued operations $ (5.0) $ (45.5) $ (2.2)
Debt and interest expense are not allocated to our discontinued operations.
During 2008, ENSCO 74 was lost as a result of Hurricane Ike in the U.S. Gulf of Mexico. The owner of a pipeline filed claims alleging that ENSCO 74 caused the pipeline to rupture during Hurricane Ike. We have incurred $3.6 million in professional fees in connection with this matter, which we have applied against our $10.0 million per occurrence deductible under our liability insurance policy.
We recently reached an agreement in principle to settle with the pipeline owner for $9.6 million. Accordingly, we recorded a $6.4 million charge for our remaining obligation under our liability insurance policy in loss from discontinued operations in our consolidated statement of income for the year ended December 31, 2013. The remaining
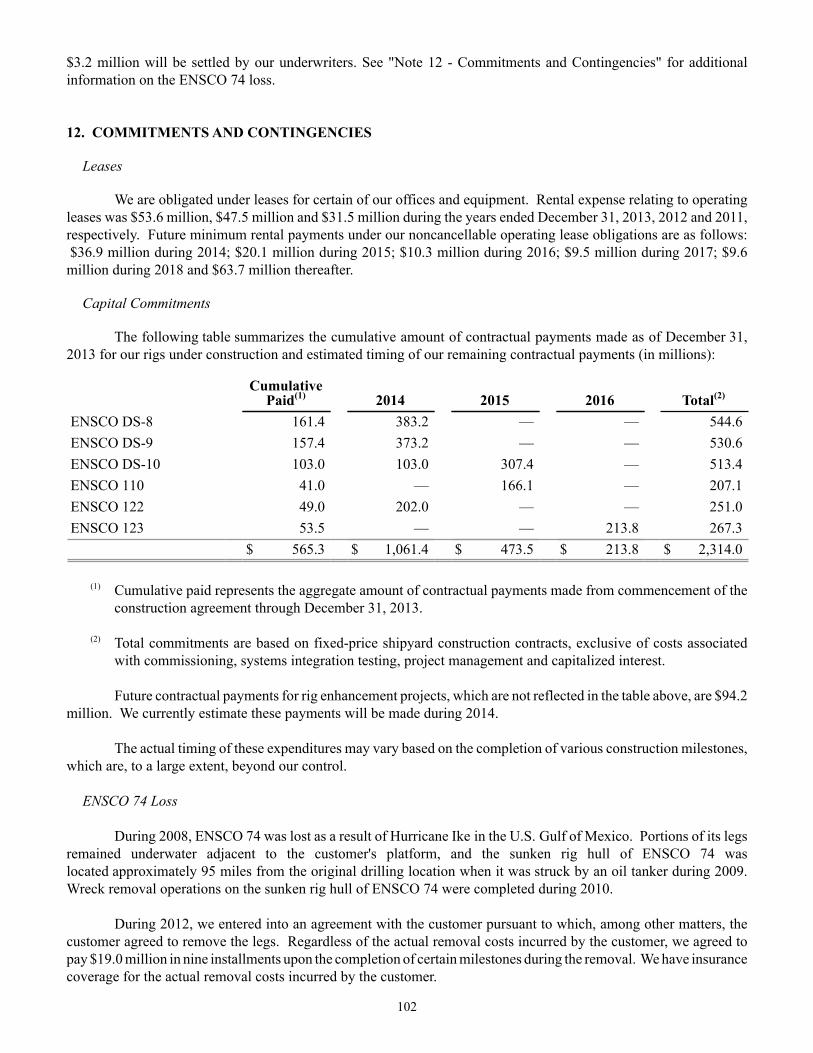
102
$3.2 million will be settled by our underwriters. See "Note 12 - Commitments and Contingencies" for additional information on the ENSCO 74 loss.
12. COMMITMENTS AND CONTINGENCIES
Leases
We are obligated under leases for certain of our offices and equipment. Rental expense relating to operating leases was $53.6 million, $47.5 million and $31.5 million during the years ended December 31, 2013, 2012 and 2011, respectively. Future minimum rental payments under our noncancellable operating lease obligations are as follows: $36.9 million during 2014; $20.1 million during 2015; $10.3 million during 2016; $9.5 million during 2017; $9.6 million during 2018 and $63.7 million thereafter.
Capital Commitments
The following table summarizes the cumulative amount of contractual payments made as of December 31, 2013 for our rigs under construction and estimated timing of our remaining contractual payments (in millions):
Cumulative Paid(1) 2014 2015 2016 Total(2)
ENSCO DS-8 161.4 383.2 — — 544.6ENSCO DS-9 157.4 373.2 — — 530.6ENSCO DS-10 103.0 103.0 307.4 — 513.4ENSCO 110 41.0 — 166.1 — 207.1ENSCO 122 49.0 202.0 — — 251.0ENSCO 123 53.5 — — 213.8 267.3
$ 565.3 $ 1,061.4 $ 473.5 $ 213.8 $ 2,314.0
(1) Cumulative paid represents the aggregate amount of contractual payments made from commencement of the construction agreement through December 31, 2013.
(2) Total commitments are based on fixed-price shipyard construction contracts, exclusive of costs associated with commissioning, systems integration testing, project management and capitalized interest.
Future contractual payments for rig enhancement projects, which are not reflected in the table above, are $94.2 million. We currently estimate these payments will be made during 2014.
The actual timing of these expenditures may vary based on the completion of various construction milestones, which are, to a large extent, beyond our control.
ENSCO 74 Loss
During 2008, ENSCO 74 was lost as a result of Hurricane Ike in the U.S. Gulf of Mexico. Portions of its legs remained underwater adjacent to the customer's platform, and the sunken rig hull of ENSCO 74 was located approximately 95 miles from the original drilling location when it was struck by an oil tanker during 2009. Wreck removal operations on the sunken rig hull of ENSCO 74 were completed during 2010. During 2012, we entered into an agreement with the customer pursuant to which, among other matters, the customer agreed to remove the legs. Regardless of the actual removal costs incurred by the customer, we agreed to pay $19.0 million in nine installments upon the completion of certain milestones during the removal. We have insurance coverage for the actual removal costs incurred by the customer.
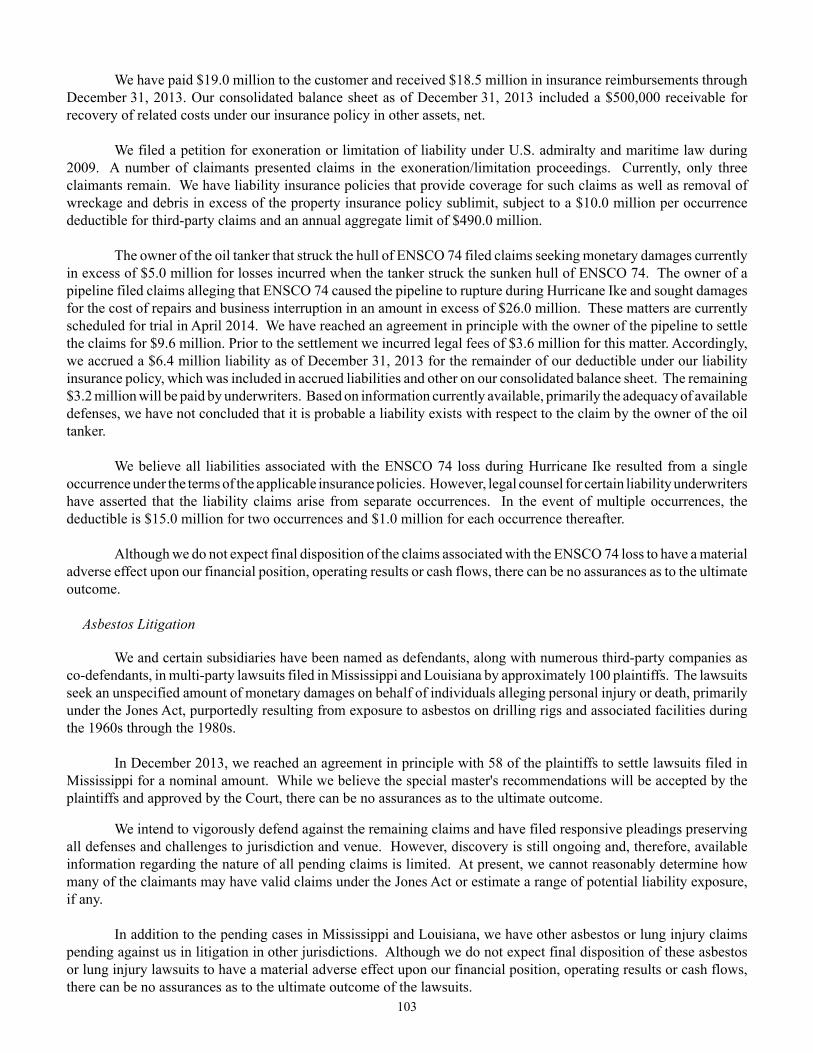
103
We have paid $19.0 million to the customer and received $18.5 million in insurance reimbursements through December 31, 2013. Our consolidated balance sheet as of December 31, 2013 included a $500,000 receivable for recovery of related costs under our insurance policy in other assets, net.
We filed a petition for exoneration or limitation of liability under U.S. admiralty and maritime law during 2009. A number of claimants presented claims in the exoneration/limitation proceedings. Currently, only three claimants remain. We have liability insurance policies that provide coverage for such claims as well as removal of wreckage and debris in excess of the property insurance policy sublimit, subject to a $10.0 million per occurrence deductible for third-party claims and an annual aggregate limit of $490.0 million.
The owner of the oil tanker that struck the hull of ENSCO 74 filed claims seeking monetary damages currently in excess of $5.0 million for losses incurred when the tanker struck the sunken hull of ENSCO 74. The owner of a pipeline filed claims alleging that ENSCO 74 caused the pipeline to rupture during Hurricane Ike and sought damages for the cost of repairs and business interruption in an amount in excess of $26.0 million. These matters are currently scheduled for trial in April 2014. We have reached an agreement in principle with the owner of the pipeline to settle the claims for $9.6 million. Prior to the settlement we incurred legal fees of $3.6 million for this matter. Accordingly, we accrued a $6.4 million liability as of December 31, 2013 for the remainder of our deductible under our liability insurance policy, which was included in accrued liabilities and other on our consolidated balance sheet. The remaining $3.2 million will be paid by underwriters. Based on information currently available, primarily the adequacy of available defenses, we have not concluded that it is probable a liability exists with respect to the claim by the owner of the oil tanker. We believe all liabilities associated with the ENSCO 74 loss during Hurricane Ike resulted from a single occurrence under the terms of the applicable insurance policies. However, legal counsel for certain liability underwriters have asserted that the liability claims arise from separate occurrences. In the event of multiple occurrences, the deductible is $15.0 million for two occurrences and $1.0 million for each occurrence thereafter.
Although we do not expect final disposition of the claims associated with the ENSCO 74 loss to have a material adverse effect upon our financial position, operating results or cash flows, there can be no assurances as to the ultimate outcome.
Asbestos Litigation
We and certain subsidiaries have been named as defendants, along with numerous third-party companies as co-defendants, in multi-party lawsuits filed in Mississippi and Louisiana by approximately 100 plaintiffs. The lawsuits seek an unspecified amount of monetary damages on behalf of individuals alleging personal injury or death, primarily under the Jones Act, purportedly resulting from exposure to asbestos on drilling rigs and associated facilities during the 1960s through the 1980s.
In December 2013, we reached an agreement in principle with 58 of the plaintiffs to settle lawsuits filed in Mississippi for a nominal amount. While we believe the special master's recommendations will be accepted by the plaintiffs and approved by the Court, there can be no assurances as to the ultimate outcome.
We intend to vigorously defend against the remaining claims and have filed responsive pleadings preserving all defenses and challenges to jurisdiction and venue. However, discovery is still ongoing and, therefore, available information regarding the nature of all pending claims is limited. At present, we cannot reasonably determine how many of the claimants may have valid claims under the Jones Act or estimate a range of potential liability exposure, if any. In addition to the pending cases in Mississippi and Louisiana, we have other asbestos or lung injury claims pending against us in litigation in other jurisdictions. Although we do not expect final disposition of these asbestos or lung injury lawsuits to have a material adverse effect upon our financial position, operating results or cash flows, there can be no assurances as to the ultimate outcome of the lawsuits.
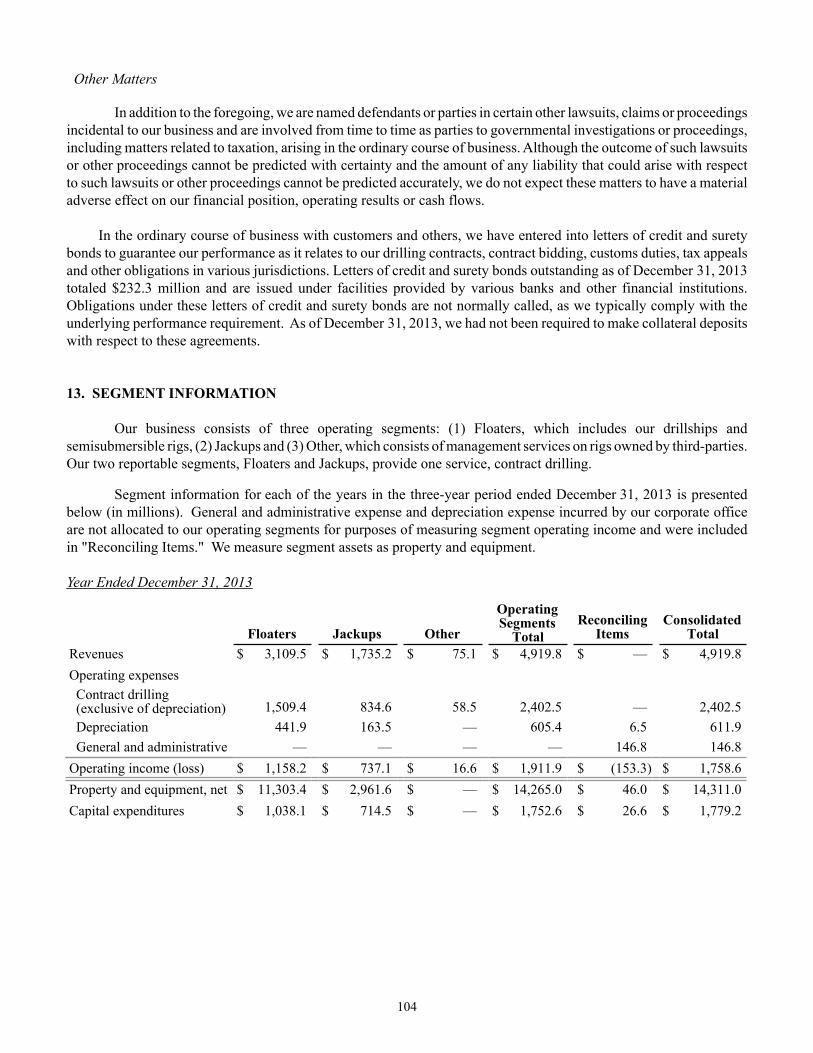
104
Other Matters
In addition to the foregoing, we are named defendants or parties in certain other lawsuits, claims or proceedings incidental to our business and are involved from time to time as parties to governmental investigations or proceedings, including matters related to taxation, arising in the ordinary course of business. Although the outcome of such lawsuits or other proceedings cannot be predicted with certainty and the amount of any liability that could arise with respect to such lawsuits or other proceedings cannot be predicted accurately, we do not expect these matters to have a material adverse effect on our financial position, operating results or cash flows.
In the ordinary course of business with customers and others, we have entered into letters of credit and surety bonds to guarantee our performance as it relates to our drilling contracts, contract bidding, customs duties, tax appeals and other obligations in various jurisdictions. Letters of credit and surety bonds outstanding as of December 31, 2013 totaled $232.3 million and are issued under facilities provided by various banks and other financial institutions. Obligations under these letters of credit and surety bonds are not normally called, as we typically comply with the underlying performance requirement. As of December 31, 2013, we had not been required to make collateral deposits with respect to these agreements.
13. SEGMENT INFORMATION Our business consists of three operating segments: (1) Floaters, which includes our drillships and semisubmersible rigs, (2) Jackups and (3) Other, which consists of management services on rigs owned by third-parties. Our two reportable segments, Floaters and Jackups, provide one service, contract drilling.
Segment information for each of the years in the three-year period ended December 31, 2013 is presented below (in millions). General and administrative expense and depreciation expense incurred by our corporate office are not allocated to our operating segments for purposes of measuring segment operating income and were included in "Reconciling Items." We measure segment assets as property and equipment.
Year Ended December 31, 2013
Floaters Jackups Other
OperatingSegments
TotalReconciling
ItemsConsolidated
TotalRevenues $ 3,109.5 $ 1,735.2 $ 75.1 $ 4,919.8 $ — $ 4,919.8Operating expenses Contract drilling (exclusive of depreciation) 1,509.4 834.6 58.5 2,402.5 — 2,402.5 Depreciation 441.9 163.5 — 605.4 6.5 611.9 General and administrative — — — — 146.8 146.8Operating income (loss) $ 1,158.2 $ 737.1 $ 16.6 $ 1,911.9 $ (153.3) $ 1,758.6Property and equipment, net $ 11,303.4 $ 2,961.6 $ — $ 14,265.0 $ 46.0 $ 14,311.0Capital expenditures $ 1,038.1 $ 714.5 $ — $ 1,752.6 $ 26.6 $ 1,779.2
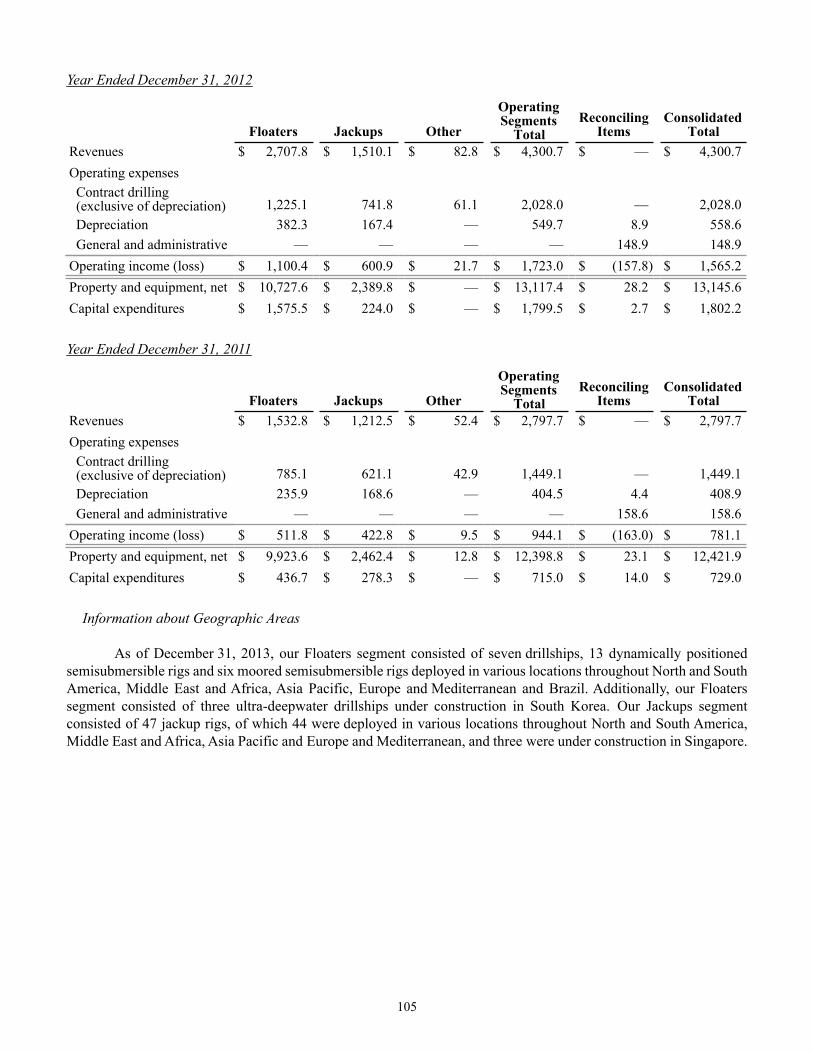
105
Year Ended December 31, 2012
Floaters Jackups Other
OperatingSegments
TotalReconciling
ItemsConsolidated
TotalRevenues $ 2,707.8 $ 1,510.1 $ 82.8 $ 4,300.7 $ — $ 4,300.7Operating expenses Contract drilling (exclusive of depreciation) 1,225.1 741.8 61.1 2,028.0 — 2,028.0 Depreciation 382.3 167.4 — 549.7 8.9 558.6 General and administrative — — — — 148.9 148.9Operating income (loss) $ 1,100.4 $ 600.9 $ 21.7 $ 1,723.0 $ (157.8) $ 1,565.2Property and equipment, net $ 10,727.6 $ 2,389.8 $ — $ 13,117.4 $ 28.2 $ 13,145.6Capital expenditures $ 1,575.5 $ 224.0 $ — $ 1,799.5 $ 2.7 $ 1,802.2
Year Ended December 31, 2011
Floaters Jackups Other
OperatingSegments
TotalReconciling
ItemsConsolidated
TotalRevenues $ 1,532.8 $ 1,212.5 $ 52.4 $ 2,797.7 $ — $ 2,797.7Operating expenses Contract drilling (exclusive of depreciation) 785.1 621.1 42.9 1,449.1 — 1,449.1 Depreciation 235.9 168.6 — 404.5 4.4 408.9 General and administrative — — — — 158.6 158.6Operating income (loss) $ 511.8 $ 422.8 $ 9.5 $ 944.1 $ (163.0) $ 781.1Property and equipment, net $ 9,923.6 $ 2,462.4 $ 12.8 $ 12,398.8 $ 23.1 $ 12,421.9Capital expenditures $ 436.7 $ 278.3 $ — $ 715.0 $ 14.0 $ 729.0
Information about Geographic Areas
As of December 31, 2013, our Floaters segment consisted of seven drillships, 13 dynamically positioned semisubmersible rigs and six moored semisubmersible rigs deployed in various locations throughout North and South America, Middle East and Africa, Asia Pacific, Europe and Mediterranean and Brazil. Additionally, our Floaters segment consisted of three ultra-deepwater drillships under construction in South Korea. Our Jackups segment consisted of 47 jackup rigs, of which 44 were deployed in various locations throughout North and South America, Middle East and Africa, Asia Pacific and Europe and Mediterranean, and three were under construction in Singapore.
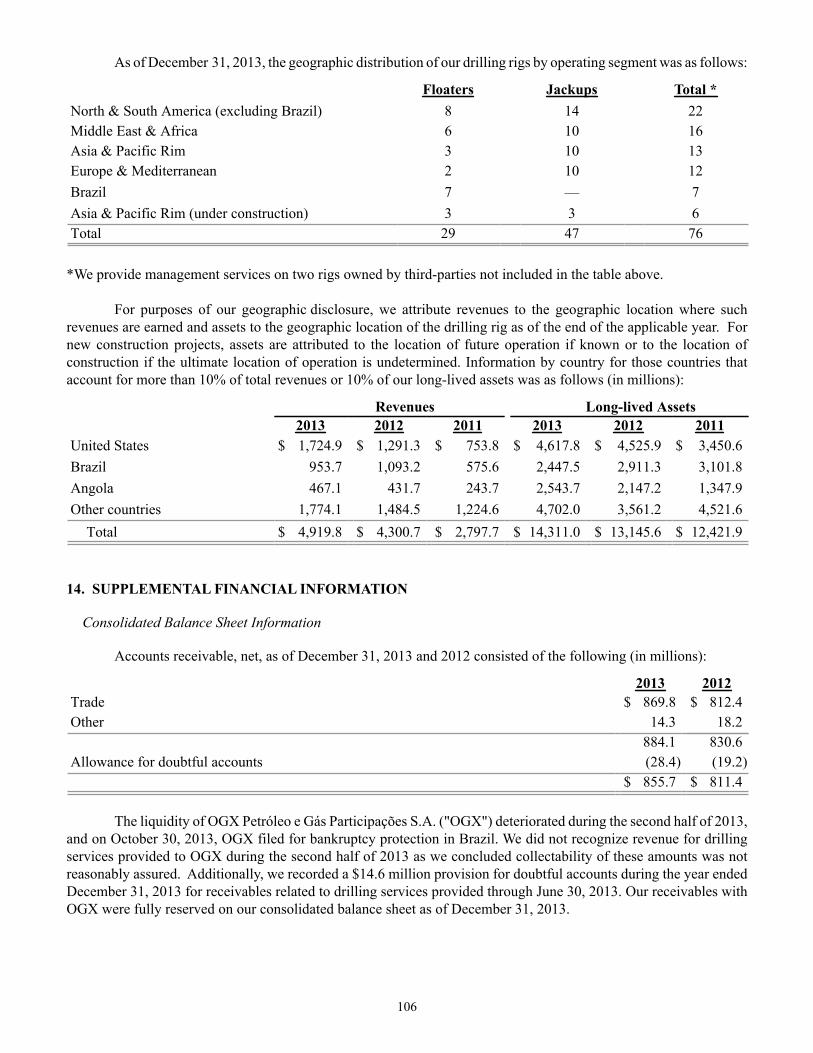
106
As of December 31, 2013, the geographic distribution of our drilling rigs by operating segment was as follows:
Floaters Jackups Total *North & South America (excluding Brazil) 8 14 22Middle East & Africa 6 10 16Asia & Pacific Rim 3 10 13Europe & Mediterranean 2 10 12Brazil 7 — 7Asia & Pacific Rim (under construction) 3 3 6Total 29 47 76
*We provide management services on two rigs owned by third-parties not included in the table above.
For purposes of our geographic disclosure, we attribute revenues to the geographic location where such revenues are earned and assets to the geographic location of the drilling rig as of the end of the applicable year. For new construction projects, assets are attributed to the location of future operation if known or to the location of construction if the ultimate location of operation is undetermined. Information by country for those countries that account for more than 10% of total revenues or 10% of our long-lived assets was as follows (in millions):
Revenues Long-lived Assets2013 2012 2011 2013 2012 2011
United States $ 1,724.9 $ 1,291.3 $ 753.8 $ 4,617.8 $ 4,525.9 $ 3,450.6Brazil 953.7 1,093.2 575.6 2,447.5 2,911.3 3,101.8Angola 467.1 431.7 243.7 2,543.7 2,147.2 1,347.9Other countries 1,774.1 1,484.5 1,224.6 4,702.0 3,561.2 4,521.6
Total $ 4,919.8 $ 4,300.7 $ 2,797.7 $ 14,311.0 $ 13,145.6 $ 12,421.9
14. SUPPLEMENTAL FINANCIAL INFORMATION
Consolidated Balance Sheet Information
Accounts receivable, net, as of December 31, 2013 and 2012 consisted of the following (in millions):
2013 2012Trade $ 869.8 $ 812.4Other 14.3 18.2 884.1 830.6Allowance for doubtful accounts (28.4) (19.2) $ 855.7 $ 811.4
The liquidity of OGX Petróleo e Gás Participações S.A. ("OGX") deteriorated during the second half of 2013, and on October 30, 2013, OGX filed for bankruptcy protection in Brazil. We did not recognize revenue for drilling services provided to OGX during the second half of 2013 as we concluded collectability of these amounts was not reasonably assured. Additionally, we recorded a $14.6 million provision for doubtful accounts during the year ended December 31, 2013 for receivables related to drilling services provided through June 30, 2013. Our receivables with OGX were fully reserved on our consolidated balance sheet as of December 31, 2013.
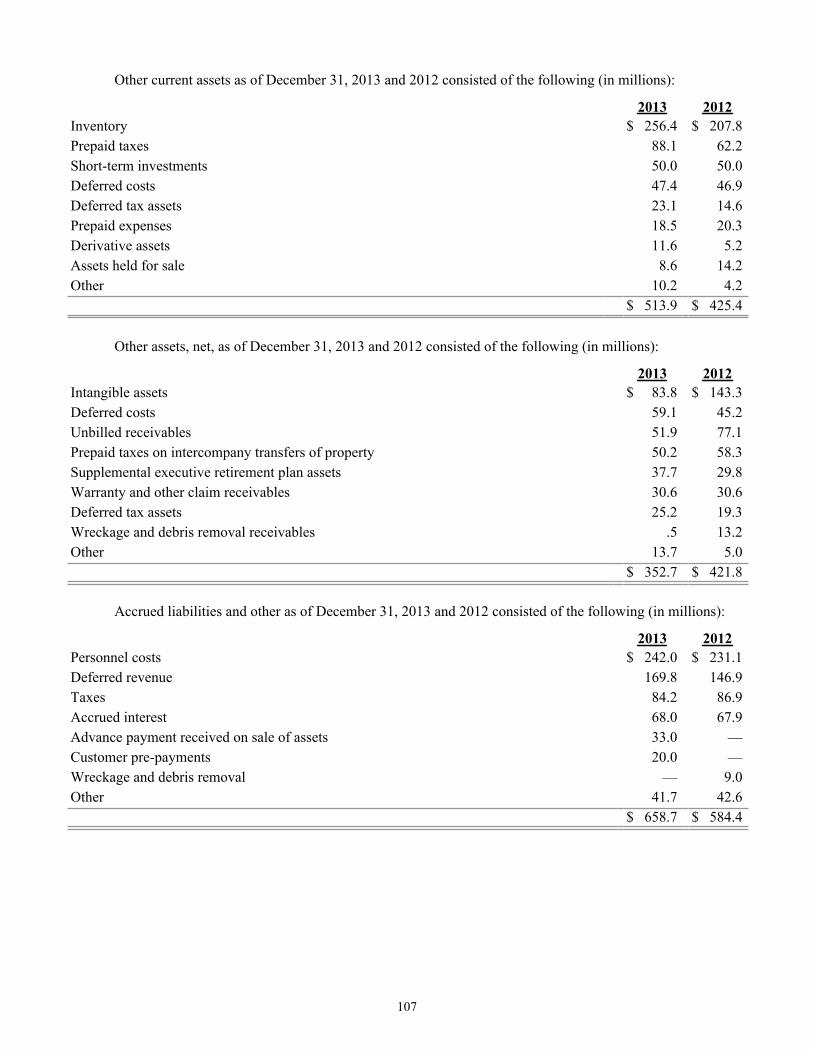
107
Other current assets as of December 31, 2013 and 2012 consisted of the following (in millions):
2013 2012Inventory $ 256.4 $ 207.8Prepaid taxes 88.1 62.2Short-term investments 50.0 50.0Deferred costs 47.4 46.9Deferred tax assets 23.1 14.6Prepaid expenses 18.5 20.3Derivative assets 11.6 5.2Assets held for sale 8.6 14.2Other 10.2 4.2
$ 513.9 $ 425.4 Other assets, net, as of December 31, 2013 and 2012 consisted of the following (in millions):
2013 2012Intangible assets $ 83.8 $ 143.3Deferred costs 59.1 45.2Unbilled receivables 51.9 77.1Prepaid taxes on intercompany transfers of property 50.2 58.3Supplemental executive retirement plan assets 37.7 29.8Warranty and other claim receivables 30.6 30.6Deferred tax assets 25.2 19.3Wreckage and debris removal receivables .5 13.2Other 13.7 5.0
$ 352.7 $ 421.8
Accrued liabilities and other as of December 31, 2013 and 2012 consisted of the following (in millions):
2013 2012Personnel costs $ 242.0 $ 231.1Deferred revenue 169.8 146.9Taxes 84.2 86.9Accrued interest 68.0 67.9Advance payment received on sale of assets 33.0 —Customer pre-payments 20.0 —Wreckage and debris removal — 9.0Other 41.7 42.6 $ 658.7 $ 584.4
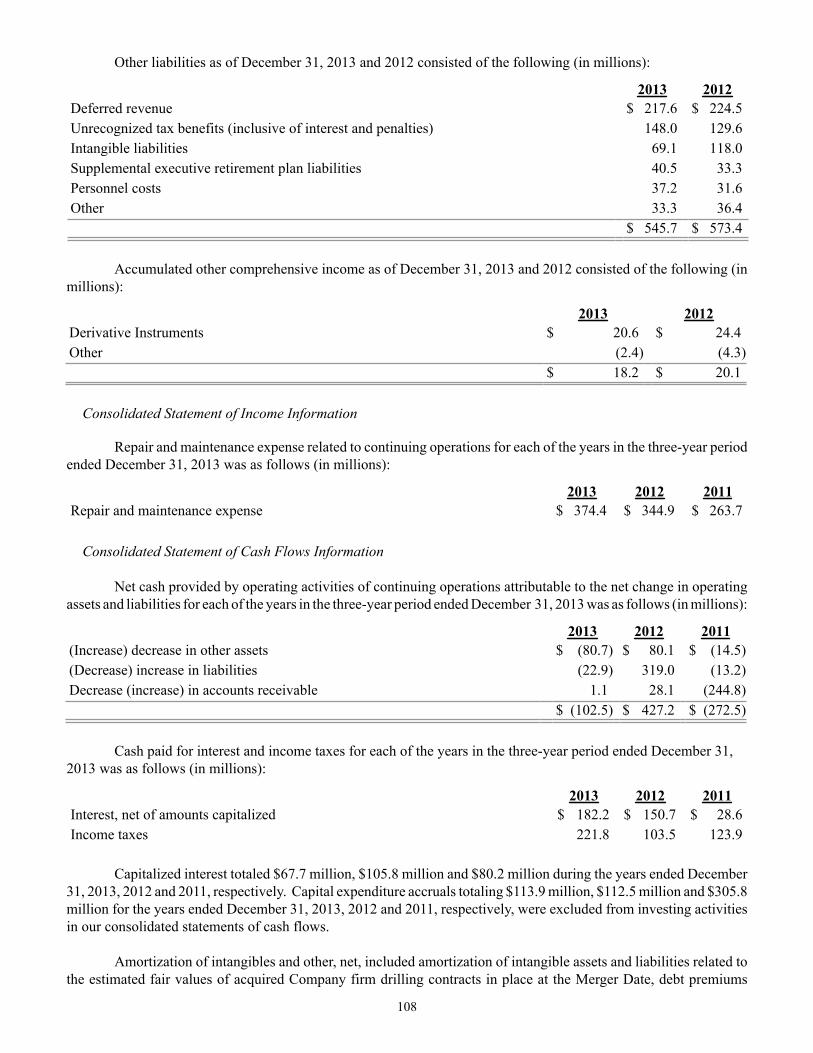
108
Other liabilities as of December 31, 2013 and 2012 consisted of the following (in millions):
2013 2012Deferred revenue $ 217.6 $ 224.5Unrecognized tax benefits (inclusive of interest and penalties) 148.0 129.6Intangible liabilities 69.1 118.0Supplemental executive retirement plan liabilities 40.5 33.3Personnel costs 37.2 31.6Other 33.3 36.4 $ 545.7 $ 573.4
Accumulated other comprehensive income as of December 31, 2013 and 2012 consisted of the following (in millions):
2013 2012Derivative Instruments $ 20.6 $ 24.4Other (2.4) (4.3)
$ 18.2 $ 20.1
Consolidated Statement of Income Information
Repair and maintenance expense related to continuing operations for each of the years in the three-year period ended December 31, 2013 was as follows (in millions):
2013 2012 2011Repair and maintenance expense $ 374.4 $ 344.9 $ 263.7
Consolidated Statement of Cash Flows Information Net cash provided by operating activities of continuing operations attributable to the net change in operating assets and liabilities for each of the years in the three-year period ended December 31, 2013 was as follows (in millions):
2013 2012 2011(Increase) decrease in other assets $ (80.7) $ 80.1 $ (14.5)(Decrease) increase in liabilities (22.9) 319.0 (13.2)Decrease (increase) in accounts receivable 1.1 28.1 (244.8)
$ (102.5) $ 427.2 $ (272.5)
Cash paid for interest and income taxes for each of the years in the three-year period ended December 31, 2013 was as follows (in millions):
2013 2012 2011Interest, net of amounts capitalized $ 182.2 $ 150.7 $ 28.6Income taxes 221.8 103.5 123.9
Capitalized interest totaled $67.7 million, $105.8 million and $80.2 million during the years ended December 31, 2013, 2012 and 2011, respectively. Capital expenditure accruals totaling $113.9 million, $112.5 million and $305.8 million for the years ended December 31, 2013, 2012 and 2011, respectively, were excluded from investing activities in our consolidated statements of cash flows.
Amortization of intangibles and other, net, included amortization of intangible assets and liabilities related to the estimated fair values of acquired Company firm drilling contracts in place at the Merger Date, debt premiums
109
related to the fair value adjustment of acquired Company debt instruments, deferred charges for income taxes incurred on intercompany transfers of drilling rigs and certain other deferred costs.
Concentration of Risk
We are exposed to credit risk relating to our receivables from customers, our cash and cash equivalents and investments and our use of derivatives in connection with the management of foreign currency exchange rate risk. We mitigate our credit risk relating to receivables from customers, which consist primarily of major international, government-owned and independent oil and gas companies, by performing ongoing credit evaluations. We also maintain reserves for potential credit losses, which generally have been within management's expectations. We mitigate our credit risk relating to cash and investments by focusing on diversification and quality of instruments. Cash equivalents and short-term investments consist of a portfolio of high-grade instruments. Custody of cash and cash equivalents and short-term investments is maintained at several well-capitalized financial institutions, and we monitor the financial condition of those financial institutions.
We mitigate our credit risk relating to counterparties of our derivatives through a variety of techniques, including transacting with multiple, high-quality financial institutions, thereby limiting our exposure to individual counterparties and by entering into ISDA Master Agreements, which include provisions for a legally enforceable master netting agreement, with almost all of our derivative counterparties. The terms of the ISDA agreements may also include credit support requirements, cross default provisions, termination events, or set-off provisions. Legally enforceable master netting agreements reduce credit risk by providing protection in bankruptcy in certain circumstances and generally permitting the closeout and netting of transactions with the same counterparty upon the occurrence of certain events. During the years ended December 31, 2013, 2012 and 2011, Petrobras, our largest customer, accounted for $817.8 million, $1.0 billion and $456.6 million, or 17%, 24% and 16%, of consolidated revenues, respectively, all of which were attributable to our Floaters segment.
During the year ended December 31, 2013, revenues provided by our drilling operations in the U. S. Gulf of Mexico totaled $1.7 billion, or 35%, of consolidated revenues, of which 75% were attributable to our Floaters segment. Revenues provided by our drilling operations in Brazil during the year ended December 31, 2013 totaled $953.7 million, or 19%, of consolidated revenues, all of which were attributable to our Floaters segment.
15. GUARANTEE OF REGISTERED SECURITIES In connection with the Merger, Ensco plc and Pride entered into a supplemental indenture to the indenture dated as of July 1, 2004 between Pride and the Bank of New York Mellon, as indenture trustee, providing for, among other matters, the full and unconditional guarantee by Ensco plc of Pride’s 8.5% senior notes due 2019, 6.875% senior notes due 2020 and 7.875% senior notes due 2040, which had an aggregate outstanding principal balance of $1.7 billion as of December 31, 2013. The Ensco plc guarantee provides for the unconditional and irrevocable guarantee of the prompt payment, when due, of any amount owed to the holders of the notes. Ensco plc is also a full and unconditional guarantor of the 7.2% Debentures due 2027 issued by Ensco Delaware in November 1997, which had an aggregate outstanding principal balance of $150.0 million as of December 31, 2013. All guarantees are unsecured obligations of Ensco plc ranking equal in right of payment with all of its existing and future unsecured and unsubordinated indebtedness.
The following tables present our condensed consolidating statements of income for each of the years in the three-year period ended December 31, 2013; our condensed consolidating statements of comprehensive income for each of the years in the three-year period ended December 31, 2013; our condensed consolidating balance sheets as of December 31, 2013 and 2012; and our condensed consolidating statements of cash flows for each of the years in the three-year period ended December 31, 2013, in accordance with Rule 3-10 of Regulation S-X.
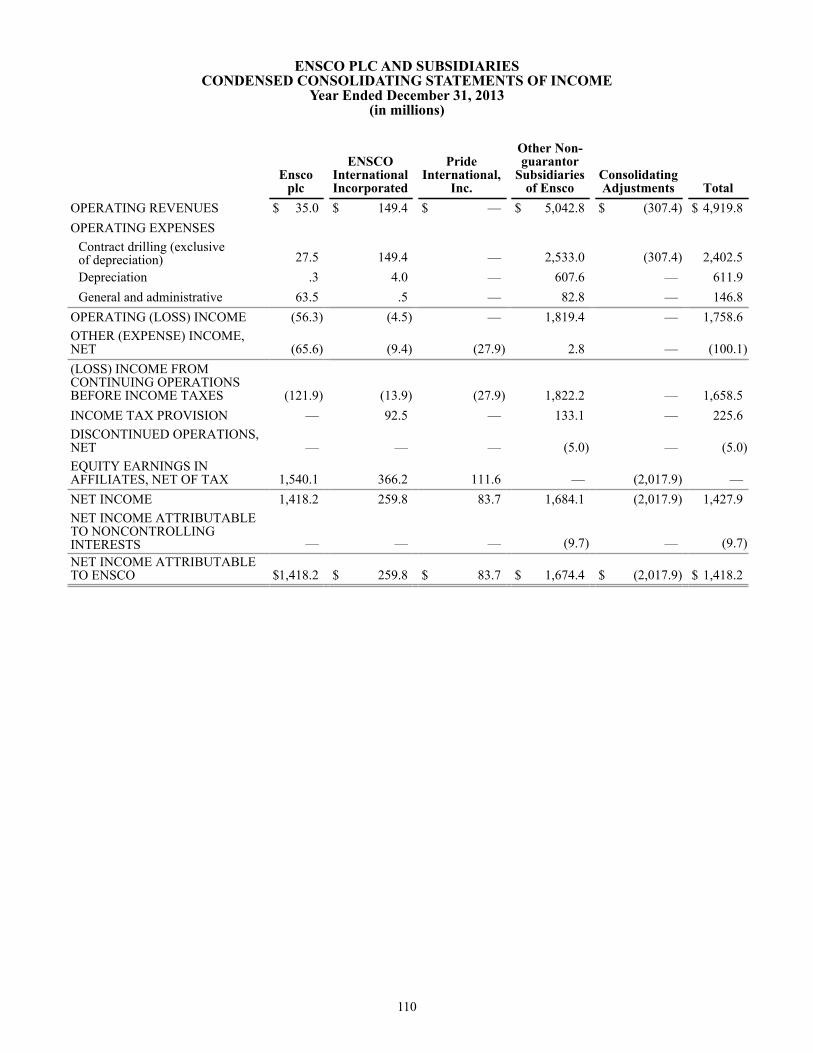
110
ENSCO PLC AND SUBSIDIARIESCONDENSED CONSOLIDATING STATEMENTS OF INCOME
Year Ended December 31, 2013(in millions)
Ensco
plc
ENSCOInternationalIncorporated
PrideInternational,
Inc.
Other Non-guarantor
Subsidiariesof Ensco
ConsolidatingAdjustments Total
OPERATING REVENUES $ 35.0 $ 149.4 $ — $ 5,042.8 $ (307.4) $ 4,919.8OPERATING EXPENSES
Contract drilling (exclusiveof depreciation) 27.5 149.4 — 2,533.0 (307.4) 2,402.5Depreciation .3 4.0 — 607.6 — 611.9General and administrative 63.5 .5 — 82.8 — 146.8
OPERATING (LOSS) INCOME (56.3) (4.5) — 1,819.4 — 1,758.6OTHER (EXPENSE) INCOME,NET (65.6) (9.4) (27.9) 2.8 — (100.1)(LOSS) INCOME FROMCONTINUING OPERATIONSBEFORE INCOME TAXES (121.9) (13.9) (27.9) 1,822.2 — 1,658.5INCOME TAX PROVISION — 92.5 — 133.1 — 225.6DISCONTINUED OPERATIONS,NET — — — (5.0) — (5.0)EQUITY EARNINGS INAFFILIATES, NET OF TAX 1,540.1 366.2 111.6 — (2,017.9) —NET INCOME 1,418.2 259.8 83.7 1,684.1 (2,017.9) 1,427.9NET INCOME ATTRIBUTABLETO NONCONTROLLINGINTERESTS — — — (9.7) — (9.7)NET INCOME ATTRIBUTABLETO ENSCO $1,418.2 $ 259.8 $ 83.7 $ 1,674.4 $ (2,017.9) $ 1,418.2
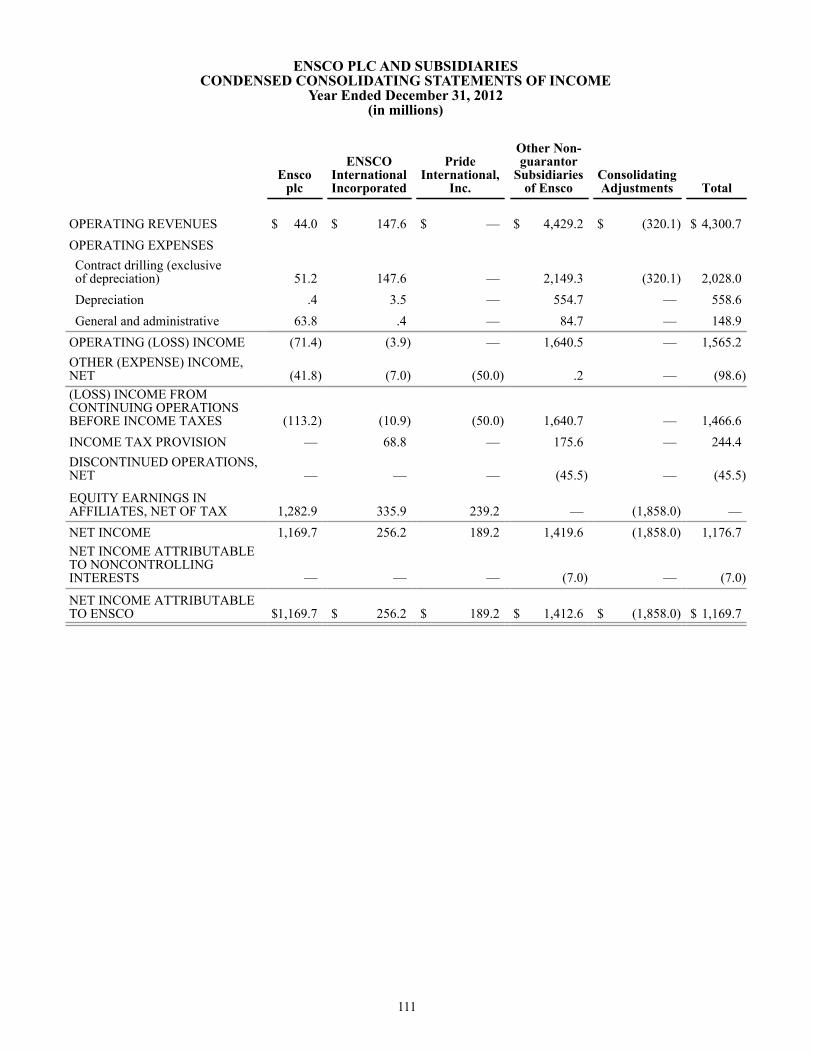
111
ENSCO PLC AND SUBSIDIARIESCONDENSED CONSOLIDATING STATEMENTS OF INCOME
Year Ended December 31, 2012(in millions)
Ensco
plc
ENSCOInternationalIncorporated
PrideInternational,
Inc.
Other Non-guarantor
Subsidiariesof Ensco
ConsolidatingAdjustments Total
OPERATING REVENUES $ 44.0 $ 147.6 $ — $ 4,429.2 $ (320.1) $ 4,300.7OPERATING EXPENSESContract drilling (exclusiveof depreciation) 51.2 147.6 — 2,149.3 (320.1) 2,028.0Depreciation .4 3.5 — 554.7 — 558.6General and administrative 63.8 .4 — 84.7 — 148.9
OPERATING (LOSS) INCOME (71.4) (3.9) — 1,640.5 — 1,565.2OTHER (EXPENSE) INCOME,NET (41.8) (7.0) (50.0) .2 — (98.6)(LOSS) INCOME FROMCONTINUING OPERATIONSBEFORE INCOME TAXES (113.2) (10.9) (50.0) 1,640.7 — 1,466.6INCOME TAX PROVISION — 68.8 — 175.6 — 244.4DISCONTINUED OPERATIONS,NET — — — (45.5) — (45.5)
EQUITY EARNINGS INAFFILIATES, NET OF TAX 1,282.9 335.9 239.2 — (1,858.0) —NET INCOME 1,169.7 256.2 189.2 1,419.6 (1,858.0) 1,176.7NET INCOME ATTRIBUTABLETO NONCONTROLLINGINTERESTS — — — (7.0) — (7.0)
NET INCOME ATTRIBUTABLETO ENSCO $1,169.7 $ 256.2 $ 189.2 $ 1,412.6 $ (1,858.0) $ 1,169.7

112
ENSCO PLC AND SUBSIDIARIESCONDENSED CONSOLIDATING STATEMENTS OF INCOME
Year Ended December 31, 2011(in millions)
Ensco
plc
ENSCOInternationalIncorporated
PrideInternational,
Inc.
Other Non-guarantor
Subsidiariesof Ensco
ConsolidatingAdjustments Total
OPERATING REVENUES $ — $ 70.0 $ — $ 2,869.5 $ (141.8) $ 2,797.7OPERATING EXPENSES Contract drilling (exclusiveof depreciation) 46.9 70.0 — 1,474.0 (141.8) 1,449.1Depreciation .4 1.8 — 406.7 — 408.9General and administrative 52.2 — — 106.4 — 158.6
OPERATING (LOSS) INCOME (99.5) (1.8) — 882.4 — 781.1OTHER INCOME (EXPENSE),NET 32.1 .4 (22.7) (67.7) — (57.9)
(LOSS) INCOME BEFOREINCOME TAXES (67.4) (1.4) (22.7) 814.7 — 723.2INCOME TAX PROVISION — 38.5 1.5 75.4 — 115.4DISCONTINUED OPERATIONS,NET — (11.1) — 8.9 (2.2)EQUITY EARNINGS INAFFILIATES, NET OF TAX 667.8 271.5 143.9 — (1,083.2) —NET INCOME 600.4 220.5 119.7 748.2 (1,083.2) 605.6NET INCOME ATTRIBUTABLETO NONCONTROLLINGINTERESTS — — — (5.2) — (5.2)
NET INCOME ATTRIBUTABLETO ENSCO $ 600.4 $ 220.5 $ 119.7 $ 743.0 $ (1,083.2) $ 600.4
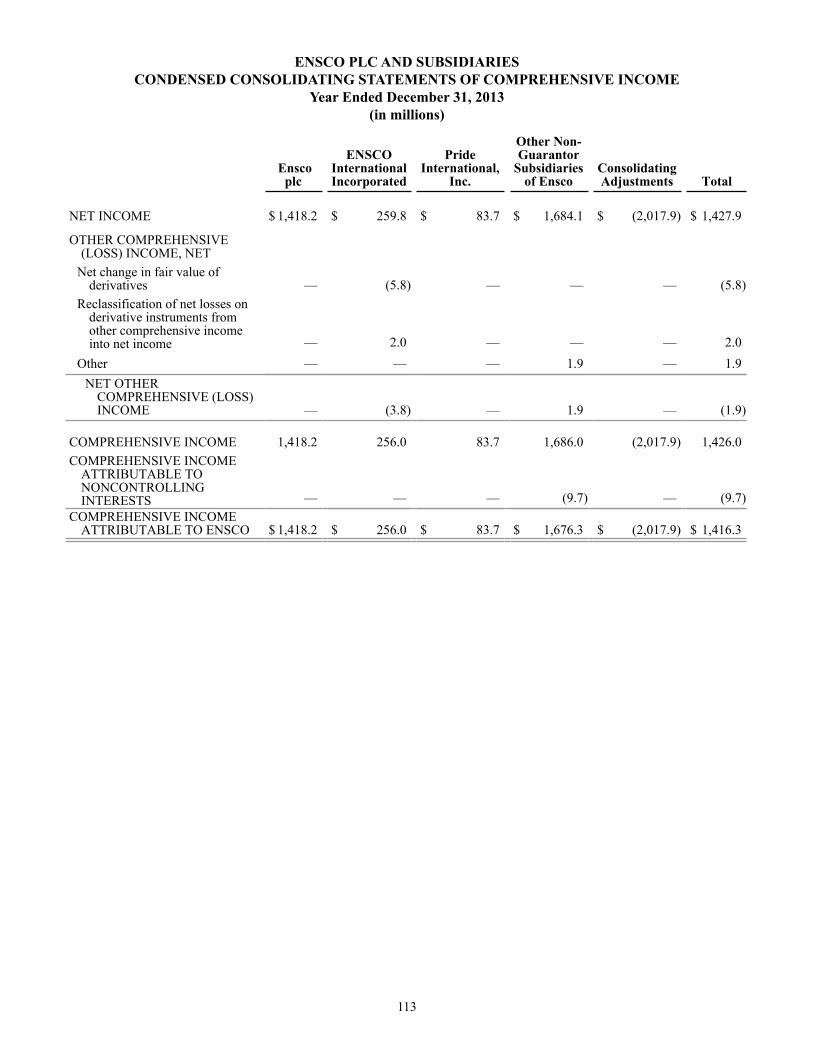
113
ENSCO PLC AND SUBSIDIARIES CONDENSED CONSOLIDATING STATEMENTS OF COMPREHENSIVE INCOME
Year Ended December 31, 2013(in millions)
Enscoplc
ENSCOInternationalIncorporated
PrideInternational,
Inc.
Other Non-Guarantor
Subsidiariesof Ensco
ConsolidatingAdjustments Total
NET INCOME $ 1,418.2 $ 259.8 $ 83.7 $ 1,684.1 $ (2,017.9) $ 1,427.9
OTHER COMPREHENSIVE(LOSS) INCOME, NET
Net change in fair value ofderivatives — (5.8) — — — (5.8)
Reclassification of net losses onderivative instruments fromother comprehensive incomeinto net income — 2.0 — — — 2.0
Other — — — 1.9 — 1.9NET OTHER
COMPREHENSIVE (LOSS)INCOME — (3.8) — 1.9 — (1.9)
COMPREHENSIVE INCOME 1,418.2 256.0 83.7 1,686.0 (2,017.9) 1,426.0COMPREHENSIVE INCOME
ATTRIBUTABLE TONONCONTROLLINGINTERESTS — — — (9.7) — (9.7)
COMPREHENSIVE INCOMEATTRIBUTABLE TO ENSCO $ 1,418.2 $ 256.0 $ 83.7 $ 1,676.3 $ (2,017.9) $ 1,416.3
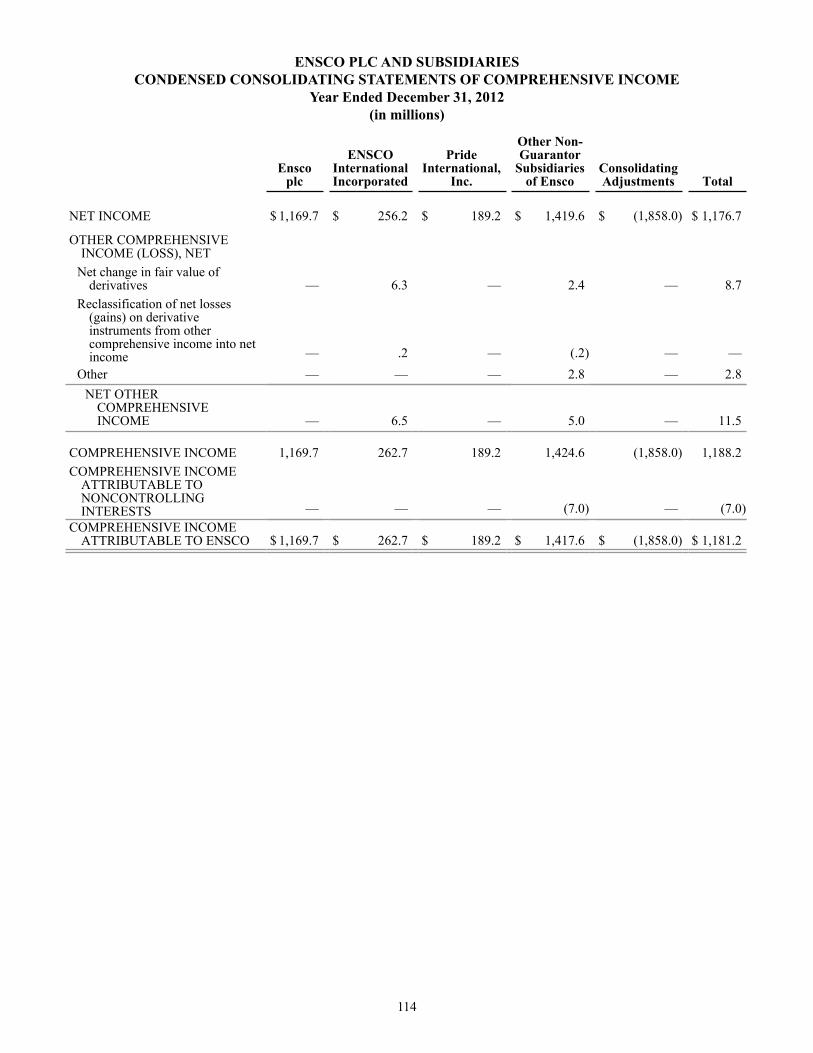
114
ENSCO PLC AND SUBSIDIARIES CONDENSED CONSOLIDATING STATEMENTS OF COMPREHENSIVE INCOME
Year Ended December 31, 2012(in millions)
Ensco
plc
ENSCOInternationalIncorporated
PrideInternational,
Inc.
Other Non-Guarantor
Subsidiariesof Ensco
ConsolidatingAdjustments Total
NET INCOME $ 1,169.7 $ 256.2 $ 189.2 $ 1,419.6 $ (1,858.0) $ 1,176.7
OTHER COMPREHENSIVEINCOME (LOSS), NET
Net change in fair value ofderivatives — 6.3 — 2.4 — 8.7
Reclassification of net losses(gains) on derivativeinstruments from othercomprehensive income into netincome — .2 — (.2) — —
Other — — — 2.8 — 2.8NET OTHER
COMPREHENSIVEINCOME — 6.5 — 5.0 — 11.5
COMPREHENSIVE INCOME 1,169.7 262.7 189.2 1,424.6 (1,858.0) 1,188.2COMPREHENSIVE INCOME
ATTRIBUTABLE TONONCONTROLLINGINTERESTS — — — (7.0) — (7.0)
COMPREHENSIVE INCOMEATTRIBUTABLE TO ENSCO $ 1,169.7 $ 262.7 $ 189.2 $ 1,417.6 $ (1,858.0) $ 1,181.2
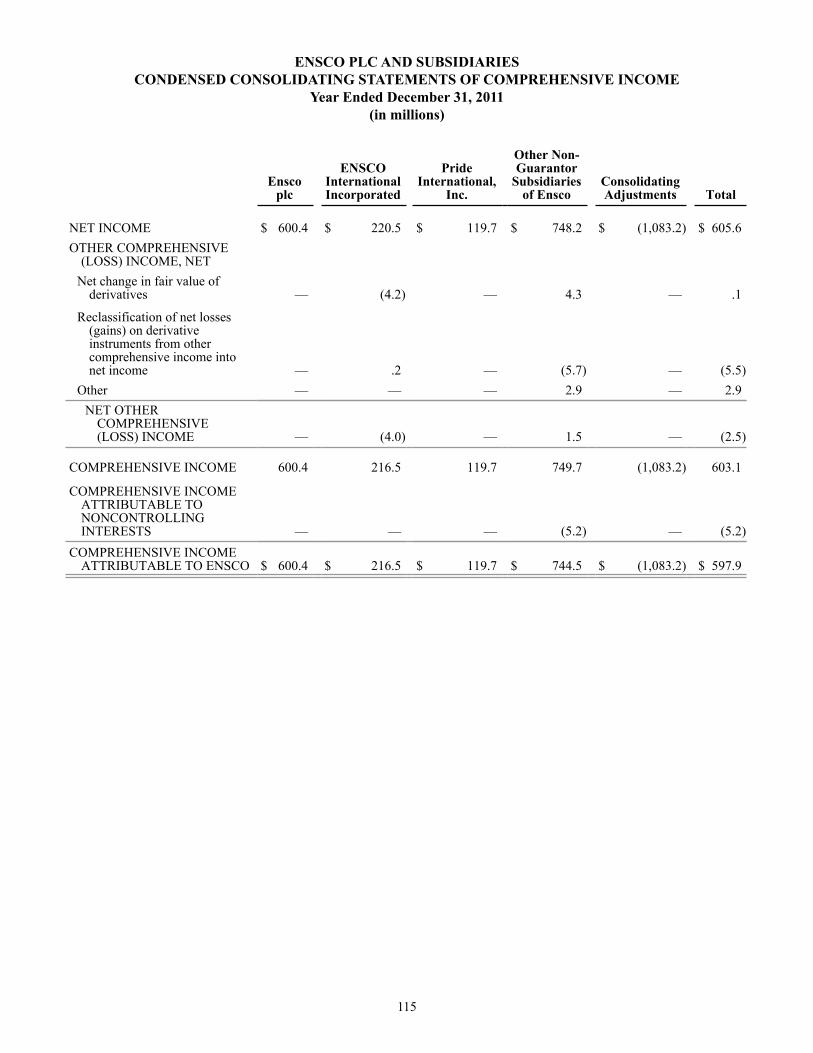
115
ENSCO PLC AND SUBSIDIARIES CONDENSED CONSOLIDATING STATEMENTS OF COMPREHENSIVE INCOME
Year Ended December 31, 2011(in millions)
Ensco
plc
ENSCOInternationalIncorporated
PrideInternational,
Inc.
Other Non-Guarantor
Subsidiariesof Ensco
ConsolidatingAdjustments Total
NET INCOME $ 600.4 $ 220.5 $ 119.7 $ 748.2 $ (1,083.2) $ 605.6OTHER COMPREHENSIVE
(LOSS) INCOME, NETNet change in fair value of
derivatives — (4.2) — 4.3 — .1
Reclassification of net losses(gains) on derivativeinstruments from othercomprehensive income intonet income — .2 — (5.7) — (5.5)
Other — — — 2.9 — 2.9NET OTHER
COMPREHENSIVE(LOSS) INCOME — (4.0) — 1.5 — (2.5)
COMPREHENSIVE INCOME 600.4 216.5 119.7 749.7 (1,083.2) 603.1
COMPREHENSIVE INCOMEATTRIBUTABLE TONONCONTROLLINGINTERESTS — — — (5.2) — (5.2)
COMPREHENSIVE INCOMEATTRIBUTABLE TO ENSCO $ 600.4 $ 216.5 $ 119.7 $ 744.5 $ (1,083.2) $ 597.9

116
ENSCO PLC AND SUBSIDIARIESCONDENSED CONSOLIDATING BALANCE SHEETS
December 31, 2013(in millions)
Ensco plc
ENSCOInternational Incorporated
PrideInternational,
Inc.
OtherNon-
guarantorSubsidiaries
of EnscoConsolidatingAdjustments
Total
ASSETS CURRENT ASSETS Cash and cash equivalents $ 46.5 $ .5 $ 4.9 $ 113.7 $ — $ 165.6Accounts receivable, net — — — 855.7 — 855.7
Accounts receivable from affiliates 1,235.0 213.8 5.5 4,169.2 (5,623.5) —Other 3.2 61.3 — 449.4 — 513.9
Total current assets 1,284.7 275.6 10.4 5,588.0 (5,623.5) 1,535.2
PROPERTY ANDEQUIPMENT, AT COST 2.1 34.3 — 17,462.1 — 17,498.5
Less accumulated depreciation 1.5 26.5 — 3,159.5 — 3,187.5Property and equipment, net .6 7.8 — 14,302.6 — 14,311.0
GOODWILL — — — 3,274.0 — 3,274.0DUE FROM AFFILIATES 4,876.8 4,236.0 1,898.0 5,069.7 (16,080.5) —
INVESTMENTS INAFFILIATES 13,830.1 4,868.6 4,092.2 — (22,790.9) —OTHER ASSETS, NET 8.8 60.1 — 283.8 — 352.7
$ 20,001.0 $ 9,448.1 $ 6,000.6 $ 28,518.1 $ (44,494.9) $ 19,472.9
LIABILITIES AND SHAREHOLDERS' EQUITY CURRENT LIABILITIES Accounts payable and accrued liabilities $ 31.5 $ 9.1 $ 34.2 $ 925.0 $ — $ 999.8
Accounts payable to affiliates 3,666.1 549.7 — 1,407.7 (5,623.5) —
Current maturities of long-term debt — — — 47.5 — 47.5
Total current liabilities 3,697.6 558.8 34.2 2,380.2 (5,623.5) 1,047.3DUE TO AFFILIATES 1,030.8 2,760.4 1,331.1 10,958.2 (16,080.5) —LONG-TERM DEBT 2,473.7 149.1 2,007.8 88.3 — 4,718.9DEFERRED INCOME TAXES — 358.3 — 3.8 — 362.1OTHER LIABILITIES — 2.3 8.7 534.7 — 545.7
ENSCO SHAREHOLDERS'EQUITY 12,798.9 5,619.2 2,618.8 14,545.6 (22,790.9) 12,791.6NONCONTROLLINGINTERESTS — — — 7.3 — 7.3
Total equity 12,798.9 5,619.2 2,618.8 14,552.9 (22,790.9) 12,798.9
$ 20,001.0 $ 9,448.1 $ 6,000.6 $ 28,518.1 $ (44,494.9) $ 19,472.9
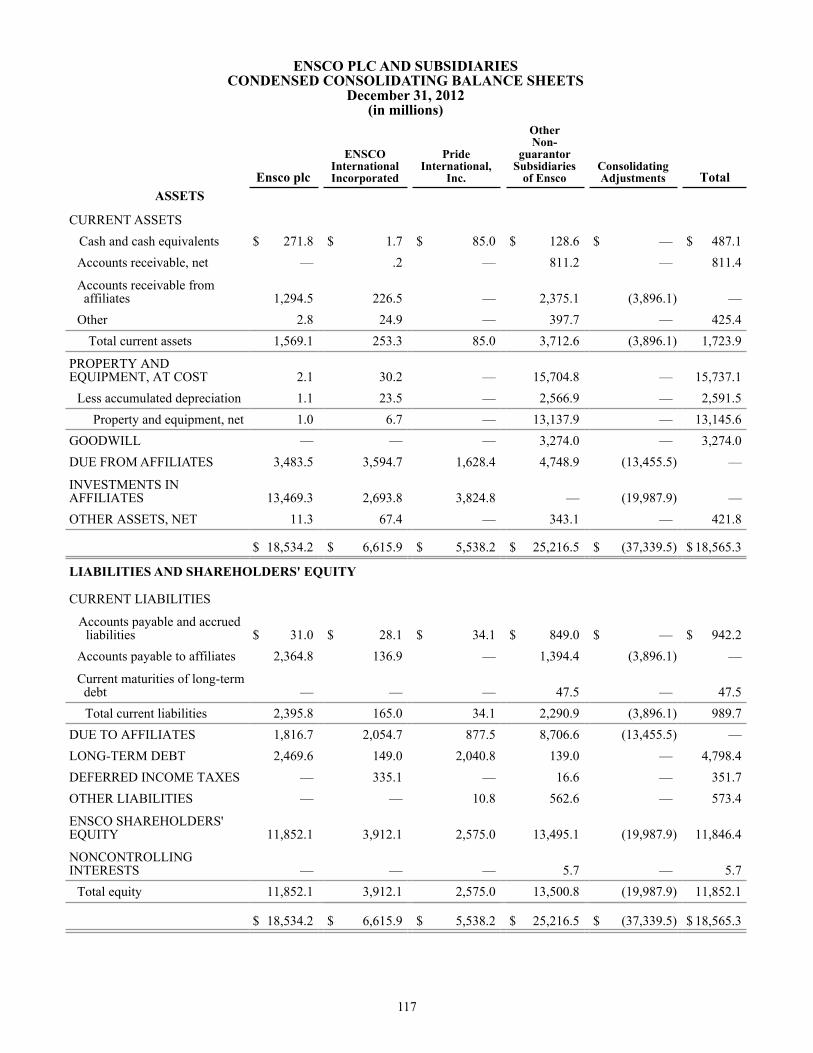
117
ENSCO PLC AND SUBSIDIARIESCONDENSED CONSOLIDATING BALANCE SHEETS
December 31, 2012(in millions)
Ensco plc
ENSCOInternational Incorporated
PrideInternational,
Inc.
OtherNon-
guarantorSubsidiaries
of EnscoConsolidatingAdjustments Total
ASSETS CURRENT ASSETS Cash and cash equivalents $ 271.8 $ 1.7 $ 85.0 $ 128.6 $ — $ 487.1
Accounts receivable, net — .2 — 811.2 — 811.4
Accounts receivable from affiliates 1,294.5 226.5 — 2,375.1 (3,896.1) —Other 2.8 24.9 — 397.7 — 425.4
Total current assets 1,569.1 253.3 85.0 3,712.6 (3,896.1) 1,723.9
PROPERTY ANDEQUIPMENT, AT COST 2.1 30.2 — 15,704.8 — 15,737.1
Less accumulated depreciation 1.1 23.5 — 2,566.9 — 2,591.5Property and equipment, net 1.0 6.7 — 13,137.9 — 13,145.6
GOODWILL — — — 3,274.0 — 3,274.0DUE FROM AFFILIATES 3,483.5 3,594.7 1,628.4 4,748.9 (13,455.5) —
INVESTMENTS INAFFILIATES 13,469.3 2,693.8 3,824.8 — (19,987.9) —OTHER ASSETS, NET 11.3 67.4 — 343.1 — 421.8
$ 18,534.2 $ 6,615.9 $ 5,538.2 $ 25,216.5 $ (37,339.5) $ 18,565.3
LIABILITIES AND SHAREHOLDERS' EQUITY CURRENT LIABILITIES
Accounts payable and accrued liabilities $ 31.0 $ 28.1 $ 34.1 $ 849.0 $ — $ 942.2
Accounts payable to affiliates 2,364.8 136.9 — 1,394.4 (3,896.1) —
Current maturities of long-term debt — — — 47.5 — 47.5
Total current liabilities 2,395.8 165.0 34.1 2,290.9 (3,896.1) 989.7DUE TO AFFILIATES 1,816.7 2,054.7 877.5 8,706.6 (13,455.5) —LONG-TERM DEBT 2,469.6 149.0 2,040.8 139.0 — 4,798.4DEFERRED INCOME TAXES — 335.1 — 16.6 — 351.7OTHER LIABILITIES — — 10.8 562.6 — 573.4
ENSCO SHAREHOLDERS'EQUITY 11,852.1 3,912.1 2,575.0 13,495.1 (19,987.9) 11,846.4
NONCONTROLLINGINTERESTS — — — 5.7 — 5.7
Total equity 11,852.1 3,912.1 2,575.0 13,500.8 (19,987.9) 11,852.1
$ 18,534.2 $ 6,615.9 $ 5,538.2 $ 25,216.5 $ (37,339.5) $ 18,565.3
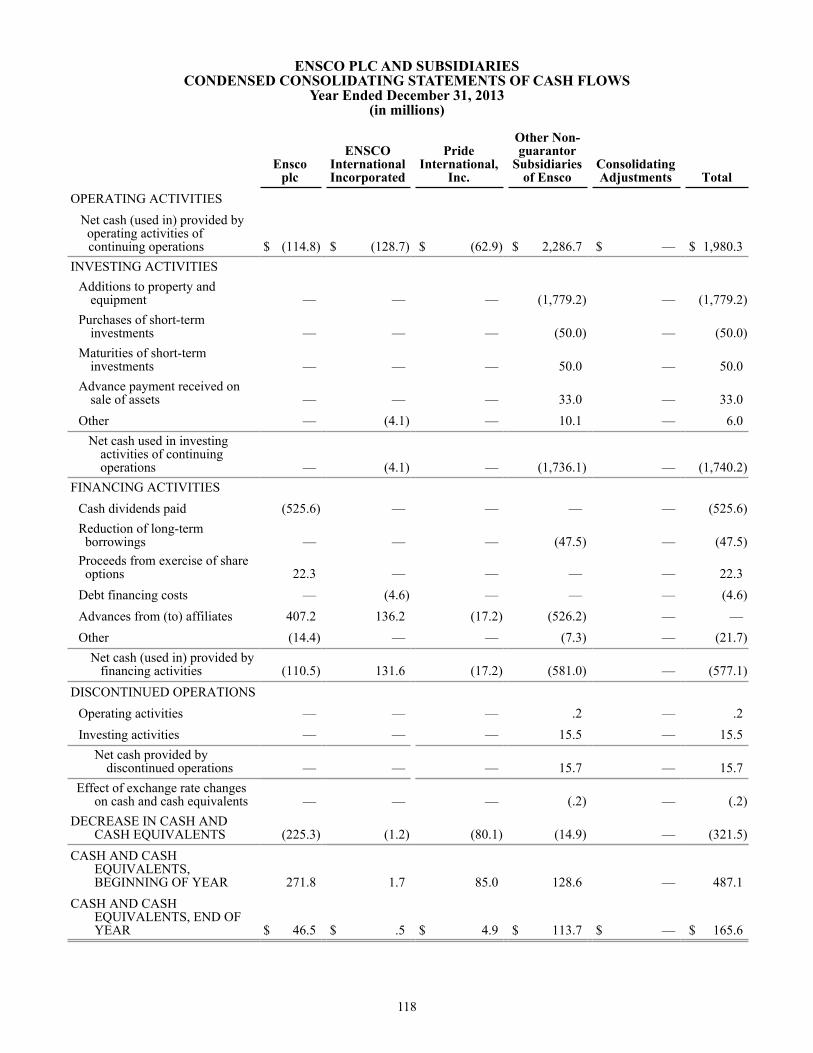
118
ENSCO PLC AND SUBSIDIARIESCONDENSED CONSOLIDATING STATEMENTS OF CASH FLOWS
Year Ended December 31, 2013(in millions)
Ensco
plc
ENSCOInternationalIncorporated
PrideInternational,
Inc.
Other Non-guarantor
Subsidiariesof Ensco
ConsolidatingAdjustments Total
OPERATING ACTIVITIES
Net cash (used in) provided by operating activities of
continuing operations $ (114.8) $ (128.7) $ (62.9) $ 2,286.7 $ — $ 1,980.3INVESTING ACTIVITIES
Additions to property andequipment — — — (1,779.2) — (1,779.2)
Purchases of short-terminvestments — — — (50.0) — (50.0)
Maturities of short-terminvestments — — — 50.0 — 50.0
Advance payment received onsale of assets — — — 33.0 — 33.0
Other — (4.1) — 10.1 — 6.0Net cash used in investing
activities of continuingoperations — (4.1) — (1,736.1) — (1,740.2)
FINANCING ACTIVITIES Cash dividends paid (525.6) — — — — (525.6)Reduction of long-term borrowings — — — (47.5) — (47.5)Proceeds from exercise of share options 22.3 — — — — 22.3Debt financing costs — (4.6) — — — (4.6)Advances from (to) affiliates 407.2 136.2 (17.2) (526.2) — —Other (14.4) — — (7.3) — (21.7)
Net cash (used in) provided by financing activities (110.5) 131.6 (17.2) (581.0) — (577.1)DISCONTINUED OPERATIONS
Operating activities — — — .2 — .2Investing activities — — — 15.5 — 15.5
Net cash provided bydiscontinued operations — — — 15.7 — 15.7
Effect of exchange rate changeson cash and cash equivalents — — — (.2) — (.2)
DECREASE IN CASH ANDCASH EQUIVALENTS (225.3) (1.2) (80.1) (14.9) — (321.5)
CASH AND CASHEQUIVALENTS,BEGINNING OF YEAR 271.8 1.7 85.0 128.6 — 487.1
CASH AND CASHEQUIVALENTS, END OFYEAR $ 46.5 $ .5 $ 4.9 $ 113.7 $ — $ 165.6
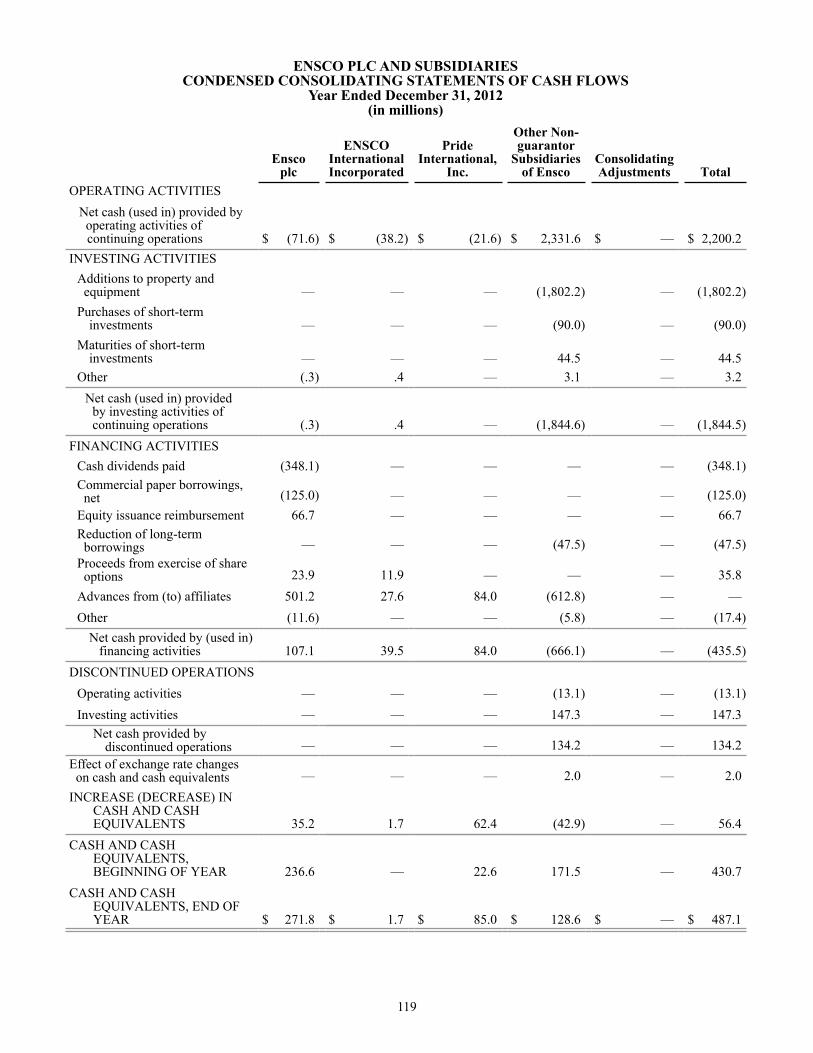
119
ENSCO PLC AND SUBSIDIARIESCONDENSED CONSOLIDATING STATEMENTS OF CASH FLOWS
Year Ended December 31, 2012(in millions)
Ensco
plc
ENSCOInternationalIncorporated
PrideInternational,
Inc.
Other Non-guarantor
Subsidiariesof Ensco
ConsolidatingAdjustments Total
OPERATING ACTIVITIES Net cash (used in) provided by operating activities of
continuing operations $ (71.6) $ (38.2) $ (21.6) $ 2,331.6 $ — $ 2,200.2INVESTING ACTIVITIES
Additions to property and equipment — — — (1,802.2) — (1,802.2)Purchases of short-term
investments — — — (90.0) — (90.0)Maturities of short-term
investments — — — 44.5 — 44.5Other (.3) .4 — 3.1 — 3.2 Net cash (used in) provided
by investing activities of continuing operations (.3) .4 — (1,844.6) — (1,844.5)FINANCING ACTIVITIES
Cash dividends paid (348.1) — — — — (348.1)Commercial paper borrowings, net (125.0) — — — — (125.0)Equity issuance reimbursement 66.7 — — — — 66.7Reduction of long-term borrowings — — — (47.5) — (47.5)Proceeds from exercise of share options 23.9 11.9 — — — 35.8Advances from (to) affiliates 501.2 27.6 84.0 (612.8) — —Other (11.6) — — (5.8) — (17.4)
Net cash provided by (used in) financing activities 107.1 39.5 84.0 (666.1) — (435.5)DISCONTINUED OPERATIONS
Operating activities — — — (13.1) — (13.1)Investing activities — — — 147.3 — 147.3
Net cash provided bydiscontinued operations — — — 134.2 — 134.2
Effect of exchange rate changes on cash and cash equivalents — — — 2.0 — 2.0INCREASE (DECREASE) IN
CASH AND CASHEQUIVALENTS 35.2 1.7 62.4 (42.9) — 56.4
CASH AND CASHEQUIVALENTS,BEGINNING OF YEAR 236.6 — 22.6 171.5 — 430.7
CASH AND CASHEQUIVALENTS, END OFYEAR $ 271.8 $ 1.7 $ 85.0 $ 128.6 $ — $ 487.1
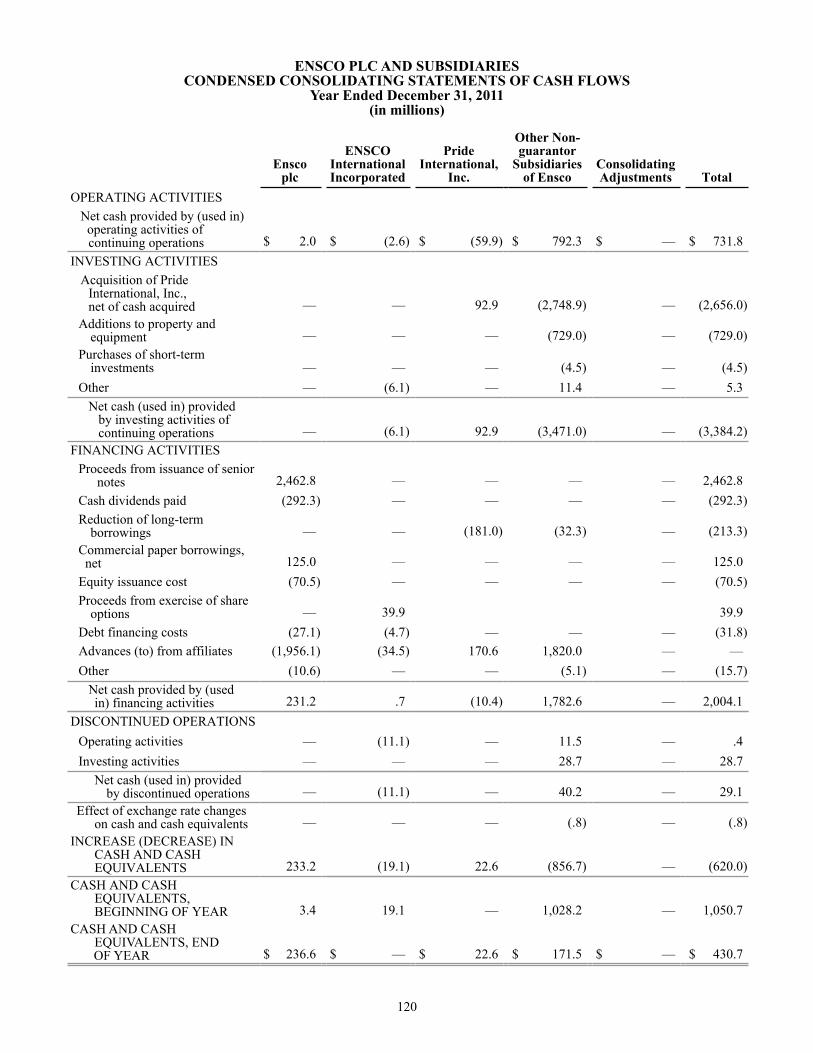
120
ENSCO PLC AND SUBSIDIARIESCONDENSED CONSOLIDATING STATEMENTS OF CASH FLOWS
Year Ended December 31, 2011(in millions)
Ensco
plc
ENSCOInternationalIncorporated
PrideInternational,
Inc.
Other Non-guarantor
Subsidiariesof Ensco
ConsolidatingAdjustments Total
OPERATING ACTIVITIES Net cash provided by (used in) operating activities of
continuing operations $ 2.0 $ (2.6) $ (59.9) $ 792.3 $ — $ 731.8INVESTING ACTIVITIES Acquisition of Pride
International, Inc.,net of cash acquired — — 92.9 (2,748.9) — (2,656.0)
Additions to property andequipment — — — (729.0) — (729.0)
Purchases of short-terminvestments — — — (4.5) — (4.5)
Other — (6.1) — 11.4 — 5.3 Net cash (used in) provided by investing activities of continuing operations — (6.1) 92.9 (3,471.0) — (3,384.2)
FINANCING ACTIVITIES Proceeds from issuance of senior
notes 2,462.8 — — — — 2,462.8Cash dividends paid (292.3) — — — — (292.3)Reduction of long-term
borrowings — — (181.0) (32.3) — (213.3)Commercial paper borrowings, net 125.0 — — — — 125.0Equity issuance cost (70.5) — — — — (70.5)Proceeds from exercise of share
options — 39.9 39.9Debt financing costs (27.1) (4.7) — — — (31.8)Advances (to) from affiliates (1,956.1) (34.5) 170.6 1,820.0 — —Other (10.6) — — (5.1) — (15.7)
Net cash provided by (usedin) financing activities 231.2 .7 (10.4) 1,782.6 — 2,004.1
DISCONTINUED OPERATIONSOperating activities — (11.1) — 11.5 — .4Investing activities — — — 28.7 — 28.7
Net cash (used in) providedby discontinued operations — (11.1) — 40.2 — 29.1
Effect of exchange rate changeson cash and cash equivalents — — — (.8) — (.8)
INCREASE (DECREASE) INCASH AND CASHEQUIVALENTS 233.2 (19.1) 22.6 (856.7) — (620.0)
CASH AND CASHEQUIVALENTS,BEGINNING OF YEAR 3.4 19.1 — 1,028.2 — 1,050.7
CASH AND CASH EQUIVALENTS, END
OF YEAR $ 236.6 $ — $ 22.6 $ 171.5 $ — $ 430.7
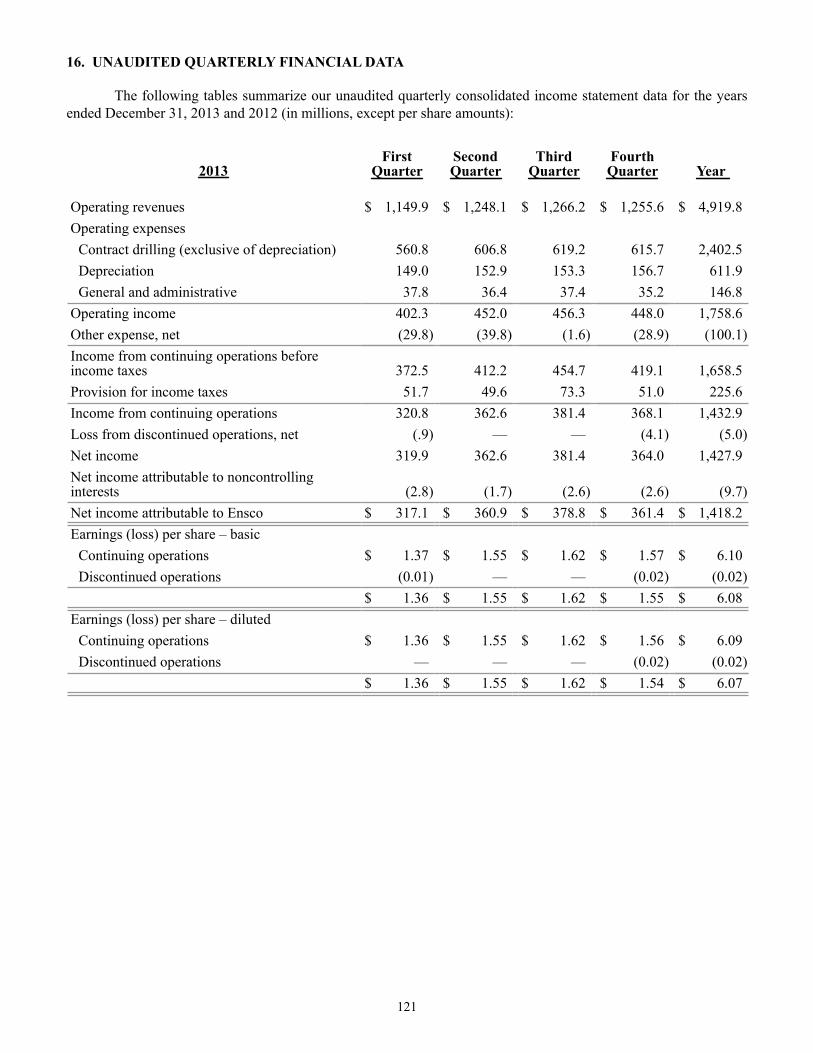
121
16. UNAUDITED QUARTERLY FINANCIAL DATA
The following tables summarize our unaudited quarterly consolidated income statement data for the years ended December 31, 2013 and 2012 (in millions, except per share amounts):
2013First
Quarter
SecondQuarter
ThirdQuarter
Fourth Quarter
Year
Operating revenues $ 1,149.9 $ 1,248.1 $ 1,266.2 $ 1,255.6 $ 4,919.8Operating expenses
Contract drilling (exclusive of depreciation) 560.8 606.8 619.2 615.7 2,402.5Depreciation 149.0 152.9 153.3 156.7 611.9General and administrative 37.8 36.4 37.4 35.2 146.8
Operating income 402.3 452.0 456.3 448.0 1,758.6Other expense, net (29.8) (39.8) (1.6) (28.9) (100.1)Income from continuing operations beforeincome taxes 372.5 412.2 454.7 419.1 1,658.5Provision for income taxes 51.7 49.6 73.3 51.0 225.6Income from continuing operations 320.8 362.6 381.4 368.1 1,432.9Loss from discontinued operations, net (.9) — — (4.1) (5.0)Net income 319.9 362.6 381.4 364.0 1,427.9Net income attributable to noncontrollinginterests (2.8) (1.7) (2.6) (2.6) (9.7)Net income attributable to Ensco $ 317.1 $ 360.9 $ 378.8 $ 361.4 $ 1,418.2Earnings (loss) per share – basic
Continuing operations $ 1.37 $ 1.55 $ 1.62 $ 1.57 $ 6.10Discontinued operations (0.01) — — (0.02) (0.02)
$ 1.36 $ 1.55 $ 1.62 $ 1.55 $ 6.08Earnings (loss) per share – diluted
Continuing operations $ 1.36 $ 1.55 $ 1.62 $ 1.56 $ 6.09Discontinued operations — — — (0.02) (0.02)
$ 1.36 $ 1.55 $ 1.62 $ 1.54 $ 6.07
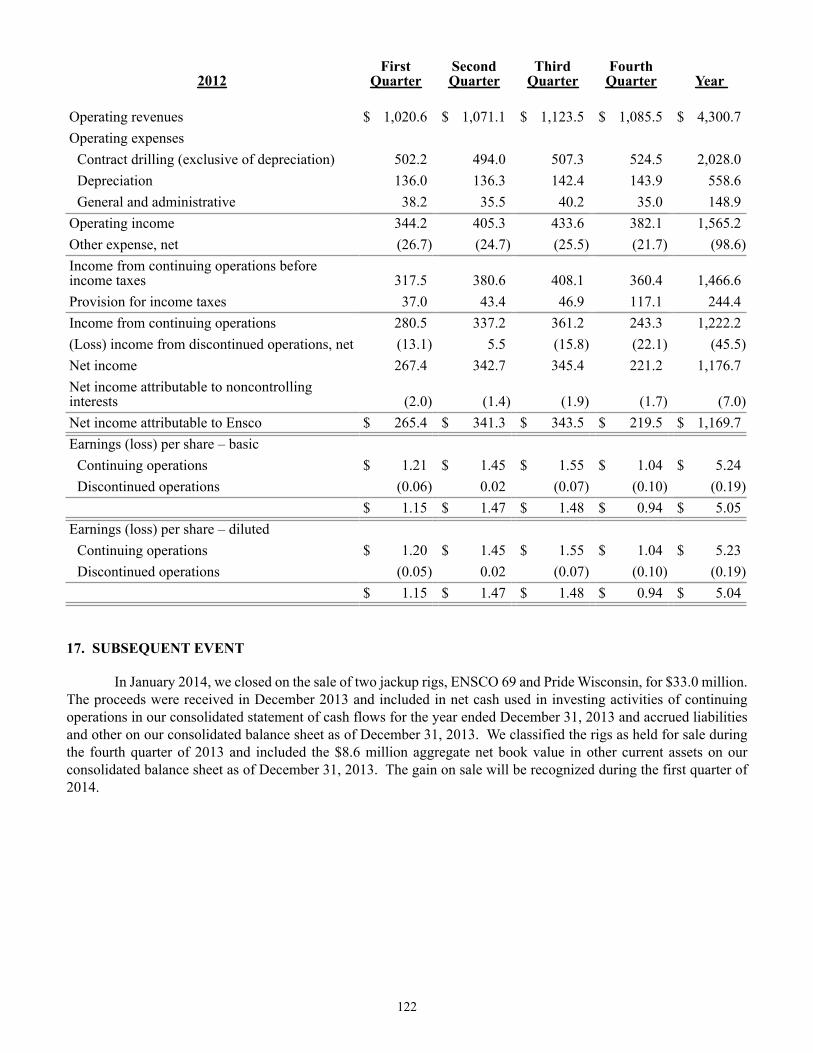
122
2012First
Quarter
SecondQuarter
ThirdQuarter
Fourth Quarter
Year
Operating revenues $ 1,020.6 $ 1,071.1 $ 1,123.5 $ 1,085.5 $ 4,300.7Operating expenses
Contract drilling (exclusive of depreciation) 502.2 494.0 507.3 524.5 2,028.0Depreciation 136.0 136.3 142.4 143.9 558.6General and administrative 38.2 35.5 40.2 35.0 148.9
Operating income 344.2 405.3 433.6 382.1 1,565.2Other expense, net (26.7) (24.7) (25.5) (21.7) (98.6)Income from continuing operations beforeincome taxes 317.5 380.6 408.1 360.4 1,466.6Provision for income taxes 37.0 43.4 46.9 117.1 244.4Income from continuing operations 280.5 337.2 361.2 243.3 1,222.2(Loss) income from discontinued operations, net (13.1) 5.5 (15.8) (22.1) (45.5)Net income 267.4 342.7 345.4 221.2 1,176.7Net income attributable to noncontrollinginterests (2.0) (1.4) (1.9) (1.7) (7.0)Net income attributable to Ensco $ 265.4 $ 341.3 $ 343.5 $ 219.5 $ 1,169.7Earnings (loss) per share – basic
Continuing operations $ 1.21 $ 1.45 $ 1.55 $ 1.04 $ 5.24Discontinued operations (0.06) 0.02 (0.07) (0.10) (0.19)
$ 1.15 $ 1.47 $ 1.48 $ 0.94 $ 5.05Earnings (loss) per share – diluted
Continuing operations $ 1.20 $ 1.45 $ 1.55 $ 1.04 $ 5.23Discontinued operations (0.05) 0.02 (0.07) (0.10) (0.19)
$ 1.15 $ 1.47 $ 1.48 $ 0.94 $ 5.04
17. SUBSEQUENT EVENT
In January 2014, we closed on the sale of two jackup rigs, ENSCO 69 and Pride Wisconsin, for $33.0 million. The proceeds were received in December 2013 and included in net cash used in investing activities of continuing operations in our consolidated statement of cash flows for the year ended December 31, 2013 and accrued liabilities and other on our consolidated balance sheet as of December 31, 2013. We classified the rigs as held for sale during the fourth quarter of 2013 and included the $8.6 million aggregate net book value in other current assets on our consolidated balance sheet as of December 31, 2013. The gain on sale will be recognized during the first quarter of 2014.
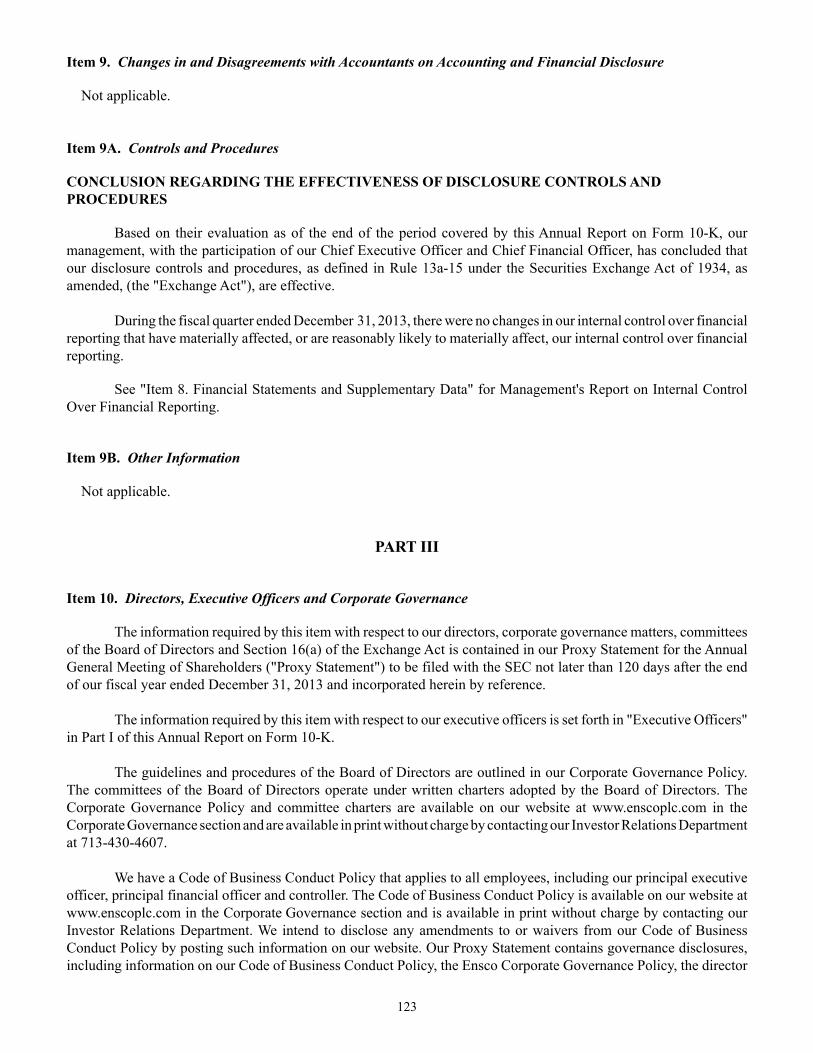
123
Item 9. Changes in and Disagreements with Accountants on Accounting and Financial Disclosure
Not applicable.
Item 9A. Controls and Procedures
CONCLUSION REGARDING THE EFFECTIVENESS OF DISCLOSURE CONTROLS AND PROCEDURES
Based on their evaluation as of the end of the period covered by this Annual Report on Form 10-K, our management, with the participation of our Chief Executive Officer and Chief Financial Officer, has concluded that our disclosure controls and procedures, as defined in Rule 13a-15 under the Securities Exchange Act of 1934, as amended, (the "Exchange Act"), are effective. During the fiscal quarter ended December 31, 2013, there were no changes in our internal control over financial reporting that have materially affected, or are reasonably likely to materially affect, our internal control over financial reporting.
See "Item 8. Financial Statements and Supplementary Data" for Management's Report on Internal Control Over Financial Reporting.
Item 9B. Other Information
Not applicable.
PART III
Item 10. Directors, Executive Officers and Corporate Governance
The information required by this item with respect to our directors, corporate governance matters, committees of the Board of Directors and Section 16(a) of the Exchange Act is contained in our Proxy Statement for the Annual General Meeting of Shareholders ("Proxy Statement") to be filed with the SEC not later than 120 days after the end of our fiscal year ended December 31, 2013 and incorporated herein by reference.
The information required by this item with respect to our executive officers is set forth in "Executive Officers" in Part I of this Annual Report on Form 10-K.
The guidelines and procedures of the Board of Directors are outlined in our Corporate Governance Policy. The committees of the Board of Directors operate under written charters adopted by the Board of Directors. The Corporate Governance Policy and committee charters are available on our website at www.enscoplc.com in the Corporate Governance section and are available in print without charge by contacting our Investor Relations Department at 713-430-4607.
We have a Code of Business Conduct Policy that applies to all employees, including our principal executive officer, principal financial officer and controller. The Code of Business Conduct Policy is available on our website at www.enscoplc.com in the Corporate Governance section and is available in print without charge by contacting our Investor Relations Department. We intend to disclose any amendments to or waivers from our Code of Business Conduct Policy by posting such information on our website. Our Proxy Statement contains governance disclosures, including information on our Code of Business Conduct Policy, the Ensco Corporate Governance Policy, the director
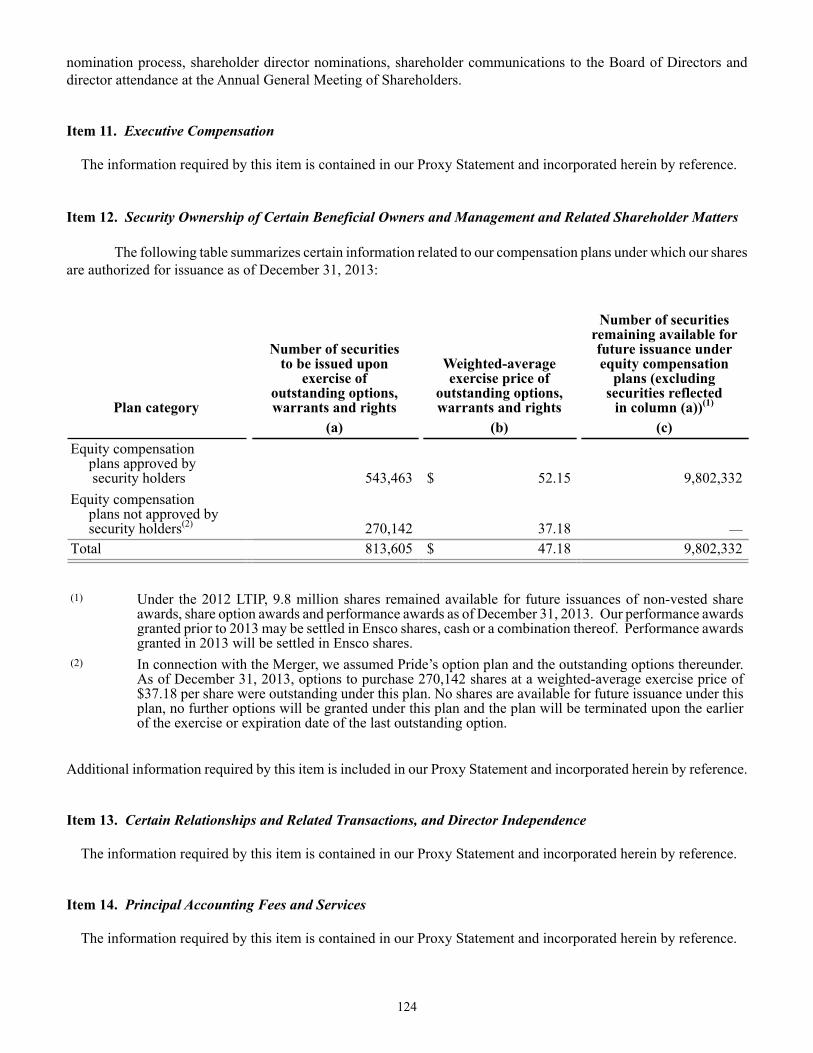
124
nomination process, shareholder director nominations, shareholder communications to the Board of Directors and director attendance at the Annual General Meeting of Shareholders.
Item 11. Executive Compensation
The information required by this item is contained in our Proxy Statement and incorporated herein by reference.
Item 12. Security Ownership of Certain Beneficial Owners and Management and Related Shareholder Matters
The following table summarizes certain information related to our compensation plans under which our shares are authorized for issuance as of December 31, 2013:
Plan category
Number of securitiesto be issued upon
exercise ofoutstanding options,warrants and rights
Weighted-averageexercise price of
outstanding options,warrants and rights
Number of securitiesremaining available forfuture issuance underequity compensation
plans (excludingsecurities reflected
in column (a))(1)
(a) (b) (c)Equity compensation plans approved by security holders 543,463 $ 52.15 9,802,332Equity compensation plans not approved by security holders(2) 270,142 37.18 —Total 813,605 $ 47.18 9,802,332
(1) Under the 2012 LTIP, 9.8 million shares remained available for future issuances of non-vested share awards, share option awards and performance awards as of December 31, 2013. Our performance awards granted prior to 2013 may be settled in Ensco shares, cash or a combination thereof. Performance awards granted in 2013 will be settled in Ensco shares.
(2) In connection with the Merger, we assumed Pride’s option plan and the outstanding options thereunder. As of December 31, 2013, options to purchase 270,142 shares at a weighted-average exercise price of $37.18 per share were outstanding under this plan. No shares are available for future issuance under this plan, no further options will be granted under this plan and the plan will be terminated upon the earlier of the exercise or expiration date of the last outstanding option.
Additional information required by this item is included in our Proxy Statement and incorporated herein by reference.
Item 13. Certain Relationships and Related Transactions, and Director Independence
The information required by this item is contained in our Proxy Statement and incorporated herein by reference.
Item 14. Principal Accounting Fees and Services
The information required by this item is contained in our Proxy Statement and incorporated herein by reference.
125
PART IV
Item 15. Exhibits, Financial Statement Schedules
(a) The following documents are filed as part of this report:
1. Financial Statements
Reports of Independent Registered Public Accounting Firm 71
Consolidated Statements of Income 73
Consolidated Statements of Comprehensive Income 74
Consolidated Balance Sheets 75
Consolidated Statements of Cash Flows 76
Notes to Consolidated Financial Statements 77
2. Financial Statement Schedules:
The schedules for which provision is made in the applicable accounting regulations of the SEC are not required under the related instructions or are inapplicable or provided elsewhere in the financial statements and, therefore, have been omitted.
3. Exhibits
Exhibit Number
Exhibit
2.1 Agreement and Plan of Merger and Reorganization, dated November 9, 2009, between ENSCOInternational Incorporated and ENSCO Newcastle LLC (incorporated by reference to Annex A tothe Registration Statement of ENSCO International Limited on Form S-4 filed on November 9,2009, File No. 333-162975).
2.2 Agreement and Plan of Merger, dated February 6, 2011, among Ensco plc, ENSCO Ventures LLC,ENSCO International Incorporated and Pride International, Inc. (incorporated by reference to Exhibit2.1 to the Registrant's Current Report on Form 8-K filed on February 7, 2011, File No. 1-8097).
2.3 Amendment No. 1 to Agreement and Plan of Merger, dated March 1, 2011, by and among Ensco plc,Pride International, Inc., ENSCO Ventures LLC and ENSCO International Incorporated(incorporated by reference to Exhibit 2.2 to the Registrant's Registration Statement on Form S-4 filedon March 3, 2011, File No. 333-172587).
2.4 Amendment No. 2 to Agreement and Plan of Merger, dated May 23, 2011, by and among Ensco plc,Pride International, Inc., ENSCO International Incorporated and ENSCO Ventures LLC(incorporated by reference to Exhibit 2.1 to the Registrant's Current Report on Form 8-K filed onMay 24, 2011, File No.1-8097).
3.1 Form of Articles of Association of Ensco International plc (incorporated by reference to Exhibit 99.1to the Registrant's Current Report on Form 8-K filed on December 16, 2009, File No. 1-8097).
3.2 Certificate of Incorporation on Change of Name (incorporated by reference to Exhibit 3.1 to theRegistrant's Current Report on Form 8-K filed on April 1, 2010, File No. 1-8097).
3.3 New Articles of Association of Ensco plc (incorporated by reference to Annex 2 to the Registrant'sProxy Statement on Form DEF 14A filed on April 5, 2013, as adopted by Special Resolution passedon May 20, 2013, File No. 1-8097).
4.1 Indenture, dated November 20, 1997, between ENSCO International Incorporated and Bankers TrustCompany, as Trustee (incorporated by reference to Exhibit 4.1 to the Registrant's Current Report onForm 8-K filed on November 24, 1997, File No. 1-8097).
126
4.2 First Supplemental Indenture, dated November 20, 1997, between ENSCO InternationalIncorporated and Bankers Trust Company, as Trustee, supplementing the Indenture, dated November20, 1997 (incorporated by reference to Exhibit 4.2 to the Registrant's Current Report on Form 8-Kfiled on November 24, 1997, File No. 1-8097).
4.3 Second Supplemental Indenture, dated December 22, 2009, among ENSCO InternationalIncorporated, Ensco International plc and Deutsche Bank Trust Company Americas, as Trustee(incorporated by reference to Exhibit 4.1 to the Registrant's Current Report on Form 8-K filed onDecember 23, 2009, File No. 1-8097).
4.4 Form of Debenture (incorporated by reference to Exhibit 4.4 to the Registrant's Current Report onForm 8-K filed on November 24, 1997, File No. 1-8097).
4.5 Indenture, dated July 1, 2004, between Pride International, Inc. and The Bank of New York Mellon,as Trustee, including the form of notes issued pursuant thereto (successor to JPMorgan Chase Bank)(incorporated by reference to Exhibit 4.1 to Pride's Registration Statement on Form S-4 filed onAugust 10, 2004, File No. 333-118104).
4.6 First Supplemental Indenture, dated July 7, 2004, between Pride International, Inc. and JPMorganChase Bank, as Trustee, including the form of note (incorporated by reference to Exhibit 4.2 toPride's Registration Statement on Form S-4 filed on August 10, 2004, File No. 333-118104).
4.7 Second Supplemental Indenture, dated June 2, 2009, between Pride International, Inc. and The Bankof New York Mellon, as Trustee, including the form of notes issued pursuant thereto (incorporated byreference to Exhibit 4.1 to Pride's Quarterly Report on Form 10-Q for the quarter ended June30, 2009, File No. 1-13289).
4.8 Third Supplemental Indenture, dated August 6, 2010, between Pride International, Inc. and The Bankof New York Mellon, as Trustee, including the form of notes issued pursuant thereto (incorporated byreference to Exhibit 4.3 to Pride's Quarterly Report on Form 10-Q for the quarter ended September30, 2010, File No. 1-13289).
4.9 Fourth Supplemental Indenture, dated May 31, 2011, among Ensco plc, Pride International, Inc. andThe Bank of New York Mellon, as Trustee (incorporated by reference to Exhibit 4.4 to theRegistrant's Current Report on Form 8-K filed on May 31, 2011, File No. 1-8097).
4.10 Form of Guarantee by Ensco plc (incorporated by reference to Exhibit 4.4 to the Registrant's CurrentReport on Form 8-K filed on May 31, 2011, File No. 1-8097).
4.11 Indenture, dated March 17, 2011, between Ensco plc and Deutsche Bank Trust Company Americas,as Trustee (incorporated by reference to Exhibit 4.22 to Post-Effective Amendment No. 2 to theRegistrant's Registration Statement on Form S-3 filed on March 17, 2011, File No. 333-156705).
4.12 First Supplemental Indenture, dated March 17, 2011, between Ensco plc and Deutsche Bank TrustCompany Americas, as Trustee (incorporated by reference to Exhibit 4.23 to Post-EffectiveAmendment No. 2 to the Registrant's Registration Statement on Form S-3 filed on March 17, 2011,File No. 333-156705).
4.13 Form of Global Note for 3.250% Senior Notes due 2016 (incorporated by reference to Exhibit A ofExhibit 4.23 to Post-Effective Amendment No. 2 to the Registrant's Registration Statement onForm S-3 filed on March 17, 2011, File No. 333-156705).
4.14 Form of Global Note for 4.700% Senior Notes due 2021 (incorporated by reference to Exhibit B ofExhibit 4.23 to Post-Effective Amendment No. 2 to the Registrant's Registration Statement onForm S-3 filed on March 17, 2011, File No. 333-156705).
4.15 Form of Deed of Release of Shareholders (incorporated by reference to Annex A to the Registrant'sProxy Statement on Schedule 14A filed on April 5, 2011, File No. 1-8097).
10.1 Fourth Amended and Restated Credit Agreement, dated May 7, 2013, among Ensco plc, and PrideInternational, Inc., as Borrowers, the Banks named therein, Citibank, N.A., as Administrative Agent,DNB Bank ASA, as Syndication Agent, Deutsche Bank Securities Inc., HSBC Bank USA, NA andWells Fargo Bank, National Association, as Co-Documentation Agents, and Citigroup GlobalMarkets Inc., DNB Markets, Inc., Deutsche Bank Securities Inc., HSBC Securities (USA) Inc. andWells Fargo Securities, LLC, as Joint Lead Arrangers and Joint Book Managers (incorporated byreference to Exhibit 10.1 to the Registrant's Current Report on Form 8-K filed on May 13, 2013, FileNo. 1-8097).
+10.2 Pride International, Inc. 1998 Long-Term Incentive Plan (As Amended and Restated EffectiveFebruary 17, 2005) (incorporated by reference to Exhibit 10.21 to Pride's Annual Report on Form 10-K for the year ended December 31, 2004, File No. 1-13289).
127
+10.3 Amendment to Pride International, Inc. 1998 Long-Term Incentive Plan (As Amended and RestatedEffective February 17, 2005) (incorporated by reference to Exhibit 4.37 to the Registrant'sRegistration Statement on Form S-8 filed on May 31, 2011, File No. 333-174611).
+10.4 2012 Amendment to the Pride International, Inc. 1998 Long-Term Incentive Plan (As Amended andRestated Effective February 17, 2005 and As Assumed by Ensco plc as of May 31, 2011), effectiveMay 14, 2012 (incorporated by reference to Exhibit 10.4 to the Registrant's Current Report on Form8-K filed on May 15, 2012, File No. 1-8097).
+10.5 Pride International, Inc. 2004 Directors' Stock Incentive Plan (As Amended and Restated EffectiveMarch 26, 2008) (incorporated by reference to Appendix B to Pride's Proxy Statement on Schedule14A filed on April 9, 2008, File No. 1-13289).
+10.6 First Amendment to the Pride International, Inc. 2004 Directors' Stock Incentive Plan (As Amendedand Restated March 26, 2008), effective August 14, 2008 (incorporated by reference to Exhibit 10.2to Pride's Quarterly Report on Form 10-Q for the quarter ended September 30, 2008, FileNo. 1-13289).
+10.7 Amendment to the Pride International, Inc. 2004 Directors' Stock Incentive Plan (As Amended andRestated Effective March 26, 2008), effective May 31, 2011 (incorporated by reference to Exhibit4.36 to the Registrant's Registration Statement on Form S-8 filed on May 31, 2011, File No.333-174611).
+10.8 2012 Amendment to the Pride International, Inc. 2004 Directors' Stock Incentive Plan (As Amendedand Restated Effective March 26, 2008 and As Assumed by Ensco plc as of May 31, 2011), effectiveMay 14, 2012 (incorporated by reference to Exhibit 10.5 to the Registrant's Current Report on Form8-K filed on May 15, 2012, File No. 1-8097).
+10.9 Pride International, Inc. 2007 Long-Term Incentive Plan (As Amended and Restated Effective March24, 2010) (incorporated by reference to Appendix A to Pride's Proxy Statement on Schedule 14Afiled on April 1, 2010, File No. 1-13289).
+10.10 First Amendment to Pride International, Inc. 2007 Long-Term Incentive Plan (As Amended andRestated Effective March 16, 2010), effective August 13, 2010 (incorporated by reference toExhibit 10.1 to Pride's Quarterly Report on Form 10-Q for the quarter ended September 30, 2010,File No. 1-13289).
+10.11 Amendment to the Pride International, Inc. 2007 Long-Term Incentive Plan (As Amended andRestated Effective March 16, 2010), effective May 31, 2011 (incorporated by reference to Exhibit4.35 to the Registrant's Registration Statement on Form S-8 filed on May 31, 2011, File No.333-174611).
+10.12 2012 Amendment to the Pride International, Inc. 2007 Long-Term Incentive Plan (As Amended andRestated Effective March 16, 2010 and As Assumed by Ensco plc as of May 31, 2011), effectiveMay 14, 2012 (incorporated by reference to Exhibit 10.6 to the Registrant's Current Report on Form8-K filed on May 15, 2012, File No. 1-8097).
+10.13 Deed of Assumption by Ensco plc relating to Equity Incentive Plans of Pride International, Inc.,dated May 26, 2011 (incorporated by reference to Exhibit 4.34 to the Registrant's RegistrationStatement on Form S-8 filed on May 31, 2011, File No. 333-174611).
+10.14 Form of Deed of Release of Directors (incorporated by reference to Annex B to the Registrant'sProxy Statement on Schedule 14A filed on April 5, 2011, File No. 1-8097).
+10.15 Form of Deed of Indemnity for Directors and Executive Officers of Ensco plc (incorporated byreference to Exhibit 10.27 to the Registrant's Quarterly Report on Form 10-Q for the quarter endedJune 30, 2011, File No. 1-8097).
+10.16 ENSCO International Incorporated 1998 Incentive Plan (incorporated by reference to Exhibit 4.1 tothe Registrant's Form S-8 filed on July 7, 1998, File No. 333-58625).
+10.17 Amendment to the ENSCO International Incorporated 1998 Incentive Plan, dated January 1, 2003(incorporated by reference to Exhibit 10.19 to the Registrant's Annual Report on Form 10-K for theyear ended December 31, 2002, File No. 1-8097).
+10.18 Amendment to the ENSCO International Incorporated 1998 Incentive Plan, dated November 9, 2005(incorporated by reference to Exhibit 10.29 to the Registrant's Annual Report on Form 10-K for theyear ended December 31, 2005, File No. 1-8097).
128
+10.19 Amendment to the ENSCO International Incorporated 1998 Incentive Plan, dated May 31, 2006(incorporated by reference to Exhibit 10.4 to the Registrant's Quarterly Report on Form 10-Q for thequarter ended June 30, 2006, File No. 1-8097).
+10.20 Amendment to the ENSCO International Incorporated 1998 Incentive Plan, dated December 22,2009 (incorporated by reference to Exhibit 10.4 to the Registrant's Current Report on Form 8-K filedon December 23, 2009, File No. 1-8097).
+10.21 Amendment to the ENSCO International Incorporated 1998 Incentive Plan, dated August 23, 2011(incorporated by reference to Exhibit 10.1 to the Registrant's Quarterly Report on Form 10-Q for thequarter ended September 30, 2011, File No. 1-8097).
+10.22 2012 Amendment to the ENSCO International Incorporated 1998 Incentive Plan (As Amended onAugust 23, 2011, and As Assumed by Ensco plc as of December 23, 2009), dated May 14, 2012(incorporated by reference to Exhibit 10.2 to the Registrant's Current Report on Form 8-K filed onMay 15, 2012, File No. 1-8097).
+10.23 ENSCO International Incorporated 2000 Stock Option Plan, dated June 22, 2000 (formerly known asthe Chiles Offshore Inc. 2000 Stock Option Plan) (incorporated by reference to Exhibit 4.6 to theRegistrant's Registration Statement on Form S-8 filed on August 7, 2002, File No. 333-97757).
+10.24 Amendment No. 1 to the ENSCO International Incorporated 2000 Stock Option Plan, datedNovember 13, 2000 (formerly known as the Chiles Offshore Inc. 2000 Stock Option Plan)(incorporated by reference to Exhibit 4.7 to the Registrant's Registration Statement on Form S-8 filedon August 7, 2002, File No. 333-97757).
+10.25 Amendment No. 2 to the ENSCO International Incorporated 2000 Stock Option Plan, dated August7, 2002 (formerly known as the Chiles Offshore Inc. 2000 Stock Option Plan) (incorporated byreference to Exhibit 4.8 to the Registrant's Registration Statement on Form S-8 filed on August 7,2002, File No. 333-97757).
+10.26 Amendment No. 3 to the ENSCO International Incorporated 2000 Stock Option Plan, dated January1, 2003 (formerly known as the Chiles Offshore Inc. 2000 Stock Option Plan) (incorporated byreference to Exhibit 10.18 to the Registrant's Annual Report on Form 10-K for the year endedDecember 31, 2002, File No. 1-8097).
+10.27 Amendment No. 4 to the ENSCO International Incorporated 2000 Stock Option Plan, datedDecember 22, 2009 (formerly known as the Chiles Offshore Inc. 2000 Stock Option Plan)(incorporated by reference to Exhibit 10.5 to the Registrant's Current Report on Form 8-K filed onDecember 23, 2009, File No. 1-8097).
+10.28 ENSCO Non-Employee Director Deferred Compensation Plan, effective January 1, 2004(incorporated by reference to Exhibit 10.1 to the Registrant's Quarterly Report on Form 10-Q for thequarter ended September 30, 2003, File No. 1-8097).
+10.29 Amendment No. 1 to the ENSCO Non-Employee Director Deferred Compensation Plan, datedMarch 11, 2008 (incorporated by reference to Exhibit 10.3 to the Registrant's Quarterly Report onForm 10-Q for the quarter ended March 31, 2008, File No. 1-8097).
+10.30 Amendment No. 2 to the ENSCO Non-Employee Director Deferred Compensation Plan, datedAugust 4, 2009 (incorporated by reference to Exhibit 10.4 to the Registrant's Quarterly Report onForm 10-Q for the quarter ended September 30, 2009, File No. 1-8097).
+10.31 Amendment No. 3 to the ENSCO Non-Employee Director Deferred Compensation Plan, datedDecember 22, 2009 (incorporated by reference to Exhibit 10.11 to the Registrant's Current Report onForm 8-K filed on December 23, 2009, File No. 1-8097).
+10.32 Amendment No. 4 to the ENSCO Non-Employee Director Deferred Compensation Plan, dated May14, 2012 (incorporated by reference to Exhibit 10.7 to the Registrant's Current Report on Form 8-Kfiled on May 15, 2012, File No. 1-8097).
+10.33 ENSCO Supplemental Executive Retirement Plan (As Amended and Restated Effective January 1,2004) (incorporated by reference to Exhibit 10.2 to the Registrant's Quarterly Report on Form 10-Qfor the quarter ended September 30, 2003, File No. 1-8097).
+10.34 Amendment No. 1 to the ENSCO Supplemental Executive Retirement Plan (As Amended andRestated Effective January 1, 2004), dated March 11, 2008 (incorporated by reference to Exhibit 10.1to the Registrant's Quarterly Report on Form 10-Q for the quarter ended March 31, 2008, File No.1-8097).
129
+10.35 Amendment No. 2 to the ENSCO Supplemental Executive Retirement Plan (As Amended andRestated Effective January 1, 2004), dated November 4, 2008 (incorporated by reference to Exhibit10.57 to the Registrant's Annual Report on Form 10-K for the year ended December 31, 2008, FileNo. 1-8097).
+10.36 Amendment No. 3 to the ENSCO Supplemental Executive Retirement Plan (As Amended andRestated Effective January 1, 2004), dated August 4, 2009 (incorporated by reference to Exhibit 10.2to the Registrant's Quarterly Report on Form 10-Q for the quarter ended September 30, 2009, FileNo. 1-8097).
+10.37 Amendment No. 4 to the ENSCO Supplemental Executive Retirement Plan (As Amended andRestated Effective January 1, 2004), dated December 22, 2009 (incorporated by reference to Exhibit10.10 to the Registrant's Current Report on Form 8-K filed on December 23, 2009, File No. 1-8097).
+10.38 Amendment No. 5 to the Ensco Supplemental Executive Retirement Plan (As Amended and RestatedEffective January 1, 2004), dated May 14, 2012 (incorporated by reference to Exhibit 10.8 to theRegistrant's Current Report on Form 8-K filed on May 15, 2012, File No. 1-8097).
+10.39 ENSCO Supplemental Executive Retirement Plan and Non-Employee Director DeferredCompensation Plan Trust Agreement (As Revised and Restated Effective January 1, 2004), datedAugust 27, 2003 (incorporated by reference to Exhibit 10.3 to the Registrant's Quarterly Report onForm 10-Q for the quarter ended September 30, 2003, File No. 1-8097).
+10.40 ENSCO 2005 Non-Employee Director Deferred Compensation Plan, effective January 1, 2005(incorporated by reference to Exhibit 99.2 to the Registrant's Current Report on Form 8-K filed onJanuary 5, 2005, File No. 1-8097).
+10.41 Amendment No. 1 to the ENSCO 2005 Non-Employee Director Deferred Compensation Plan, datedMarch 11, 2008 (incorporated by reference to Exhibit 10.4 to the Registrant's Quarterly Report onForm 10-Q for the quarter ended March 31, 2008, File No. 1-8097).
+10.42 Amendment No. 2 to the ENSCO 2005 Non-Employee Director Deferred Compensation Plan, datedNovember 4, 2008 (incorporated by reference to Exhibit 10.60 to the Registrant's Annual Report onForm 10-K for the year ended December 31, 2008, File No. 1-8097).
+10.43 Amendment No. 3 to the ENSCO 2005 Non-Employee Director Deferred Compensation Plan, datedAugust 4, 2009 (incorporated by reference to Exhibit 10.5 to the Registrant's Quarterly Report onForm 10-Q for the quarter ended September 30, 2009, File No. 1-8097).
+10.44 Amendment No. 4 to the ENSCO 2005 Non-Employee Director Deferred Compensation Plan, datedDecember 22, 2009 (incorporated by reference to Exhibit 10.9 to the Registrant's Current Report onForm 8-K filed on December 23, 2009, File No. 1-8097).
+10.45 Amendment No. 5 to the Ensco 2005 Non-Employee Director Deferred Compensation Plan, datedMay 14, 2012 (incorporated by reference to Exhibit 10.9 to the Registrant's Current Report on Form8-K filed on May 15, 2012, File No. 1-8097).
+10.46 ENSCO 2005 Supplemental Executive Retirement Plan (As Amended and Restated EffectiveJanuary 1, 2005), dated November 4, 2008 (incorporated by reference to Exhibit 10.56 to theRegistrant's Annual Report on Form 10-K for the year ended December 31, 2008, File No. 1-8097).
+10.47 Amendment No. 1 to the ENSCO 2005 Supplemental Executive Retirement Plan (As Amended andRestated Effective January 1, 2005), dated August 4, 2009 (incorporated by reference to Exhibit 10.3to the Registrant's Quarterly Report on Form 10-Q for the quarter ended September 30, 2009, FileNo. 1-8097).
+10.48 Amendment No. 2 to the ENSCO 2005 Supplemental Executive Retirement Plan (As Amended andRestated Effective January 1, 2005), dated November 3, 2009 (incorporated by reference to Exhibit10.31 to the Registrant's Annual Report on Form 10-K for the year ended December 31, 2009, FileNo. 1-8097).
+10.49 Amendment No. 3 to the ENSCO 2005 Supplemental Executive Retirement Plan (As Amended andRestated Effective January 1, 2005), dated December 22, 2009 (incorporated by reference to Exhibit10.8 to the Registrant's Current Report on Form 8-K filed on December 23, 2009, File No. 1-8097).
+10.50 Amendment No. 4 to the Ensco 2005 Supplemental Executive Retirement Plan (As Amended andRestated Effective January 1, 2005), dated May 14, 2012 (incorporated by reference to Exhibit 10.10to the Registrant's Current Report on Form 8-K filed on May 15, 2012, File No. 1-8097).
130
+10.51 Amendment No. 5 to the Ensco 2005 Amended and Restated Supplemental Executive RetirementPlan (As Amended and Restated Effective January 1, 2005), dated May 14, 2012 (incorporated byreference to Exhibit 10.10 to the Registrant's Current Report on Form 8-K filed on May 15, 2012,File No. 1-8097).
+10.52 ENSCO 2005 Benefit Reserve Trust, effective January 1, 2005 (incorporated by reference to Exhibit99.3 to the Registrant's Current Report on Form 8-K filed on January 5, 2005, File No. 1-8097).
+10.53 Deed of Assumption relating to Equity Incentive Plans of ENSCO International Incorporated, datedDecember 22, 2009, executed by Ensco International plc (incorporated by reference to Exhibit 10.1to the Registrant's Current Report on Form 8-K filed on December 23, 2009, File No. 1-8097).
+10.54 ENSCO International Incorporated 2005 Long-Term Incentive Plan (As Revised and Restated onDecember 22, 2009 and As Assumed by Ensco International plc as of December 23, 2009), effectiveDecember 23, 2009 (incorporated by reference to Exhibit 10.3 to the Registrant's Current Report onForm 8-K filed on December 23, 2009, File No. 1-8097).
+10.55 First Amendment to the ENSCO International Incorporated 2005 Long-Term Incentive Plan (AsRevised and Restated on December 22, 2009 and As Assumed by Ensco plc as of December 23,2009), dated March 1, 2011 (incorporated by reference to Exhibit 10.2 to the Registrant's QuarterlyReport on Form 10-Q for the period ending March 31, 2011, File No. 1-8097).
+10.56 Second Amendment to the ENSCO International Incorporated 2005 Long-Term Incentive Plan (AsRevised and Restated on December 22, 2009 and As Assumed by Ensco plc as of December 23,2009), effective August 23, 2011 (incorporated by reference to Exhibit 10.2 to the Registrant'sQuarterly Report on Form 10-Q for the period ending September 30, 2011, File No. 1-8097).
+10.57 Third Amendment to the ENSCO International Incorporated 2005 Long-Term Incentive Plan (AsRevised and Restated on December 22, 2009 and As Assumed by Ensco plc as of December 23,2009), dated May 14, 2012 (incorporated by reference to Exhibit 10.1 to the Registrant's CurrentReport on Form 8-K filed on May 15, 2012, File No. 1-8097).
+10.58 Fourth Amendment to the ENSCO International Incorporated 2005 Long-Term Incentive Plan (AsRevised and Restated on December 22, 2009 and As Assumed by Ensco plc as of December 23,2009), dated January 1, 2013 (incorporated by reference to Exhibit 10.1 to the Registrant's QuarterlyReport on Form 10-Q for the period ending June 30, 2013, File No. 1-8097).
+10.59 Form of ENSCO International Incorporated 2005 Long-Term Incentive Plan Performance UnitAward Agreement Terms and Conditions (incorporated by reference to Exhibit 10.7 to theRegistrant's Current Report on Form 8-K filed on November 6, 2009, File No. 1-8097).
+10.60 Form of Ensco Performance-Based Long-Term Incentive Award Summary (incorporated byreference to Exhibit 10.6 to the Registrant's Current Report on Form 8-K filed on November 6, 2009,File No. 1-8097).
+10.61 ENSCO International Incorporated 2005 Cash Incentive Plan, dated January 1, 2005 (incorporatedby reference to Exhibit C to the Registrant's Definitive Proxy Statement filed on March 21, 2005,File No. 1-8097).
+10.62 Amendment to the ENSCO International Incorporated 2005 Cash Incentive Plan, dated May 21,2008 (incorporated by reference to Exhibit 10.2 to the Registrant's Quarterly Report on Form 10-Qfor the quarter ended June 30, 2008, File No. 1-8097).
+10.63 Second Amendment to the ENSCO International Incorporated 2005 Cash Incentive Plan, datedNovember 4, 2008 (incorporated by reference to Exhibit 10.59 to the Registrant's Annual Report onForm 10-K for the year ended December 31, 2008, File No. 1-8097).
+10.64 Form of ENSCO International Incorporated Director Indemnification Agreement (incorporated byreference to Exhibit 10.1 to the Registrant's Current Report on Form 8-K filed on November 6, 2009,File No. 1-8097).
+10.65 Form of ENSCO International Incorporated Executive Officer Indemnification Agreement(incorporated by reference to Exhibit 10.2 to the Registrant's Current Report on Form 8-K filed onNovember 6, 2009, File No. 1-8097).
+10.66 Form of ENSCO International Incorporated Director and/or Officer Indemnification Agreement withDaniel W. Rabun (incorporated by reference to Exhibit 10.3 to the Registrant's Current Report onForm 8-K filed on November 6, 2009, File No. 1-8097).
131
+10.67 Form of ENSCO International Incorporated Director and/or Officer Indemnification Agreement withJohn Mark Burns (incorporated by reference to Exhibit 10.4 to the Registrant's Current Report onForm 8-K filed on November 6, 2009, File No. 1-8097).
+10.68 Form of Indemnification Agreement of ENSCO International Incorporated (incorporated byreference to Exhibit 10.12 to the Registrant's Current Report on Form 8-K filed on December 23,2009, File No. 1-8097).
+10.69 Form of Deed of Indemnity of Ensco International plc (incorporated by reference to Exhibit 10.13 tothe Registrant's Current Report on Form 8-K filed on December 23, 2009, File No. 1-8097).
+10.70 Employment Offer Letter Agreement between ENSCO International Incorporated and Daniel W.Rabun, dated January 13, 2006 and accepted on February 6, 2006 (incorporated by reference toExhibit 10.1 to the Registrant's Current Report on Form 8-K filed on February 6, 2006, File No.1-8097).
+10.71 Amendment to the Employment Offer Letter Agreement between ENSCO International Incorporatedand Daniel W. Rabun, dated December 22, 2009 (incorporated by reference to Exhibit 10.15 to theRegistrant's Current Report on Form 8-K filed on December 23, 2009, File No. 1-8097).
+10.72 Restated and Superseding Employment Agreement, dated as of November 13, 2013, between DanielW. Rabun and Ensco plc (incorporated by reference to Exhibit 10.1 to the Registrant's CurrentReport on Form 8-K filed on November 19, 2013, File No. 1-8097).
+10.73 Amendment and Restatement of the Letter Agreement between ENSCO International Incorporatedand William S. Chadwick, Jr., dated December 22, 2009 (incorporated by reference to Exhibit 10.14to the Registrant's Current Report on Form 8-K filed on December 23, 2009, File No. 1-8097).
+10.74 Employment Offer Letter between ENSCO International Incorporated and Mark Burns, dated May19, 2008 and accepted on May 22, 2008 (incorporated by reference to Exhibit 10.3 to the Registrant'sQuarterly Report on Form 10-Q for the quarter ended June 30, 2008, File No. 1-8097).
+10.75 Employment Offer Letter between ENSCO International Incorporated and Carey Lowe, dated June23, 2008 and accepted July 22, 2008 (incorporated by reference to Exhibit 10.1 to the Registrant'sQuarterly Report on Form 10-Q for the quarter ended September 30, 2008, File No. 1-8097).
+10.76 Summary of Relocation Benefits of Certain Executive Officers (incorporated by reference to Item5.02 to the Registrant's Current Report on Form 8-K filed on December 1, 2009, File No. 1-8097).
+10.77 Ensco plc 2012 Long-Term Incentive Plan, effective January 1, 2012 (incorporated by reference toAnnex A to the Registrant's Proxy Statement filed on April 4, 2012, File No. 1-8097).
+10.78 First Amendment to the Ensco plc 2012 Long-Term Incentive Plan, effective August 21, 2012(incorporated by reference to the Registrant's Quarterly Report on Form 10-Q for the quarter endedSeptember 30, 2012, File No. 1-8097).
+10.79 Second Amendment to the Ensco plc 2012 Long-Term Incentive Plan, effective January 1, 2013(incorporated by reference to Exhibit 10.2 to the Registrant's Quarterly Report on Form 10-Q for thequarter ended June 30, 2013, File No. 1-8097).
*+10.80 Separation Agreement, dated as of January 10, 2014, between Kevin C. Robert and Ensco plc.
*21.1 Subsidiaries of the Registrant.
*23.1 Consent of Independent Registered Public Accounting Firm.
*31.1 Certification of the Chief Executive Officer of Registrant pursuant to Rule 13a-14 or 15d-14 of theSecurities Exchange Act of 1934, as adopted pursuant to Section 302 of the Sarbanes-Oxley Act of2002.
*31.2 Certification of the Chief Financial Officer of Registrant pursuant to Rule 13a-14 or 15d-14 of theSecurities Exchange Act of 1934, as adopted pursuant to Section 302 of the Sarbanes-Oxley Act of2002.
**32.1 Certification of the Chief Executive Officer of Registrant pursuant to 18 U.S.C. Section 1350, asadopted pursuant to Section 906 of the Sarbanes-Oxley Act of 2002.
**32.2 Certification of the Chief Financial Officer of Registrant pursuant to 18 U.S.C. Section 1350, asadopted pursuant to Section 906 of the Sarbanes-Oxley Act of 2002.
*101.INS XBRL Instance Document
132
*101.SCH XBRL Taxonomy Extension Schema
*101.CAL XBRL Taxonomy Extension Calculation Linkbase
*101.DEF XBRL Taxonomy Extension Definition Linkbase
*101.LAB XBRL Taxonomy Extension Label Linkbase
*101.PRE XBRL Taxonomy Extension Presentation Linkbase
***+
Filed herewith.Furnished herewith.Management contracts or compensatory plans and arrangements required to be filed as exhibits pursuant to Item 15(b) of this report.
Certain agreements relating to our long-term debt have not been filed as exhibits as permitted by paragraph (b)(4)(iii)(A) of Item 601 of Regulation S-K since the total amount of securities authorized under any such agreements do not exceed 10% of our total assets on a consolidated basis. Upon request, we will furnish to the SEC all constituent agreements defining the rights of holders of our long-term debt not filed herewith.
133
SIGNATURES
Pursuant to the requirements of Section 13 or 15(d) of the Securities Exchange Act of 1934, the Registrant has duly caused this report to be signed on its behalf by the undersigned thereunto duly authorized, on February 26, 2014.
Ensco plc (Registrant)
By /s/ DANIEL W. RABUN Daniel W. Rabun Chairman, President and Chief Executive Officer
Pursuant to the requirements of the Securities Exchange Act of 1934, this report has been signed by the following persons on behalf of the Registrant and in the capacities and on the date indicated.
Signatures Title Date
/s/ DANIEL W. RABUN Daniel W. Rabun
Chairman, President and Chief Executive Officer
February 26, 2014
/s/ J. RODERICK CLARK J. Roderick Clark
Director February 26, 2014
/s/ ROXANNE J. DECYK Roxanne J. Decyk
Director February 26, 2014
/s/ MARY E. FRANCIS CBE Mary E. Francis CBE
Director February 26, 2014
/s/ C. CHRISTOPHER GAUT C. Christopher Gaut
Director February 26, 2014
/s/ GERALD W. HADDOCK Gerald W. Haddock
Director February 26, 2014
/s/ FRANCIS S. KALMAN Francis S. Kalman
Director February 26, 2014
/s/ KEITH O. RATTIE Keith O. Rattie
Director February 26, 2014
/s/ PAUL E. ROWSEY, III Paul E. Rowsey, III
Director February 26, 2014
/s/ JAMES W. SWENT III James W. Swent III
Executive Vice President and Chief Financial Officer (principal financial officer)
February 26, 2014
/s/ DOUGLAS J. MANKO Douglas J. Manko
Vice President - Finance February 26, 2014
/s/ ROBERT W. EDWARDS III Robert W. Edwards III
Controller(principal accounting officer)
February 26, 2014
United Kingdom Statutory Accounts
Ensco plc
Annual Report and Financial StatementsRegistered Number 07023598
31 December 2013
Contents Page No.
1
10
13
30
31
32
33
34
35
36
Strategic report
Directors’ report
Directors’ remuneration report
Statement of directors’ responsibilities in respect of the annual report, strategic report and directors’
report and the financial statements
Independent auditor’s report to the members of Ensco plc
Consolidated Profit and Loss Account
Consolidated Balance Sheet
Company Balance Sheet
Consolidated Cash Flow Statement
Reconciliations of Movements in Shareholders’ Funds
Notes 37
1
Strategic report Our business Ensco plc ("we," "our" or the "company") own the world's second largest offshore drilling rig fleet amongst competitive rigs, our ultra-deepwater fleet is the newest in the industry, and our premium jackup fleet is the largest of any offshore drilling company. We currently own and operate an offshore drilling rig fleet of 74 rigs, including six rigs under construction, spanning most of the strategic, high-growth markets around the globe. Our rig fleet includes ten drillships, 13 dynamically positioned semisubmersible rigs, six moored semisubmersible rigs and 45 jackup rigs. Our customers include most of the leading national and international oil companies, in addition to many independent operators. We are among the most geographically diverse offshore drilling companies, with current operations and drilling contracts spanning approximately 20 countries on six continents in nearly every major offshore basin around the world. The markets in which we operate include Australia, Brazil, the Mediterranean, Mexico, the Middle East, the North Sea, Southeast Asia, the U.S. Gulf of Mexico and West Africa. We provide drilling services on a "day rate" contract basis. Under day rate contracts, we provide a drilling rig and rig crews and receive a fixed amount per day for drilling a well. Our customers bear substantially all of the ancillary costs of constructing the well and supporting drilling operations, as well as the economic risk relative to the success of the well. In addition, our customers may pay all or a portion of the cost of moving our equipment and personnel to and from the well site. We do not provide "turnkey" or other risk-based drilling services.
Principal risks and uncertainties The success of our business largely depends on the level of activity in offshore oil and natural gas exploration, development and production. Oil and natural gas prices, and market expectations of potential changes in these prices, may significantly affect the level of drilling activity. An actual decline, or the perceived risk of a decline, in oil and/or natural gas prices could cause oil and gas companies to reduce their overall level of activity or spending, in which case demand for our services may decline and turnover may be adversely affected through lower rig utilisation and/or lower day rates. Any prolonged reduction in oil and natural gas prices will depress the levels of exploration, development and production activity. In addition, continued hostilities in foreign countries and the occurrence or threat of terrorist attacks against the United States or other countries could create downward pressure on the economies of the United States and other countries. Moreover, even during periods of high commodity prices, customers may cancel or curtail their drilling programmes, or reduce their levels of capital expenditures for exploration and production for a variety of reasons, including their lack of success in exploration efforts. Advances in onshore exploration and development technologies, particularly with respect to onshore shale plays, could result in our customers allocating more of their capital expenditure budgets to onshore exploration and production activities and less to offshore activities. These factors could cause our turnover and margins to decline, as a result of declines in utilisation and day rates, and limit our future growth prospects.
Our industry The offshore contract drilling industry is highly competitive. Drilling contracts are, for the most part, awarded on a competitive bid basis. Price competition is often the primary factor in determining which contractor is awarded a contract, although quality of service, operational and safety performance, equipment suitability and availability, location of equipment, reputation and technical expertise also are factors. We have numerous competitors in the offshore contract drilling industry that have significant resources. Operating results in the offshore contract drilling industry are cyclical and directly related to the demand for drilling rigs and the available supply of drilling rigs. While the cost of moving a rig and the availability of rig-moving vessels may cause the balance of supply and demand to vary somewhat between regions, significant variations between regions are generally of a short-term nature due to rig mobility.
2
Strategic report (continued) Drilling rig demand Demand for drilling rigs is directly related to the regional and worldwide levels of offshore exploration and development spending by oil and gas companies, which is beyond our control. The markets for our contract drilling services are cyclical. Offshore exploration and development spending may fluctuate substantially from year-to-year and from region-to-region. Such spending fluctuations result from many factors, including:
• demand for oil and natural gas,
• regional and global economic conditions and changes therein,
• political, social and legislative environments in major oil-producing countries,
• production and inventory levels and related activities of the Organization of Petroleum Exporting Countries ("OPEC") and other oil and natural gas producers,
• technological advancements that impact the methods or cost of oil and natural gas exploration and development,
• disruption to exploration and development activities due to hurricanes and other severe weather conditions and the risk thereof, and
• the impact that these and other events, whether caused by economic conditions, international or national climate change regulations or other factors, may have on the current and expected future prices of oil and natural gas.
Utilisation and day rates stabilised during 2011 as deepwater permitting activity increased in the U.S. Gulf of Mexico and global demand for shallow-water and deepwater drilling improved. During 2012, the permitting process in the U.S. Gulf of Mexico continued to improve and demand growth for floater and jackup rigs resulted in increased utilisation and day rates. Day rates strengthened further during 2013 as demand remained strong in most regions, due in part to favourable commodity prices and the announcement of new oil and gas discoveries in regions around the world. Since factors that affect offshore exploration and development spending are beyond our control and because rig demand can change quickly, it is difficult for us to predict future industry conditions, demand trends or future operating results. Periods of low rig demand often result in excess rig supply, which generally results in reductions in utilisation and day rates; conversely, periods of high rig demand often result in a shortage of rigs, which generally results in increased utilisation and day rates.
Drilling rig supply During the current newbuild cycle, various industry participants ordered the construction of 381 new drillships, semisubmersible rigs and jackup rigs, 149 of which were delivered during the last three years. Worldwide rig supply in the Floaters segment continues to increase as a result of newbuild construction programmes. Currently there are 99 newbuild drillships and semisubmersible rigs under construction, over 30 of which are scheduled for delivery during 2014. Approximately half of all newbuild floater rigs scheduled for delivery during 2014 are contracted. We expect these newbuild floaters to be absorbed into the market; however, utilisation and day rates for less capable floaters will likely be negatively impacted. Worldwide rig supply in the Jackups segment continues to increase as a result of newbuild construction programmes. Currently there are 133 newbuild jackup rigs under construction, over 35 of which are scheduled for delivery during 2014. The majority of all newbuild jackup rigs scheduled for delivery during 2014 are not contracted. Although we expect these newbuild jackup rigs to be absorbed into the market, utilisation and day rates in certain regions may come under pressure in the near to intermediate term depending upon the rate at which older jackups are retired.
3
Strategic report (continued) Drilling rig supply (continued) Rig loss or damage due to hurricanes, blowouts, craterings, punchthroughs and other operational events, and the limited availability of insurance for certain perils in some geographic regions, may impact the supply of offshore drilling rigs in a particular market and cause fluctuations in utilisation and day rates.
Drilling rig construction and delivery We remain focused on our long-established strategy of high-grading and expanding the size of our fleet. During the three-year period ended 31 December 2013, we invested $3.0 billion in the construction of new drilling rigs. We previously contracted Keppel FELS Limited ("KFELS") to construct seven ENSCO 8500 Series® ultra-deepwater semisubmersible rigs based on our proprietary design. The ENSCO 8500 Series® rigs are enhanced versions of ENSCO 7500 and are capable of drilling in up to 8,500 feet of water. ENSCO 8506, the final rig in the ENSCO 8500 Series®, was delivered during 2012 and commenced drilling operations in the U.S. Gulf of Mexico under a long-term contract during the first quarter of 2013. On 31 May 2011 (the "Merger Date"), Ensco plc completed a merger transaction (the "Merger") with Pride International, Inc., a Delaware corporation ("Pride"), pursuant to which Pride became an indirect, wholly-owned subsidiary of Ensco plc. In connection with the Merger, we acquired seven drillships, two of which were under construction at the time of the Merger. ENSCO DS-6 was delivered in January 2012, underwent customer specified upgrades and commenced drilling operations in Angola under a long-term contract during the first quarter of 2013. ENSCO DS-7 was delivered in September 2013 and commenced a long-term contract in Angola during the fourth quarter of 2013. These newbuild drillships are based on a Samsung Heavy Industries ("SHI") proprietary hull design capable of drilling in water depths of up to 10,000 feet of water. During 2012, we entered into agreements with SHI to construct two additional ultra-deepwater drillships (ENSCO DS-8 and ENSCO DS-9). ENSCO DS-8 is currently uncontracted and scheduled for delivery during the third quarter of 2014. ENSCO DS-9 is currently scheduled for delivery during the fourth quarter of 2014 and is committed under a long-term contract. During 2013, we entered into an agreement with SHI to construct our eighth ultra-deepwater drillship (ENSCO DS-10), which is uncontracted and scheduled for delivery during the third quarter of 2015. We previously entered into agreements with KFELS to construct three ultra-premium harsh environment jackup rigs (ENSCO 120, ENSCO 121 and ENSCO 122). ENSCO 120 was delivered in September 2013 and commenced drilling operations under a long-term contract in the North Sea during the first quarter of 2014. ENSCO 121 was delivered during the fourth quarter of 2013 and is expected to commence drilling operations under a long-term contract in the North Sea during the second quarter of 2014. ENSCO 122 is currently scheduled for delivery during the third quarter 2014 and is committed under a long-term drilling contract. During 2013, we entered into agreements with KFELS to construct a premium jackup rig (ENSCO 110) and a fourth ultra-premium harsh environment jackup rig in the ENSCO 120 Series (ENSCO 123). These rigs are scheduled for delivery during the first quarter of 2015 and the second quarter of 2016, respectively. Both of these rigs are currently uncontracted. A substantial portion of our projected cash flows will continue to be invested in the expansion and enhancement of our fleet of drilling rigs. We also intend to continue paying quarterly dividends for the foreseeable future. However, our Board of Directors may change the timing and payment amount depending on several factors including our profitability, liquidity, financial condition, reinvestment opportunities and capital requirements. We believe our strong balance sheet, $10.7 billion of contract backlog and borrowing capacity under our commercial paper programme and revolving credit facility will provide flexibility to make additional investments in our fleet and sustain an adequate level of liquidity during 2014 and beyond.
4
Strategic report (continued) Segment highlights Floaters Operating results for our Floaters segment improved during 2013, primarily due to commencement of ENSCO 8506 and ENSCO DS-6 drilling operations as well as a full year of operations for ENSCO 8505. During the first quarter of 2013, ENSCO 8506 and ENSCO DS-6 commenced drilling operations under long-term contracts at day rates of approximately $530,000. ENSCO 8505 commenced drilling operations under a long-term contract during the second quarter of 2012 at a day rate of approximately $475,000. ENSCO DS-7 was delivered in September 2013 and commenced a long-term contract in Angola during the fourth quarter of 2013. The day rate averages approximately $648,000 over the term of the contract. In January 2014, ENSCO DS-9 was contracted to ConocoPhillips and is expected to commence a long-term contract in the U.S. Gulf of Mexico during the third quarter of 2015 at an average day rate of approximately $550,000.
ENSCO 8501 received a one-year contract extension from Noble Energy in the U.S. Gulf of Mexico that commenced in August 2013 at a day rate of approximately $525,000. ENSCO 5004 was contracted to Mellitah during the third quarter of 2013 and is expected to commence drilling operations in the Mediterranean during the second quarter of 2014 at an average day rate of approximately $310,000 over the term of the contract.
ENSCO 6001 and ENSCO 6002 received five-year contract extensions from Petrobras in Brazil that commenced in June and July 2013, respectively, at day rates of approximately $370,000, significantly higher than the day rates earned under the expiring contracts.
During 2013, we entered into an agreement with SHI to construct our eighth ultra-deepwater drillship, ENSCO DS-10, which is currently uncontracted and scheduled for delivery during the third quarter of 2015. Jackups An increase in average day rates resulted in improved operating results for our Jackups segment during 2013. In particular, premium jackup rigs earned significantly higher day rates during 2013 due to increasing customer demand for more technically capable rigs. The jackup market remains tight, and as of 31 December 2013, all of our marketed jackup rigs were contracted. In the U.S. Gulf of Mexico, multiple jackup rigs were contracted for longer terms and higher day rates than the expiring contracts. Energy XXI extended the ENSCO 82 contract for one year through September 2014 and the ENSCO 99 contract for nine months through July 2014. Both rigs will receive higher day rates under the contract extensions. Chevron contracted ENSCO 68 and ENSCO 81 for one year and 11 month terms, respectively, at day rates of approximately $145,000, significantly higher than the day rates earned under the expiring contracts. Additionally, Fieldwood extended the ENSCO 87 contract for one year through January 2015 at a day rate of approximately $147,000.
The jackup market was also strong in other regions. ENSCO 54 was contracted to Saudi Aramco in the Middle East through October 2017 at an average day rate of approximately $115,000. ENSCO 105 was contracted to Shell in Malaysia through November 2014 at a day rate of approximately $161,000.
Ultra-premium harsh environment jackup rigs ENSCO 120 and ENSCO 121 were delivered during 2013. ENSCO 120 commenced drilling operations under a long-term contract in the North Sea at a day rate of approximately $230,000 during the first quarter of 2014. ENSCO 121 is expected to commence drilling operations under a long-term contract in the North Sea at a day rate of approximately $230,000 during the second quarter of 2014.
In response to strong demand, we recently entered into agreements with KFELS to construct a premium jackup rig (ENSCO 110) and an ultra-premium harsh environment jackup rig (ENSCO 123). These rigs are scheduled for delivery during the first quarter 2015 and second quarter 2016, respectively. Both of these rigs are currently uncontracted.
5
Strategic report (continued) Business environment Floaters There have been relatively few new floater contracts signed during 2014, and certain customers are receiving pressure from their investors to be more disciplined in their capital spending. Increasing rig supply from newbuild floaters and rigs coming off contract is expected to temper utilisation, day rates and contract duration, but retirements of older, less capable floaters should alleviate some of this pressure. Drilling contractors will be more challenged to contract older, less capable floaters that are not retired. Rig supply in the U.S. Gulf of Mexico is expected to increase as more than 12 rigs will mobilise to the region during 2014. Although the majority of these newbuild rigs are contracted, utilisation for existing floaters in the region may be negatively impacted, and some of these rigs may mobilise to other regions. In Mexico, the government is taking steps to expand deepwater drilling that could lead to incremental demand in future years.
We believe there will be incremental demand in Brazil as customers come to the market for rigs to drill their new exploration acreage awarded in licensing rounds held during 2013. Petrobras has open tenders and inquiries to contract floaters and contract extension negotiations for multiple rigs with contracts expiring in 2015 are ongoing. A newbuild floater program for rigs "built in Brazil" is planned to have its initial deliveries in late 2015 or starting in 2016 and may put pressure on utilisation and day rate for incumbent drilling contractors operating in Brazil.
In West Africa, multiple newbuild drillships are projected to enter the region during 2014; however, this region is experiencing one of the highest levels of demand. We expect demand in the Asia Pacific market to remain stable, with incremental requirements in Australia, Indonesia, Myanmar and Vietnam.
Supply and demand in the North Sea market are balanced, and we believe there will be incremental demand for harsh environment floaters. The Mediterranean market is also expected to present additional drilling opportunities. Jackups Demand for jackups is strong, supporting current day rates and contract terms. Utilisation and day rates in certain regions may come under pressure as more newbuild rigs enter the market; however, retirements of older jackups should partially offset new supply as the majority of the global jackup fleet is more than 30 years old.
Demand is steady in the U.S. Gulf of Mexico. Recent lease sales indicate opportunities for favourable future demand. The national oil company of Mexico, Petróleos Mexicanos ("PEMEX"), continues to expand its rig fleet, and we believe there will be incremental demand in Mexico as PEMEX contracts additional jackups.
The Asia Pacific market remains balanced, and many of the contracted newbuild rigs being built in the region will mobilise to other regions during 2014 to begin their initial contracts. Uncontracted newbuild rigs scheduled for delivery from Asian shipyards during 2014 will likely put pressure on utilisation and day rates in the region depending upon the rate at which older jackups are retired.
The Middle East market is expected to remain strong, and we believe there will be incremental demand from operators in the region. Demand in West Africa increased during 2013, and there are currently open tenders for incremental rigs for multi-year terms. We expect the North Sea market to remain tight. Significant contracted backlog exists for 2014, and operators are issuing tenders to secure rigs for work beginning in 2015 and beyond.
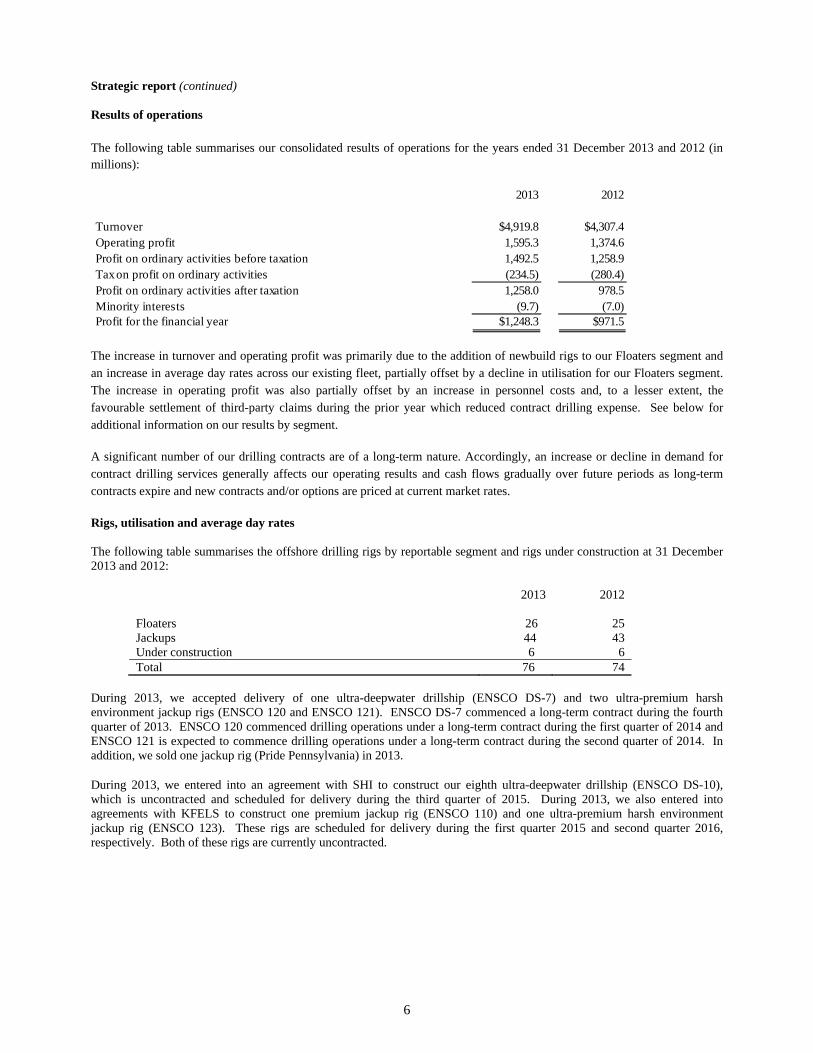
6
Strategic report (continued) Results of operations The following table summarises our consolidated results of operations for the years ended 31 December 2013 and 2012 (in millions):
The increase in turnover and operating profit was primarily due to the addition of newbuild rigs to our Floaters segment and an increase in average day rates across our existing fleet, partially offset by a decline in utilisation for our Floaters segment. The increase in operating profit was also partially offset by an increase in personnel costs and, to a lesser extent, the favourable settlement of third-party claims during the prior year which reduced contract drilling expense. See below for additional information on our results by segment. A significant number of our drilling contracts are of a long-term nature. Accordingly, an increase or decline in demand for contract drilling services generally affects our operating results and cash flows gradually over future periods as long-term contracts expire and new contracts and/or options are priced at current market rates. Rigs, utilisation and average day rates The following table summarises the offshore drilling rigs by reportable segment and rigs under construction at 31 December 2013 and 2012:
2013 2012 Floaters 26 25 Jackups 44 43 Under construction 6 6 Total 76 74
During 2013, we accepted delivery of one ultra-deepwater drillship (ENSCO DS-7) and two ultra-premium harsh environment jackup rigs (ENSCO 120 and ENSCO 121). ENSCO DS-7 commenced a long-term contract during the fourth quarter of 2013. ENSCO 120 commenced drilling operations under a long-term contract during the first quarter of 2014 and ENSCO 121 is expected to commence drilling operations under a long-term contract during the second quarter of 2014. In addition, we sold one jackup rig (Pride Pennsylvania) in 2013.
During 2013, we entered into an agreement with SHI to construct our eighth ultra-deepwater drillship (ENSCO DS-10), which is uncontracted and scheduled for delivery during the third quarter of 2015. During 2013, we also entered into agreements with KFELS to construct one premium jackup rig (ENSCO 110) and one ultra-premium harsh environment jackup rig (ENSCO 123). These rigs are scheduled for delivery during the first quarter 2015 and second quarter 2016, respectively. Both of these rigs are currently uncontracted.
2013 2012
Turnover $4,919.8 $4,307.4 Operating profit 1,595.3 1,374.6 Profit on ordinary activities before taxation 1,492.5 1,258.9 Tax on profit on ordinary activities (234.5) (280.4) Profit on ordinary activities after taxation 1,258.0 978.5 Minority interests (9.7) (7.0) Profit for the financial year $1,248.3 $971.5
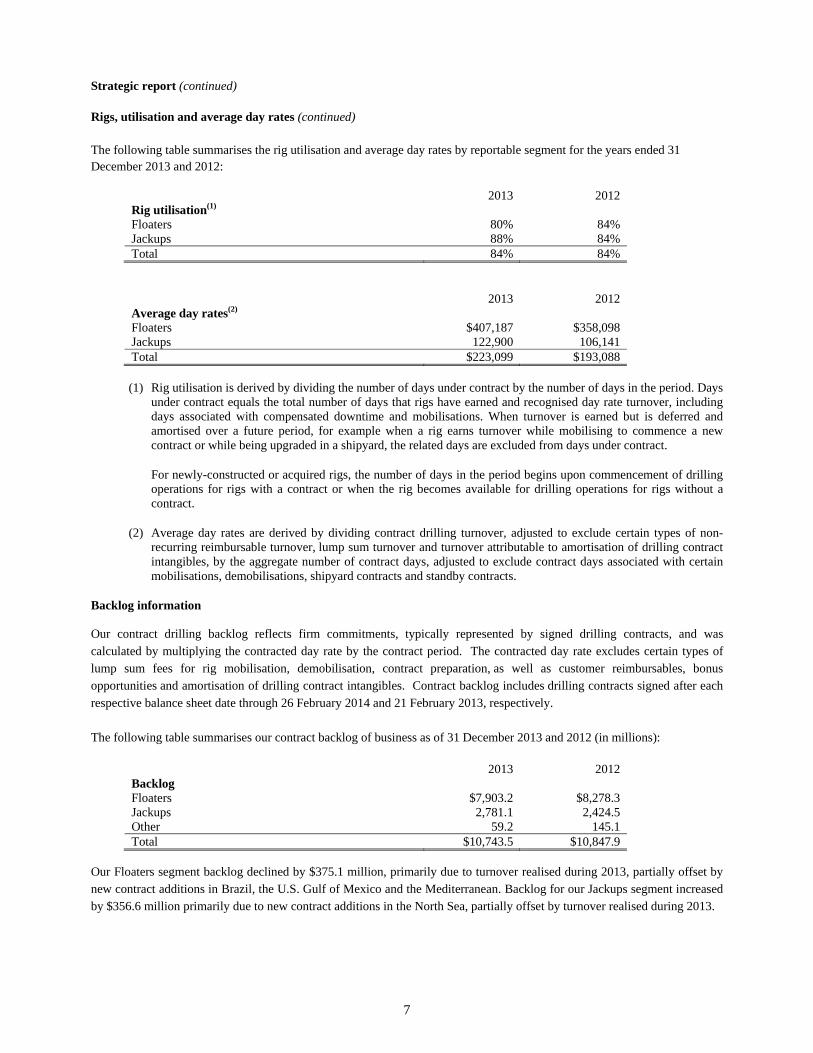
7
Strategic report (continued) Rigs, utilisation and average day rates (continued) The following table summarises the rig utilisation and average day rates by reportable segment for the years ended 31 December 2013 and 2012:
2013 2012 Rig utilisation(1) Floaters 80% 84% Jackups 88% 84% Total 84% 84%
2013 2012 Average day rates(2) Floaters $407,187 $358,098 Jackups 122,900 106,141 Total $223,099 $193,088
(1) Rig utilisation is derived by dividing the number of days under contract by the number of days in the period. Days
under contract equals the total number of days that rigs have earned and recognised day rate turnover, including days associated with compensated downtime and mobilisations. When turnover is earned but is deferred and amortised over a future period, for example when a rig earns turnover while mobilising to commence a new contract or while being upgraded in a shipyard, the related days are excluded from days under contract.
For newly-constructed or acquired rigs, the number of days in the period begins upon commencement of drilling operations for rigs with a contract or when the rig becomes available for drilling operations for rigs without a contract.
(2) Average day rates are derived by dividing contract drilling turnover, adjusted to exclude certain types of non-recurring reimbursable turnover, lump sum turnover and turnover attributable to amortisation of drilling contract intangibles, by the aggregate number of contract days, adjusted to exclude contract days associated with certain mobilisations, demobilisations, shipyard contracts and standby contracts.
Backlog information
Our contract drilling backlog reflects firm commitments, typically represented by signed drilling contracts, and was calculated by multiplying the contracted day rate by the contract period. The contracted day rate excludes certain types of lump sum fees for rig mobilisation, demobilisation, contract preparation, as well as customer reimbursables, bonus opportunities and amortisation of drilling contract intangibles. Contract backlog includes drilling contracts signed after each respective balance sheet date through 26 February 2014 and 21 February 2013, respectively. The following table summarises our contract backlog of business as of 31 December 2013 and 2012 (in millions):
2013 2012 Backlog Floaters $7,903.2 $8,278.3 Jackups 2,781.1 2,424.5 Other 59.2 145.1 Total $10,743.5 $10,847.9
Our Floaters segment backlog declined by $375.1 million, primarily due to turnover realised during 2013, partially offset by new contract additions in Brazil, the U.S. Gulf of Mexico and the Mediterranean. Backlog for our Jackups segment increased by $356.6 million primarily due to new contract additions in the North Sea, partially offset by turnover realised during 2013.
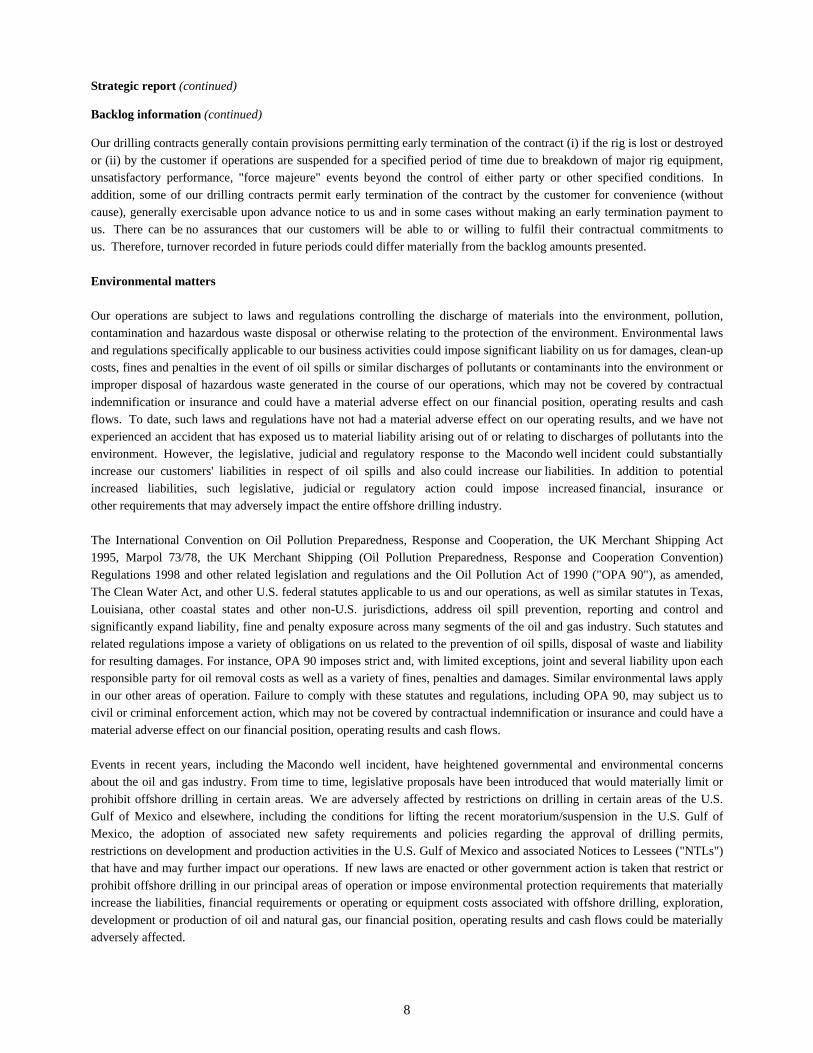
8
Strategic report (continued)
Backlog information (continued)
Our drilling contracts generally contain provisions permitting early termination of the contract (i) if the rig is lost or destroyed or (ii) by the customer if operations are suspended for a specified period of time due to breakdown of major rig equipment, unsatisfactory performance, "force majeure" events beyond the control of either party or other specified conditions. In addition, some of our drilling contracts permit early termination of the contract by the customer for convenience (without cause), generally exercisable upon advance notice to us and in some cases without making an early termination payment to us. There can be no assurances that our customers will be able to or willing to fulfil their contractual commitments to us. Therefore, turnover recorded in future periods could differ materially from the backlog amounts presented.
Environmental matters Our operations are subject to laws and regulations controlling the discharge of materials into the environment, pollution, contamination and hazardous waste disposal or otherwise relating to the protection of the environment. Environmental laws and regulations specifically applicable to our business activities could impose significant liability on us for damages, clean-up costs, fines and penalties in the event of oil spills or similar discharges of pollutants or contaminants into the environment or improper disposal of hazardous waste generated in the course of our operations, which may not be covered by contractual indemnification or insurance and could have a material adverse effect on our financial position, operating results and cash flows. To date, such laws and regulations have not had a material adverse effect on our operating results, and we have not experienced an accident that has exposed us to material liability arising out of or relating to discharges of pollutants into the environment. However, the legislative, judicial and regulatory response to the Macondo well incident could substantially increase our customers' liabilities in respect of oil spills and also could increase our liabilities. In addition to potential increased liabilities, such legislative, judicial or regulatory action could impose increased financial, insurance or other requirements that may adversely impact the entire offshore drilling industry. The International Convention on Oil Pollution Preparedness, Response and Cooperation, the UK Merchant Shipping Act 1995, Marpol 73/78, the UK Merchant Shipping (Oil Pollution Preparedness, Response and Cooperation Convention) Regulations 1998 and other related legislation and regulations and the Oil Pollution Act of 1990 ("OPA 90"), as amended, The Clean Water Act, and other U.S. federal statutes applicable to us and our operations, as well as similar statutes in Texas, Louisiana, other coastal states and other non-U.S. jurisdictions, address oil spill prevention, reporting and control and significantly expand liability, fine and penalty exposure across many segments of the oil and gas industry. Such statutes and related regulations impose a variety of obligations on us related to the prevention of oil spills, disposal of waste and liability for resulting damages. For instance, OPA 90 imposes strict and, with limited exceptions, joint and several liability upon each responsible party for oil removal costs as well as a variety of fines, penalties and damages. Similar environmental laws apply in our other areas of operation. Failure to comply with these statutes and regulations, including OPA 90, may subject us to civil or criminal enforcement action, which may not be covered by contractual indemnification or insurance and could have a material adverse effect on our financial position, operating results and cash flows. Events in recent years, including the Macondo well incident, have heightened governmental and environmental concerns about the oil and gas industry. From time to time, legislative proposals have been introduced that would materially limit or prohibit offshore drilling in certain areas. We are adversely affected by restrictions on drilling in certain areas of the U.S. Gulf of Mexico and elsewhere, including the conditions for lifting the recent moratorium/suspension in the U.S. Gulf of Mexico, the adoption of associated new safety requirements and policies regarding the approval of drilling permits, restrictions on development and production activities in the U.S. Gulf of Mexico and associated Notices to Lessees ("NTLs") that have and may further impact our operations. If new laws are enacted or other government action is taken that restrict or prohibit offshore drilling in our principal areas of operation or impose environmental protection requirements that materially increase the liabilities, financial requirements or operating or equipment costs associated with offshore drilling, exploration, development or production of oil and natural gas, our financial position, operating results and cash flows could be materially adversely affected.
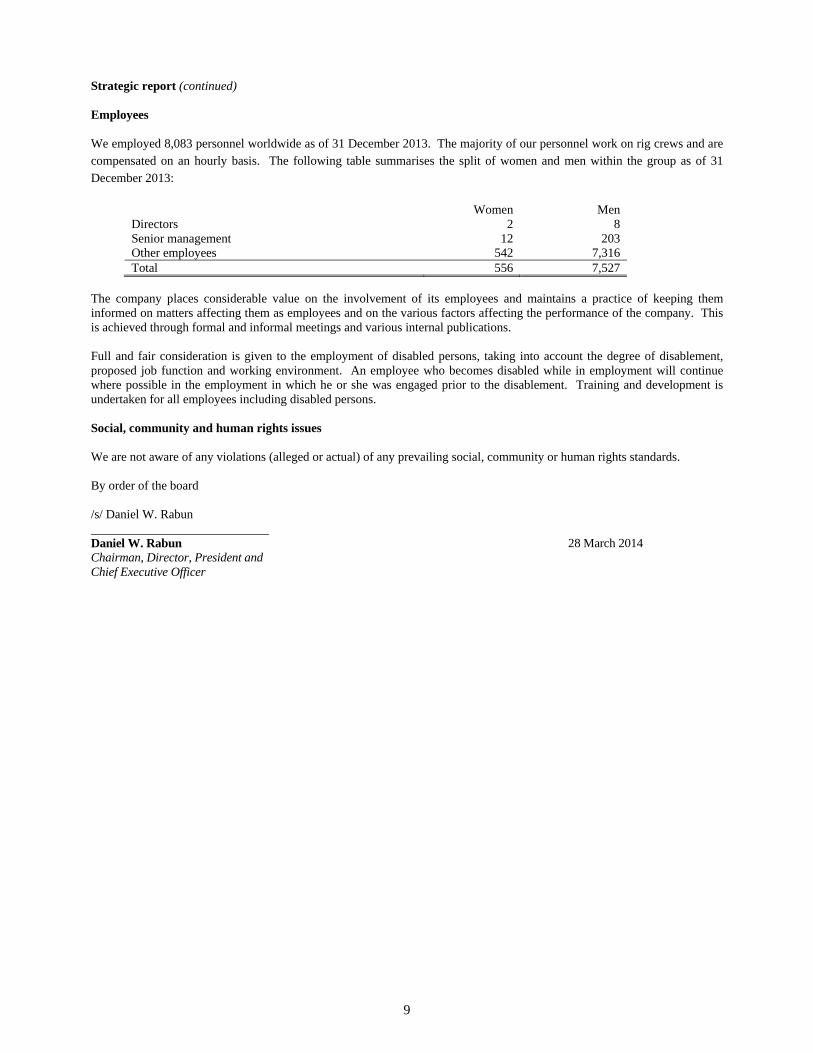
9
Strategic report (continued) Employees We employed 8,083 personnel worldwide as of 31 December 2013. The majority of our personnel work on rig crews and are compensated on an hourly basis. The following table summarises the split of women and men within the group as of 31 December 2013:
Women Men Directors 2 8 Senior management 12 203 Other employees 542 7,316 Total 556 7,527
The company places considerable value on the involvement of its employees and maintains a practice of keeping them informed on matters affecting them as employees and on the various factors affecting the performance of the company. This is achieved through formal and informal meetings and various internal publications. Full and fair consideration is given to the employment of disabled persons, taking into account the degree of disablement, proposed job function and working environment. An employee who becomes disabled while in employment will continue where possible in the employment in which he or she was engaged prior to the disablement. Training and development is undertaken for all employees including disabled persons. Social, community and human rights issues We are not aware of any violations (alleged or actual) of any prevailing social, community or human rights standards. By order of the board /s/ Daniel W. Rabun Daniel W. Rabun Chairman, Director, President and Chief Executive Officer
28 March 2014
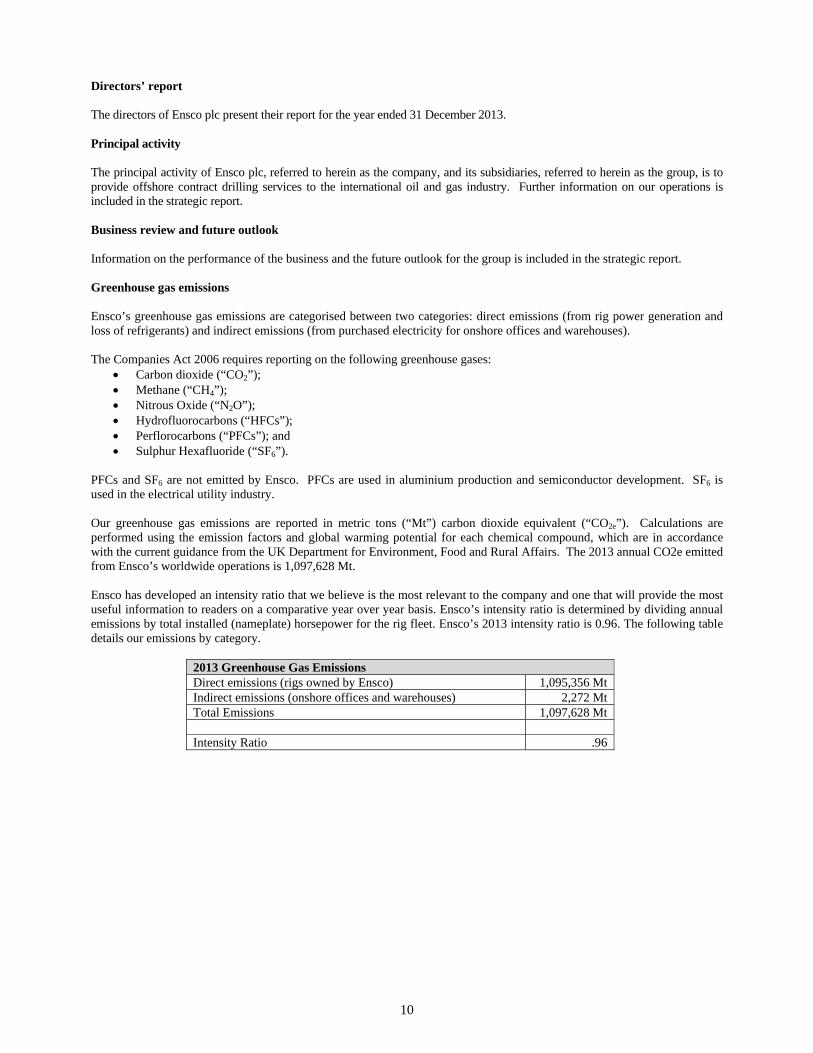
10
Directors’ report The directors of Ensco plc present their report for the year ended 31 December 2013. Principal activity The principal activity of Ensco plc, referred to herein as the company, and its subsidiaries, referred to herein as the group, is to provide offshore contract drilling services to the international oil and gas industry. Further information on our operations is included in the strategic report. Business review and future outlook Information on the performance of the business and the future outlook for the group is included in the strategic report. Greenhouse gas emissions Ensco’s greenhouse gas emissions are categorised between two categories: direct emissions (from rig power generation and loss of refrigerants) and indirect emissions (from purchased electricity for onshore offices and warehouses). The Companies Act 2006 requires reporting on the following greenhouse gases:
Carbon dioxide (“CO2”); Methane (“CH4”); Nitrous Oxide (“N2O”); Hydrofluorocarbons (“HFCs”); Perflorocarbons (“PFCs”); and Sulphur Hexafluoride (“SF6”).
PFCs and SF6 are not emitted by Ensco. PFCs are used in aluminium production and semiconductor development. SF6 is used in the electrical utility industry. Our greenhouse gas emissions are reported in metric tons (“Mt”) carbon dioxide equivalent (“CO2e”). Calculations are performed using the emission factors and global warming potential for each chemical compound, which are in accordance with the current guidance from the UK Department for Environment, Food and Rural Affairs. The 2013 annual CO2e emitted from Ensco’s worldwide operations is 1,097,628 Mt. Ensco has developed an intensity ratio that we believe is the most relevant to the company and one that will provide the most useful information to readers on a comparative year over year basis. Ensco’s intensity ratio is determined by dividing annual emissions by total installed (nameplate) horsepower for the rig fleet. Ensco’s 2013 intensity ratio is 0.96. The following table details our emissions by category.
2013 Greenhouse Gas Emissions Direct emissions (rigs owned by Ensco) 1,095,356 Mt Indirect emissions (onshore offices and warehouses) 2,272 Mt Total Emissions 1,097,628 Mt Intensity Ratio .96
11
Directors’ report (continued) Directors The directors who held office during the year ended 31 December 2013 and up to the date of this report were as follows: Daniel W. Rabun (Chairman) David A. B. Brown J. Roderick Clark Roxanne J. Decyk (appointed 20 May 2013) Mary E. Francis CBE (appointed 20 May 2013) C. Christopher Gaut Gerald W. Haddock Francis S. Kalman Thomas L. Kelly II (resigned 20 May 2013) Keith O. Rattie Rita M. Rodriguez (resigned 20 May 2013) Paul E. Rowsey, III Thomas L. Kelly II and Rita M. Rodriguez retired from the Board on 20 May 2013. David A.B. Brown is retiring from the Board effective as of the Annual General Meeting of Shareholders on 19 May 2014. Third party indemnity provisions The company has granted an indemnity to its directors against liability in respect of proceedings brought by third parties, subject to the conditions set out in section 234 of the UK Companies Act 2006. Such qualifying third party indemnity provision remains in force as at the date of approving the directors’ report. In addition, Ensco Delaware granted an indemnity to Dr. Rodriguez and Messrs. Rabun, Clark, Gaut, Haddock, Kelly, Rattie and Rowsey against liability in respect of proceedings brought by third parties in consideration of Ensco Delaware’s request for service to the company as director, and the Acquired Company granted an indemnity to Messrs. Brown and Kalman against liability in respect of proceedings brought by third parties in consideration of the Acquired Company’s request for service to the company as director. Dividends Dividends declared and paid during the years ended 31 December 2013 and 2012 were $525.6 million ($2.25 per share) and $348.1 million ($1.50 per share), respectively. On 21 March 2014, the company paid a dividend in the amount of $175.3 million ($0.75 per share). Exposure to price, credit, liquidity and cash flow risk Price risk arises on financial instruments because of changes in, for example, equity prices. The group currently is not exposed to any material price risk. Credit risk is the risk that one party to a financial instrument will cause a financial loss for the other party by failing to discharge an obligation. The group is exposed to credit risk relating to its receivables from customers, cash and investments and use of derivatives in connection with the management of foreign currency exchange rate risk. The group minimises its credit risk relating to receivables from customers, which primarily consist of major international, government-owned and independent oil and natural gas companies, by performing ongoing credit evaluations. The group also maintains reserves for potential credit losses, which to date have been within management's expectations. The group minimises its credit risk relating to cash and investments by focusing on diversification and quality of instruments. Cash balances are maintained in major, well-capitalised commercial banks. Cash equivalents consist of a portfolio of high-grade instruments. Custody of cash and cash equivalents is maintained at several major financial institutions, and the group monitors the financial condition of those financial institutions. The group mitigates its credit risk relating to the counterparties of its derivatives by transacting with multiple, high-quality counterparties, thereby limiting exposure to individual counterparties, and by monitoring the financial condition of its counterparties.
12
Directors’ report (continued) Exposure to price, credit, liquidity and cash flow risk (continued) Liquidity risk is the risk that an entity will encounter difficulty in meeting obligations associated with financial liabilities. The group expects to fund its short-term liquidity needs, including contractual obligations and anticipated capital expenditures, as well as any dividends or working capital requirements, from its cash, operating cash flow and funds borrowed under its commercial paper programme and/or credit facility. The group expects to fund its long-term liquidity needs, including contractual obligations, anticipated capital expenditures and dividends, from its cash and cash equivalents, operating cash flow and, if necessary, funds borrowed under its credit facility or other future financing arrangements. The group may decide to access debt markets to raise additional capital or increase liquidity as necessary. Cash flow risk is the risk of exposure to variability in cash flows that is attributable to a particular risk associated with a recognised asset or liability such as changes in foreign currency exchange rates. The group manages this risk by use of derivatives as explained below. Use of derivatives The functional currency of a substantial portion of the group’s companies is the U.S. dollar. As is customary in the oil and natural gas industry, a majority of the group’s turnover is denominated in U.S. dollars, however, a portion of the expenses incurred by its non-U.S. subsidiaries are denominated in currencies other than the U.S. dollar ("foreign currencies"). The group uses foreign currency forward contracts to reduce exposure to various market risks, primarily foreign currency exchange rate risk. The group maintains a foreign currency risk management strategy that utilises derivatives to reduce the group’s exposure to unanticipated fluctuations in earnings and cash flows caused by changes in foreign currency exchange rates. Although no interest rate related derivatives were outstanding at 31 December 2013 and 2012, the group occasionally employs an interest rate risk management strategy that utilises derivative instruments to minimise or eliminate unanticipated fluctuations in earnings and cash flows arising from changes in, and volatility of, interest rates. Policy and practice on payment of creditors Statutory regulations issued under the UK Companies Act 2006 require companies to make a statement of their policy and practice in respect of the payment of trade creditors. Individual operating companies are responsible for agreeing terms and conditions for their business transactions and ensuring that suppliers are aware of the terms of payment. At the year end there were 24 days (2012: 27 days) of purchases in trade creditors.
Political and charitable contributions
The company did not make any political contributions during the year. The company made charitable contributions of $0.8 million during the year. Disclosure of information to auditors The directors who held office at the date of approval of this directors’ report confirm that, so far as they are each aware, there is no relevant audit information of which the company’s auditors are unaware; and each director has taken all the steps that they ought to have taken as a director to make themselves aware of any relevant audit information and to establish that the company’s auditors are aware of that information. Auditors In accordance with Section 489 of the UK Companies Act 2006, a resolution for the re-appointment of KPMG Audit Plc as statutory auditors of the company is to be proposed at the forthcoming annual general meeting. By order of the board /s/ Daniel W. Rabun Daniel W. Rabun Chairman, Director, President and Chief Executive Officer
6 Chesterfield Gardens London
W1J 5BQ 28 March 2014
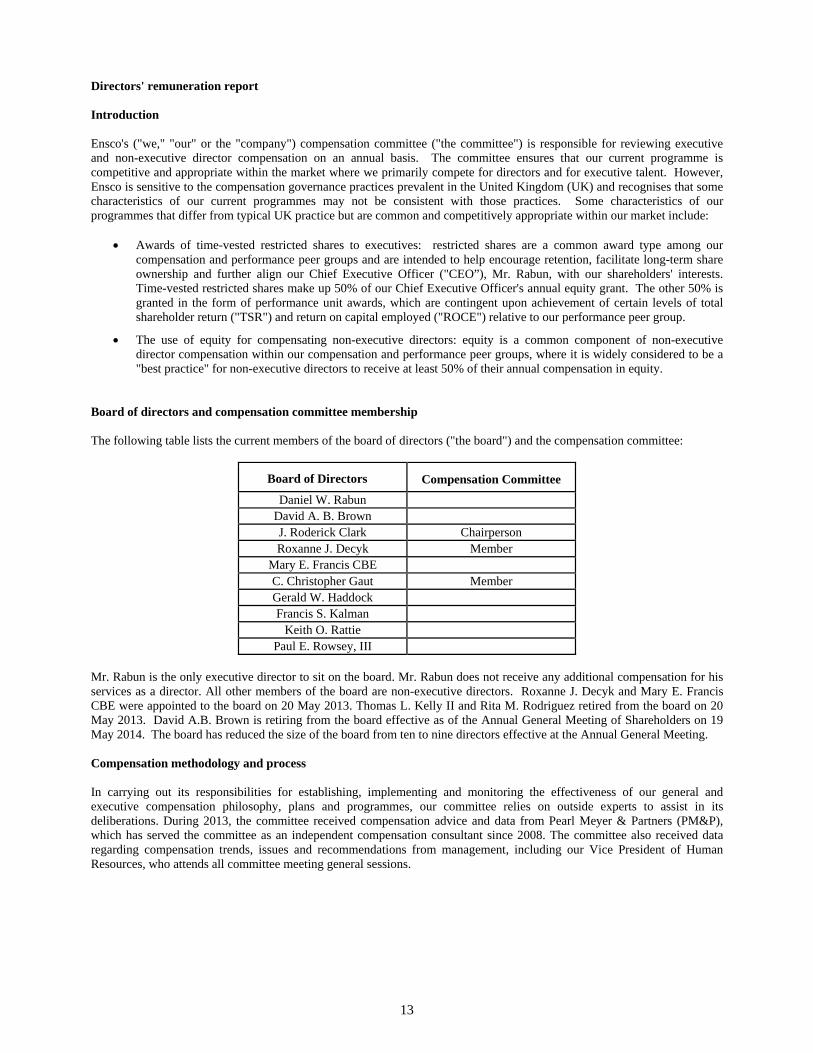
13
Directors' remuneration report Introduction Ensco's ("we," "our" or the "company") compensation committee ("the committee") is responsible for reviewing executive and non-executive director compensation on an annual basis. The committee ensures that our current programme is competitive and appropriate within the market where we primarily compete for directors and for executive talent. However, Ensco is sensitive to the compensation governance practices prevalent in the United Kingdom (UK) and recognises that some characteristics of our current programmes may not be consistent with those practices. Some characteristics of our programmes that differ from typical UK practice but are common and competitively appropriate within our market include:
Awards of time-vested restricted shares to executives: restricted shares are a common award type among our compensation and performance peer groups and are intended to help encourage retention, facilitate long-term share ownership and further align our Chief Executive Officer ("CEO”), Mr. Rabun, with our shareholders' interests. Time-vested restricted shares make up 50% of our Chief Executive Officer's annual equity grant. The other 50% is granted in the form of performance unit awards, which are contingent upon achievement of certain levels of total shareholder return ("TSR") and return on capital employed ("ROCE") relative to our performance peer group.
The use of equity for compensating non-executive directors: equity is a common component of non-executive director compensation within our compensation and performance peer groups, where it is widely considered to be a "best practice" for non-executive directors to receive at least 50% of their annual compensation in equity.
Board of directors and compensation committee membership The following table lists the current members of the board of directors ("the board") and the compensation committee:
Board of Directors Compensation Committee
Daniel W. Rabun David A. B. Brown J. Roderick Clark Chairperson Roxanne J. Decyk Member
Mary E. Francis CBE C. Christopher Gaut Member Gerald W. Haddock Francis S. Kalman
Keith O. Rattie Paul E. Rowsey, III
Mr. Rabun is the only executive director to sit on the board. Mr. Rabun does not receive any additional compensation for his services as a director. All other members of the board are non-executive directors. Roxanne J. Decyk and Mary E. Francis CBE were appointed to the board on 20 May 2013. Thomas L. Kelly II and Rita M. Rodriguez retired from the board on 20 May 2013. David A.B. Brown is retiring from the board effective as of the Annual General Meeting of Shareholders on 19 May 2014. The board has reduced the size of the board from ten to nine directors effective at the Annual General Meeting. Compensation methodology and process In carrying out its responsibilities for establishing, implementing and monitoring the effectiveness of our general and executive compensation philosophy, plans and programmes, our committee relies on outside experts to assist in its deliberations. During 2013, the committee received compensation advice and data from Pearl Meyer & Partners (PM&P), which has served the committee as an independent compensation consultant since 2008. The committee also received data regarding compensation trends, issues and recommendations from management, including our Vice President of Human Resources, who attends all committee meeting general sessions.
14
Directors' remuneration report (continued) Compensation methodology and process (continued) PM&P was engaged by the committee to provide counsel regarding our compensation philosophy and practices, including executive and non-executive director compensation. Regarding executive compensation, the services provided included a review of the principal components of compensation (base salary, cash bonus and long-term incentives), peer group selection (both compensation and performance peers), pay for performance assessment, and short-term and long-term incentive plan design. In respect of non-executive director compensation, PM&P reviewed the company's philosophy and practices regarding general board compensation, committee compensation, committee chair compensation and non-executive director equity award programmes. PM&P provided the committee with comparative market assessments of CEO and non-executive director compensation levels, including information relative to compensation trends and prevailing practices. The committee regularly reviews the services provided by its outside consultants and believes that PM&P is independent in providing executive compensation consulting services. We compete for executive-level talent with oilfield service companies as well as other industries and professions. Comparative salary data are obtained from several sources, including PM&P, industry-specific surveys, and compensation peer company proxy statements filed with the U.S. Securities and Exchange Commission. The committee reviews the composition of the compensation and performance peer groups. Our compensation peer group, which was approved by the committee for 2013 in consultation with PM&P, was composed of 13 drilling and oilfield services companies of a similar overall size and historical financial performance. The compensation peer group for 2013 was the same as our compensation peer group for 2012. Compensation risk The committee carefully considers the relationship between risk and our overall compensation policies, programmes and practices for the CEO and non-executive directors. The committee continually monitors the company's general compensation practices, specifically the design, administration and assessment of our incentive plans, to identify any components, measurement factors or potential outcomes that might create an incentive for excessive risk-taking detrimental to the company. The committee has determined that the company's compensation plans and policies do not encourage excessive risk-taking. The committee also paid particular attention to potential unintended consequences associated with the establishment of the Ensco Cash Incentive Plan ("ECIP") and performance unit award goals and related measurement criteria under the Long Term Incentive Plans ("LTIPs"). In formulating such goals and performance criteria, the committee focused on matters such as safety performance, financial performance, relative TSR, absolute and relative ROCE and Strategic Team Goals ("STGs"). The committee determined that such goals and performance criteria did not encourage participation in high-risk activities that are reasonably likely to have a material adverse effect on the company. In addition, the committee believes that there are numerous good governance characteristics of our compensation programmes that serve to mitigate excessive risk taking. We have compensation recoupment policies in place in the ECIP and through our LTIPs. The committee will seek to claw back or reduce the size of cash incentive awards or proceeds from equity incentive awards for Mr. Rabun, if he violates our Code of Business Conduct Policy, or in the case of certain financial restatements (including application of the provisions of the Sarbanes-Oxley Act of 2002, as amended, in the event of a restatement of our earnings). Total shareholder return The chart below presents a comparison of the five-year cumulative total return, assuming $100 invested on 31 December 2008 and the reinvestment of dividends, for our shares, the Standard & Poor's 500 Stock Price Index and the Dow Jones U.S. Oil Equipment & Services Index.* The Standard & Poor's 500 Stock Price Index has been chosen as a broad equity market index of which the company has been a constituent member throughout the year ended 31 December 2013.
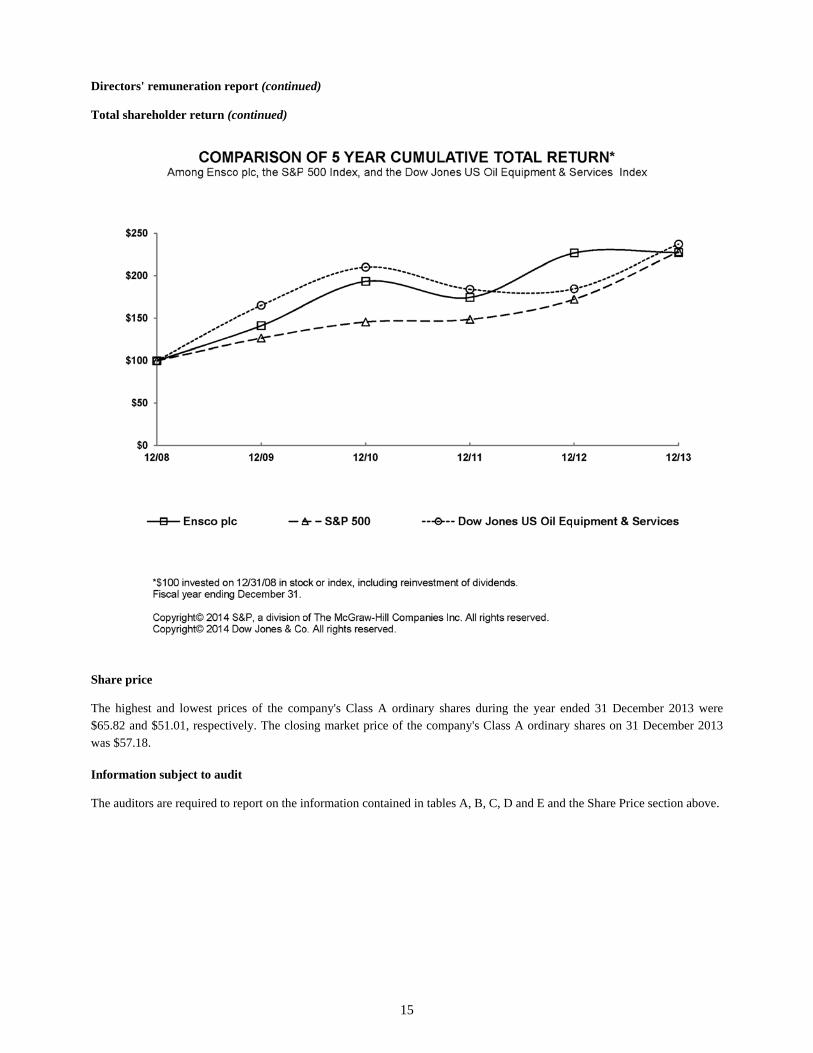
Di To
Sh Th$6wa In Th
irectors' rem
otal sharehold
hare price
he highest and65.82 and $51as $57.18.
nformation su
he auditors are
uneration rep
der return (c
d lowest pric.01, respectiv
ubject to audi
e required to r
port (continu
continued)
ces of the comvely. The clos
it
report on the i
ued)
mpany's Classsing market pr
nformation co
15
s A ordinary rice of the co
ontained in tab
shares duringmpany's Clas
bles A, B, C, D
g the year ends A ordinary
D and E and th
ded 31 Decemshares on 31
he Share Price
mber 2013 wDecember 20
e section abov
were 013
ve.
16
Directors' remuneration report (continued) Remuneration of executive director Our Chairman and CEO, our only executive director, does not receive any additional compensation for his services as a director. The table below summarises the CEO’s total remuneration, annual bonus payout and performance unit awards vesting as a percentage of maximum opportunity for the current year and previous four years.
2013 2012 2011 2010 2009
Total Remuneration $ 11,383,983
$ 9,297,459
$ 10,574,713
$ 7,152,858
$ 4,619,128
Annual Bonus as a Percentage of Maximum 54% 77% 61% 68 % 66%Performance Awards Vesting as a Percentage of Maximum 40% 66% 43% 77 % 57% The compensation paid to him for the years ended 31 December 2013 and 2012 is reported in the tables below.
CEO Compensation – Table A
Year
Salary and Fees
($)
Taxable Benefits
($)(1) Annual Incentives
($)(2)
Long-Term Incentives
($)(3) Other ($)(4)
Total ($)
2013 1,042,500 971,546 3,786,457 2,007,250 3,576,230 11,383,983
2012 975,000 910,316 3,758,041 2,588,423 1,065,679 9,297,459
(1) Taxable benefits provided to our executive director includes the following:
Year
Group Term Life Insurance
Dividends on Non- Vested
Restricted Share
Awards
Cost of Living
Allowance
Foreign Service
PremiumHousing
AllowanceTransportation
Allowance Other Total
2013 $ 10,062 $ 273,659
$ 148,790 $ 156,375 $ 334,445 $ 31,785 $ 16,430
$ 971,546
2012 $ 10,062 $ 237,458
$ 150,661 $ 146,250 $ 327,380 $ 34,112 $ 4,393
$ 910,316
(2) The amounts disclosed in this column represent the aggregate grant-date fair value of restricted share awards granted
during the respective year and bonuses awarded for the respective years pursuant to the ECIP. Amounts disclosed in this column related to annual bonus include amounts voluntarily deferred under the SERP. Mr. Rabun voluntarily deferred 100% of his bonus into his SERP account during 2013 and 2012.
(3) The amounts disclosed in this column represent cash paid to Mr. Rabun in connection with the settlement of performance
unit awards granted during 2011 and 2010 for the respective three-year performance periods.
(4) Other benefits provided to our executive director include the following:
Year
Ensco Savings
Plan
Profit Sharing
Plan SERP Tax
Equalisation Total
2013 $ 12,750 $ 104,251 $ 39,375 $ 3,419,854 $ 3,576,230
2012 $ 12,500 $ 97,500 $ 36,250 $ 919,429 $ 1,065,679
17
Directors' remuneration report (continued) Remuneration of executive director (continued)
Performance Unit Awards – Table B The following table sets forth information regarding performance unit awards outstanding at the beginning and end of the year ended 31 December 2013 for our CEO:
Date of Grant
End of Period Over Which Qualifying Conditions
Must be Fulfilled for
Each Award(1)
Grant-date Fair Value of Performance
Unit Awards at Beginning
of FY ($)(2)(3)(4)
Grant-date Fair Value of Performance Unit Awards
Granted During the FY ($)(2)(3)(4)
Actual Payout Related to Awards
Which Vested During the FY
($)
Grant-date Fair Value of Performance
Unit Awards at End of FY
($)(2)(3)(4)
1/3/2011 31/12/2013 648,675 - 1,548,450 (5) -
25/7/2011 31/12/2013 270,320 - 458,800 (5) -
28/2/2012 31/12/2014 1,912,500 - N/A 1,912,500
25/2/2013 31/12/2015 - 2,843,740 N/A 2,843,740
(1) Performance unit awards are measured over a three-year performance period. Any amounts earned under the
performance unit awards are not payable until after the close of the performance period. Performance awards are subject to forfeiture if the recipient leaves the company prior to award payout.
(2) Grant-date fair value for performance unit awards is measured using the estimated probable payout on the date of grant.
The performance unit awards are based upon financial performance measurements, each measured over the three-year performance period. The awards granted during 2013 are denominated in company shares and will be settled in company shares upon attainment of specified performance goals based on relative TSR and relative ROCE. The awards granted prior to 2013 may be settled in company shares, cash or combination thereof at the committee's discretion upon attainment of specified performance goals based on relative TSR, relative ROCE and absolute ROCE. The goals for the performance unit awards granted have three performance bands: a threshold, a target and a maximum. If the minimum threshold for the respective financial performance measure is not met, no amount will be paid for that component. Payments are calculated using straight-line interpolation for performance between the threshold and target and between the target and maximum for each component.
The resulting threshold, target and maximum estimated possible payouts for Mr. Rabun for the performance unit awards granted under the LTIP during 2011 for the performance period beginning 1 January 2011 and ending 31 December 2013 were as follows:
Threshold Target Maximum
$ 488,250 $ 2,170,000 $ 5,056,100 (3) In respect of the performance unit awards, TSR is defined as dividends paid during the performance period plus the
ending share price of the performance period minus the beginning share price of the performance period, divided by the beginning share price of the performance period. Beginning and ending share prices are based on the average closing prices during the quarter preceding the performance period and the final quarter of the performance period, respectively. ROCE is defined as net income, adjusted for any nonrecurring gains and losses, plus after-tax net interest expense, divided by total equity as of 1 January of the respective year plus the average of the long-term debt balances as of 1 January and 31 December of the respective year.
(4) The company's relative performance is evaluated against a group of nine performance peer companies, consisting of Atwood Oceanics, Inc., Diamond Offshore Drilling, Inc., Helmerich & Payne, Inc., Hercules Offshore, Inc., Nabors Industries Ltd., Noble Corporation, Parker Drilling Company, Rowan Companies plc and Transocean Ltd.
(5) The performance unit award for the performance period beginning 1 January 2011 and ending 31 December 2013 is expected to be paid in cash in April 2014, subject to the committee's final review and approval.
18
Directors' remuneration report (continued)
Remuneration of non-executive directors
Total non-employee director compensation generally is intended to approximate the median of our compensation peer group companies. The committee uses a combination of cash and equity compensation to attract and retain qualified candidates to serve on the board. Our 2012 LTIP provides that non-employee directors receive an automatic annual grant of equity compensation following each annual general meeting of shareholders. In accordance with the compensation policy, restricted share units equivalent to an aggregate value of $250,000, based on the closing price of the company's shares on the date of grant, were granted to our non-employee directors effective 1 June 2013. Prior to 2011, the company granted restricted shares to non-employee directors which vest (restriction lapse) at a rate of 20% each year over a five-year period or upon retirement from the board. During 2011, the company began granting restricted share units in place of restricted shares to non-employee directors. Restricted share units vest (restrictions lapse) at a rate of 33.3% each year over a three-year period or upon retirement from the board.
Equity accumulation by our non-executive directors is encouraged, and we have specific security ownership guidelines, which are included in the Ensco Corporate Governance Policy. The policy provides that each non-executive director, within five years of appointment to the board, should hold a number of shares of the company having a fair market value of at least five times the director's annual retainer. Each of our directors is in compliance with these guidelines.
Under the Non-Employee Director Deferred Compensation Plan, our non-executive directors could elect to defer a portion of their cash compensation. Non-executive directors are eligible to participate in our U.S. and UK group health and welfare insurance plans on the same basis and cost as our full-time employees. A non-executive director's contribution to group health and welfare insurance premium costs is paid in cash or withheld from the quarterly instalments of the director's annual retainer. The compensation paid to the non-executive directors for the years ended 31 December 2013 and 2012 is reported in the table below.
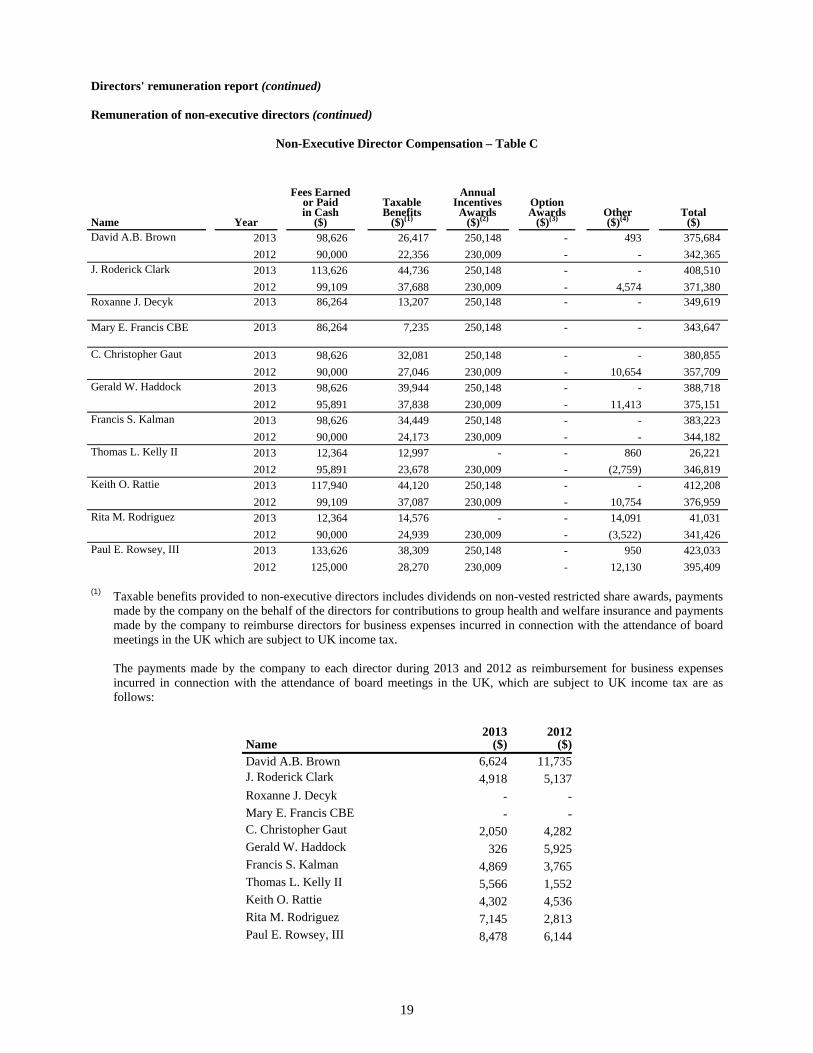
19
Directors' remuneration report (continued) Remuneration of non-executive directors (continued)
Non-Executive Director Compensation – Table C
Name Year
Fees Earnedor Paid in Cash
($)
Taxable Benefits
($)(1)
Annual Incentives
Awards ($)(2)
Option Awards
($)(3)
Other ($)(4)
Total ($)
David A.B. Brown 2013 98,626 26,417 250,148 - 493 375,684 2012 90,000 22,356 230,009 - - 342,365
J. Roderick Clark 2013 113,626 44,736 250,148 - - 408,510 2012 99,109 37,688 230,009 - 4,574 371,380
Roxanne J. Decyk 2013 86,264 13,207 250,148 - - 349,619
Mary E. Francis CBE 2013 86,264 7,235 250,148 - - 343,647
C. Christopher Gaut 2013 98,626 32,081 250,148 - - 380,855 2012 90,000 27,046 230,009 - 10,654 357,709
Gerald W. Haddock 2013 98,626 39,944 250,148 - - 388,718 2012 95,891 37,838 230,009 - 11,413 375,151
Francis S. Kalman 2013 98,626 34,449 250,148 - - 383,223 2012 90,000 24,173 230,009 - - 344,182
Thomas L. Kelly II 2013 12,364 12,997 - - 860 26,221 2012 95,891 23,678 230,009 - (2,759) 346,819
Keith O. Rattie 2013 117,940 44,120 250,148 - - 412,208 2012 99,109 37,087 230,009 - 10,754 376,959
Rita M. Rodriguez 2013 12,364 14,576 - - 14,091 41,031 2012 90,000 24,939 230,009 - (3,522) 341,426
Paul E. Rowsey, III 2013 133,626 38,309 250,148 - 950 423,033 2012 125,000 28,270 230,009 - 12,130 395,409
(1) Taxable benefits provided to non-executive directors includes dividends on non-vested restricted share awards, payments
made by the company on the behalf of the directors for contributions to group health and welfare insurance and payments made by the company to reimburse directors for business expenses incurred in connection with the attendance of board meetings in the UK which are subject to UK income tax. The payments made by the company to each director during 2013 and 2012 as reimbursement for business expenses incurred in connection with the attendance of board meetings in the UK, which are subject to UK income tax are as follows:
Name 2013
($)2012
($)David A.B. Brown 6,624 11,735J. Roderick Clark 4,918 5,137Roxanne J. Decyk - -Mary E. Francis CBE - -C. Christopher Gaut 2,050 4,282Gerald W. Haddock 326 5,925Francis S. Kalman 4,869 3,765Thomas L. Kelly II 5,566 1,552Keith O. Rattie 4,302 4,536Rita M. Rodriguez 7,145 2,813Paul E. Rowsey, III 8,478 6,144
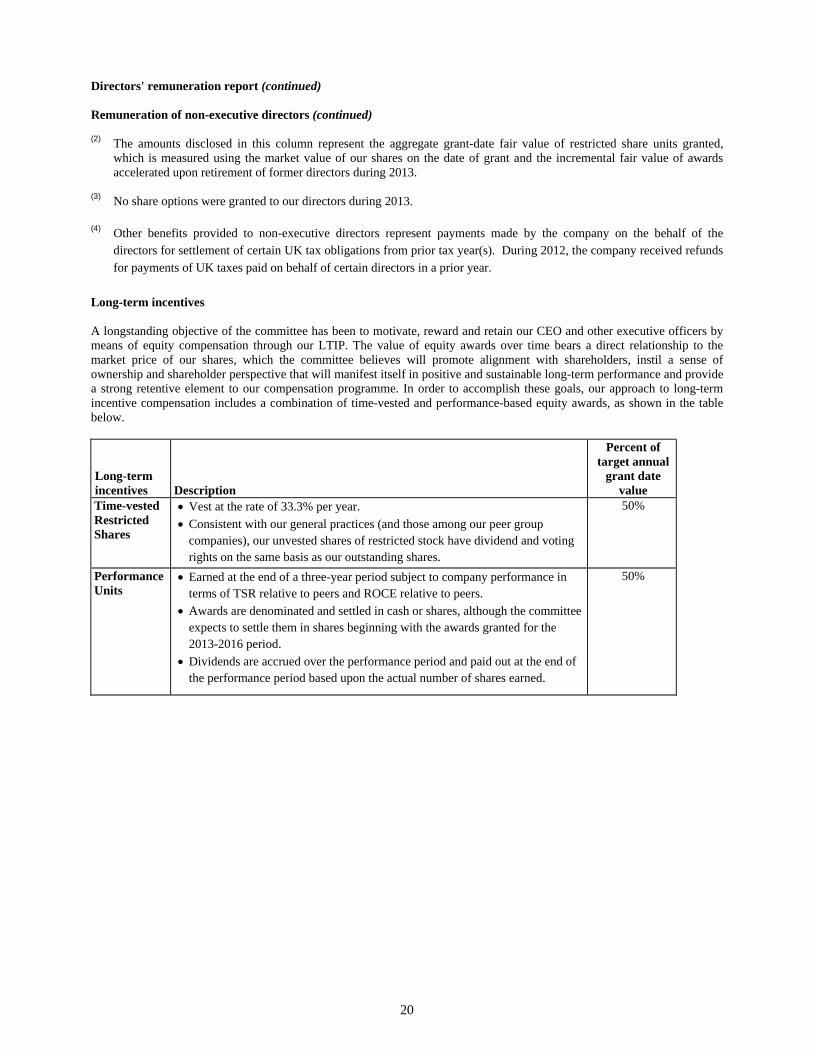
20
Directors' remuneration report (continued) Remuneration of non-executive directors (continued) (2) The amounts disclosed in this column represent the aggregate grant-date fair value of restricted share units granted,
which is measured using the market value of our shares on the date of grant and the incremental fair value of awards accelerated upon retirement of former directors during 2013.
(3) No share options were granted to our directors during 2013.
(4) Other benefits provided to non-executive directors represent payments made by the company on the behalf of the
directors for settlement of certain UK tax obligations from prior tax year(s). During 2012, the company received refunds for payments of UK taxes paid on behalf of certain directors in a prior year.
Long-term incentives A longstanding objective of the committee has been to motivate, reward and retain our CEO and other executive officers by means of equity compensation through our LTIP. The value of equity awards over time bears a direct relationship to the market price of our shares, which the committee believes will promote alignment with shareholders, instil a sense of ownership and shareholder perspective that will manifest itself in positive and sustainable long-term performance and provide a strong retentive element to our compensation programme. In order to accomplish these goals, our approach to long-term incentive compensation includes a combination of time-vested and performance-based equity awards, as shown in the table below.
Long-term incentives Description
Percent of target annual
grant date value
Time-vested Restricted Shares
Vest at the rate of 33.3% per year.
Consistent with our general practices (and those among our peer group companies), our unvested shares of restricted stock have dividend and voting rights on the same basis as our outstanding shares.
50%
Performance Units
Earned at the end of a three-year period subject to company performance in terms of TSR relative to peers and ROCE relative to peers.
Awards are denominated and settled in cash or shares, although the committee expects to settle them in shares beginning with the awards granted for the 2013-2016 period.
Dividends are accrued over the performance period and paid out at the end of the performance period based upon the actual number of shares earned.
50%
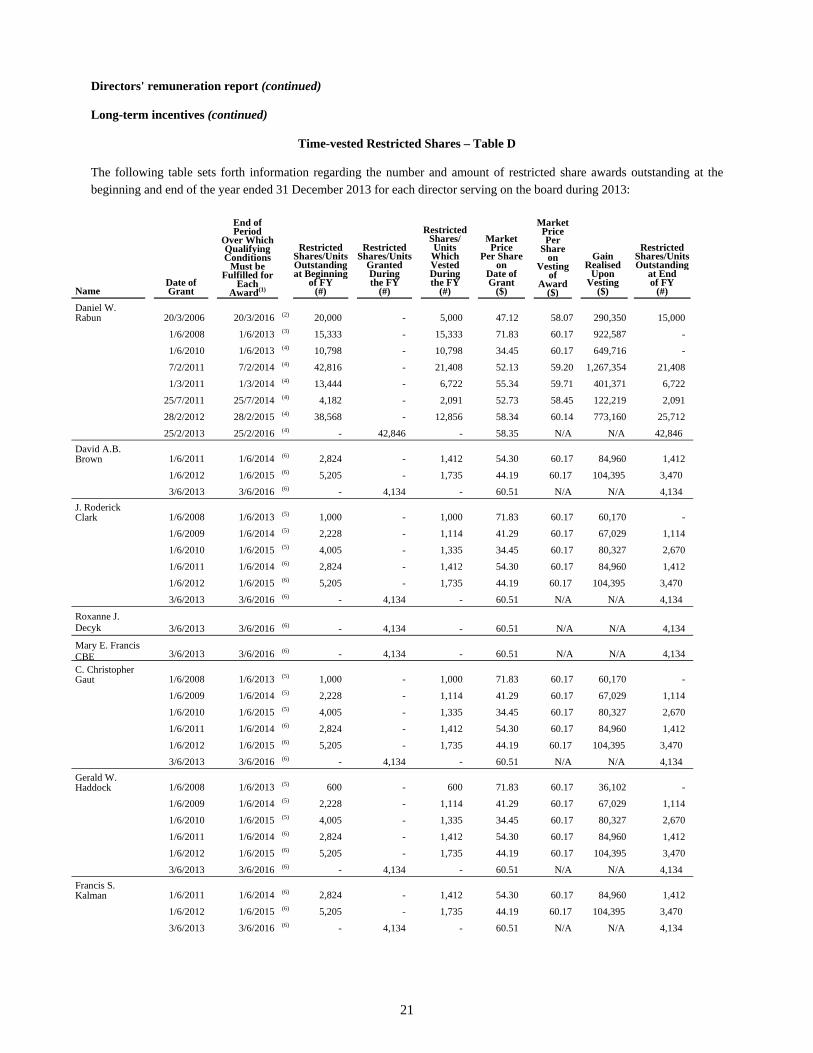
21
Directors' remuneration report (continued) Long-term incentives (continued)
Time-vested Restricted Shares – Table D The following table sets forth information regarding the number and amount of restricted share awards outstanding at the beginning and end of the year ended 31 December 2013 for each director serving on the board during 2013:
Name
Date of Grant
End of Period
Over Which Qualifying Conditions
Must be Fulfilled for
Each Award(1)
Restricted Shares/Units Outstandingat Beginning
of FY (#)
Restricted Shares/Units
Granted During the FY
(#)
Restricted Shares/ Units
Which Vested During the FY
(#)
Market Price
Per Share on
Date of Grant
($)
Market Price Per
Share on
Vesting of
Award ($)
Gain Realised
Upon Vesting
($)
Restricted Shares/Units Outstanding
at End of FY
(#)
Daniel W. Rabun
20/3/2006 20/3/2016 (2) 20,000 - 5,000 47.12 58.07 290,350 15,000
1/6/2008 1/6/2013 (3) 15,333 - 15,333 71.83 60.17 922,587 -
1/6/2010 1/6/2013 (4) 10,798 - 10,798 34.45 60.17 649,716 -
7/2/2011 7/2/2014 (4) 42,816 - 21,408 52.13 59.20 1,267,354 21,408
1/3/2011 1/3/2014 (4) 13,444 - 6,722 55.34 59.71 401,371 6,722
25/7/2011 25/7/2014 (4) 4,182 - 2,091 52.73 58.45 122,219 2,091
28/2/2012 28/2/2015 (4) 38,568 - 12,856 58.34 60.14 773,160 25,712
25/2/2013 25/2/2016 (4) - 42,846 - 58.35 N/A N/A 42,846
David A.B. Brown
1/6/2011 1/6/2014 (6) 2,824 - 1,412 54.30 60.17 84,960 1,412
1/6/2012 1/6/2015 (6) 5,205 - 1,735 44.19 60.17 104,395 3,470
3/6/2013 3/6/2016 (6) - 4,134 - 60.51 N/A N/A 4,134
J. Roderick Clark
1/6/2008 1/6/2013 (5) 1,000 - 1,000 71.83 60.17 60,170 -
1/6/2009 1/6/2014 (5) 2,228 - 1,114 41.29 60.17 67,029 1,114
1/6/2010 1/6/2015 (5) 4,005 - 1,335 34.45 60.17 80,327 2,670
1/6/2011 1/6/2014 (6) 2,824 - 1,412 54.30 60.17 84,960 1,412
1/6/2012 1/6/2015 (6) 5,205 - 1,735 44.19 60.17 104,395 3,470
3/6/2013 3/6/2016 (6) - 4,134 - 60.51 N/A N/A 4,134
Roxanne J. Decyk
3/6/2013 3/6/2016 (6) - 4,134 - 60.51 N/A N/A 4,134
Mary E. Francis CBE
3/6/2013 3/6/2016 (6) - 4,134 - 60.51 N/A N/A 4,134
C. Christopher Gaut
1/6/2008 1/6/2013 (5) 1,000 - 1,000 71.83 60.17 60,170 -
1/6/2009 1/6/2014 (5) 2,228 - 1,114 41.29 60.17 67,029 1,114
1/6/2010 1/6/2015 (5) 4,005 - 1,335 34.45 60.17 80,327 2,670
1/6/2011 1/6/2014 (6) 2,824 - 1,412 54.30 60.17 84,960 1,412
1/6/2012 1/6/2015 (6) 5,205 - 1,735 44.19 60.17 104,395 3,470
3/6/2013 3/6/2016 (6) - 4,134 - 60.51 N/A N/A 4,134
Gerald W. Haddock
1/6/2008 1/6/2013 (5) 600 - 600 71.83 60.17 36,102 -
1/6/2009 1/6/2014 (5) 2,228 - 1,114 41.29 60.17 67,029 1,114
1/6/2010 1/6/2015 (5) 4,005 - 1,335 34.45 60.17 80,327 2,670
1/6/2011 1/6/2014 (6) 2,824 - 1,412 54.30 60.17 84,960 1,412
1/6/2012 1/6/2015 (6) 5,205 - 1,735 44.19 60.17 104,395 3,470
3/6/2013 3/6/2016 (6) - 4,134 - 60.51 N/A N/A 4,134
Francis S. Kalman
1/6/2011 1/6/2014 (6) 2,824 - 1,412 54.30 60.17 84,960 1,412
1/6/2012 1/6/2015 (6) 5,205 - 1,735 44.19 60.17 104,395 3,470
3/6/2013 3/6/2016 (6) - 4,134 - 60.51 N/A N/A 4,134
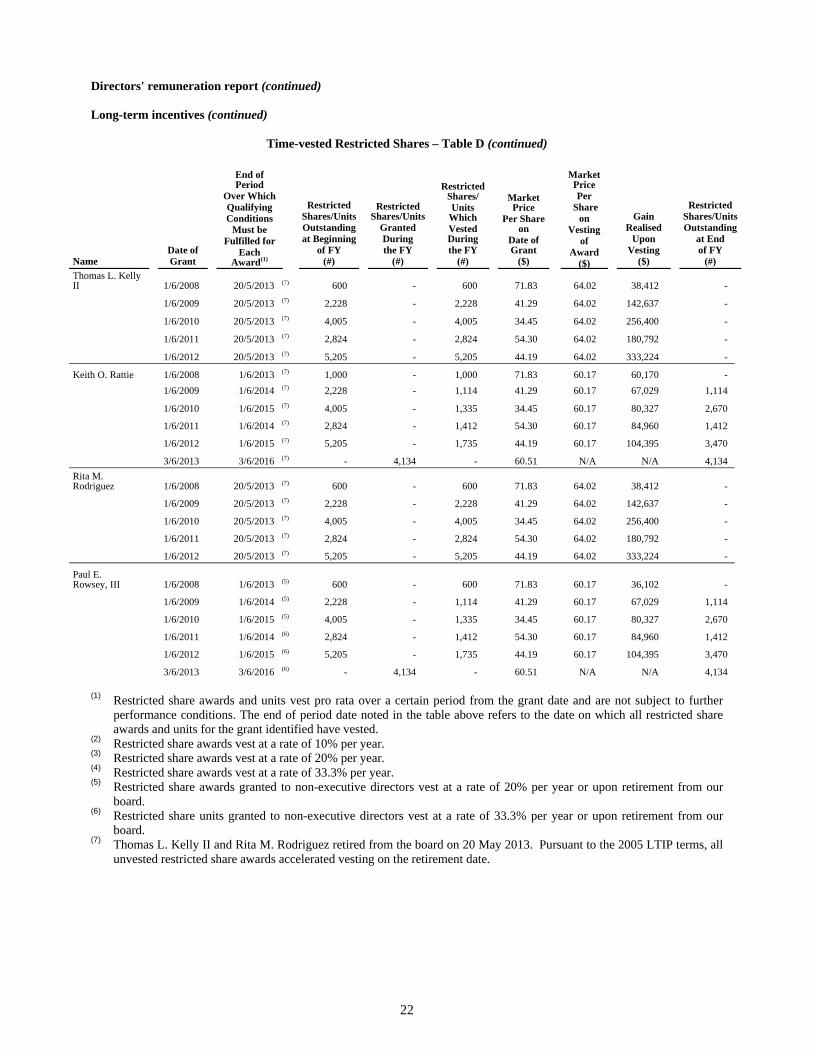
22
Directors' remuneration report (continued) Long-term incentives (continued)
Time-vested Restricted Shares – Table D (continued)
(1) Restricted share awards and units vest pro rata over a certain period from the grant date and are not subject to further
performance conditions. The end of period date noted in the table above refers to the date on which all restricted share awards and units for the grant identified have vested.
(2) Restricted share awards vest at a rate of 10% per year. (3) Restricted share awards vest at a rate of 20% per year. (4) Restricted share awards vest at a rate of 33.3% per year. (5) Restricted share awards granted to non-executive directors vest at a rate of 20% per year or upon retirement from our
board. (6) Restricted share units granted to non-executive directors vest at a rate of 33.3% per year or upon retirement from our
board. (7) Thomas L. Kelly II and Rita M. Rodriguez retired from the board on 20 May 2013. Pursuant to the 2005 LTIP terms, all
unvested restricted share awards accelerated vesting on the retirement date.
Name
Date of Grant
End of Period
Over Which Qualifying Conditions
Must be Fulfilled for
Each Award(1)
Restricted Shares/UnitsOutstandingat Beginning
of FY (#)
Restricted Shares/Units
Granted During the FY
(#)
Restricted Shares/ Units
Which Vested During the FY
(#)
Market Price
Per Share on
Date of Grant
($)
Market Price Per
Share on
Vesting of
Award ($)
Gain Realised
Upon Vesting
($)
Restricted Shares/UnitsOutstanding
at End of FY
(#)
Thomas L. Kelly II 1/6/2008 20/5/2013 (7) 600 - 600 71.83 64.02 38,412 -
1/6/2009 20/5/2013 (7) 2,228 - 2,228 41.29 64.02 142,637 -
1/6/2010 20/5/2013 (7) 4,005 - 4,005 34.45 64.02 256,400 -
1/6/2011 20/5/2013 (7) 2,824 - 2,824 54.30 64.02 180,792 -
1/6/2012 20/5/2013 (7) 5,205 - 5,205 44.19 64.02 333,224 -
Keith O. Rattie 1/6/2008 1/6/2013 (7) 1,000 - 1,000 71.83 60.17 60,170 -
1/6/2009 1/6/2014 (7) 2,228 - 1,114 41.29 60.17 67,029 1,114
1/6/2010 1/6/2015 (7) 4,005 - 1,335 34.45 60.17 80,327 2,670
1/6/2011 1/6/2014 (7) 2,824 - 1,412 54.30 60.17 84,960 1,412
1/6/2012 1/6/2015 (7) 5,205 - 1,735 44.19 60.17 104,395 3,470
3/6/2013 3/6/2016 (7) - 4,134 - 60.51 N/A N/A 4,134
Rita M. Rodriguez 1/6/2008 20/5/2013 (7) 600 - 600 71.83 64.02 38,412 -
1/6/2009 20/5/2013 (7) 2,228 - 2,228 41.29 64.02 142,637 -
1/6/2010 20/5/2013 (7) 4,005 - 4,005 34.45 64.02 256,400 -
1/6/2011 20/5/2013 (7) 2,824 - 2,824 54.30 64.02 180,792 -
1/6/2012 20/5/2013 (7) 5,205 - 5,205 44.19 64.02 333,224 -
Paul E. Rowsey, III 1/6/2008 1/6/2013 (5) 600 - 600 71.83 60.17 36,102 -
1/6/2009 1/6/2014 (5) 2,228 - 1,114 41.29 60.17 67,029 1,114
1/6/2010 1/6/2015 (5) 4,005 - 1,335 34.45 60.17 80,327 2,670
1/6/2011 1/6/2014 (6) 2,824 - 1,412 54.30 60.17 84,960 1,412
1/6/2012 1/6/2015 (6) 5,205 - 1,735 44.19 60.17 104,395 3,470
3/6/2013 3/6/2016 (6) - 4,134 - 60.51 N/A N/A 4,134
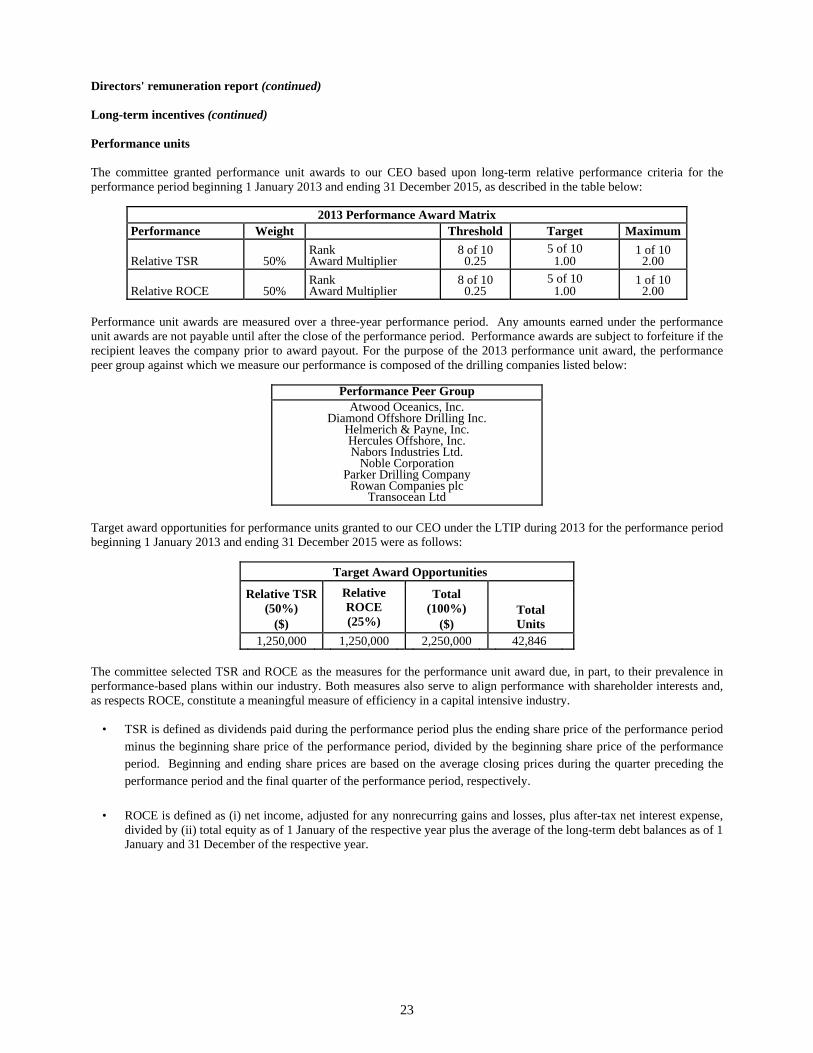
23
Directors' remuneration report (continued) Long-term incentives (continued) Performance units The committee granted performance unit awards to our CEO based upon long-term relative performance criteria for the performance period beginning 1 January 2013 and ending 31 December 2015, as described in the table below:
2013 Performance Award Matrix
Performance Weight Threshold Target Maximum
Relative TSR 50% Rank Award Multiplier
8 of 10 0.25
5 of 10 1.00
1 of 10 2.00
Relative ROCE 50% Rank Award Multiplier
8 of 10 0.25
5 of 10 1.00
1 of 10 2.00
Performance unit awards are measured over a three-year performance period. Any amounts earned under the performance unit awards are not payable until after the close of the performance period. Performance awards are subject to forfeiture if the recipient leaves the company prior to award payout. For the purpose of the 2013 performance unit award, the performance peer group against which we measure our performance is composed of the drilling companies listed below:
Performance Peer GroupAtwood Oceanics, Inc.
Diamond Offshore Drilling Inc. Helmerich & Payne, Inc. Hercules Offshore, Inc. Nabors Industries Ltd.
Noble Corporation Parker Drilling Company
Rowan Companies plc Transocean Ltd
Target award opportunities for performance units granted to our CEO under the LTIP during 2013 for the performance period beginning 1 January 2013 and ending 31 December 2015 were as follows:
Target Award Opportunities
Relative TSR (50%)
($)
Relative ROCE (25%)
Total (100%)
($) Total Units
1,250,000 1,250,000 2,250,000 42,846
The committee selected TSR and ROCE as the measures for the performance unit award due, in part, to their prevalence in performance-based plans within our industry. Both measures also serve to align performance with shareholder interests and, as respects ROCE, constitute a meaningful measure of efficiency in a capital intensive industry.
• TSR is defined as dividends paid during the performance period plus the ending share price of the performance period minus the beginning share price of the performance period, divided by the beginning share price of the performance period. Beginning and ending share prices are based on the average closing prices during the quarter preceding the performance period and the final quarter of the performance period, respectively.
• ROCE is defined as (i) net income, adjusted for any nonrecurring gains and losses, plus after-tax net interest expense, divided by (ii) total equity as of 1 January of the respective year plus the average of the long-term debt balances as of 1 January and 31 December of the respective year.
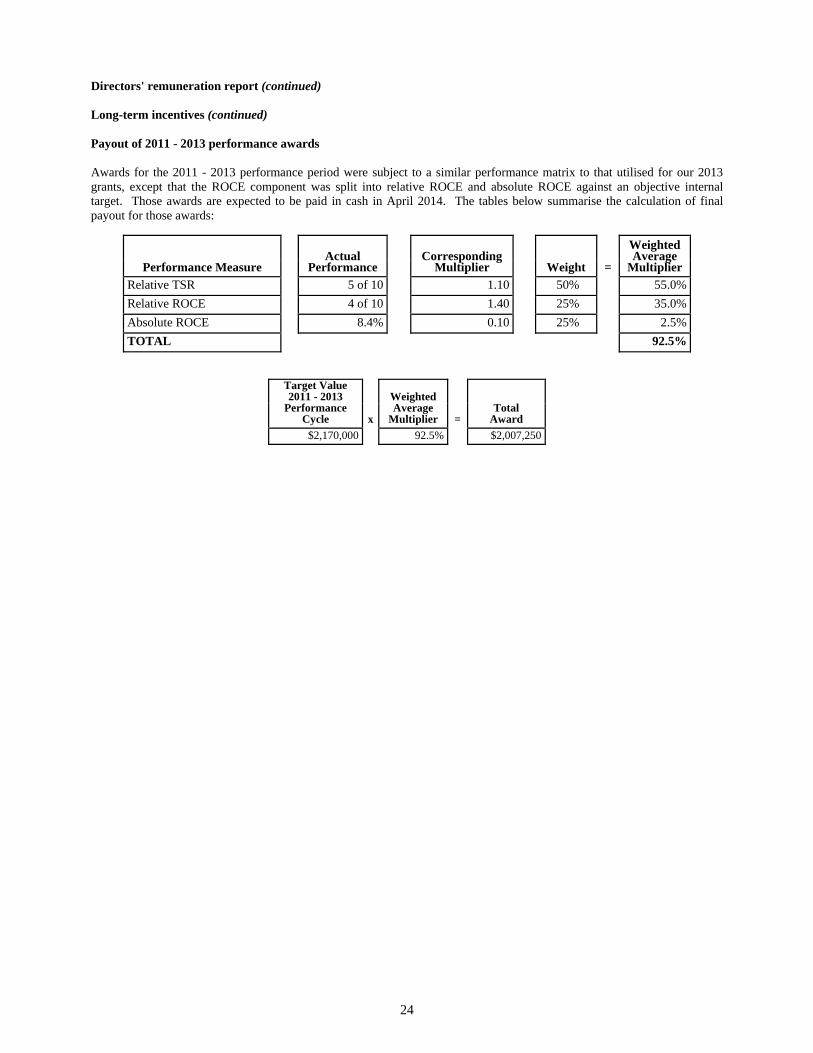
24
Directors' remuneration report (continued) Long-term incentives (continued) Payout of 2011 - 2013 performance awards Awards for the 2011 - 2013 performance period were subject to a similar performance matrix to that utilised for our 2013 grants, except that the ROCE component was split into relative ROCE and absolute ROCE against an objective internal target. Those awards are expected to be paid in cash in April 2014. The tables below summarise the calculation of final payout for those awards:
Performance Measure Actual
Performance Corresponding
Multiplier
Weight Weighted
Average Multiplier =
Relative TSR 5 of 10 1.10 50% 55.0%
Relative ROCE 4 of 10 1.40 25% 35.0%
Absolute ROCE 8.4% 0.10 25% 2.5%
TOTAL 92.5%
Target Value2011 - 2013
Performance Cycle x
Weighted Average
Multiplier
Total
Award =
$2,170,000 92.5% $2,007,250
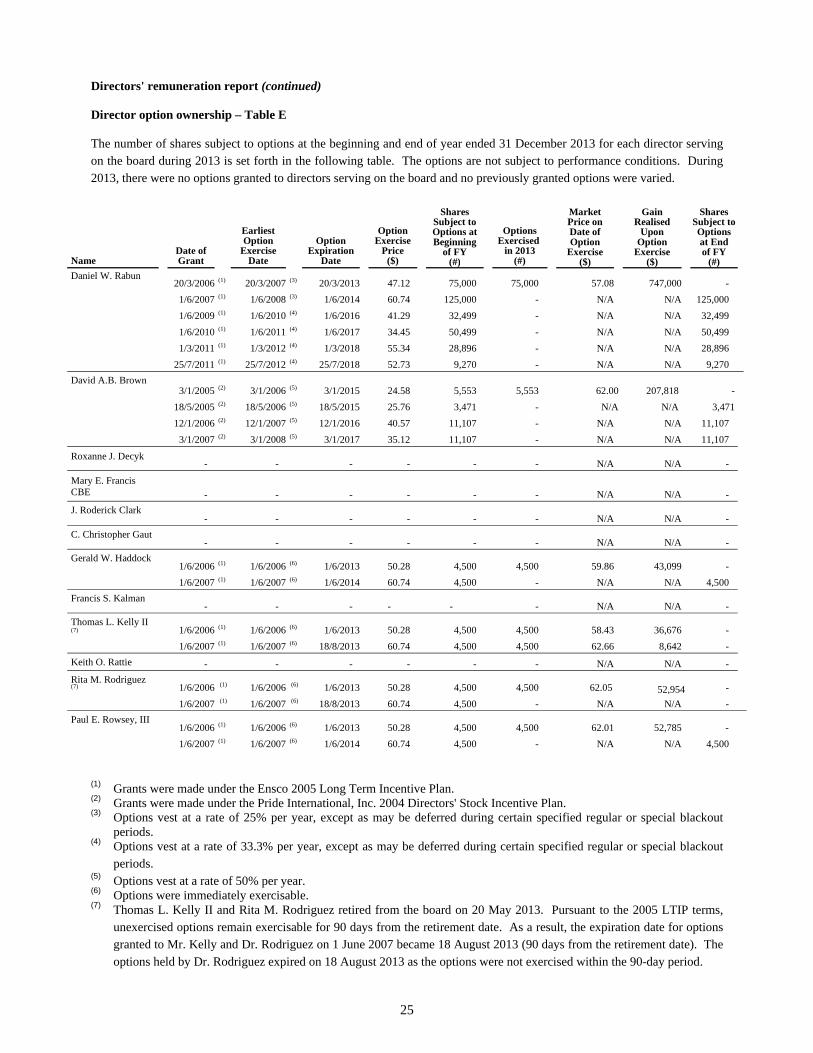
25
Directors' remuneration report (continued) Director option ownership – Table E The number of shares subject to options at the beginning and end of year ended 31 December 2013 for each director serving on the board during 2013 is set forth in the following table. The options are not subject to performance conditions. During 2013, there were no options granted to directors serving on the board and no previously granted options were varied.
Name
Date of Grant
Earliest Option
Exercise Date
Option Expiration
Date
Option Exercise
Price ($)
Shares Subject to Options at Beginning
of FY (#)
Options Exercised
in 2013 (#)
Market Price on Date of Option
Exercise ($)
Gain Realised
Upon Option
Exercise ($)
Shares Subject to Options at End of FY
(#)Daniel W. Rabun
20/3/2006 (1) 20/3/2007 (3) 20/3/2013 47.12 75,000 75,000 57.08 747,000 -
1/6/2007 (1) 1/6/2008 (3) 1/6/2014 60.74 125,000 - N/A N/A 125,000
1/6/2009 (1) 1/6/2010 (4) 1/6/2016 41.29 32,499 - N/A N/A 32,499
1/6/2010 (1) 1/6/2011 (4) 1/6/2017 34.45 50,499 - N/A N/A 50,499
1/3/2011 (1) 1/3/2012 (4) 1/3/2018 55.34 28,896 - N/A N/A 28,896
25/7/2011 (1) 25/7/2012 (4) 25/7/2018 52.73 9,270 - N/A N/A 9,270
David A.B. Brown 3/1/2005 (2) 3/1/2006 (5) 3/1/2015 24.58 5,553 5,553 62.00 207,818 -
18/5/2005 (2) 18/5/2006 (5) 18/5/2015 25.76 3,471 - N/A N/A 3,471
12/1/2006 (2) 12/1/2007 (5) 12/1/2016 40.57 11,107 - N/A N/A 11,107
3/1/2007 (2) 3/1/2008 (5) 3/1/2017 35.12 11,107 - N/A N/A 11,107
Roxanne J. Decyk - - - - - - N/A N/A -
Mary E. Francis CBE
- - - - - - N/A N/A -
J. Roderick Clark - - - - - - N/A N/A -
C. Christopher Gaut - - - - - - N/A N/A -
Gerald W. Haddock 1/6/2006 (1) 1/6/2006 (6) 1/6/2013 50.28 4,500 4,500 59.86 43,099 -
1/6/2007 (1) 1/6/2007 (6) 1/6/2014 60.74 4,500 - N/A N/A 4,500
Francis S. Kalman - - - - - - N/A N/A -
Thomas L. Kelly II (7)
1/6/2006 (1) 1/6/2006 (6) 1/6/2013 50.28 4,500 4,500 58.43 36,676 -
1/6/2007 (1) 1/6/2007 (6) 18/8/2013 60.74 4,500 4,500 62.66 8,642 -
Keith O. Rattie - - - - - - N/A N/A -
Rita M. Rodriguez (7)
1/6/2006 (1) 1/6/2006 (6) 1/6/2013 50.28 4,500 4,500 62.05 52,954 -
1/6/2007 (1) 1/6/2007 (6) 18/8/2013 60.74 4,500 - N/A N/A -
Paul E. Rowsey, III 1/6/2006 (1) 1/6/2006 (6) 1/6/2013 50.28 4,500 4,500 62.01 52,785 -
1/6/2007 (1) 1/6/2007 (6) 1/6/2014 60.74 4,500 - N/A N/A 4,500
(1) Grants were made under the Ensco 2005 Long Term Incentive Plan. (2) Grants were made under the Pride International, Inc. 2004 Directors' Stock Incentive Plan. (3) Options vest at a rate of 25% per year, except as may be deferred during certain specified regular or special blackout
periods. (4) Options vest at a rate of 33.3% per year, except as may be deferred during certain specified regular or special blackout
periods. (5) Options vest at a rate of 50% per year. (6) Options were immediately exercisable. (7) Thomas L. Kelly II and Rita M. Rodriguez retired from the board on 20 May 2013. Pursuant to the 2005 LTIP terms,
unexercised options remain exercisable for 90 days from the retirement date. As a result, the expiration date for options granted to Mr. Kelly and Dr. Rodriguez on 1 June 2007 became 18 August 2013 (90 days from the retirement date). The options held by Dr. Rodriguez expired on 18 August 2013 as the options were not exercised within the 90-day period.
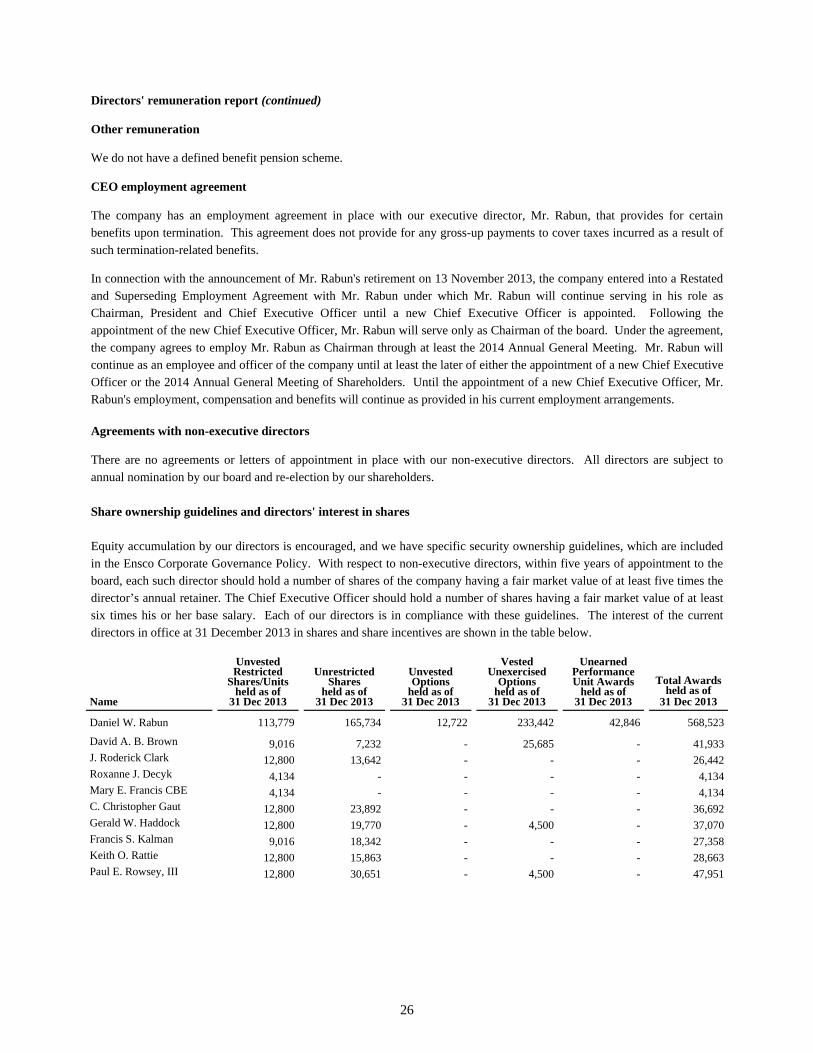
26
Directors' remuneration report (continued) Other remuneration We do not have a defined benefit pension scheme. CEO employment agreement The company has an employment agreement in place with our executive director, Mr. Rabun, that provides for certain benefits upon termination. This agreement does not provide for any gross-up payments to cover taxes incurred as a result of such termination-related benefits.
In connection with the announcement of Mr. Rabun's retirement on 13 November 2013, the company entered into a Restated and Superseding Employment Agreement with Mr. Rabun under which Mr. Rabun will continue serving in his role as Chairman, President and Chief Executive Officer until a new Chief Executive Officer is appointed. Following the appointment of the new Chief Executive Officer, Mr. Rabun will serve only as Chairman of the board. Under the agreement, the company agrees to employ Mr. Rabun as Chairman through at least the 2014 Annual General Meeting. Mr. Rabun will continue as an employee and officer of the company until at least the later of either the appointment of a new Chief Executive Officer or the 2014 Annual General Meeting of Shareholders. Until the appointment of a new Chief Executive Officer, Mr. Rabun's employment, compensation and benefits will continue as provided in his current employment arrangements. Agreements with non-executive directors There are no agreements or letters of appointment in place with our non-executive directors. All directors are subject to annual nomination by our board and re-election by our shareholders.
Share ownership guidelines and directors' interest in shares Equity accumulation by our directors is encouraged, and we have specific security ownership guidelines, which are included in the Ensco Corporate Governance Policy. With respect to non-executive directors, within five years of appointment to the board, each such director should hold a number of shares of the company having a fair market value of at least five times the director’s annual retainer. The Chief Executive Officer should hold a number of shares having a fair market value of at least six times his or her base salary. Each of our directors is in compliance with these guidelines. The interest of the current directors in office at 31 December 2013 in shares and share incentives are shown in the table below.
Name
Unvested Restricted
Shares/Units held as of
31 Dec 2013
Unrestricted Shares
held as of 31 Dec 2013
Unvested Options
held as of 31 Dec 2013
Vested Unexercised
Options held as of
31 Dec 2013
Unearned Performance Unit Awards
held as of 31 Dec 2013
Total Awards held as of
31 Dec 2013
Daniel W. Rabun 113,779 165,734 12,722 233,442 42,846 568,523
David A. B. Brown 9,016 7,232 - 25,685 - 41,933J. Roderick Clark 12,800 13,642 - - - 26,442Roxanne J. Decyk 4,134 - - - - 4,134Mary E. Francis CBE 4,134 - - - - 4,134C. Christopher Gaut 12,800 23,892 - - - 36,692Gerald W. Haddock 12,800 19,770 - 4,500 - 37,070Francis S. Kalman 9,016 18,342 - - - 27,358Keith O. Rattie 12,800 15,863 - - - 28,663Paul E. Rowsey, III 12,800 30,651 - 4,500 - 47,951
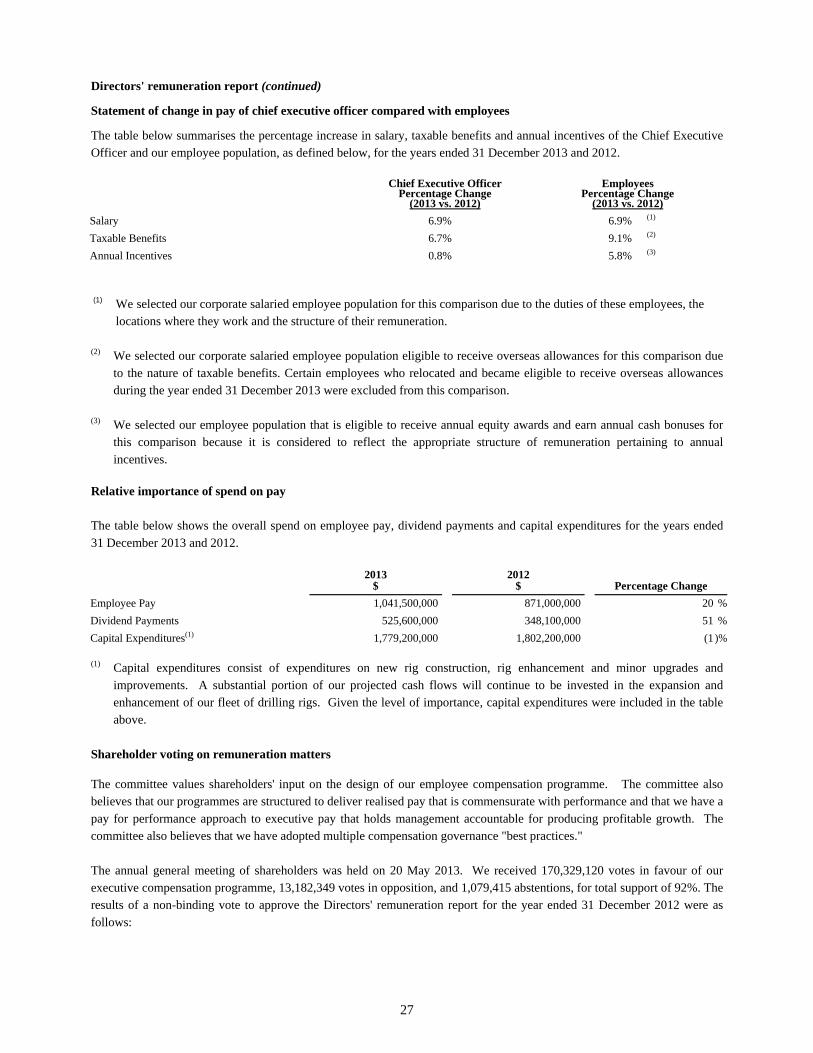
27
Directors' remuneration report (continued)
Statement of change in pay of chief executive officer compared with employees
The table below summarises the percentage increase in salary, taxable benefits and annual incentives of the Chief Executive Officer and our employee population, as defined below, for the years ended 31 December 2013 and 2012.
Chief Executive Officer Percentage Change
(2013 vs. 2012)
Employees Percentage Change
(2013 vs. 2012)
Salary 6.9% 6.9% (1)
Taxable Benefits 6.7% 9.1% (2)
Annual Incentives 0.8% 5.8% (3)
(1) We selected our corporate salaried employee population for this comparison due to the duties of these employees, the
locations where they work and the structure of their remuneration.
(2) We selected our corporate salaried employee population eligible to receive overseas allowances for this comparison due to the nature of taxable benefits. Certain employees who relocated and became eligible to receive overseas allowances during the year ended 31 December 2013 were excluded from this comparison.
(3) We selected our employee population that is eligible to receive annual equity awards and earn annual cash bonuses for
this comparison because it is considered to reflect the appropriate structure of remuneration pertaining to annual incentives.
Relative importance of spend on pay
The table below shows the overall spend on employee pay, dividend payments and capital expenditures for the years ended 31 December 2013 and 2012.
2013
$ 2012
$ Percentage Change
Employee Pay 1,041,500,000 871,000,000 20 %
Dividend Payments 525,600,000 348,100,000 51 %
Capital Expenditures(1) 1,779,200,000 1,802,200,000 (1 )%
(1) Capital expenditures consist of expenditures on new rig construction, rig enhancement and minor upgrades and
improvements. A substantial portion of our projected cash flows will continue to be invested in the expansion and enhancement of our fleet of drilling rigs. Given the level of importance, capital expenditures were included in the table above.
Shareholder voting on remuneration matters The committee values shareholders' input on the design of our employee compensation programme. The committee also believes that our programmes are structured to deliver realised pay that is commensurate with performance and that we have a pay for performance approach to executive pay that holds management accountable for producing profitable growth. The committee also believes that we have adopted multiple compensation governance "best practices." The annual general meeting of shareholders was held on 20 May 2013. We received 170,329,120 votes in favour of our executive compensation programme, 13,182,349 votes in opposition, and 1,079,415 abstentions, for total support of 92%. The results of a non-binding vote to approve the Directors' remuneration report for the year ended 31 December 2012 were as follows:
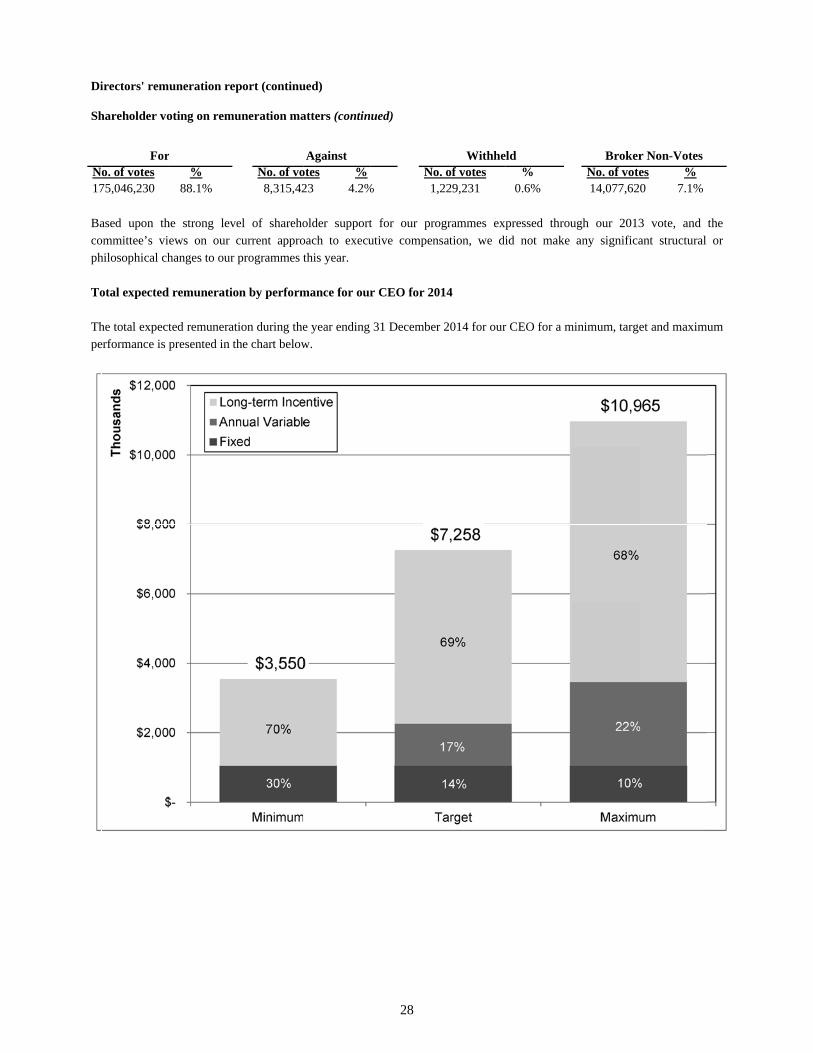
Di
Sh
N17
Bacoph
To Thpe
irectors' rem
hareholder vo
Foro. of votes 75,046,230
ased upon thommittee’s vihilosophical ch
otal expected
he total expecterformance is p
uneration rep
oting on remu
r %
88.1%
he strong levews on our changes to our
remuneratio
ted remuneratpresented in th
port (continu
uneration ma
No. of vo8,315,42
el of sharehocurrent approprogrammes t
on by perform
tion during thehe chart below
ued)
atters (contin
Againstotes %23 4.2%
older supportoach to executhis year.
mance for our
e year ending w.
28
ued)
No% 1,
t for our proutive compen
r CEO for 20
31 December
Withheo. of votes,229,231
ogrammes exnsation, we di
014
r 2014 for our
eld%
0.6%
pressed throuid not make
r CEO for a m
BrokerNo. of vote14,077,62
ugh our 2013any significa
minimum, targe
r Non-Voteses %0 7.1%
3 vote, and ant structural
et and maxim
the or
mum
29
Directors' remuneration report (continued)
Total expected remuneration by performance for our CEO for 2014 (continued) The chart assumes no share price movement and excludes dividend accruals. Assumptions made for each scenario are as follows:
Performance Level Fixed Annual Variable Compensation (ECIP)
Long-term Incentive Compensation (LTIP)
Minimum (Below Threshold)
Base salary 0% earned if performance is below threshold/ minimum acceptable on all performance measures
Restricted stock earned at 100% Performance units at 0% (ROCE and TSR rank ninth or tenth in performance peer group). Actual value of awards will vary further based on dividend accrual and share price at date of settlement.
Target (In Line with Expectation)
Base salary 100% of target earned (115% of salary) if financial and safety performance is at 100% of goals and strategic team goals achievement “meets expectations”
Restricted stock earned at 100% Performance units at 100% of target (ROCE and TSR rank fifth in the performance peer group) Actual value of awards will vary further based on dividend accrual and share price at date of settlement.
Maximum Base salary 200% of target earned (230% of salary) if financial and safety performance exceeds maximum goals and strategic team goals are all achieved at an outstanding level (far exceeding expectations)
Restricted stock earned at 100% Performance units at 200% of target (ROCE and TSR rank first in performance peer group) Actual value of awards will vary further based on dividend accrual and share price at date of settlement.
The Directors’ remuneration report was approved by the board of directors on 28 March 2014 and was signed on its behalf by: /s/ Daniel W. Rabun Daniel W. Rabun Chairman, Director, President and Chief Executive Officer
30
Statement of directors’ responsibilities in respect of the annual report, strategic report and directors’ report and the financial statements
The directors are responsible for preparing the Annual Report, Strategic Report and Directors’ Report and the financial statements in accordance with applicable law and regulations. Company law requires the directors to prepare financial statements for each financial year. Under that law, they have elected to prepare the group and parent company financial statements in accordance with UK Accounting Standards and applicable law (UK Generally Accepted Accounting Practice). Under company law, the directors must not approve the financial statements unless they are satisfied that they give a true and fair view of the state of affairs of the group and parent company and of their profit or loss for that period. In preparing the group and parent company financial statements, the directors are required to: select suitable accounting policies and then apply them consistently;
make judgements and estimates that are reasonable and prudent;
state whether applicable UK Accounting Standards have been followed, subject to any material departures disclosed and explained in the financial statements; and
prepare the financial statements on the going concern basis unless it is inappropriate to presume that the group and the parent company will continue in business.
The directors are responsible for keeping adequate accounting records that are sufficient to show and explain the parent company’s transactions and disclose with reasonable accuracy at any time the financial position of the parent company and enable them to ensure that its financial statements comply with the Companies Act 2006. They have general responsibility for taking such steps as are reasonably open to them to safeguard the assets of the group and to prevent and detect fraud and other irregularities. Under applicable law and regulations, the directors are also responsible for preparing a Strategic Report and Directors’ Report and a Directors’ Remuneration Report that complies with that law and those regulations.
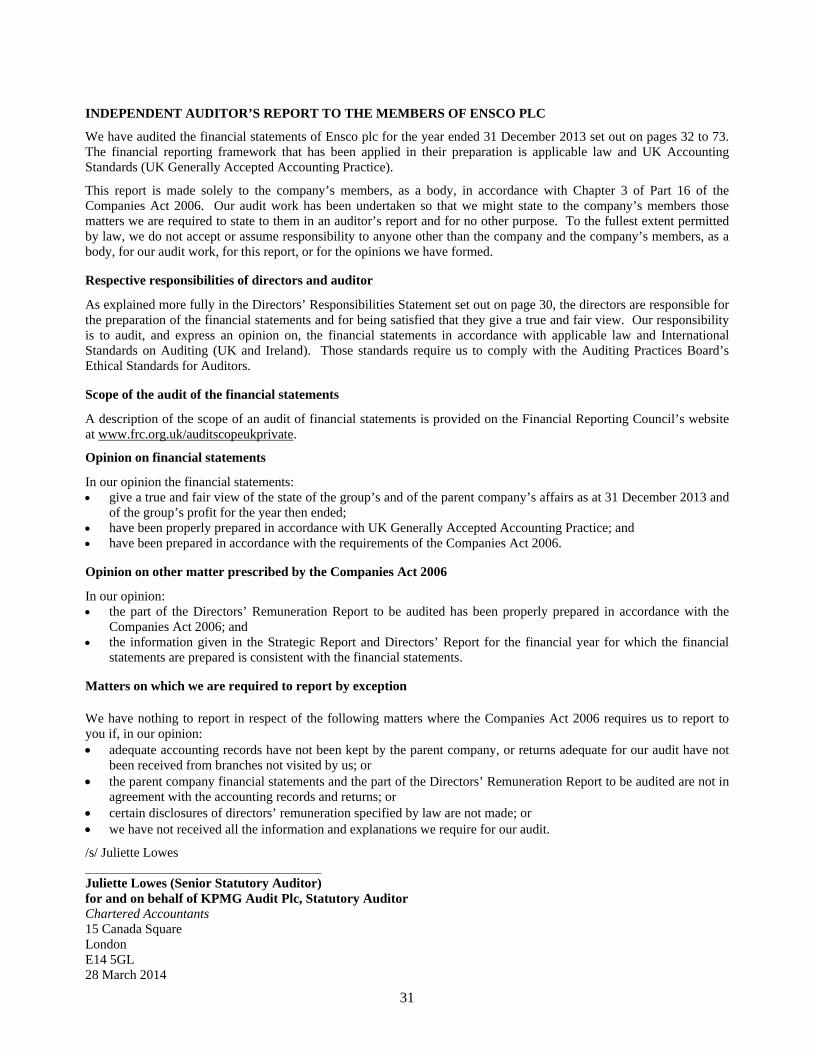
31
INDEPENDENT AUDITOR’S REPORT TO THE MEMBERS OF ENSCO PLC
We have audited the financial statements of Ensco plc for the year ended 31 December 2013 set out on pages 32 to 73. The financial reporting framework that has been applied in their preparation is applicable law and UK Accounting Standards (UK Generally Accepted Accounting Practice).
This report is made solely to the company’s members, as a body, in accordance with Chapter 3 of Part 16 of the Companies Act 2006. Our audit work has been undertaken so that we might state to the company’s members those matters we are required to state to them in an auditor’s report and for no other purpose. To the fullest extent permitted by law, we do not accept or assume responsibility to anyone other than the company and the company’s members, as a body, for our audit work, for this report, or for the opinions we have formed.
Respective responsibilities of directors and auditor
As explained more fully in the Directors’ Responsibilities Statement set out on page 30, the directors are responsible for the preparation of the financial statements and for being satisfied that they give a true and fair view. Our responsibility is to audit, and express an opinion on, the financial statements in accordance with applicable law and International Standards on Auditing (UK and Ireland). Those standards require us to comply with the Auditing Practices Board’s Ethical Standards for Auditors.
Scope of the audit of the financial statements
A description of the scope of an audit of financial statements is provided on the Financial Reporting Council’s website at www.frc.org.uk/auditscopeukprivate.
Opinion on financial statements
In our opinion the financial statements: give a true and fair view of the state of the group’s and of the parent company’s affairs as at 31 December 2013 and
of the group’s profit for the year then ended; have been properly prepared in accordance with UK Generally Accepted Accounting Practice; and have been prepared in accordance with the requirements of the Companies Act 2006.
Opinion on other matter prescribed by the Companies Act 2006
In our opinion: the part of the Directors’ Remuneration Report to be audited has been properly prepared in accordance with the
Companies Act 2006; and the information given in the Strategic Report and Directors’ Report for the financial year for which the financial
statements are prepared is consistent with the financial statements.
Matters on which we are required to report by exception
We have nothing to report in respect of the following matters where the Companies Act 2006 requires us to report to you if, in our opinion: adequate accounting records have not been kept by the parent company, or returns adequate for our audit have not
been received from branches not visited by us; or the parent company financial statements and the part of the Directors’ Remuneration Report to be audited are not in
agreement with the accounting records and returns; or certain disclosures of directors’ remuneration specified by law are not made; or we have not received all the information and explanations we require for our audit.
/s/ Juliette Lowes Juliette Lowes (Senior Statutory Auditor) for and on behalf of KPMG Audit Plc, Statutory Auditor Chartered Accountants 15 Canada Square London E14 5GL 28 March 2014
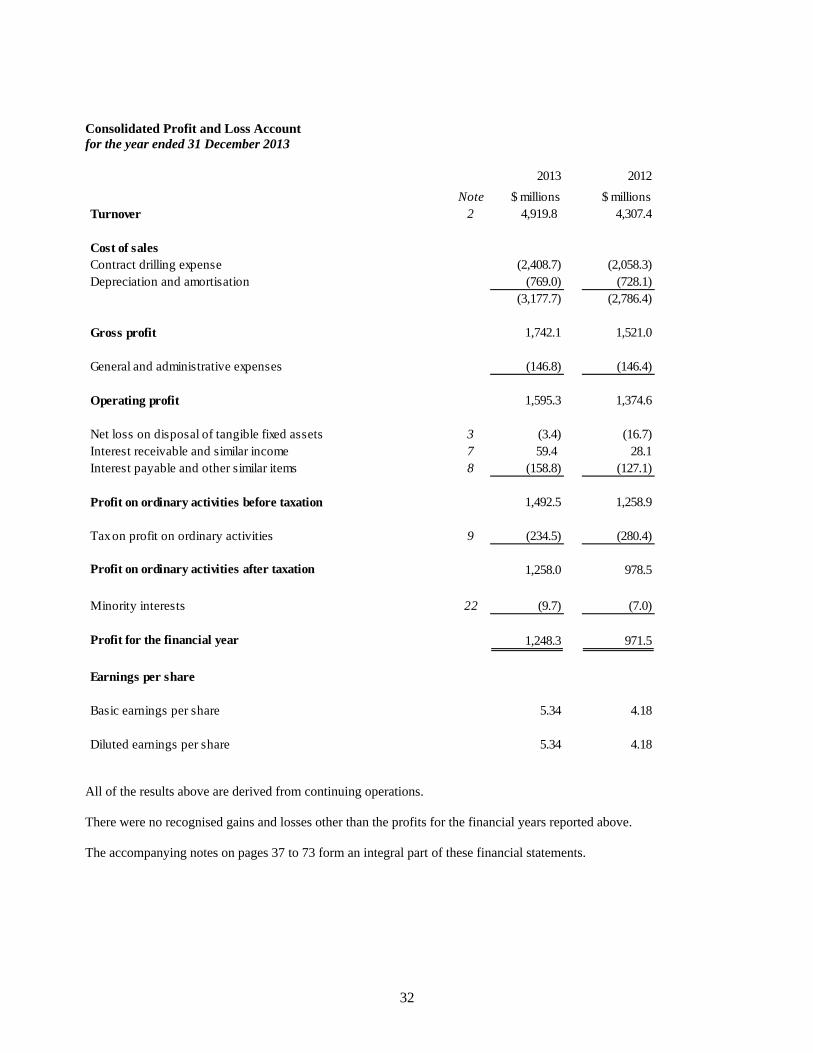
32
Consolidated Profit and Loss Account for the year ended 31 December 2013
All of the results above are derived from continuing operations. There were no recognised gains and losses other than the profits for the financial years reported above. The accompanying notes on pages 37 to 73 form an integral part of these financial statements.
2013 2012
Note $ millions $ millionsTurnover 2 4,919.8 4,307.4
Cost of salesContract drilling expense (2,408.7) (2,058.3) Depreciation and amortisation (769.0) (728.1)
(3,177.7) (2,786.4) Gross profit 1,742.1 1,521.0
General and administrative expenses (146.8) (146.4) Operating profit 1,595.3 1,374.6 Net loss on disposal of tangible fixed assets 3 (3.4) (16.7) Interest receivable and similar income 7 59.4 28.1Interest payable and other similar items 8 (158.8) (127.1)
Profit on ordinary activities before taxation 1,492.5 1,258.9
Tax on profit on ordinary activities 9 (234.5) (280.4)
Profit on ordinary activities after taxation 1,258.0 978.5
Minority interests 22 (9.7) (7.0)
Profit for the financial year 1,248.3 971.5
Earnings per share
Basic earnings per share 5.34 4.18
Diluted earnings per share 5.34 4.18
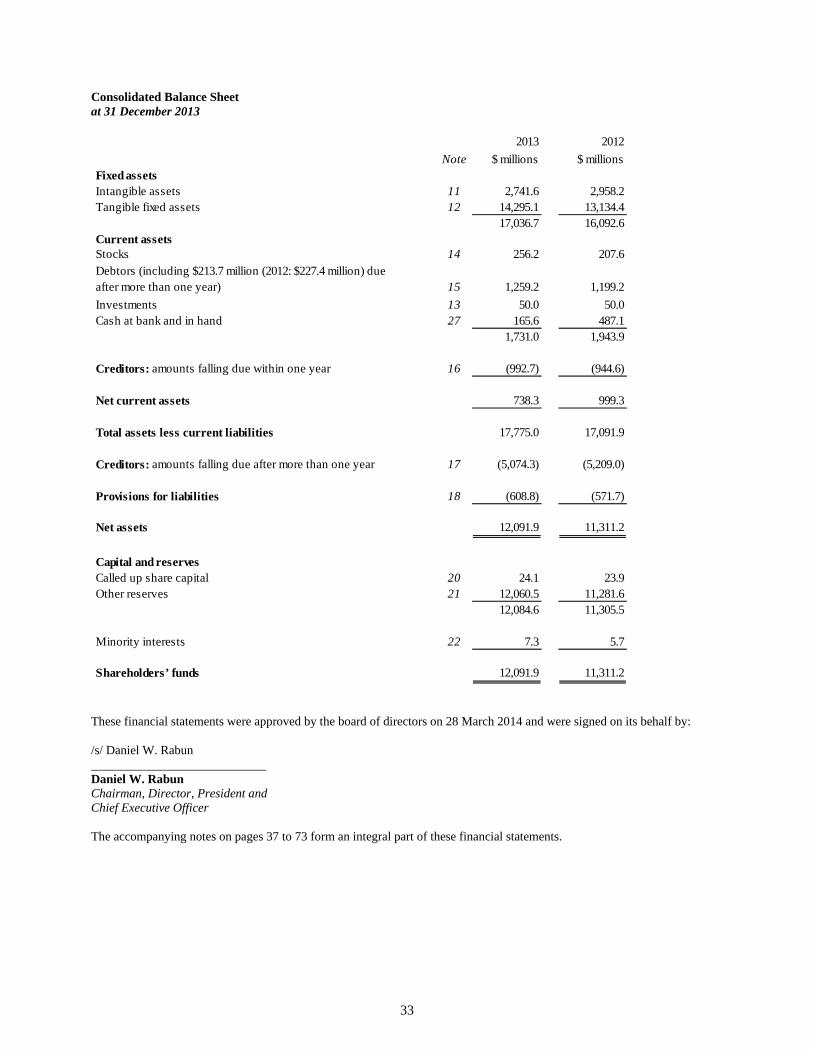
33
Consolidated Balance Sheet at 31 December 2013
These financial statements were approved by the board of directors on 28 March 2014 and were signed on its behalf by: /s/ Daniel W. Rabun Daniel W. Rabun Chairman, Director, President and Chief Executive Officer The accompanying notes on pages 37 to 73 form an integral part of these financial statements.
2013 2012
Note $ millions $ millionsFixed assetsIntangible assets 11 2,741.6 2,958.2 Tangible fixed assets 12 14,295.1 13,134.4
17,036.7 16,092.6 Current assetsStocks 14 256.2 207.6 Debtors (including $213.7 million (2012: $227.4 million) due after more than one year) 15 1,259.2 1,199.2
Investments 13 50.0 50.0 Cash at bank and in hand 27 165.6 487.1
1,731.0 1,943.9
Creditors: amounts falling due within one year 16 (992.7) (944.6)
Net current assets 738.3 999.3
Total assets less current liabilities 17,775.0 17,091.9
Creditors: amounts falling due after more than one year 17 (5,074.3) (5,209.0)
Provisions for liabilities 18 (608.8) (571.7)
Net assets 12,091.9 11,311.2
Capital and reservesCalled up share capital 20 24.1 23.9 Other reserves 21 12,060.5 11,281.6
12,084.6 11,305.5
Minority interests 22 7.3 5.7
Shareholders’ funds 12,091.9 11,311.2
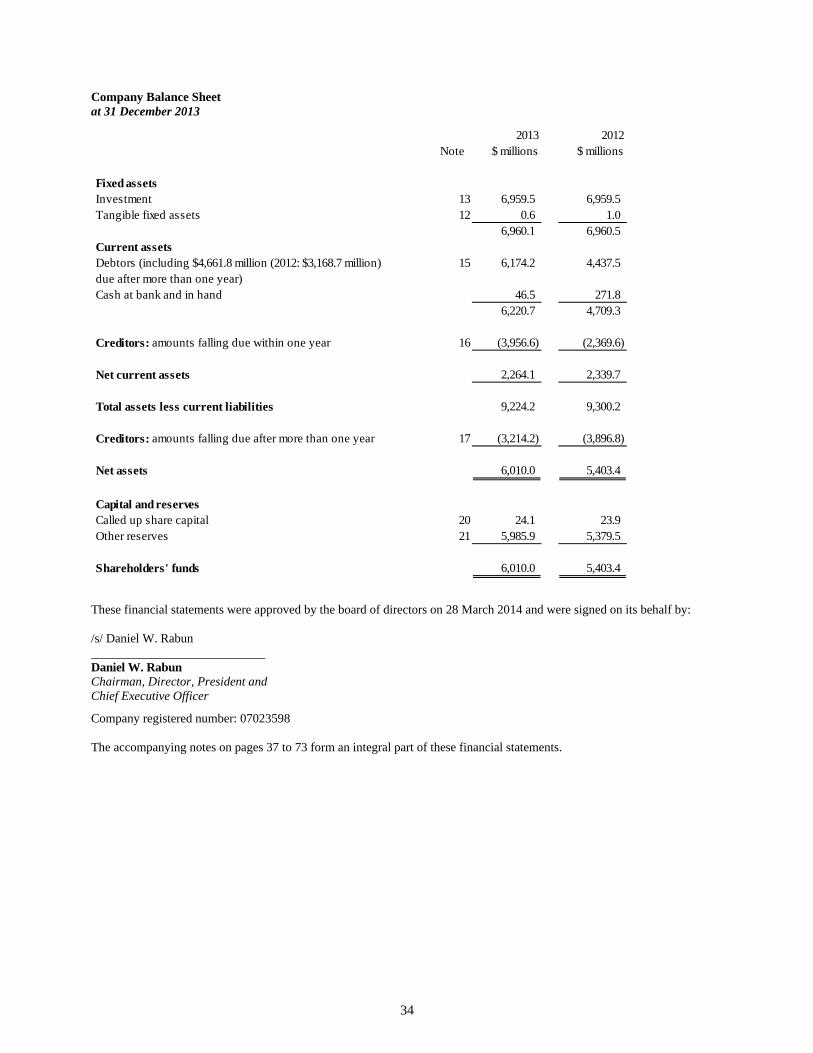
34
Company Balance Sheet at 31 December 2013
These financial statements were approved by the board of directors on 28 March 2014 and were signed on its behalf by: /s/ Daniel W. Rabun Daniel W. Rabun Chairman, Director, President and Chief Executive Officer
Company registered number: 07023598 The accompanying notes on pages 37 to 73 form an integral part of these financial statements.
2013 2012Note $ millions $ millions
Fixed assetsInvestment 13 6,959.5 6,959.5Tangible fixed assets 12 0.6 1.0
6,960.1 6,960.5Current assetsDebtors (including $4,661.8 million (2012: $3,168.7 million) 15 6,174.2 4,437.5due after more than one year)Cash at bank and in hand 46.5 271.8
6,220.7 4,709.3
Creditors: amounts falling due within one year 16 (3,956.6) (2,369.6)
Net current assets 2,264.1 2,339.7
Total assets less current liabilities 9,224.2 9,300.2
Creditors: amounts falling due after more than one year 17 (3,214.2) (3,896.8)
Net assets 6,010.0 5,403.4
Capital and reservesCalled up share capital 20 24.1 23.9Other reserves 21 5,985.9 5,379.5
Shareholders' funds 6,010.0 5,403.4
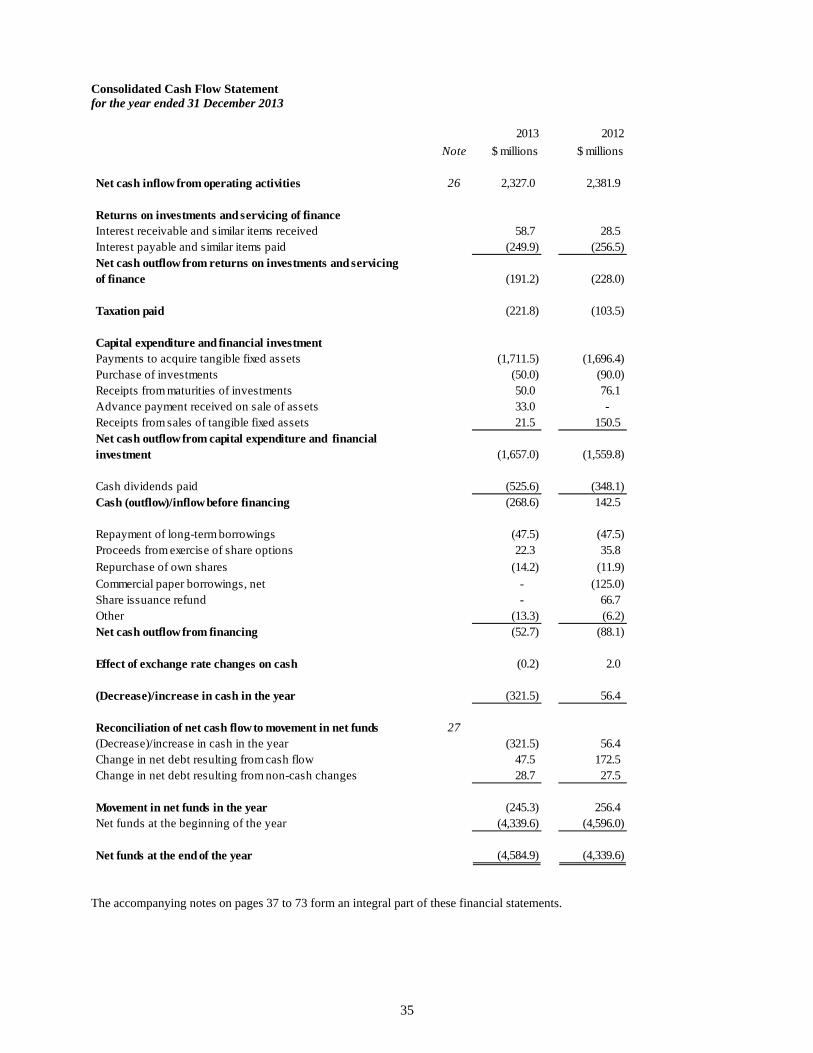
35
Consolidated Cash Flow Statement for the year ended 31 December 2013
The accompanying notes on pages 37 to 73 form an integral part of these financial statements.
2013 2012
Note $ millions $ millions
Net cash inflow from operating activities 26 2,327.0 2,381.9
Returns on investments and servicing of financeInterest receivable and similar items received 58.7 28.5 Interest payable and similar items paid (249.9) (256.5)
(191.2) (228.0)
Taxation paid (221.8) (103.5)
Capital expenditure and financial investmentPayments to acquire tangible fixed assets (1,711.5) (1,696.4) Purchase of investments (50.0) (90.0) Receipts from maturities of investments 50.0 76.1 Advance payment received on sale of assets 33.0 - Receipts from sales of tangible fixed assets 21.5 150.5 Net cash outflow from capital expenditure and financial investment (1,657.0) (1,559.8)
Cash dividends paid (525.6) (348.1) Cash (outflow)/inflow before financing (268.6) 142.5
Repayment of long-term borrowings (47.5) (47.5) Proceeds from exercise of share options 22.3 35.8
Repurchase of own shares (14.2) (11.9) Commercial paper borrowings, net - (125.0) Share issuance refund - 66.7 Other (13.3) (6.2) Net cash outflow from financing (52.7) (88.1)
Effect of exchange rate changes on cash (0.2) 2.0
(Decrease)/increase in cash in the year (321.5) 56.4
Reconciliation of net cash flow to movement in net funds 27(Decrease)/increase in cash in the year (321.5) 56.4 Change in net debt resulting from cash flow 47.5 172.5 Change in net debt resulting from non-cash changes 28.7 27.5
Movement in net funds in the year (245.3) 256.4 Net funds at the beginning of the year (4,339.6) (4,596.0)
Net funds at the end of the year (4,584.9) (4,339.6)
Net cash outflow from returns on investments and servicing of finance
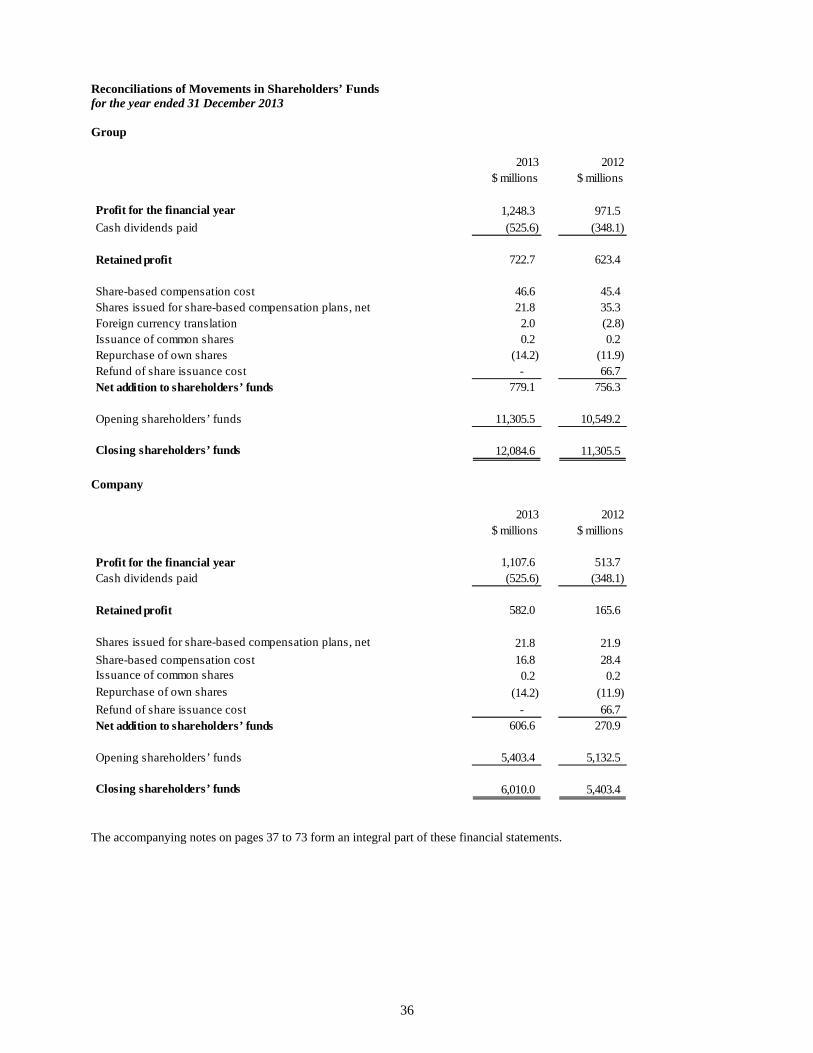
36
Reconciliations of Movements in Shareholders’ Funds for the year ended 31 December 2013 Group
Company
The accompanying notes on pages 37 to 73 form an integral part of these financial statements.
2013 2012$ millions $ millions
Profit for the financial year 1,248.3 971.5 Cash dividends paid (525.6) (348.1)
Retained profit 722.7 623.4
Share-based compensation cost 46.6 45.4 Shares issued for share-based compensation plans, net 21.8 35.3 Foreign currency translation 2.0 (2.8) Issuance of common shares 0.2 0.2 Repurchase of own shares (14.2) (11.9) Refund of share issuance cost - 66.7 Net addition to shareholders’ funds 779.1 756.3
Opening shareholders’ funds 11,305.5 10,549.2
Closing shareholders’ funds 12,084.6 11,305.5
2013 2012$ millions $ millions
Profit for the financial year 1,107.6 513.7 Cash dividends paid (525.6) (348.1)
Retained profit 582.0 165.6
Shares issued for share-based compensation plans, net 21.8 21.9
Share-based compensation cost 16.8 28.4 Issuance of common shares 0.2 0.2 Repurchase of own shares (14.2) (11.9) Refund of share issuance cost - 66.7 Net addition to shareholders’ funds 606.6 270.9
Opening shareholders’ funds 5,403.4 5,132.5
Closing shareholders’ funds 6,010.0 5,403.4
37
Notes
1 Accounting policies The following accounting policies have been applied consistently in dealing with items which are considered material in relation to the financial statements. Basis of preparation The financial statements have been prepared in accordance with applicable accounting standards and under the historical cost accounting rules. Certain prior year balances have been amended to be consistent with the current year presentation. The functional currency of the company is the U.S. dollar. The U.S. dollar is the prevalent currency used within the oil and natural gas industry and the group has a significant level of U.S. dollar cash flows, assets and liabilities. The group and parent company financial statements are therefore presented in U.S. dollars. Going concern The group’s business activities, together with the factors likely to affect its future development, performance and financial position are set out in the Business review. The group has considerable financial resources together with contract backlog with a number of customers across different geographic areas. Therefore, the directors believe that the group is well placed to successfully manage its business risks. After having made the appropriate inquiries, the directors have a reasonable expectation that the group has adequate resources to continue in operational existence for the foreseeable future. Consequently, they continue to adopt the going concern basis of accounting in preparing the annual financial statements. Basis of consolidation The group financial statements consolidate the financial statements of the company and its subsidiary undertakings made up to 31 December 2013. The acquisition method of accounting has been adopted. Under this method, the results of subsidiary undertakings acquired or disposed of in the year are included in the consolidated profit and loss account from the date of acquisition or up to the date of disposal. In the company’s financial statements, investments in subsidiary undertakings are stated at cost less amounts written off. The carrying values of the investments in subsidiary undertakings are reviewed for impairment if events or changes in circumstances indicate that the carrying values may not be recoverable. Under section 408 of the UK Companies Act 2006, the company is exempt from the requirement to present its own profit and loss account. Foreign currency remeasurement The functional currency of a substantial portion of the group’s companies is the U.S. dollar. As is customary in the oil and natural gas industry, a majority of the group’s turnover is denominated in U.S. dollars; however, a portion of the turnover and expenses incurred by its non-U.S. subsidiaries are denominated in currencies other than the U.S. dollar. Non-monetary balances are held at historical exchange rates. Monetary balances are translated at the yearend exchange rates with any gains or losses taken to interest receivable and other similar income, interest payable and other similar items or other reserves. Transactions are shown in the profit and loss account at the average exchange rate during the month that the transaction occurred or the relevant hedged rate. Transaction gains and losses, including gains and losses on the settlement of certain derivative instruments, are included in interest receivable and similar income and interest payable and other similar items in the group’s consolidated profit and loss account. Cash Cash, for the purpose of the cash flow statement, comprises cash in hand, deposits repayable on demand and investments with a maturity of less than three months that are repayable on demand without penalty.
38
Notes (continued)
1 Accounting policies (continued) Tangible fixed assets and depreciation All directly attributable costs incurred in connection with the acquisition, construction, enhancement and improvement of tangible fixed assets are capitalised, including allocations of interest incurred during periods that the group’s drilling rigs are under construction or undergoing major enhancements and improvements. Repair and maintenance costs are charged to contract drilling expense in the period in which they occur. Upon sale or retirement of tangible fixed assets, the related cost and accumulated depreciation are removed from the balance sheet and the resulting gain or loss is included in profit/loss on disposal of tangible fixed assets. The group’s tangible fixed assets are depreciated on the straight-line method, after allowing for salvage values, over their estimated useful economic lives. Drilling rigs and related equipment are depreciated over estimated economic useful lives ranging up to 35 years. Buildings and improvements are depreciated over estimated economic useful lives ranging up to 30 years. Other equipment, including computer and communications hardware and software costs, is depreciated over estimated economic useful lives ranging up to 6 years. Goodwill Positive goodwill arising on an acquisition is capitalised, classified as an asset on the balance sheet and amortised on a straight-line basis over its estimated useful economic life. The estimated useful economic life of the group’s goodwill is 20 years. If a subsidiary or business is subsequently sold or closed, any goodwill arising on acquisition that has not been amortised through the profit and loss account is taken into account in determining the profit or loss on sale or closure. Impairment of fixed assets and goodwill The group evaluates the carrying value of its fixed assets for impairment when events or changes in circumstances indicate that a potential impairment exists. If any such indication exists, the asset’s recoverable amount is estimated. The recoverable amount of fixed assets is the greater of their net realisable value and value in use. An impairment loss is recognised whenever the carrying value of an asset exceeds its recoverable amount. Fixed assets held for sale are recorded at the lower of net book value or net realisable value. Goodwill is tested for impairment at the end of the first full financial year following the acquisition and in subsequent periods if events or changes in circumstances indicate that the carrying value may not be recoverable. Goodwill is tested for impairment at the income-generating unit level. Impairment losses recognised in respect of income-generating units are allocated first to reduce the carrying amount of any goodwill allocated to income-generating units, then to the carrying amount of the tangible fixed assets in the unit on a pro rata basis. Calculation of recoverable amount In assessing value in use, the asset’s expected future cash flows are discounted to their present value using a pre-tax discount rate that reflects current market assessments of the rate of return expected on an equally risky investment. Reversals of impairment An impairment loss is reversed on goodwill only if subsequent external events reverse the effect of the original event which caused the recognition of the impairment. When this occurs, the reversal of the impairment loss is recognised in the current period. For fixed assets where the recoverable amount increases as a result of a change in economic conditions or in the expected use of the asset, the reversal of the impairment loss is recognised in the current period. An impairment loss for goodwill and fixed assets is reversed only to the extent that the asset’s carrying amount does not exceed the carrying amount that would have been determined, net of depreciation or amortisation, if no impairment loss had been recognised.
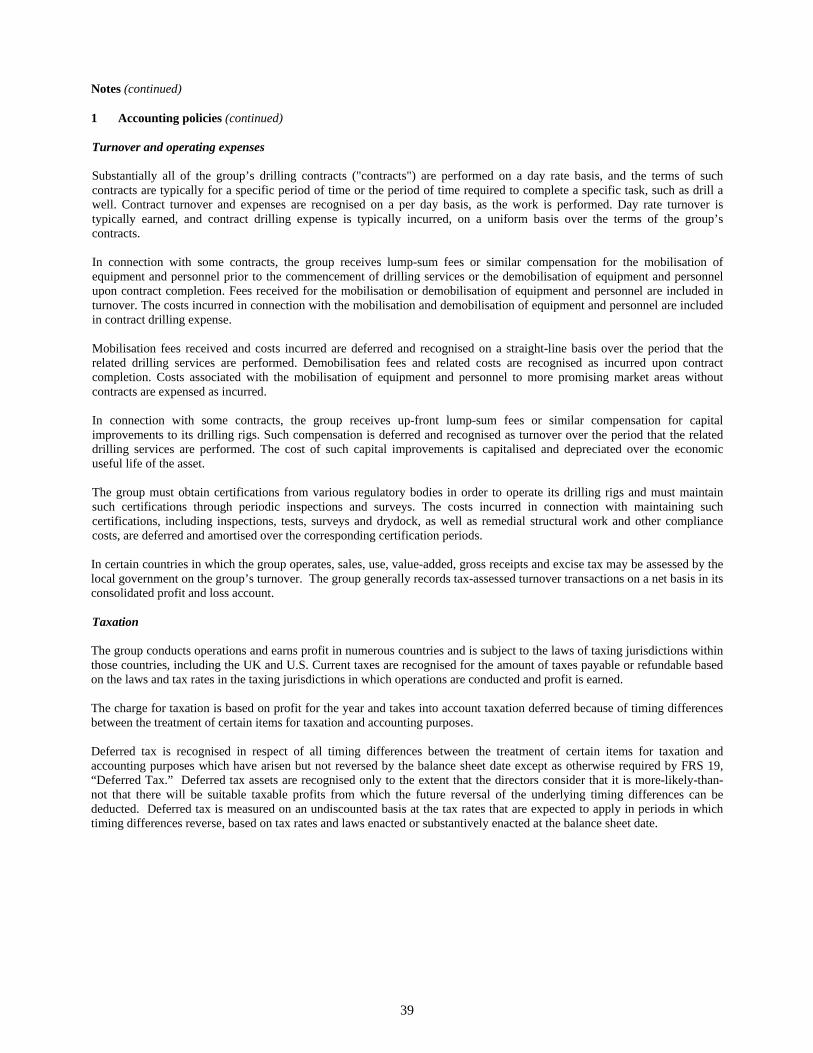
39
Notes (continued)
1 Accounting policies (continued) Turnover and operating expenses Substantially all of the group’s drilling contracts ("contracts") are performed on a day rate basis, and the terms of such contracts are typically for a specific period of time or the period of time required to complete a specific task, such as drill a well. Contract turnover and expenses are recognised on a per day basis, as the work is performed. Day rate turnover is typically earned, and contract drilling expense is typically incurred, on a uniform basis over the terms of the group’s contracts. In connection with some contracts, the group receives lump-sum fees or similar compensation for the mobilisation of equipment and personnel prior to the commencement of drilling services or the demobilisation of equipment and personnel upon contract completion. Fees received for the mobilisation or demobilisation of equipment and personnel are included in turnover. The costs incurred in connection with the mobilisation and demobilisation of equipment and personnel are included in contract drilling expense. Mobilisation fees received and costs incurred are deferred and recognised on a straight-line basis over the period that the related drilling services are performed. Demobilisation fees and related costs are recognised as incurred upon contract completion. Costs associated with the mobilisation of equipment and personnel to more promising market areas without contracts are expensed as incurred. In connection with some contracts, the group receives up-front lump-sum fees or similar compensation for capital improvements to its drilling rigs. Such compensation is deferred and recognised as turnover over the period that the related drilling services are performed. The cost of such capital improvements is capitalised and depreciated over the economic useful life of the asset. The group must obtain certifications from various regulatory bodies in order to operate its drilling rigs and must maintain such certifications through periodic inspections and surveys. The costs incurred in connection with maintaining such certifications, including inspections, tests, surveys and drydock, as well as remedial structural work and other compliance costs, are deferred and amortised over the corresponding certification periods. In certain countries in which the group operates, sales, use, value-added, gross receipts and excise tax may be assessed by the local government on the group’s turnover. The group generally records tax-assessed turnover transactions on a net basis in its consolidated profit and loss account. Taxation The group conducts operations and earns profit in numerous countries and is subject to the laws of taxing jurisdictions within those countries, including the UK and U.S. Current taxes are recognised for the amount of taxes payable or refundable based on the laws and tax rates in the taxing jurisdictions in which operations are conducted and profit is earned. The charge for taxation is based on profit for the year and takes into account taxation deferred because of timing differences between the treatment of certain items for taxation and accounting purposes. Deferred tax is recognised in respect of all timing differences between the treatment of certain items for taxation and accounting purposes which have arisen but not reversed by the balance sheet date except as otherwise required by FRS 19, “Deferred Tax.” Deferred tax assets are recognised only to the extent that the directors consider that it is more-likely-than-not that there will be suitable taxable profits from which the future reversal of the underlying timing differences can be deducted. Deferred tax is measured on an undiscounted basis at the tax rates that are expected to apply in periods in which timing differences reverse, based on tax rates and laws enacted or substantively enacted at the balance sheet date.
40
Notes (continued)
1 Accounting policies (continued) Taxation (continued) In many of the jurisdictions in which the group operates, tax laws relating to the offshore drilling industry are not well developed and change frequently. Furthermore, the group may enter into transactions with affiliates or employ other tax planning strategies that generally are subject to complex tax regulations. As a result of the foregoing, the tax liabilities and assets the group recognises in its financial statements may differ from the tax positions taken, or expected to be taken, in the group’s tax returns. Tax positions are evaluated for recognition using a more-likely-than-not threshold, and those tax positions requiring recognition are measured as the largest amount of tax benefit that is greater than 50% likely of being realised upon effective settlement with a taxing authority that has full knowledge of all relevant information. Interest and penalties relating to taxation are included in tax on profit on ordinary activities in the consolidated profit and loss account. The group’s drilling rigs frequently move from one taxing jurisdiction to another based on where they are contracted to perform drilling services. The movement of drilling rigs among taxing jurisdictions may involve a transfer of drilling rig ownership among the group’s subsidiaries. The pre-tax profit resulting from intercompany rig sales is eliminated and the carrying value of rigs sold in intercompany transactions remains at the historical net depreciated cost prior to the transaction. The consolidated financial statements do not reflect the asset disposition transaction of the selling subsidiary or the asset acquisition transaction of the acquiring subsidiary. Taxation resulting from the transfer of drilling rig ownership among subsidiaries, as well as the tax effect of any reversing temporary differences resulting from the transfers, is recognised in tax on profit on ordinary activities in the year that the intercompany rig sale occurs with a corresponding deferred tax asset recognised and amortised over the remaining useful life of the related rig. In some instances, the group may determine that certain temporary differences will not result in a taxable or deductible amount in future years, as it is more-likely-than-not the group will depart from a given taxing jurisdiction without such temporary differences being recovered or settled. Under these circumstances, no future tax consequences are expected and no deferred taxes are recognised in connection with such operations. The group evaluates these determinations on a periodic basis and, in the event the group’s expectations relative to future tax consequences change, the applicable deferred taxes are recognised. Dividend income received by Ensco plc from its subsidiaries is exempt from UK taxation. We do not provide deferred taxes on undistributed earnings of certain subsidiaries because our policy and intention is to reinvest such earnings indefinitely. Each of the subsidiaries for which we maintain such policy has significant net assets, liquidity, contract backlog and/or other financial resources available to meet operational and capital investment requirements and otherwise allow us to continue to maintain our policy of reinvesting the undistributed earnings indefinitely. Share-based compensation The group sponsors several share-based compensation plans that provide equity compensation to the group’s employees, officers and directors. Share-based compensation cost is measured at fair value on the date of grant and recognised over the period in which each employee becomes unconditionally entitled to the awards (usually the vesting period). The amount of compensation cost recognised in the consolidated profit and loss account with a corresponding increase in equity, is based on the awards ultimately expected to vest and, therefore, reduced for estimated forfeitures. All changes in estimated forfeitures are based on historical experience and are recognised as a cumulative adjustment to compensation cost in the period in which they occur. See "Note 25 – Employee compensation schemes" for additional information on the group’s share-based compensation. Financial assets and liabilities The company has elected not to adopt FRS 26, "Financial Instruments: Recognition and Measurement." Financial assets and liabilities consist of marketable securities held in the group’s supplemental executive retirement plans (SERP) and derivatives. The SERP are non-qualified plans where eligible employees may defer a portion of their compensation for use after retirement. Assets held in the SERP consist of marketable securities and are measured at fair value based on quoted market prices. SERP assets are held on behalf of employees and are not available for use by the group. The group uses various derivative financial instruments to manage its exposure to foreign currency exchange rate risk. Derivatives are measured at cost. Gains and losses on derivatives are recognised upon maturity.
41
Notes (continued)
1 Accounting policies (continued) Interest bearing borrowings All interest bearing borrowings are immediately recognised at net proceeds. After initial recognition, debt is increased by the amortisation of finance cost and reduced by repayments made in the year. Finance costs of debt are charged to the profit and loss account over the term of the debt at a constant rate on the carrying amount. Provisions for litigation and other items Provisions for legal claims or actions against the group are recognised when it is more-likely-than-not that the group has a present obligation as the result of a past event, and it is probable that an outflow of economic benefits will be required to settle the obligation. Stocks Stocks are stated at the lower of cost or net realisable value. Net realisable value is based on estimated selling price less any further costs expected to be incurred on disposal. Leases Operating lease rentals are charged to the profit and loss account on a straight-line basis over the term of the lease. Dividends on shares presented within equity Dividends unpaid at the balance sheet date are only recognised as a liability at that date to the extent that they are appropriately authorised and are no longer at the discretion of the group. Unpaid dividends that do not meet these criteria are disclosed in the notes to the financial statements. Own shares Transactions of the company sponsored stock compensation trust are treated as being those of the company and are therefore reflected in the parent company and group financial statements. In particular, the trust’s purchases and sales of shares in the company are debited and credited directly to own share reserve. Minority interests Local third parties hold an interest in certain of the group’s subsidiaries. These interests are presented as minority interests within the consolidated balance sheet, profit and loss account and cash flow statement. Earnings per share The Group presents basic and diluted earnings per share data for its ordinary shares. Basic earnings per share is calculated by dividing the profit or loss attributable to ordinary shareholders of the company by the weighted average number of ordinary shares outstanding during the year, adjusted for own shares held. Diluted earnings per share is determined by adjusting the profit or loss attributable to ordinary shareholders and the weighted average number of ordinary shares outstanding, adjusted for own shares held, for the effects of all dilutive potential ordinary shares, consisting of share options granted to employees.
42
Notes (continued)
2 Segmental information Our business consists of three operating segments: (1) Floaters, which includes our drillships and semisubmersible rigs, (2) Jackups and (3) Other, which consists of management services on rigs owned by third-parties. Our two reportable segments, Floaters and Jackups, provide one service, contract drilling.
General and administrative expense and depreciation expense incurred by our corporate office and goodwill amortisation are not allocated to our operating segments for purposes of measuring segment operating profit and were included in "Reconciling Items." Net assets not allocated to the group’s operating segments were also included in "Reconciling Items." The tables below set out information for each of the operating segments. Year ended 31 December 2013
OperatingSegments Reconciling Group
Floaters Jackups Other Total Items Total$ millions $ millions $ millions $ millions $ millions $ millions
TurnoverTurnover to third parties 3,109.5 1,735.2 75.1 4,919.8 - 4,919.8
Operating profit 1,158.2 737.1 16.6 1,911.9 (316.6) 1,595.3
Net loss on disposal of tangible fixed assets - (3.4) - (3.4) - (3.4)
Interest receivable and other similar income - - - - 59.4 59.4
Interest payable and other similar items - - - - (158.8) (158.8)
1,158.2 733.7 16.6 1,908.5 (416.0) 1,492.5
Net assets 11,303.4 2,961.6 - 14,265.0 (2,173.1) 12,091.9
Profit on ordinary activities before taxation
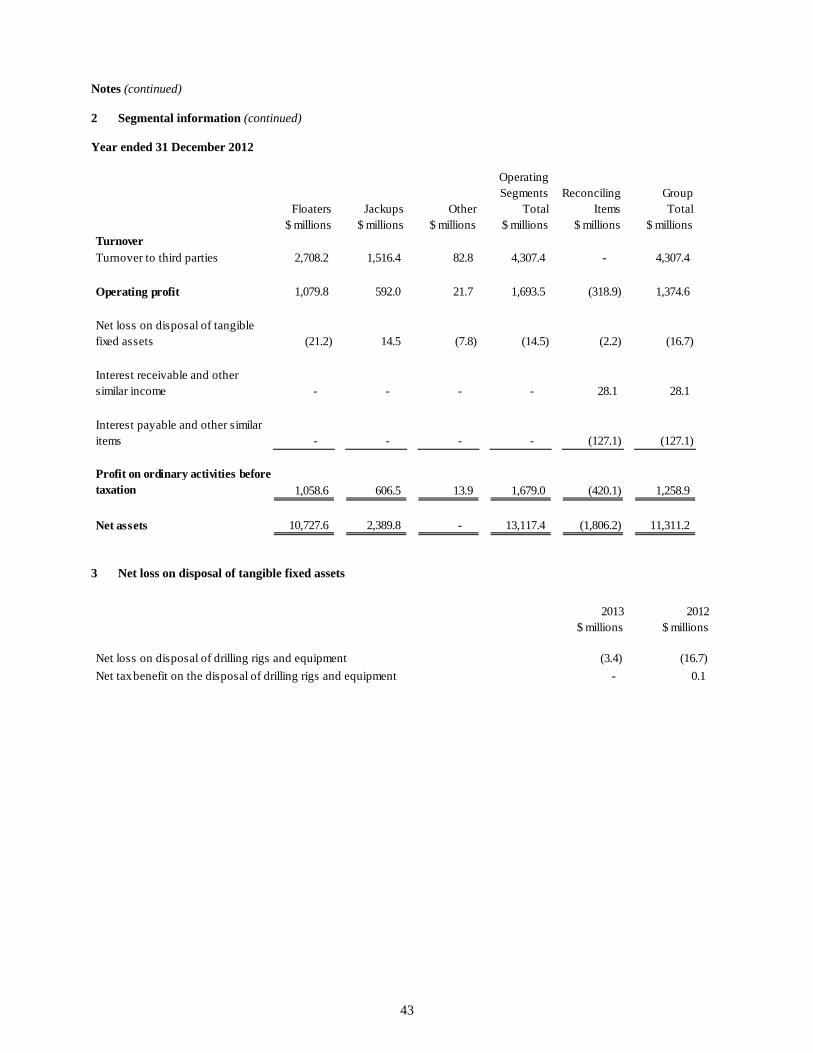
43
Notes (continued)
2 Segmental information (continued) Year ended 31 December 2012
3 Net loss on disposal of tangible fixed assets
OperatingSegments Reconciling Group
Floaters Jackups Other Total Items Total$ millions $ millions $ millions $ millions $ millions $ millions
TurnoverTurnover to third parties 2,708.2 1,516.4 82.8 4,307.4 - 4,307.4
Operating profit 1,079.8 592.0 21.7 1,693.5 (318.9) 1,374.6
Net loss on disposal of tangible fixed assets (21.2) 14.5 (7.8) (14.5) (2.2) (16.7)
Interest receivable and other similar income - - - - 28.1 28.1
Interest payable and other similar items - - - - (127.1) (127.1)
1,058.6 606.5 13.9 1,679.0 (420.1) 1,258.9
Net assets 10,727.6 2,389.8 - 13,117.4 (1,806.2) 11,311.2
Profit on ordinary activities before taxation
2013 2012$ millions $ millions
Net loss on disposal of drilling rigs and equipment (3.4) (16.7)
Net tax benefit on the disposal of drilling rigs and equipment - 0.1
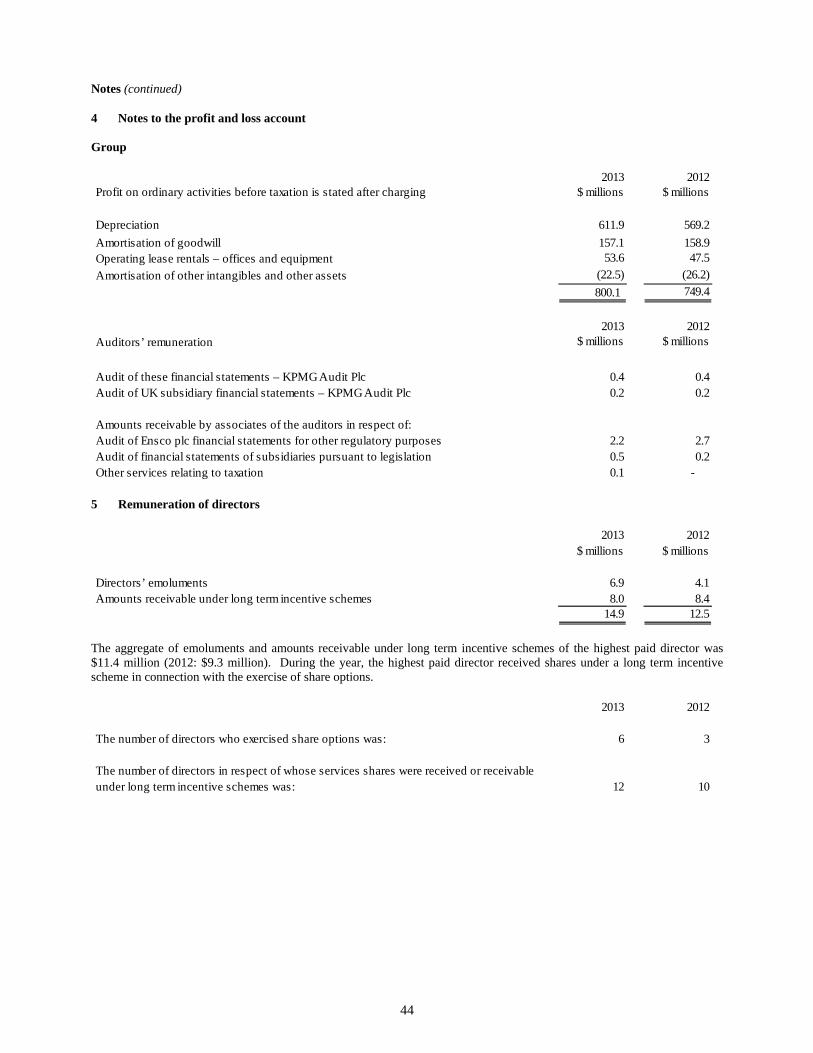
44
Notes (continued)
4 Notes to the profit and loss account Group
5 Remuneration of directors
The aggregate of emoluments and amounts receivable under long term incentive schemes of the highest paid director was $11.4 million (2012: $9.3 million). During the year, the highest paid director received shares under a long term incentive scheme in connection with the exercise of share options.
2013 2012Profit on ordinary activities before taxation is stated after charging $ millions $ millions
Depreciation 611.9 569.2
Amortisation of goodwill 157.1 158.9Operating lease rentals – offices and equipment 53.6 47.5
Amortisation of other intangibles and other assets (22.5) (26.2)
800.1 749.4
2013 2012Auditors’ remuneration $ millions $ millions
Audit of these financial statements – KPMG Audit Plc 0.4 0.4Audit of UK subsidiary financial statements – KPMG Audit Plc 0.2 0.2
Amounts receivable by associates of the auditors in respect of:Audit of Ensco plc financial statements for other regulatory purposes 2.2 2.7Audit of financial statements of subsidiaries pursuant to legislation 0.5 0.2Other services relating to taxation 0.1 -
2013 2012$ millions $ millions
Directors’ emoluments 6.9 4.1Amounts receivable under long term incentive schemes 8.0 8.4
14.9 12.5
2013 2012
The number of directors who exercised share options was: 6 3
12 10The number of directors in respect of whose services shares were received or receivable under long term incentive schemes was:
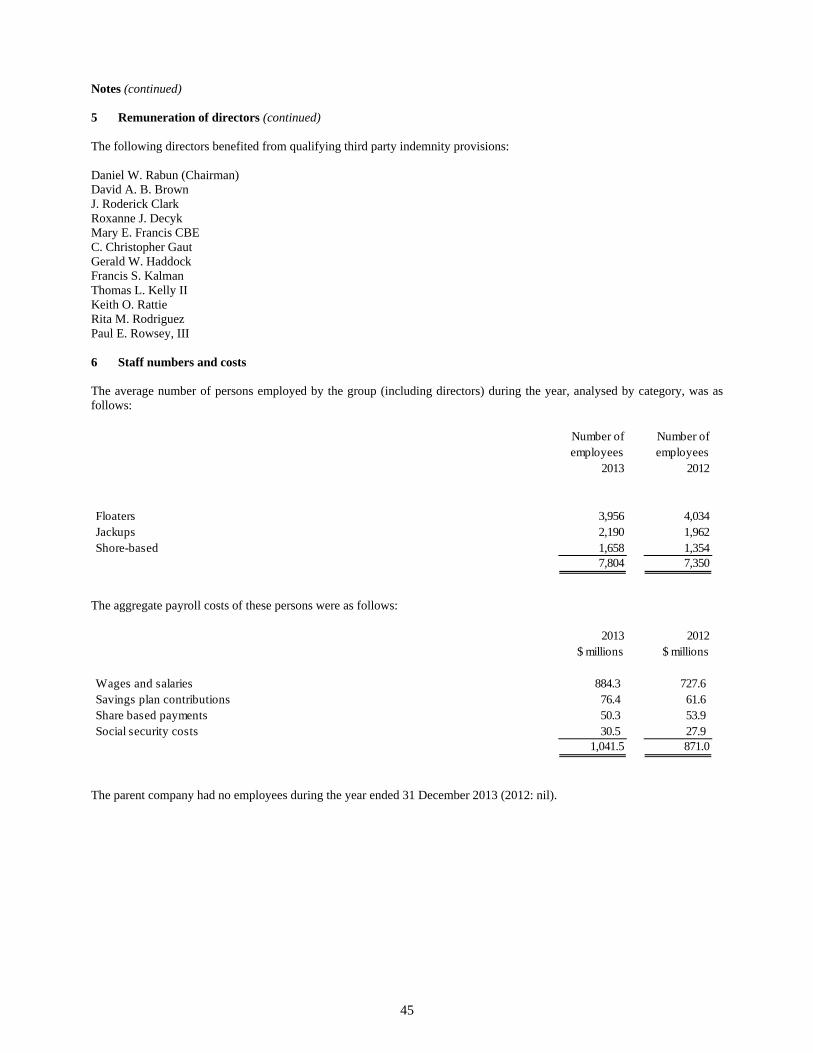
45
Notes (continued) 5 Remuneration of directors (continued) The following directors benefited from qualifying third party indemnity provisions: Daniel W. Rabun (Chairman) David A. B. Brown J. Roderick Clark Roxanne J. Decyk Mary E. Francis CBE C. Christopher Gaut Gerald W. Haddock Francis S. Kalman Thomas L. Kelly II Keith O. Rattie Rita M. Rodriguez Paul E. Rowsey, III 6 Staff numbers and costs The average number of persons employed by the group (including directors) during the year, analysed by category, was as follows:
The aggregate payroll costs of these persons were as follows:
The parent company had no employees during the year ended 31 December 2013 (2012: nil).
Number of employees
Number of employees
2013 2012
Floaters 3,956 4,034 Jackups 2,190 1,962 Shore-based 1,658 1,354
7,804 7,350
2013 2012$ millions $ millions
Wages and salaries 884.3 727.6 Savings plan contributions 76.4 61.6 Share based payments 50.3 53.9 Social security costs 30.5 27.9
1,041.5 871.0
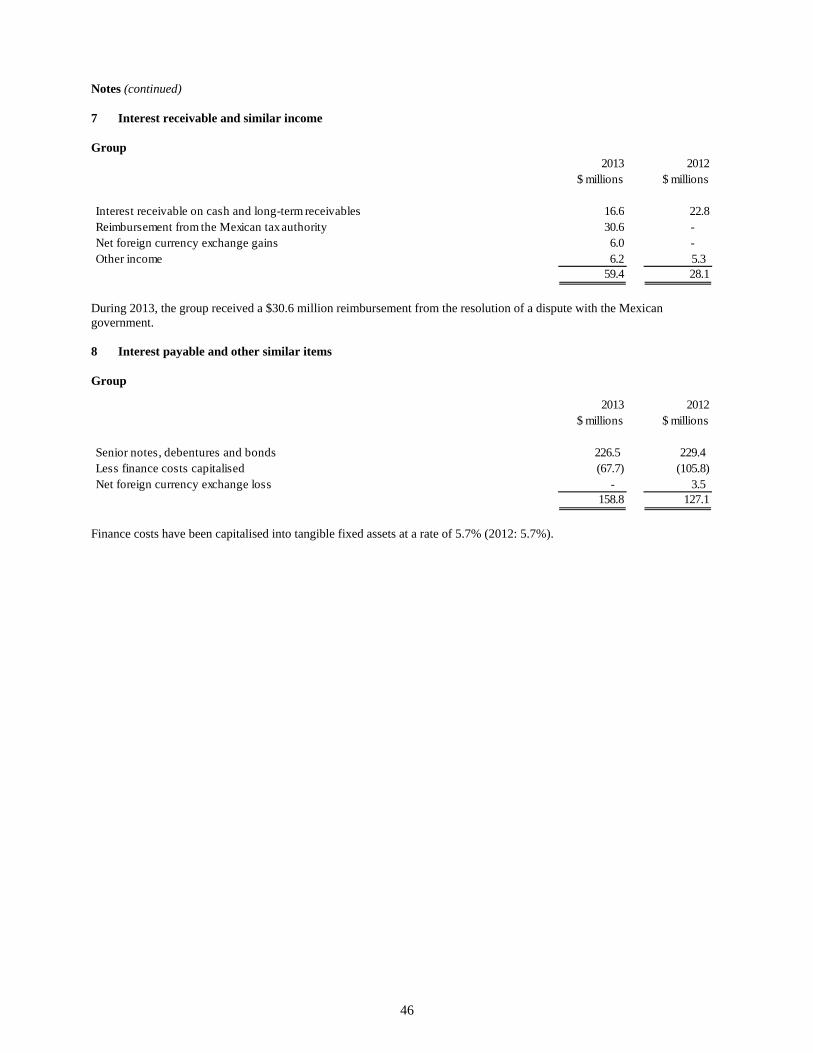
46
Notes (continued)
7 Interest receivable and similar income
Group
During 2013, the group received a $30.6 million reimbursement from the resolution of a dispute with the Mexican government. 8 Interest payable and other similar items
Group
Finance costs have been capitalised into tangible fixed assets at a rate of 5.7% (2012: 5.7%).
2013 2012$ millions $ millions
Interest receivable on cash and long-term receivables 16.6 22.8Reimbursement from the Mexican tax authority 30.6 - Net foreign currency exchange gains 6.0 - Other income 6.2 5.3
59.4 28.1
2013 2012$ millions $ millions
Senior notes, debentures and bonds 226.5 229.4 Less finance costs capitalised (67.7) (105.8)Net foreign currency exchange loss - 3.5
158.8 127.1
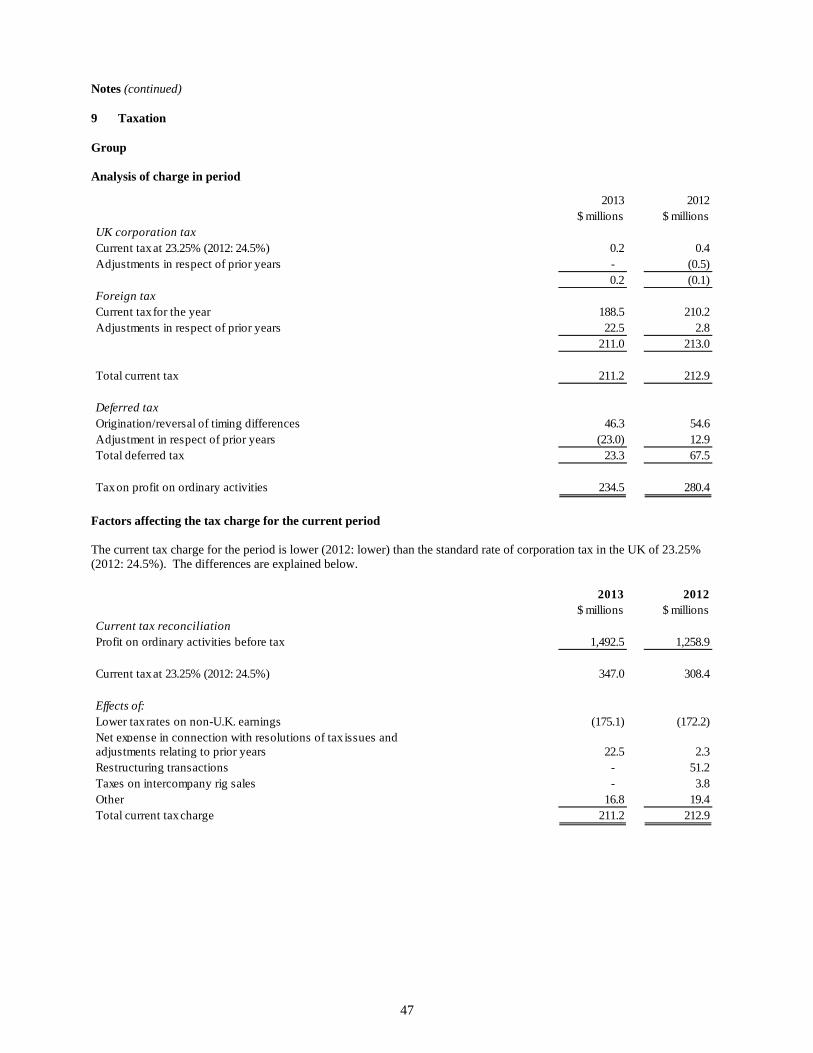
47
Notes (continued)
9 Taxation
Group Analysis of charge in period
Factors affecting the tax charge for the current period The current tax charge for the period is lower (2012: lower) than the standard rate of corporation tax in the UK of 23.25% (2012: 24.5%). The differences are explained below.
2013 2012$ millions $ millions
UK corporation tax Current tax at 23.25% (2012: 24.5%) 0.2 0.4Adjustments in respect of prior years - (0.5)
0.2 (0.1)Foreign taxCurrent tax for the year 188.5 210.2 Adjustments in respect of prior years 22.5 2.8
211.0 213.0
Total current tax 211.2 212.9
Deferred taxOrigination/reversal of timing differences 46.3 54.6 Adjustment in respect of prior years (23.0) 12.9 Total deferred tax 23.3 67.5
Tax on profit on ordinary activities 234.5 280.4
2013 2012$ millions $ millions
Current tax reconciliation Profit on ordinary activities before tax 1,492.5 1,258.9
Current tax at 23.25% (2012: 24.5%) 347.0 308.4
Effects of:Lower tax rates on non-U.K. earnings (175.1) (172.2)Net expense in connection with resolutions of tax issues andadjustments relating to prior years 22.5 2.3 Restructuring transactions - 51.2 Taxes on intercompany rig sales - 3.8 Other 16.8 19.4 Total current tax charge 211.2 212.9
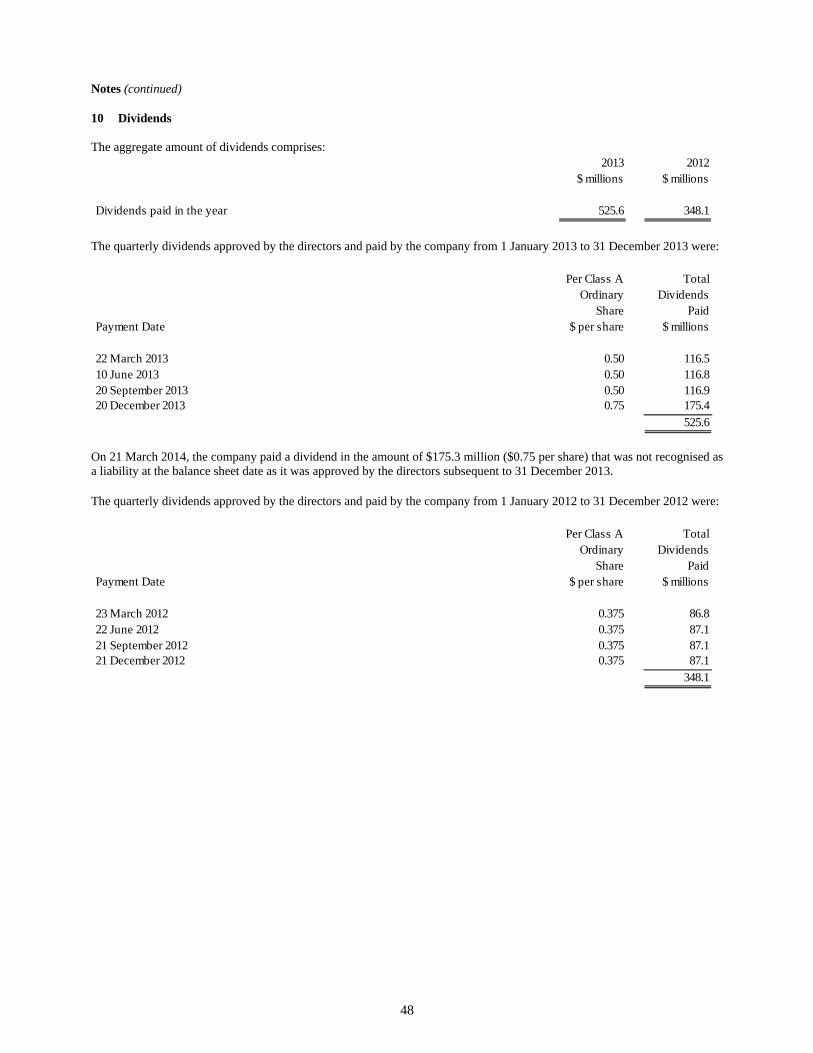
48
Notes (continued)
10 Dividends The aggregate amount of dividends comprises:
The quarterly dividends approved by the directors and paid by the company from 1 January 2013 to 31 December 2013 were:
On 21 March 2014, the company paid a dividend in the amount of $175.3 million ($0.75 per share) that was not recognised as a liability at the balance sheet date as it was approved by the directors subsequent to 31 December 2013. The quarterly dividends approved by the directors and paid by the company from 1 January 2012 to 31 December 2012 were:
2013 2012$ millions $ millions
Dividends paid in the year 525.6 348.1
Per Class A TotalOrdinary Dividends
Share PaidPayment Date $ per share $ millions
22 March 2013 0.50 116.510 June 2013 0.50 116.820 September 2013 0.50 116.920 December 2013 0.75 175.4
525.6
Per Class A TotalOrdinary Dividends
Share PaidPayment Date $ per share $ millions
23 March 2012 0.375 86.822 June 2012 0.375 87.121 September 2012 0.375 87.121 December 2012 0.375 87.1
348.1
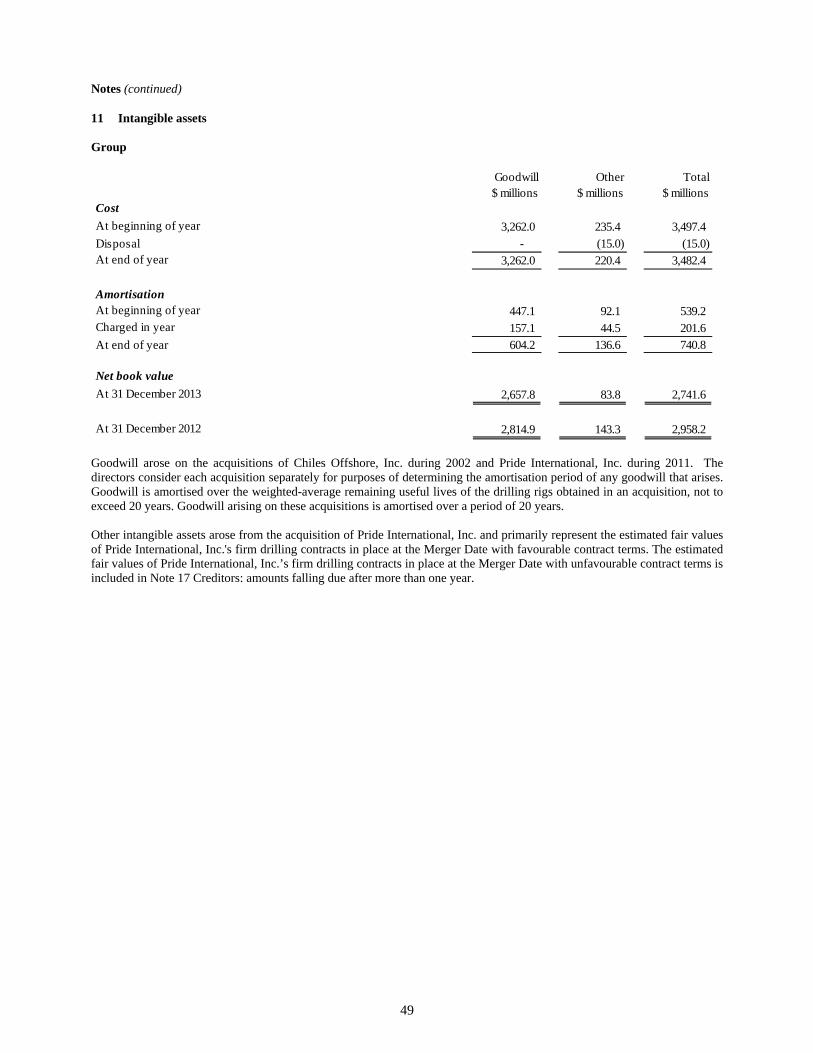
49
Notes (continued)
11 Intangible assets Group
Goodwill arose on the acquisitions of Chiles Offshore, Inc. during 2002 and Pride International, Inc. during 2011. The directors consider each acquisition separately for purposes of determining the amortisation period of any goodwill that arises. Goodwill is amortised over the weighted-average remaining useful lives of the drilling rigs obtained in an acquisition, not to exceed 20 years. Goodwill arising on these acquisitions is amortised over a period of 20 years. Other intangible assets arose from the acquisition of Pride International, Inc. and primarily represent the estimated fair values of Pride International, Inc.'s firm drilling contracts in place at the Merger Date with favourable contract terms. The estimated fair values of Pride International, Inc.’s firm drilling contracts in place at the Merger Date with unfavourable contract terms is included in Note 17 Creditors: amounts falling due after more than one year.
Goodwill Other Total$ millions $ millions $ millions
Cost
At beginning of year 3,262.0 235.4 3,497.4 Disposal - (15.0) (15.0) At end of year 3,262.0 220.4 3,482.4
AmortisationAt beginning of year 447.1 92.1 539.2 Charged in year 157.1 44.5 201.6 At end of year 604.2 136.6 740.8
Net book value
At 31 December 2013 2,657.8 83.8 2,741.6
At 31 December 2012 2,814.9 143.3 2,958.2
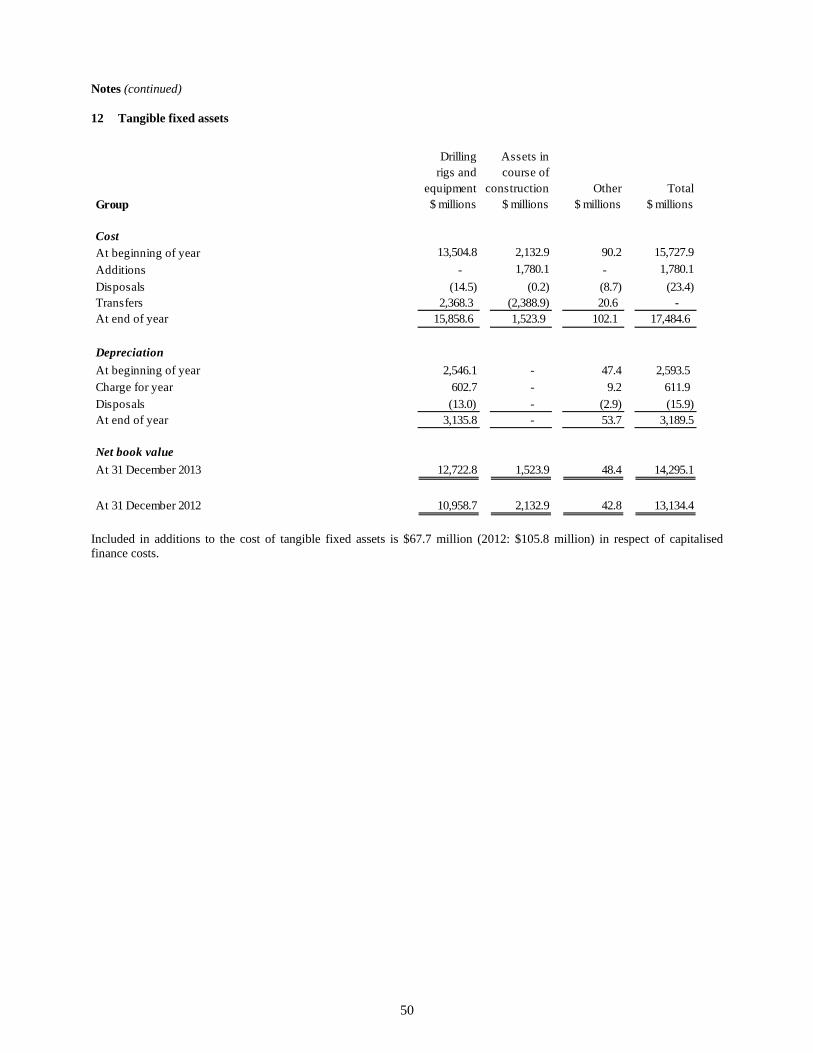
50
Notes (continued)
12 Tangible fixed assets
Included in additions to the cost of tangible fixed assets is $67.7 million (2012: $105.8 million) in respect of capitalised finance costs.
Drilling Assets inrigs and course of
equipment construction Other TotalGroup $ millions $ millions $ millions $ millions
CostAt beginning of year 13,504.8 2,132.9 90.2 15,727.9
Additions - 1,780.1 - 1,780.1
Disposals (14.5) (0.2) (8.7) (23.4)Transfers 2,368.3 (2,388.9) 20.6 - At end of year 15,858.6 1,523.9 102.1 17,484.6
Depreciation
At beginning of year 2,546.1 - 47.4 2,593.5 Charge for year 602.7 - 9.2 611.9
Disposals (13.0) - (2.9) (15.9)At end of year 3,135.8 - 53.7 3,189.5
Net book value
At 31 December 2013 12,722.8 1,523.9 48.4 14,295.1
At 31 December 2012 10,958.7 2,132.9 42.8 13,134.4
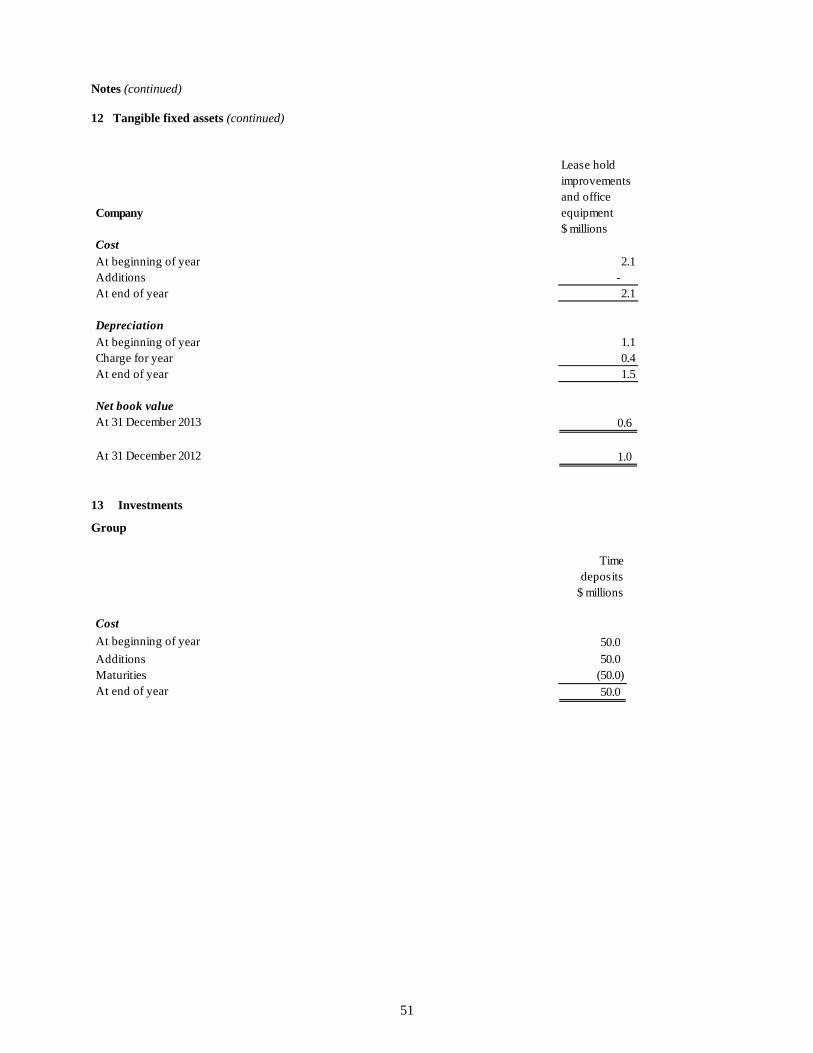
51
Notes (continued)
12 Tangible fixed assets (continued)
13 Investments
Group
Company
Lease hold improvements and office equipment$ millions
CostAt beginning of year 2.1Additions - At end of year 2.1
DepreciationAt beginning of year 1.1Charge for year 0.4At end of year 1.5
Net book valueAt 31 December 2013 0.6
At 31 December 2012 1.0
Time deposits
$ millions
Cost
At beginning of year 50.0
Additions 50.0 Maturities (50.0) At end of year 50.0
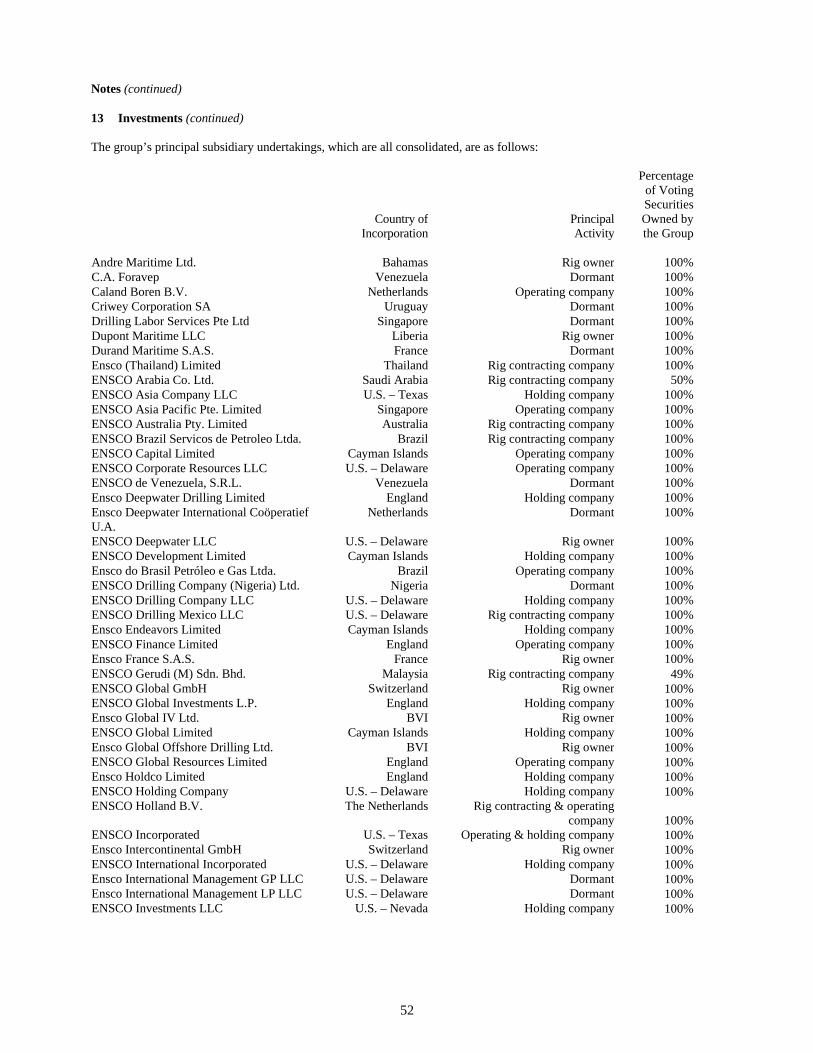
52
Notes (continued)
13 Investments (continued) The group’s principal subsidiary undertakings, which are all consolidated, are as follows:
Country ofIncorporation
PrincipalActivity
Percentageof VotingSecuritiesOwned by the Group
Andre Maritime Ltd. Bahamas Rig owner 100%C.A. Foravep Venezuela Dormant 100%Caland Boren B.V. Netherlands Operating company 100%Criwey Corporation SA Uruguay Dormant 100%Drilling Labor Services Pte Ltd Singapore Dormant 100%Dupont Maritime LLC Liberia Rig owner 100%Durand Maritime S.A.S. France Dormant 100%Ensco (Thailand) Limited Thailand Rig contracting company 100%ENSCO Arabia Co. Ltd. Saudi Arabia Rig contracting company 50%ENSCO Asia Company LLC U.S. – Texas Holding company 100%ENSCO Asia Pacific Pte. Limited Singapore Operating company 100%ENSCO Australia Pty. Limited Australia Rig contracting company 100%ENSCO Brazil Servicos de Petroleo Ltda. Brazil Rig contracting company 100%ENSCO Capital Limited Cayman Islands Operating company 100%ENSCO Corporate Resources LLC U.S. – Delaware Operating company 100%ENSCO de Venezuela, S.R.L. Venezuela Dormant 100%Ensco Deepwater Drilling Limited England Holding company 100%Ensco Deepwater International Coöperatief U.A.
Netherlands Dormant 100%
ENSCO Deepwater LLC U.S. – Delaware Rig owner 100%ENSCO Development Limited Cayman Islands Holding company 100%Ensco do Brasil Petróleo e Gas Ltda. Brazil Operating company 100%ENSCO Drilling Company (Nigeria) Ltd. Nigeria Dormant 100%ENSCO Drilling Company LLC U.S. – Delaware Holding company 100%ENSCO Drilling Mexico LLC U.S. – Delaware Rig contracting company 100%Ensco Endeavors Limited Cayman Islands Holding company 100%ENSCO Finance Limited England Operating company 100%Ensco France S.A.S. France Rig owner 100%ENSCO Gerudi (M) Sdn. Bhd. Malaysia Rig contracting company 49%ENSCO Global GmbH Switzerland Rig owner 100%ENSCO Global Investments L.P. England Holding company 100%Ensco Global IV Ltd. BVI Rig owner 100%ENSCO Global Limited Cayman Islands Holding company 100%Ensco Global Offshore Drilling Ltd. BVI Rig owner 100%ENSCO Global Resources Limited England Operating company 100%Ensco Holdco Limited England Holding company 100%ENSCO Holding Company U.S. – Delaware Holding company 100%ENSCO Holland B.V. The Netherlands Rig contracting & operating
company 100%ENSCO Incorporated U.S. – Texas Operating & holding company 100%Ensco Intercontinental GmbH Switzerland Rig owner 100%ENSCO International Incorporated U.S. – Delaware Holding company 100%Ensco International Management GP LLC U.S. – Delaware Dormant 100%Ensco International Management LP LLC U.S. – Delaware Dormant 100%ENSCO Investments LLC U.S. – Nevada Holding company 100%
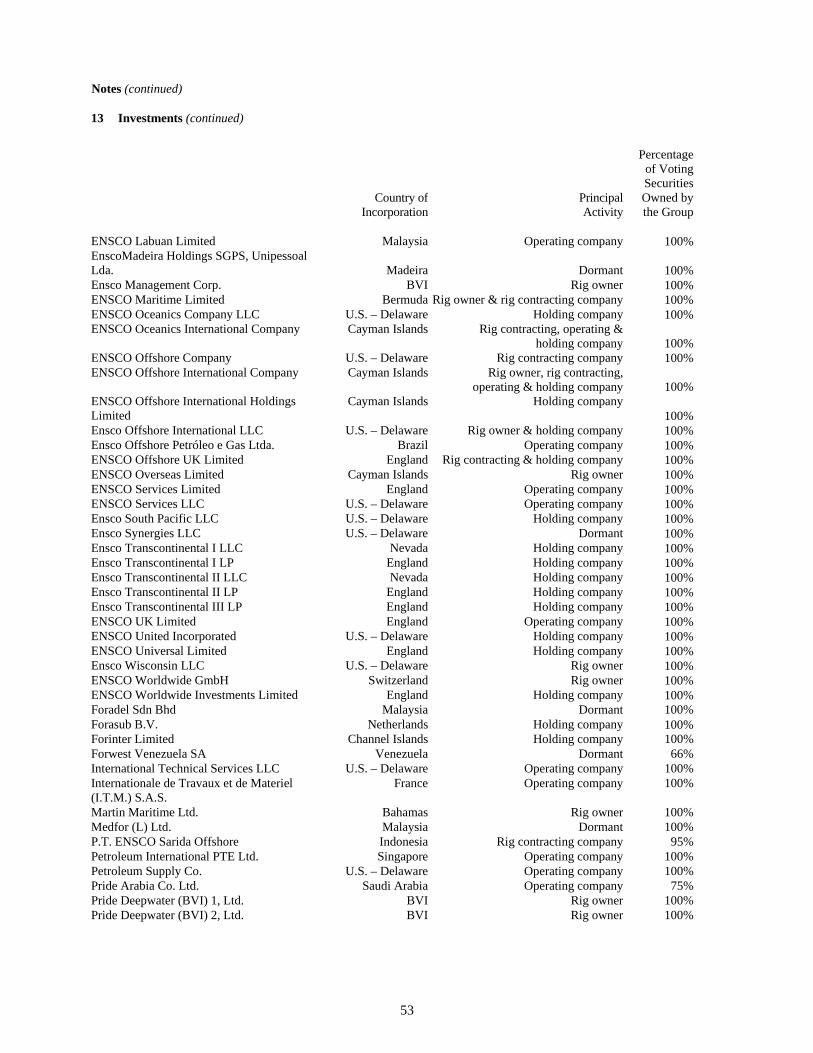
53
Notes (continued)
13 Investments (continued)
Country ofIncorporation
PrincipalActivity
Percentageof VotingSecuritiesOwned by the Group
ENSCO Labuan Limited Malaysia Operating company 100%EnscoMadeira Holdings SGPS, Unipessoal Lda. Madeira Dormant 100%Ensco Management Corp. BVI Rig owner 100%ENSCO Maritime Limited Bermuda Rig owner & rig contracting company 100%ENSCO Oceanics Company LLC U.S. – Delaware Holding company 100%ENSCO Oceanics International Company Cayman Islands Rig contracting, operating &
holding company 100%ENSCO Offshore Company U.S. – Delaware Rig contracting company 100%ENSCO Offshore International Company Cayman Islands Rig owner, rig contracting,
operating & holding company 100%ENSCO Offshore International Holdings Limited
Cayman Islands Holding company100%
Ensco Offshore International LLC U.S. – Delaware Rig owner & holding company 100%Ensco Offshore Petróleo e Gas Ltda. Brazil Operating company 100%ENSCO Offshore UK Limited England Rig contracting & holding company 100%ENSCO Overseas Limited Cayman Islands Rig owner 100%ENSCO Services Limited England Operating company 100%ENSCO Services LLC U.S. – Delaware Operating company 100%Ensco South Pacific LLC U.S. – Delaware Holding company 100%Ensco Synergies LLC U.S. – Delaware Dormant 100%Ensco Transcontinental I LLC Nevada Holding company 100%Ensco Transcontinental I LP England Holding company 100%Ensco Transcontinental II LLC Nevada Holding company 100%Ensco Transcontinental II LP England Holding company 100%Ensco Transcontinental III LP England Holding company 100%ENSCO UK Limited England Operating company 100%ENSCO United Incorporated U.S. – Delaware Holding company 100%ENSCO Universal Limited England Holding company 100%Ensco Wisconsin LLC U.S. – Delaware Rig owner 100%ENSCO Worldwide GmbH Switzerland Rig owner 100%ENSCO Worldwide Investments Limited England Holding company 100%Foradel Sdn Bhd Malaysia Dormant 100%Forasub B.V. Netherlands Holding company 100%Forinter Limited Channel Islands Holding company 100%Forwest Venezuela SA Venezuela Dormant 66%International Technical Services LLC U.S. – Delaware Operating company 100%Internationale de Travaux et de Materiel (I.T.M.) S.A.S.
France Operating company 100%
Martin Maritime Ltd. Bahamas Rig owner 100%Medfor (L) Ltd. Malaysia Dormant 100%P.T. ENSCO Sarida Offshore Indonesia Rig contracting company 95%Petroleum International PTE Ltd. Singapore Operating company 100%Petroleum Supply Co. U.S. – Delaware Operating company 100%Pride Arabia Co. Ltd. Saudi Arabia Operating company 75%Pride Deepwater (BVI) 1, Ltd. BVI Rig owner 100%Pride Deepwater (BVI) 2, Ltd. BVI Rig owner 100%
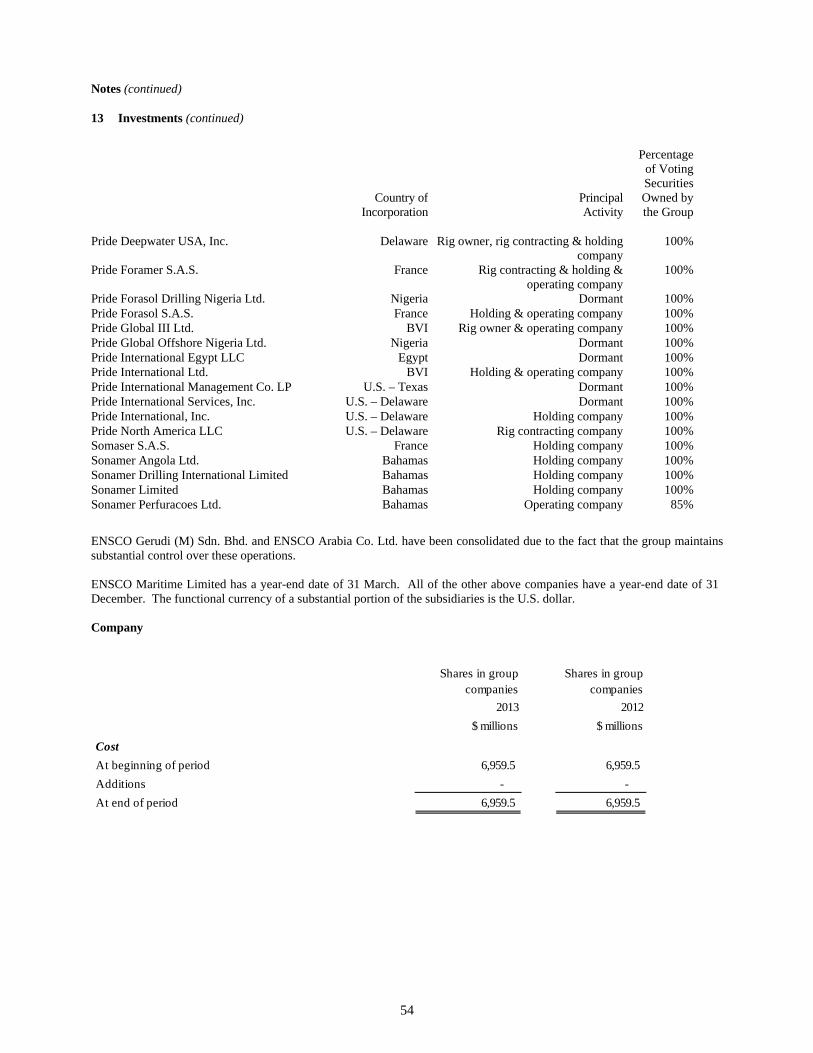
54
Notes (continued)
13 Investments (continued)
Country ofIncorporation
PrincipalActivity
Percentageof VotingSecuritiesOwned by the Group
Pride Deepwater USA, Inc. Delaware Rig owner, rig contracting & holding
company100%
Pride Foramer S.A.S. France Rig contracting & holding & operating company
100%
Pride Forasol Drilling Nigeria Ltd. Nigeria Dormant 100%Pride Forasol S.A.S. France Holding & operating company 100%Pride Global III Ltd. BVI Rig owner & operating company 100%Pride Global Offshore Nigeria Ltd. Nigeria Dormant 100%Pride International Egypt LLC Egypt Dormant 100%Pride International Ltd. BVI Holding & operating company 100%Pride International Management Co. LP U.S. – Texas Dormant 100%Pride International Services, Inc. U.S. – Delaware Dormant 100%Pride International, Inc. U.S. – Delaware Holding company 100%Pride North America LLC U.S. – Delaware Rig contracting company 100%Somaser S.A.S. France Holding company 100%Sonamer Angola Ltd. Bahamas Holding company 100%Sonamer Drilling International Limited Bahamas Holding company 100%Sonamer Limited Bahamas Holding company 100%Sonamer Perfuracoes Ltd. Bahamas Operating company 85%
ENSCO Gerudi (M) Sdn. Bhd. and ENSCO Arabia Co. Ltd. have been consolidated due to the fact that the group maintains substantial control over these operations. ENSCO Maritime Limited has a year-end date of 31 March. All of the other above companies have a year-end date of 31 December. The functional currency of a substantial portion of the subsidiaries is the U.S. dollar. Company
Shares in group companies
Shares in group companies
2013 2012
$ millions $ millions
Cost
At beginning of period 6,959.5 6,959.5
Additions - -
At end of period 6,959.5 6,959.5
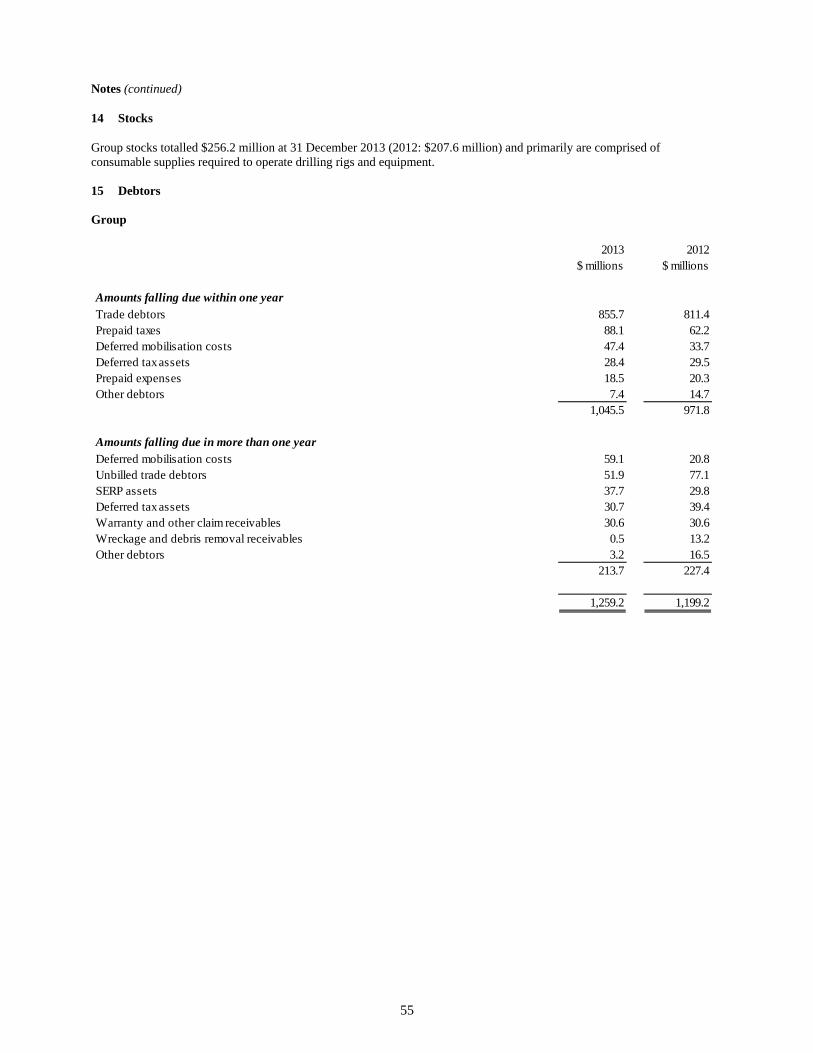
55
Notes (continued)
14 Stocks
Group stocks totalled $256.2 million at 31 December 2013 (2012: $207.6 million) and primarily are comprised of consumable supplies required to operate drilling rigs and equipment. 15 Debtors Group
2013 2012$ millions $ millions
Amounts falling due within one yearTrade debtors 855.7 811.4 Prepaid taxes 88.1 62.2 Deferred mobilisation costs 47.4 33.7 Deferred tax assets 28.4 29.5 Prepaid expenses 18.5 20.3 Other debtors 7.4 14.7
1,045.5 971.8
Amounts falling due in more than one yearDeferred mobilisation costs 59.1 20.8 Unbilled trade debtors 51.9 77.1 SERP assets 37.7 29.8 Deferred tax assets 30.7 39.4 Warranty and other claim receivables 30.6 30.6 Wreckage and debris removal receivables 0.5 13.2 Other debtors 3.2 16.5
213.7 227.4
1,259.2 1,199.2
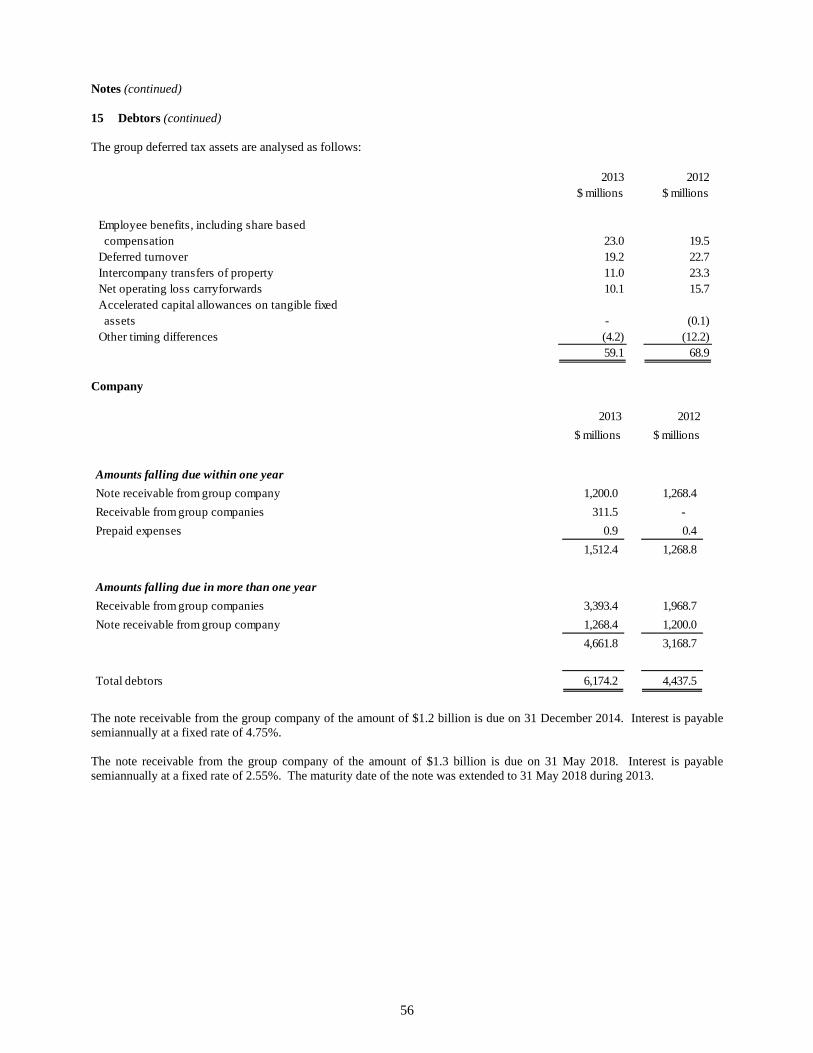
56
Notes (continued)
15 Debtors (continued) The group deferred tax assets are analysed as follows:
Company
The note receivable from the group company of the amount of $1.2 billion is due on 31 December 2014. Interest is payable semiannually at a fixed rate of 4.75%. The note receivable from the group company of the amount of $1.3 billion is due on 31 May 2018. Interest is payable semiannually at a fixed rate of 2.55%. The maturity date of the note was extended to 31 May 2018 during 2013.
2013 2012$ millions $ millions
Employee benefits, including share based compensation 23.0 19.5 Deferred turnover 19.2 22.7 Intercompany transfers of property 11.0 23.3 Net operating loss carryforwards 10.1 15.7 Accelerated capital allowances on tangible fixed assets - (0.1) Other timing differences (4.2) (12.2)
59.1 68.9
2013 2012
$ millions $ millions
Amounts falling due within one year
Note receivable from group company 1,200.0 1,268.4
Receivable from group companies 311.5 -
Prepaid expenses 0.9 0.4
1,512.4 1,268.8
Amounts falling due in more than one year
Receivable from group companies 3,393.4 1,968.7
Note receivable from group company 1,268.4 1,200.0
4,661.8 3,168.7
Total debtors 6,174.2 4,437.5
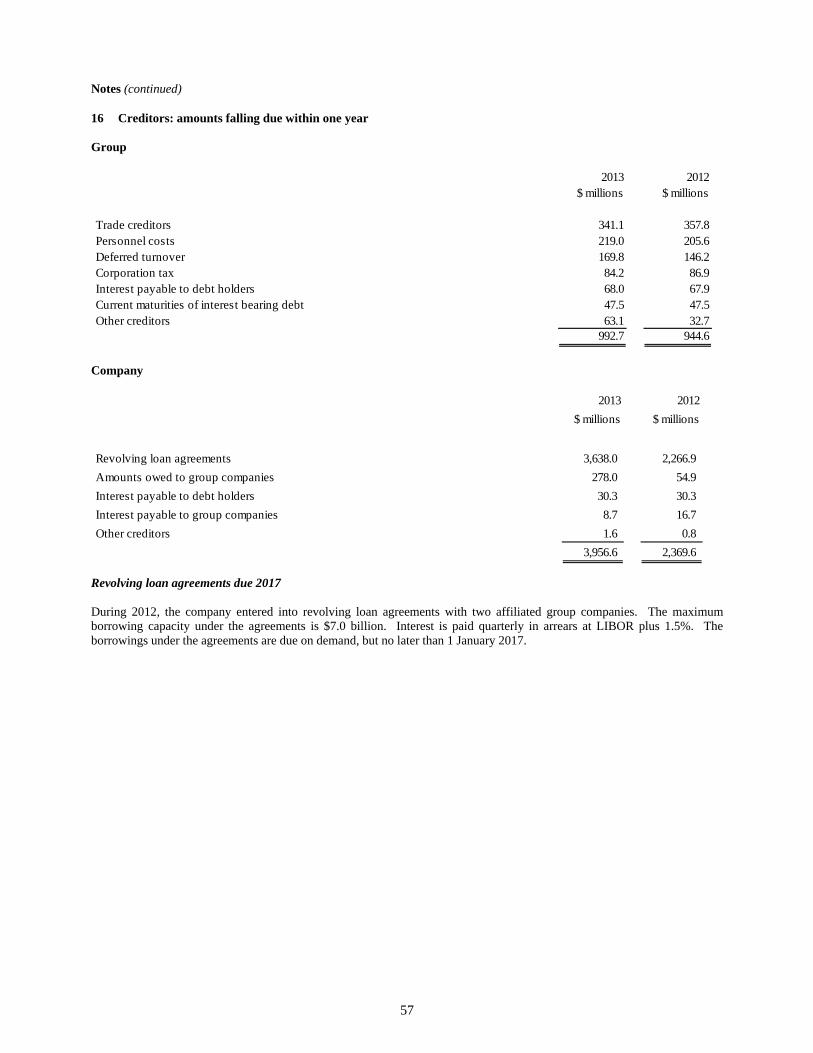
57
Notes (continued)
16 Creditors: amounts falling due within one year Group
Company
Revolving loan agreements due 2017 During 2012, the company entered into revolving loan agreements with two affiliated group companies. The maximum borrowing capacity under the agreements is $7.0 billion. Interest is paid quarterly in arrears at LIBOR plus 1.5%. The borrowings under the agreements are due on demand, but no later than 1 January 2017.
2013 2012$ millions $ millions
Trade creditors 341.1 357.8 Personnel costs 219.0 205.6 Deferred turnover 169.8 146.2 Corporation tax 84.2 86.9 Interest payable to debt holders 68.0 67.9 Current maturities of interest bearing debt 47.5 47.5 Other creditors 63.1 32.7
992.7 944.6
2013 2012
$ millions $ millions
Revolving loan agreements 3,638.0 2,266.9
Amounts owed to group companies 278.0 54.9
Interest payable to debt holders 30.3 30.3
Interest payable to group companies 8.7 16.7
Other creditors 1.6 0.8
3,956.6 2,369.6
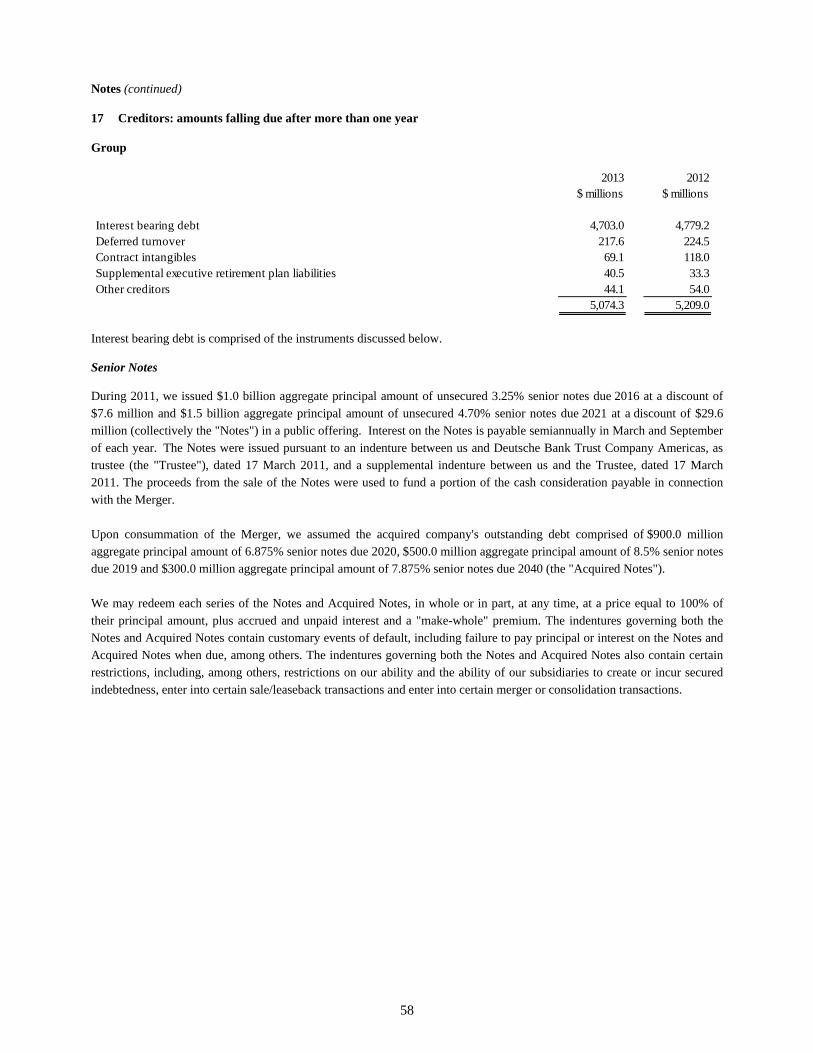
58
Notes (continued)
17 Creditors: amounts falling due after more than one year
Group
Interest bearing debt is comprised of the instruments discussed below. Senior Notes During 2011, we issued $1.0 billion aggregate principal amount of unsecured 3.25% senior notes due 2016 at a discount of $7.6 million and $1.5 billion aggregate principal amount of unsecured 4.70% senior notes due 2021 at a discount of $29.6 million (collectively the "Notes") in a public offering. Interest on the Notes is payable semiannually in March and September of each year. The Notes were issued pursuant to an indenture between us and Deutsche Bank Trust Company Americas, as trustee (the "Trustee"), dated 17 March 2011, and a supplemental indenture between us and the Trustee, dated 17 March 2011. The proceeds from the sale of the Notes were used to fund a portion of the cash consideration payable in connection with the Merger. Upon consummation of the Merger, we assumed the acquired company's outstanding debt comprised of $900.0 million aggregate principal amount of 6.875% senior notes due 2020, $500.0 million aggregate principal amount of 8.5% senior notes due 2019 and $300.0 million aggregate principal amount of 7.875% senior notes due 2040 (the "Acquired Notes"). We may redeem each series of the Notes and Acquired Notes, in whole or in part, at any time, at a price equal to 100% of their principal amount, plus accrued and unpaid interest and a "make-whole" premium. The indentures governing both the Notes and Acquired Notes contain customary events of default, including failure to pay principal or interest on the Notes and Acquired Notes when due, among others. The indentures governing both the Notes and Acquired Notes also contain certain restrictions, including, among others, restrictions on our ability and the ability of our subsidiaries to create or incur secured indebtedness, enter into certain sale/leaseback transactions and enter into certain merger or consolidation transactions.
2013 2012$ millions $ millions
Interest bearing debt 4,703.0 4,779.2Deferred turnover 217.6 224.5Contract intangibles 69.1 118.0Supplemental executive retirement plan liabilities 40.5 33.3Other creditors 44.1 54.0
5,074.3 5,209.0
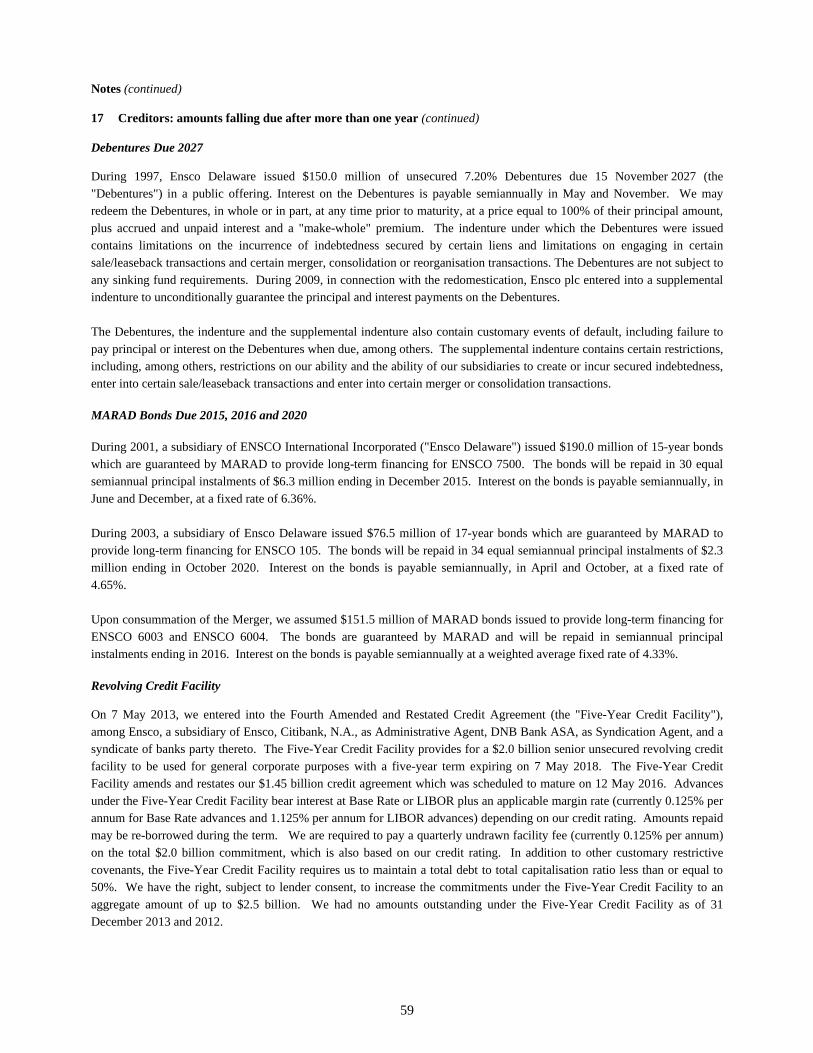
59
Notes (continued)
17 Creditors: amounts falling due after more than one year (continued)
Debentures Due 2027 During 1997, Ensco Delaware issued $150.0 million of unsecured 7.20% Debentures due 15 November 2027 (the "Debentures") in a public offering. Interest on the Debentures is payable semiannually in May and November. We may redeem the Debentures, in whole or in part, at any time prior to maturity, at a price equal to 100% of their principal amount, plus accrued and unpaid interest and a "make-whole" premium. The indenture under which the Debentures were issued contains limitations on the incurrence of indebtedness secured by certain liens and limitations on engaging in certain sale/leaseback transactions and certain merger, consolidation or reorganisation transactions. The Debentures are not subject to any sinking fund requirements. During 2009, in connection with the redomestication, Ensco plc entered into a supplemental indenture to unconditionally guarantee the principal and interest payments on the Debentures. The Debentures, the indenture and the supplemental indenture also contain customary events of default, including failure to pay principal or interest on the Debentures when due, among others. The supplemental indenture contains certain restrictions, including, among others, restrictions on our ability and the ability of our subsidiaries to create or incur secured indebtedness, enter into certain sale/leaseback transactions and enter into certain merger or consolidation transactions.
MARAD Bonds Due 2015, 2016 and 2020 During 2001, a subsidiary of ENSCO International Incorporated ("Ensco Delaware") issued $190.0 million of 15-year bonds which are guaranteed by MARAD to provide long-term financing for ENSCO 7500. The bonds will be repaid in 30 equal semiannual principal instalments of $6.3 million ending in December 2015. Interest on the bonds is payable semiannually, in June and December, at a fixed rate of 6.36%. During 2003, a subsidiary of Ensco Delaware issued $76.5 million of 17-year bonds which are guaranteed by MARAD to provide long-term financing for ENSCO 105. The bonds will be repaid in 34 equal semiannual principal instalments of $2.3 million ending in October 2020. Interest on the bonds is payable semiannually, in April and October, at a fixed rate of 4.65%. Upon consummation of the Merger, we assumed $151.5 million of MARAD bonds issued to provide long-term financing for ENSCO 6003 and ENSCO 6004. The bonds are guaranteed by MARAD and will be repaid in semiannual principal instalments ending in 2016. Interest on the bonds is payable semiannually at a weighted average fixed rate of 4.33%. Revolving Credit Facility On 7 May 2013, we entered into the Fourth Amended and Restated Credit Agreement (the "Five-Year Credit Facility"), among Ensco, a subsidiary of Ensco, Citibank, N.A., as Administrative Agent, DNB Bank ASA, as Syndication Agent, and a syndicate of banks party thereto. The Five-Year Credit Facility provides for a $2.0 billion senior unsecured revolving credit facility to be used for general corporate purposes with a five-year term expiring on 7 May 2018. The Five-Year Credit Facility amends and restates our $1.45 billion credit agreement which was scheduled to mature on 12 May 2016. Advances under the Five-Year Credit Facility bear interest at Base Rate or LIBOR plus an applicable margin rate (currently 0.125% per annum for Base Rate advances and 1.125% per annum for LIBOR advances) depending on our credit rating. Amounts repaid may be re-borrowed during the term. We are required to pay a quarterly undrawn facility fee (currently 0.125% per annum) on the total $2.0 billion commitment, which is also based on our credit rating. In addition to other customary restrictive covenants, the Five-Year Credit Facility requires us to maintain a total debt to total capitalisation ratio less than or equal to 50%. We have the right, subject to lender consent, to increase the commitments under the Five-Year Credit Facility to an aggregate amount of up to $2.5 billion. We had no amounts outstanding under the Five-Year Credit Facility as of 31 December 2013 and 2012.
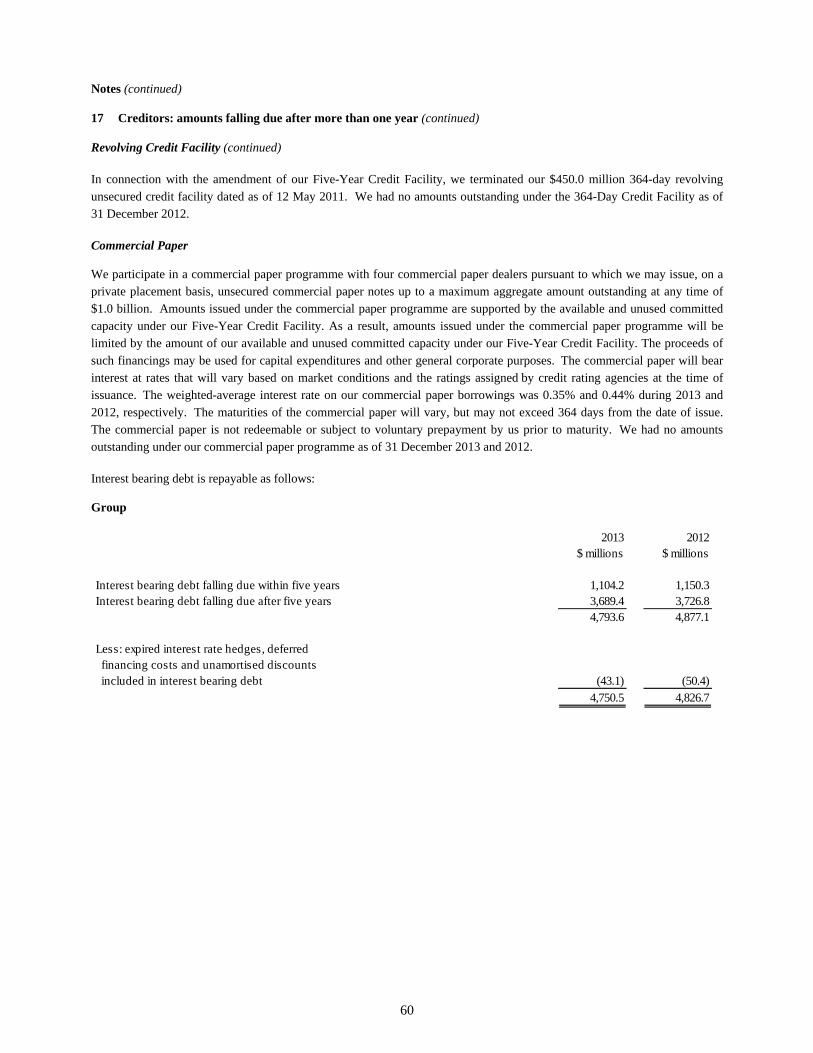
60
Notes (continued)
17 Creditors: amounts falling due after more than one year (continued)
Revolving Credit Facility (continued) In connection with the amendment of our Five-Year Credit Facility, we terminated our $450.0 million 364-day revolving unsecured credit facility dated as of 12 May 2011. We had no amounts outstanding under the 364-Day Credit Facility as of 31 December 2012.
Commercial Paper We participate in a commercial paper programme with four commercial paper dealers pursuant to which we may issue, on a private placement basis, unsecured commercial paper notes up to a maximum aggregate amount outstanding at any time of $1.0 billion. Amounts issued under the commercial paper programme are supported by the available and unused committed capacity under our Five-Year Credit Facility. As a result, amounts issued under the commercial paper programme will be limited by the amount of our available and unused committed capacity under our Five-Year Credit Facility. The proceeds of such financings may be used for capital expenditures and other general corporate purposes. The commercial paper will bear interest at rates that will vary based on market conditions and the ratings assigned by credit rating agencies at the time of issuance. The weighted-average interest rate on our commercial paper borrowings was 0.35% and 0.44% during 2013 and 2012, respectively. The maturities of the commercial paper will vary, but may not exceed 364 days from the date of issue. The commercial paper is not redeemable or subject to voluntary prepayment by us prior to maturity. We had no amounts outstanding under our commercial paper programme as of 31 December 2013 and 2012. Interest bearing debt is repayable as follows: Group
2013 2012$ millions $ millions
Interest bearing debt falling due within five years 1,104.2 1,150.3Interest bearing debt falling due after five years 3,689.4 3,726.8
4,793.6 4,877.1
Less: expired interest rate hedges, deferred financing costs and unamortised discounts included in interest bearing debt (43.1) (50.4)
4,750.5 4,826.7
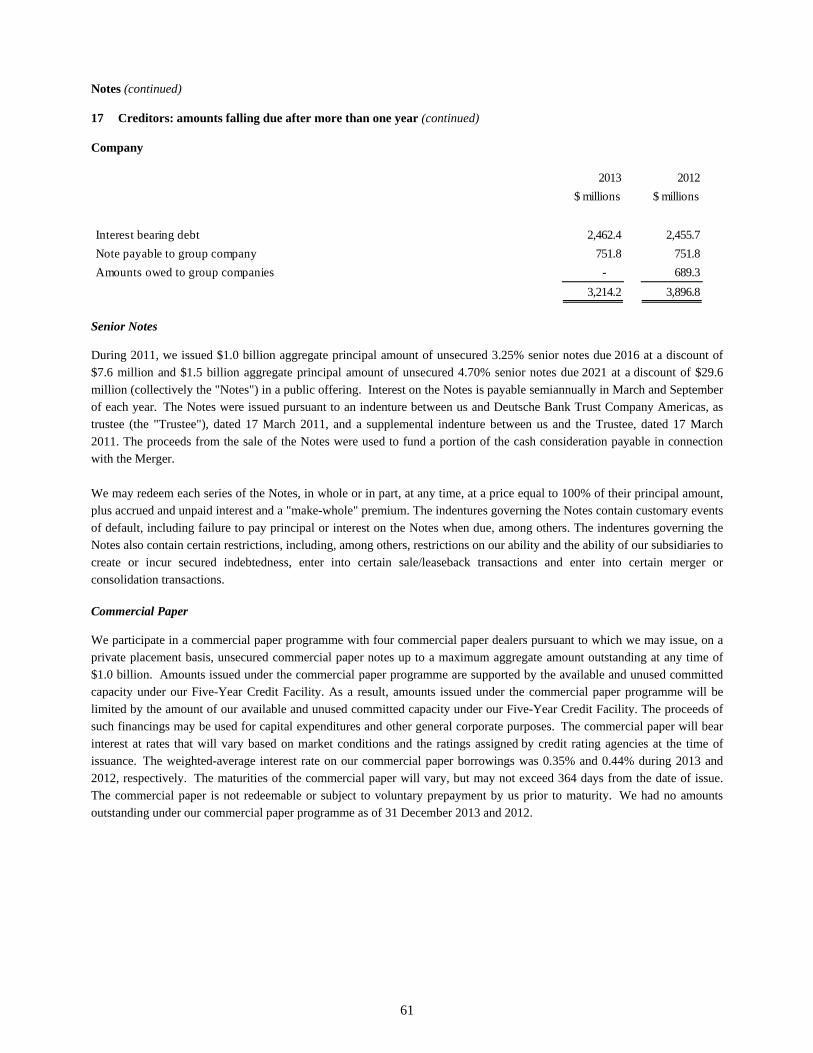
61
Notes (continued)
17 Creditors: amounts falling due after more than one year (continued)
Company
Senior Notes During 2011, we issued $1.0 billion aggregate principal amount of unsecured 3.25% senior notes due 2016 at a discount of $7.6 million and $1.5 billion aggregate principal amount of unsecured 4.70% senior notes due 2021 at a discount of $29.6 million (collectively the "Notes") in a public offering. Interest on the Notes is payable semiannually in March and September of each year. The Notes were issued pursuant to an indenture between us and Deutsche Bank Trust Company Americas, as trustee (the "Trustee"), dated 17 March 2011, and a supplemental indenture between us and the Trustee, dated 17 March 2011. The proceeds from the sale of the Notes were used to fund a portion of the cash consideration payable in connection with the Merger. We may redeem each series of the Notes, in whole or in part, at any time, at a price equal to 100% of their principal amount, plus accrued and unpaid interest and a "make-whole" premium. The indentures governing the Notes contain customary events of default, including failure to pay principal or interest on the Notes when due, among others. The indentures governing the Notes also contain certain restrictions, including, among others, restrictions on our ability and the ability of our subsidiaries to create or incur secured indebtedness, enter into certain sale/leaseback transactions and enter into certain merger or consolidation transactions. Commercial Paper We participate in a commercial paper programme with four commercial paper dealers pursuant to which we may issue, on a private placement basis, unsecured commercial paper notes up to a maximum aggregate amount outstanding at any time of $1.0 billion. Amounts issued under the commercial paper programme are supported by the available and unused committed capacity under our Five-Year Credit Facility. As a result, amounts issued under the commercial paper programme will be limited by the amount of our available and unused committed capacity under our Five-Year Credit Facility. The proceeds of such financings may be used for capital expenditures and other general corporate purposes. The commercial paper will bear interest at rates that will vary based on market conditions and the ratings assigned by credit rating agencies at the time of issuance. The weighted-average interest rate on our commercial paper borrowings was 0.35% and 0.44% during 2013 and 2012, respectively. The maturities of the commercial paper will vary, but may not exceed 364 days from the date of issue. The commercial paper is not redeemable or subject to voluntary prepayment by us prior to maturity. We had no amounts outstanding under our commercial paper programme as of 31 December 2013 and 2012.
2013 2012
$ millions $ millions
Interest bearing debt 2,462.4 2,455.7
Note payable to group company 751.8 751.8
Amounts owed to group companies - 689.3
3,214.2 3,896.8
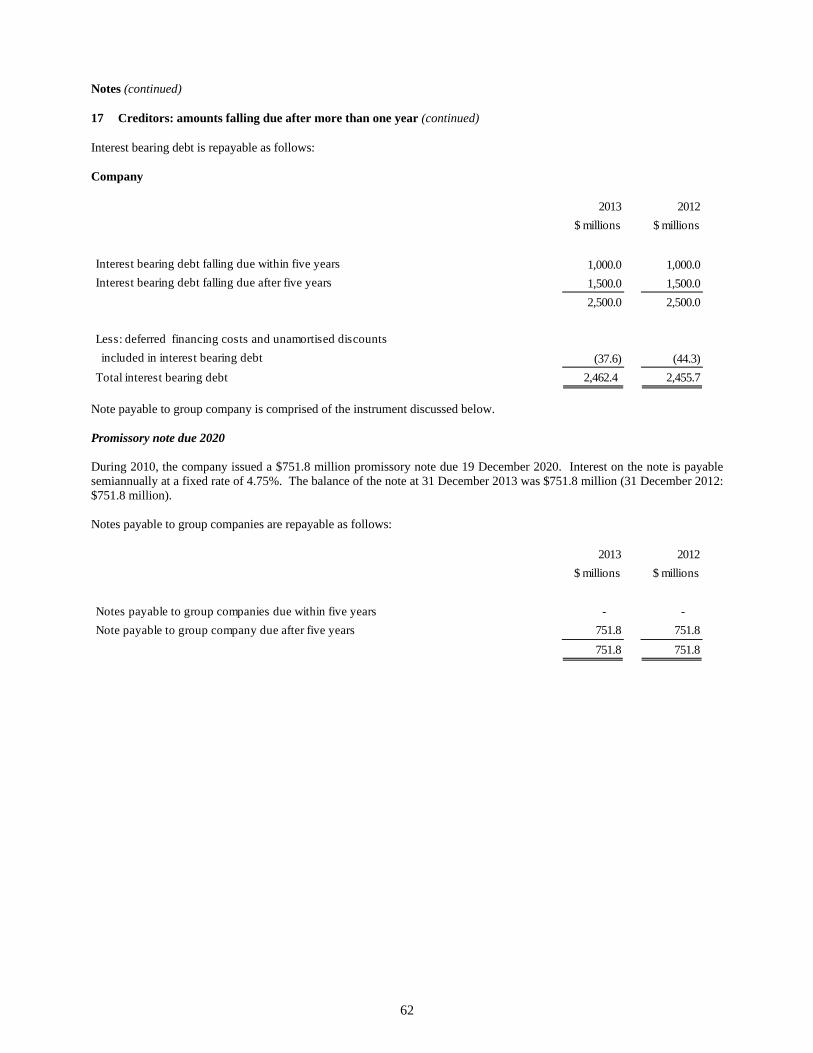
62
Notes (continued)
17 Creditors: amounts falling due after more than one year (continued)
Interest bearing debt is repayable as follows: Company
Note payable to group company is comprised of the instrument discussed below. Promissory note due 2020 During 2010, the company issued a $751.8 million promissory note due 19 December 2020. Interest on the note is payable semiannually at a fixed rate of 4.75%. The balance of the note at 31 December 2013 was $751.8 million (31 December 2012: $751.8 million). Notes payable to group companies are repayable as follows:
2013 2012
$ millions $ millions
Interest bearing debt falling due within five years 1,000.0 1,000.0
Interest bearing debt falling due after five years 1,500.0 1,500.0
2,500.0 2,500.0
Less: deferred financing costs and unamortised discounts
included in interest bearing debt (37.6) (44.3)
Total interest bearing debt 2,462.4 2,455.7
2013 2012
$ millions $ millions
Notes payable to group companies due within five years - -
Note payable to group company due after five years 751.8 751.8
751.8 751.8
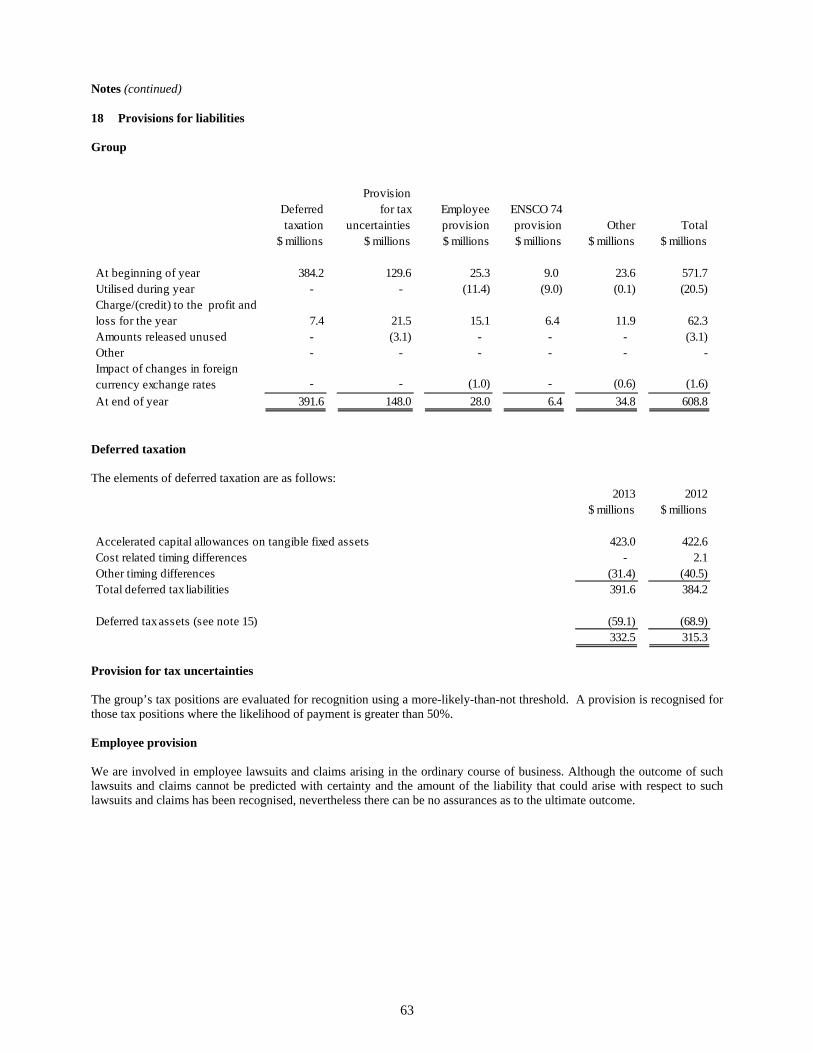
63
Notes (continued)
18 Provisions for liabilities
Group
Deferred taxation The elements of deferred taxation are as follows:
Provision for tax uncertainties The group’s tax positions are evaluated for recognition using a more-likely-than-not threshold. A provision is recognised for those tax positions where the likelihood of payment is greater than 50%. Employee provision We are involved in employee lawsuits and claims arising in the ordinary course of business. Although the outcome of such lawsuits and claims cannot be predicted with certainty and the amount of the liability that could arise with respect to such lawsuits and claims has been recognised, nevertheless there can be no assurances as to the ultimate outcome.
Deferred taxation
Provisionfor tax
uncertaintiesEmployee provision
ENSCO 74 provision Other Total
$ millions $ millions $ millions $ millions $ millions $ millions
At beginning of year 384.2 129.6 25.3 9.0 23.6 571.7 Utilised during year - - (11.4) (9.0) (0.1) (20.5)Charge/(credit) to the profit and loss for the year 7.4 21.5 15.1 6.4 11.9 62.3 Amounts released unused - (3.1) - - - (3.1)Other - - - - - - Impact of changes in foreign currency exchange rates - - (1.0) - (0.6) (1.6)
At end of year 391.6 148.0 28.0 6.4 34.8 608.8
2013 2012$ millions $ millions
Accelerated capital allowances on tangible fixed assets 423.0 422.6Cost related timing differences - 2.1Other timing differences (31.4) (40.5) Total deferred tax liabilities 391.6 384.2
Deferred tax assets (see note 15) (59.1) (68.9) 332.5 315.3
64
Notes (continued)
18 Provisions for liabilities (continued) Wreckage and debris removal provision ENSCO 74 loss During 2008, ENSCO 74 was lost as a result of Hurricane Ike in the U.S. Gulf of Mexico. Portions of its legs remained underwater adjacent to the customer's platform, and the sunken rig hull of ENSCO 74 was located approximately 95 miles from the original drilling location when it was struck by an oil tanker during 2009. Wreck removal operations on the sunken rig hull of ENSCO 74 were completed during 2010. During 2012, we entered into an agreement with the customer pursuant to which, among other matters, the customer agreed to remove the legs. Regardless of the actual removal costs incurred by the customer, we agreed to pay $19.0 million in nine instalments upon the completion of certain milestones during the removal. We have insurance coverage for the actual removal costs incurred by the customer. We have paid $19.0 million to the customer and received $18.5 million in insurance reimbursements through 31 December 2013. Our consolidated balance sheet as of 31 December 2013 included a $0.5 million receivable for recovery of related costs under our insurance policy in other assets, net. We filed a petition for exoneration or limitation of liability under U.S. admiralty and maritime law during 2009. A number of claimants presented claims in the exoneration/limitation proceedings. Currently, only three claimants remain. We have liability insurance policies that provide coverage for such claims as well as removal of wreckage and debris in excess of the property insurance policy sublimit, subject to a $10.0 million per occurrence deductible for third-party claims and an annual aggregate limit of $490.0 million. The owner of the oil tanker that struck the hull of ENSCO 74 filed claims seeking monetary damages currently in excess of $5.0 million for losses incurred when the tanker struck the sunken hull of ENSCO 74. The owner of a pipeline filed claims alleging that ENSCO 74 caused the pipeline to rupture during Hurricane Ike and sought damages for the cost of repairs and business interruption in an amount in excess of $26.0 million. These matters are currently scheduled for trial in April 2014. We have reached an agreement in principle with the owner of the pipeline to settle the claims for $9.6 million. Prior to the settlement, we incurred legal fees of $3.6 million for this matter. Accordingly, we accrued a $6.4 million liability as of 31 December 2013 for the remainder of our deductible under our liability insurance policy. The remaining $3.2 million will be paid by underwriters. Based on information currently available, primarily the adequacy of available defenses, we have not concluded that it is probable a liability exists with respect to the claim by the owner of the oil tanker. We believe all liabilities associated with the ENSCO 74 loss during Hurricane Ike resulted from a single occurrence under the terms of the applicable insurance policies. However, legal counsel for certain liability underwriters have asserted that the liability claims arise from separate occurrences. In the event of multiple occurrences, the deductible is $15.0 million for two occurrences and $1.0 million for each occurrence thereafter. Although we do not expect final disposition of the claims associated with the ENSCO 74 loss to have a material adverse effect upon our financial position, operating results or cash flows, there can be no assurances as to the ultimate outcome.
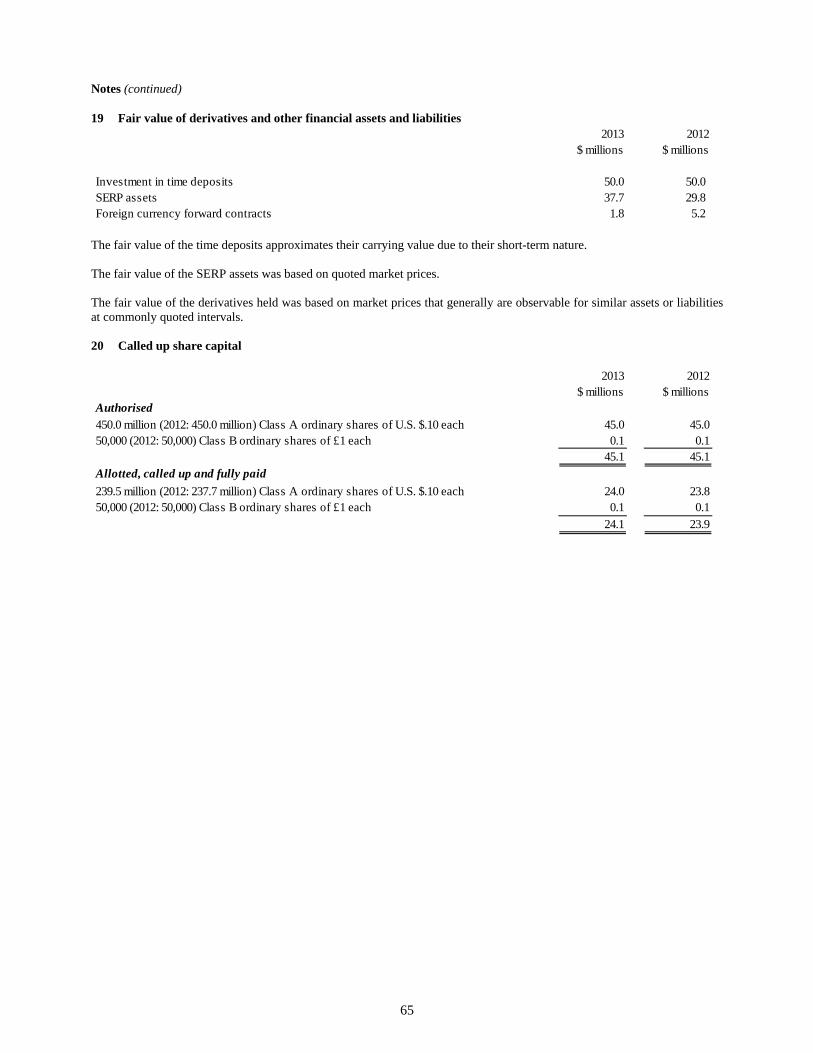
65
Notes (continued)
19 Fair value of derivatives and other financial assets and liabilities
The fair value of the time deposits approximates their carrying value due to their short-term nature. The fair value of the SERP assets was based on quoted market prices. The fair value of the derivatives held was based on market prices that generally are observable for similar assets or liabilities at commonly quoted intervals. 20 Called up share capital
2013 2012$ millions $ millions
Investment in time deposits 50.0 50.0 SERP assets 37.7 29.8 Foreign currency forward contracts 1.8 5.2
2013 2012$ millions $ millions
Authorised450.0 million (2012: 450.0 million) Class A ordinary shares of U.S. $.10 each 45.0 45.0 50,000 (2012: 50,000) Class B ordinary shares of £1 each 0.1 0.1
45.1 45.1
Allotted, called up and fully paid
239.5 million (2012: 237.7 million) Class A ordinary shares of U.S. $.10 each 24.0 23.850,000 (2012: 50,000) Class B ordinary shares of £1 each 0.1 0.1
24.1 23.9
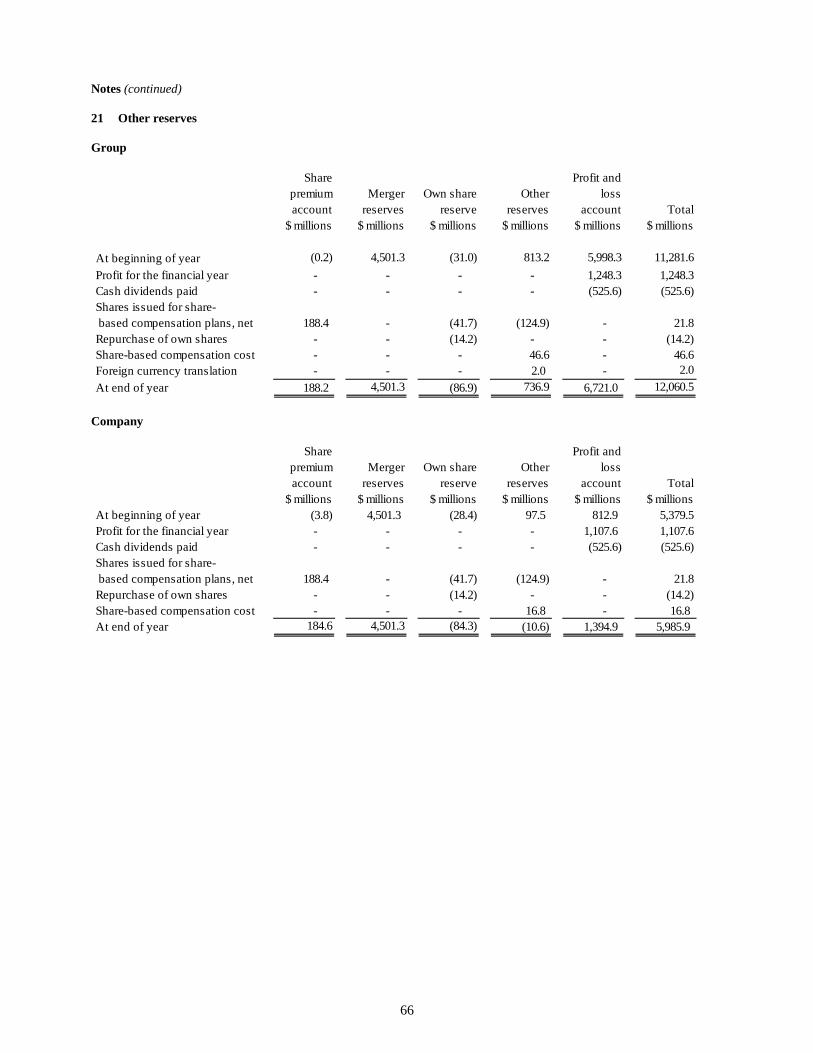
66
Notes (continued)
21 Other reserves
Group
Company
Share premium account
Merger reserves
Own share reserve
Other reserves
Profit and loss
account Total$ millions $ millions $ millions $ millions $ millions $ millions
At beginning of year (0.2) 4,501.3 (31.0) 813.2 5,998.3 11,281.6
Profit for the financial year - - - - 1,248.3 1,248.3 Cash dividends paid - - - - (525.6) (525.6)Shares issued for share- based compensation plans, net 188.4 - (41.7) (124.9) - 21.8 Repurchase of own shares - - (14.2) - - (14.2)Share-based compensation cost - - - 46.6 - 46.6 Foreign currency translation - - - 2.0 - 2.0
At end of year 188.2 4,501.3 (86.9) 736.9 6,721.0 12,060.5
Share premium account
Merger reserves
Own share reserve
Other reserves
Profit and loss
account Total$ millions $ millions $ millions $ millions $ millions $ millions
At beginning of year (3.8) 4,501.3 (28.4) 97.5 812.9 5,379.5 Profit for the financial year - - - - 1,107.6 1,107.6 Cash dividends paid - - - - (525.6) (525.6)Shares issued for share- based compensation plans, net 188.4 - (41.7) (124.9) - 21.8 Repurchase of own shares - - (14.2) - - (14.2)Share-based compensation cost - - - 16.8 - 16.8 At end of year 184.6 4,501.3 (84.3) (10.6) 1,394.9 5,985.9
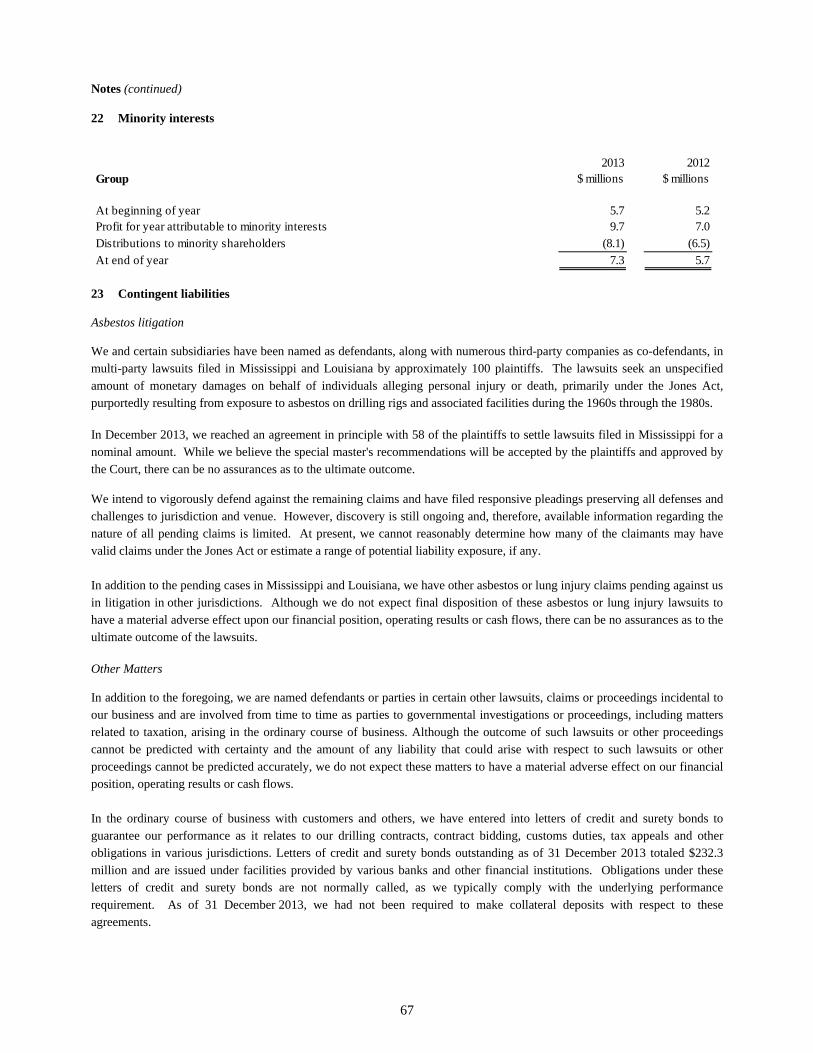
67
Notes (continued)
22 Minority interests
23 Contingent liabilities Asbestos litigation We and certain subsidiaries have been named as defendants, along with numerous third-party companies as co-defendants, in multi-party lawsuits filed in Mississippi and Louisiana by approximately 100 plaintiffs. The lawsuits seek an unspecified amount of monetary damages on behalf of individuals alleging personal injury or death, primarily under the Jones Act, purportedly resulting from exposure to asbestos on drilling rigs and associated facilities during the 1960s through the 1980s. In December 2013, we reached an agreement in principle with 58 of the plaintiffs to settle lawsuits filed in Mississippi for a nominal amount. While we believe the special master's recommendations will be accepted by the plaintiffs and approved by the Court, there can be no assurances as to the ultimate outcome.
We intend to vigorously defend against the remaining claims and have filed responsive pleadings preserving all defenses and challenges to jurisdiction and venue. However, discovery is still ongoing and, therefore, available information regarding the nature of all pending claims is limited. At present, we cannot reasonably determine how many of the claimants may have valid claims under the Jones Act or estimate a range of potential liability exposure, if any. In addition to the pending cases in Mississippi and Louisiana, we have other asbestos or lung injury claims pending against us in litigation in other jurisdictions. Although we do not expect final disposition of these asbestos or lung injury lawsuits to have a material adverse effect upon our financial position, operating results or cash flows, there can be no assurances as to the ultimate outcome of the lawsuits. Other Matters In addition to the foregoing, we are named defendants or parties in certain other lawsuits, claims or proceedings incidental to our business and are involved from time to time as parties to governmental investigations or proceedings, including matters related to taxation, arising in the ordinary course of business. Although the outcome of such lawsuits or other proceedings cannot be predicted with certainty and the amount of any liability that could arise with respect to such lawsuits or other proceedings cannot be predicted accurately, we do not expect these matters to have a material adverse effect on our financial position, operating results or cash flows. In the ordinary course of business with customers and others, we have entered into letters of credit and surety bonds to guarantee our performance as it relates to our drilling contracts, contract bidding, customs duties, tax appeals and other obligations in various jurisdictions. Letters of credit and surety bonds outstanding as of 31 December 2013 totaled $232.3 million and are issued under facilities provided by various banks and other financial institutions. Obligations under these letters of credit and surety bonds are not normally called, as we typically comply with the underlying performance requirement. As of 31 December 2013, we had not been required to make collateral deposits with respect to these agreements.
2013 2012Group $ millions $ millions
At beginning of year 5.7 5.2Profit for year attributable to minority interests 9.7 7.0 Distributions to minority shareholders (8.1) (6.5)
At end of year 7.3 5.7
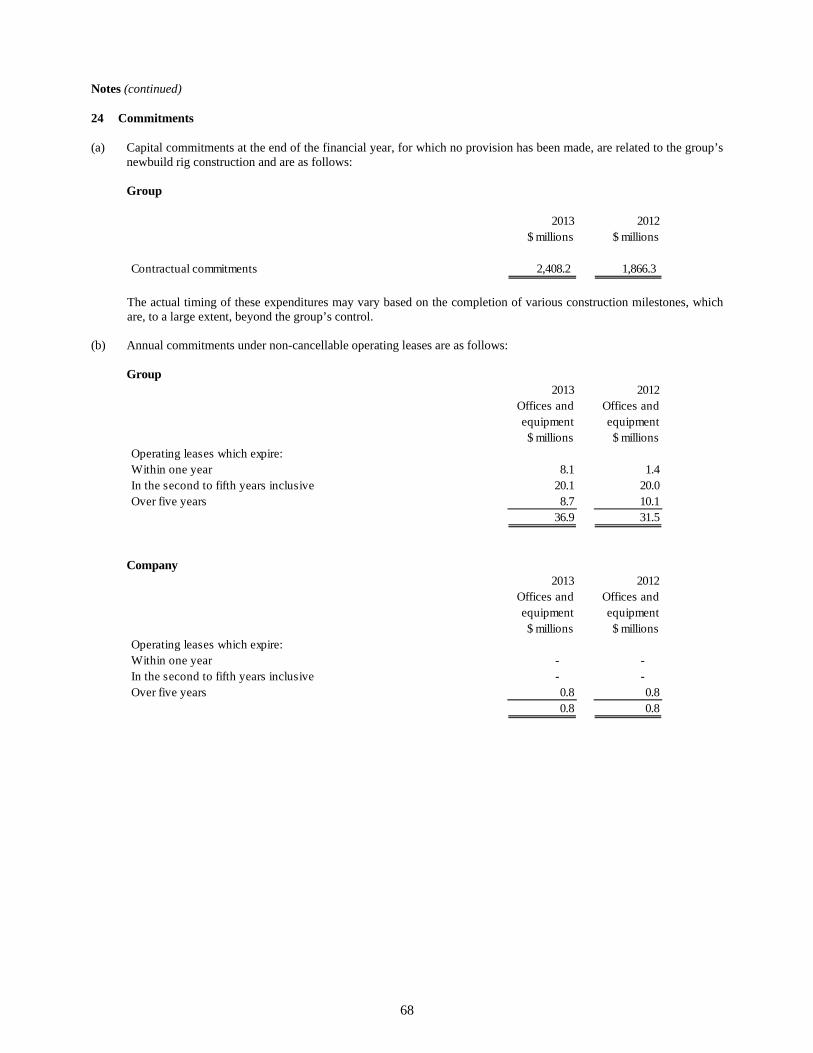
68
Notes (continued)
24 Commitments
(a) Capital commitments at the end of the financial year, for which no provision has been made, are related to the group’s newbuild rig construction and are as follows:
Group
The actual timing of these expenditures may vary based on the completion of various construction milestones, which are, to a large extent, beyond the group’s control.
(b) Annual commitments under non-cancellable operating leases are as follows:
Group
Company
2013 2012$ millions $ millions
Contractual commitments 2,408.2 1,866.3
2013 2012Offices and Offices andequipment equipment$ millions $ millions
Operating leases which expire:Within one year 8.1 1.4In the second to fifth years inclusive 20.1 20.0 Over five years 8.7 10.1
36.9 31.5
2013 2012Offices and Offices andequipment equipment$ millions $ millions
Operating leases which expire:Within one year - - In the second to fifth years inclusive - - Over five years 0.8 0.8
0.8 0.8
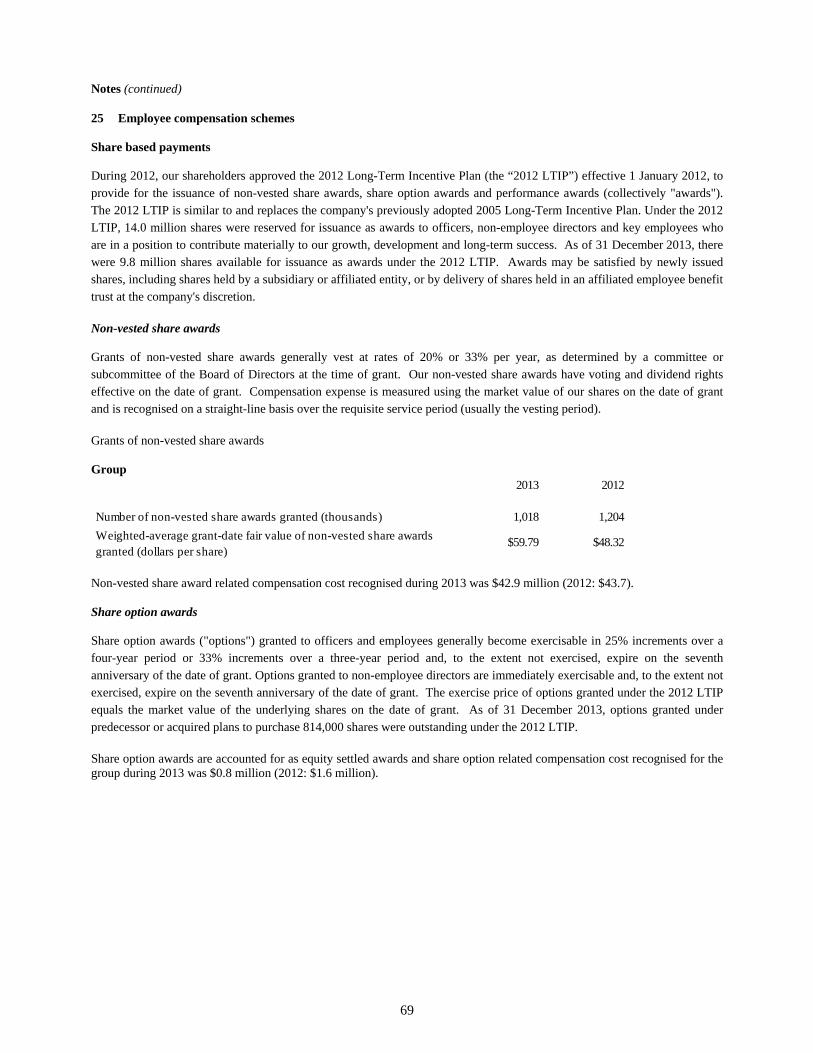
69
Notes (continued)
25 Employee compensation schemes
Share based payments During 2012, our shareholders approved the 2012 Long-Term Incentive Plan (the “2012 LTIP”) effective 1 January 2012, to provide for the issuance of non-vested share awards, share option awards and performance awards (collectively "awards"). The 2012 LTIP is similar to and replaces the company's previously adopted 2005 Long-Term Incentive Plan. Under the 2012 LTIP, 14.0 million shares were reserved for issuance as awards to officers, non-employee directors and key employees who are in a position to contribute materially to our growth, development and long-term success. As of 31 December 2013, there were 9.8 million shares available for issuance as awards under the 2012 LTIP. Awards may be satisfied by newly issued shares, including shares held by a subsidiary or affiliated entity, or by delivery of shares held in an affiliated employee benefit trust at the company's discretion.
Non-vested share awards Grants of non-vested share awards generally vest at rates of 20% or 33% per year, as determined by a committee or subcommittee of the Board of Directors at the time of grant. Our non-vested share awards have voting and dividend rights effective on the date of grant. Compensation expense is measured using the market value of our shares on the date of grant and is recognised on a straight-line basis over the requisite service period (usually the vesting period). Grants of non-vested share awards Group
Non-vested share award related compensation cost recognised during 2013 was $42.9 million (2012: $43.7). Share option awards Share option awards ("options") granted to officers and employees generally become exercisable in 25% increments over a four-year period or 33% increments over a three-year period and, to the extent not exercised, expire on the seventh anniversary of the date of grant. Options granted to non-employee directors are immediately exercisable and, to the extent not exercised, expire on the seventh anniversary of the date of grant. The exercise price of options granted under the 2012 LTIP equals the market value of the underlying shares on the date of grant. As of 31 December 2013, options granted under predecessor or acquired plans to purchase 814,000 shares were outstanding under the 2012 LTIP. Share option awards are accounted for as equity settled awards and share option related compensation cost recognised for the group during 2013 was $0.8 million (2012: $1.6 million).
2013 2012
Number of non-vested share awards granted (thousands) 1,018 1,204
$59.79 $48.32 Weighted-average grant-date fair value of non-vested share awards granted (dollars per share)
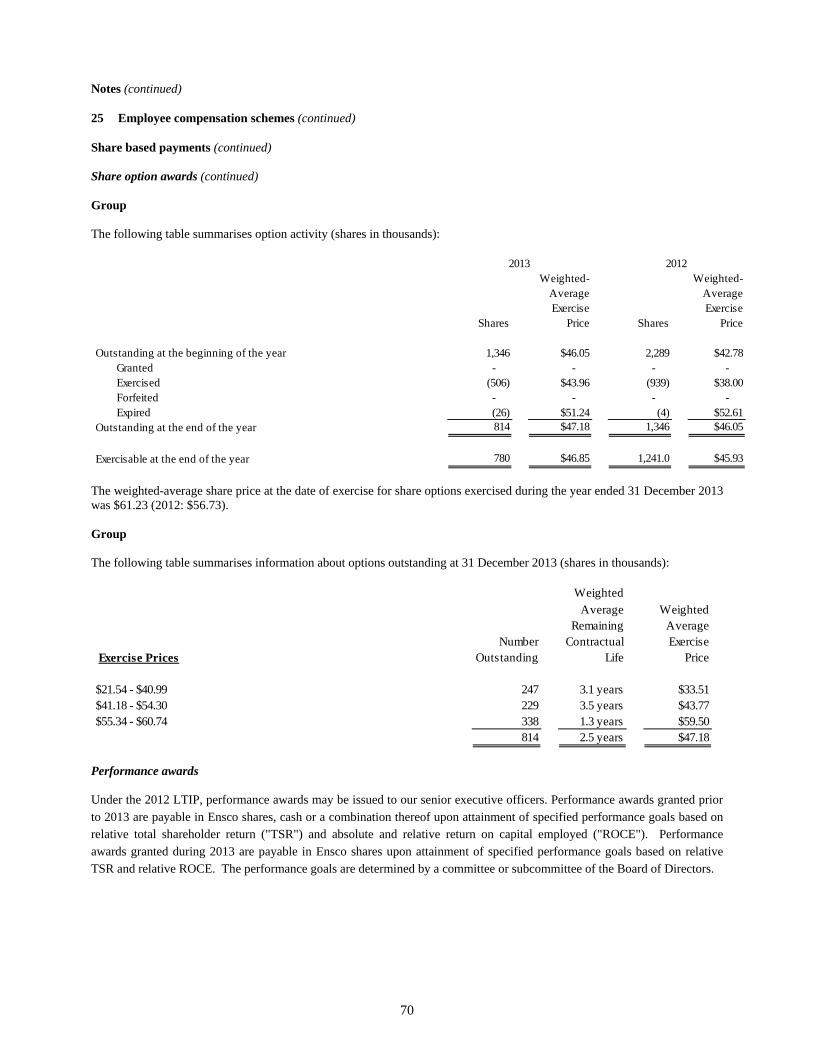
70
Notes (continued)
25 Employee compensation schemes (continued)
Share based payments (continued) Share option awards (continued) Group The following table summarises option activity (shares in thousands):
The weighted-average share price at the date of exercise for share options exercised during the year ended 31 December 2013 was $61.23 (2012: $56.73). Group The following table summarises information about options outstanding at 31 December 2013 (shares in thousands):
Performance awards Under the 2012 LTIP, performance awards may be issued to our senior executive officers. Performance awards granted prior to 2013 are payable in Ensco shares, cash or a combination thereof upon attainment of specified performance goals based on relative total shareholder return ("TSR") and absolute and relative return on capital employed ("ROCE"). Performance awards granted during 2013 are payable in Ensco shares upon attainment of specified performance goals based on relative TSR and relative ROCE. The performance goals are determined by a committee or subcommittee of the Board of Directors.
Weighted- Weighted-Average AverageExercise Exercise
Shares Price Shares Price
Outstanding at the beginning of the year 1,346 $46.05 2,289 $42.78 Granted - - - - Exercised (506) $43.96 (939) $38.00 Forfeited - - - - Expired (26) $51.24 (4) $52.61 Outstanding at the end of the year 814 $47.18 1,346 $46.05
Exercisable at the end of the year 780 $46.85 1,241.0 $45.93
20122013
WeightedAverage Weighted
Remaining AverageNumber Contractual Exercise
Exercise Prices Outstanding Life Price
$21.54 - $40.99 247 3.1 years $33.51$41.18 - $54.30 229 3.5 years $43.77$55.34 - $60.74 338 1.3 years $59.50
814 2.5 years $47.18
71
Notes (continued)
25 Employee compensation schemes (continued)
Share based payments (continued) Performance awards (continued) Performance awards generally vest at the end of a three-year measurement period based on attainment of performance goals. Our performance awards granted prior to 2013 are classified as liability awards with compensation expense measured based on the estimated probability of attainment of the specified performance goals and recognised on a straight-line basis over the requisite service period. The estimated probable outcome of attainment of the specified performance goals is based on historical experience, and any subsequent changes in this estimate are recognised as a cumulative adjustment to compensation cost in the period in which the change in estimate occurs. Our performance awards granted during 2013 are classified as equity awards with compensation expense recognised on a straight-line basis over the requisite service period. The estimated probable outcome of attainment of the specified performance goals is based on historical experience, and any subsequent changes in this estimate for the relative ROCE performance goal are recognised as a cumulative adjustment to compensation cost in the period in which the change in estimate occurs. The aggregate grant-date fair value of performance awards granted during 2013 and 2012 totaled $8.2 million and $7.2 million, respectively. The aggregate fair value of performance awards vested during 2013 and 2012 totaled $7.4 million and $5.3 million, respectively, all of which was paid in cash. During the years ended 31 December 2013 and 2012, we recognised $6.6 million and $9.7 million of compensation expense for performance awards, respectively, which was included in general and administrative expense. Savings plans We have profit sharing plans (the "Ensco Savings Plan," the "Ensco Multinational Savings Plan" and the "Ensco Limited Retirement Plan"), which cover eligible employees, as defined within each plan. The Ensco Savings Plan includes a 401(k) savings plan feature which allows eligible employees to make tax deferred contributions to the plan. The Ensco Limited Retirement Plan also allows eligible employees to make tax deferred contributions to the plan. Contributions made to the Ensco Multinational Savings Plan may or may not qualify for tax deferral based on each plan participant's local tax requirements. We generally make matching cash contributions to the plans. We match 100% of the amount contributed by the employee up to a maximum of 5% of eligible salary. Matching contributions totaled $21.1 million and $16.5 million for the years ended 31 December 2013 and 2012, respectively. Profit sharing contributions made into the plans require approval of the Board of Directors and are generally paid in cash. We recorded profit sharing contribution provisions of $55.3 million and $45.1 million for the years ended 31 December 2013 and 2012, respectively. Matching contributions and profit sharing contributions become vested in 33% increments upon completion of each initial year of service with all contributions becoming fully vested subsequent to achievement of three or more years of service. We have 1.0 million shares reserved for issuance as matching contributions under the Ensco Savings Plan.
72
Notes (continued)
26 Reconciliation of operating profit to operating cash flows
27 Analysis of net funds
2013 2012$ millions $ millions
Operating profit 1,595.3 1,374.6 Depreciation 611.9 569.2
Goodwill amortisation 157.1 158.9 Share-based compensation cost 50.3 53.9
Increase/(decrease) in provisions 37.1 (24.4)
Increase in stocks (48.6) (18.7) (Increase)/decrease in debtors (31.9) 104.0 (Decrease)/increase in creditors (28.0) 242.1
Other amortisation (22.5) (26.2)Settlement of warranty and other claims (11.0) (57.9) Other, net 17.3 6.4 Net cash inflow from operating activities 2,327.0 2,381.9
At beginning
of year Cash flow
Other non cash
changesAt end of
year
$ millions $ millions $ millions $ millions
Cash in hand, at bank 487.1 (321.5) - 165.6
Interest bearing debt due after one year (4,779.2) 47.5 28.7 (4,703.0)
Interest bearing debt due within one year (47.5) - - (47.5)
Total (4,339.6) (274.0) 28.7 (4,584.9)
73
Notes (continued)
28 Earnings per share The calculation of basic earnings per share was based on the profit attributable to ordinary shareholders divided by the weighted average number of ordinary shares outstanding of 230.9 million (2012: 229.4 million). The calculation of diluted earnings per share was based on the profit attributable to ordinary shareholders divided by the weighted average number of ordinary shares outstanding after adjustment for the effects of all potentially dilutive ordinary shares of 231.1 million (2012: 229.7 million). The following table is a reconciliation of profit for the financial year attributable to Ensco shares used in our basic and diluted earnings per share computations for years ended 31 December 2013 and 2012:
The following table is a reconciliation of the weighted-average shares used in our basic and diluted earnings per share computations for years ended 31 December 2013 and 2012:
Antidilutive share options totaling 0.3 million and 0.4 million for the years ended 31 December 2013 and 2012, respectively, were excluded from the computation of diluted EPS. 29 Post Balance Sheet event On 21 March 2014, the company paid a dividend in the amount of $175.3 million ($0.75 per share). In January 2014, we closed on the sale of two jackup rigs, ENSCO 69 and Pride Wisconsin, for $33.0 million. The proceeds were received in December 2013. The gain on sale will be recognised during the first quarter of 2014.
2013 2012$ millions $ millions
Profit for the financial year 1,248.3 971.5Profit for the financial year allocated to non-vested share awards (15.1) (12.3) Profit for the financial year attributable to Ensco shares 1,233.2 959.2
2013 2012millions millions
Weighted-average shares - basic 230.9 229.4Potentially dilutive shares 0.2 0.3Weighted-average shares - diluted 231.1 229.7

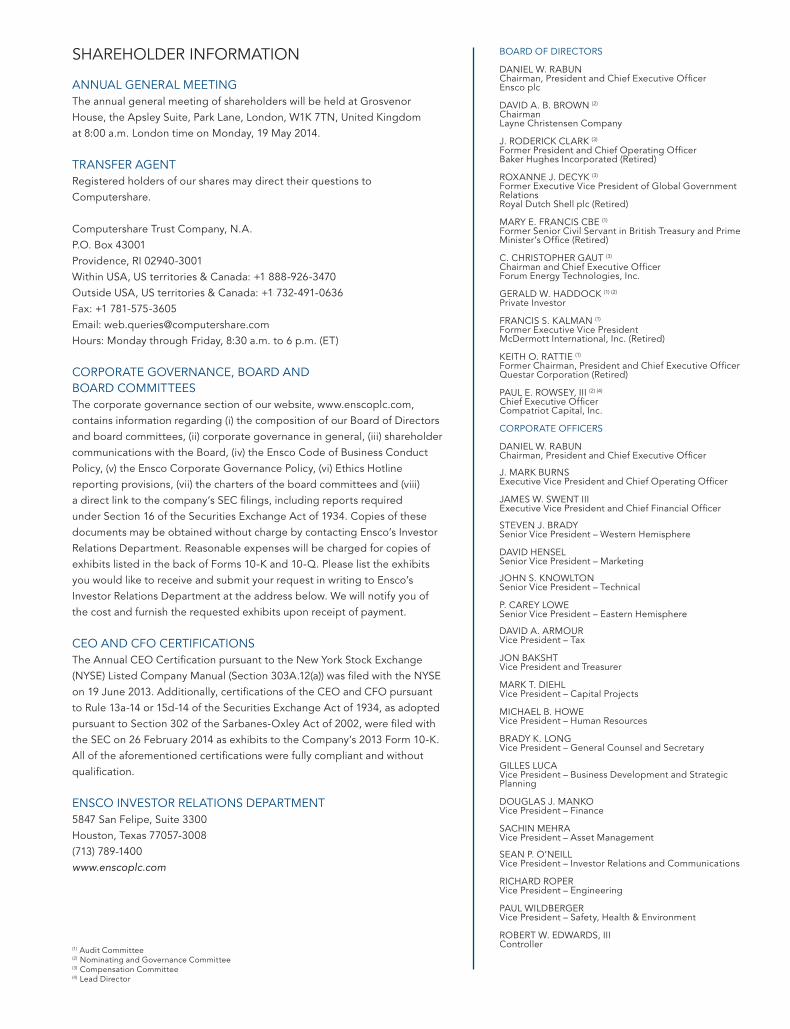
SHAREHOLDER INFORMATION
ANNUAL GENERAL MEETINGThe annual general meeting of shareholders will be held at Grosvenor House, the Apsley Suite, Park Lane, London, W1K 7TN, United Kingdom at 8:00 a.m. London time on Monday, 19 May 2014.
TRANSFER AGENTRegistered holders of our shares may direct their questions to Computershare.
Computershare Trust Company, N.A.P.O. Box 43001 Providence, RI 02940-3001Within USA, US territories & Canada: +1 888-926-3470 Outside USA, US territories & Canada: +1 732-491-0636 Fax: +1 781-575-3605Email: [email protected]: Monday through Friday, 8:30 a.m. to 6 p.m. (ET)
CORPORATE GOVERNANCE, BOARD AND BOARD COMMITTEES The corporate governance section of our website, www.enscoplc.com, contains information regarding (i) the composition of our Board of Directors and board committees, (ii) corporate governance in general, (iii) shareholder communications with the Board, (iv) the Ensco Code of Business Conduct Policy, (v) the Ensco Corporate Governance Policy, (vi) Ethics Hotline reporting provisions, (vii) the charters of the board committees and (viii) a direct link to the company’s SEC filings, including reports required under Section 16 of the Securities Exchange Act of 1934. Copies of these documents may be obtained without charge by contacting Ensco’s Investor Relations Department. Reasonable expenses will be charged for copies of exhibits listed in the back of Forms 10-K and 10-Q. Please list the exhibits you would like to receive and submit your request in writing to Ensco’s Investor Relations Department at the address below. We will notify you of the cost and furnish the requested exhibits upon receipt of payment.
CEO AND CFO CERTIFICATIONSThe Annual CEO Certification pursuant to the New York Stock Exchange (NYSE) Listed Company Manual (Section 303A.12(a)) was filed with the NYSE on 19 June 2013. Additionally, certifications of the CEO and CFO pursuant to Rule 13a-14 or 15d-14 of the Securities Exchange Act of 1934, as adopted pursuant to Section 302 of the Sarbanes-Oxley Act of 2002, were filed with the SEC on 26 February 2014 as exhibits to the Company’s 2013 Form 10-K. All of the aforementioned certifications were fully compliant and without qualification.
ENSCO INVESTOR RELATIONS DEPARTMENT5847 San Felipe, Suite 3300Houston, Texas 77057-3008(713) 789-1400www.enscoplc.com
(1) Audit Committee (2) Nominating and Governance Committee (3) Compensation Committee (4) Lead Director
BOARD OF DIRECTORS
DANIEL W. RABUN Chairman, President and Chief Executive Officer Ensco plc
DAVID A. B. BROWN (2)
ChairmanLayne Christensen Company
J. RODERICK CLARK (3)
Former President and Chief Operating OfficerBaker Hughes Incorporated (Retired)
ROXANNE J. DECYK (3)
Former Executive Vice President of Global GovernmentRelations Royal Dutch Shell plc (Retired)
MARY E. FRANCIS CBE (1)
Former Senior Civil Servant in British Treasury and Prime Minister’s Office (Retired)
C. CHRISTOPHER GAUT (3)
Chairman and Chief Executive OfficerForum Energy Technologies, Inc.
GERALD W. HADDOCK (1) (2)
Private Investor
FRANCIS S. KALMAN (1)
Former Executive Vice PresidentMcDermott International, Inc. (Retired)
KEITH O. RATTIE (1)
Former Chairman, President and Chief Executive OfficerQuestar Corporation (Retired)
PAUL E. ROWSEY, III (2) (4)
Chief Executive OfficerCompatriot Capital, Inc.
CORPORATE OFFICERS
DANIEL W. RABUNChairman, President and Chief Executive Officer
J. MARK BURNSExecutive Vice President and Chief Operating Officer
JAMES W. SWENT IIIExecutive Vice President and Chief Financial Officer
STEVEN J. BRADYSenior Vice President – Western Hemisphere
DAVID HENSELSenior Vice President – Marketing
JOHN S. KNOWLTONSenior Vice President – Technical
P. CAREY LOWE Senior Vice President – Eastern Hemisphere
DAVID A. ARMOUR Vice President – Tax
JON BAKSHTVice President and Treasurer
MARK T. DIEHL Vice President – Capital Projects
MICHAEL B. HOWEVice President – Human Resources
BRADY K. LONGVice President – General Counsel and Secretary
GILLES LUCAVice President – Business Development and Strategic Planning
DOUGLAS J. MANKO Vice President – Finance
SACHIN MEHRAVice President – Asset Management
SEAN P. O’NEILLVice President – Investor Relations and Communications
RICHARD ROPERVice President – Engineering
PAUL WILDBERGERVice President – Safety, Health & Environment
ROBERT W. EDWARDS, IIIController
(in millions of $, except EPS and percentages)
(1) Includes the results of Pride International, Inc. from the acquisition date of 31 May 2011. (2) Total Capital includes Long-term Debt plus Ensco Shareholders’ Equity.
FINANCIAL HIGHLIGHTS 2009 2010 2011(1) 2012
Ensco plc (NYSE: ESV) brings energy to the world as a global provider of offshore drilling services to the petroleum industry. For more than 25 years, the company has focused on operating safely and going beyond customer expectations. Ensco is ranked first in total customer satisfaction with top honors in eight of 14 categories in the latest annual survey by EnergyPoint Research®. Operating one of the newest ultra-deepwater rig fleets and the largest premium jackup fleet, Ensco has a major presence in the most strategic offshore basins across six continents. In terms of dividend yield, Ensco is among the top dividend payers of S&P 500® companies.
Revenues 1,859 1,674 2,798 4,301 4,920
Income from Continuing Operations 749 557 608 1,222 1,433
Net Income Attributable to Ensco 779 580 600 1,170 1,418
Cash Flow from Continuing Operations 1,176 807 732 2,200 1,980
Diluted Earnings Per Share
from Continuing Operations 5.24 3.86 3.09 5.23 6.09
Diluted Earnings Per Share 5.48 4.06 3.08 5.04 6.07
Total Assets 6,747 7,052 17,899 18,565 19,473
Long-Term Debt, net of current portion 257 240 4,878 4,798 4,719
Ensco Shareholders’ Equity 5,499 5,960 10,879 11,846 12,792
Long-Term Debt-to-Total Capital(2) 4% 4% 31% 29% 27%
$5.5$6.0
$10.9
$11.8
$12.8
2009 2010 2011 2012 2013
ENSCO SHAREHOLDERS’ EQUITY
(in billions)
2013
Annual Report andUnited Kingdom Statutory Accounts
Ensco plc6 Chesterfield GardensLondon W1J 5BQ
Registered in England No. 7023598
2013