Embed Size (px)
Citation preview
Pakistan Geographical Review, Vol. 69, No.2, December 2014, PP 111-132
111
REGIONALIZING THE CLIMATE OF PAKISTAN USING KÖPPENCLASSIFICATION SYSTEM
SARDAR SARFARAZ*, MUDASAR HASAN ARSALAN* AND HIRA FATIMA**
*Institute of Space and Planetary Astrophysics, University of Karachi,**Pakistan Meteorological Department
ABSTRACTPakistan is the only country in the world to have a unique range of altitudes from sea level to the secondhighest mountain peak of the world. This distinct characteristic gives it large variation in climate across itsdifferent areas, like huge temperature difference and large spatial rainfall distribution. These largelycontrasting variations in temperature and precipitation can best be depicted by making some well-definedclassifications of climate parameters and their spatial distribution across Pakistan. In this paper, we producedclimate maps of Pakistan by using the 30-year monthly normal area-weighted precipitation and temperaturedata set of 59 meteorological sites well spread across Pakistan using the Geographic Information System (GIS).We calculated the climate variables used in Köppen-Geiger system at each of 59 meteorological stations. Theresult shows three principal climates classes i.e. B, C and D with their further subclasses across Pakistan. Weregionalized the climate of Pakistan based on spatial proximity principals and developed a sub-regional mapof climate zones of Pakistan.
KEY WORDS: Climate classification, Pakistan, rainfall, annual temperature, Climate parameters
interpolation, GIS.
INTRODUCTIONWorld meteorological Organization (WMO) defines the climate as the statisticaldescription in terms of the mean and variability of relevant quantities over a period oftime. These average weather conditions span over years and decades, typically over a 30-year period. It is the classification, which helps distinguish similar pattern of climate fromthe dissimilar ones, Walterscheid (2009). The world climate has been classified intodifferent classes by many climatologists and geographers like Supan (1896), Köppen(1936), Thornthwaite (1948), Blair (1942), Gieger (1953), Miller (1969) and Griffith (1978).According to Griffiths (1978) the climatic classification is simply a method of arrangingvarious climatic parameters either singly or grouped into ranks to simplify the mass ofdata and to identify analogies. The most commonly used climate indices of the world arethose given by Köppen who had divided the world climate on the basis of temperatures.He describes that it is the vegetation type that actually provides identification aboutclimate prevailing in the regions taking into account the temperature and precipitation(Köppen, 1936). Thornthwaite, (1948) classifies the climate on the basis of two mainindices, the moisture content and annual potential evapotranspiration. Based on thesetwo climate indices he gave a famous map (Thornthwaite map) which clearly divides thewetter and drier regions. Trewartha, (1968) said that climate classification is a processbasic to all sciences, recognizing individuals with some unique characteristics in commonand grouping them into a few classes or types. He considers Thornthwaite classificationas a more refined method, especially for agriculture applications because of containingan account of evapotranspiration than that of Köppen, which proves more helpful.Similarly Doerr (1962) comparison of maps generated by the Köppen and Thronthwaite
Sardar Sarfraz, Mudasar Hasan Arsalan and Hira Fatima
112
methods signifies the latter more accurate and helpful to describe the climate of a place.But it is still the Köppen system, which is widely and popularly used around the globe byacademia and researchers (Peel et al., 2007; and Kottek et al., 2006).Some tremendous efforts have already been made on climate classification of Pakistanby Kazi (1951), Shamshad (1956) and Nasarullah (1968). Zahid and Rasul, (2011) did theThermal classification of Pakistan. Kazi's (1951) work on climate classification of Pakistanfirst dates us back to the climate classification done by climatologists including Trewartha(1946), Köppen (1936), Thornthwaite (1948), Blair (1942), Kendrew (1941) and Miller(1949). For instance Trewartha had presented three types of classification, namely,Tropical and sub-tropical steppe, Tropical and sub-tropical desert and Undifferentiatedhighlands; Köppen gave his five famous classifications; Thornthwaite came up with sixclasses; Blair with four; Kendrew with four and Miller demonstrated three classes forPakistan region. Kazi (1951) argues that being an arid continental country like Pakistanthe climate elements are subject to greater fluctuations and variations, because the meanannual values of temperature and rainfall as well as mean seasonal and mean monthlyvalues do not seem appropriate and helpful for describing a class of climate. He thensuggests the construction of Tri-Liner Graphs by considering the eleven-year cycle orlarger period (say 20 years) and suggests that the maxima and minima of temperatureshould be shown by three curves:The first showing the actual lowest maximum temperature for each month, occurred atthe station during the cycle,The second showing the actual highest maximum for each month recorded during thecycle andThe third showing the mean monthly maximum temperature for the period.Similarly, three curves may be drawn for minima, the highest minimum, lowest minimumand mean minimum. Shamshad, (1956),by taking into account the characteristics ofseasons, suggested that Pakistan climate classifications might put under seasonsclassification as:Quadruple season of extra-tropical type (Summer, Autumn, Winter and Spring),Triple season of temperature-moisture type (Hot, rainy and cold season) andDouble season of temperature type (Hot and Cold season).Shamshad, (1956) associated the above seasons with two main types of climate, extra-tropical and subtropical: the first group of seasons goes with extra-tropical, the secondand third with the subtropical types. Khan (1993) worked out the climate classification at32 individual meteorological stations of Pakistan by using the 1931-60 normal climaticdata maintained by the Pakistan Meteorological Department by taking into account theKöppen, Trewartha and Thornthwaite climate classification systems. Chaudhry and Rasul,2004 did the Agro-climatic classification of Pakistan by applying a modified Thornthwaiteapproach adopted by Reddy and Reddy (1973) using reference crop evapotranspirationand concluded that 2/3 of the total area of Pakistan lies under the arid climate.
Regionalizing the climate of Pakistan using Koppen classification system
113
Pakistan, stretching from 24 °N to 36 °N and 61 °E to 76.5 °E, possesses a much diversifiedclimate with experiencing a hot and dry climate in the south, temperate in northwest andarctic in the north. Summer temperature in the south rise over 50°C and wintertemperature in the north fall as low as -20°C to -22°C (Pakistan Climatic Normals, 1961-90). Similarly, the precipitation variability is also distinctively large across north and southPakistan, ranging 1500-2000 mm and 100-200 mm, respectively, (Pakistan ClimaticNormals, 1981-2010). The eastern belt of the country receives more summer (monsoon),rains whereas western belt is more influenced by the winter rains from westerndisturbances (Khan, 1993). Such a large gradient, therefore necessitates defining itsclimate into some sub-regions or classes.All previous efforts are found based on historical data at least 50 years back, except Zahidand Rasul, (2011). Most of these efforts are to categorize the meteorological stations andcontouring for climate parameter distribution across Pakistan. However, sub-regionalization for dividing the whole region into distinct climate zones is missing in theliterature.In recent years, Geographical Information System (GIS) has provided many tools andtechniques to support researchers for cartographic aggregation, generalization andclustering (ArcGIS Resources, 2014a, 2015a,b).There are several geo-statisticaltechniques developed for interpolating the stations data in GIS environment. Sluiter(2008) classified these methods in three primary categories i.e. deterministic,probabilistic and others. Deterministic methods such as nearest neighborhood andtriangulation, Inverse Distance Weighting, polynomial functions (Splines), Linearregression and artificial neural network, use geometric properties of points sampled togenerate a continuous surface. While probabilistic methods such as optimuminterpolation and different type of Krigging, includes the concept of randomness, linearregression and geostatistics. Other methods are the combination of deterministic andprobabilistic methods, specially designed for meteorological studies. (Sluiter et. al. 2008)Literature search shows that there is no single suggested method of interpolation. Hence,it is usually selected based on desired accuracy, available data and resources. However astudy of spatial variability of climatological parameters -in which different interpolationtechniques i.e. Inverse distance weighted (IDW), Spline and Kriging were used- shows thatthere is considerable difference in predicting the spatial variability in climate normal usingdifferent interpolation techniques. (Irmak, Ranade, Marx, Irmak, Hubbard, Meyer, andMartin, 2010).This paper is an attempt to spatially map the climate parameters and work out the Köppenclimate classification system for Pakistan using the GIS with latest available normalclimatic values of temperature and precipitation (monthly, seasonal and annual). We usedthe monthly climatic normal (1981-2010) data at 59 meteorological stations of Pakistan.
Sardar Sarfraz, Mudasar Hasan Arsalan and Hira Fatima
114
MATERIAL AND METHODSThe monthly climatic normal data on rainfall and temperatures for a 30-year (1981-2010)at 59 data sites was obtained from the Pakistan Meteorological Department, PMD (Fig.1). It was a quality controlled data as PMD has published it in their publication “The 30-year (1981-2010) Climatic Normals of Pakistan”. The monthly data values wereaggregated over 12 months to work out the annual values. Since Pakistan normallyexhibits four weather seasons based on rainfall, the summer monsoon (July throughSeptember, JAS), winter (December to March, DJFM), pre-monsoon season (April-June,AMJ) and autumn or post-monsoon (October-November, ON), (Shamshad, 1985 andKhan, 1993). So the seasonal rainfall indices for the summer monsoon (July-September),winter (DJFM), pre-monsoon (AMJ) and post-monsoon (ON) were worked out byaggregating the three, four, three and two months values respectively. Based ontemperature we may define the seasonal temperature indices as, winter (or cold)temperature season consisting of December to February (DJF), spring (mild temperature)the aggregate of March-April (MA), hot/pre-monsoon of May-June (MJ), monsoon of July-September (JAS) and post-monsoon/autumn consisting of October-November (ON),(Zahid and Rasool, 2011, Khan 1993). Which means a year is sub-divided into fivetemperature seasons, because the March temperatures at most of the data stations rankcloser to that of April than in February. Similarly May and June being the hottest (and dry)months are aggregated into a separate season as their temperatures stand higher thanthat of monsoon (JAS) season.We utilized the data management capabilities of ArcGIS to store, edit and manage data.Further, the visualization and mapping capabilities of ArcGIS were used to present thedata clearly and effectively. The stations data layer was created in ArcGIS from thegeographical coordinates of stations (Fig. 1) and then every station was linked to itsclimatic data, such as Annual normal rain, DJFM-rain, JAS-rain, AMJ-rain, ON-rain andAnnual and seasonal normal temperatures by a unique identifier.As ArcGIS is fully loaded with spatial analysis tools that can be used for analyzinggeographic patterns as well as advanced predictive modelling, we performedinterpolation of climate parameters. The inverse distance weighted (IDW) method inArcGIS is used for interpolation of each annual and seasonal rainfall and temperatureindices for mapping the values over the area not covered by the data points. IDWinterpolation is based on the assumption that the influence of variable that is beingmapped decreases with distance from its sampled location i.e. weight is the function ofinverse distance. IDW interpolation uses a linear weighted combination of sampled pointsto calculate the cell values. These cell values are limited to the range of values used forinterpolation.In a GIS environment, raster datasets can be displayed or rendered in several ways.Display colors can be changed, or the dataset values can be stretched to enhance thevisual contrast or the classification renderer can be used. In rendered classification thedata values of single band thematic raster -which is based on a continuous phenomenon
Regionalizing the climate of Pakistan using Koppen classification system
115
like slope, temperature, distance, etc. - are grouped into a small number of classes.Different classification methods are used like manual, equal interval, quantile, naturalbreaks, standard deviation etc. (ArcGIS Resources, 2014b). To better understand thespatial variation of annual and seasonal normal rainfall and temperature by comparing(using the same legend), we grouped the range of annual and seasonal normaltemperature values (i.e. -1-37) into six classes of equal intervals. This classificationrenderer was used to classify all the IDW interpolated annual and seasonal normaltemperatures. As the range of annual rain (37-1775) was much greater than the range ofseasonal rains (0-771), we created two different classification renderers of six equalinterval classes: one with the range of seasonal rains to classify the IDW interpolatedseasonal rains and other with the range of annual normal rain to classify IDW interpolatedannual normal rain.The climate type or class in accordance with the Köppen climate classification system(Table 1) at each data station was determined by calculating the mean annualtemperature (MAT) and mean annual precipitation (MAP) from the mean monthly datavalues. The two seasons, summer and winter, rainfall were realized by aggregating themonthly rainfall of April through September (AMJJAS) and of October through March(ONDJFM) respectively. Then for determining the precipitation threshold (Pthresh),another parameter of Köppen classification criteria, percentage contribution to theannual total of the summer and winter precipitation was realized, (Peel et al., 2007 andKottek et al., 2006).In Köppen-Geiger climate scheme (1936) the climate classification type A represents theTropical climate. Class type B represents the arid with further sub-division into the desertand steppe types. The type C represents the temperate climate type with further sub-division into the temperate with dry winter (or dry summer). The type D represents thecold climate with further sub-division into cold with dry winter (or dry summer) and Erepresents the Polar climate with further sub-division into Tundra and Frost climates.Further, the second letter represents the precipitation and the third is meant fortemperature, e.g. the climate classification BWhw means the Desert hot with dry winterclimate, Csa stands for the Temperate with dry and hot summer and so on (Peel et al.,2007). The detailed criteria and key to calculate the Köppen climate classes is given inTable 1.One of the most commonly used aggregating technique for qualitative data (for whichother interpolation techniques are not applicable) is Thiessen polygon. In this technique,data points are taken as centers for drawing polygons or boundaries around them basedon the distribution of sampled data points (Beurs, 1999). For sub regionalization, we usedThiessen polygon technique to aggregate the climate classes of stations. From theindividual meteorological station in the form of point geometry, we produced aconsolidated map of Pakistan climate regions.
Sardar Sarfraz, Mudasar Hasan Arsalan and Hira Fatima
116
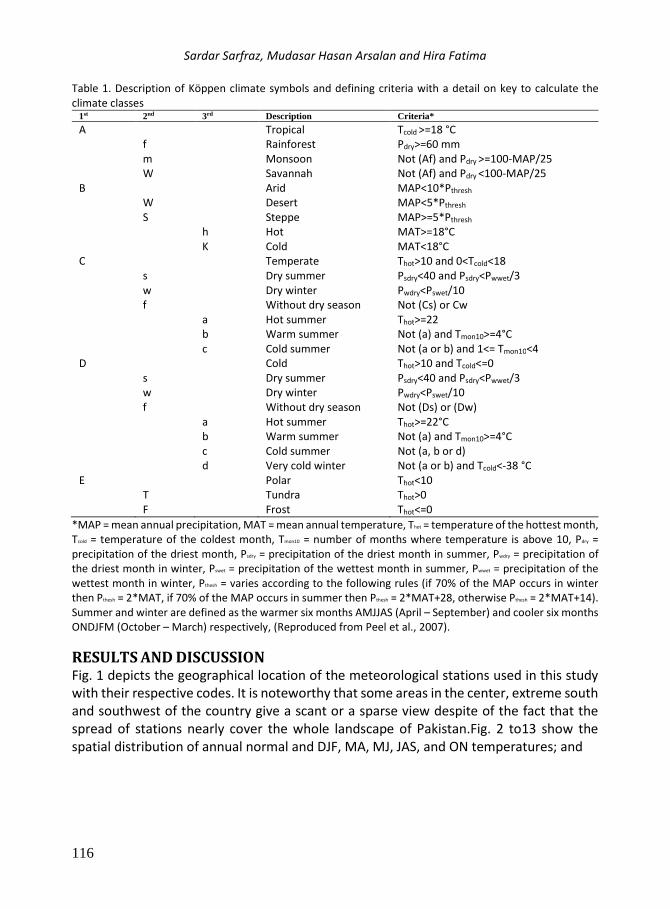
Table 1. Description of Köppen climate symbols and defining criteria with a detail on key to calculate theclimate classes
1st 2nd 3rd Description Criteria*
A Tropical Tcold >=18 °Cf Rainforest Pdry>=60 mmm Monsoon Not (Af) and Pdry >=100-MAP/25W Savannah Not (Af) and Pdry <100-MAP/25
B Arid MAP<10*Pthresh
W Desert MAP<5*Pthresh
S Steppe MAP>=5*Pthresh
h Hot MAT>=18°CK Cold MAT<18°C
C Temperate Thot>10 and 0<Tcold<18s Dry summer Psdry<40 and Psdry<Pwwet/3w Dry winter Pwdry<Pswet/10f Without dry season Not (Cs) or Cw
a Hot summer Thot>=22b Warm summer Not (a) and Tmon10>=4°Cc Cold summer Not (a or b) and 1<= Tmon10<4
D Cold Thot>10 and Tcold<=0s Dry summer Psdry<40 and Psdry<Pwwet/3w Dry winter Pwdry<Pswet/10f Without dry season Not (Ds) or (Dw)
a Hot summer Thot>=22°Cb Warm summer Not (a) and Tmon10>=4°Cc Cold summer Not (a, b or d)d Very cold winter Not (a or b) and Tcold<-38 °C
E Polar Thot<10T Tundra Thot>0F Frost Thot<=0
*MAP = mean annual precipitation, MAT = mean annual temperature, Thot = temperature of the hottest month,Tcold = temperature of the coldest month, Tmon10 = number of months where temperature is above 10, Pdry =precipitation of the driest month, Psdry = precipitation of the driest month in summer, Pwdry = precipitation ofthe driest month in winter, Pswet = precipitation of the wettest month in summer, Pwwet = precipitation of thewettest month in winter, Pthesh = varies according to the following rules (if 70% of the MAP occurs in winterthen Pthesh = 2*MAT, if 70% of the MAP occurs in summer then Pthesh = 2*MAT+28, otherwise Pthesh = 2*MAT+14).Summer and winter are defined as the warmer six months AMJJAS (April – September) and cooler six monthsONDJFM (October – March) respectively, (Reproduced from Peel et al., 2007).
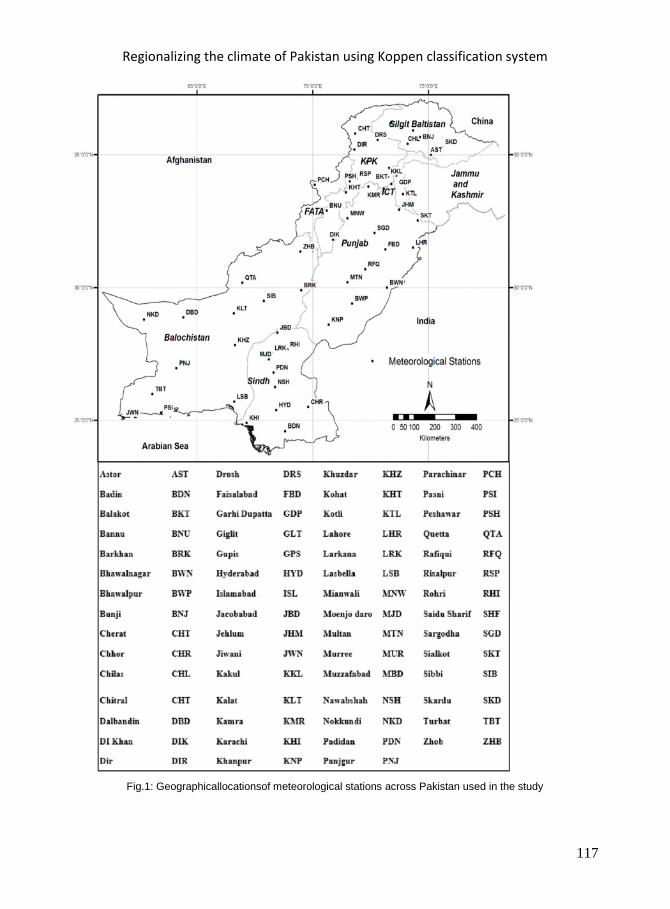
RESULTS AND DISCUSSIONFig. 1 depicts the geographical location of the meteorological stations used in this studywith their respective codes. It is noteworthy that some areas in the center, extreme southand southwest of the country give a scant or a sparse view despite of the fact that thespread of stations nearly cover the whole landscape of Pakistan.Fig. 2 to13 show thespatial distribution of annual normal and DJF, MA, MJ, JAS, and ON temperatures; and
Regionalizing the climate of Pakistan using Koppen classification system
117
Fig.1: Geographicallocationsof meteorological stations across Pakistan used in the study
Sardar Sarfraz, Mudasar Hasan Arsalan and Hira Fatima
118
JAS, DJFM, AMJ and ON rainfalls and climate classification of each meteorological
stations across Pakistan.
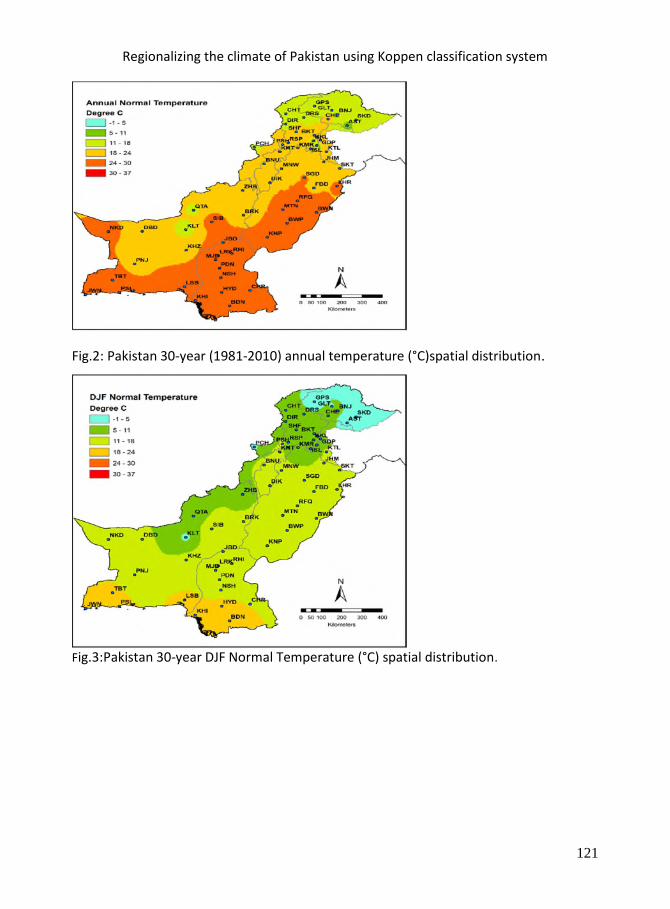
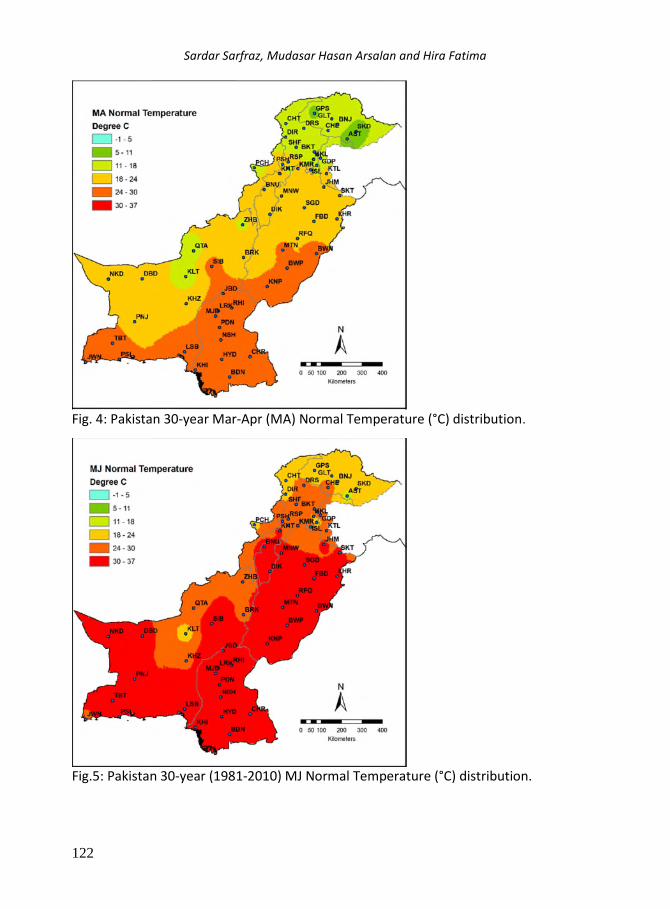
ANNUAL AND SEASONAL NORMAL TEMPERATURE SPATIALDISTRIBUTIONFig. 2 shows the spatial distribution of annual normal temperature across Pakistan. Itevidently shows that the annual normal temperature ranges from 24 °C to 30 °C in southPakistan (Sindh province and south Balochistan), it decreases as we proceed along northand ranges 11-18 °C in the extreme north/ northeast of the country and in northBalochistan. Obviously the south Pakistan experiences over 26 °C more than what northPakistan records in annual temperature which is distinctively large temperature gradient.The historical climate records reveal that the extreme temperatures (ever maximum of53.5°C recorded at Moenjodaro, Sindh and ever minimum of -21 °C recorded at Skardu)difference is 74.5°Cin populated areas of Pakistan (Source: Climatic Normals of Pakistan1961-90 and 1981-2010; CDPC, PMD).Fig. 3 depicts the spatial distribution of 30-year winter (DJF) normal temperatures acrossPakistan. The northern areas evidently experience -01 °C to 5 °C temperature (with atleast 3 stations in Gilgit-Baltistan (GB) and one in northern Balochistan showing the frostyconditions, beryl green shaded). Then moving down the latitudes we find a gradualincrease in temperature (ref. Fig. 3) culminating at 18-24 °C in southern Sindh andsouthwest coast of Balochistan. Hence, overall the winter temperature range acrossPakistan comes out to be below zero to 24 °C which is again quite a large range like thatof annual temperatures. In defining winter temperature season we slightly deviate fromthe norm of winter rainfall season composition because the month of March is not asmuch cold as December, January and February, but for winter rainfall season March istaken into account for being wet enough.Fig. 4 shows how the spring season (March-April, MA) normal temperatures are spatiallydistributed. Again the temperature maxima (24-30°C, orange shade) we find over entireSindh, southeast Punjab and extreme south and southwest Balochistan. The minimumrange of 5-11 °C (dark green shade) is observed over the northeast (Gilgit-Baltistan, GB)of the country. The overall range of about 25 °C from north to south of the countrypersists during the spring season.The spatial distribution of the summer or pre-monsoon temperatures is shown in Fig. 5where the highest temperature range of 30-37 °C persists over Sindh, most of Balochistanand Punjab (except northeast part) followed by 24-30 °C over north-northeast Balochistan(except a hilly station Kalat whose range matches with that of the northern area, orangecolor) and northeast Punjab. Then gradual decrease is observed while movingnortheastwards of the country inclusive of some isolated places in north Balochistanwhere the least range of 18-24 °C is noticeable. We therefore can conclude that thesummer/pre-monsoon (May-June, MJ) season turns out to be the hottest of all fiveseasons with an overall range in excess of 25 °C between north and south of the country.
Regionalizing the climate of Pakistan using Koppen classification system
119
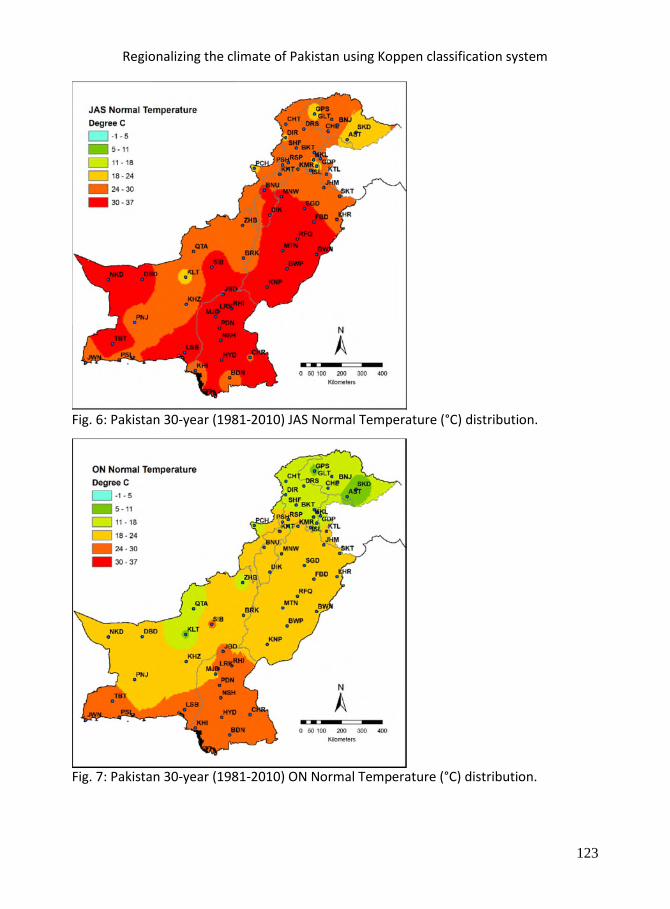
Fig. 6 depicts the spatial distribution of monsoon season (JAS) temperatures acrossPakistan. The high temperature range of 30-37 °C (red colored) is yet again seen overSindh (excluding isolated places in the extreme south and southwest parts), east,southeast and northwest Balochistan, south and central Punjab and south KhyberPakhtunkhwa (KP). The lowest temperature range of 18-24 °C in monsoon season is seenpersisting over north, northeast of the country and isolated place in north Balochistan.Comparing the JAS season (Fig. 6) with MJ (Fig. 5) we notice that MJ temperature maximacover more area of Balochistan and KP. The lowest and highest temperature ranges differby about 17 °C which of course is lower than that seen in other seasons’ temperatures.Fig. 7 shows the temperature spatial distribution of autumn/post-monsoon (ON) seasonwith maximum range of about 24-30 °C persisting over south Pakistan (Sindh) and thecoast of Balochistan. The next lower temperature range of 18-24 °C is observed overentire Punjab, KP and Balochistan except a few places in its north where a lesser range of11-18 °C is seen. The lowest range of 5-11 °C yet again features over the northeast areasof the country and isolated place over northern Balochistan. Here the difference in lowestand highest temperature ranges turns out to be of 19 °C which of course is second lowestas compared to other seasons. The autumn (ON) season thus appears to fall third behindMJ and JAS in warming and in cool stands above than MA and DJF.From the results depicted in Fig. 2 we may understand that Pakistan experiences annualaverage temperature in a marked range of 11-30 °C from north to south with southernareas experiencing the maximum range 24-30 °C and northern parts observing 11-18 °C.This of course is a well marked temperature gradient and that is why the southernPakistan is termed to have an arid to semi-arid climate, while in the north the climate istermed as temperate.On seasonal scale the results show that Pakistan, northern areas and north Balochistanexperience very cold/ frosty conditions (temperature ranging below -1°C to 5 °C), whereassouth and southwest coast experience a mild-cooling winter (11-18 °C) (see Figs. 3). Thespring season temperatures distribution ranges are 5 – 11 °C in the northern areas and24-30 °C in the south (Fig. 4) with an overall range of over 21 °C between south and north.The summer (May-June, MJ) season being hottest of all records the temperaturemaximum range 30-37 °C in south/southeast of the country (Fig. 5) and minimum rangeof 11-20 °C yet again over northern region with overall range being over 25 °C betweennorth and south of Pakistan. The JAS though, is a summer (monsoon) season, but provesa less hot (by 3 °C) than the dry summer (MJ) primarily due to being wettest of all fourseasons. Its maximum range is 30-37°C and lowest one being 11-18 °C. The autumnseason (ON) temperatures are found to drop to 5-11 °C in the north and 24-30°C in southand southwest. Thus the 30-year normal temperature analysis reveals that throughout ayear northern areas of Pakistan experience as low as below 0 °C winter temperature andon the other hand southern areas batter the hot conditions in excess of 37 °C duringsummer.
Sardar Sarfraz, Mudasar Hasan Arsalan and Hira Fatima
120
The variation in temperature is due to the influence of various factors, including thelatitudinal extent of Pakistan, high mountain terrain in the north and northwest,vegetation cover, solar angle and insolation, continentality and an elevation difference ofas low as zero meter at mean sea level in the south to over 2300 m in the north. Thesehighly contrasting temperatures then dictate the climatic conditions of the different sub-regions of Pakistan. The southern desert regions of Pakistan receive intense solar heatingin April - June and September - October with maximum global radiation (direct or diffusesky) per day is 700-800 cal/cm2 in May and a minimum of 400 cal/cm2 in January withannual average of 560 cal/cm2 (Sikka, 1997). The typical geographical features of Pakistanresult in extreme thermal contrast (Arif et al., 2013). It is the hot summer (MJ)temperature, which plays a crucial role in setting up of the heat low, a seasonal (heat) lowpressure area forming over south Pakistan during May-September, which in turn plays apivotal role in dragging in the moist currents from the North Indian Ocean duringmonsoon season, (Arif et al, 2013 and Sarfaraz, 2007). Hence, in southern Pakistan thelack of sufficient rain compounded with high temperatures leads to highevapotranspiration and water scarcity and as a result the area is mainly categorized asthe arid to semi-arid climate.
Regionalizing the climate of Pakistan using Koppen classification system
121
Fig.2: Pakistan 30-year (1981-2010) annual temperature (°C)spatial distribution.
Fig.3:Pakistan 30-year DJF Normal Temperature (°C) spatial distribution.
Sardar Sarfraz, Mudasar Hasan Arsalan and Hira Fatima
122
Fig. 4: Pakistan 30-year Mar-Apr (MA) Normal Temperature (°C) distribution.
Fig.5: Pakistan 30-year (1981-2010) MJ Normal Temperature (°C) distribution.
Regionalizing the climate of Pakistan using Koppen classification system
123
Fig. 6: Pakistan 30-year (1981-2010) JAS Normal Temperature (°C) distribution.
Fig. 7: Pakistan 30-year (1981-2010) ON Normal Temperature (°C) distribution.
Sardar Sarfraz, Mudasar Hasan Arsalan and Hira Fatima
124
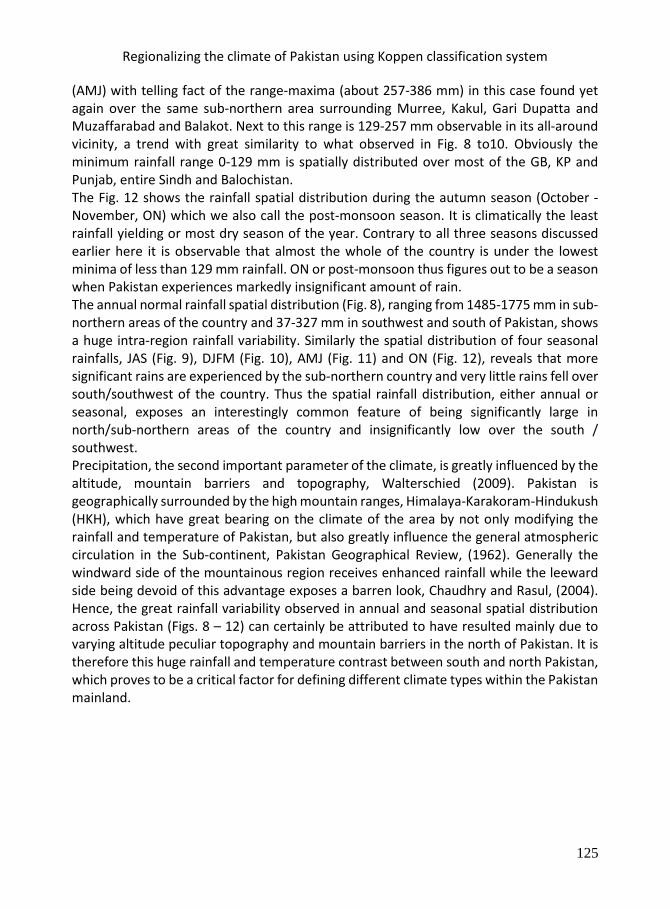
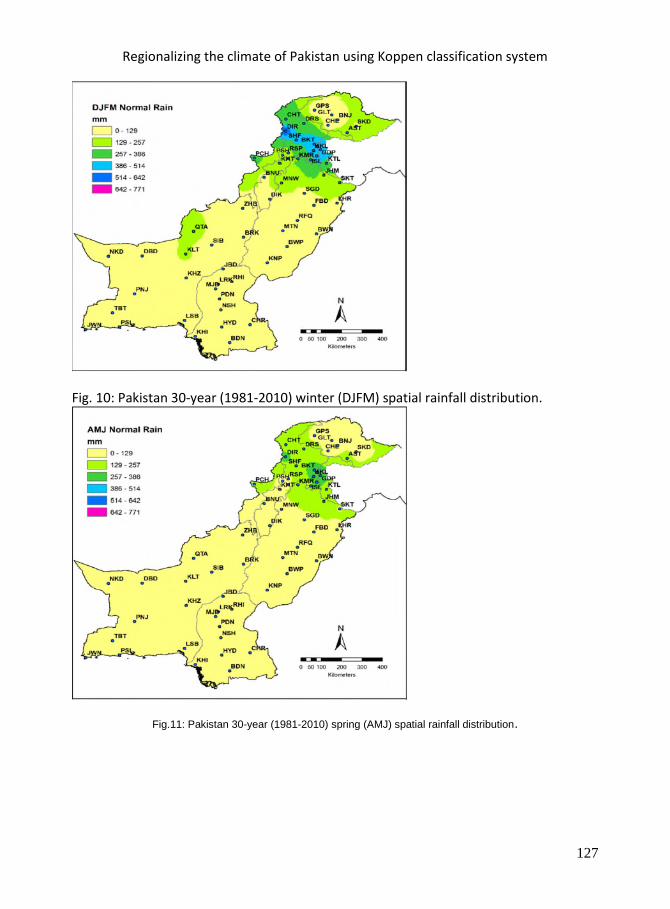
THE SPATIAL DISTRIBUTION OF ANNUAL AND SEASONAL NORMALRAINFALLThe Fig. 8 to 12 exhibit how annual and seasonal normal rainfalls are spatially distributedacross Pakistan. Showing a distinctively large variation from north to south, Fig. 8manifests that the sub-northern area of Pakistan receives the maximum of annual rainfalli.e.1485-1775 mm (ginger pink shade). It reduces with southward movement and reachesits minimum range of about 37 to 327 mm (medium yellow color) in Balochistan, Sindhand south Punjab. So evidently the intra-region rainfall variability (1738 mm) in annualnormal rainfall spatial distribution signifies the marked climatic gradient across Pakistan.Fig. 9 depicts the summer monsoon (JAS) rainfall distribution over different sub-regionsof Pakistan. It is observed that again the most of rainfall concentration is over sub-northern areas of Pakistan i.e. ginger pink shaded spots (642-771 mm) surroundingIslamabad, Sialkot, Kakul, Balakot and suburbs. Next higher range of 514-642 mm spreadsover the rest of the northeast area covering the stations, Jhelum, Kotli, Garhi Dupatta andKamra. The third higher range of 386-514 mm engulfs the area stretching from Lahoretowards northwest followed by a decrease in rainfall towards the south and southwestuntil comes almost entire Balochistan (with exception of a few sites in the northeast),southwest Punjab and central and upper Sindh where a minimum range of just a few to129 mm is noticeable. Hence, we can conclude that the bulk of the monsoon rains fellover sub-northern areas of Pakistan. Pattern wise it is by and large similar to what wefound in the annual rainfall spatial distribution.Fig. 10 manifests the 30-year normal winter (DJFM) rainfall spatial distribution acrossPakistan. DJFM rainfall is the second largest contributor with 30% share to the annualtotal rainfall of Pakistan. It is evident that largest rainfall range 514-642 mm is found onlyaround Dir in the northwest followed by next higher range 386-514 mm persisting overthe area around Murree, Kakul, Balakot, Saidu Sharif and Garhi Dupatta. It is noticeablethat maximum DJFM-rainfall occur over the same geographical location as that in JAScase, but covered area getting thinned out than that observed in the latter case (Figs. 8and 9). Here the minimum range falling below 129 mm is observed covering more thanthree-fourth of Pakistan stretches from southwest to northeastwards and culminatingaround Mianwali and suburbs and then reemerging over an eastern GB in the northeast.This is in a contrast to the range-minima we observed in annual and JAS rainfall spatialdistribution (Figs. 8-9). It is because the country's west and southwest areas receive theirbulk of rains during the winter season due to the eastward propagating mid-latitudecyclones called the western disturbances, WDs (Martyn, 1992).Apart from JAS and DJFM rains, respectively 57% and 30%, the rest 13% is contributed bythe local convective thunderstorm development occurring in transition periods, pre-monsoon and post-monsoon. To see how exactly the rainfall during these two transitionperiods is spatially distributed we further sub-divide these into spring or pre-monsoonseason (April to June, AMJ) and autumn/post-monsoon season (October – November,ON). Fig. 11 depicts the spatial rainfall distribution during pre-monsoon or spring period
Regionalizing the climate of Pakistan using Koppen classification system
125
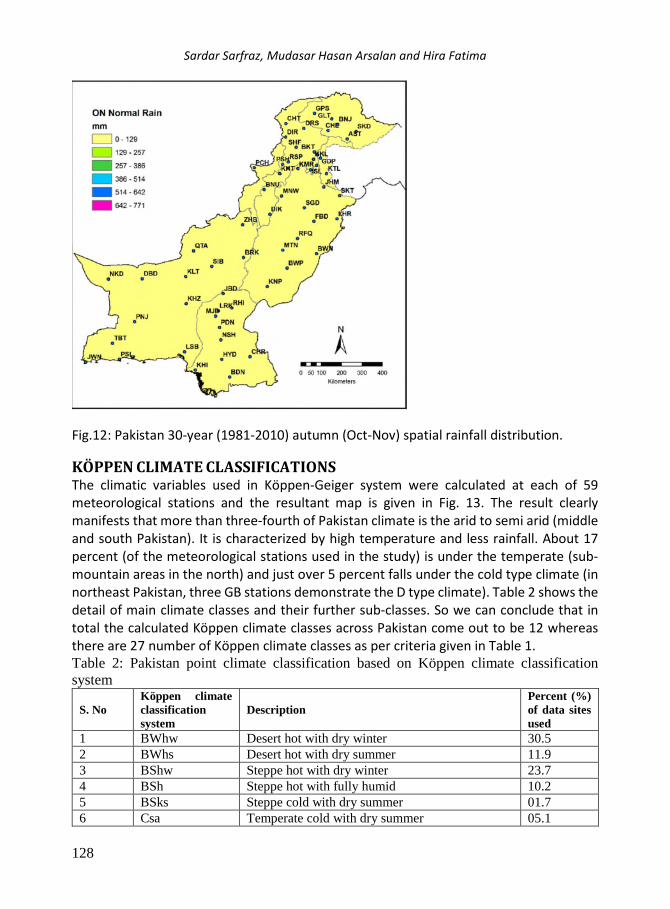
(AMJ) with telling fact of the range-maxima (about 257-386 mm) in this case found yetagain over the same sub-northern area surrounding Murree, Kakul, Gari Dupatta andMuzaffarabad and Balakot. Next to this range is 129-257 mm observable in its all-aroundvicinity, a trend with great similarity to what observed in Fig. 8 to10. Obviously theminimum rainfall range 0-129 mm is spatially distributed over most of the GB, KP andPunjab, entire Sindh and Balochistan.The Fig. 12 shows the rainfall spatial distribution during the autumn season (October -November, ON) which we also call the post-monsoon season. It is climatically the leastrainfall yielding or most dry season of the year. Contrary to all three seasons discussedearlier here it is observable that almost the whole of the country is under the lowestminima of less than 129 mm rainfall. ON or post-monsoon thus figures out to be a seasonwhen Pakistan experiences markedly insignificant amount of rain.The annual normal rainfall spatial distribution (Fig. 8), ranging from 1485-1775 mm in sub-northern areas of the country and 37-327 mm in southwest and south of Pakistan, showsa huge intra-region rainfall variability. Similarly the spatial distribution of four seasonalrainfalls, JAS (Fig. 9), DJFM (Fig. 10), AMJ (Fig. 11) and ON (Fig. 12), reveals that moresignificant rains are experienced by the sub-northern country and very little rains fell oversouth/southwest of the country. Thus the spatial rainfall distribution, either annual orseasonal, exposes an interestingly common feature of being significantly large innorth/sub-northern areas of the country and insignificantly low over the south /southwest.Precipitation, the second important parameter of the climate, is greatly influenced by thealtitude, mountain barriers and topography, Walterschied (2009). Pakistan isgeographically surrounded by the high mountain ranges, Himalaya-Karakoram-Hindukush(HKH), which have great bearing on the climate of the area by not only modifying therainfall and temperature of Pakistan, but also greatly influence the general atmosphericcirculation in the Sub-continent, Pakistan Geographical Review, (1962). Generally thewindward side of the mountainous region receives enhanced rainfall while the leewardside being devoid of this advantage exposes a barren look, Chaudhry and Rasul, (2004).Hence, the great rainfall variability observed in annual and seasonal spatial distributionacross Pakistan (Figs. 8 – 12) can certainly be attributed to have resulted mainly due tovarying altitude peculiar topography and mountain barriers in the north of Pakistan. It istherefore this huge rainfall and temperature contrast between south and north Pakistan,which proves to be a critical factor for defining different climate types within the Pakistanmainland.

Sardar Sarfraz, Mudasar Hasan Arsalan and Hira Fatima
126
Fig.8: Pakistan 30-year (1981-2010) annual rainfall (mm) spatial distribution.
Fig. 9: Pakistan 30-year (1981-2010) summer monsoon (JAS) spatial rainfall distribution.
Regionalizing the climate of Pakistan using Koppen classification system
127
Fig. 10: Pakistan 30-year (1981-2010) winter (DJFM) spatial rainfall distribution.
Fig.11: Pakistan 30-year (1981-2010) spring (AMJ) spatial rainfall distribution.
Sardar Sarfraz, Mudasar Hasan Arsalan and Hira Fatima
128
Fig.12: Pakistan 30-year (1981-2010) autumn (Oct-Nov) spatial rainfall distribution.
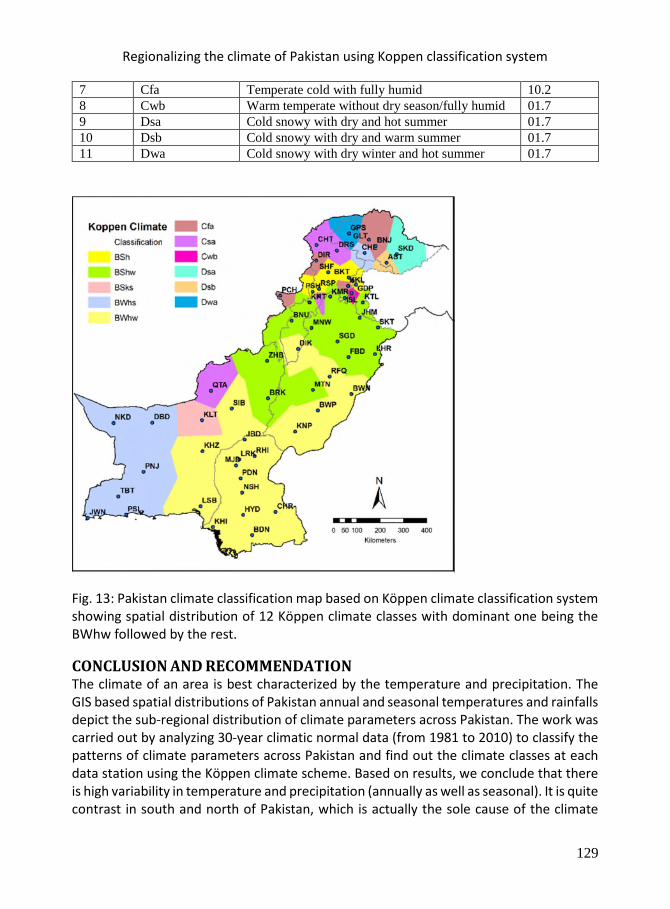
KÖPPEN CLIMATE CLASSIFICATIONSThe climatic variables used in Köppen-Geiger system were calculated at each of 59meteorological stations and the resultant map is given in Fig. 13. The result clearlymanifests that more than three-fourth of Pakistan climate is the arid to semi arid (middleand south Pakistan). It is characterized by high temperature and less rainfall. About 17percent (of the meteorological stations used in the study) is under the temperate (sub-mountain areas in the north) and just over 5 percent falls under the cold type climate (innortheast Pakistan, three GB stations demonstrate the D type climate). Table 2 shows thedetail of main climate classes and their further sub-classes. So we can conclude that intotal the calculated Köppen climate classes across Pakistan come out to be 12 whereasthere are 27 number of Köppen climate classes as per criteria given in Table 1.Table 2: Pakistan point climate classification based on Köppen climate classificationsystem
S. NoKöppen climateclassificationsystem
DescriptionPercent (%)of data sitesused
1 BWhw Desert hot with dry winter 30.52 BWhs Desert hot with dry summer 11.93 BShw Steppe hot with dry winter 23.74 BSh Steppe hot with fully humid 10.25 BSks Steppe cold with dry summer 01.76 Csa Temperate cold with dry summer 05.1
Regionalizing the climate of Pakistan using Koppen classification system
129
7 Cfa Temperate cold with fully humid 10.28 Cwb Warm temperate without dry season/fully humid 01.79 Dsa Cold snowy with dry and hot summer 01.710 Dsb Cold snowy with dry and warm summer 01.711 Dwa Cold snowy with dry winter and hot summer 01.7
Fig. 13: Pakistan climate classification map based on Köppen climate classification systemshowing spatial distribution of 12 Köppen climate classes with dominant one being theBWhw followed by the rest.
CONCLUSION AND RECOMMENDATIONThe climate of an area is best characterized by the temperature and precipitation. TheGIS based spatial distributions of Pakistan annual and seasonal temperatures and rainfallsdepict the sub-regional distribution of climate parameters across Pakistan. The work wascarried out by analyzing 30-year climatic normal data (from 1981 to 2010) to classify thepatterns of climate parameters across Pakistan and find out the climate classes at eachdata station using the Köppen climate scheme. Based on results, we conclude that thereis high variability in temperature and precipitation (annually as well as seasonal). It is quitecontrast in south and north of Pakistan, which is actually the sole cause of the climate
Sardar Sarfraz, Mudasar Hasan Arsalan and Hira Fatima
130
differences between north and south of Pakistan. The Köppen climate classifications at59 meteorological stations demonstrate that with total 11 number of Köppen climateclasses found the three-fourth area falls under arid to semi-arid climate, a handful fallingunder the temperate class followed by a dry cold climate in the north observed at a fewstations. The results can further be refined by using the data over longer periods of 50-year, 60, or 90years.
ACKNOWLEDGEMENTThe authors are extremely thankful to the Pakistan Meteorological Department forproviding the data used in this work.
REFERENCESArcGIS Resources. (2014a) An overview of Generalization Toolset. In ArcGIS Help 10.1,
Esri, Redlands, CA, URL: http://resources.arcgis.com/en/help/main/10.2/index.html#//009z00000033000000 Last visited 02/05/2015
ArcGIS Resources. (2014b) Renderers used to display the raster data, Esri, Redlands, CA,URL: http://resources.arcgis.com/en/help/main/10.1/index.html#//009t0000006r000000 Last visited 02/05/2015
ArcGIS Resources. (2015a) What is Production Mapping? (Production Mapping). InArcGIS Help 10.1, Esri, Redlands, CA, URL: http://resources.arcgis.com/en/help/main/10.2/index.html#//010300000214000000 Last visited 02/05/2015
ArcGIS Resources.(2015b) Extending your map with spatial analysis. In ArcGIS Help 10.1,Esri, Redlands, CA, URL: http://resources.arcgis.com/en/communities/analysis/017z00000015000000.htm Last visited 02/05/2015
Arif Zubair, A. Farhan Khan and Muhammad Umer Khan, 2013: Elements of MonsoonCirculation and its Behaviour Impact over Pakistan; European Academy Research,Vol. I (5).
A. Irmak, P. K. Ranade, D. Marx, S. Irmak, K. G. Hubbard, G. E. Meyer, D. L. Martin (2010): Spatial Interpolation of Climate Variables in Nebraska, Transactions of theASABE. 53(6): 1759-1771.
Austin Miller, 1949: Climatology, London.Anwar, M.M. (1993): A geography of Pakistan, Book-World Islamabad andLahore, pp.
20-60.Blair, T.A. (1942): Climatology, general and regional, Prentice-Hall, INC.,New York, pp.
484.Burgos, J.J. (1958): Agroclimatic classifications and representations: report of the
applications value of climatic and agroclimatic classification for agriculturalpurposes;Comission for Agricultural Meteorology, WMO, Varsovia.
B. J. Garnier, 1951: Thornthwaite’s New System of Climatic Classification inItsApplication to New Zealand; Trans-action of the Royal Society of New Zealand, Vol.79, pp. 87-103.
Regionalizing the climate of Pakistan using Koppen classification system
131
Climate Data Processing Centre, Pakistan Meteorological Department, 2013: TheClimatic Normals of Pakistan,1961-90 and 1981-2010
C. W. Thornthwaite, 1948: An Approach towards a Rational ClimateClassification,Geographical Review, Vol. 38, No. 1, pp. 55-94.
R. da Cunha, A. R., & Schöffel, E. R. (2011): The Evapotranspiration in ClimateClassification; INTECH Open Access Publisher.
De Beurs, K., Stein, A., & White, J. W. (1999). Interpolation techniques for climatevariables (p. 26), Mexico, DF: CIMMYT.
Doerr, A.H. (1962). Thornthwaite's original climatic classification andOklahoma'sclimate,
Proceedings of the Oklahoma Academy of Science Vol. 42 (1), pp. 231-235.Hijmans, R. J., Cameron, S. E., Parra, J. L., Jones, P. G., & Jarvis, A. (2005): Very
highresolution interpolated climate surfaces for global land areas; Internationaljournal of climatology, 25(15), pp.1965-1978.
J. F. Griffiths, “Applied Climatology,” 2nd Edition, Ox-ford University Press, London,1978, p. 136.
Kazi S. Ahmad, E. T. Dean, A. Haye, Mrs. R. M. Durrani, K. U. Kureishy andAfzal Jaffri, 1951: Pakistan Geographical Review, Vol. VI, No. 1.
Khan J. A., 1993: The Climate of Pakistan, Rehber Publisher, Karachi, PakistanKöppen W., 1936: “Das Geographisca System der Klimate,” In: W. Köppen and G.C. Geiger, Eds., Handbuch derli-matologie, Gebr, Borntraeger, pp. 1-44.Kottek, M., Grieser, J., Beck, C., Rudolf, B., & Rubel, F. (2006): World map of the Köppen-Geiger climate classification updated; Meteorologische Zeitschrift,15(3), PP.259-263.Maida Zahid and Ghulam Rasul, 2011: Thermal Classification of Pakistan;Atmospheric
and Climate Sciences, Vol. 1, pp. 206-213.Martyn D, 1992: Climate of the world; Elsevier first edition, pp. 436Miller, A.A. (1959). Climatology, Mehtewn London and E.P. Dulton and Co.INC., New
York, pp. 313.Nasrullah, K. (1968). Climate of West Pakistan according to Thornthwaite system of
classification of climates, PGR Vol. 23 (No. 1): 12-25.Pakistan Geographical Review,1962, Vol.17 No. 1(1).
Peel, Murray C., Brian L. Finlayson, and Thomas A. McMahon, 2007: "Updated worldmap of the Köppen-Geiger climate classification." Hydrology and earth systemsciences discussions 4(2). Pp. 439-473.
Q. Z. Chaudhary and G. Rasul, 2004: Agro-Climatic Classification ofPakistan, ScienceVision, Vol. 9, No. 1-4, pp. 59-66.
Rodman E. Snead,1968: Weather patterns in Southern West Pakistan, Archiv fürMeteorologie, Geophysik und Bioklimatologie Serie B, Vol. 16 (4), Page 316.
Shamshad K.M., (1986): The Meteorology of Pakistan:Climate and Weather of Pakistan,Royal Book Company Karachi Pakistan, pp. 313.
Sardar Sarfraz, Mudasar Hasan Arsalan and Hira Fatima
132
Sluiter, R. (2008). Interpolation methods for climate data: literature review. De Bilt,Royal Netherlands Meteorological Institute(KNMI).
Steven K. Walterscheid, 2009: Climate Classification for the Earth's Oceanic Areas usingthe Köppen System; Masters Dissertation, Kansas State University, ManhattanKansas
Stern Harvey, Graham De Hoedt, and Jeneanne Ernst. 2000: "Objective classification ofAustralian climates." Australian Meteorological Magazine 49(2) pp.87-96.
S. U. Khan, M. Hassan, F. K. Khan and A. Bari, 2010: “Climate Classificationof Pakistan,”BALWOIS, Ohrid, pp. 1-47.
Walterscheid, Steven K., 2011: Climate classification for the earth's oceanic areas usingthe Köppen System. Diss. Kansas State University
WMO - World Meteorological Organization No. 100 (2009): Guide to climatologicalpractices, 3rd ed., pp. 180,URL://www.wmo.int/pages/prog/wcp/ccl/guide/guide_climat_practices.html.