Embed Size (px)
Citation preview

||Weather and Climate Risks GroupInstitute for Environmental Decisions, ETH ZürichFederal Office of Meteorology and Climatology MeteoSwiss
Regionalization of tropical cyclone impact functions
Samuel Eberenz ([email protected])Samuel LüthiDavid N. Bresch
DOI:10.5194/egusphere-egu2020-5611© Authors 2020. This work is distributed under the Creative Commons Attribution 4.0 License.

||Weather and Climate Risks GroupInstitute for Environmental Decisions, ETH ZürichFederal Office of Meteorology and Climatology MeteoSwiss
4 May 2020Samuel Eberenz | EGU General Assembly 2020 1
Introduction: Beyond the singular global tropical cyclone impact function
• Natural hazard risk assessmentsutilize impact functions to computeeconomic damage from hazardintensity and asset exposure.
• Regional impact functions are scarce.In the case of tropical cyclones (TCs),curves calibrated for the USA areoften applied globally.
• This can lead to a substantialoverestimation of regional TC impactsas compared to reported damage (c.f.world map).
• Here, we fit and assess regionalizedimpact functions in a global TC impactmodeling framework.
NA1: the Caribbean with Central America and Mexico (red);NA2: the USA and Canada (blue);NI: North Indian Ocean (green);OC: Oceania with Australia (purple);SI: South Indian Ocean (orange);WP1: South East Asia (yellow); WP2: the Philippines (brown); WP3: China mainland (rose); WP4: East Asia (black).
Regional total damage ratio (TDR): ratio between total simulated and reported tropical cyclone (TC) damagefor each region. Based on the modeling of wind induced direct economic damage with a default impact functionfor 473 events, i.e. 376 TCs (red lines) making landfall in 53 countries in nine regions:
DOI:10.5194/egusphere-egu2020-5611
Default (USA Impact function globally applied)

||
Weather and Climate Risks GroupInstitute for Environmental Decisions, ETH ZürichFederal Office of Meteorology and Climatology MeteoSwiss
ResultsImpact modeling
Weather and climate risk modeling platform
CLIMADA1
4 May 2020Samuel Eberenz | EGU General Assembly 2020 2
Data and Method: Assessing regionalized TC impact functions
HazardWind fields modelled1,2,3
from 4098 unique
TC tracks4 (1980-2017)
ExposureGridded physical
asset value5
(as of 2014)
VulnerabilityDefault impact function
mapping wind speed
to direct damage6
(calibrated for the USA)
Simulated damageDirect economic
damage per TC
event and country
Assigning: 473 matched data points* (damage per TC and country)
Reported damageDirect economic damage7
per TC event and country
(992 entries from 1980-2017)
Damage Ratio• EDR: ratio per event
• TDR: total ratio per region
!"#$%&'() *&#&+(,-.#&%"/() 0(1-.'() *&#&+(
Regionalized Impact Functions• Calibration by fitting impact functions
per region based on EDR and TDR
• Uncertainty estimation based on spread
of EDR
*) The 473 assigned TC events account for ~58% of
global simulated TC damage based on all 4098 TC
tracks from 1980-2017. Reported damage accounts for
76% of total normalized reported TC damage over the
same period of time (91% before normalization).
Damage comparison
DOI:10.5194/egusphere-egu2020-5611

||Weather and Climate Risks GroupInstitute for Environmental Decisions, ETH ZürichFederal Office of Meteorology and Climatology MeteoSwiss
4 May 2020Samuel Eberenz | EGU General Assembly 2020 3
R2=0.26 R2=0.34
Default (USA Impact function globally applied) Regionalized Impact Functions
Results: Damage comparison for 473 TC events
Calibration
WP4
DOI:10.5194/egusphere-egu2020-5611

||
Weather and Climate Risks GroupInstitute for Environmental Decisions, ETH ZürichFederal Office of Meteorology and Climatology MeteoSwiss
4 May 2020Samuel Eberenz | EGU General Assembly 2020 4
Results: Total damage ratio per region with regionalized impact functions
Regionalized Impact Functions
Regional total damage ratio (TDR): ratio between total simulated and reported tropical cyclone (TC) damage for each region.
Based on the modeling of wind induced direct economic damage with regionalized impact functions for 473 events, i.e. 376 TCs (red
lines) making landfall in 53 countries.
DOI:10.5194/egusphere-egu2020-5611
||Weather and Climate Risks Group
Institute for Environmental Decisions, ETH Zürich
Federal Office of Meteorology and Climatology MeteoSwiss
4 May 2020Samuel Eberenz | EGU General Assembly 2020 5
Discussion
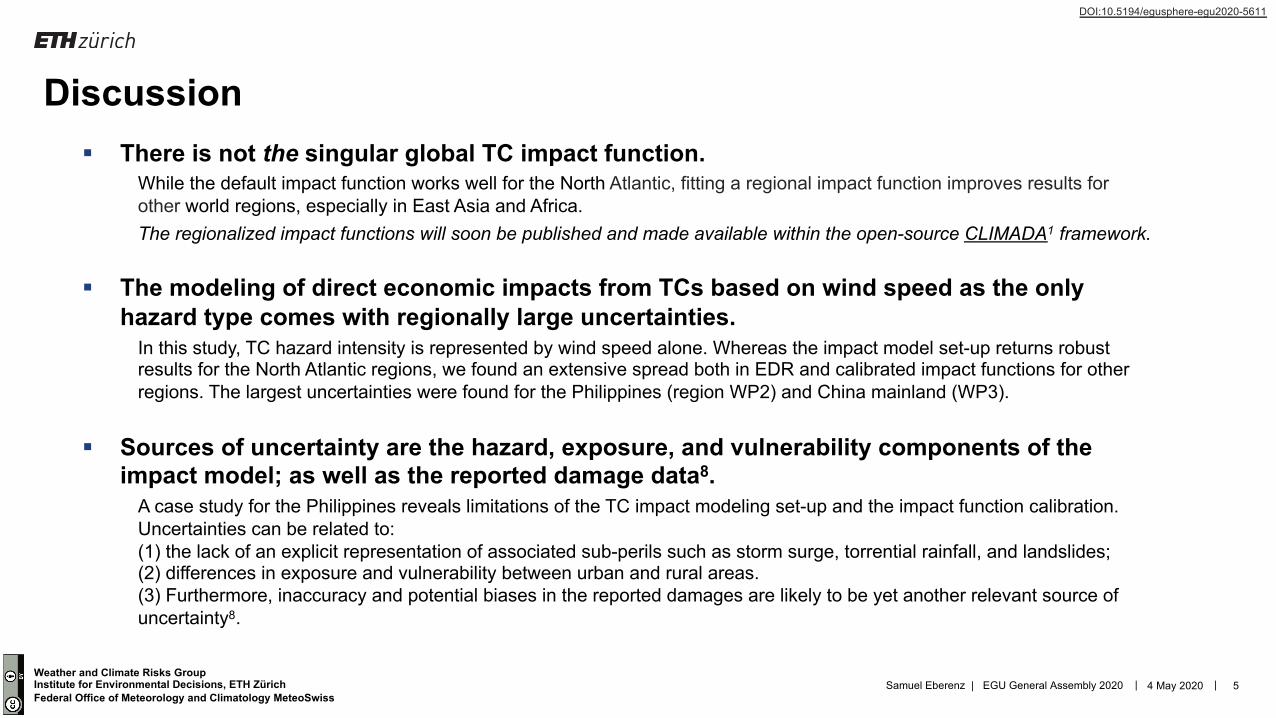
§ There is not the singular global TC impact function.
While the default impact function works well for the North Atlantic, fitting a regional impact function improves results for other world regions, especially in East Asia and Africa. The regionalized impact functions will soon be published and made available within the open-source CLIMADA1 framework.
§ The modeling of direct economic impacts from TCs based on wind speed as the only
hazard type comes with regionally large uncertainties.
In this study, TC hazard intensity is represented by wind speed alone. Whereas the impact model set-up returns robust results for the North Atlantic regions, we found an extensive spread both in EDR and calibrated impact functions for other regions. The largest uncertainties were found for the Philippines (region WP2) and China mainland (WP3).
§ Sources of uncertainty are the hazard, exposure, and vulnerability components of the
impact model; as well as the reported damage data8.
A case study for the Philippines reveals limitations of the TC impact modeling set-up and the impact function calibration. Uncertainties can be related to:(1) the lack of an explicit representation of associated sub-perils such as storm surge, torrential rainfall, and landslides;(2) differences in exposure and vulnerability between urban and rural areas.(3) Furthermore, inaccuracy and potential biases in the reported damages are likely to be yet another relevant source of uncertainty8.
DOI:10.5194/egusphere-egu2020-5611
||Weather and Climate Risks GroupInstitute for Environmental Decisions, ETH ZürichFederal Office of Meteorology and Climatology MeteoSwiss
4 May 2020Samuel Eberenz | EGU General Assembly 2020 6
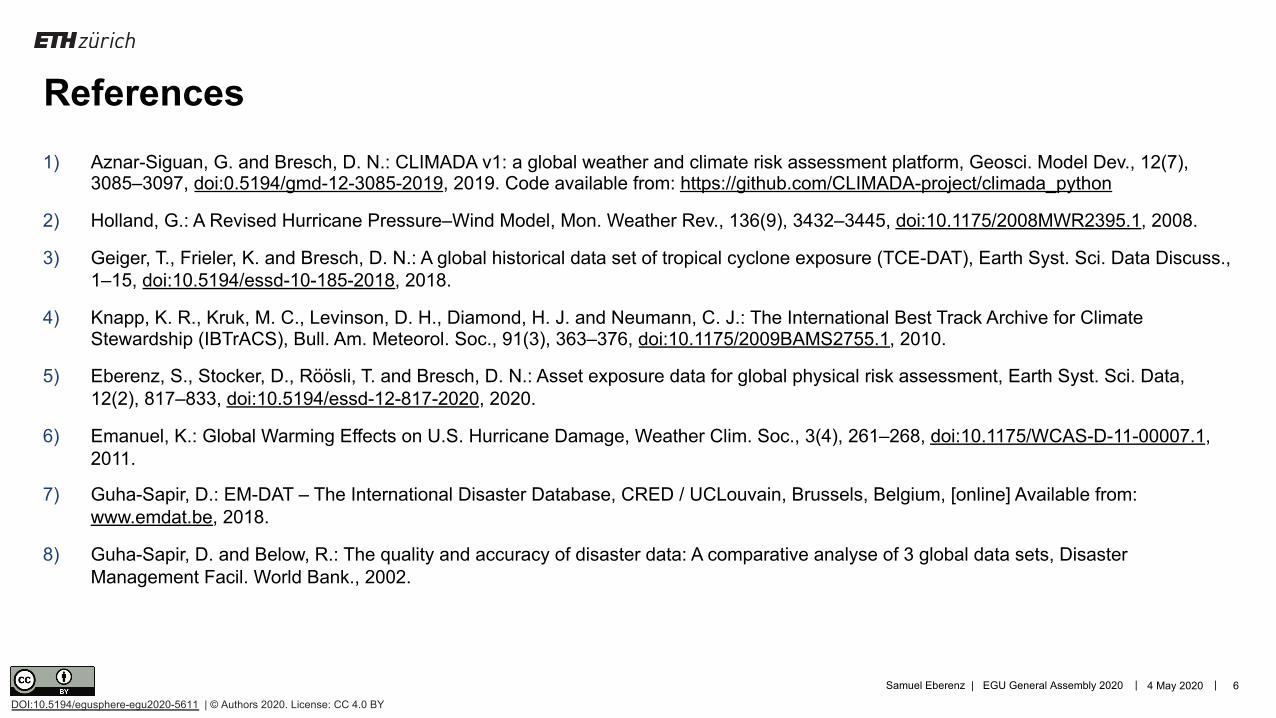
References1) Aznar-Siguan, G. and Bresch, D. N.: CLIMADA v1: a global weather and climate risk assessment platform, Geosci. Model Dev., 12(7),
3085–3097, doi:0.5194/gmd-12-3085-2019, 2019. Code available from: https://github.com/CLIMADA-project/climada_python
2) Holland, G.: A Revised Hurricane Pressure–Wind Model, Mon. Weather Rev., 136(9), 3432–3445, doi:10.1175/2008MWR2395.1, 2008.
3) Geiger, T., Frieler, K. and Bresch, D. N.: A global historical data set of tropical cyclone exposure (TCE-DAT), Earth Syst. Sci. Data Discuss., 1–15, doi:10.5194/essd-10-185-2018, 2018.
4) Knapp, K. R., Kruk, M. C., Levinson, D. H., Diamond, H. J. and Neumann, C. J.: The International Best Track Archive for Climate Stewardship (IBTrACS), Bull. Am. Meteorol. Soc., 91(3), 363–376, doi:10.1175/2009BAMS2755.1, 2010.
5) Eberenz, S., Stocker, D., Röösli, T. and Bresch, D. N.: Asset exposure data for global physical risk assessment, Earth Syst. Sci. Data, 12(2), 817–833, doi:10.5194/essd-12-817-2020, 2020.
6) Emanuel, K.: Global Warming Effects on U.S. Hurricane Damage, Weather Clim. Soc., 3(4), 261–268, doi:10.1175/WCAS-D-11-00007.1, 2011.
7) Guha-Sapir, D.: EM-DAT – The International Disaster Database, CRED / UCLouvain, Brussels, Belgium, [online] Available from: www.emdat.be, 2018.
8) Guha-Sapir, D. and Below, R.: The quality and accuracy of disaster data: A comparative analyse of 3 global data sets, Disaster Management Facil. World Bank., 2002.
DOI:10.5194/egusphere-egu2020-5611 | © Authors 2020. License: CC 4.0 BY