Embed Size (px)
Citation preview

Research Department Minnesota House of Representatives 600 State Office Building 100 Rev. Dr. Martin Luther King Jr. Boulevard St. Paul, MN 55155 www.house.mn/hrd
Minnesota State Demographic Center Centennial Office Building, Room 300
658 Cedar Street St. Paul, MN 55155 www.demography.state.mn.us
Sean Williams, House Research Susan Brower, Minnesota State Demographic Center September 2018
Regional Trends in the Domestic Migration of Minnesota’s Young People
Minnesota has experienced an ongoing loss of residents to other states since the early 2000s. This publication presents data on the migration patterns of Minnesotans aged 18 to 29, who are the most likely age group to move between Minnesota and other states. It also describes the degree to which domestic migration patterns vary in different regions of the state.
Note on A Changing Minnesota series: This publication is the third in an occasional series of joint publications between House Research and the State Demographic Center on demography and a changing Minnesota. The goal of this series is to meld data on Minnesota as a changing polity with an overview of statutes and public policies that are affected by those changes.
Contents
Introduction ...................................................................................................... 2 Migration Peaks During Young Adulthood ..................................................... 3 Migration of Young People by Age ................................................................. 4 Regional Migration Rates ................................................................................ 6 Total Net Migration by Region ...................................................................... 10 Demographics of the Population that Migrated ............................................. 11 Destinations of Those Who Moved ............................................................... 18 Conclusion ..................................................................................................... 20
HOUSE RESEARCH & STATE DEMOGRAPHIC CENTER
A Changing Minnesota

House Research Department and Minnesota State Demographic Center September 2018 Regional Patterns in Domestic Migration Page 2
Introduction Minnesota has experienced an ongoing loss of residents to other states since the early 2000s—the result of state-to-state migration. Between 2000 and 2010, Minnesota lost about 45,000 residents in total, and since 2010, the state has lost an additional 34,000 residents (2010-2017). New data from recent years suggest that the trend may be reversing,1 or at least tempering, but it is still too early to tell whether Minnesota will see a lasting reversal of these long-standing migration patterns.
Migration to and from Minnesota—in particular the migration of young people—will impact the future of Minnesota’s economy and governance. The state currently spends a significant portion of its budget on education; if individuals who are educated in Minnesota leave the state, the economic and social contributions of that investment leaves with them. Projections by the State Demographic Center indicate that the state’s death rate will exceed the birth rate at some point in the early 2040s.2 As a result, future population growth in Minnesota will depend on the state’s ability to attract new residents through migration.
Census data demonstrate that this statewide trend is largely a product of the migration patterns of young people, particularly those aged 18 to 29. The data show that the statewide migration pattern of individuals in this age group were not uniform. Different regions of the state experienced very different migration trends, both in terms of the number and the demographic characteristics of the young people migrating to and from each region.
This publication attempts to distinguish the migration patterns occurring in different regions of the state. Given the state’s geographic, economic, and cultural diversity, it is likely that the migration patterns of young people differ significantly. The publication focuses on the differences in migration patterns between individuals residing in four geographic regions of the state—Hennepin County, Ramsey County, other counties in the seven-county metropolitan area, and Greater Minnesota. These groupings are unfortunately broad, and do not account for differences within each region. However, given the sample sizes and geographic groupings used by the U.S. Census Bureau’s American Community Survey, it is difficult to say anything statistically meaningful about smaller geographic groups.
This publication focuses exclusively on state-to-state migration. While migration within Minnesota and international migration are both of demographic and policy interest, those topics are discussed in detail in a report by the State Demographic Center.3
1 The Census Bureau’s 2017 population estimates showed Minnesota’s domestic net migration was 7,941, meaning more individuals moved to Minnesota from another state than left Minnesota for another state. United States Census Bureau, Population Division, December 2017.
2 Minnesota State Demographic Center, “Minnesota on the Move: Migration Patterns & Implications,” January 2015. https://mn.gov/bms-stat/assets/mn-on-the-move-migration-report-msdc-jan2015.pdf.
3 Ibid.

House Research Department and Minnesota State Demographic Center September 2018 Regional Patterns in Domestic Migration Page 3
Migration Peaks During Young Adulthood Minnesotans of all ages migrate between states, but Minnesotans in their late teens and twenties migrate with the greatest frequency. Figure 1 shows the frequency with which individuals in Minnesota migrated to and from another state. Migration peaks in early adulthood—around ages 18 to 19—and slowly declines throughout adulthood. While there is a small uptick in migration among individuals nearing retirement age, the size of that increase is small in comparison to the migration patterns of younger people. To the extent that net migration has a large effect on Minnesota’s population, it is mostly due to the migration of individuals younger than 30.

House Research Department and Minnesota State Demographic Center September 2018 Regional Patterns in Domestic Migration Page 4
Migration of Young People by Age Net migration of young Minnesotans varies greatly among different age cohorts. As Figure 1 shows, both in- and out-migration spike at ages 18 and 19 as individuals attending postsecondary institutions depart for other states and arrive in Minnesota. Statewide, the outflow of 18- and 19-year-olds to other states is much larger than the inflow, peaking at around age 19, where the state experiences an out-migration rate of about 117 individuals of that age per 1,000. While in-migration also increases, the increases are not sufficient to offset the number of Minnesotans leaving for other states. At ages 20 and 21, both in- and out-migration decline somewhat, but out-migration continues to outpace in-migration.
At ages 22 through 25, both in- and out-migration begin to increase as individuals complete college, but in-migration overtakes out-migration in this age range. Of any age, 23-year-olds have the highest rate of in-migration to Minnesota; about 79 individuals per 1,000 of that age migrate to the state. From ages 26 to 29, both in- and out-migration trend downward, but in-migration tends to outpace out-migration among individuals in that age range.
Significantly more 18- to 21-year-old Minnesotans move to another state than arrive from another state. Figure 3 displays the same pattern as Figure 2, but it subtracts out-migration from in-migration to estimate net state-to-state migration in Minnesota for each age group. Statewide, Minnesota lost 10,653 more residents aged 18 to 21 to other states than it gained from other states.

House Research Department and Minnesota State Demographic Center September 2018 Regional Patterns in Domestic Migration Page 5
Among individuals aged 22 to 29, the trend was reversed, with more individuals entering Minnesota from other states than leaving it. The positive migration of individuals in their twenties is much smaller than the outmigration of those aged 18 to 21. On net, Minnesota gained 2,338 individuals aged 22 to 29 due to state-to-state migration, meaning the state offset about 22 percent of its loss of individuals in the younger cohort with in-migration of individuals who moved to Minnesota in their twenties.

House Research Department and Minnesota State Demographic Center September 2018 Regional Patterns in Domestic Migration Page 6
Regional Migration Rates Minnesota’s statewide migration patterns provide one view of population flows to and from the state, but that view hides the varied patterns occurring in different regions of the state. Figure 4 shows state-to-state migration patterns for Ramsey County, Hennepin County, other seven-county metro area, and Greater Minnesota. The regional trends are clearly distinct from one another, and none matches with the pattern in the state as a whole.
The regional analysis in Figure 4 is necessarily noisier than the statewide trend, because the samples for the four regions are smaller than the state as a whole. While variation from one year to the next at the regional level results, in part, from statistical noise due to sampling error, distinct differences in migration patterns by age and region are apparent. Ramsey County experienced less out-migration of 18- to 21-year-olds, and saw significant positive net migration among individuals ages 23 to 29. Hennepin County saw comparatively high rates of out-migration among 18- and 19-year-olds, but also higher rates of in-migration among individuals in the early twenties. The other metro counties had the highest rates of out-migration of college-aged individuals of the four regions analyzed. Greater Minnesota generally had lower rates of migration than the other four regions, with out-migration outpacing in-migration among almost all ages measured cohorts.
House Research Department and Minnesota State Demographic Center September 2018 Regional Patterns in Domestic Migration Page 7
To improve the stability of the estimates, the data are aggregated into two age groups—18- to 21-year-olds and 22- to 29-year-olds. In this section, the 18- to 21-year-old cohort is referred to as “the younger cohort” and the 22- to 29-year-old cohort as “the older cohort.” The aggregated results for these age groups are presented in Figures 5 and 6. These figures show migration rates per 1,000 persons of a given age, meaning they control for differences in population in the different regions.
Migration to and from Ramsey County
While the state as a whole experienced net negative migration of 18- to 21-year-olds, the trend in Ramsey County was approximately flat. After aggregating together Minnesotans in this age range, there was slightly more in-migration than out-migration, but the uncertainty of this estimate was wide enough that it may be due to sampling error alone. One potential reason for this trend is the large number of private nonprofit colleges in Ramsey County (relative to the county’s size).
However, Ramsey County was successful at attracting individuals in the older cohort from other states. Minnesota as a whole experienced positive state-to-state net migration of 22- to 29-year-olds, and a significant portion of that positive trend was the result of individuals moving to Ramsey County. Ramsey County experienced positive net migration of about 1,400 24- to 29-year-olds. Given that the state experienced total net migration of about 2,300 individuals in that cohort, net migration to Ramsey County’s positive net migration was responsible for about 59 percent of the total gain in the older cohort statewide.4
Migration to and from Hennepin County
The pattern in Hennepin County also differed from the statewide pattern. Among 18 to 21-year olds, Hennepin County had the highest rate of in-migration of any of the four regions we analyzed. Even so, the County’s out-migration rate was high enough that it experienced negative net-migration of individuals in the younger cohort; about 1,500 more individuals in the age group left Hennepin County for other states than migrated to the county.
Among individuals aged 22 to 29, Hennepin County had positive net migration. Hennepin County’s out-migration rate was similar to Ramsey County’s, and its in-migration rate was slightly lower. However, because of Hennepin County’s larger population, it actually had the greatest total net migration of the four regions analyzed; on the net Hennepin County added about 1,900 individuals aged 22 to 29 due to state-to-state migration.
4 While the statewide total net migration among the 22- to 29-year-old cohort was approximately 2,300 individuals, Greater Minnesota experienced negative net migration of about 1,500 individuals. As a result, the percent contribution to the statewide total by Hennepin County, Ramsey County, and other metro counties would sum to greater than 100 percent.

House Research Department and Minnesota State Demographic Center September 2018 Regional Patterns in Domestic Migration Page 8
Migration to and from Other Metro Counties
The most obvious differences from the statewide pattern were in the other five metro-area counties—Anoka, Carver, Dakota, Washington, and Scott. Those counties experienced the highest rate of out-migration of 18- to 21-year-olds among the four regions analyzed. Out-migration of young people aged 18 to 21 was about 138 per 1,000; in other words, about 14 percent of 18- to 21-year-olds living in those counties migrated to other states. Those counties simultaneously experienced very low rates of in-migration for that age cohort—about 25 individuals per 1,000. This is potentially because there are relatively few four-year schools in these counties; neither Minnesota State nor the University of Minnesota operate a four-year campus in those counties.
These five metro counties account for a significant portion of the total migration of individuals in the younger cohort from Minnesota to other states. Statewide, Minnesota experienced net migration of about -10,700 individuals aged 18 to 21; of that total, approximately 5,900 migrated away from metro counties other than Hennepin and Ramsey. In other words, about 55 percent of the state’s net outflow of 18- to 21-year-olds to other states came from the other five metro-area counties.

House Research Department and Minnesota State Demographic Center September 2018 Regional Patterns in Domestic Migration Page 9
While the pattern in the other metro counties for 18- to 21-year-olds was an exaggerated version of the overall trend in the state, the pattern for 22- to 29-year-olds was similar to the statewide pattern. The Census data showed that net migration of 22- to 29-year-olds was about 600, but given the uncertainty of that estimate, it is possible that net migration was flat or slightly negative.
Migration to and from Greater Minnesota
Greater Minnesota was the only region of the four that experienced net negative migration of both 18- to 21-year-olds and 22- to 29-year-olds. Even so, as was the case statewide, out-migration in Greater Minnesota was greater among 18- to 21-year-olds and in-migration was greater among 22- to 29-year-olds.
Among the younger cohort, Greater Minnesota experienced both more in-migration and less out-migration that the “Other Metro Counties” region. As a result, Greater Minnesota’s net migration rate was less extreme—about -23 per 1,000 individuals aged 18 to 21—compared with about -113 per 1,000 in the Other Metro Counties region. However, Greater Minnesota has a larger population than the Other Metro Counties, meaning that it still experienced a large amount of total out-migration. Overall, Greater Minnesota experienced net migration of about
House Research Department and Minnesota State Demographic Center September 2018 Regional Patterns in Domestic Migration Page 10
-3,400 individuals aged 18 to 21, which accounted for about 32 percent of the total net migration out of Minnesota among that age group.
Among individuals aged 22 to 29, Greater Minnesota’s total net state-to-state migration was less extreme than for the 18- to 21-year-old cohort—about -1,500. Even so, it is a troubling sign for the region that the migration rate among this age cohort was negative. While the state of Minnesota as a whole is able to partially offset the out-migration of the younger cohort with in-migration of the older cohort, Greater Minnesota experienced negative net migration of individuals in both groups.
Total Net Migration by Region The data presented above in figures 5 and 6 show migration rates per 1,000 individuals of a given age. Adjusting the migration rate for population allows for easier comparisons between four regions of different sizes, but it makes it difficult to identify the share of statewide migration each region is responsible for.
Figure 7 shows the total net migration of individuals in each region in the state in comparison with the statewide total net migration. The four regional trends help contextualize the broader trend in Minnesota. Minnesota lost more than 10,000 individuals aged 18 to 21 per year to other states, and the largest share of these individuals migrated from Greater Minnesota, Hennepin County, and the Other Metro Counties region. The state as a whole experienced positive net migration of individuals in their later twenties, and these individuals mostly moved to Ramsey County and Hennepin County.

House Research Department and Minnesota State Demographic Center September 2018 Regional Patterns in Domestic Migration Page 11
Demographics of the Population that Migrated Student Status
There is strong evidence that most of individuals who migrated between Minnesota and other states when they were 18 to 21 years old were leaving to go to school. Figure 8 shows the share of 18- to 21-year-olds that migrated to and from each region that were students. Over 75 percent of the individuals who moved to and from Hennepin and Ramsey County were students, including about 91 percent of the individuals who moved to Ramsey County. This finding is unsurprising, because both counties feature a University of Minnesota campus, a Minnesota State campus, community colleges, and multiple private colleges and technical schools.

House Research Department and Minnesota State Demographic Center September 2018 Regional Patterns in Domestic Migration Page 12
Notably, a significant portion (about 87 percent) of 18- to 21-year-olds who moved away from the Other Metro Counties region were students, while a significantly smaller share of those who moved to the region (about 59 percent) were students. This likely reflects the comparatively small number of four-year campuses in the five other metro counties.
Similar proportions of the 18- to 21-year-olds who moved between Greater Minnesota and other states were students—about 71 percent of those who left the region and 72 percent of those who moved to the region. These percentages are smaller than Hennepin and Ramsey County, but greater than the other five metro counties. While Greater Minnesota has an even larger number of colleges and universities than Hennepin and Ramsey County, its population of 18- to 21-year-olds was significantly higher (about 150,000) than either Hennepin or Ramsey County (about 57,000 and 31,000 respectively). Hennepin and Ramsey County are unique in that they contain large numbers of higher education institutions in a comparatively small geographic region. As a result a larger share of the students migrating to those counties are students.
Unsurprisingly, comparatively fewer 22- to 29-year-olds who migrated between Minnesota and other states were students. Figure 9 shows the student status of the older cohort. In general, less than 30 percent of the individuals in the 22- to 29-year-old cohort were students—this trend held for both individuals migrating to and from Minnesota. The greatest outlier from the trend was Ramsey County, where about 38 percent of the individuals who migrated to another state were

House Research Department and Minnesota State Demographic Center September 2018 Regional Patterns in Domestic Migration Page 13
students. This may indicate that students who migrated away from Ramsey County were more likely to attend graduate school.
Place of Birth
An intuitive interpretation of the migration patterns described above is that people who move to Minnesota between the ages of 22 to 29 are returning home after attending college in another state. To some extent that is certainly true, but this analysis shows that it is likely not the most common reason people in that age group move to Minnesota.
Using Census data, it is difficult to identify how many individuals return to Minnesota after attending college in another state. The American Community Survey only asks the question: “Where did this person live one year ago?” For individuals in their mid-twenties who move to the state, that question will only reveal that they migrated to Minnesota—it does not reveal where they graduated from high school or where they were living four years ago when they may have departed for college.5
5 As recently as 2000, the Census asked respondents where they lived five years ago. This question has been discontinued.

House Research Department and Minnesota State Demographic Center September 2018 Regional Patterns in Domestic Migration Page 14
As a result, place of birth is the best proxy for identifying how many students are migrating back to the state after college. This is obviously imperfect—it is possible, for example, that an individual was born in Iowa, graduated from a Minnesota high school, went to college in Wisconsin, and returned to Minnesota in their twenties. Even so, it is the best available measure of return migration.
Figure 10 shows the birthplace of 22- to 29-year-olds who migrated to Minnesota from another state. In all four regions analyzed, the most common place of birth for that subgroup was a state other than Minnesota. In all four regions, no more than 23 percent of the older cohort that moved to Minnesota from another state was born in Minnesota. As a comparison, about 70 percent of the 18- to 21-year-old out-migrants were born in the state. While some of the individuals born in other states likely graduated from a Minnesota high school and departed for college, a significant portion likely moved to Minnesota for the first time.
Individuals who were born in Minnesota made up a larger share of the older cohort who moved to Greater Minnesota and Other Metro Counties than those who moved to Hennepin and Ramsey County. The totals in Greater Minnesota and the Other Metro Counties region were about 37 percent and 39 percent respectively, while they were about 29 percent of those who moved to Hennepin and Ramsey County.
House Research Department and Minnesota State Demographic Center September 2018 Regional Patterns in Domestic Migration Page 15
In Hennepin and Ramsey counties, a significant portion of 22- to 29-year-olds who moved to Minnesota were born in another country—about 18 percent and 23 percent, respectively. Although a comparatively small number (4.5 percent) of foreign-born individuals migrated to the Other Metro Counties region, Greater Minnesota also saw significant in-migration of foreign-born individuals in the older cohort; about 10 percent of those who migrated to Greater Minnesota were born in another country.
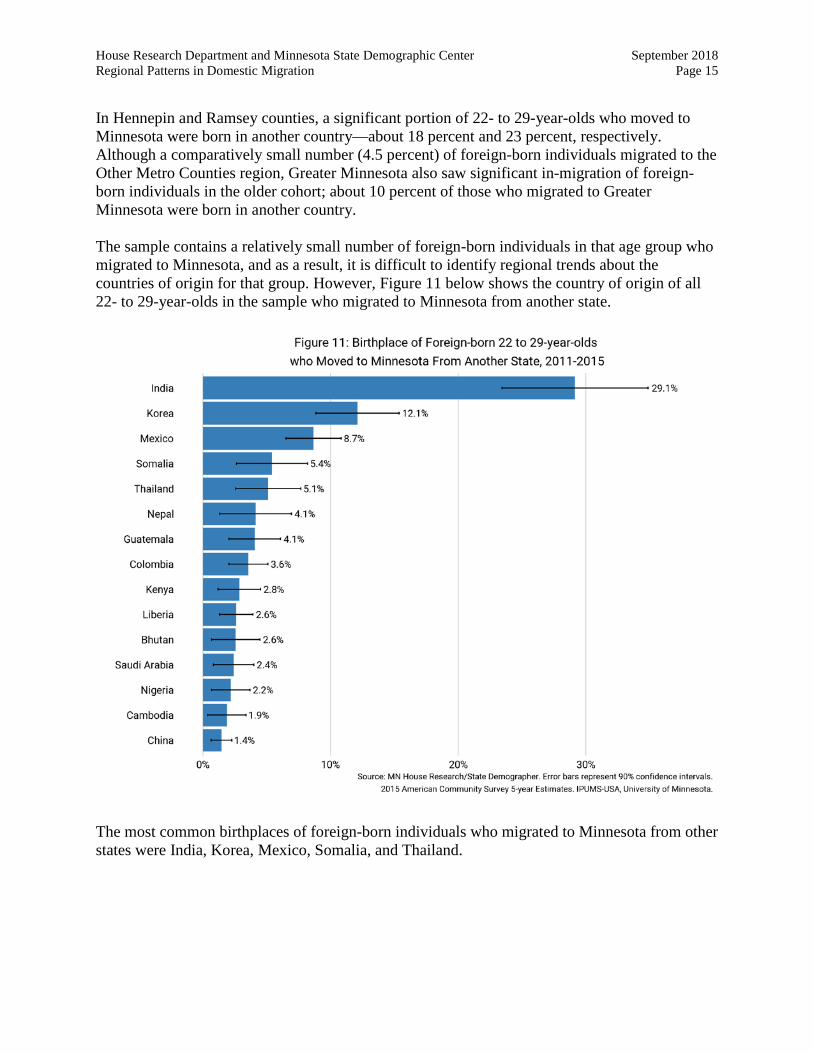
The sample contains a relatively small number of foreign-born individuals in that age group who migrated to Minnesota, and as a result, it is difficult to identify regional trends about the countries of origin for that group. However, Figure 11 below shows the country of origin of all 22- to 29-year-olds in the sample who migrated to Minnesota from another state.
The most common birthplaces of foreign-born individuals who migrated to Minnesota from other states were India, Korea, Mexico, Somalia, and Thailand.

House Research Department and Minnesota State Demographic Center September 2018 Regional Patterns in Domestic Migration Page 16 Educational Attainment
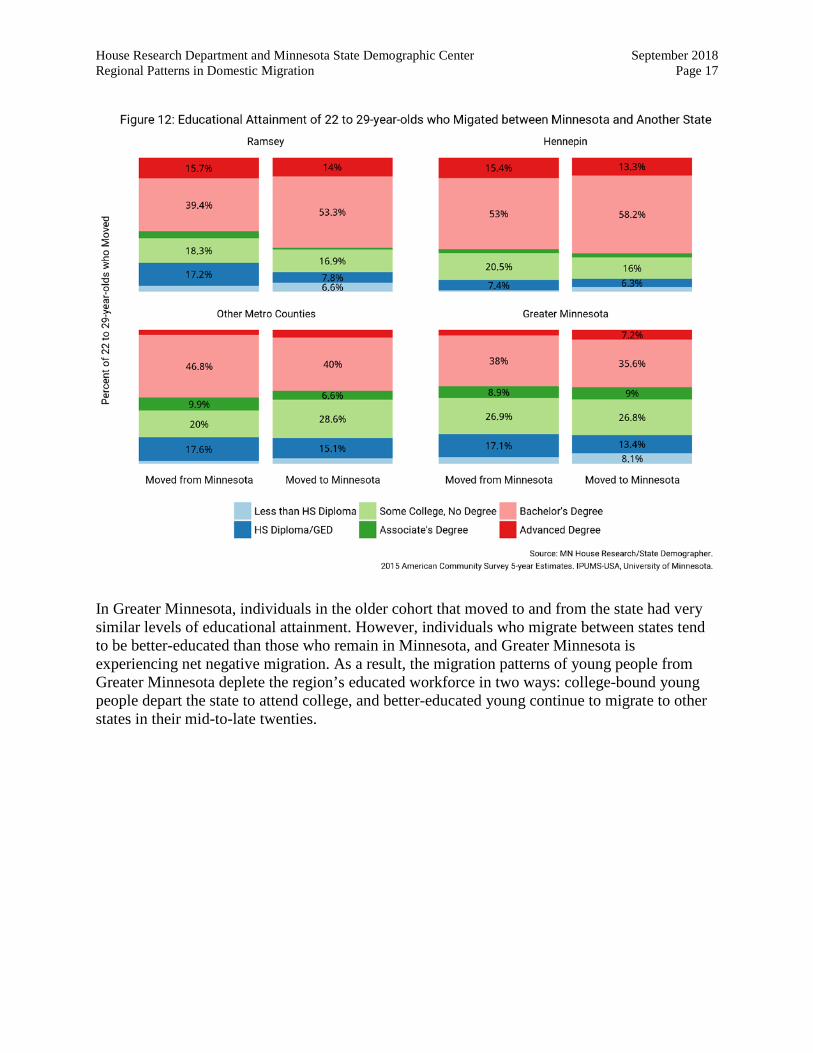
The data presented above indicate that migration patterns of young people are strongly tied to higher education. A large number of individuals in the younger cohort moved away from Minnesota, and a significant portion of those individuals were students. If the state is losing significant numbers of young people who are pursuing college degrees, the state’s workforce would benefit if the individuals who move to the state during their twenties were college-educated—or if those educated in Minnesota remained in the state after graduation. Individuals who moved between Minnesota and other states when they were 22 to 29 years old tended to be better educated than the wider population in that age group. Statewide, about 35 percent of individuals in the same age group had a bachelor’s or advanced degree. In each of the four geographic regions we analyzed, individuals who migrated between Minnesota and another state were more likely to have some college or greater educational attainment. This trend was true of both individuals moving to Minnesota and from the state. In three of the four regions we analyzed, the individuals migrating to the state from another state were at least as well-educated as those migrating away from the state. Figure 12 shows the educational attainment patterns for each region. Ramsey County and Hennepin County were responsible for a significant share of the state’s positive net migration of 22- to 29-year-olds, and the individuals migrating to those counties were as well or better educated than the individuals departing for other states. In Ramsey County, about 67 percent of those who moved to the county had a bachelor’s or advanced degree, compared with about 55 percent of those who departed for another state. For Hennepin County, about 72 percent had that level of educational attainment, compared with 68 percent of those who departed. The difference in Hennepin County was small enough that it may have been due to sampling error, but the data implied the population migrating to the county had similar education levels to the population leaving it. Moreover, given that the county attracted more residents from other states than it lost, state-to-state migration likely added to the county’s college-educated workforce. Overall, the results in Hennepin and Ramsey counties show that the same regions of Minnesota that were attracting 22- to 29-year-olds from other states were succeeding in attracting well-educated 22- to 29-year-olds. In the Other Metro Counties region, the individuals who moved to another state were about as well-educated—or slightly less well-educated—than those who moved to the region. About 45 percent of individuals who moved from the region to another state had a bachelor’s or advanced degree, compared with about 50 percent of those who moved to the region—a difference that may simply be the result of sampling error. Interestingly, those who moved to the region were more likely than those who moved away from the region to have some college education but no degree.
House Research Department and Minnesota State Demographic Center September 2018 Regional Patterns in Domestic Migration Page 17
In Greater Minnesota, individuals in the older cohort that moved to and from the state had very similar levels of educational attainment. However, individuals who migrate between states tend to be better-educated than those who remain in Minnesota, and Greater Minnesota is experiencing net negative migration. As a result, the migration patterns of young people from Greater Minnesota deplete the region’s educated workforce in two ways: college-bound young people depart the state to attend college, and better-educated young continue to migrate to other states in their mid-to-late twenties.

House Research Department and Minnesota State Demographic Center September 2018 Regional Patterns in Domestic Migration Page 18
Destinations of Those Who Moved To the extent that Minnesota is competing with other states for educated workers, policymakers may wish to better understand which states young Minnesotans are departing for, as well as the states from which Minnesota is attracting young people. Figure 13 shows those trends.
Destinations and Sources of 18- to 21-year-olds
The most obvious takeaway is that young people tend to migrate between Minnesota and adjacent states, and they tend to move to and from states with large populations. Among the younger cohort, the top destination for young people from all four regions is Wisconsin. In all four regions we analyzed, there were high rates of migration to and from larger states such as Illinois, New York, and California. This is consistent with the “gravity model of migration,” which holds that the rates of migration between two regions is positively correlated with the population of the origin and destination regions, and negatively correlated with the distance between them.

House Research Department and Minnesota State Demographic Center September 2018 Regional Patterns in Domestic Migration Page 19
In addition to the gravity model of migration, another potential reason for this pattern is Minnesota’s policy of tuition reciprocity with Wisconsin, which permits young people to pay in-state tuition rates at public higher education institutions in Wisconsin. The Minnesota Office of Higher Education (OHE) reported that in the fall of 2015, 13,837 Minnesotans benefited from in-state tuition in Wisconsin, while about 8,300 Wisconsinites received in-state tuition in Minnesota.6 North and South Dakota, both of which also have tuition reciprocity with Minnesota, were common destinations in Hennepin County, Ramsey County, and Greater Minnesota. OHE additionally reported that on net, 6,915 Minnesotans left for North Dakota and 2,208 Minnesotans departed for South Dakota.7
Tuition reciprocity may have also played a role in attracting 18- to 21-year-olds to Minnesota from other states. In each region analyzed, North Dakota and Wisconsin were the top two sources of individuals who migrated to Minnesota, and South Dakota was a common destination for residents of Greater Minnesota. Mirroring the pattern observed with out-migration, young people moved to Minnesota tended to arrive from neighboring states such as Iowa, and large state such as California, Illinois, and Texas.
Destinations and Sources of 22- to 29-year-olds
The top destinations and sources for the older cohort were also consistent with the gravity model of migration—the states with the highest rates of migration were large and geographically proximate. The most common origins for 22- to 29-year-olds who moved to Minnesota were Wisconsin and North Dakota. California was in the top five for all four regions, and Illinois was in the top five for all regions other than Greater Minnesota, where it ranked eighth. Texas was a common origin for those who moved to Hennepin County and Greater Minnesota.
6 Minnesota Office of Higher Education, Minnesota Tuition Reciprocity: 2017 Annual Report, February 2017. https://www.ohe.state.mn.us/pdf/ReciprocityDataOverview2017.pdf.
7 Ibid.

House Research Department and Minnesota State Demographic Center September 2018 Regional Patterns in Domestic Migration Page 20
There was a similar pattern—migration to neighboring states and large states—for 22 to 29-year-olds who left Minnesota for another state. The most common destination for residents of all four regions was Wisconsin. North Dakota was the second-most common destination for Minnesotans departing Hennepin County and Greater Minnesota, and was the fifth most common destination for residents of the Other Metro Counties region. Iowa was a top-five destination for all four regions. California was a very common destination for residents of Ramsey County and the Other Metro Counties, and Illinois was a common destination for residents of Ramsey and Hennepin Counties.
Conclusion Policymakers in Minnesota have expressed concern about the fact that the state has suffered a net loss of residents to other states. This publication demonstrates that the state’s domestic migration trends vary greatly in different regions in the state, as well as among different age cohorts. To the extent that policymakers wish to respond to these trends—and offset the net loss of population to other states—their policy responses will be most effective if they are appropriately targeted to the specifics of the state’s migration patterns.

House Research Department and Minnesota State Demographic Center September 2018 Regional Patterns in Domestic Migration Page 21
Policies that aim to reverse the trends detailed in this report could focus on a number of opportunities to shape the future of the state’s migration growth, including limiting outflow of college-aged individuals—particularly from the Other Metro Counties region and Greater Minnesota—and increasing the inflow of college-aged residents from “sending” states to Minnesota. Policies that increase the retention of those who moved to Minnesota for college may also hold promise. Because migration rates of people older than 30 decline, there is a good chance that people who move to Minnesota in their late twenties will remain in the state. The research shows that young people are willing to move to Minnesota, even if they are not born here, and those who move to the state tend to be better educated than the state’s population as a whole. Additionally, the higher education levels of migrants implies that the state’s response to these trends will matter a great deal to Minnesota’s economic future. More educated workers tend to be more economically productive, meaning there will be greater economic benefits from attracting them, and greater economic costs to losing them.
The range of public policies that may influence the migration behavior of young adults, of course, is exceedingly wide. They include policies that shape many different dimensions of the quality of life in Minnesota—its livability and affordability, as well as its economic and educational opportunities. In the coming years, the migration of young adults in the context of these opportunities will matter a great deal to the state’s economic outcomes.
For more information about population, visit the demographics area of the House Research website (www.house.mn/hrd/) and the website of the State Demographic Center (https://mn.gov/admin/demography/).
About “A Changing Minnesota” series: This is an occasional series of joint publications between House Research and the State Demographic Center on demography and a changing Minnesota. The goal of this series is to meld data on Minnesota as a changing polity with an overview of statutes and public policies that are affected by those changes. If you have comments on this piece, or on the concept of such a series, please contact Colbey Sullivan at [email protected].