Embed Size (px)
Citation preview

1
Regional trade integration and trade facilitation as a pro-industrialization policy tool: the
case of North Africa’s countries
By Simon Mevel*, Jaime Moll de Alba** and Nassim Oulmane*
Introduction
The economic emergence of North African countries1 (NACs) requires the significant transformation
of their economies and raises the question about the process guiding their structural change. Despite
their different level of diversification, the economic performance of most countries in the North
African region remains dependent on either commodity prices or weather conditions. North African
economies are, in general, poorly diversified and specialized in a handful of sectors or non-dynamic
products with low added value. The high levels of unemployment, particularly among youth, call for
the urgent creation of several million jobs in the region in the coming future. Only a significant
increase in economic growth can help meet this pressing challenge. Such an increase, often times
called ‘explosive growth’ has been experienced in the past through structural change in either
industries or services. The growing participation in international trade, namely through manufactured
exports increasingly diverse and sophisticated has constituted a prominent engine guiding the
structural transformation of successful developing countries.
The North African countries began to diversify their structures in the 60s and 70s through state-led
import substitution strategies (Morocco, Tunisia) or heavy industrialization strategies (Algeria,
Egypt). The diversification of their economies continued at different paces under the structural change
period of the 80s and 90s. As a result the economic structures of most countries in the region have
changed between the mid-80s and 2007 as proven by larger shares of industry and services in their
economies. Such a change is confirmed by an increase in diversification indices (Ben Hammouda and
ali. 2009), particularly in Egypt, Tunisia and Morocco (to a lesser extent). The share of these countries
on the global market of manufactured goods has remained, however, marginal. Their share remained
slightly above 1% between 1975 and 2008 by whereas East Asia increased from 1.7 to 20%.
The apparent paradox between the level of diversification and the international integration of the
NACs is explained by several factors: on the one hand, by their relatively weak pace of diversification
compared to the rest of the world and, on the other hand, by their focus not necessarily on the most
dynamic world’s products with limited growth of Manufacturing Value Added (MVA). Moreover, the
North Africa’s regional market has witnessed increasing competition of newcomers such as China,
India, and Turkey. All the above has resulted in the current limited integration of these countries into
global value chains (GVCs) which account for a significant share of global MVA.
Since 2008 (Moll de Alba, 2014), North Africa’s MVA growth rates have declined, like in almost all
world regions, partly as a consequence of the overall economic downturn. Alarmingly, North Africa
recorded the second lowest MVA growth rate of all African regions in 2008-2012. Despite leading in
terms of MVA per capita among African regions, North Africa’s level falls far behind that of the most
* United Nations Economic Commission for Africa (UNECA), [email protected] [email protected] ** United Nations Industrial Development Organization (UNIDO) [email protected] 1 In this paper NACs is made up of Algeria, Egypt, Libya, Morocco, Tunisia and Sudan. However in the
simulations Sudan is not comprised in rest of North Africa.

2
dynamic regions of the world. Moreover, the gap increased during 2008-2012 due to the stagnant
MVA per capita growth rate experienced by the region.
Manufacturing plays a modest role in North Africa’s economy, and it is comparatively less important
than in the most dynamic developing regions and has failed to expand during the last decades.
Deindustrialization thus remains a reality in the North Africa region, where MVA accounts for barely
one-tenth of its GDP, and the growth of its manufacturing sector lags behind that of its overall
economy. The region has failed to spur industrial development and hence to realize significant
advances in terms of structural change.
The experience of developed countries, as well as that of emerging countries, particularly in Asia,
shows that it is through deep structural transformation of the economy that these countries have
managed to achieve real development (UNIDO 2009). Similarly, research (Imbs and Wacziarg 2003)
shows that the transition from low- to middle-income countries takes place through the development
of a strong and diversified economy and with the state playing a role in this process. For such
economies as NACs where minerals and hydrocarbons are predominant structural change should take
place through the acceleration of the pace of diversification towards manufactured goods and through
the nature of the process through its reorientation towards more dynamic and efficient technologies.
Indeed, the literature suggests that beyond economic diversification and exports, it is the nature of this
particular diversification and sophistication in the process of production and exports, which constitutes
a lever for the structural shift of these economies (Hausmann et al. 2007). Active policy reforms have
proven to play an important role supporting that process. Trade policy can make significant
contributions, particularly to increase processing to lead to higher value-added. Regional trade
agreements may constitute a key instrument to raise the participation of NACs in global trade. The
positive growth prospects of the African continent may covert the Continental Free Trade Agreement
(CFTA) 2 into a chief opportunity, ex ante, for NACs to expand their manufactured exports based on
the continent’s rapid urbanization and demographic evolution (Ref ERA 2014). This assumption needs
to be assessed to measure to what extent such trade reforms would play a pivotal role in the re-
industrialization of NACs. Beside the CFTA, NACS are embarked in two other major regional
integration processes. The Great Arab Free Trade Area (GAFTA) with the countries of the League of
Arab States (LAS), and the EUROMED process with the European Union.
Given the relative modest size of the NACs economies, and of that of the whole region, a deeper
integration with the African continent, the LAS countries and within the Euromed framework might
strengthen the optimisation of the comparative advantages of the region. However this process will
not conduct to the same pattern of trade with each partner, particularly with regards to manufacturing
exports. The purpose of this paper is to assess different scenarios of regional integration with the main
NACs trade partners and to analyze which kind of regional integration is more pro-industrialization
for NACs, .
The paper is articulated as follows: The first section presents the state of manufacturing production in
NACs and analyzes its recent evolution. Section two describes the methodology and various different
scenarios put forward for the regional trade integration analysis. The third section presents the main
findings of the trade reforms envisaged on the NACs’ trade and income performance. Finally, the
fourth session puts forward a set of policy recommendations.
2 At the 2012 African Union (AU) Summit, African Heads of State and Government endorsed an AU action
plan for “Boosting intra-African trade and establishing the continental free trade area (CFTA)”; it was agreed
that the CFTA which negotiations are expected to be launched at the June 2015 AU Summit would be
tentatively established by 2017.

3
1 State of manufacturing production in North African countries
This section examines the current industrial production growth and structure of North African
countries in comparison to other country groups. It then compares the relative industrial
performance of North Africa with other main regions.
1.1 Industrial production
Manufacturing accounted for only one-fourth of Africa’s industrial structure, on average, for
the period 2008-2012, while mining and utilities made up 61 percent, the largest share of the
overall structure of African industry (Figure 1). The share of mining and utilities in Africa
was more than double that of other regions including Europe, Asia and Latin America, where
manufacturing played the leading role in industry with 59 percent, 58 percent and 51 percent,
respectively.
Source: UNSD (2014a)
Within Africa, variations among regions are significant. On the one hand, mining and utilities
accounted by far for the largest share of industry in Central Africa (81 percent), Western
Africa (79 percent), North Africa (59 percent) and Southern Africa (51 percent). On the other
hand, manufacturing was the leading contributor to industry in Eastern Africa (45 percent);
Southern and North Africa followed in terms of the highest contribution of manufacturing
with one third and one fourth, respectively.
The structure of industry in North Africa also reveals a great deal of divergences between
countries. The contribution of manufacturing to national industrial structure is highest in
Tunisia and Sudan (both at 58 percent), followed by Morocco (52 percent) and Egypt (44
25
5158 59
61
27
2719
1322
1622
0%
10%
20%
30%
40%
50%
60%
70%
80%
90%
100%
Africa Latin America Asia Europe
Figure 1: Structure of Industry -Developing World Regions (2008-2012)
Manufacturing Mining & utilities Construction

4
percent). At the other extreme, mining and utilities play the leading role in Libya with 85
percent and Algeria with 74 percent.
The share of Africa’s population to total world population increased from 14.4 percent to 15.5
percent, growing faster than its share in world MVA which increased moderately to reach
1.50 percent in 2013. The share of Africa’s MVA in total MVA of developing countries which
increased their share in world MVA, declined from 5 percent in 2008 to 4.2 percent in 2013.
During the same period, the share of North Africa’s population in world population grew
from 0.28 to 0.29 percent while its share in world MVA stagnated at 0.53 percent. Developed
countries with a combined population of 17 percent held more than 64.5 percent of global
industrial production in 2013.
In line with the overall trend in Africa, the North Africa region exhibited a significant
slowdown of its already comparatively moderate average MVA growth rate from 4.18 percent
during 2003-2008 to 1.67 percent in 2008-2013 (Table 1). This compares to Western Africa,
which only accounted for 10.66 percent of Africa’s MVA, but managed to increase its average
annual MVA growth rate from 3.67 percent to 5.24 percent during the same period or to
Eastern Africa’s annual MVA growth rate, which remained close to 5 percent but only
accounted for 4.05 percent of Africa’s total MVA. Despite the decline in developing countries
and in China, their average annual growth rates remained at comparatively much higher
levels, i.e. 5.51 percent and 8.37 percent, respectively, during the period 2008-2013.
Table 1: Level and growth of MVA by country group, US$ Constant 2005, in billion
Country group 2008 2009 2010 2011 2012 2013
Average annual
growth rate (in %)
2003-
2008
2008-
2013
World 8,248 7,581 8,299 8,627 8,829 8,980 4.10 1.72
Developed 5,810 5,090 5,595 5,740 5,799 5,793 2.65 -0.06
Developing 2,438 2,491 2,704 2,886 3,030 3,187 8.16 5.51
Central Africa 4 4 4 4 5 5 2.16 3.12
Eastern Africa 4 4 5 5 5 5 5.61 5.06
North Africa 44 45 46 45 47 48 4.18 1.67
Southern Africa 59 54 57 59 61 62 5.30 1.27
Western Africa 11 12 12 13 14 14 3.67 5.24
Africa 122 119 124 126 131 135 4.64 2.00
Caribbean 15 15 17 18 14 14 3.02 -1.50
Central America 178 162 177 185 192 193 2.97 1.59
South America 292 274 296 306 307 312 5.25 1.33
Latin America 486 452 490 509 513 519 4.31 1.34
China 1,059 1,141 1,243 1,364 1,470 1,582 11.47 8.37
Central Asia 10 10 11 12 12 13 4.60 4.83

5
South Asia 199 216 236 244 252 262 9.12 5.66
South East Asia 209 206 225 231 248 262 5.69 4.64
West Asia 80 83 91 96 98 102 9 5
Other Asia & Pacific 3 3 3 3 1 1 1.62 -21.08
Asia 1,560 1,659 1,810 1,949 2,081 2,222 10.07 7.32
Europe 269 261 280 301 305 312 7.20 2.96 Source: UNIDO (2015)
Low and stagnant levels of MVA explain Africa’s low level of MVA per capita at constant
2005 US$ 130 in 2013 (Table 2). This is 36 times less than that of developed countries and
more than 4 times less than developing countries’ MVA per capita. Despite the North Africa
region recording the highest MVA per capita among Africa’s regions in 2013 with US$ 276
(constant 2005 dollars), followed closely by Southern Africa with US$ 213, its MVA per
capita is comparatively lower than that of other country groups, e.g. 17 times lower than that
of developed countries and more than four times lower than the MVA per capita of Central
America. Previous research by UNIDO indicates that Africa has not benefitted from the
increase of manufacturing production and exports recorded by developing countries since
2000 (UNIDO, 2009). Moreover, during the period 1990-2010, the Middle East and North
Africa only managed to achieve a small increase in MVA per capita, with the exception of
Turkey, with no sign of diversification, i.e. the region remains dependent on oil (UNIDO,
2013a).
Table 2: Level and growth of MVA per capita by country group, US$ Constant 2005
Country group 2008 2009 2010 2011 2012 2013 Average annual growth rate (in %)
2003-2008 2008-2013
World 1,233 1,121 1,213 1,247 1,275 1,284 2.89 0.81
Developed 4,863 4,232 4,625 4,719 4,748 4,738 2.00 -0.52
Developing 444 448 480 506 531 552 6.77 4.47
Central Africa 104 101 104 105 107 108 -0.28 0.79
Eastern Africa 23 24 25 25 27 28 2.91 3.47
North Africa 274 277 280 266 274 276 2.57 0.20
Southern Africa 224 203 209 212 213 213 2.93 -1.01
Western Africa 39 40 40 41 42 44 1.05 2.56
Africa 131 125 128 126 130 130 2.25 -0.10
Caribbean 422 427 467 484 532 539 2.12 5.04
Central America 1,176 1,054 1,134 1,172 1,200 1,189 1.55 0.21
South America 761 707 754 773 767 772 4.01 0.28
Latin America 850 782 837 862 875 876 3.04 0.60
China 797 855 927 1 012 1 086 1 164 10.88 7.87

6
Central Asia 176 170 187 198 204 210 3.57 3.59
South Asia 125 135 145 147 150 154 7.47 4.16
South East Asia 383 373 403 408 434 455 4.46 3.53
West Asia 404 408 441 456 517 526 7 5
Other Asia & Pacific 101 97 99 100 95 97 0.57 -0.76
Asia 416 438 472 504 539 569 8.83 6.47
Europe 1,120 1,081 1,160 1,245 1,258 1,282 7.03 2.75 Source: UNIDO (2015)
The situation in the North Africa region looks comparatively worse when considering both
its limited industrial fabric and its growing population. MVA per capita increased marginally
by 0.20 percent during 2008-2013 to reach US$ 276 in 2013 compared to a 2.57 percent
growth in 2003-2008 (Table 2). Despite significantly lower levels of MVA per capita,
Western Africa increased its MVA per capita at 2.56 percent during 2008-2013 to reach US$
42 and Eastern Africa recorded an average annual growth rate of 3.47 percent, recording US$
28 in 2013. The marginal increase of US$ 2 in North Africa’s MVA per capita compares to
an increase of nearly US$ 108 during the period 2008-2013 in developing countries, which
reached a value of US$ 552 (constant 2005 dollars) in 2013 or to China, which recorded an
impressive increase of US$ 367, reaching a per capita MVA in 2013 of US$ 1,164.
Despite registering the highest MVA per capita in Africa, the North Africa region not only
continues to lie far behind other world country groups, but the existing gap is also increasing
due to the region’s marginal increase in 2008-2013.
According to their average growth rates for 2003-2013, North Africa would manage to catch
up only one other selected country groups, namely South East Asia in 37 years’ time (Figure
2). None other African region would catch up any of the selected country groups. Moreover,
if North Africa succeeded in increasing its MVA per capita growth rate to 10 percent per
annum, the region could reach the 2013 MVA per capita level of South America within 11
years and China’s within 16 years.
Figure 2: Catching-up of African regions to selected countries or country groups based
on 2013 MVA per capita (2005 constant dollars)

7
Source: Estimations based on UNIDO data (2015)
The aggregate growth rate of the North Africa region masks the differences between
countries. All countries in the region experienced lower average annual MVA growth rates
during 2008-2013 compared to 2003-2008 (Table 3). Egypt, which accounted for more than
42 percent of the region’s MVA in 2013, witnessed a drop in its growth rate from 5.74 percent
to 2.73 percent, while Libya’s MVA, which accounted for less than 3 percent of North
Africa’s total MVA, plummeted in 2008-2013 to a rate of -12.93 percent.
Table 3: Level and growth of MVA by country group, US$ Constant 2005, in million
Country 2008 2009 2010 2011 2012 2013 Average annual
growth rate (in %)
2003-
2008
2008-
2013
Algeria 6,221 6,594 5,676 6,105 6,199 6,285 2.69 0.21
Egypt 17,614 18,34
5
19,32
2
1,914
8
19,68
4
20,15
5
5.74 2.73
Libya 2,653 2,747 2,780 6,39 1,433 1,328 4.62 -12.93
Morocco 9,574 9,636 9,913 10,12
1
10,41
4
10,72
1
2.73 2.29
0
200
400
600
800
1000
1200
2013 2018 2023 2028 2033 2038 2043 2048 2053
MV
A p
er c
apit
a (U
$ 2
00
5 c
on
stan
t)
Year
Central Africa
Eastern Africa
Southern Africa
Western Africa
North Africa
South America
China
South East Asia

8
Sudan 2,068 2,139 2,429 2,336 2,313 2,373 5.22 2.79
Tunisia 5,791 5,598 6,248 6,329 6,593 6,855 3.27 3.43
Source: UNIDO (2015)
Consequently, most of the region’s countries also recorded considerable declines in their
MVA per capita growth rates (Table 4). Tunisia was the only country in the region that
displayed a higher per capita growth rate in 2008-2013, 2.32 percent, than in 2003-2008
reaching the highest value in 2013 in North Africa at US$ 634 (constant 2005 dollars) almost
twice that of Morocco (US$ 326). The latter displays the second highest value in the region
with an MVA per capita that experienced a moderate decline in its growth rate from 1.69
percent in 2003-2008 to 1.27 percent in 2008-2013. Algeria (-1.22 percent) and Libya (-13.91
percent) witnessed a decline in their MVA per capita in 2008-2013 with their respective
values dropping to US$ 170 and US$ 204 (constant 2005 dollars) in 2013, respectively.
Table 4: Level and growth of MVA per capita by country, US$ Constant 2005, in
million
Country 2008 2009 2010 2011 2012 2013 Average annual
growth rate (in
%)
2003-
2008
2008-
2013
Algeria 181 189 160 170 170 170 1.15 -1.22
Egypt 225 230 238 232 234 236 3.83 0.98
Libya 431 439 437 100 222 204 2.46 -13.91
Morocco 306 305 310 314 319 326 1.69 1.27
Sudan 61 61 68 64 62 63 2.58 0.57
Tunisia 565 540 596 597 616 634 2.19 2.32
Source: UNIDO (2015)
Based on the region’s average growth rates for 2003-2013, only one country in the region,
Tunisia, could reach the MVA per capita levels achieved by some selected countries within
40 years. Tunisia could reach the level of South Africa’s MVA per capita level within 18
years and China’s within 28 years (Figure 3). Tunisia would almost catch up with the MVA
per capita level of Turkey within 40 years. At current growth rates, all other North African
countries would fail to catch up with the current MVA per capita levels of other countries.
North African countries need to record significantly higher growth rates to close the gap with
selected countries’ MVA per capita in the coming years.
Figure 3: Catching-up of North African countries to selected countries based on 2013 MVA per
capita (2005 constant dollars)

9
Source: Estimations based on UNIDO data (2015)
The intra-industry structure of manufactured production in African regions is presented in
Figure 4. It is worth noting that sub-Saharan Africa (SSA) and Latin America recorded the
lowest change in their industrial structures. Resource-based (RB) activities continue to
dominate SSA’s industrial structure. SSA failed to follow the pace of the general shift to more
complex industrial activities (UNIDO, 2013b). Moreover, SSA reduced its capacity in 1990-
2010 to capture manufacturing value as shown in the decline by one-third of its share of
medium- and high-tech MVA in total manufacturing (UNIDO, 2013a).
Southern and North Africa, which together accounted for four-fifths of Africa’s MVA in
2012, also had the highest share of medium- and high-technology products in the region at 31
percent and 23 percent, respectively. Medium- and high-tech (MHT) activities are particularly
valuable as they grow faster, especially at medium- and high-income levels, offer enhanced
learning opportunities and spillover effects (UNIDO, 2009). The share of resource-based
activities accounted for nearly half of MVA and remained significant in both Southern (45
percent) and North Africa (46 percent). Low-tech (LT) MVA plays a less significant role in
African manufacturing than one would expect, bearing in mind its development stage.
Africa’s low-tech MVA has recorded a decline, which is associated with the decrease in
textiles production (UNCTAD and UNIDO, 2011).
0
200
400
600
800
1000
1200
1400
1600
1800
2000
2013 2018 2023 2028 2033 2038 2043 2048 2053
MV
A p
er c
apit
a (U
$ 2
00
5 c
on
stan
t)
Year
Algeria
Egypt
Morocco
Libya
Tunisia
China
South Africa
Turkey

10
During 2002-2011, the Middle East and North Africa roughly followed the world trend,
continuously shifting towards more complex products over time. Thus, the share of resource-
based manufacturing dropped to 40.3 percent while MHT activities increased to 32.7 percent
(UNIDO, 2013b).
Northern and Southern Africa, Africa’s two largest industrial regions, also displayed the
highest increases and shares of MHT activities in manufacturing, at 23 percent and 31 percent,
respectively. Overall, despite moderate declines, the share of resource-based activities
remains the largest component in all African regions. Central, Eastern and Western Africa
also displayed high shares of resource-based activities accounting for 76 percent, 64 percent
and 60 percent, respectively.
Source: UNIDO (2014b)
1.2 Relative industrial performance
This section examines North Africa’s relative industrial performance compared to other
selected world regions.
Figure 5 presents the MVA per capita level of selected world regions and their MVA per
capita growth. Using the MVA median growth (2.4 percent) during 2008-2013 and the MVA
per capita median level (US$ 274) in 2013 of selected regions, the graph can be divided into
four zones to illustrate relative performance.
In the top-right quadrant, we find regions such as Europe, South East Asia, the Caribbean and
South America and countries such as China, which recorded an impressive 7.89 percent
7974 76
63 6064
5144 46 47 45 45
7567
60
1922 21
27 3130
3036 31
24 25 25
1320
25
2 4 310 9 6
19 20 2329 30 31
12 12 15
0
10
20
30
40
50
60
70
80
90
100
2001 2006 2011 2001 2006 2011 2001 2006 2011 2001 2006 2011 2001 2006 2011
Central Africa Eastern Africa North Africa Southern Africa Western Africa
Shar
e in
ind
ust
ry v
alu
e-a
dd
ed (
%)
Figure 4: Technological structure of MVA - Regional level
MHT
LT
RB

11
average growth rate with comparatively higher MVA levels and growth rates. The bottom-
right quadrant includes regions such as Central and South America which have also achieved
relatively higher levels of MVA per capita, but are experiencing difficulties in sustaining their
growth. The top-left quadrant includes regions such as South Asia with a relatively lower
manufacturing base but a significant level of growth with a 2008-2013 average MVA per
capita growth rate of 4.16 percent as well as Eastern and Western Africa 3.47 and 2.56 percent
average growth rate, respectively.
Finally, regions with a comparatively less dynamic MVA per capita growth rates from already
relatively low levels are found in the bottom-left quadrant. These include Central Africa with
0.79 percent in 2008-2013. North Africa shows relatively low average growth rates (0.20
percent in 2008-2013) combined with an MVA per capita that falls precisely into the median
of all regions. The relative performance of African regions is comparatively weak; none of
them recorded higher values than the median for the two chosen variables.

12
Source: UNIDO (2015)
Western Africa
Southern Africa
North Africa
Eastern Africa
Central Africa
Other Asia & Pacific
West AsiaSouth East AsiaSouth AsiaCentral Asia
China
Europe
South America Central America
Caribbean
-5
-3
-1
1
3
5
7
9
11
13
15
0 200 400 600 800 1000 1200 1400
Gro
wth
(%
)
Level (US$ constant 2005)
Figure 5: MVA per capita, 5-year average (2008-2013)
Africa
Asia
Europe
2,4
US$ 274

13

14
Figure 6 presents the relative average MVA per capita level of African countries and their
average growth rate. Using the MVA per capita median growth (1.5 percent) during 2008-
2013 and its average level (US$ 45) of selected regions in 2013, the graph can be divided into
four zones to illustrate the relative performance.
In the top-right quadrant, we find countries that recorded comparatively higher MVA levels
and growth rates (relative to other African countries). Only one North African country is
included in this group, namely Tunisia with US$ 592.42 average MVA per capita and 2.32
average growth rate. In this group, the growth rates recorded by Angola at 5.84 percent and
Zimbabwe with 5.76 percent were remarkable, even if their MVA per capita levels were not
among the highest in this quadrant. Seychelles with US$ 896.96 displayed the highest average
MVA per capita in this group coupled with a significant average growth rate of 2.62 percent.
The bottom-right quadrant includes countries that achieved relatively higher levels of MVA
per capita, but experienced difficulties in sustaining their growth. Five North African
countries, namely Morocco, Egypt, Algeria, Sudan and Libya are included in this group, but
they displayed significant differences in terms of the 2008-2013 average MVA per capita
ranging from US$ 313 in Morocco with the highest level in this quadrant, to US$63 in Sudan
with the lowest. Their average growth rates during 2008-2013 varied from 1.27 percent in
Morocco to -1.21 percent in Algeria. The two countries with the highest MVA per capita
levels, namely Mauritius at US$ 944 and South Africa at US$ 909 fall into this quadrant.
Among this group, Swaziland with -4.34 percent recorded the worst growth rate. Libya
belongs to this group as well (albeit not displayed in the figure) with an average growth rate
of -13.90 percent.
The top-left quadrant includes countries with a relatively lower manufacturing base but a
significant level of growth, and includes Ethiopia, Chad, Tanzania and Nigeria. Ethiopia
recorded the highest average growth rate with 6.48 percent during 2008-2013, followed by
Tanzania with 4.91 percent.
Finally, in the bottom-left quadrant, we find countries with a declining MVA per capita from
already relatively low levels, such as Burkina Faso, the Gambia and Burundi.

15
Source: UNIDO (2015)
0.9
Cameroon
C.A.R.
Chad
Congo Gabon
S.T.P.
Burundi
Comoros
Djibouti
Eritrea
Ethiopia
Kenya
Rwanda
Somalia
Uganda
Algeria
Egypt
Sudan
Angola
Botswana
D.R.C.
Lesotho
Madagascar
Malawi
Mozambique
United Republic of Tanzania
Zambia
Zimbabwe
Benin
Burkina Faso
Côte d'Ivoire
Gambia
Ghana
Guinea Guinea-Bissau
LiberiaMali
Mauritania
Niger
Nigeria
Senegal
Sierra Leone
Togo
-10
-8
-6
-4
-2
0
2
4
6
8
10
$- $50 $100 $150 $200 $250 $300
Gro
wth
(%
)
Level (US$ constant 2005)
Figure 6: MVA per capita, 5-year average (2008-2013)
US$46
Mauritius
Namibia Seychelles
South Africa
Swaziland
MoroccoTunisia
$300 $500 $700 $900 $1 100 $1 300
Central AfricaEastern AfricaSouthern AfricaNorth AfricaWestern AfricaMedian
1,5

16
Source: UNIDO (2015)
Africa’s industrial sector remains underdeveloped (Lall, 2005; Bigsten and Söderbom, 2011;
UNIDO, 2010, 2013a, 2013b). Moreover, Africa deindustrialized during 1993-2013 (Table 7).
Its level of industrialization, using the share of MVA in GDP as a proxy, declined from 11.51
percent in 1993 to 9.88 percent in 2013. This accentuates the overall trend experienced in 1950-
2005 when manufacturing industries followed an almost flat trajectory, reaching a share of 11
percent MVA in GDP in 2005, equivalent to that of 1950 (Szirmai, 2012; UNIDO, 2013a). The
share of MVA in GDP declined in all African regions to values ranging from 5.07 percent in
Western Africa to 12.64 in Southern Africa (Table 5). In North Africa, that share slightly
declined to 10.40 percent in 2013. This compares to an increase in developing countries as a
whole where MVA reached 20.84 of GDP in 2013 while South East Asia and China reached
26.95 percent and 32.54 percent, respectively.
Table 5: Share of MVA in GDP
Country/Region 1993 2003 2013
World 15.44 15.90 16.44
Developed 15.12 15.06 14.73
Developing 16.88 19.21 20.84
Central Africa 10.07 10.66 9.32
Eastern Africa 8.42 7.74 7.11
North Africa 10.94 11.09 10.40
Southern Africa 15.01 14.19 12.64
Western Africa 6.55 5.94 5.07
Africa 11.51 11.12 9.88
Caribbean 11.69 11.84 13.62
Central America 16.91 17.53 16.88
South America 17.03 15.50 13.69
Latin America 16.78 16.06 14.72
China 28.54 33.39 32.54
Central Asia 13.81 12.09 9.69
South Asia 13.53 14.38 15.07
South East Asia 23.65 27.37 26.95
West Asia 7.07 8.82 10.52
Other Asia & Pacific 17.30 14.27 7.12
Asia & Pacific 19.29 24.15 25.58
Europe 15.05 15.25 18.14
Source: UNIDO (2015)

17
An additional issue of concern is the fact that Africa’s manufacturing sector grew slower in
general with 2.51 percent than its economy as a whole with 4.32 percent during 2008-2013.
The same applies to the previous period of 2003-2008 despite higher growth rates with 5.83
percent and 7.12 percent, respectively. Even Africa’s post-1995 growth was weak and the lack
of industry on the continent continues to constitute a barrier to its growth prospects and makes
it more difficult to attract industry compared to regions that have already industrialized (Page,
2010). Thus, despite some evident growth in sub-Saharan Africa, the challenge to accelerate
and sustain it remains (Abarche et al., 2008).
Source: UNIDO (2015)
No African region recorded a higher growth rate of its manufacturing sector than of its economy
as a whole either in 2003-2008 or in 2008-2013. The highest manufacturing and economic
growth rates during 2008-2013 were recorded in Western and Eastern Africa. Both belong to
the least industrialized regions in Africa and only accounted for 10.66 percent and 4.05 percent,
respectively, of Africa’s MVA in 2013. Unlike other developing regions, Africa’s economic
growth over the last decades has not resulted in any significant structural change, jeopardizing
the continent’s future sustained growth. This trend has been exacerbated by the decline in
growth rates during 2008-2013. The same applies to North Africa (Figure 7), whose MVA (2.09
percent) grew slower than its GDP (2.64 percent). This can be explained by the fast growing
services sector in the close proximity of the European market and by the fact that the mining
industry remains the main component of industrial activity in a number of economies within
this region.
Our analysis suggests that, to varying degrees, the manufacturing base of the North Africa
region remains comparatively weak and its potential contribution to sustained economic growth
of the region is far from being realized. Moreover, our study suggests that different patterns
exist within the region in terms of the development of the manufacturing sector. The
manufacturing base of two natural resource-rich countries, Algeria and Libya, remains weak
and calls for an urgent diversification of their economies which are almost exclusively
4,32
5,39
6,56
2,64
3,60
7,98
7,12
4,73
9,15
6,39
7,66
7,46
2,51
3,91
6,36
2,09
1,59
6,59
5,83
2,70
7,06
5,25
6,67
4,61
0,00 1,00 2,00 3,00 4,00 5,00 6,00 7,00 8,00 9,00 10,00
Africa
Central Africa
Eastern Africa
North Africa
Southern Africa
Western Africa
Africa
Central Africa
Eastern Africa
North Africa
Southern Africa
Western Africa
20
08
-20
13
20
03
-20
08
Figure 7: Growth of MVA and GDP (%) – Regional level
MVA
GDP

18
dependent on their natural resources, i.e. natural gas and oil. Despite having a relatively larger
manufacturing base, the second group of countries, Tunisia, Egypt and Morocco, have
witnessed a stagnation or decline in the contribution of their manufacturing sector to their
economic growth over the last years due, among other reasons, to the political and social
changes and to their strong dependence on a handful of markets which have suffered a severe
downturn. This has exacerbated the trend of previous years when North Africa’s industrial
sector failed to keep pace with the world’s most dynamic developing regions. With regard to
international trade, North Africa continues to play a minor role at the global level, particularly
in manufactured trade. Primary exports, which are exposed to the volatility of world prices,
continue to lead North Africa’s export structure (Moll De Alba, 2014). The benefits of past
commodity booms and regional economic growth have not been exploited to push forward the
necessary structural transformation of the region. Moreover, North African manufactured
exports are dominated by resource-based and low-technology products and concentrate on a
limited number of products and markets, thereby increasing their vulnerability to external
shocks.
Given these facts, NACs are implementing several reforms to accelerate the diversification of
their economies. Against that context, regional trade agreements (RTAs) may constitute a key
instrument to raise the participation of NACs in global trade. The positive growth prospects of
the African continent may covert the Continental Free Trade Agreement (CFTA) into a chief
opportunity, ex ante, for NACs to expand their manufactured exports based on the continent’s
rapid urbanization and demographic evolution (Ref ERA 2014). This assumption needs to be
assessed to measure to what extent such trade reforms would play a pivotal role in the re-
industrialization of NACs. Beside the CFTA, NACs are embarked in two other major regional
integration processes. The Great Arab Free Trade Area (GAFTA) with the countries of the
League of Arab States (LAS), and the EUROMED process with the European Union.
Given the relative modest size of the NACs economies, and of that of the whole region, a deeper
integration with the continent, the LAS countries and within the Euromed framework might
strengthen the optimisation of the comparative advantages of the region. However this process
will not conduct to the same pattern of trade with each partner, particularly with regards to
manufacturing exports. The purpose of this paper is to assess different scenarios of regional
integration with the main NACs trade partners and to analyze which kind of regional integration
is more pro-industrialization for NACs.
2. Model used and description of trade reforms
2.1 Main model assumptions, data requirements, geographic and sectoral decomposition
This analysis relies on the Modelling International Relationships in Applied General
Equilibrium (MIRAGE) multi-country multi-sector Computable General Equilibrium (CGE)
model, particularly well designed for trade policy analysis. The dynamic version of the model
is utilized with its standard model closure3. The dynamic is recursive implying a succession of
equilibriums being solved sequentially from one year to another. See Annex 1 for a more
detailed description of the model and its main assumptions4. The model relies on the Global
3 See annex 1. 4 See Decreux and Valin (2007) for full description of the model features.

19
Trade Analysis Project (GTAP) database version 8.15 for macroeconomic and bilateral trade
data while the Market Access Map at Harmonized System 6-digit (MAcMap-HS6) database
version 26 is employed for bilateral protection information. MAcMap-HS6 database is updated
with key evolutions to date (such as to reflect the Everything But Arm (EBA) initiative, African
Growth and Opportunity Act (AGOA), enlargement of the European Union to 28 members)
Considering both solver limitations and constraints from the GTAP database in terms of
geographic and sectoral details, simulations are conducted with a total of 14 countries or regions
and 29 sectors.
The focus being on North Africa, all the North African countries available in the GTAP version
8.1 database are preserved. The rest of African countries are aggregated in the 4 remaining
African regions. The main trading partners (i.e. the European Union, the United States China)
are also kept as they are in the database, while all other countries and regions are aggregated
into two groups: Emerging Industrialised Economies (EIE) and rest of the world (see Annex 2).
Regarding the sectoral aggregation, emphasize is put on industrial manufacturing sectors which
are keys for NACs structural transformation. In other words, as much details as possible were
kept for these sectors. In total, 29 sectors were considered which can be decomposed into
Agriculture (1), Food (7), industrial Manufacturing (16), Mining and Energy (3) and service
sectors (2) (see Annex 3).
Following the utmost decision made to tentatively establish a CFTA by 2017, all the scenarios
in this study are fully implemented by 2017. Moreover, while the reforms are assumed to be
effective by 2017, outcomes are given for the year 2020 in order for all variables of the model
to properly adjust to shocks. Unless otherwise indicated, these yearly outcomes are given by
comparison between the scenarios and the reference (or baseline; i.e. without trade reforms)
and either in percent or absolute changes.
2.2 Trade reforms
A clear roadmap for the regional integration process in Africa was initially provided by the
Abuja Treaty, which came into effect in 1994. In line with the Treaty, African Heads of States
and Governments have agreed in January 2012 -by endorsing the African Union Action Plan
for “Boosting Intra-African Trade and the Establishment of a Continental Free Trade Area”- to
set up a CFTA, with 2017 as tentative target. Therefore, a first scenario assumes the removal
of all tariff barriers on goods within the African continent to be effective by 2017. An alternate
reform is to consider a reduction of costs to trade across borders on top of the trade liberalization
entailed by the CFTA, assuming that all countries are implementing the trade facilitation part
of the WTO agreement reached in December 2013, called “the Bali package”. These are
modeled using a database on trade costs associated to time from Minor and Tsigas (2008). The
authors estimated the percentage of exports and imports lost due to a delay of one day in
customs processing and port handling, by country and sector. Decreux and Fontagne (2009)
aggregated, at the GTAP level, data of costs at the barrier from Minor and Tsigas. Applying the
same methodology, trade costs were aggregated for the regions and sectors determined in the
study allowing for calibration of these costs into the model. 25% reductions of these trade costs
5 See Narayanan et al. (2012). 6 See Boumellassa et al. (2009).

20
or “iceberg costs” were then applied, such as customs procedures, port handling and inland
transport in import and export processes are assumed to become more efficient worldwide by
2017, as compared to that in the base year. The assumption is that reforms should lead to
improve productivity (Portugal-Perez and Wilson, 2010) and particularly improve the
competitiveness of manufactures industrial products. Trade Facilitation can boost productivity,
Karingi and Spencer (2011) confirm these result on TFP on 18 African countries and indicate
that trade facilitation can also shape production, catalyzing transition toward more sophisticated
exports and greater future growth.
A second set of scenarios is based on the first one with an additional FTA within the Great Arab
Free Trade Area framework. The implementation of the an-Arab FTA has already started in the
majority of Arab countries. However, in many cases the product coverage is low and the lists
of exclusion for sensitive products are important. In this scenario we assume a total FTA by
2017 without any exclusion. As for the first scenario, we assess an alternative reform that
includes a 25% reduction of costs to trade across borders by 2017
A third set of scenarios is based on the second one to which we add a deep FTA between NACs
and the EU countries. The scenario is an enlargement of the current bilateral Euro-med
agreement, which is focused on manufactured products, to all sectors by 2017, without any
exclusion. As for the previous set of scenarios, an additional reform including a 25% reduction
of costs to trade across borders by 2017 is envisaged.
3. Economic impacts of implemented reforms
3.1 Impact of different scenarios on the exports
3.1.1 With only the CFTA in place:
The implementation of the first scenario will have a significant impact on African countries’
exports that would strongly increase. The North African exports would rise by 2.7% while the
rest of Africa will experience an exports increase of 8.2%.
The impact of the other countries would remain very weak as third countries (i.e. from outside
Africa) would see their exports slightly reduced by maximum 0.2% in the case of the EU.
Increase in Africa’s exports would essentially be the result of a boost in intra-African trade
which would expand (in absolute terms) by nearly USD 70 billion in 2020. North African
exporters would grab as much as 20% of this gain; 52% of which would be just expansion in
intra-North African trade and the rest would be increase in North African countries’ exports to
the rest of Africa (see Annexe 4).
The reverse can be observed in the case of the rest of Africa. With increase in exports towards
themselves significantly larger than towards North Africa in absolute terms, but in relative
terms they would expand their exports more towards North African economies (thanks to larger
increase of exports towards North Africa for Central Africa and Southern Africa).
However, in relative terms (i.e. percentage) all African countries, with the exception of Egypt,
would expand their trade more with African partners outside of North Africa (this would be
particularly evident in the case of Morocco)
21
Third countries would export less to African economies, redirecting some of their trade towards
non-African partners; but in net, as indicated earlier the CFTA reform would be slightly trade
diverting for them
Table 6: Changes in total exports by country/region, following implementation of the
CFTA with or without trade facilitation (TF) reforms, % vs. USD bn, 2020
Source: authors’ calculations based on the MIRAGE model
The improvement of trade facilitation measures (i.e. reduction of costs to trade across borders)
would considerably enhance export gains for Africa; and also stimulate exports for third
countries, thereby reversing the negative effects these economies would feel from the sole
CFTA reform.
Trade expansion would be observed for nearly all bilateral relationships; elsewhere variations
would be less negative than without trade facilitation reforms. It is also important to note that
African countries (both from North Africa and outside) would not only be able to grab
considerable export opportunities within Africa, thanks to the CFTA, but also outside of Africa,
thanks to trade facilitation measures which would improve their competitiveness on foreign
markets (see Annexe 5)
Sectorial analysis: change in trade by main Sector.
As the main change in export following the CFTA implementation concerns trade within the
continent, we focus our analysis on the changes in intra-African trade and intra-North-African
trade by main sectors.
Figure 8: Changes in intra-African trade by main sector, following the implementation of
the CFTA with vs. without trade facilitation reforms, USD billion, 2020
% USD bn % USD bn
China -0.1 -2.0 8.7 257.1
European Union -0.2 -6.2 5.3 158.3
United States -0.1 -1.1 6.2 120.7
North Africa 2.7 8.9 6.3 20.4
Algeria & Libya 1.0 1.8 3.4 5.9
Egypt 3.2 2.7 7.5 6.2
Morocco 6.0 2.1 10.7 3.8
Tunisia 6.8 2.3 13.2 4.4
Rest of Arab League -0.1 -0.5 4.1 35.9
Rest of Africa 8.2 42.4 15.6 80.8
Central Africa 3.2 3.5 7.0 7.5
Western Africa 13.2 21.3 18.1 29.1
Eastern Africa 9.8 9.1 20.8 19.2
Southern Africa 5.4 8.6 15.8 25.0
EIE -0.1 -2.1 8.3 196.0
Rest of the World 0.0 -2.0 6.5 391.8
CFTA CFTA + TF

22
Source: authors’ calculations based on the MIRAGE model
In absolute terms, and following the establishment of the CFTA, intra-African trade would
increase most in industrial products (USD 42.7 billion) bringing positive perspectives for
Africa’s industrialization. The industrial content of intra-African trade would expand further if
trade facilitation measures are improved on top of CFTA (with 61.5% and 64.3% of increase in
intra-African trade found in industrial sectors alone following CFTA and CFTA+TF,
respectively).
These results indicate that: i) the CFTA has a positive bias toward trade of industrial products;
ii) Trade facilitation measures will increase more the trade of industrial products compared to
other categories of products (Figure 8). Indeed, TF measures on top of the CFTA reform will
increase further intra-African trade of industrial product by USD 14 bn ( 21%) while further
increases would be only USD 0.3 bn (1%), USD 1.4 (19%), and USD 3.1(14%) in agriculture,
food and mining & energy, respectively.
Trade of intermediate products within the continent but also with the rest of the world will
increase thanks to trade facilitation reforms and will have an impact on trade of final products.
Trade facilitation measure could have also a significant impact on the insertion in global value
chains, but also in the development of regional value chains across the continent or within North
Africa as according to Portugal-Perez and Wilson (2010) trade facilitation can boost
productivity.
Focusing on solely North African countries exports to all Africa, the above still hold; with
59.0% and 61.4% of increase in North African exports to all Africa found in industrial sectors
alone following CFTA and CFTA+TF, respectively
However, zooming into solely intra-North African trade the positive impact of CFTA and TF
reforms on industrialization would be much more pronounced (with about 68.8% and 69.7% of
increase in intra-African trade found in industrial sectors alone following CFTA and CFTA+TF,
respectively).
At sector level, and although crude and processed oil would represent a significant share
(namely 10%) of the increase in intra-North African trade following CFTA reforms, largest
expansion would be for industrial products such as chemicals, metals, motor vehicles and parts,
as well as machinery equipment; increase in process food would also be significant for
vegetable oils, dairies and other food products (see Figure 9).
-10.0
0.0
10.0
20.0
30.0
40.0
50.0
60.0
CFTA CFTA + TF
Agriculture Food Industry Mining and energy Services

23
Figure 9: Changes in intra-North African trade by sector, following CFTA reforms, with
vs. without TF measures, USD billion, 2020
Source: authors’ calculations based on the MIRAGE model
The adoption of trade facilitation measures would favor most intra-North African trade in
vegetable oils, mining, paper products, chemicals, metals and electronic equipment; intra-trade
in those sectors being increased by at least an additional 25% with the reduction of costs to
trade across borders compared to CFTA without trade facilitation
3.1.2 Scenario 2: If a PanArab FTA is in place on top of the CFTA
The second set of scenarios implies an additional FTA with Arab League countries in top of the
CFTA. Against this context, the significant increase in intra-African trade, thanks to the CFTA,
is complemented by a substantial increase in intra-Arab League trade (i.e. North Africa + the
rest of Arab League) which would expand (in absolute terms) by nearly USD 15 billion in 2020.
Export benefits for North African countries would expand further compared to only having a
CFTA in place. Countries from the rest of the Arab League would pass from a net trade
diversion situation under CFTA alone to net trade creation if a Pan-Arab FTA is established in
parallel to CFTA reform.
The trade diversion for intra-African trade is only very limited (following the fact that some
North African countries tend to export more towards the rest of Arab League at the expense of
exports to African partners-from North Africa as well as the rest of Africa): intra-African trade
would increase by USD 69.5 billion and USD 68.9 billion with CFTA and
CFTA+PanArabFTA, respectively. Third countries’ exports towards the Arab League (North
-0.2
0.0
0.2
0.4
0.6
0.8
1.0
1.2
1.4
Agr
icul
ture
Pro
cess
ed r
ice
Sug
ar
Veg
etab
le o
ils a
nd f
ats
Dai
ry p
rodu
cts
Mea
t pr
oduc
ts
Oth
er f
ood
prod
ucts
Bev
erag
es a
nd t
obac
co
Min
ing
Cru
de a
nd r
efin
ed o
il
Oth
er e
nerg
y
Fis
hing
For
estr
y
Tex
tiles
Wea
ring
appa
rel
Leat
her
prod
ucts
Pap
er p
rodu
cts
Woo
d pr
oduc
ts
Che
mic
als,
rub
ber
and
plas
tics
prod
ucts
Min
eral
pro
duct
s
Iron
and
ste
el
Oth
er m
etal
pro
duct
s
Mot
or v
ehic
ales
and
par
ts
Tra
nspo
rt e
quip
men
t
Ele
ctro
nic
equi
pmen
t
Mac
hine
ry e
quip
men
t
Oth
er m
anuf
actu
re
Tra
nspo
rt s
ervi
ces
Oth
er s
ervi
ces
CFTA CFTA + TF

24
Africa and the rest of the Arab League) would be reduced further (than if only a CFTA is
implemented) but this trade diversion effect for third countries would remain relatively limited
Trade facilitation would considerably expand benefits for all Arab League countries; for other
countries (i.e. outside of Arab League) the benefits from trade facilitation would be nearly
unchanged compared to what was observed under the sole CFTA reform.
Change in North African exports to the rest of Arab league trade by main Sector
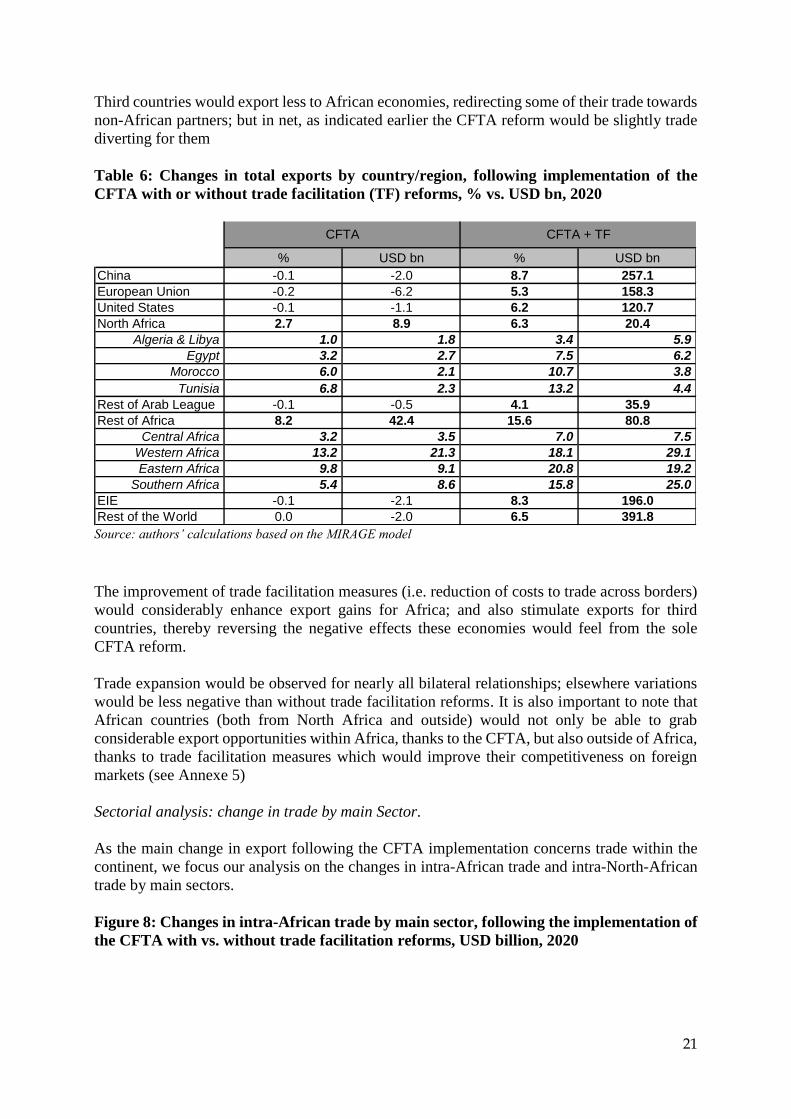
As far as intra-Arab League trade is concerned, a PanArab FTA would also drive industrial
products. However, it is worth noting that if a CFTA stimulates intra-African trade of industrial
products more than for mining/energy and agriculture, a PanArab FTA would stimulates intra-
Arab League trade of mining and energy significantly more than food and agricultural products
and even more than industrial products.
This would be driven by: i) The strong increase of mining and energy exports from North Africa
to the rest of Arab League following PanArab FTA (see Figure 10); ii) A significant increase
in intra-Rest of Arab League trade of mining and energy.
Figure 10: Changes in North African countries’ export to the rest of League Arab, by
main sector, following CFTA and Pan-Arab FTA reforms, with vs. without TF measures,
USD billion, 2020
Source: authors’ calculations based on the MIRAGE model
Looking at intra-North African trade gains, and as indicated earlier, they would be slightly
reduced with the PanArab FTA on top of a CFTA, simply because North African countries
would grab export opportunities towards the rest of the Arab League, thereby increasing less
there exports to the rest of Africa than with only a CFTA.
Yet, this would not undermine the industrialization of intra-North African trade with or without
TF measures (Figure 11).
Figure 11: Changes in intra-North African trade by sector, following CFTA and Pan-
Arab FTA reforms, with vs. without TF reforms, USD billion, 2020
0
0,5
1
1,5
2
2,5
3
3,5
CFTA + PanArabFTA CFTA + PanArabFTA + TF
Agriculture Food
25
Source: authors’ calculations based on the MIRAGE model
Turning to intra-Rest of Arab League FTA trade, industrial products are also the most
stimulated, and the benefits of having a Pan-Arab FTA in place are clear. But benefits for
mining and energy products in intra-trade expansion (as indicated earlier) are also evident; and
it is interesting to note that trade facilitation measures matter tremendously for intra-Arab
League trade of industrial products(as it is the sector making the largest progression with TF in
relative terms and compared to a situation without TF). This result confirms in a more
pronounced way the previous result in the case of the CFTA and TF.
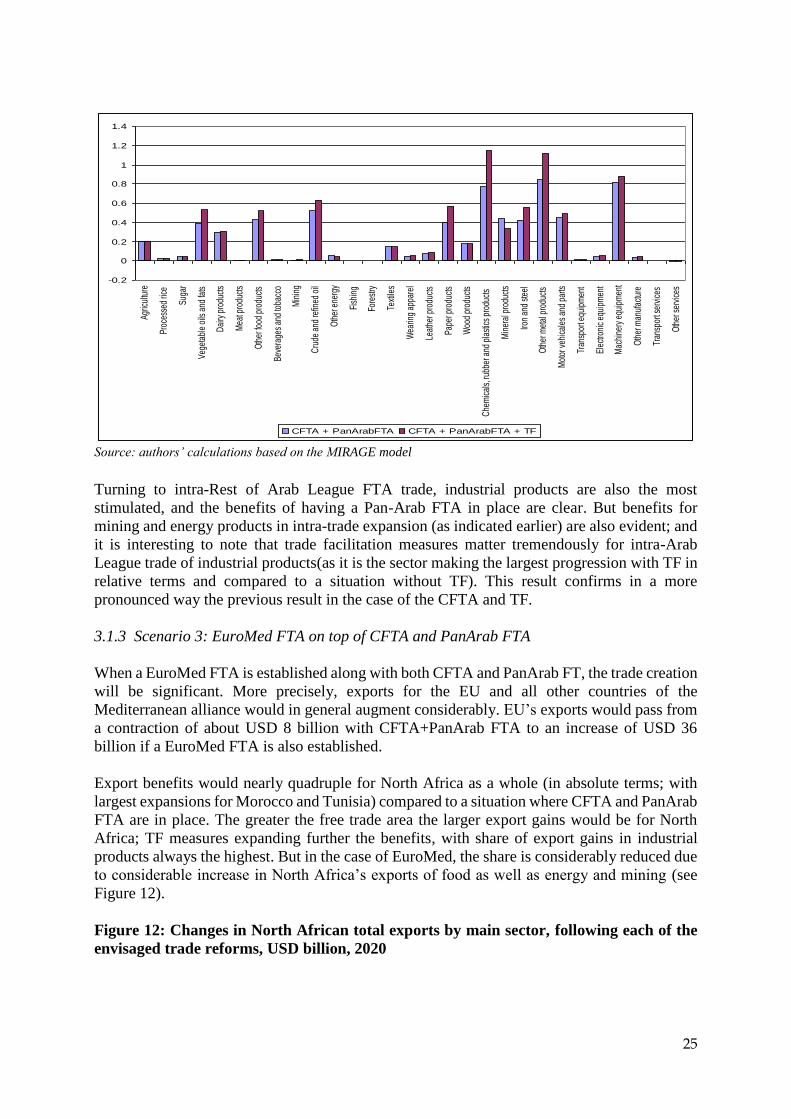
3.1.3 Scenario 3: EuroMed FTA on top of CFTA and PanArab FTA
When a EuroMed FTA is established along with both CFTA and PanArab FT, the trade creation
will be significant. More precisely, exports for the EU and all other countries of the
Mediterranean alliance would in general augment considerably. EU’s exports would pass from
a contraction of about USD 8 billion with CFTA+PanArab FTA to an increase of USD 36
billion if a EuroMed FTA is also established.
Export benefits would nearly quadruple for North Africa as a whole (in absolute terms; with
largest expansions for Morocco and Tunisia) compared to a situation where CFTA and PanArab
FTA are in place. The greater the free trade area the larger export gains would be for North
Africa; TF measures expanding further the benefits, with share of export gains in industrial
products always the highest. But in the case of EuroMed, the share is considerably reduced due
to considerable increase in North Africa’s exports of food as well as energy and mining (see
Figure 12).
Figure 12: Changes in North African total exports by main sector, following each of the
envisaged trade reforms, USD billion, 2020
-0.2
0
0.2
0.4
0.6
0.8
1
1.2
1.4
Agr
icul
ture
Pro
cess
ed ri
ce
Sug
ar
Veg
etab
le o
ils a
nd fa
ts
Dai
ry p
rodu
cts
Mea
t pro
duct
s
Oth
er fo
od p
rodu
cts
Bev
erag
es a
nd to
bacc
o
Min
ing
Cru
de a
nd re
fined
oil
Oth
er e
nerg
y
Fish
ing
Fore
stry
Text
iles
Wea
ring
appa
rel
Leat
her p
rodu
cts
Pap
er p
rodu
cts
Woo
d pr
oduc
ts
Che
mic
als,
rubb
er a
nd p
last
ics
prod
ucts
Min
eral
pro
duct
s
Iron
and
stee
l
Oth
er m
etal
pro
duct
s
Mot
or v
ehic
ales
and
par
ts
Tran
spor
t equ
ipm
ent
Ele
ctro
nic
equi
pmen
t
Mac
hine
ry e
quip
men
t
Oth
er m
anuf
actu
re
Tran
spor
t ser
vice
s
Oth
er s
ervi
ces
CFTA + PanArabFTA CFTA + PanArabFTA + TF

26
Source: authors’ calculations based on the MIRAGE model
The rest of countries part of EuroMed would get relatively more limited expansion in their
exports (in particular countries from the rest of the Arab League) from the benefits already
obtained under CFTA and PanArab FTA.
Given to this size effect, countries outside the EuroMed would see their decline in export
worsening compared to CFTA and PanArab FTA; following increased trade and higher
competition within the EuroMed area.
Table 7: Changes in total exports by country/region, following each of the envisaged trade
reforms, USD billion, 2020
Source: authors’ calculations based on the MIRAGE model
As observed in other scenarios, trade facilitation would play a very positive role on trade of all
countries; expanding gains for EuroMed countries and more than compensate possible trade
diversion for others (see Table 7).
For North African countries it appears that each FTA will stimulate, in relative terms, different
main sectors. Breakdown by destination can help better understand these aspects (see Table 8).
-5,0
0,0
5,0
10,0
15,0
20,0
25,0
30,0
CFTA CFTA + TF CFTA +PanArabFTA
CFTA +PanArabFTA + TF
CFTA +PanArabFTA +EuroMedFTA
CFTA +PanArabFTA +
EuroMedFTA + TF
Agriculture Food Industry Mining and energy Services
CFTA CFTA + TFCFTA +
PanArabFTA
CFTA +
PanArabFTA + TF
CFTA +
PanArabFTA +
EuroMedFTA
CFTA +
PanArabFTA +
EuroMedFTA + TF
China -2.0 257.1 -2.7 256.3 -4.8 254.0
European Union -6.2 158.3 -8.1 156.2 36.0 202.6
United States -1.1 120.7 -1.4 120.3 -3.3 118.4
North Africa 8.9 20.4 12.7 24.5 49.2 62.2
Algeria & Libya 1.8 5.9 2.4 6.6 7.2 11.7
Egypt 2.7 6.2 4.9 8.7 12.7 16.7
Morocco 2.1 3.8 2.8 4.5 15.5 17.7
Tunisia 2.3 4.4 2.6 4.8 13.8 16.3
Rest of Arab League -0.5 35.9 11.2 48.5 12.3 49.5
Rest of Africa 42.4 80.8 42.6 81.1 42.3 80.7
Central Africa 3.5 7.5 3.5 7.5 3.4 7.4
Western Africa 21.3 29.1 21.3 29.1 21.3 29.2
Eastern Africa 9.1 19.2 9.4 19.6 9.3 19.5
Southern Africa 8.6 25.0 8.5 24.9 8.2 24.7
EIE -2.1 196.0 -3.0 195.1 -2.7 195.5
Rest of the World -2.0 391.8 -3.6 390.1 -5.8 387.7

27
Table 8: Changes in exports from North Africa to main destinations, following each of the
envisaged trade reforms, %, 2020
Source: authors’ calculations based on the MIRAGE model
If industrial products represent the largest shares of North Africa’s export gains towards Africa
(North Africa as well as the rest of Africa), mining and energy dominate North Africa’s export
gains towards the Rest of Arab League; and food dominate NA’s exports to the EU.
3.2 Changes in tariff revenues and real income
Tariff liberalization reforms imply relatively large cut in tariff revenues, especially for North
African countries (Table 9). However this impact is differentiated from a country to another. If
Algeria and Libya are the most negatively affected in the cases of the CFTA and Pan-Arab
FTA, it is for Morocco and Tunisia that the tariff revenue impact is the most negative in the
case of EuroMed. For the entire region, the impact is more than ten times higher in the case
EuroMed is implemented compared to only the CFTA (-58.8% compared to 5.6%); a Pan-Arab
FTA would only double the fiscal impact compared to the sole CFTA reform, with a strong
CFTA CFTA + TFCFTA +
PanArabFTA
CFTA +
PanArabFTA
+ TF
CFTA +
PanArabFTA
+
EuroMedFTA
CFTA +
PanArabFTA
+
EuroMedFTA
+ TF
Agriculture -0.1 0.1 -0.1 0.1 0.6 0.8
Food -0.1 0.0 -0.1 0.0 14.6 15.1
Industry -1.5 1.3 -1.3 1.6 8.2 11.9
Mining and energy -0.6 2.9 -1.2 2.3 3.1 6.8
Services -0.4 0.0 -0.4 0.0 0.6 1.0
Total -2.8 4.3 -3.2 4.0 27.1 35.6
Agriculture 0.2 0.2 0.2 0.2 0.1 0.1
Food 1.2 1.5 1.2 1.4 0.9 1.1
Industry 4.9 5.9 4.7 5.7 2.7 3.4
Mining and energy 0.8 0.9 0.6 0.7 0.2 0.3
Services 0.0 0.0 0.0 0.0 0.0 0.0
Total 7.1 8.5 6.7 8.0 3.9 4.9
Agriculture 0.3 0.3 0.3 0.3 0.3 0.3
Food 2.5 2.6 2.5 2.6 3.2 3.3
Industry 3.2 3.7 3.2 3.7 4.3 4.9
Mining and energy 0.6 0.6 0.6 0.6 0.6 0.6
Services 0.0 0.0 0.0 0.0 0.0 0.0
Total 6.5 7.1 6.5 7.2 8.4 9.1
Agriculture 0.0 0.0 0.0 0.0 0.0 0.0
Food -0.1 0.0 0.3 0.3 0.4 0.5
Industry -0.1 0.5 1.6 2.3 2.3 3.2
Mining and energy -0.1 0.0 3.3 3.3 3.2 3.2
Services 0.0 -0.1 0.0 0.0 0.0 0.0
Total -0.3 0.4 5.2 5.9 6.1 6.9
North Africa's exports to EU
North Africa's exports to North African partners
North Africa's exports to rest of Africa
North Africa's exports to rest of Arab League

28
impact on Morocco. This is consistent with efforts to be engaged as the deeper FTA reform, the
larger the liberalization efforts, and the greater the loss in tariff revenues.
Table 9: Changes in tariff revenues by country/region, following each of the envisaged
trade reforms, %, 2020
Source: authors’ calculations based on the MIRAGE model
The implementation of trade facilitation measures will, however, reduce the relative negative
tariff revenue impact in all scenarios. This is not a surprise as trade facilitation measures
envisaged in the modeling exercise partly aim at improving cross border procedures and thus
making tariff collection more efficient7. This is very pronounced in the case of the sole CFTA
reforms as customs procedures are often less efficient within Africa than between Africa and
the rest of the world.
This negative impact do not have considerable effects on real income which are either only
slightly negative or slightly positive depending on the trade reforms; but the adoption of TF
measures have positive impacts on all countries’ real income and even offsetting the possible
negative effects from liberalization reforms (Table 10).
Table 10: Changes in real income by country/region, following each of the envisaged trade
reforms, %, 2020
7 If trade facilitation measures were to be implemented alone (i.e. without any tariff cut as those implied by regional
integration reforms) then trade would be boosted and tariff revenues increased following improvement of costumes
procedures and tariff revenues collection.
CFTA CFTA + TFCFTA +
PanArabFTA
CFTA +
PanArabFTA +
TF
CFTA +
PanArabFTA +
EuroMedFTA
CFTA +
PanArabFTA +
EuroMedFTA + TF
European Union -0.1 4.8 -0.1 4.7 -1.3 3.4
North Africa -5.6 -3.8 -10.3 -8.9 -58.8 -58.2
Algeria & Libya -11.5 -10.6 -15.5 -15.0 -44.6 -44.2
Egypt -1.8 1.2 -6.5 -4.2 -56.7 -55.1
Morocco -2.6 -1.5 -9.2 -8.2 -71.9 -72.0
Tunisia -1.3 2.5 -5.1 -1.6 -74.7 -74.0
Rest of Arab League -0.1 1.4 -7.5 -6.4 -13.7 -12.6
Rest of Africa -25.3 -21.7 -25.6 -22.0 -26.4 -22.7
Central Africa -31.5 -30.0 -31.5 -30.0 -32.0 -30.6
Western Africa -33.4 -30.6 -33.4 -30.6 -34.5 -31.7
Eastern Africa -29.4 -26.2 -30.5 -27.3 -30.8 -27.7
Southern Africa 7.2 15.4 7.1 15.3 6.4 14.5
% USD bn % USD bn % USD bn % USD bn % USD bn % USD bn
China 0.0 -0.1 0.9 5.5 0.0 -0.1 0.9 5.4 0.0 -0.2 0.9 5.4
European Union 0.0 -0.2 0.9 16.8 0.0 -0.2 0.9 16.8 0.0 0.9 1.0 17.9
United States 0.0 0.0 0.3 5.3 0.0 0.0 0.3 5.3 0.0 0.0 0.3 5.4
North Africa 0.2 0.1 1.1 0.7 0.2 0.1 1.1 0.7 0.5 0.3 1.4 0.9
Algeria & Libya -0.1 0.0 0.5 0.1 -0.2 0.0 0.5 0.1 -0.3 -0.1 0.3 0.1
Egypt 0.3 0.1 1.2 0.3 0.4 0.1 1.3 0.3 1.1 0.3 2.0 0.5
Morocco 0.3 0.0 1.3 0.1 0.0 0.0 1.1 0.1 -0.8 -0.1 0.3 0.0
Tunisia 1.0 0.1 3.0 0.2 0.9 0.0 2.8 0.2 2.7 0.2 4.7 0.3
Rest of Arab League 0.0 0.0 0.8 0.7 0.1 0.1 1.0 0.9 0.0 0.0 0.8 0.8
Rest of Africa 0.5 0.6 2.1 2.5 0.5 0.6 2.1 2.5 0.4 0.5 2.1 2.5
Central Africa 0.0 0.0 0.8 0.1 0.1 0.0 0.8 0.1 0.0 0.0 0.7 0.1
Western Africa 0.6 0.2 2.3 0.9 0.6 0.2 2.3 0.9 0.6 0.2 2.2 0.9
Eastern Africa -0.1 0.0 2.0 0.5 -0.1 0.0 2.0 0.5 -0.1 0.0 1.9 0.5
Southern Africa 0.9 0.4 2.5 1.0 0.9 0.3 2.5 1.0 0.8 0.3 2.4 1.0
EIE 0.0 -0.1 1.0 7.5 0.0 -0.1 1.0 7.5 0.0 -0.2 1.0 7.4
Rest of the World 0.0 0.0 0.8 11.4 0.0 -0.1 0.8 11.4 0.0 -0.1 0.8 11.3
CFTA + TFCFTA
CFTA +
PanArabFTA +
EuroMedFTA + TF
CFTA +
PanArabFTA +
EuroMedFTA
CFTA +
PanArabFTA + TF
CFTA +
PanArabFTA

29
Source: authors’ calculations based on the MIRAGE model
Moreover, it should be highlighted that any possible and relatively limited negative effects on
real incomes of North African economies can potentially be offset through other fiscal reforms
made possible by an increase in trade volume and economic activity following the various
integration policies.
Conclusions and recommandations
During different phases of their economic development, North African countries have
implemented voluntary policies for their structural transformation, without significant success,
particularly when their evolution is compared with East Asian developing countries. During the
last decade, NACs have experienced a stagnation of the contribution of their manufacturing
industries to the GDP and even have faced a kind of deindustrialization during the second part
of this period.
Trade policy can make significant contributions, particularly to increase processing to lead to
higher value-added. Regional trade agreements may constitute a key instrument to raise the
participation of NACs in global trade. The positive growth prospects of the African continent,
related to the rapid urbanisation and growth of the middle class, may covert the Continental
Free Trade Agreement (CFTA) into a serious opportunity for North African economies to
expand their manufactured exports. Given their traditional trade relations with Europe in in a
less extend with the rest of Arab countries, this assumption has been assessed also within the
context of the Great Arab Free Trade Area with the countries of the League of Arab States, and
the EUROMED process with the European Union
In this study, three main scenarios were assessed. In absolute terms, the establishment of the
CFTA, would increase intra-African trade most in industrial products (USD 42.7 bn among
69.5 bn) bringing positive perspectives for Africa’s industrialization. The industrial content of
intra-African trade would expand further if trade facilitation measures are improved on top of
CFTA. Indeed, TF measures on top of the CFTA reform will increase further intra-African trade
of industrial product by USD 14 bn.
When we consider solely intra-North African trade the positive impact of CFTA and TF reforms
on industrialization would be much more pronounced.
A PanArab FTA would also drive industrial products. However, it is worth noting that if a
CFTA stimulates intra-African trade of industrial products more than for mining/energy and
agriculture, a PanArab FTA would stimulates intra-Arab League trade of mining and energy
significantly more than food and agricultural products and even more than industrial products.
In this case also trade facilitation measures matter tremendously trade of industrial products, as
it is the sector making the largest progression with TF in relative terms and compared to a
situation without TF.
When a EuroMed FTA is established along with both CFTA and PanArab FT, the trade creation
will be significant. More precisely, exports for the EU and all other countries of the
Mediterranean alliance would in general augment considerably.

30
Increasing intra-North African trade offering new market opportunities towards other African
partners. However, reduction/elimination of tariff barriers is not costless, generating tariff
revenue losses which can lead to ambiguous real income effects (some countries being hurt
more than other).
For North African countries it appears that each FTA will stimulate, in relative terms, different
main sectors. If industrial products represent the largest shares of North Africa’s export gains
towards Africa (North Africa as well as the rest of Africa), mining and energy dominate North
Africa’s export gains towards the Rest of Arab League; and food dominate NA’s exports to the
EU
The Complementary measures such as trade facilitation are also critical to ensure real income
gains for all North African and more broadly all African economies. These measures help
considerably boosting further intra-regional trade and export industrialization. Of course such
outcomes will only be possible if reforms are fully effective and implemented, prohibiting or
strictly limiting exemptions and sensitive products from trade liberalization efforts, and tackling
the tariff revenue adjustment effort at the country level.
Trade facilitation reforms will have the maximum impact if in parallel an important effort is
made on trade infrastructures highlighting the key importance of financial resources dedicated
to these efforts. Generalizing the creation of common funds and regional development banks to
finance key infrastructure projects and other projects aiming at easing trade across borders as
they often benefit to a large number of countries and facilitate the development of regional
value chains. Against that context the aid for trade projects should be more focused towards the
objective to boosting intra-regional trade.

31
References
Abarche, J., GO, D. S and Page, J (2008), Is Africa at a turning point?, Policy Research Working
Paper 4519, Africa Region, Washington, The World Bank.
AfDB, OECD, UNDP, ECA (2013) African Economic Outlook “Structural Transformation and
Natural Resources” – Regional Edition / Northern Africa, OECD publishing.
African Union Commission (1991), “Treaty Establishing the African Economic Community”.
Ben Hammouda, H., Oulmane, N. and Sadni Jallab, M (2009) "D'une diversification spontanée
à une diversification organisée. Quelles politiques pour diversifier les économies d'Afrique
du Nord ?," Revue économique, Presses de Sciences-Po, vol. 60(1), pages 133-155.
Ben Hammouda, H. and P.N. Osakwe (2006), “Global Trade Models and Economic
PolicyAnalyses: Relevance, Risks, and Repercussions for Africa”, ATPC Work in Progress
No.47,UNECA
Bigsten, A. and Söderbom M. (2011), Industrial Strategies for Economic Recovery and Long-
term Growth in Africa, African Development Review 23:2, pp. 161-171.
Blanchflower, D.G. and A.J. Oswald (2005), “The Wage Curve Reloaded”, Discussion Paper
Series, IZA DP No. 1665.
Bouët, A., B. Dimaranan, H. Valin (2010), “Modeling the Global Trade and Environment
Impactsof Biofuel Policies”, IPFRI Discussion Paper No. 01018.
Boumellassa, H., D. Laborde, C. Mitaritonna (2009), “A Picture of Tariff Protection Across the
World in 2004: MAcMap-HS6, Version 2”, IFPRI Discussion Paper No. 00903.
Decreux, Y., H. Valin (2007), “MIRAGE, Updated Version of the Model for Trade Policy
Analysis:Focus on Agricultural and Dynamics”, CEPII, Working paper No 2007-15.
Decreux, Y., L. Fontagne (2009), “Economic Impact of Potential outcome of the DDA”,
CEPII,Working paper No 2009-01.
Karingi, S., and S. Mevel (2012) “Deepening Regional Integration in Africa: A Computable
General Equilibrium Assessment of the Establishment of a Continental Free Trade Area
followed by a Continental Customs Union”, ATPC working paper, Addis Ababa.
Klinger, Bailey (2009) “Is south–south trade a testing ground for structural transformation?”,
Center for International Development, Harvard University.
Lall, S. (2005) “Is African industry competing?”, Working Paper Number 121, Queen Elizabeth
House, University of Oxford.
Minor, P. and M. Tsigas (2008) “Impact of Better Trade Facilitation in Developing Countries:
Analysis with a New GTAP Database for the Value of Time in Trade”, Research Report
submitted to GTAP 11th Annual Conference, Helsinki, Finland.
32
Moll De Alba, J. (2014) “Industrial development in North African countries – A statistical
profile”, UNIDO Working Paper 03/2014, Vienna.
Narayanan, G., Badri, A. Aguiar and R. McDougall, Eds. 2012. Global Trade, Assistance, and
Production: The GTAP 8 Data Base, Center for Global Trade Analysis, Purdue University.
Page, J. (2011) “Should Africa Industrialize?”, United Nations University, UNU-Wider
Working Paper No.2011/47, Helsinki.
Page, J. (2012) “Can Africa Industrialize?”, Journal of African Economies, Vol. 21, AERC
Supplement 2, pp. ii86–ii125.
Park, S-C. (2002). “Measuring tariff equivalents in cross border trade in services”, KIEP
Working Paper 02-15.
Portugal-Perez, A. and J.S. Wilson (2010) “Export performance and trade facilitation reform :
hard and soft infrastructure” Policy Research Working Paper Series 5261, The World Bank.
Szirmai, A. (2012) “Industrialisation as an engine of growth in developing countries, 1950–
2005”, Structural Change and Economic Dynamics, 3 (4), 406-420.
UNCTAD and UNIDO (2011), Fostering Industrial Development in Africa in the New Global
Environment, Economic Development in Africa Report 2011, United Nations publication,
New York and Geneva.
UNCTAD (2013). Economic Development in Africa Report 2013. Intra-African Trade:
Unlocking African Private Sector Dynamism. United Nations publication.
UNECA, AUC, and AfDB (2010), “Assessing Regional Integration in Africa IV: Enhancing
Intra-African Trade”, United Nations Publication.
UNIDO (2009), Breaking in and Moving up: New Industrial Challenges for the Bottom Billion
and the Middle-income Countries, Industrial Development Report 2009, Vienna, Austria.
UNIDO (2013a), The Industrial Competitiveness of Nations, Looking back, forging ahead,
Competitive Industrial Performance Report 2012/2013, Vienna, Austria.
UNIDO (2013b), Sustaining Employment Growth: The Role of Manufacturing and Structural
Change, Industrial Development Report 2013, Vienna, Austria.
USAID (2007), “Calculating Tariff Equivalents for Time in Trade”.
Warren, T. (2000) “The identification of impediments to trade and investment in
telecommunications services”, in Findlay, C. and Warren, T. (eds) 2000, Impediments to
Trade in Services: Measurement and Policy Implications, Routledge, London and New
York, pp. 71-84.
World Bank (2005) “Global Economic Prospects 2005: Trade, Regionalism and Development”.
World Bank (2012) “Doing Business 2012: Doing Business in a More Transparent World”
33
Annex 1: Key features of the MIRAGE CGE model
On the demand side of the model, a single representative agent in each region is assumed. This
agent devotes a fixed share of its income to savings and the rest is spent towards the
consumption of goods. A Linear Expenditure System–Constant Elasticity of Substitution (LES–
CES) function is used to represent agent’s preferences across sectors. Horizontal (variety) and
vertical (quality) differentiations in goods are made possible by the model, such as goods
produced by developed countries are assumed to be of relatively higher quality than the ones
produced by developing countries (i.e. Armington hypothesis).
On the supply side, the model relies on a Leontief function which assumes perfect
complementarity between value added and intermediate consumption. Unskilled and skilled
labor, capital, land, and natural resources are the five factors of production contributing to the
value added. Skilled labor and capital are supposed to be more substitutable between themselves
than with other factors. Moreover, skilled labor is perfectly mobile between sectors. Unskilled
labor, however, is imperfectly mobile between agricultural and non agricultural sectors but
perfect mobility is assumed among each group of sectors. Demographic forecast provided by
the World Bank8 is used to exogenously set the rates of variations of the labor. Land is
imperfectly mobile between sectors. Natural resources and capital are both sector-specific; with
natural resources being constant and capital accumulative. Investment is the sole adjustment
variable for capital stocks; such as the capital stock for the current year depends on the
investment made for the same year and the capital stock from the previous year which has
depreciated. Additionally, GDP growth is forecasted affecting total factor productivity9.
A full employment of factor endowments is assumed; thanks to flexible wages that maintain
constant the aggregate employment in all regions. While such hypothesis may appear
unsatisfactory -especially in the African context- it is motivated by at least three reasons. First,
unemployment rates for African economies –when available– are not necessarily reliable.
Second, the alternative which suggests assuming fixed nominal or real wages to represent
unemployment in CGE models is not less disputable than the full employment hypothesis.
Indeed, such assumption does not consider the wage determination’s process in developing
countries (see Ben Hammouda and Osakwe, 2006). Third, the full employment assumption is
coherent with the medium to long term effects resulting from shocks analyzed with CGE models
(see Bouët et al. 2010).
The current account of each region is maintained constant and fixed to its initial value to ensure
the macroeconomic closure of the MIRAGE model; any possible disequilibrium of the current
account is to be offset by an adjustment of the real exchange rate. In other words, when trade is
stimulated by a specific reform (e.g. liberalization involving a reduction in tariff barriers) then
the real exchange rates appreciate if exports increase more than the imports or depreciate when
the exports increase less than the imports.
8 See World Development Indicators from the World Bank. 9 See World Bank publication: “Global Economic Prospects 2005: Trade, Regionalism, and Development”.

34
Annex 2: Geographic decomposition determined for the modelling exercise
Annex 3: Sectoral decomposition determined for the modelling exercise
# Country/Region Main region
1 Egypt North Africa
2 Morocco North Africa
3 Tunisia North Africa
4 Rest of North Africa North Africa
5 Central Africa Rest of Africa
6 Western Africa Rest of Africa
7 Eastern Africa Rest of Africa
8 Souhtern Africa Rest of Africa
9 Rest of Arab League Rest of Arab League
10 European Union European Union (28 members)
11 United States United States
12 China China
13 Emerging industrialized Emerging industrialized economies
14 Rest of the world Rest of the world
# Sector Main Sector
1 Agriculture Agriculture
2 Dairy products Processed food
3 Meat products Processed food
4 Vegetable oils and fats Processed food
5 Processed rice Processed food
6 Sugar Processed food
7 Other food products Processed food
8 Beverages and tobacco Processed food
9 Other energy Mining and energy
10 Crude and refined oil Mining and energy
11 Mining Mining and energy
12 Fishing Industry
13 Forestry Industry
14 Textiles Industry
15 Wearing apparel Industry
16 Leather products Industry
17 Wood products Industry
18 Paper products Industry
19 Chemicals, rubber and plastics products Industry
20 Mineral products Industry
21 Iron and steel Industry
22 Other metal products Industry
23 Motor vehicales and parts Industry
24 Transport equipment Industry
25 Electronic equipment Industry
26 Machinery equipment Industry
27 Other manufacture Industry
28 Other services Services
29 Transport services Services

35
Annex 4: Changes in bilateral trade, following the CFTA reforms (without trade facilitation
measures), USD billion, 2020
Source: authors’ calculations based on the MIRAGE model
Ch
ina
Eu
rop
ean
Unio
n
Un
ite
d S
tate
s
No
rth
Afr
ica
Re
st
of
Ara
b L
ea
gu
e
Re
st
of
Afr
ica
EIE
Re
st
of
the
Wo
rld
China 1.1 0.8 -0.2 0.1 -5.5 0.3 1.4
European Union -0.2 0.2 -1.1 0.0 -5.2 -0.1 0.2
United States -0.2 0.0 0.1 0.0 -0.6 -0.2 -0.1
North Africa -0.2 -2.8 -0.3 7.1 -0.3 6.5 -0.5 -0.6
Algeria & Libya 0.0 0.0 0.0 1.2 0.0 0.5 0.0 0.0
Egypt -0.1 -0.9 -0.2 2.4 -0.2 2.3 -0.3 -0.3
Morocco -0.1 -0.5 -0.1 0.2 0.0 2.9 -0.1 -0.1
Tunisia 0.0 -1.4 -0.1 3.3 0.0 0.8 -0.1 -0.2
Rest of Arab League 0.0 0.0 0.2 -0.1 0.0 -1.0 0.2 0.2
Rest of Africa -1.0 -4.5 -2.8 3.8 -0.3 52.0 -2.3 -2.7
Central Africa 0.2 0.3 0.2 0.4 0.0 2.2 0.1 0.1
Western Africa -0.4 -1.2 -1.6 0.7 -0.1 25.3 -1.0 -0.4
Eastern Africa 0.2 0.6 0.1 0.5 0.2 7.2 0.1 0.4
Southern Africa -1.0 -4.1 -1.4 2.3 -0.4 17.3 -1.4 -2.7
EIE 0.0 0.5 0.7 -0.5 0.0 -3.5 0.1 0.5
Rest of the World -1.0 0.0 0.3 -0.2 0.0 -1.0 -0.1 0.0
Importer
Exp
ort
er

36
Annex 5: Changes in bilateral trade, following the CFTA reforms with trade facilitation
measures, USD billion, 2020
Source: authors’ calculations based on the MIRAGE model
Ch
ina
Eu
rop
ean
Unio
n
Un
ite
d S
tate
s
No
rth
Afr
ica
Re
st
of
Ara
b L
ea
gu
e
Re
st
of
Afr
ica
EIE
Re
st
of
the
Wo
rld
China 63.2 41.8 2.2 5.6 4.0 42.6 97.9
European Union 29.0 18.1 3.8 3.3 1.2 37.5 65.3
United States 19.4 17.3 0.4 1.4 0.9 26.9 54.4
North Africa -0.1 4.3 0.4 8.5 0.4 7.1 0.1 -0.1
Algeria & Libya -0.2 2.8 0.5 1.3 0.1 0.5 1.0 -0.1
Egypt 0.1 1.0 -0.1 2.8 0.3 2.7 -0.7 0.1
Morocco 0.0 0.6 0.0 0.3 0.0 3.0 -0.2 0.1
Tunisia 0.0 -0.2 -0.1 4.1 0.0 0.9 -0.1 -0.1
Rest of Arab League 3.1 6.8 -0.2 1.5 9.1 1.3 1.3 13.2
Rest of Africa 2.4 3.8 0.8 4.4 0.3 68.1 -1.1 3.0
Central Africa 1.2 1.5 1.2 0.6 0.1 2.5 0.2 0.3
Western Africa -0.1 1.2 -0.1 0.8 0.0 27.3 -0.7 1.0
Eastern Africa 1.2 2.0 0.4 0.7 0.6 12.1 0.5 1.9
Southern Africa 0.0 -0.9 -0.7 2.5 -0.3 26.1 -1.0 -0.3
EIE 30.6 29.3 33.0 0.8 4.6 1.6 36.5 59.6
Rest of the World 146.4 47.0 50.1 0.6 5.7 2.1 51.6 88.4
Importer
Exp
ort
er