Embed Size (px)
Citation preview
Atlanta Regional Commission, February 2018
For more information, contact:
Regional Snapshot: Metro Atlanta’s
Hispanic and Latino Community
This Photo by Unknown Author is licensed under CC BY-NC-ND

In Summary…
Metro Atlanta is home to an increasing number of international residents. Not only are the counties in metro Atlanta among the most diverse in the southeast, a significant proportion of recent growth has come from those born in different countries,particularly those from Hispanic origins.
Georgia has the fastest growth rate of Latino population in the nation, and the Latino population more than doubled in metro Atlanta last decade. Strong Latino growth is forecasted to continue, especially in the core metro counties.
Lately, the majority of growth in Latino population has come from those born in the United States. In previous decades, immigration (i.e. new arrivals) was the primary driver of growth.
The Latino population is significantly younger than other races/ethnicities. The median age of Latinos is 26, compared to 36 overall and 41 for White, Non-Hispanic.
In the 2017 Metro Atlanta Speaks survey, Hispanic/Latino respondents demonstrated higher levels of overall optimism for the future than did respondents overall (among other key differences).
3
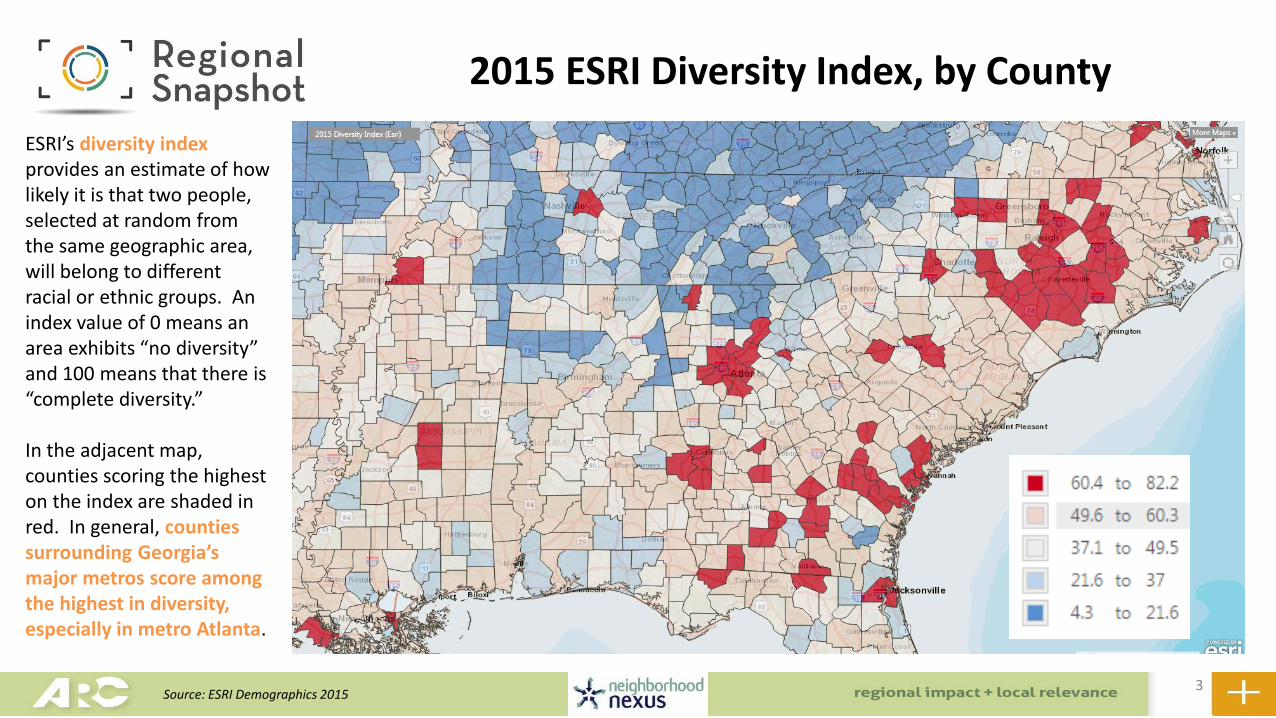
2015 ESRI Diversity Index, by County
ESRI’s diversity index provides an estimate of how likely it is that two people, selected at random from the same geographic area, will belong to different racial or ethnic groups. An index value of 0 means an area exhibits “no diversity” and 100 means that there is “complete diversity.”
In the adjacent map, counties scoring the highest on the index are shaded in red. In general, counties surrounding Georgia’s major metros score among the highest in diversity, especially in metro Atlanta.
Source: ESRI Demographics 2015
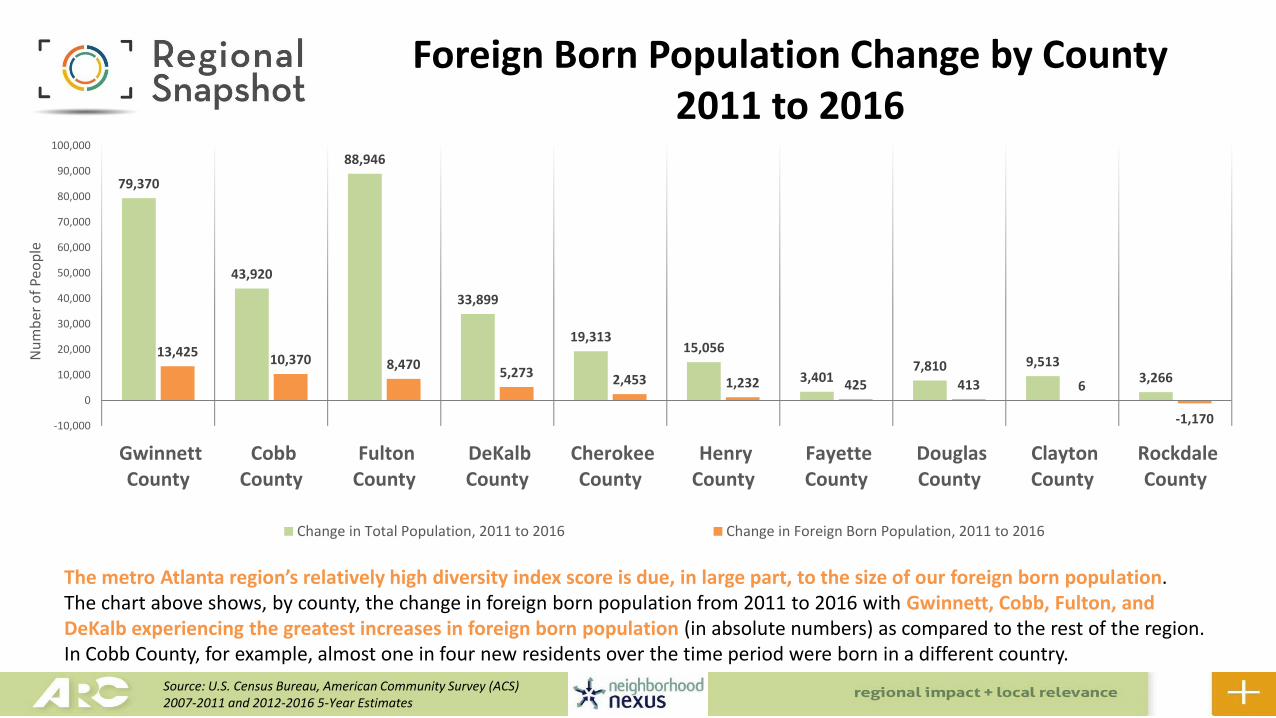
Foreign Born Population Change by County2011 to 2016
Source: U.S. Census Bureau, American Community Survey (ACS)2007-2011 and 2012-2016 5-Year Estimates
The metro Atlanta region’s relatively high diversity index score is due, in large part, to the size of our foreign born population.The chart above shows, by county, the change in foreign born population from 2011 to 2016 with Gwinnett, Cobb, Fulton, and DeKalb experiencing the greatest increases in foreign born population (in absolute numbers) as compared to the rest of the region. In Cobb County, for example, almost one in four new residents over the time period were born in a different country.
79,370
43,920
88,946
33,899
19,31315,056
3,4017,810 9,513
3,266
13,42510,370 8,470
5,273 2,453 1,232 425 413 6
-1,170-10,000
0
10,000
20,000
30,000
40,000
50,000
60,000
70,000
80,000
90,000
100,000
GwinnettCounty
CobbCounty
FultonCounty
DeKalbCounty
CherokeeCounty
HenryCounty
FayetteCounty
DouglasCounty
ClaytonCounty
RockdaleCounty
Nu
mb
er o
f Pe
op
le
Change in Total Population, 2011 to 2016 Change in Foreign Born Population, 2011 to 2016
Americas367,120
Asia233,670
Africa82,414
Europe67,800
Oceania2,503
Foreign Born Population by Region of Birth
Mexico164,267
Other Central America41,279
Other Caribbean36,877
Jamaica32,681
Other South America25,537
El Salvador17,788
Colombia17,431
Canada12,819
Brazil9,170
Cuba8,570
Other Northern America
701
Foreign Born Population from Americas by Country of Birth
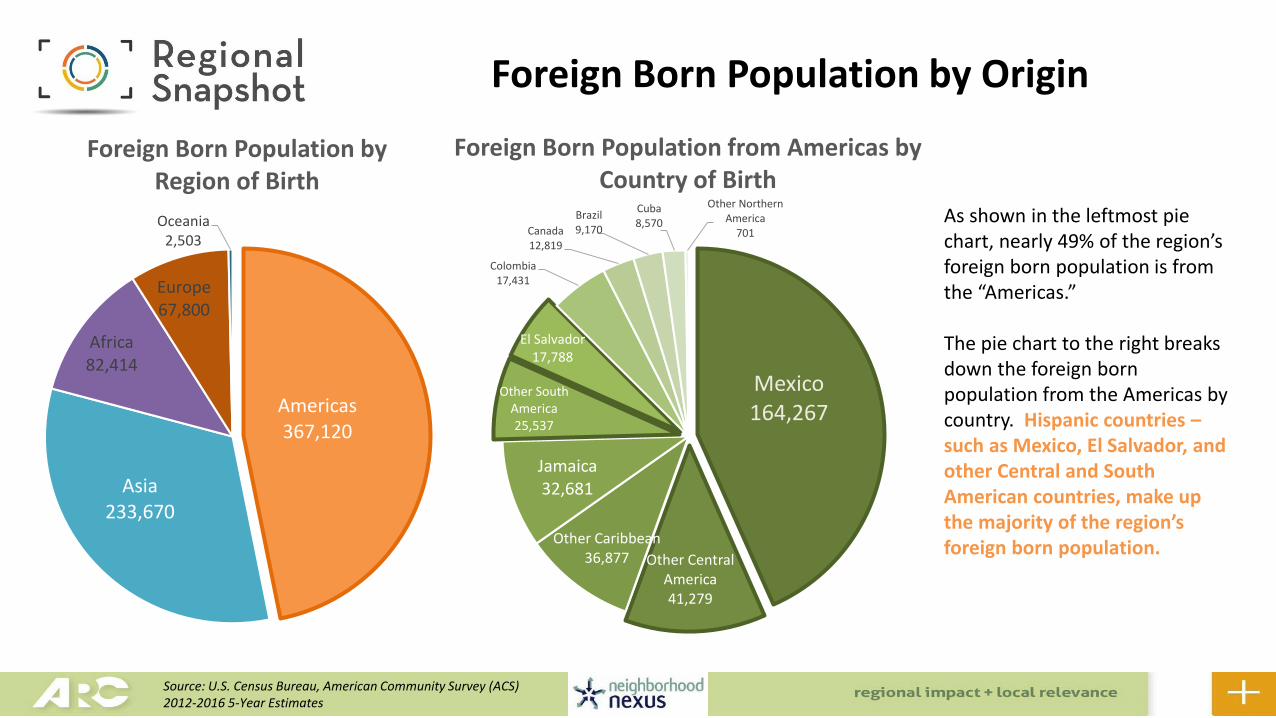
As shown in the leftmost pie chart, nearly 49% of the region’s foreign born population is from the “Americas.”
The pie chart to the right breaks down the foreign born population from the Americas by country. Hispanic countries –such as Mexico, El Salvador, and other Central and South American countries, make up the majority of the region’s foreign born population.
Foreign Born Population by Origin
Source: U.S. Census Bureau, American Community Survey (ACS)2012-2016 5-Year Estimates
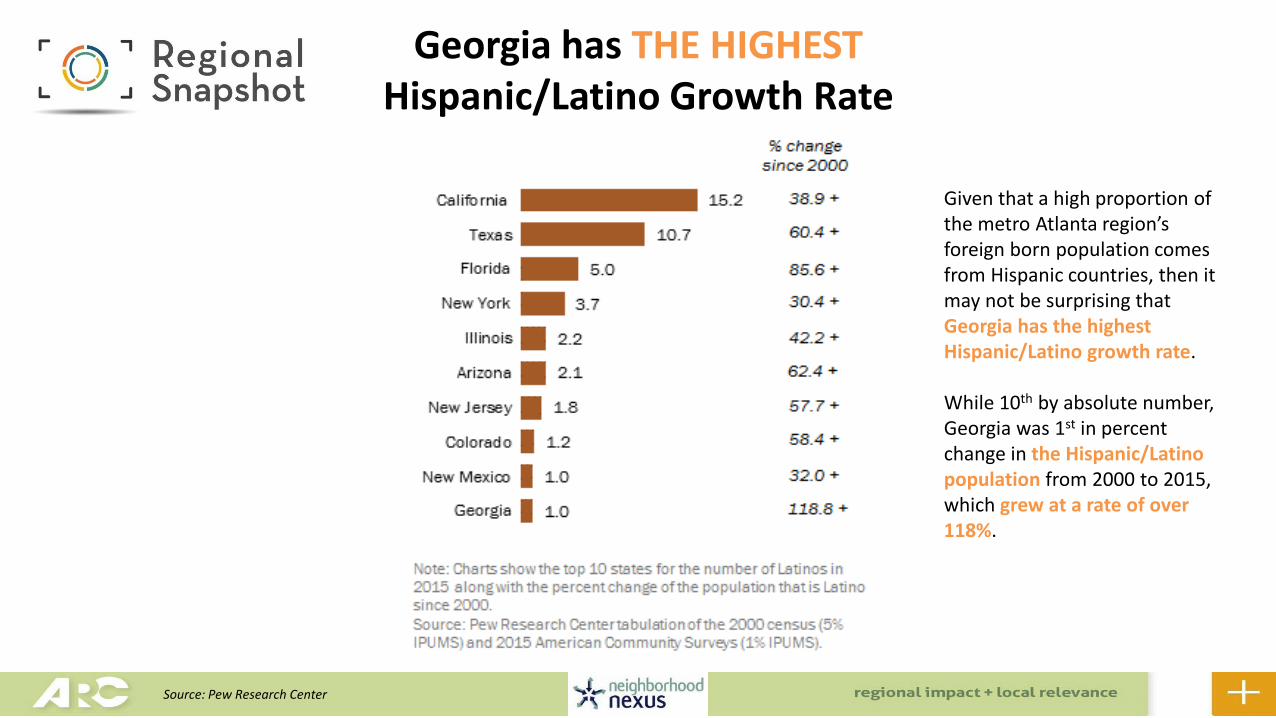
Georgia has THE HIGHEST Hispanic/Latino Growth Rate
Given that a high proportion of the metro Atlanta region’s foreign born population comes from Hispanic countries, then it may not be surprising that Georgia has the highest Hispanic/Latino growth rate.
While 10th by absolute number, Georgia was 1st in percent change in the Hispanic/Latino population from 2000 to 2015, which grew at a rate of over 118%.
Source: Pew Research Center
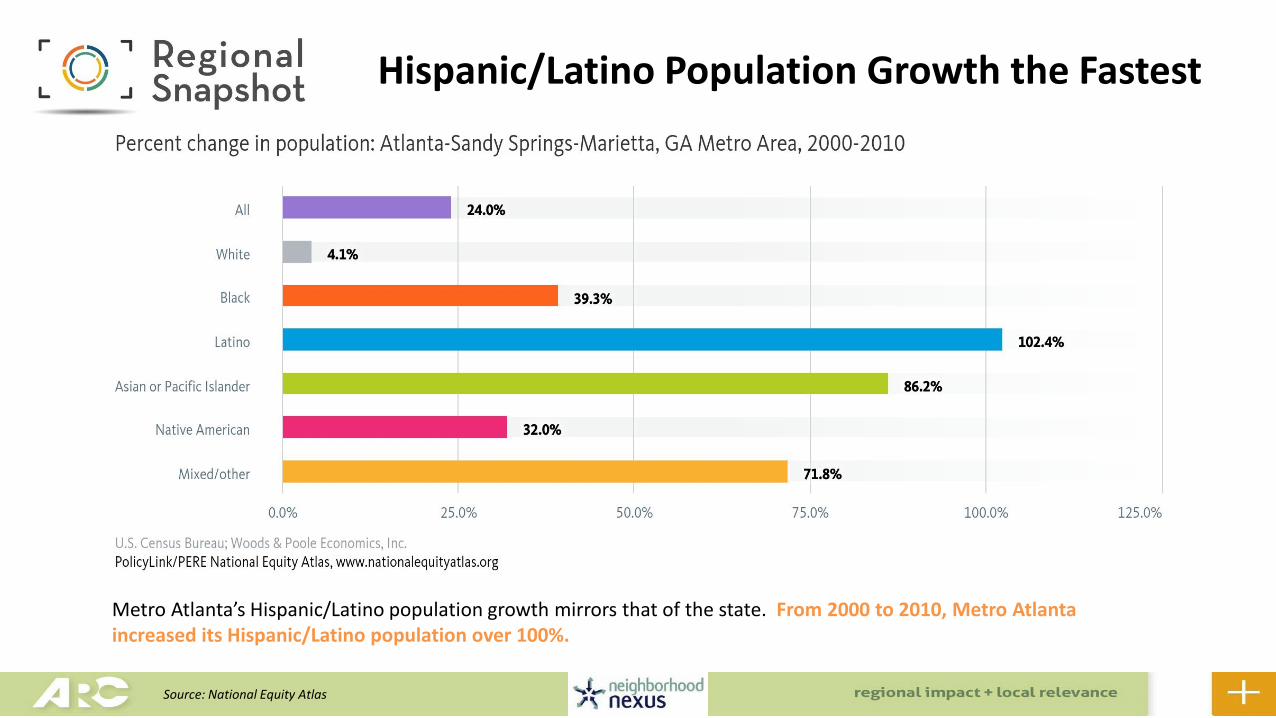
Hispanic/Latino Population Growth the Fastest
Metro Atlanta’s Hispanic/Latino population growth mirrors that of the state. From 2000 to 2010, Metro Atlanta increased its Hispanic/Latino population over 100%.
Source: National Equity Atlas
29.9%
31.9%
37.3%
46.3%
47.0%
47.8%
48.7%
53.3%
62.7%
71.8%
6.5%
19.9%
16.8%
24.6%
15.7%
15.2%
32.7%
16.5%
20.3%
7.0%
15.1%
2.4%
7.3%
10.0%
10.6%
6.0%
5.4%
6.2%
5.6%
7.3%
45.5%
43.9%
36.7%
15.6%
24.3%
28.6%
10.7%
22.1%
9.1%
10.6%
0% 10% 20% 30% 40% 50% 60% 70% 80% 90% 100%
LA
Miami
Houston
Washington
NYC
Dallas
Atlanta
Chicago
Philadelphia
Boston
White Black American Indian/Alaska Native Asian Pacific Islander Other Multiple Races Hispanic (Any Race)
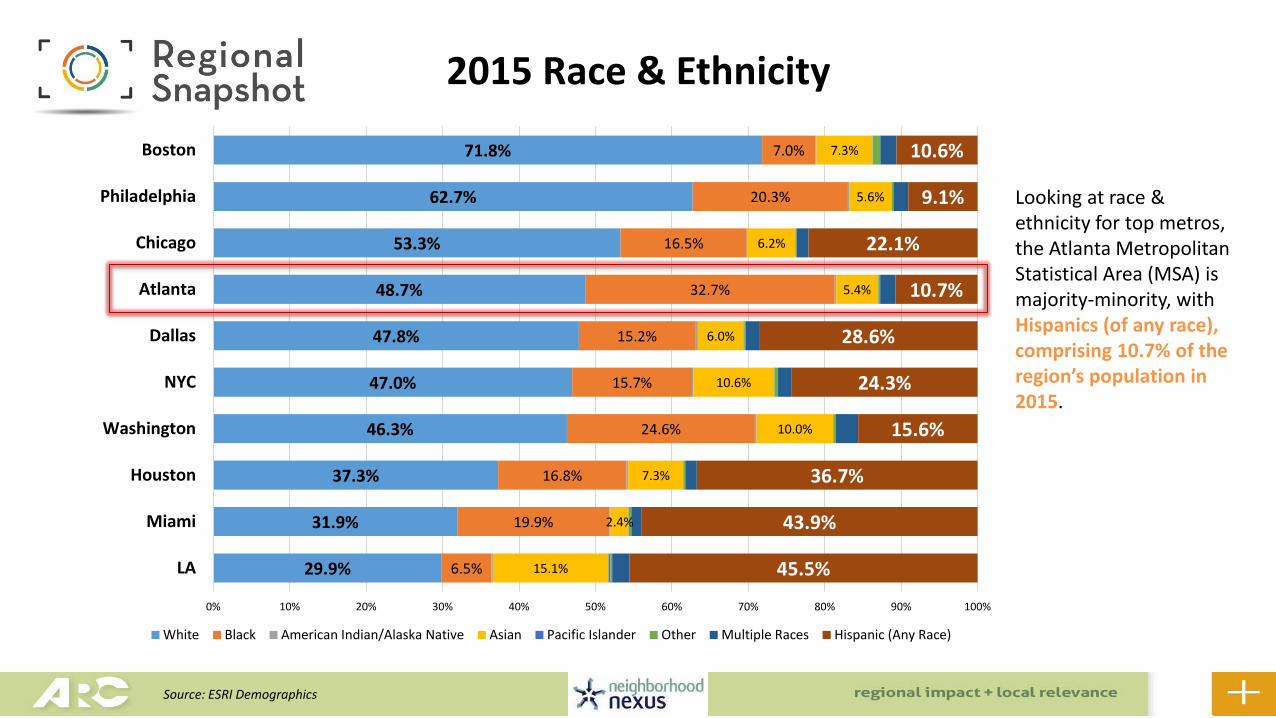
2015 Race & Ethnicity
Looking at race & ethnicity for top metros, the Atlanta Metropolitan Statistical Area (MSA) is majority-minority, with Hispanics (of any race), comprising 10.7% of the region’s population in 2015.
Source: ESRI Demographics
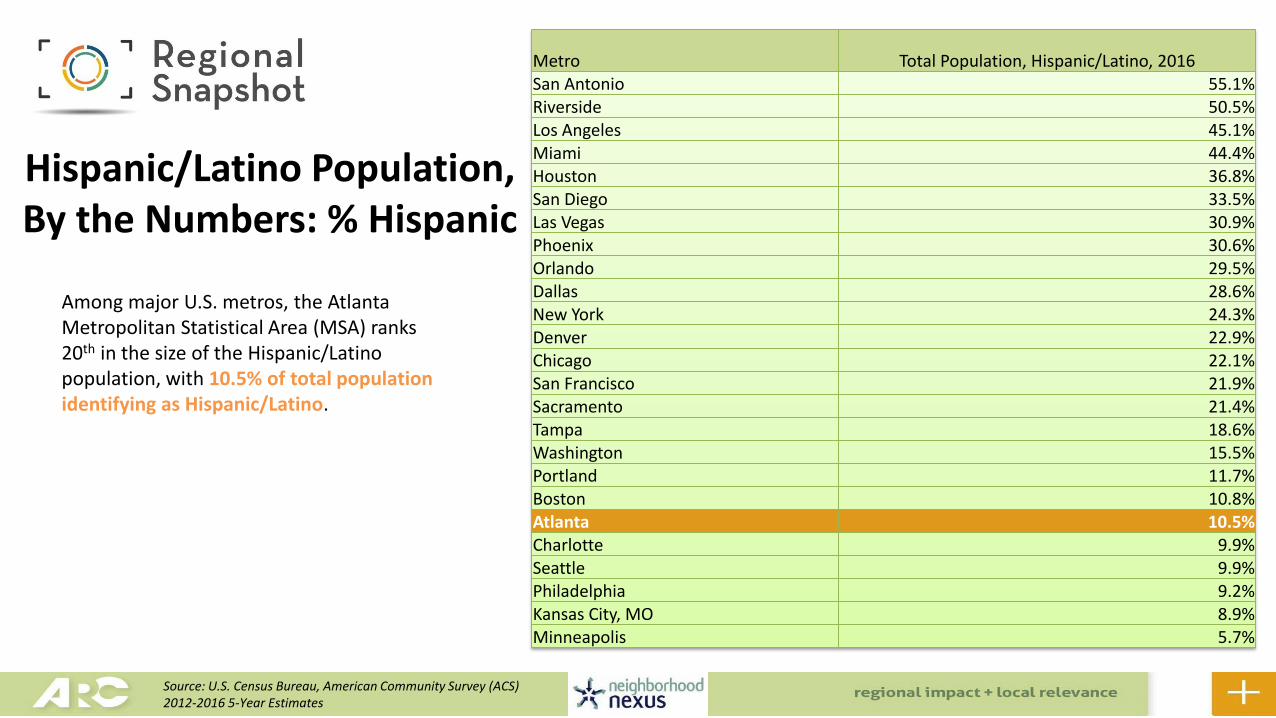
Metro Total Population, Hispanic/Latino, 2016San Antonio 55.1%Riverside 50.5%Los Angeles 45.1%Miami 44.4%Houston 36.8%San Diego 33.5%Las Vegas 30.9%Phoenix 30.6%Orlando 29.5%Dallas 28.6%New York 24.3%Denver 22.9%Chicago 22.1%San Francisco 21.9%Sacramento 21.4%Tampa 18.6%Washington 15.5%Portland 11.7%Boston 10.8%Atlanta 10.5%Charlotte 9.9%Seattle 9.9%Philadelphia 9.2%Kansas City, MO 8.9%Minneapolis 5.7%
Hispanic/Latino Population, By the Numbers: % Hispanic
Among major U.S. metros, the Atlanta Metropolitan Statistical Area (MSA) ranks 20th in the size of the Hispanic/Latino population, with 10.5% of total population identifying as Hispanic/Latino.
Source: U.S. Census Bureau, American Community Survey (ACS)2012-2016 5-Year Estimates

Change in Race & Ethnicity by County (2015-2040)
ARC’s adopted forecasts show continued gains in the Hispanic population through 2040, especially in core metro counties (Clayton, Cobb, DeKalb, Fulton, and Gwinnett). However, it’s not just the metro core that is seeing a boom in its Hispanic population…
Source: ARC Forecasts, series 15
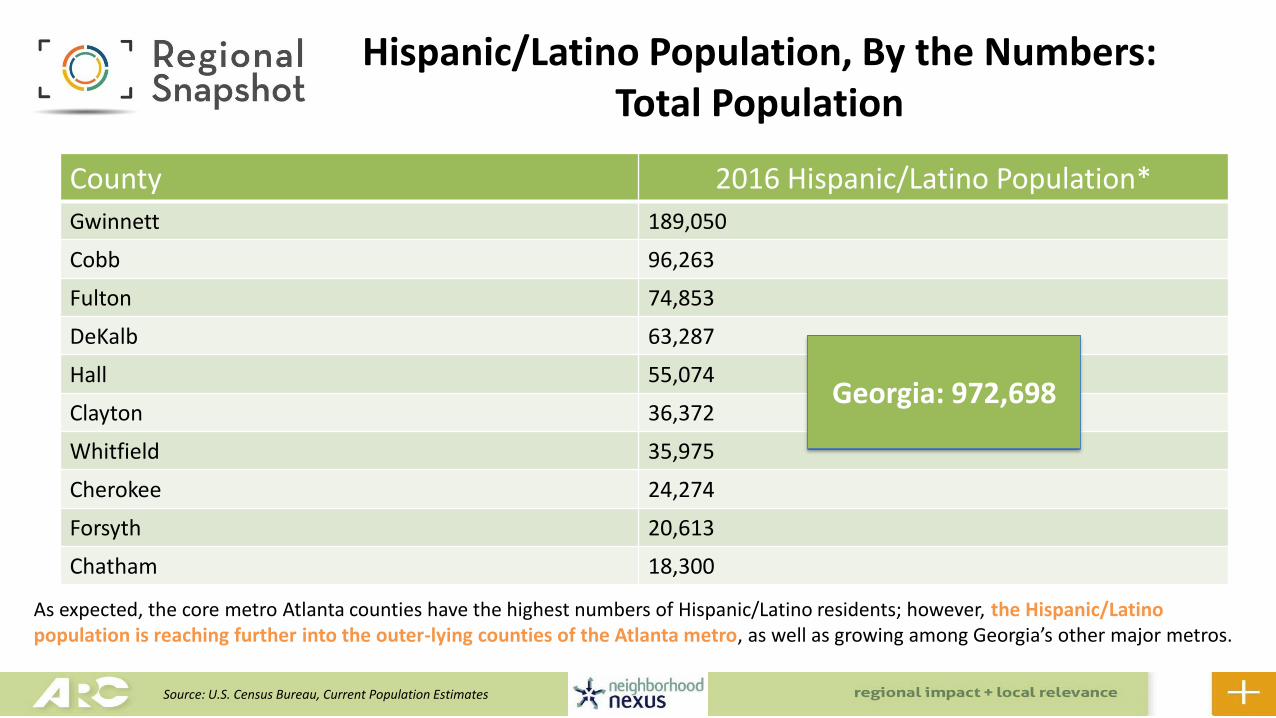
County 2016 Hispanic/Latino Population*
Gwinnett 189,050
Cobb 96,263
Fulton 74,853
DeKalb 63,287
Hall 55,074
Clayton 36,372
Whitfield 35,975
Cherokee 24,274
Forsyth 20,613
Chatham 18,300
Georgia: 972,698
Hispanic/Latino Population, By the Numbers: Total Population
As expected, the core metro Atlanta counties have the highest numbers of Hispanic/Latino residents; however, the Hispanic/Latino population is reaching further into the outer-lying counties of the Atlanta metro, as well as growing among Georgia’s other major metros.
Source: U.S. Census Bureau, Current Population Estimates
County % Change, 2013 – 2016: Hispanic/Latino Population
Stewart 34%
Effingham 33%
Columbia 25.5%
Bryan 23.1%
Madison 22.2%
Barrow 21.5%
Paulding 20.1%
Newton 19.4%
Oconee 18.9%
Walton 18.2%
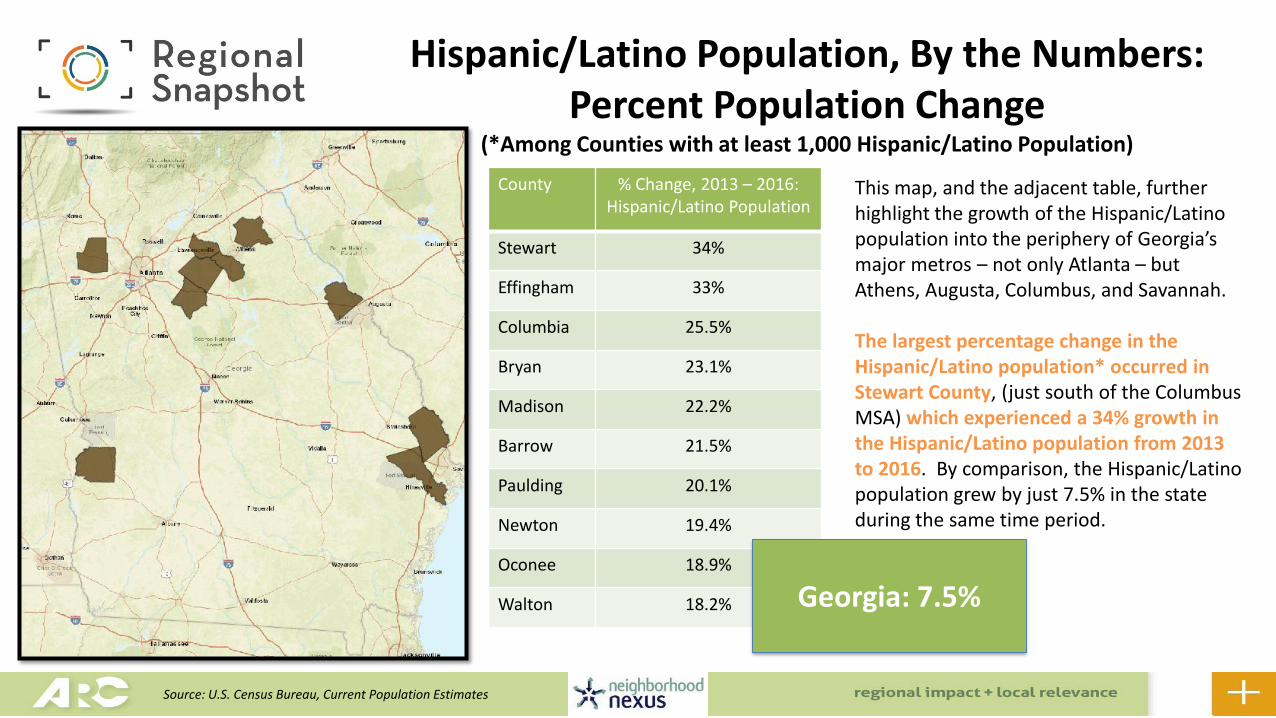
Hispanic/Latino Population, By the Numbers: Percent Population Change
(*Among Counties with at least 1,000 Hispanic/Latino Population)
Georgia: 7.5%
This map, and the adjacent table, further highlight the growth of the Hispanic/Latino population into the periphery of Georgia’s major metros – not only Atlanta – but Athens, Augusta, Columbus, and Savannah.
The largest percentage change in the Hispanic/Latino population* occurred in Stewart County, (just south of the Columbus MSA) which experienced a 34% growth in the Hispanic/Latino population from 2013 to 2016. By comparison, the Hispanic/Latino population grew by just 7.5% in the state during the same time period.
Source: U.S. Census Bureau, Current Population Estimates
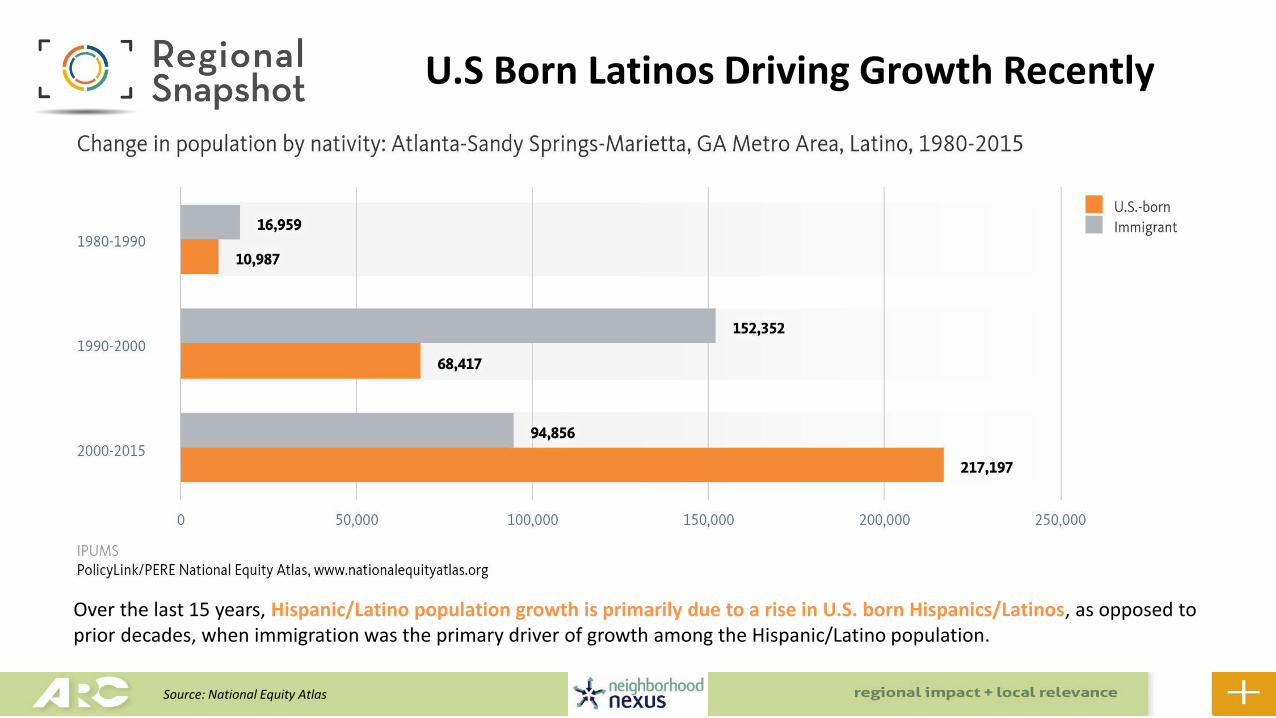
U.S Born Latinos Driving Growth Recently
Over the last 15 years, Hispanic/Latino population growth is primarily due to a rise in U.S. born Hispanics/Latinos, as opposed to prior decades, when immigration was the primary driver of growth among the Hispanic/Latino population.
Source: National Equity Atlas
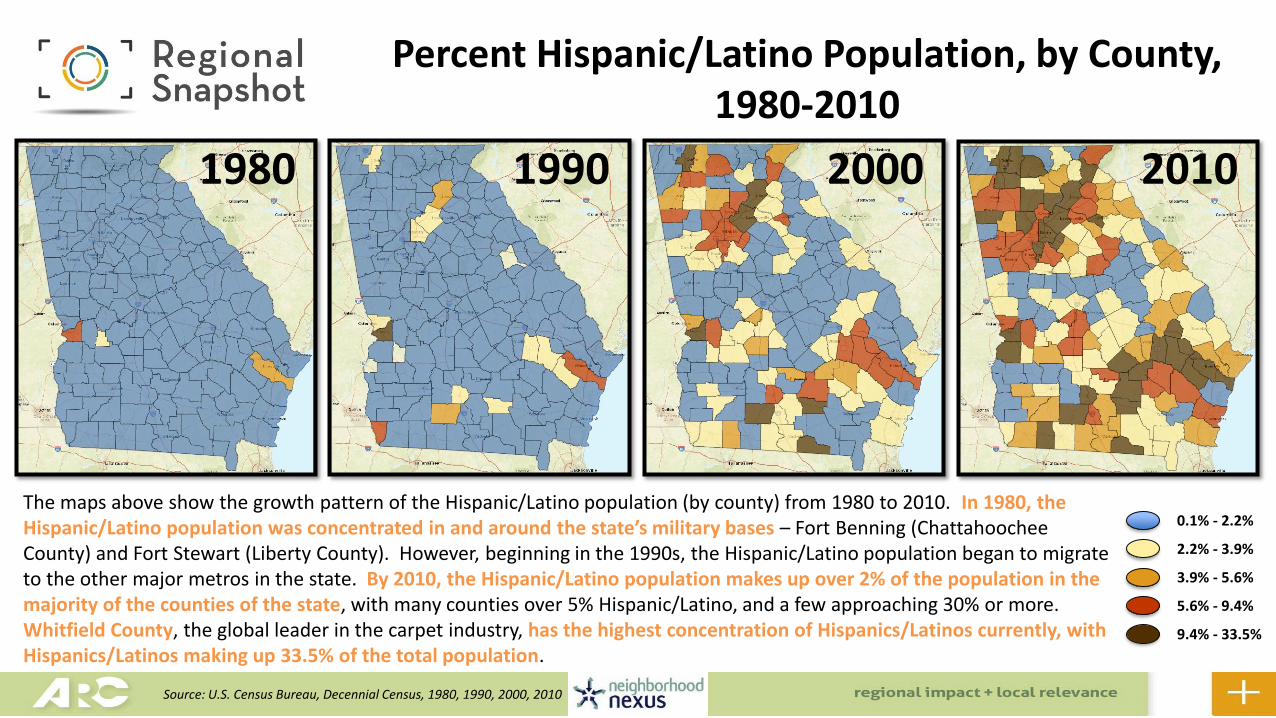
0.1% - 2.2%
2.2% - 3.9%
3.9% - 5.6%
5.6% - 9.4%
9.4% - 33.5%
1980 1990 2000 2010
The maps above show the growth pattern of the Hispanic/Latino population (by county) from 1980 to 2010. In 1980, the Hispanic/Latino population was concentrated in and around the state’s military bases – Fort Benning (Chattahoochee County) and Fort Stewart (Liberty County). However, beginning in the 1990s, the Hispanic/Latino population began to migrate to the other major metros in the state. By 2010, the Hispanic/Latino population makes up over 2% of the population in the majority of the counties of the state, with many counties over 5% Hispanic/Latino, and a few approaching 30% or more. Whitfield County, the global leader in the carpet industry, has the highest concentration of Hispanics/Latinos currently, with Hispanics/Latinos making up 33.5% of the total population.
Percent Hispanic/Latino Population, by County, 1980-2010
Source: U.S. Census Bureau, Decennial Census, 1980, 1990, 2000, 2010
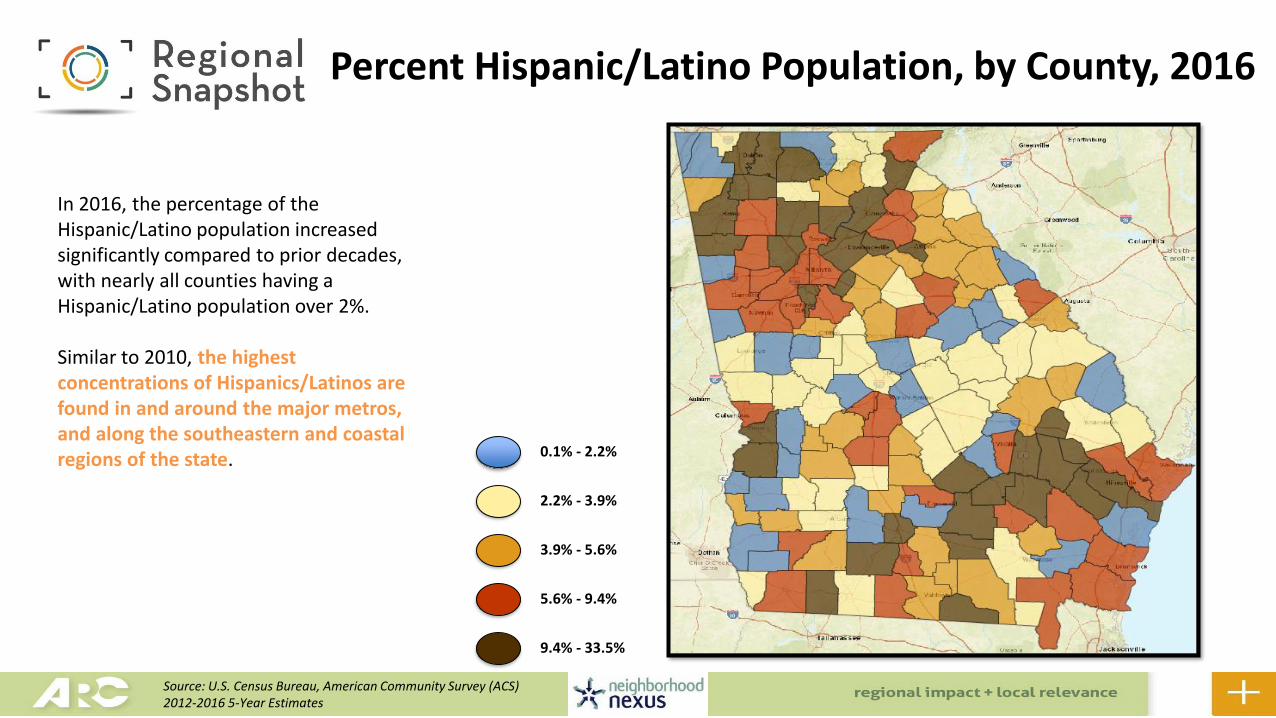
0.1% - 2.2%
2.2% - 3.9%
3.9% - 5.6%
5.6% - 9.4%
9.4% - 33.5%
In 2016, the percentage of the Hispanic/Latino population increased significantly compared to prior decades, with nearly all counties having a Hispanic/Latino population over 2%.
Similar to 2010, the highest concentrations of Hispanics/Latinos are found in and around the major metros, and along the southeastern and coastal regions of the state.
Percent Hispanic/Latino Population, by County, 2016
Source: U.S. Census Bureau, American Community Survey (ACS)2012-2016 5-Year Estimates
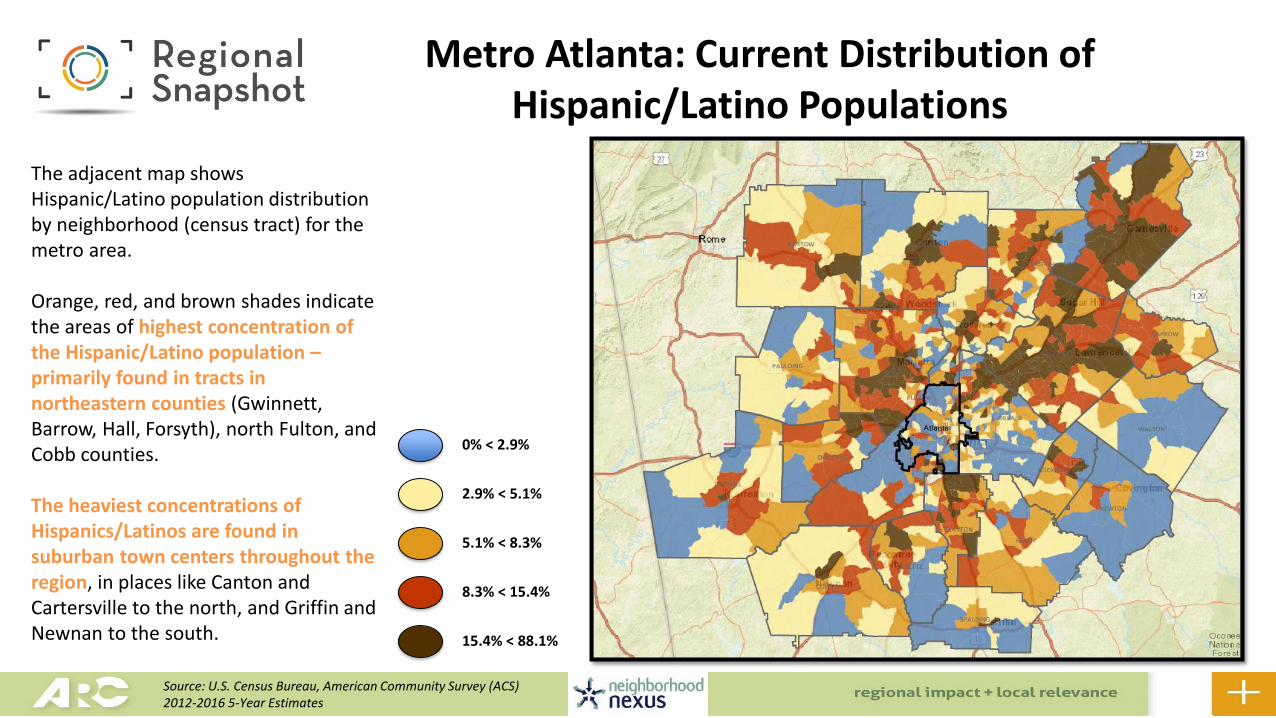
Metro Atlanta: Current Distribution of Hispanic/Latino Populations
0% < 2.9%
2.9% < 5.1%
5.1% < 8.3%
8.3% < 15.4%
15.4% < 88.1%
The adjacent map shows Hispanic/Latino population distribution by neighborhood (census tract) for the metro area.
Orange, red, and brown shades indicate the areas of highest concentration of the Hispanic/Latino population –primarily found in tracts in northeastern counties (Gwinnett, Barrow, Hall, Forsyth), north Fulton, and Cobb counties.
The heaviest concentrations of Hispanics/Latinos are found in suburban town centers throughout the region, in places like Canton and Cartersville to the north, and Griffin and Newnan to the south.
Source: U.S. Census Bureau, American Community Survey (ACS)2012-2016 5-Year Estimates
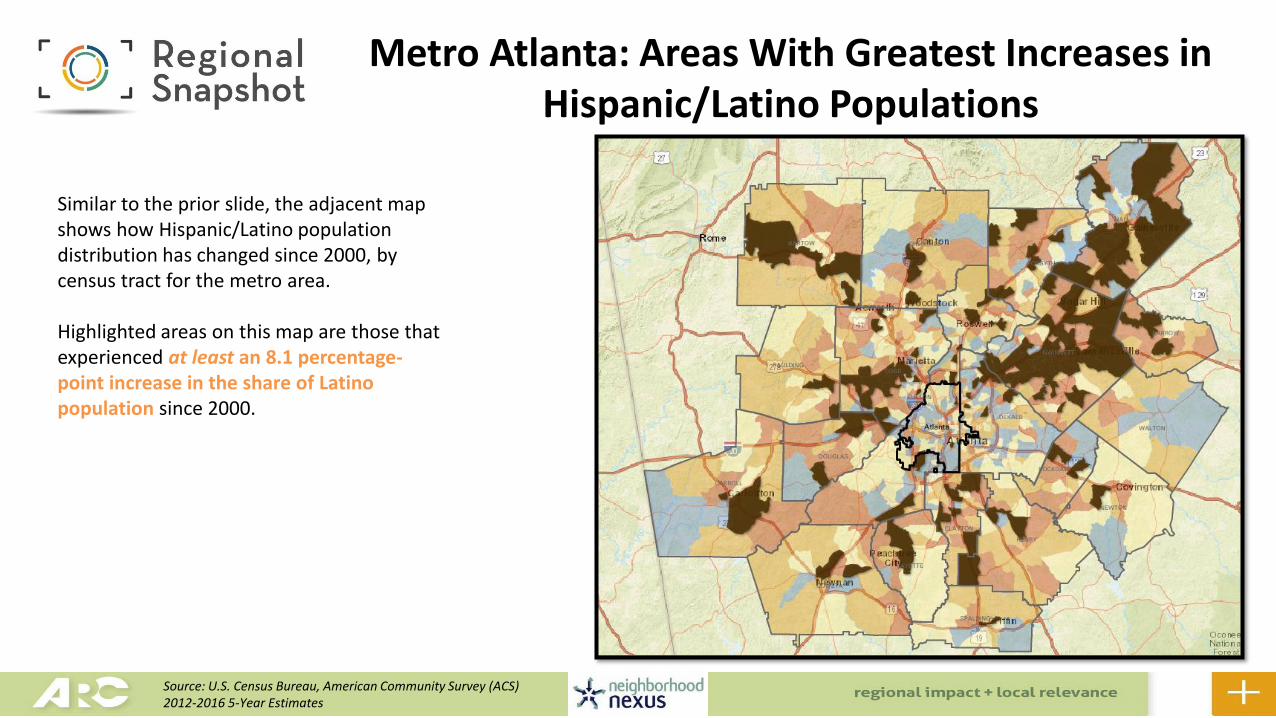
Metro Atlanta: Areas With Greatest Increases in Hispanic/Latino Populations
Similar to the prior slide, the adjacent map shows how Hispanic/Latino population distribution has changed since 2000, by census tract for the metro area.
Highlighted areas on this map are those that experienced at least an 8.1 percentage-point increase in the share of Latino population since 2000.
Source: U.S. Census Bureau, American Community Survey (ACS)2012-2016 5-Year Estimates
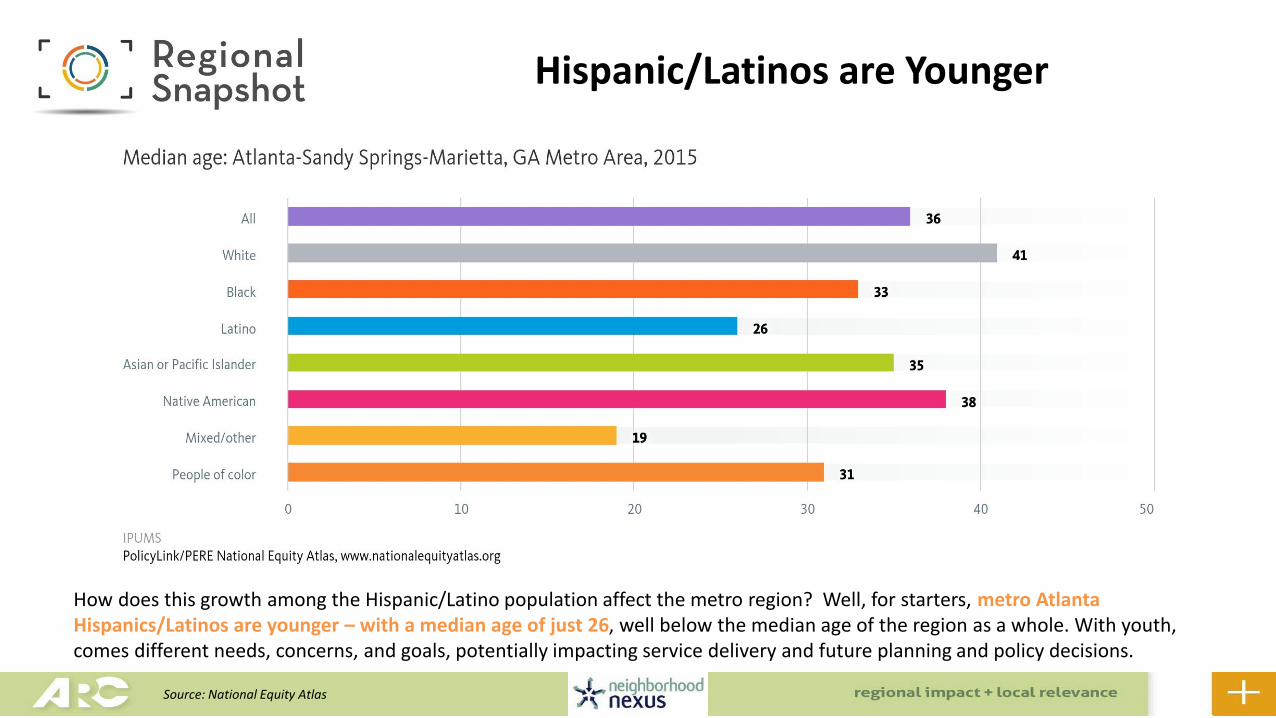
Hispanic/Latinos are Younger
How does this growth among the Hispanic/Latino population affect the metro region? Well, for starters, metro Atlanta Hispanics/Latinos are younger – with a median age of just 26, well below the median age of the region as a whole. With youth, comes different needs, concerns, and goals, potentially impacting service delivery and future planning and policy decisions.
Source: National Equity Atlas
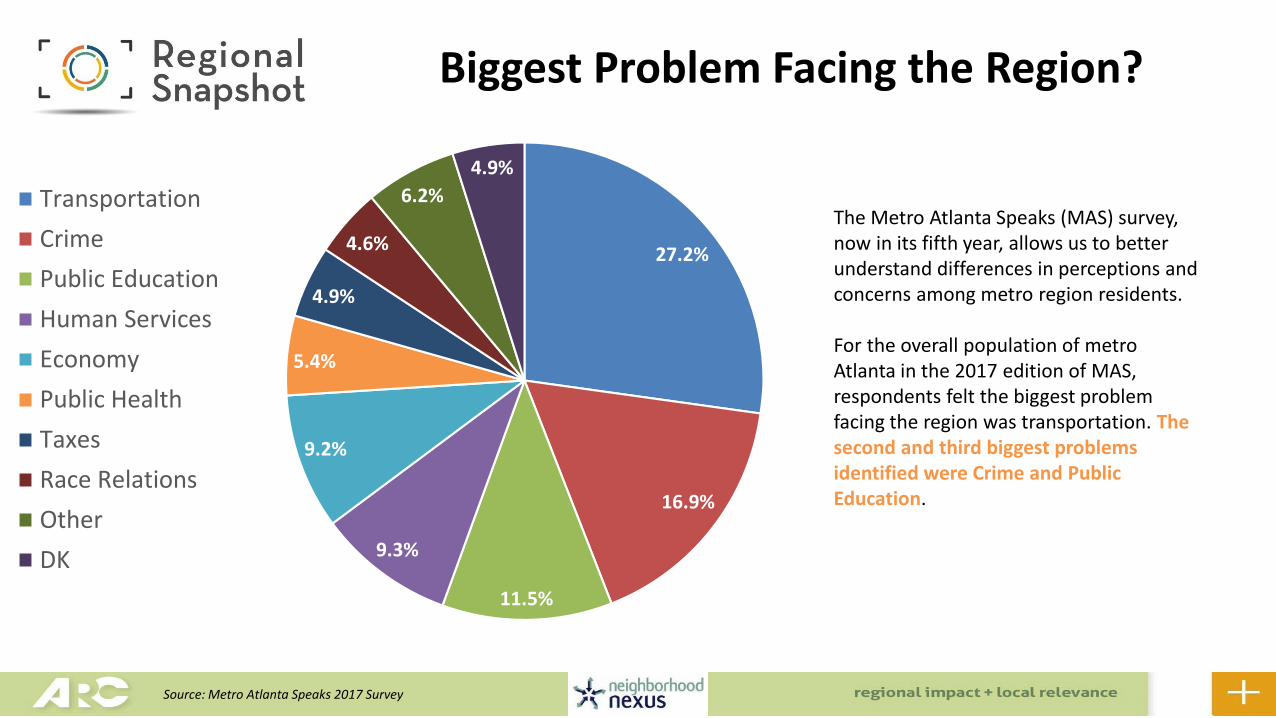
Biggest Problem Facing the Region?
27.2%
16.9%
11.5%
9.3%
9.2%
5.4%
4.9%
4.6%
6.2%
4.9%
Transportation
Crime
Public Education
Human Services
Economy
Public Health
Taxes
Race Relations
Other
DK
The Metro Atlanta Speaks (MAS) survey, now in its fifth year, allows us to better understand differences in perceptions and concerns among metro region residents.
For the overall population of metro Atlanta in the 2017 edition of MAS, respondents felt the biggest problem facing the region was transportation. The second and third biggest problems identified were Crime and Public Education.
Source: Metro Atlanta Speaks 2017 Survey
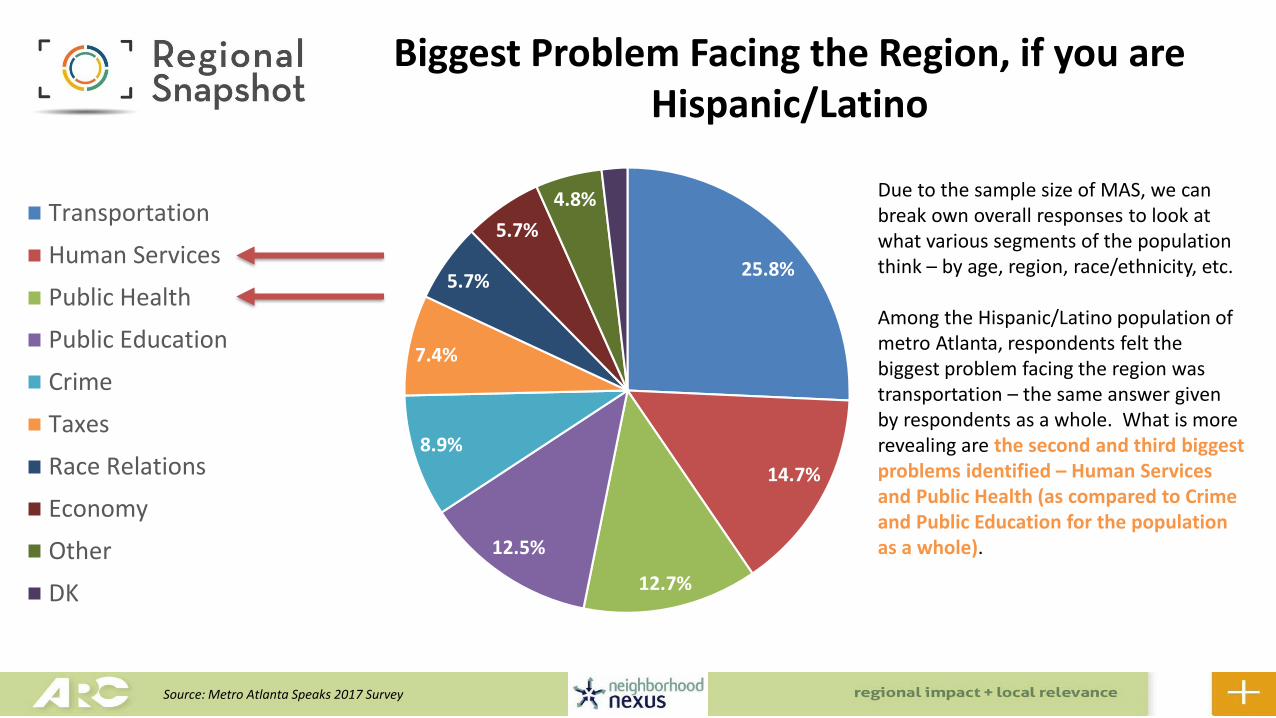
25.8%
14.7%
12.7%
12.5%
8.9%
7.4%
5.7%
5.7%
4.8%
1.8%
Transportation
Human Services
Public Health
Public Education
Crime
Taxes
Race Relations
Economy
Other
DK
Biggest Problem Facing the Region, if you are Hispanic/Latino
Due to the sample size of MAS, we can break own overall responses to look at what various segments of the population think – by age, region, race/ethnicity, etc.
Among the Hispanic/Latino population of metro Atlanta, respondents felt the biggest problem facing the region was transportation – the same answer given by respondents as a whole. What is more revealing are the second and third biggest problems identified – Human Services and Public Health (as compared to Crime and Public Education for the population as a whole).
Source: Metro Atlanta Speaks 2017 Survey
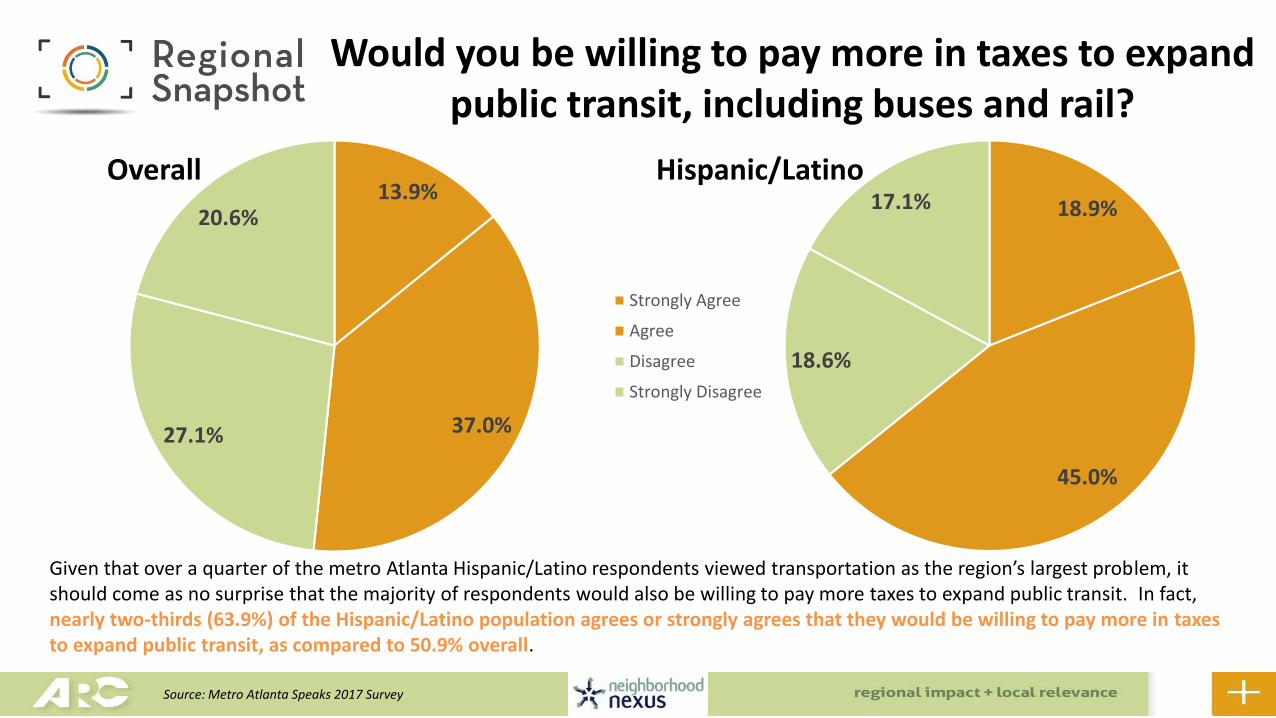
Would you be willing to pay more in taxes to expand public transit, including buses and rail?
13.9%
37.0%27.1%
20.6% 18.9%
45.0%
18.6%
17.1%
Strongly Agree
Agree
Disagree
Strongly Disagree
Overall Hispanic/Latino
Given that over a quarter of the metro Atlanta Hispanic/Latino respondents viewed transportation as the region’s largest problem, it should come as no surprise that the majority of respondents would also be willing to pay more taxes to expand public transit. In fact, nearly two-thirds (63.9%) of the Hispanic/Latino population agrees or strongly agrees that they would be willing to pay more in taxes to expand public transit, as compared to 50.9% overall.
Source: Metro Atlanta Speaks 2017 Survey
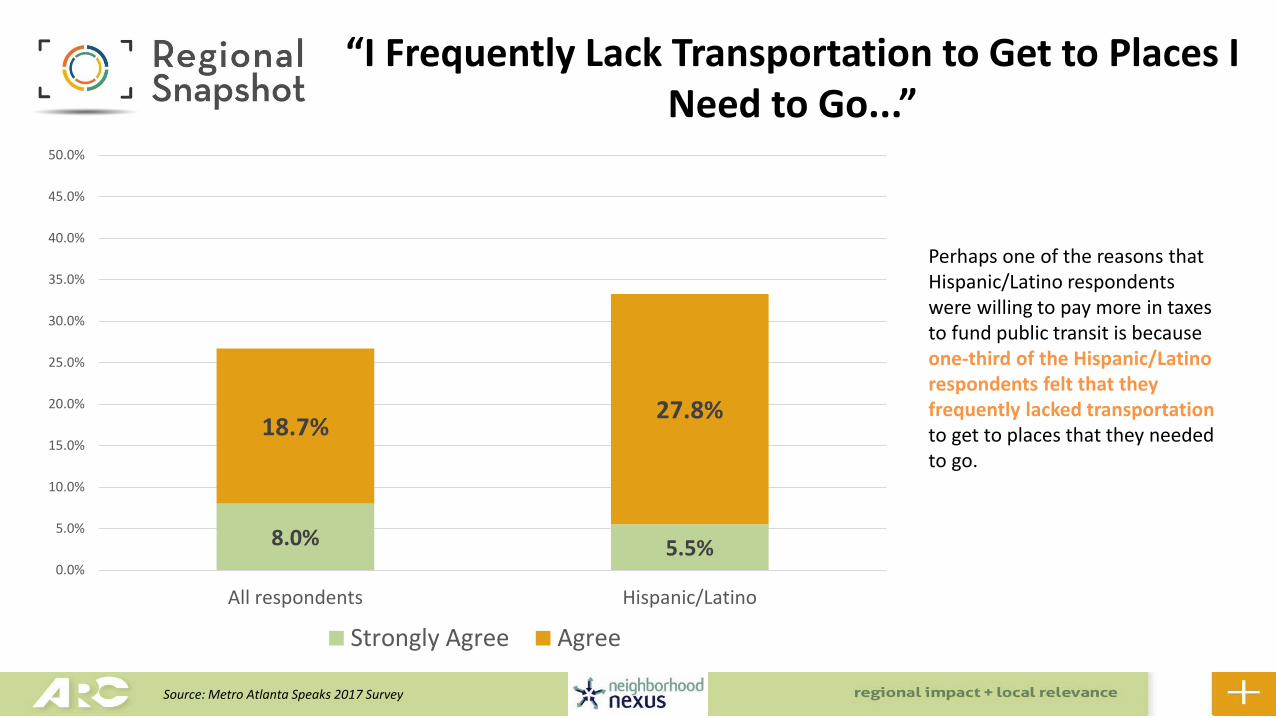
8.0% 5.5%
18.7%27.8%
0.0%
5.0%
10.0%
15.0%
20.0%
25.0%
30.0%
35.0%
40.0%
45.0%
50.0%
All respondents Hispanic/Latino
Strongly Agree Agree
“I Frequently Lack Transportation to Get to Places I Need to Go...”
Perhaps one of the reasons that Hispanic/Latino respondents were willing to pay more in taxes to fund public transit is because one-third of the Hispanic/Latino respondents felt that they frequently lacked transportation to get to places that they needed to go.
Source: Metro Atlanta Speaks 2017 Survey
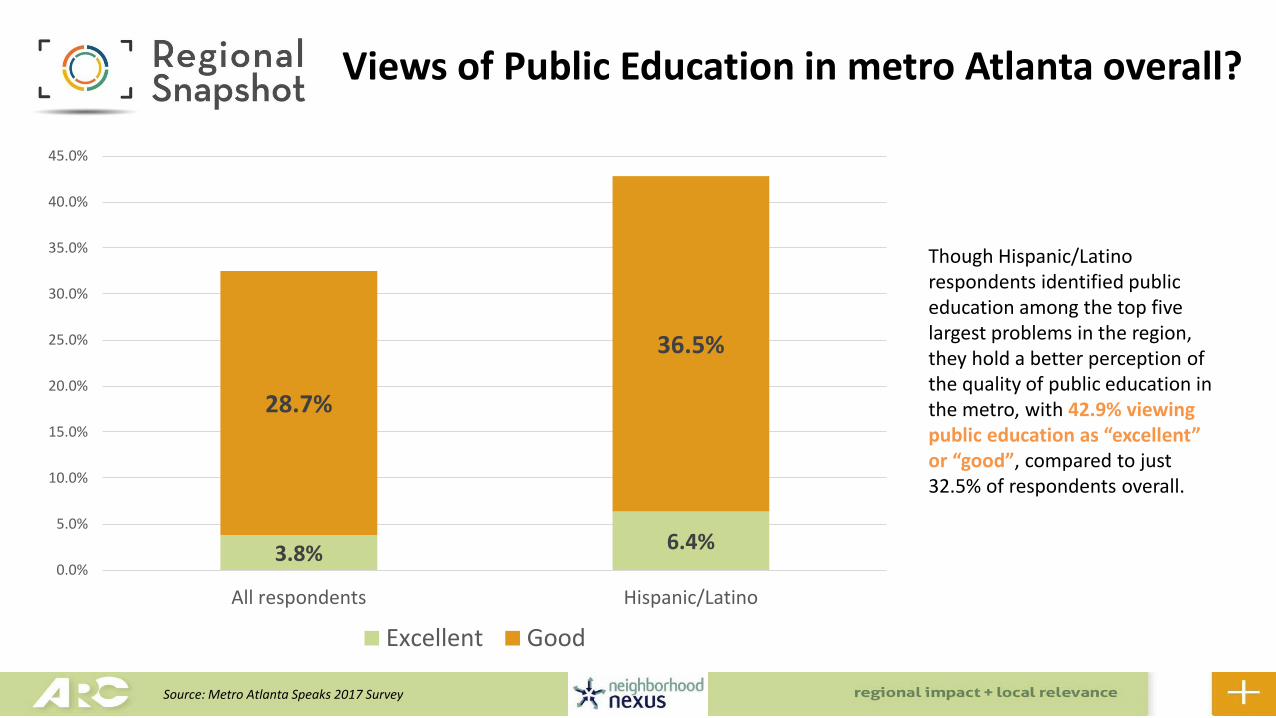
3.8% 6.4%
28.7%
36.5%
0.0%
5.0%
10.0%
15.0%
20.0%
25.0%
30.0%
35.0%
40.0%
45.0%
All respondents Hispanic/Latino
Excellent Good
Views of Public Education in metro Atlanta overall?
Though Hispanic/Latino respondents identified public education among the top five largest problems in the region, they hold a better perception of the quality of public education in the metro, with 42.9% viewing public education as “excellent” or “good”, compared to just 32.5% of respondents overall.
Source: Metro Atlanta Speaks 2017 Survey
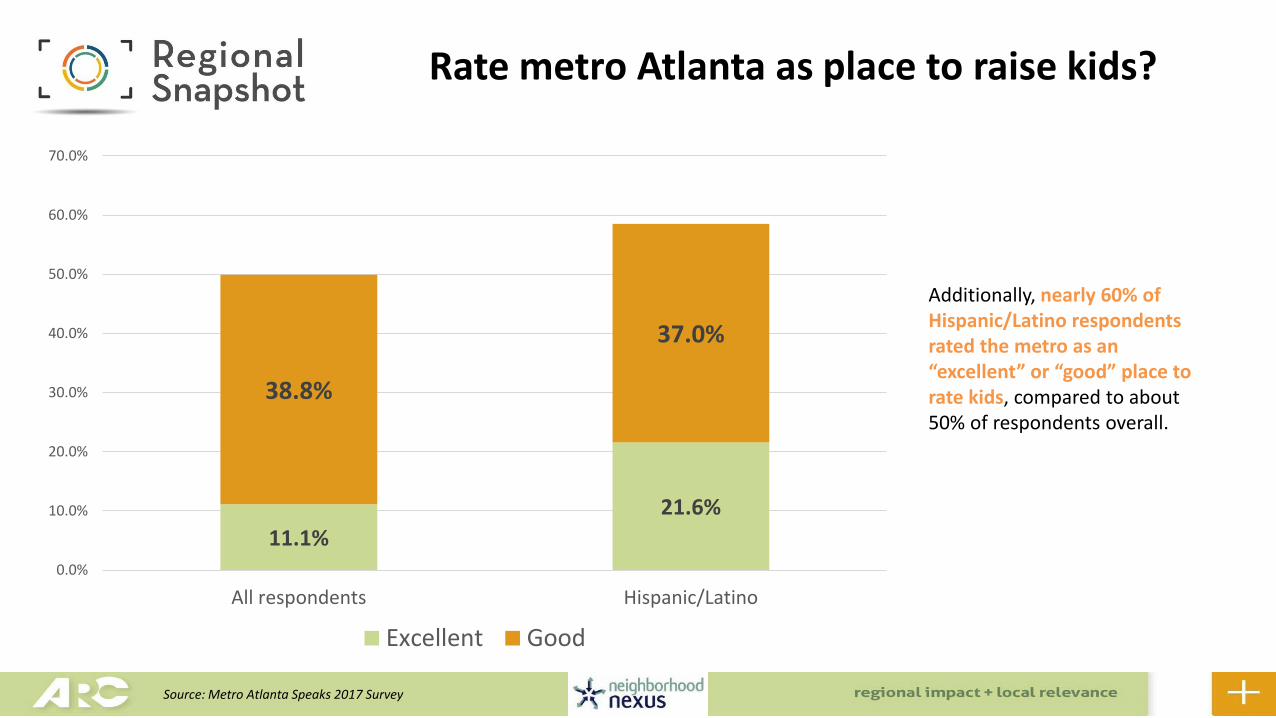
11.1%
21.6%
38.8%
37.0%
0.0%
10.0%
20.0%
30.0%
40.0%
50.0%
60.0%
70.0%
All respondents Hispanic/Latino
Excellent Good
Rate metro Atlanta as place to raise kids?
Additionally, nearly 60% of Hispanic/Latino respondents rated the metro as an “excellent” or “good” place to rate kids, compared to about 50% of respondents overall.
Source: Metro Atlanta Speaks 2017 Survey
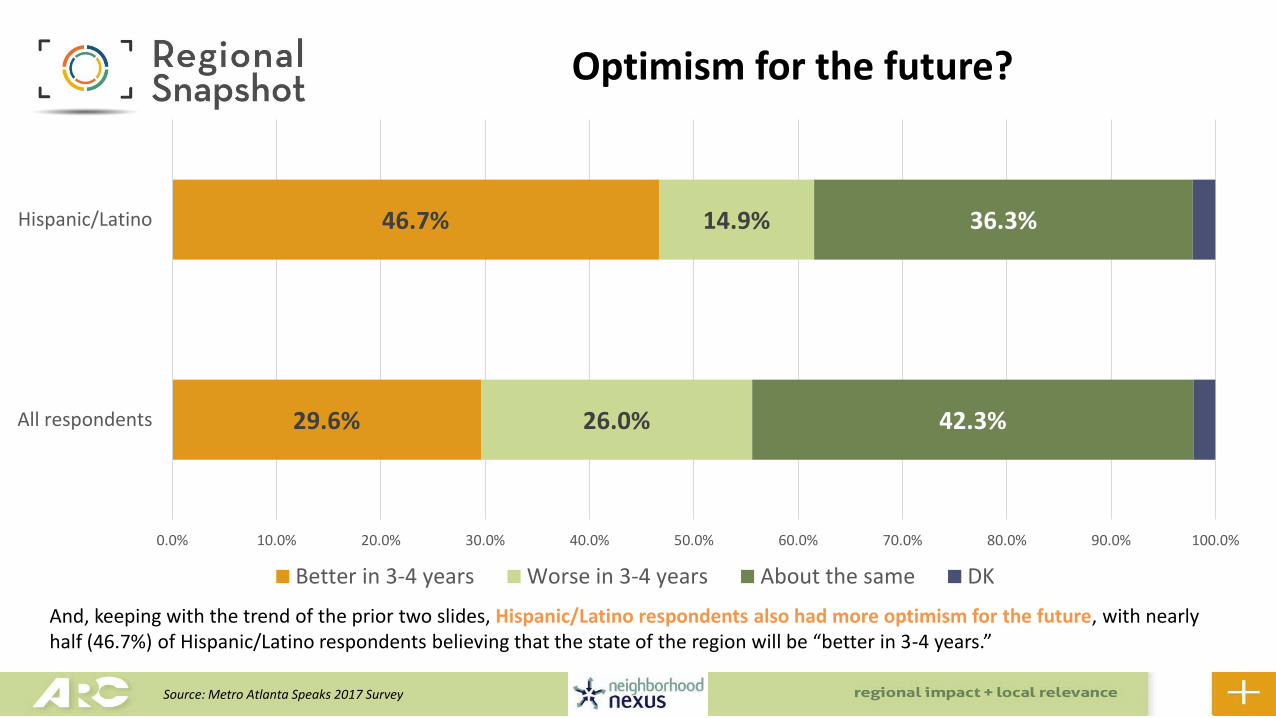
29.6%
46.7%
26.0%
14.9%
42.3%
36.3%
0.0% 10.0% 20.0% 30.0% 40.0% 50.0% 60.0% 70.0% 80.0% 90.0% 100.0%
All respondents
Hispanic/Latino
Better in 3-4 years Worse in 3-4 years About the same DK
Optimism for the future?
And, keeping with the trend of the prior two slides, Hispanic/Latino respondents also had more optimism for the future, with nearly half (46.7%) of Hispanic/Latino respondents believing that the state of the region will be “better in 3-4 years.”
Source: Metro Atlanta Speaks 2017 Survey