Embed Size (px)
Citation preview

Development of broadband in Africa
A presentation by David BernalMay 17th-18th, 2011
Gaborone, Botswana
Regional Seminar on Costs and Tariffs for Member Countries of the Regional Group for
Africa (SG3RG-AFR)
Session 3
11

Contents
1. Introduction
2. Trends and challenges
5. Regulatory analysis
7. Benchmark: Spain and Nigeria
8. Summary and conclusions
6. Pricing: cost modeling
3. Broadband Plans: USA, Europe and Spain
4. Broadband in Africa
2

Contents
1. Introduction
2. Trends and challenges
5. Regulatory analysis
7. Benchmark: Spain and Nigeria
8. Summary and conclusions
6. Pricing: cost modeling
3. Broadband Plans: USA, Europe and Spain
4. Broadband in Africa
3

Introduction.
As it is described in the American Broadband Plan by FCC, Broadband is the great infrastructure challenge of the early 21st century. Its is difficult to separate broadband services from next generation networks (NGN). According to the FCC:
“broadband” refers to advanced communications systems capable of providing high speed transmission of services such as data, voice, and video over the Internet and other networks. Transmission is provided by a wide range of technologies, including digital subscriber line and fiber optic cable, coaxial cable, wireless technology, and satellite. Broadband platforms make possible the convergence of voice, video, and data services onto a single network.
and according to the Recommendation I.113 of the ITU Standardization Sector:
Transmission capacity that is faster than primary rate Integrated Services Digital Network (ISDN) at 1.5 or 2.0 Megabits per second (Mbits)
What is Broadband?
4
So, it is possible to separate Broadband from NGN ?
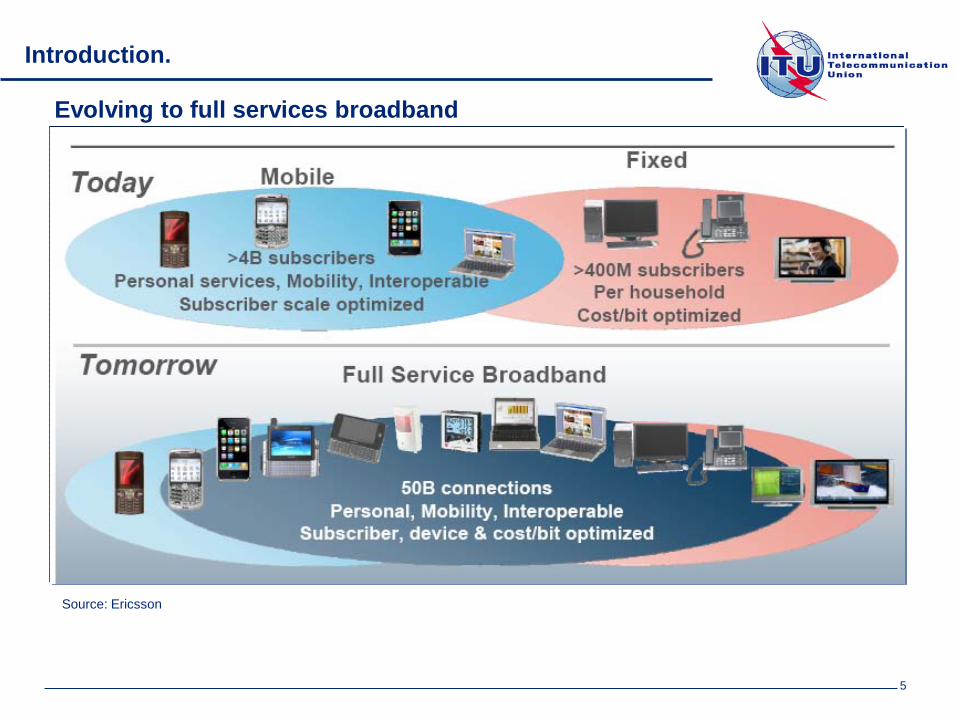
Introduction.
Evolving to full services broadband
Source: Ericsson
5

Introduction.
The NGN architecture as defined by the ITU and ETSI borrows heavily from the work done by 3GPP. According to Y.2012, the NGN architecture supports the delivery of multimedia services and content delivery services, including video streaming and broadcasting. An aim of the NGN is to serve as an PSTN and ISDN replacement.
Next Generation Networks (NGN) can be developed using a number of technologies, including fiber, cable, fixed, mobile wireless, or further technology upgrades to the existing copper based networks.
• From traditional “one network-one service” approach to a “one network-many services”.• Services and content maybe delivered over a variety of devices• Provide higher speed using different technologies
What is NGN?
Towards the convergence of networks, services and devices:
One of the most fundamental aspects that characterize NGN is the convergence mobile/fixed networks.
The term “convergence” is being used to refer to offer voice, data, video, and other increasingly intermingled multimedia services seamlessly over single or multiple infrastructures and platforms.
Converging NGNs, and the overall global NGN, are being driven by digitization, packetization, high-speed transfer, and Internet Protocol (IP).
6

Introduction.
NGN’s are distinguished from traditional circuit switched networksin that all information is transmitted via packets, which are thenlabeled according to their type (data, voice, etc) and handleddifferently by traffic management equipment.
So,• NGNs will allow carriers’ networks to cost effectivelysupport a new suite of sophisticated services by building oncore competencies related to traditional transport services
• It will help reduce costs by eliminating the inefficienciesof current service-specific, proprietary, and non-reusablesolutions
• NGN approaches will reduce the time to market and life-cycle costs of offering new services.
• It will enable carriers to deploy advanced services, allowingthem to remain competitive as well as expand their capabilitiesto enter new markets
From traditional networks to NGN
Main architectural changes to be made:
• In core network, migration of voice from a circuit-switched architecture to packets• In the wired access network, new mechanism to process voice and data (xDSL).• In the cable access network, upgrade of DOCSIS ( towards DOCSIS 3.0) -> FTTH
Source: OFCOM,
TRADITIONAL NETWORKS
NEXT GENERATION NETWORKS
7

Introduction.
Towards the convergence model
Demand is increasing very quickly in most Member States – and it has produced an increase of required capacity andan upgraded network.
Rankings of broadband penetration among Member States are very volatile, suggesting major disparities according tomarket conditions;
Price per unit of bandwidth is falling very quickly, largely because an active competition based on infrastructure insome areas.
Operators offer a range of services, presumably in the hope of encouraging upgrading;
Source: J. Horrocks, “NGN and Convergence Models, Myths, and Muddle”
8

Introduction.
• High growth not only of fixed but also mobile services…..
• Packet services
• Customer segmentation (heavy internet users vs soft internet users) and fixed-mobile substitution effect.
DEMAND
OFFER
• Alternative technologies like cable, fiber , ULL or mobile that are focused on most highly populated areas and better economic conditions
• Geographical regions characterized by infrastructure competence has more price competition
• Governments in Europe are convinced to extend broadband services to urban and rural areas –> Complementation by private initiatives
• Network neutrality could change some business models (service providers, content providers, network operators, end users)
A new market structure implies innovative regulatory measures
Geographical difference becomes a key issue to be analyzed.
9

Contents
1. Introduction
2. Trends and challenges
5. Regulatory analysis
7. Benchmark: Spain and Nigeria
8. Summary and conclusions
6. Pricing: cost modeling
3. Broadband Plans: USA, Europe and Spain
4. Broadband in Africa
10

2. Main trends and challenges
Source: Analysis Mason
Europe: Strong uptake of mobile broadband services
Source: Analysis Mason11

2. Main trends and challenges
Source: Analysis Mason
Mobile broadband connections by regions Data services as a proportion of wireless network traffic, worldwide
Voice traffic will increase between 2010 and 2015, but data traffic is expected to increase much faster and will dominate the servicemix in developed and emerging markets by 2015.
With the prevalence of smartphones forecast to spread globally and the consequent increase in the number of MBB data connections (referring to all connections using 3G, HSPA, LTE or similar to connect a PC)
Africa shows a future increase in mobile broadband connections
12

13
2. Main trends and challenges
Main trends Challenges
• Growing popularity of smartphones with asignificant impact on the traffic
• Mobile broadband substitution for severalclients and geographical areas.
• Economical crisis impacts on demandevolution and decision taken about networkrollout or sharing networks
• Impact of network neutrality on strategyof different operators (value chain)
• Price strategy must be changed
• Spectrum regulation
• Promoting broadband in rural areas
• Definition of spectrum policy implying moreefficient spectrum use as well as a higher telecomservices penetration. (refarming, digital dividend,…)
• Definition of regulatory policy that incentiveinvestments and shareholders return ( riskremuneration depending on the risk assumed)
• Access network transformation substitutingtraditional networks for broadband networks.
• Geographical segmentation consideration inthe market analysis, network deployment and SMPoperators.
• New commercial and pricing policies, based oncapacity and different kinds of user devices
13

Contents
1. Introduction
2. Trends and challenges
5. Regulatory analysis
7. Benchmark: Spain and Nigeria
8. Summary and conclusions
6. Pricing: cost modeling
3. Broadband Plans: USA, Europe and Spain
4. Broadband in Africa
14

3. Broadband Plans: USA
In early 2009, Congress directed the Federal Communications Commission (FCC) to develop a National Broadband Plan to ensure every American has “access to broadband capability.”
Goal No. 1: At least 100 million U.S. homes should have affordable access to actual download speeds of at least 100 megabits per second and actual upload speeds of at least 50 megabits per second.
Goal No. 2: The United States should lead the world in mobile innovation, with the fastest and most extensive wireless networks of any nation.
Goal No. 3: Every American should have affordable access to robust broadband service, and the means and skills to subscribe if they so choose.
Goal No. 4: Every American community should have affordable access to at least 1 gigabit per second broadband service to anchor institutions such as schools, hospitals and government buildings.
Goal No. 5: To ensure the safety of the American people, every first responder should have access to a nationwide, wireless, interoperable broadband public safety network.
Goal No. 6: To ensure that America leads in the clean energy economy, every American should be able to use broadband to track and manage their real-time energy consumption.
Long Term Goals100Mb download in 2020
Mobile Broadband is a key item
To achieve 500Mhz for 4G providers from current 50Mhz
Each community having access to 1Gbps to connect schools,….
But is it the solution to real lack of competence?
Fundings
In 2010, the federal USF (Universal Service Fund) was projected to make total outlays of $8.7 billion through several programs
The High-Cost program, which subsidizes telecommunications services in areas where costs would otherwise be prohibitively high, will spend $4.6 billion. Additionally to USF, FCC wants Government to approve US$9bn in 3 years to deploy broadband
Total cost of the Broadband Plan is estimated around €US$15bn-US$ 35bn15

3. Broadband Plans: USA
Availability of 4Mbps-Capable Broadband Networks in USA by country
16

3. Broadband Plans: Europe - Digital Agenda
Key Performance Targets from the Benchmarking framework 2011-2015 endorsed by the EU Member States in November 2009.
• Basic broadband for all by 2013: basic broadband coverage for 100% of EU citizens. (Baseline: Total DSL coverage (as % of the total EU population) was at 93% in December 2008.)
• Fast broadband by 2020: broadband coverage at 30 Mbps or more for 100% of EU citizens. (Baseline: 23% of broadband subscriptions were with at least 10 Mbps in January 2010.)
• Ultra-fast broadband by 2020: 50% of European households should have subscriptions above 100Mbps.
Broadband targets
• Promoting eCommerce: 50% of the population should be buying online by 2015. (Baseline: In 2009, 37 % of the individuals aged 16-74 ordered goods or services for private use in the last 12 months.)
• Cross-border eCommerce: 20% of the population should buy cross border online by 2015. (Baseline: In 2009, 8 % of the individuals aged 16-74 ordered goods or services from sellers from other EU countries in the last 12 months.)
• eCommerce for business: 33% of SMEs should conduct online purchases/sales by 2015. (Baseline: During 2008, 24% and 12% of enterprises was, respectively, purchasing/selling electronically, for an amount equal to or greater than 1% of the turnover/total purchases.
• Single market for telecoms services: the difference between roaming and national tariffs should approach zero by 2015. (Baseline: In 2009, the roaming average price per minute was 0.38 cents (call made) and the average price per minute for all calls in the EU was 0.13 cents (roaming included).
Digital single market
17

3. Broadband Plans: Spain – Plan Avanza
The objective of "Avanza Infraestructures“ (2008-2011) funding program is to facilitate investments to extend telecommunication services" coverage to isolated and rural areas.
•The objective is to continue PEBA program successes by increasing broadband coverage in very small population centers and not only to improve bandwidth and network capacity provided by telecommunication operators at rural areas but also to improve the service quality.
Main goals of phase I. Projects intended to:
• Develop access infrastructures in order to satisfy the demand for broadband connection from population in isolated and rural areas. • Develop rural backbone networks (High-capacity rural networks)• Test in rural areas those innovative broadband technologies that are being spreaded in urban areas. • Develop public networks so that citizens can access to Public Administration services. • Disseminate broadband advantages and opportunities so that digital divide can be narrowed.
Action Plan
• F1 action line projects: 13 projects from 4 telcos are being developed in order to provide broadband access to 10.034 population centers. Both cabled and wireless broadband access technologies are being used: ADSL, 3G/HSDPA, WIMAX and Satellite. Envisaged investments amount to nearly 9 million € with a contribution by the Government of 2.1 million € non-recoverable subsidies and nearly 4.7 million € zero interest loans.
• F2 action line projects: 16 projects from 3 telcos are being developed in order to improve backbone networks of 721 town councils. Envisaged investments amount to nearly 46 million € with a contribution by the Government of 10.1 million € non-recoverable subsidies and nearly 21 million € zero interest loans.
• F3 action line projects: one pilot project is being developed within this action line by Innovamar tecnological foundation . The project objective is to develop ICTs at sea related industries in order to update the fishing sector.
• F4 action line projects: taken into account the importance of training and advertising in order to increase Internet usage rates and literacy at rural areas, this action line objective is to disseminate advantages of broadband and telecommunication advanced services as well as available opportunities by accessing to the information society. 18

3. Broadband Plans: Spain – Plan Avanza
Action F1
Action F2
19

Contents
1. Introduction
2. Trends and challenges
5. Regulatory analysis
7. Benchmark: Spain and Nigeria
8. Summary and conclusions
6. Pricing: cost modeling
3. Broadband Plans: USA, Europe and Spain
4. Broadband in Africa
20

4. Broadband in Africa
Correlation between broadband and GDP
Source: Analysis Mason
• Positive correlation between the availability of telecom services in a country and its gross domestic product (GDP) or overall economic output.
21

4. Broadband in Africa
Coverage and penetration in mobile market
Source: GSMA
• Africa has more than 900 million people living in 54countries. It covers more than 20 percent of the totallandmass on this planet . Considering its huge size andpopulation, opportunities to expand mobile service are justas enormous especially in remote African communities.
•Approximately half of African countries face a greatchallenge to bring greater geographical and populationcoverage to markets where penetration and affordabilityare low.
•These are generally low income countries, mostly withlarge geographical areas or topographical barriers andweak transportation and electricity supply infrastructures,which contribute to high operator costs.
• Amongst the 43 African countries of a sampleanalyzed, 10 have achieved GSM coverage greater than90% of population and a further 8 have coverage of70% orgreater.
• All except one (Angola) of the 24 countries with lessthan 70% population coverage has per capita incomesless than US$ 1,000
22

4. Broadband in Africa
Coverage and penetration in mobile market
Source: GSMA
• Although 80% of the future subscriber growth will come from developing markets, primarily in Africa, Asia Pacific and Latam, revenue growth will be more balanced between developed and developing markets.
• In developing countries mobile has eclipsed the fixed networks and has become the means to bring communications services to everyone. Mobile has now emerged as the dominant and preferred route to Universal Access (UA) and Universal Service (US) .
• Mobile operators have been able to meet demand for basic voice services in a much more rapid and flexible way than fixed line operators, eliminating many of the barriers for people on low incomes to subscribe and use communication services.
•Marginal revenues in rural areas are lower than urban areas and investments required to reach these rural areas are disproportionately high. To serve rural areas, operators must pay increasing attention to the total cost of ownership (TCO) of their networks, to minimize both capital and operating costs.
• Low ARPUs are not an insurmountable barrier for operators. Companies operating in a low ARPU environment can be profitable
• Competition between multiple operators results in more rapid growth. Almost all of the high achievement countries have three or more GSM operators.
• Competition between multiple operators results in more rapid growth Almost all of the high achievement countries have three or more GSM operators
SUMMARY.
23

4. Broadband in Africa
Mobile market in rural areas
Source: GSMA
• Total marginal revenue can be improved through deeper coverage, but the cost of network expansion and operation in rural and low population density areas rises exponentially.
• Many rural areas combine low ARPU with higher costs due to high backhaul expenditures
To maintain EBITDA levels with reduced ARPU, operators have to focus on reduce their operation costs by several measures:
24

4. Broadband in Africa
International bandwidth in Africa
Source: Ericsson25

4. Broadband in Africa
International bandwidth in Africa
Source: ITU
1) The maximum capacity of all the cables being built is 15.71 Tbps (demand was measured in Gigabits)
2) The arrival of this large amount of international bandwidth provides the spread of networks to both major cities and the roll-out of fibre and wireless local delivery networks in the cities themselves.
3)Lower prices of international bandwidth help operators to make money with services provided to end users instead of bandwidth.
Out of the 49 Sub-Saharan African countries and territories, 32 now have their capital cities connected tointernational fibre and many of these have either completed a backbone to connect their major cities or have plans to do so by2012.
In a number of instances, Governments like those of Kenya, Rwanda, Tanzania and Uganda have taken on loansor deployed universal access funds to get national backbones built. In each instance, these have been given to theformer incumbents to manage but only in the case of Tanzania is this still a Government-owned entity
Others like Angola and Ethiopia have left the responsibility of building the national fibre backbone with theincumbent, although in the case of the latter, the Government has signed a contract with France Telecom toprovide strategic management
In the case of South Africa, the Government created a separate agency (Infraco) to operate existing assets andbuild out more
Of the 19 countries that remain unconnected, 14 of them have concrete plans that will see their capital citiesconnected by 2012 and backbone plans to connect major cities.
The driver for the connection of most African capitals has been the arrival of eight international fibre cables : manyAfrican capitals are either on the coast or near to the coast.
Cable TimingEast coastSeacom ImplementedTEAMS ImplementedEASSy ImplementedLION 1 and 2 implementedWest coastGlo One 2/Q3 2010Main One ImplementedWACS Q2, 2011ACE Q2, 2012
26
4. Broadband in Africa
International bandwidth in Africa
Source: Analysis Mason
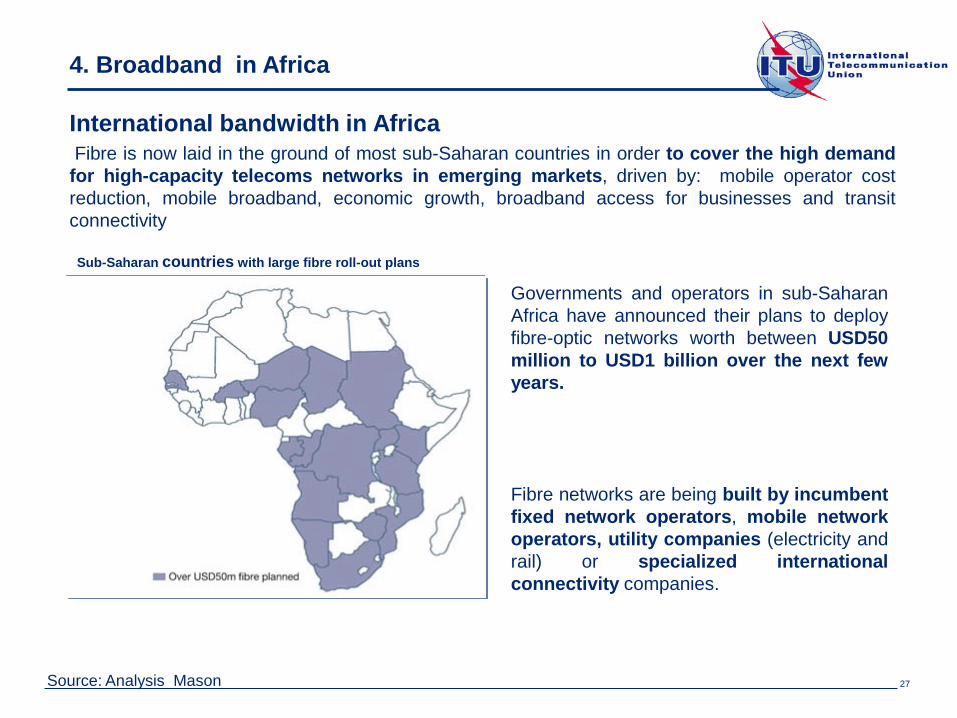
Fibre is now laid in the ground of most sub-Saharan countries in order to cover the high demandfor high-capacity telecoms networks in emerging markets, driven by: mobile operator costreduction, mobile broadband, economic growth, broadband access for businesses and transitconnectivity
27
Sub-Saharan countries with large fibre roll-out plans
Governments and operators in sub-SaharanAfrica have announced their plans to deployfibre-optic networks worth between USD50million to USD1 billion over the next fewyears.
Fibre networks are being built by incumbentfixed network operators, mobile networkoperators, utility companies (electricity andrail) or specialized internationalconnectivity companies.

4. Broadband in Africa
An alternative to expand broadband to rural areas
Source: Intelsat and Analysis Mason
• To connect rural African communities, local base stations must be connected to fixed wireline or fiber cables,microwave links or satellite backhaul connections:
• Fixed wireline is almost non-existent in many parts of Africa. In most circumstances, microwave links are usedbecause equipment is readily available and spectrum licenses are easy to obtain. Microwave links are most cost-effective when servicing large populations over small distances
• Costs dramatically escalate when connecting communities that are more than 30km away from the corenetwork, requiring multiple hops.
• Satellite technology is not impacted by distance. It’s much more efficient and economical to use thanmicrowave links when servicing small populations over large distances, such as those in rural or remote areas.
Many African communities with large populations are isolated,far away from their closest neighbor. So, mobile networkoperators have two options:
1)Connect each base station to a single aggregation node
2)Use a hybrid approach that includes both microwave andsatellite technologies. Several base stations serving acommunity are connected locally with microwave, then thecluster is backhauled via satellite to the operator’s core network.
28

4. Broadband in Africa
An alternative to expand broadband to rural areas
Source: Intelsat and Analysis Mason
Hybrid backhaul combines the distance advantage of satellite with the bandwidth advantage of microwave.
29

4. Broadband in Africa
The Uganda UA Program: trend to internet
Source: GSMA
The UA policy and funding (RCDF) program was designed to cover both rural telephony and Internet and designedto leverage the digital backbones constructed by the two leading operators, Uganda Telecom Limited (UTL) and MTN Uganda.
A techno-economic analysis determined that the use of commonly available broadband wireless options, with acoverage radius of 10-15 km, would ensure that Internet services could be provided as an overlay network in virtually allof the district centres using base station towers in a very economical manner.
One-time “smart subsidies” were therefore offered for the installation of Internet POPs and broadband access systems at32 of the country’s 56 district centers The Internet POPs would ensure that all institutions, schools and businesseswithin line-of-sight of the district centres’ central radio towers would be able to secure high quality Internet access atthe same price as if they were located in the capital, Kampala.
The regulator, UCC, also decided that along with or following immediately behind each Internet POP, one public Internetcafé per district and at least one “vanguard institution” (e.g. a leading Internetready school or college) could beincentivized with “smart subsidies.”
As well, local training initiatives and regional content development could be supported from the RCDF. These wouldcombine to promote the start-up of the local Internet market on a commercially sustainable basis.
While the RCDF’s strategy did not immediately guarantee that Internet service would be implemented ubiquitously, thestrategy serves to stimulate the market and also greatly reduces every rural person’s distance to the nearest Internetaccess by the placement of the POPs in each district centre.
Rural users are now on the way to being able to access the Internet, at least through public Internet cafés or institutionsthat are close to them.
30

Contents
1. Introduction
2. Trends and challenges
5. Regulatory analysis
7. Benchmark: Spain and Nigeria
8. Summary and conclusions
6. Pricing: cost modeling
3. Broadband Plans: USA, Europe and Spain
4. Broadband in Africa
31

5. Regulatory analysis
The three Criteria test
1. Presence of high and non-transitoryentry barriers whether of structural, legalor regulatory nature
2. It admits only those markets, thestructure of which does not tend towardseffective competition within the relevanttime horizon
3. Application of competition law alonewould not adequately address themarket failure(s) concerned
Obligations/Remedies:
• Price control: cost oriented/ reasonable“prices”
• Separated accounting• Access obligation• Non discrimination and transparency• Functional separation
In order to justify the imposition of regulatory obligations on a given market, the three criteria test is applied.
FASE I. MARKET DEFINITION
FASE II. MARKET STRUCTURE
FASE III. DOMINANT POSITION?
FASE IV. RESULTS ANALYSIS
ENDNo
Yes
Does it exist any element that could provoke dominance?
Individual dominance Collective dominance
Does it exist dominant position?
Yes No
Does it exist individual dominance?
Does it exist collective dominance?Yes No
REGULATION IS A MUST
Is it enough with Competition Law?
ENDNoYes
No
Competence is due to current regulation?
No
Yes
Does it exist effective competition?
Yes
When to regulate?
32

5.Regulatory analysis.
• In reality, competition is focusing on some areas inevery country !!
• Geographic markets should not be considered exceptionsin fixed and mobile telecommunications:
• narrowband access markets as well as broadbandaccess markets are likely to show very often thefeatures of geographic markets.
Regarding NGA (Next GenerationAccess), geography does matter:
• state and age of existingnetwork infrastructure,• length of local loop,• population density andstructure of the housing market,• Others (distribution ofusers,…)
In Spain, broadband marketshows very heterogeneouscompetitive conditions, existinghigher competition in areaswhere several types ofinfrastructures provide severalbroadband services: socio-demographic and economicconditions in different regions.
Source: CMT
Example: Spain
Regulation based on geographical situation
33

5. Regulatory analysis.
• NGN costs should be lower and lessdependent on traffic volumes.
• NGN features create fundamental problemsif we wish to cost an individual service for“cost-based wholesale price” remedies
• There is a great deal of uncertainty aboutthe applications that will need to be supportedand hence the optimum design anddeployment of Next Generation AccessNetworks (NGAs)
• Data services dominate voice trafficvolumes contributing to an increase of datarevenues in the operators accountings.
• Different types and speeds of NGA roll-outlead in turn to uncertainties for the designand dimensioning of the aggregation andcore IP transport and optical networks, andthus for cost allocation
NGN will change the operators costs structure
34

5. Regulatory analysis
• The main barriers of FTTC /FTTB and FTTH are civil engineering cost (horizontal barrier), in-house wiring (vertical barrier), co-location at the street cabinet, and backhaul between the Street Cabinet and the operators’ networks.
Resale
Bitstream
Shared /full MDF unbundling
FTTH/FTTC)
Investments related to the kind of competition
35

5. Regulatory analysis.
Some operators have decided to share their networks under several options in order to reduce their opex and capex: site sharing, RAN sharing and backhaul sharing
Source: Analysis Mason
Sharing passive and active infrastructures
36

5. Regulatory analysis.
Expenditures breakdown:
Capex:
37% buildings and materials, 31% power, 15% BTS or Node B, 6% backhaul, 11% other
Opex: 20% electricity, 20% hw and sw, 15% land rent, 14% backhaul, 31% other
Another driver could be to extent coverage into rural areas,
Source: Analysis Mason
Comparison of the network economics of legacy and LTE networks
Mobile networks: cost reduction by sharing infrastructures
The main driver to share networks is reducing network costs that represents one-third of total expenditure.
37

5. Regulatory analysis.
ACCESSNETWORK
• Already shared access costs cannot be sensibly/easily split into services• “Customer dependent costs” are mixed with traffic dependent costs and co-exist in the access network or even at customer premises• Copper local loop is no longer a clear demarcation:
– Even in traditional networks, the definitions have been a problem with some “arbitrary” allocations of nodes from access to core
• Traditional definitions (often in directives or law) cannot be easily applied• NGN access seems to be the enduring bottleneck
• Services share the same network – in the past each had their own dedicated network (and costs). A large amount of costs are fixed/common to many services• In the past shared systems’ cost could be split based on technical and economic factors that were generally agreed on and based on good cost driver logic• NGN services are delivered by application severs - more separate from the networks• Service providers should be able to configure the network (say QoS – speed, priority) to suit the service
CORENETWORK
NGN are facing different assessments to traditional remedies or regulatory strategies, taking into account the relationship between services and networks.
Regulatory Requirements for NGNs: a new approach
38

5. Regulatory analysis
• A Minimal intervention principle
• Wholesale regulation
• To incentive investment andinnovation
• Regulation applied to emergingmarkets
• Regulation must no disturbcompetition
• Ex-ante policies proportional tothe market situation
RETAIL
Broadband access
WHOLESALE
Effective competitionWithout ex-ante regulation ?
• No regulation
LLU /Bitstream markets
Effective competition due to ULL regulation?
• LLU Regulation
• No regulation of indirect access
Yes
Yes
• LLU Regulation
• Bitstream Regulation
NO
NO
Regulation at wholesale or retail level?
39

5. Regulatory analysis
• Functional separation requires dominant operators to separate , but not sell, their networkinfrastructure from their retail service division
• The separated network business provides the same services to the rest of incumbents’ retailbusiness as to the alternative operators.
.
Customers
ServiceCo1 ServiceCo2
InfraCo
Regulated company
Functional separation as an alternative option to open market
Functional separation – some examples:
Great Britain - Open Reach
New Zeland - Chorus
Sweeden - Skanova Access
Italy – Open access
40
5. Regulatory analysis.
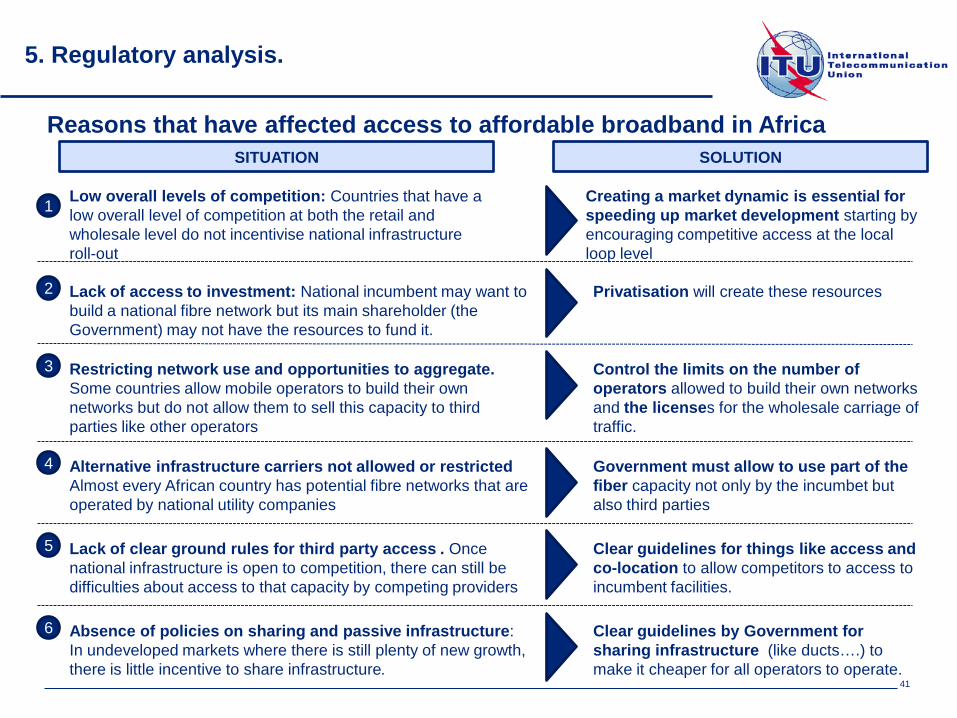
Low overall levels of competition: Countries that have a low overall level of competition at both the retail and wholesale level do not incentivise national infrastructure roll-out
Reasons that have affected access to affordable broadband in Africa
1 Creating a market dynamic is essential for speeding up market development starting by encouraging competitive access at the local loop level
Lack of access to investment: National incumbent may want to build a national fibre network but its main shareholder (the Government) may not have the resources to fund it.
2 Privatisation will create these resources
Restricting network use and opportunities to aggregate. Some countries allow mobile operators to build their own networks but do not allow them to sell this capacity to third parties like other operators
3 Control the limits on the number of operators allowed to build their own networks and the licenses for the wholesale carriage of traffic.
Alternative infrastructure carriers not allowed or restricted Almost every African country has potential fibre networks that are operated by national utility companies
4 Government must allow to use part of the fiber capacity not only by the incumbet but also third parties
SITUATION SOLUTION
Lack of clear ground rules for third party access . Once national infrastructure is open to competition, there can still be difficulties about access to that capacity by competing providers
5 Clear guidelines for things like access and co-location to allow competitors to access to incumbent facilities.
Absence of policies on sharing and passive infrastructure: In undeveloped markets where there is still plenty of new growth, there is little incentive to share infrastructure.
6 Clear guidelines by Government for sharing infrastructure (like ducts….) to make it cheaper for all operators to operate.
41

5. Regulatory analysis.
Policy and market interventions in Africa
COMMERCIAL INFRASTRUCTURE SHARING
ENCOURAGING THIRD PARTY PROVIDERS
Sharing passive infrastructure through building ducts: South Africa MTN, Neotel and Vodacom came together inMarch 2009 to build a 5,000 kms network costing between R1.7 – 2 billion to compete with the existing one provided bythe incumbent Telkom
Sharing passive and active infrastructure: In Uganda, Orange is sharing both active and passive parts of the Waridnetwork (now taken over by Essar) and in Kenya Yu (the Essar brand) is sharing network with the second largestoperator in the country Zain (now taken over by Bharti Airtel)
With ARPUs declining, similar pressures are forcing operators to look at ways of sharing other parts ofinfrastructure through third party providers. Independent companies either purchase or build towers for mobileoperators that they then lease to them.
Three categories of third party providers are worth highlighting as all encourage both the spread of national telecomnetworks and act to provide effective price competition. These are:
1) carriers’ carriers, provide wholesale capacity for other operators. Ex: Phase3 Telecom and Suburban Telecom inWest Africa; Kenya Data Networks in East Africa; and Liquid Africa (owned by Econet) in Southern Africa
2) alternative infrastructure operators, usually utilities or parastatals. Ex: electricity, gas and water companies,railways and oil companies.
3) dark fibre operators. Ex: In South Africa, there is a company called Dark Fibre Africa that does exactly that.42

Contents
1. Introduction
2. Trends and challenges
5. Regulatory analysis
7. Benchmark: Spain and Nigeria
8. Summary and conclusions
6. Pricing: cost modeling
3. Broadband Plans: USA, Europe and Spain
4. Broadband in Africa
43

6.Pricing: Cost modeling
Costing methods for traditional networks show some difficulties:
Issues to be considered for NGN cost modeling
However, there are some basic obstacles to doing cost modeling based on operator accounts(“top-down”). Suitable historic accounts for a top-down modeling approach will almost certainlynot exist for services such as IPTV.
1
2
Considering modeling future years, a number of issues arise:
NGN services share the same network components. The cost driver to each service is notas clear as PSTN (Service routing table more difficult)
3
Traffic volumes are uncertain across the range of traffic types, and likely to grow much more rapidly than in the past PSTN environment :
The rate and dimensioning of future investments, perhaps to cope with rapid traffic mixchanges can only be estimated
The problem is not how to make an NGN cost model but also how to get a service-costingallocation scheme with a rationale economic and following technical and commercial reality
Models based on traditional “cost drivers” are difficult because costs for some services willbe too low and others too high and not aligned with current market revenue trends
44

Assets, working capital and operational costs
• A functioning network incurs operational costs. Both capital and operational costs must be recovered. Inaddition to the fixed assets, some working capital is required – net assets less net liabilities. This requiresan additional investment that should be allowed for.
Annualisation methodologies
• Annualisation charges are calculated on capital investment as the sum of the cost of capital, anddepreciation. The effective annual cost of the investment is required to define the revenue needed toprovide for the replacement of the investment (asset) and to allow a fair return on the investment (profit).
Cost of capital (WACC)
• It provides a fair return on the asset investment. If it is correctly defined, it allows sufficient return toaccount for the risks of the associated telecoms market
Routing factors:
• Specify, for each type of service, the average use made of each type of network element
Others
Bottom up models - LRIC Top down models
6.Pricing: Cost modeling
Key financial parameters to be considered using cost models
45

6.Pricing: Cost modeling
•The Bottom-Up model shall beused as part of a process tovalidate and reconcile resultsobtained from the Top-Downmodel to achieve fairlydetermined LRIC estimates forkey wholesale services
• The Bottom-Up models may beupdated periodically and used tocompare with updated versions ofthe Top-Down models.
The main parts of the model are:
Bottom up - LRIC
1
2
Calculating network elements
Estimating demand anddetermining input unit costsBuilding an hypothetical network
3
Determining the cost of network elements
4
Calculating Cost services 5
46

6.Pricing: Cost modeling: Top down
• Since LRIC is a forward-lookingconcept, current cost accounting(CCA) principles have to be used toestimate the appropriate Gross value ofassets (an annualisation method hasto be defined) . This involves re-valuing assets on the basis of thereplacement cost of the modernequivalent asset (MEA).
• Under top down models and usingFDC (Full Distributed costs) youhave a first draft to calculate assetrevaluation by using historical costaccounting
• Cost-volume relationships (CVRs)show the way in which costs change inrelation to a change in the volumes ofthe service provided.
• Average cost of capital (WACC) is akey element of this model
Top down accounting
47

6.Pricing: Cost modeling
48
Reconciliation process: Top down vs bottom up
48

6.Pricing: Cost modeling
Real options: Cost models based on real options theory could fit with this capital intensive markets
• Traditional regulatory practice evaluates investments according to the well-established net presentvalue theory
• In economy, “real option” is the term given to the possibility to modify a project, and it is reallyuseful with investment decisions made under uncertainty:
• The investment is partially or completely irreversible.• There is uncertainty over the future rewards from investment.• Investors usually have some leeway about the timing of their investments
Traditional models based on the net present value rule assume that investment iseither reversible or is a “now or never proposition”, so it does not model the valuethat might be associated with the choice of using different timing strategies.
From a financial point of view, pricing cost oriented implies that Net Present Value (NPV)is equal to zero.
49

6.Pricing: Cost modeling
Value of “waiting” option
• Investment at t=0: NPV = 0 estimated accessvalue price” p0”
• Investment at t=1: NPV(p0)>0. In this case,when sunk costs exists, there is some uncertaintyregarding future cash flows and you can have thepossibility to wait, and unlike rational investor thatinvest at t=0, the “wait price” is different fromNPV =0
Distortion generated without including “waiting” value
• Competitor , that taking into account uncertainty andthe access price p0 (NPV =0) wants to rentinfrastructure from incumbent at t t=0,and enter intothe market at t=1.
• Investment at t=1: NPV(p1)>0 and p1<p0, could fix alower price (p1) than p0, whereas that using p1incumbent would have NPV<0. In this case, regulationwould provoke some advantage to the entrantdisturbing the competence.
• The rule to fix prices should be the one that do not create “waiting value”. Prices which do not disturb competence are not sensible to invest at the moment t=0 or at t=1;
1 T=4: NPV(p4)=0, estimation of “p4”
1 T=3: NPV (p3)=0, estimation of “p3”
1 T=2: NPV (p2)=0, estimation of “p2”
1 T=1: NPV (p1)=0, estimation of “p1”
Investing at t=0? p4>p3>p2>p1>p0
How to calculate access prices using real option theory
50

Contents
1. Introduction
2. Trends and challenges
5. Regulatory analysis
7. Benchmark: Spain and Nigeria
8. Summary and conclusions
6. Pricing: cost modeling
3. Broadband Plans: USA, Europe and Spain
4. Broadband in Africa
51

7.Benchmark
Several fixed and mobile operators (Telefónica, Vodafone, Orange, Jazztel and ONO) are leadingthe deployment of fiber network in Spain
Source: Analysis Mason
Spain
52

• In general terms, OLOS have decided to base theirs business models onLocal Loop Unbundling (LLU) as a mechanism to be different from otheroperators. But, growing presence of some operators in exchanges where onlytraditional SMP operator was, has created an aggressive competence and alarge variety of services .
• Differentiation through LLU has helped packet services appearance
• LLU, like cable technology, is focused on certain areas with special socialand economic conditions . SMP operators are losing market power in thatregions
Competence based on Infrastructures
Competence based on services
Spain
7.Benchmark
53

Market, competition and regulatory conditions could make fibre an opportunity for new entrant with manageable risks
• B2C* demand is increasing due to the growing penetration of high-bandwidth services (non-linear TV, fixed and mobile broadband) as well as growing capacity requirements for these services
• B2B** demand is also experiencing significant growth, with increasing needs for more mobile backhaul capacity and FTTx deployments in urban areas
Backbone and aggregation – the majority is under the control of several electric companies, which provide services directly to retail operators
• Access – Telefonica is the only operator with enough funds to deploy an FTTx network; cable operators will deploy DOCSYS 3.0 in selected areas; whereas the high investments required would make it difficult for LLU operators toenter this market
Remedies in Market 4, including access to Telefonica’s ducts, provide a workable environment. Proactivelobbying with the CMT would improve the investment case
• The European Commission and the Spanish authorities view the deployment of high-speed fibre as a strategicobjective, which could entail the allocation of public funding
• The business case is clearly more attractive in the most densely populated areas where key potential clients are already present through LLU
• At a later stage, the potential in other areas could be examined on a case-by case basis depending on the economics
• The business case is clearly more attractive in the most densely populated areas where key potential clients are already present through LLU
• At a later stage, the potential in other areas could be examined on a case-by case basis depending on the economics
Growing demand
Limited competition
Positive regulation
Geographic scope
Manageable risks
7.BenchmarkSpain
Source: Analysis Mason 54

Spain
The CMT has imposed useful regulation in Markets 4and 5 with the aim to create a favourable regulatory environmentfor investment in FTTH by:
• mandating open access to fibre networks in buildings:the operator which first cables a building needs to provide access to competitors
• mandating access to Telefonica’s ducts for the deployment of FTTH and HFC-based NGA networks, as well as for mobile backhaul
Spanish regulation
• The objective of state-aid control is to ensure that these measures will lead to higher broadband coverage and penetration, or in a more timely manner than would otherwise occur without the aid
• The European Commission recently announced its endorsement of almost EUR300 million of public funding to support the deployment of broadband networks from September 2010. It also announced its intention to award up to EUR1 billion to improve broadband coverage in rural areas
Public funding
According to the CMT approach, it makes a workable framework:
• the same Telefonica’s local exchanges specified in the OBA are also open for the use by other operators of Telefonica’s ducts• the prices have been set at levels that may allow a business case to be successful• Some lobbying could be beneficial to clarify some grey areas left in the MARCo such as actual available duct capacity, SLAs, simultaneous deployment of several fiber cables, etc.
• It is key to identify the three different types of area: white (no NGA network in three years), grey (one single NGA network in three years) and black (two or more NGA networks in three years):• currently it is difficult to envisage that more than25% of the population will live in black areas by 2012 (limited deployment by Telefonica)• The safest bet is to target white areas, although a new operator could try and build a case by arguing that it could build a more open NGA network, with effective wholesale products (including fibre unbundling) in grey areas
Assessment of Spanish regulation
Assessment of regulation for public funding
A favourable regulatory environment benefits the deployment of fibre networks, potentially with public funding
7.Benchmark
Source: Analysis Mason 55

Nigeria
7.Benchmark
Source: Analysis Mason
Broadband in Nigeria is already mobile – and with positive policy action can enhance Nigeria’sGDP by over 1% in 2015
With almost non-existent wireline services, broadband in Nigeria is driven by wireless accesstechnologies
• Fixed network infrastructure is very limited outsideLagos
• State-owned incumbent Nitel has undergoneturbulent privatisations, nationalisations andmanagement changes in the last ten years
• Subscribers to its fixed service, and to mobiledivision M-Tel‟s mobile service, have been indecline over this period despite huge market growth
• Wireless broadband (currently offered using UMTS,HSPA, WiMAX and EVDO networks) is critical toseizing the opportunity presented by Internet anddata access in Nigeria
56

Nigeria
7.Benchmark
Source: Analysis Mason
Mobile broadband services using HSPA and LTE are expected to continue to drive increasedbroadband reach
CDMA mobile broadband networks were first tolaunch, while 3G (UMTS) licenses were onlyawarded in April 2007
Mobile broadband has created momentum inthe broadband market, despite HSPA only beinglaunched in 2008:
• Mobile broadband subscribers nowaccount for over half of all high speedinternet service users
• By Q4 2010, it was estimated that mobilebroadband connections in Nigeria numberedjust under 600 thousand
• By the end of 2011, UMTS/HSPA/LTEshare of subscribers is expected to behigher than CDMA, which is likely to remainconfined to major towns
57

Nigeria
7.Benchmark
Source: Analysis Mason
The Nigerian Communications Commission (NCC) has generally used effective, proportionateregulation
• While local loop unbundling is in place, the poorstate of incumbent Nitel‟s infrastructure means thatit is not used
• NCC has recognized the importance of facilitatingmarket provision of broadband, particularly throughaccess to spectrum
• NCC has used auctions to award GSM licenses(2001), the second national operator license (2002),3G licenses (2007) and CDMA and fixed wirelesslicenses
• However there are spectrum issues emerging thatcould jeopardize mobile broadband growth:
There is a lack of clarity over when the vital DigitalDividend spectrum will be passed to the NCC for useby mobile broadband, which could dramaticallyincrease mobile broadband coverage
58

Nigeria
7.Benchmark
Source: Analysis Mason
NCC administers several ICT initiatives
59

Contents
1. Introduction
2. Trends and challenges
5. Regulatory analysis
7. Benchmark: Spain and Nigeria
8. Summary and conclusions
6. Pricing: cost modeling
3. Broadband Plans: USA, Europe and Spain
4. Broadband in Africa
60

8. Summary and conclusions.
1. No homogeneous competence conditions. Depending on the geography and economic conditions , competencebased on infrastructures or on services is applied.
2. Different access alternatives, like LLU or mobile broadband, must be taken into account in order to analyzemarkets and define ex-ante obligations.
3. Next Generation Networks (NGN) investments open the discussion related to the remuneration of the riskassumed by operators to deploy the networks.
Traditional weighted average cost of capital (wacc) vs real options
4. Calculating NGN pricing face some difficulties compared with traditional networks and services: LRIC models -bottom up vs top down
5. A new investment cycle bring us new models to be considered: real options
6. New cost reduction strategies (sharing passive or active infrastructures) for mobile operators will become akey driver to analyze competitive markets considering incumbents and new entrants
7. Take into consideration geographical areas is crucial, from a regulatory point of view, in order to provideproportionate obligations.
8. Spectrum availability ( Digital Dividend) for mobile services could bring new opportunities for rural areas
9. Public Private Partnership could bring us a solution for providing broadband services under capital intensivemarkets: fiber networks deployments,….
61

David Bernal Cantero
Regional Seminar on Costs and Tariffs for Member Countries of the Regional Group for
Africa (SG3RG-AFR)
62