Embed Size (px)
Citation preview

CSC(82)RT-267 1
CSC 82
Commonwealth Science Council
Regional RuralTechnology ProgrammeReport of the Regional Workshop on
Rural Drinking Water Supply10-13 May 1982, Madras, India
Commonwealth Secretariat

CSC(82)RT-26
COMMONWEALTH REGIONAL (ASIA/PACIFIC)RURAL TECHNOLOGY PROGRAMME
Report of the Regional Workshop onRURAL DRINKING WATER SUPPLY10 - 13 May 1982, Madras, India
COMMONWEALTH SCIENCE COUNCIL NATIONAL ENVIRONMENTALMARLBOROUGH HOUSE ENGINEERING RESEARCH INSTITUTEPALL MALL NAGPUR 440 020LONDON SW1Y 5HX INDIA
SEPTEMBER 1982

CONTENTS Page
Introduction v
Programme and Participation v
Opening Session v
Country Papers vi
Technical Papers vi
ANNEXES
1 Programme 1
2 List of Participants 3
3 Welcome address by Shri K N Johry 5
4 India Country Report :
a) Water Supply and Sanitation Decade - an Overview 7
b) International Water Supply and Sanitation Decade -
Global Status 21
5 Seychelles Country Report 25
6 Papua New Guinea Report 29
7 Technology Choice for Rural Water Supply 33
8 Rural Water Supply Systems in Tamil Nadu 43
9 Package Treatment Plants - An Effective Tool for
Rural Water Supply 49
10 Package Plants for Rural Water Supply 61
11 Slow Sand Filtration for Rural Water Supplies:
a) Slow Sand Filters for Safe-Water in-Rural Areas 69b) Slow Sand Filtration - Appropriate technology
for Safe Water 75te lAV 1 2 Community Education and Participation in Water Supply
"><* and Sanitation 99
13 Planning Considerations in Rural Water Supply Systems 103
AL 14 Ground Water Extraction and Supply 113
15 Role of Solar Distillation in Rural Water Supply 119

1.0 Introduction
The Commonwealth Science Council Rural Technology Programme has ten projectsconcerned with aspects of rural development in the Asia/Pacific Region. Oneproject is concerned particularly with the problems of rural water supply.The project, which involves Bangladesh, India, Papua New Guinea and Seychellesis being coordinated by the Seychelles. Its objective is to identify, furtherdevelop (if necessary) and disseminate improved, low cost water purifyingtechnologies suitable for application in small villages in rural areas.
The project was established in 1978 and it has proved a very useful forum forinformation exchange in the region. With the advent of UN International DrinkingWater Supply and Sanitation Decade it was decided that the project should befurther developed.
A workshop was therefore convened in Madras on May 10 - 13 1982 with the objectivesof:
- exchanging information on the current situation in the participating countries
- examining available technologies for water purification in rural areas
- identifying technologies suitable for transfer to rural areas
- selecting technologies requiring further research and development and
drawing up a programme of follow-up activities
2.0 Programme and Participation
A programme for the workshop is attached (Annex 1). After the opening session
country papers were presented. Technical sessions then focused on the variousmethods available.. The final day was devoted to discussions on follow-upactivities.
The workshop was attended by 23 participants (Annex 2 ) from Papua New Guinea,Seychelles, Sri Lanka and India. In addition the workshop was attended by arepresentative from the WHO International Reference Centre for Water Supplyand Sanitation.
3.0 Opening Session
The four-day regional workshop during May 10-13 on 'Rural Drinking Water Supply1
organized jointly by the National Environmental Engineering Research Institute,(NEERI) Nagpur and the Commonwealth Science Council, with financial support fromCommonwealth Fund for Technical Cooperation, was inaugurated by Shri A K Aranganathan,Chairman, Tamil Nadu Water Supply and Drainage Board on May 10, 1982 at Madras.Twenty-three participants from India, Sri Lanka, Papua New Guinea and Seychelleswere present.
Shri C Ponnaiyyan, Minister for Cooperation and Law, Government of Tamil Nadupresiding over the function emphasisised the need for developing a low cost andefficient system of pumping water from deep borewells to ensure uninterruptedsupply of safe drinking water in rural areas „
Dr B B Sundaresan, Director, NEERI, underlined the need for formulating viableprojects for India and other developing countries during the 'InternationalWater Supply and Sanitation Decade 1981-1990'. CSC offered a forum for exchangeof information on technologies in the area of water supply which could be effec-tively utilised through this workshop.
Shri K N Johry, Head, International Scientific Collaboration, CSIR welcomed(Annex 3) the participants on behalf of CSC and said that the workshop wasbeing held in India so that the participating countries could gain from theIndian experience in the field of Slow Sand Filtration,, He said that National

laboratories of CSIR are making useful contribution in developing low costrural technology. He then went on to explain the history of the CSC RuralTechnology Programme and described some of the highlights from the otherprojects,,
4.0 Country Papers
The Indian country paper was presented by Dr Sundaresan (Annex 4)In it he focused on India's preparation and commitment to the InternationalDecade for Drinking Water Supply and Sanitation. In particular he describedthe extensive study that has been undertaken into the status of rural watersupply in India which involved information gathering at all levels from govern-ment to the individuals living in villages. From this study and others a pro-gramme for the decade had been evolved and was now bieng implemented,
Mr S Rosseau presented the Seychelles paper (Annex 5). He described theorganization of water supply in the country, its current status and plans forthe Drinking Water Decade. He then outlined the Seychelles experience with avariety of water treatment technologies, ceramic pressure candles, pressurefilters, slow sand filters and rapid gravity filters. He closed by identifyingpotential topics for regional collaboration.
In Papua New Guinea (Annex 6) water supply has tended to receive a low prioritybecause of plentiful supplies of water from rainfall. However a number ofagencies are now involved including UNICEF and the Asian Development Bank.In addition the Appropriate Technology Development Unit and Local GovernmentTechnical Service have been examining some technologies. When systems had beeninstalled upkeep and maintenance often proved a problem and it was recognisedthat there was a considerable need to train villagers in the value of watersupply and the need for its maintenance.
5.0 Technical Papers
The paper 'Technology Choice for Rural Water Supply' (Annex 7) examined the factorsto be considered in designing rural water supply systems. Among the topics to beexamined are:
i) Accessibility -taps in every house are ideal but costs dictatecheaper solutions such as public stand pipes or wells
ii) Water quality standards - the ideal is 100% safe water but againeconomics frequently dicate acceptance of lower levels of purity
iii) Source - the best available source should always be chosen bearing inmind distribution costs and level of pollution
iv) Method of purification to be used eg pot chlorination, iron removal,defluoridation, slow sand filtration etc,
The paper examined the various sources available and also described the meansof purification available for village and individual household applications.
The experience of provision of water in rural areas of Tamil Nadu was describedin the following paper (Annex 8), The problems of the state were describedand the method used to classify village needs was explained. Depending on theneeds and size of the village a standard 'package' is then installed taking intoaccount the likely growth of the village. The importance of village levelparticipation was stressed and the various arrangements to ensure pump repairdescribed.
The next paper (Annex 9) described the design and operation of simple packagetreatment plans for the removal of iron and fluoride from rural water supplies.These materials are common contaminants in many water supplies and pose aconsiderable problem. The iron removal plant relies on the aeration of the waterfollowed by filtration to remove precipitated iron. The fluoride removal plant

involves dosing with alum and lime followed by filtration. The iron removalplant is available in a number of different designs.
A paper on package plants for rural water supply was presented by scientistsfrom NEERI (Annex 10). The merits of such plants were assessed and then plantsavailable in India were described; they included pressuiefilters, package slow-sand filters and multi-inlet/multi-outlet filters. Current work at NEERI wasalso described, in particular a new, simple unit offering chemical dosing,flocculation, clarification and fibration.
The merits of slow sand filters were described in another paper from NEERIAnnex 11 a). The construction and operation of the filter was described andits suitablility to rural applications stressed. Various modifications toreduce costs were described and then the results of a number of demonstrationprojects explained. The success of these demonstration projects was related tothe personnel involved and the importance attached to health education and communityparticipation.
More work on slow sand filters was described in a paper from the InternationalReference Centre for Community Water Supply and Sanitation of the World HealthOrganization (Annex lib),, The basic technology was described and then it wasexplained how this was adapted to suit local needs and how local communitiesbecame involved in the operation of the plants.
The next paper (Annex 12) examined this aspect in greater detail by describingthe results of a number of demonstration projects installed by NEERI. In thisproject villages receiving slow and filters were surveyed and based on theresults of the survery on educational strategy evolved. This strategy was thenimplemented
The results achieved were reported to be very favourable and considerableimprovements in health standards had been measured. For example parasite infectionhad dropped from 70% to 50% in 6 years. One of the reasons for this success wasidentified as the degree of local involvement that had been established in boththe construction and operation of the water supply system.
The following paper (Annex 13) examined in detail the needs of the distributionsystem to be connected to the purified water supply. Three options are commonlyavailable, public stand pipes, distribution reservoirs with taps, and houseconnection?. The advantages and disadvantages of each were considered and thedesign parameters to be used were outlined. The paper closed with a considerationof means of revenue collection and a discussion on the importance of communityparticipation.
vii
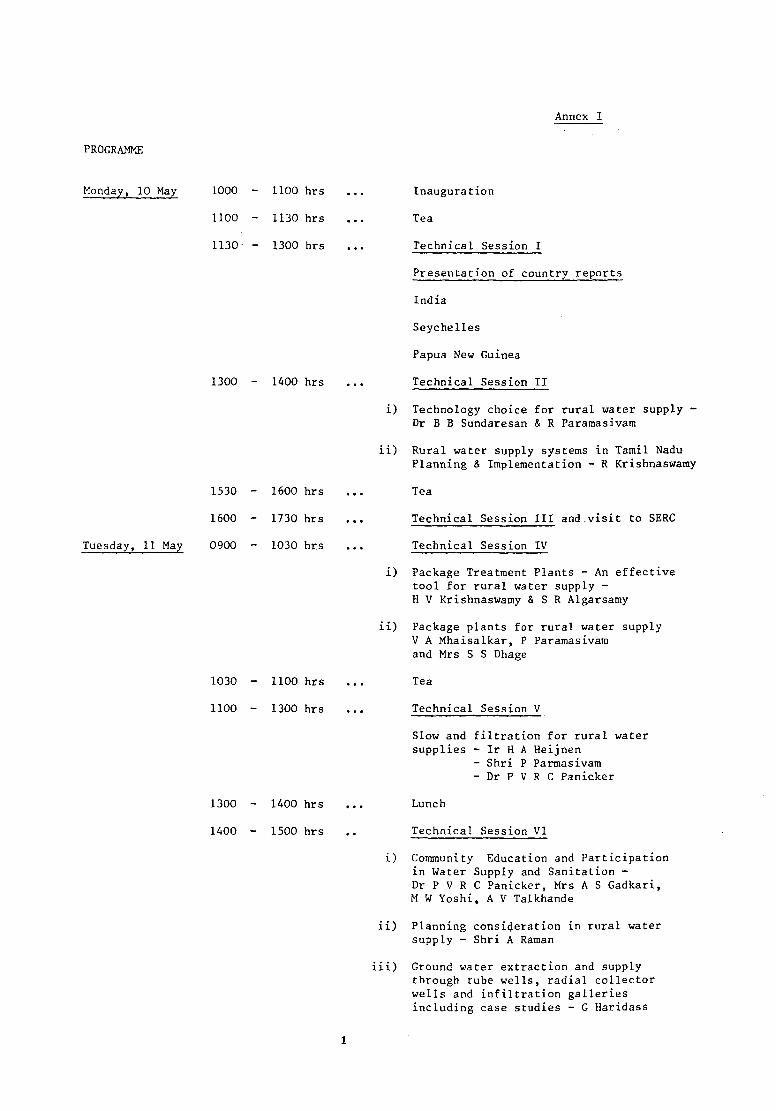
Annex I
PROGRAMME
Monday, 10 May 1000 -
1100 -
1130- -
1300 -
1100 hrs
1130 hrs
1300 hrs
1A00 hrs
Inauguration
Tea
Technical Session I
Presentation of country reports
India
Seychelles
Papua New Guinea
Technical Session II
1530
1600
Tuesday, 11 May 0900
1030
1100
1300
1400
i) Technology choice for rural water supply -Dr B B Sundaresan & R Paramasivam
ii) Rural water supply systems in Tamil Nadu
Planning & Implementation - R Krishnaswamy
1600 hrs ... Tea
1730 hrs ... Technical Session III and.visit to SERC
1030 hrs ... Technical Session IV
i) Package Treatment Plants - An effectivetool for rural water supply -H V Krishnaswamy & S R Algarsamy
ii) Package plants for rural water supplyV A Mhaisalkar, P Paramasivamand Mrs S S Dhage
1100 hrs ... Tea
1300 hrs ... Technical Session V
Slow and filtration for rural watersupplies - Ir H A Heijnen
- Shri P Parmasivam- Dr P V R C Panicker
1400 hrs ... Lunch
1500 hrs .. Technical Session VI
i) Community Education and Participationin Water Supply and Sanitation -Dr P V R C Panicker, Mrs A S Gadkari,M W Yoshi, A V Talkhande
ii) Planning consideration in rural watersupply - Shri A Raman
iii) Ground water extraction and supplythrough tube wells, radial collectorwells and infiltration galleriesincluding case studies - G Haridass

Tuesday, 11 Maycont'd
1530 - 1630 hrs Technical Session Vll
{) Role of Splar Distrillation in RuralWater Supply - Dr R Pitchai andShri T Damodara Rao
ii) Highlights of field visits TWAD
Wednesday, 12 May Field Visits
Thursday, 13 May
0900 -
1030 T-
1100 -
1230 -
U00 -r
1030
1100
1230
1400
1530
hrs
hrs
hrs
hrs
hrs
Technical Session Vlll
Identification of Areas for RegionalCooperation & Project Fprmulation
Tea
Adoption of Reconpiendations
Lunch
Concluding Session

Annex 2
REGIONAL WORKSHOP ON RURAL DRINKING WATER SUPPLY
LIST OF PARTICIPANTS
Mr W GuthrieLocal Government SectionDepartment of Works & SuppliesP 0 Box 1108BorokoPAPUA NEW GUINEA
Mr S RousseauWater EngineerDepartment of WorksMinistry of Planning and DevelopmentP 0 Box 53Unity HouseSEYCHELLES
Mr M A T de SilvaAssistant Secretary GeneralNational Science Council47/5 Maitland PlaceColombo 7SRI LANKA
Mr Ir Han A HeijnenProject Manager (SSF)WHO International ReferenceCentre (IRC) for CommunityWater Supply & SanitationP 0 Box 5500H M RijswijkTHE NETHERLANDS
Shri K N JohryHead (International ScientificCollaboration Unit)Council of Scientific andIndustrial Research
Rafi MargNew Delhi 110 001INDIA
Dr B B SundaresanDirectorNational Environmental EngineeringResearch Institute (NEERI)
Nagpur 440 020INDIA
Shri R ParamasivamScientist & HeadWater Engineering DivisionNational Environmental EngineeringResearch Institute
Nagpur 440 020INDIA
Shri V A MhaisalkarScientistWater Engineering DivisionNational Environmental EngineeringResearch Institute
Nagpur 400 020INDIA
Dr P V R C PanickerScientist & HeadEpidemiology CellNational Environmental EngineeringResearch Institute
Nagpur 440 020INDIA
Shri A RamanScientist & HeadNEERI Delhi Zonal LaboratoryChandrawal Water WorksShamnath MargNew Delhi 110 054INDIA
Dr M MariappanScientist & HeadNEERI Madras Zonal LaboratoryCSIR ComplexMadras 600 113INDIA
Dr M RamaiahCoordinating Director & Director (SERC)CSIR ComplexMadras 600 113INDIA
Shri R KrishnaswamyChief Engineer (General)Tamil Nadu Water Supply & Drainage BoardTWAD House31 Kamaraj SalaiMadras 600 005INDIA
Shri A PonnambalamChief Engineer (Urban)TWAD Board31 Kamaraj SalaiMadras 600 005INDIA
Shri S A JagadeesanSuperintending Engineer(Project Formulation)TWAD BoardTWAD House31 Kamaraj SalaiMadras 600 005INDIA
Shri G HaridassExecutive Engineer(Research Division)TWAD BoardTWAD House31 Kamaraj SalaiMadras 600 005INDIA

Shri H V KrishnaswamyGeneral ManagerRichardson & Cruddas (1972) Ltd25 Rajaji SalaiMadras 600 001INDIA
Shri S R AlagarcamyJoint ManagerRichardson & Cruddas (1972) Ltd23 Rajaji SplaiMadras 600 001INDIA
Dr R PitchaiDirector & ProfessorCentre for Environmental StudiesAnna University of TechnologyGuindyMadras 600 025INDIA
Shri T Damodara RaoVisiting FacultyCentre for Environmental StudiesAnna University of TechnologyGuindyMadras 60Q 025INDIA
Dr R GuruswamyAssistant ProfessorCollege of Engineering (AUT)GuindyMadras 600 025INDIA
Shri A K MuddugalV./s Richardson & Cruddas (1972) Ltd23 Rajaji SalaiMadras 600 001INDIA
Shri A J GriffithProject OfficerUNICEFRavindra MansionDinsha Vachha RoadBombay 400 020INDIA
Annex 3
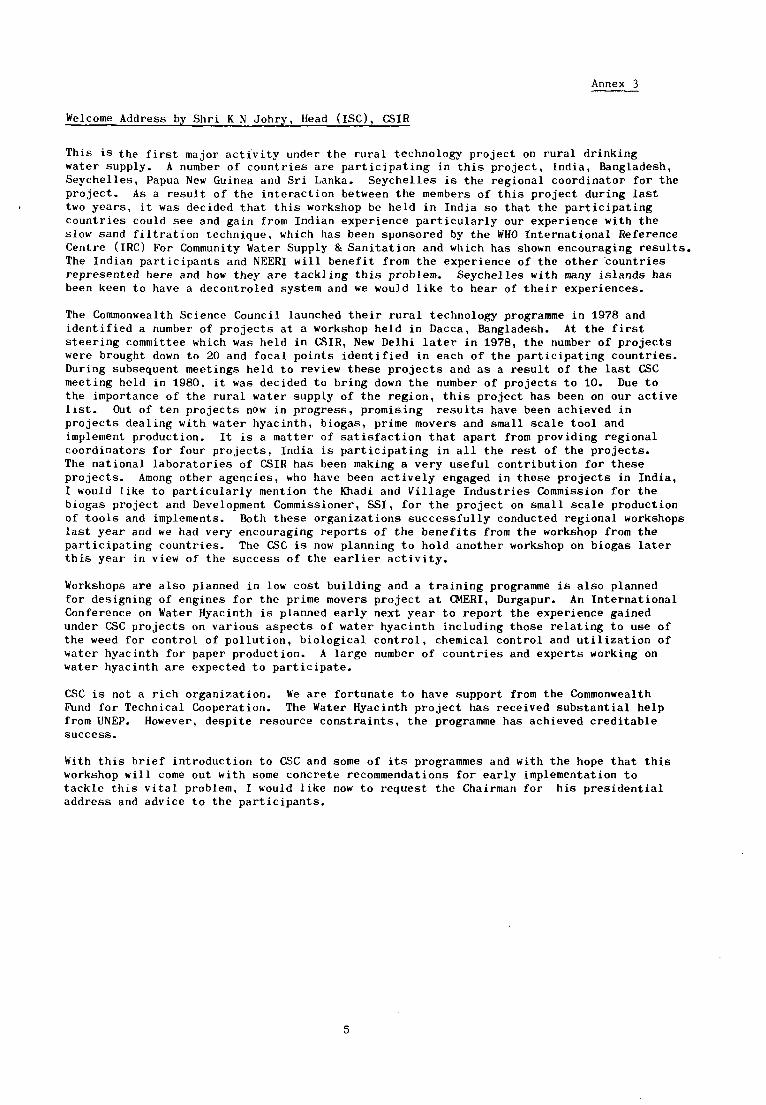
Welcome Address by Shri K N Johry, Head (ISC), CSIR
This is the first major activity under the rural technology project on rural drinkingwater supply. A number of countries are participating in this project, India, Bangladesh,Seychelles, Papua New Guinea and Sri Lanka. Seychelles is the regional coordinator for theproject. As a result of the interaction between the members of this project during lasttwo years, it was decided that this workshop be held in India so that the participatingcountries could see and gain from Indian experience particularly our experience with theslow sand filtration technique, which has been sponsored by the WHO International ReferenceCentre (IRC) For Community Water Supply & Sanitation and which has shown encouraging results.The Indian participants and NEER1 will benefit from the experience of the other countriesrepresented here and how they are tackling this problem. Seychelles with many islands hasbeen keen to have a decontroled system and we would like to hear of their experiences.
The Commonwealth Science Council launched their rural technology programme in 1978 andidentified a number of projects at a workshop held in Dacca, Bangladesh. At the firststeering committee which was held in CSIR, New Delhi later in 1978, the number of projectswere brought down to 20 and focal points identified in each of the participating countries.During subsequent meetings held to review these projects and as a result of the last CSCmeeting held in 1980, it was decided to bring down the number of projects to 10. Due tothe importance of the rural water supply of the region, this project has been on our activelist. Out of ten projects now in progress, promising results have been achieved inprojects dealing with water hyacinth, biogas, prime movers and small scale tool andimplement production. It is a matter of satisfaction that apart from providing regionalcoordinators for four projects, India is participating in all the rest of the projects.The national laboratories of CSIR has been making a very useful contribution for theseprojects. Among other agencies, who have been actively engaged in these projects in India,I would like to particularly mention the Khadi and Village Industries Commission for thebiogas project and Development Commissioner, SSI, for the project on small scale productionof tools and implements. Both these organizations successfully conducted regional workshopslast year and we had very encouraging reports of the benefits from the workshop from theparticipating countries. The CSC is now planning to hold another workshop on biogas laterthis year in view of the success of the earlier activity.
Workshops are also planned in low cost building and a training programme is also plannedfor designing of engines for the prime movers project at CMERI, Durgapur. An InternationalConference on Water Hyacinth is planned early next year to report the experience gainedunder CSC projects on various aspects of water hyacinth including those relating to use ofthe weed for control of pollution, biological control, chemical control and utilization ofwater hyacinth for paper production. A large number of countries and experts working onwater hyacinth are expected to participate.
CSC is not a rich organization. We are fortunate to have support from the CommonwealthFund for Technical Cooperation. The Water Hyacinth project has received substantial helpfrom UNEP. However, despite resource constraints, the programme has achieved creditablesuccess.
With this brief introduction to CSC and some of its programmes and with the hope that thisworkshop will come out with some concrete recommendations for early implementation totackle this vital problem, I would like now to request the Chairman for his presidentialaddress and advice to the participants.


Annex 4a
WATER SUPPLY AND SANITATION DECADE - INDIA - AN OVERVIEW
by Dr B B Sundaresan & R Paramasivam, National Environmental Engineering ResearchInstitute, Nagpur 440 020, India.
Introduction
The International Drinking Water Supply and Sanitation Decade Programme (1981-1990) statesthat safe drinking water and effective sanitation should be provided for all people by theyear 1990. To achieve this goal with meagre resources in a time frame of a decade asagainst a century or more taken by developed countries, needs political will, public supportand administrative action at all levels in the developing countries. As it may not be atotally realistic goal for all the countries, each nation has to establish its own target,develop an appropriate strategy and implement a plan of action to achieve the set goal.
A review of the current status of drinking water supply at global, regional and nationallevel would be relevant. The data compiled by WHO on service coverage for drinking watersupply shows a clear percentage increase only in rural water supply (Table 1). As of 1980,the percentage of total urban population covered has registered a marginal decrease fromthe 1975 level of 77 per cent. This indicates that the urban coverage did not keep pacewith the increase in urban population. The third world population has been growing steadily,so the number of people without facilities has also grown. According to WHO in 1975, 1233million people in the third world (excluding China) had no adequate clean water which hasrisen to 1320 million in 1980. The rural population without access to clean water, however,remained virtually the same (1106 million in 1975 and 1143 million in 1980).
Table 1 : Service Coverage for Drinking Water Supply in Developing Countries (1970-1980)
Urban
Rural
Total
Indian
1970Populationserved (inmillions)
316
182
498
Scenario
Percentageof totalpopulation
67
14
29
1975Populationserved (inmillions)
450
313
763
Percentageof totalpopulation
77
22
38
1980Populationserved (inmillions)
526
569
995
(estimated)Percentageof totalpopulation
75
29
43
In post-independent India, industrial and technological progress has been impressive, butwater supply and sanitation programmes have lagged far behind. As of 1980, 67 per cent ofurban and 31 per cent of rural population had reasonable access to safe water supply(Tables 2 and 3). Several factors have contributed to this slow progress.
The single most important constraint in rural water supply programmes has been inadequatefinancial inputs. In the past, financial allocation has not been in proportion to the needsof this sector due to the competing demands from other sectors on the limited resources.Inadequate and inappropriate organisational and administrative set-ups, lack of trainedpersonnel at various levels and inadequate community participation have all contributed tothe slow progress in this vital sector. The magnitude of the problem and the task aheadwill be evident from the fact that one half of the population without reasonable water supplyin the world are in the South-east Asia region and 65 per cent of this are in India. Becauseof its sheer size and diversity, India's efforts to achieve the target will be viewed withconsiderable interest by the rest of the world.
Preparation for the Decade Programme
Rapid assessment of the status of drinking water supply and sanitation in India was under-taken during 1977-1980 so that a clear picture would emerge. Sector studies in respect ofall the States and Union Territories have been carried out. The technical wing of theMinistry of Works and Housing, viz, The Central Public Health and Environmental Engineering

Table 2 - Statewise Number of Villages in Different Population Groups - India.
Name of State andUnion Territory
Andhra PradeshAssamBiharGujaratHaryanaHimachal PradeshJammu & KashmirKarnatakaKeralaMadhya PradeshMaharashtraManipurMeghalayaNagalandOrissaPunjabRajasthanSikkimTamil NaduTripuraDttar PradeshWest Bengal
Union Territory
A & N IslandsArunachal PradeshChandigarh
Grouplessthan
53525578174402054618
1202017484939
21978450539743192334
1854618878771-9882995273567604
2662405
3Dadra & Nagar Haveli 3DelhiGoa,Daman & DiuLaccadivesPondicherryMizoram
Total :
206616437
L50,072
I Group II Group III200-499 500-999
200
438366942048343511400372322007949
22727690884761093325
15223331111010
311981969
3485610957
724135202374-9850
168,561
54385950152325242109086115567082
21651610529237237169
8821357778171143425473
282959085
3210710185382-8536
132,990
Group IV1000-1999
64113012-931343951673260764455616
5952743917254114
35462892400863
4547222
160816622
1938726798515749
81,973
Group V2000-4999
483373443371968975502262014122
12923102797178309401524
7390265
54003342
110-5607762654
36,005 4
Group VI5000-9999
72426675248}4829
252316874928-12279165-7523
515412
_-1-623233
,974
Groupover
10,000
80186178--9
808675---2210-
140-
5852
_---22---
1,358
VIITotal
27,22121,99567,56618,2756,73116,9166,50326,8261,26870,88335,7751,9494,583960
46,99212,18833,305
21515,7354,727
112,56138,074
3902,973
267224340910333229
575,936

Table 3 - Water Supply Service Coverage - India
^ ^ (Populations in thousands)
Name of the State/U T Population benefitted "with wateras on 31-3-1981Urban Rural Total
Percentage of
Urban Rural Total
Andhra PradeshAssamBiharGujaratHaryanaHimachal PradeshJammu & KashmirKarnatakaKeralaMadhya PradeshMaharashtraManipurMeghalayaNagalandOrissaPunjabRajasthanSikkimTamil NaduTripuraUttar PradeshWest BengalA & N IslandArunachal PradeshChandigarhDelhiDadra & Nagar HaveliGoa, Daman & DiuLakshadweepMizoramPondicherryMadrasBombay
6,908525
5,5269,4271,128325
1,2239,5342,8477,09411,418
2616466
1,0223,0454,059
249,858
10513,9904,659
25480
4.700
16,7403,496
41,91620,2622,7571,8041,7338,1586,04613,0367,833269216328
2,9502,9929,892
325,787741
6,4886,439
392
284
332
10174
3,475
1683
113245140
23,6484,021
47,44229,6893,8852,1292,95617,6928,893
20,13019,251
530280394
3,9726,03713,951
5615,645
84620,47811,098
417480
4,984
5003
123419
3,615
62.5421-8770.3895.0047.1696.73100.0099.8660.7672.3088.7871.7028.0029.0737.4472.3665.7022.4361.7139.6288.8030.75
90.0093.79.
77.20
14.7078.7381.20
41.5019.9069.4087.6027.3046.3536.4031.3028.4130.1419.6924.4519.6667.2712.1225.2636.2621.9221.6040.297.20
15.79
64.58
100.00
22.988.50
32.0067.3050.00
46.0020.1469.5289.8031.1250.3749.4049.6934.2637.9443.4236.2021.2055.1014.6837.6141.7022.1336.6035.2119.3719.84
50.3092.8080.60
43.078.50
29.1570.6679.29
Total: 102,304 161,260 263,564 66.91 31.07 32.99
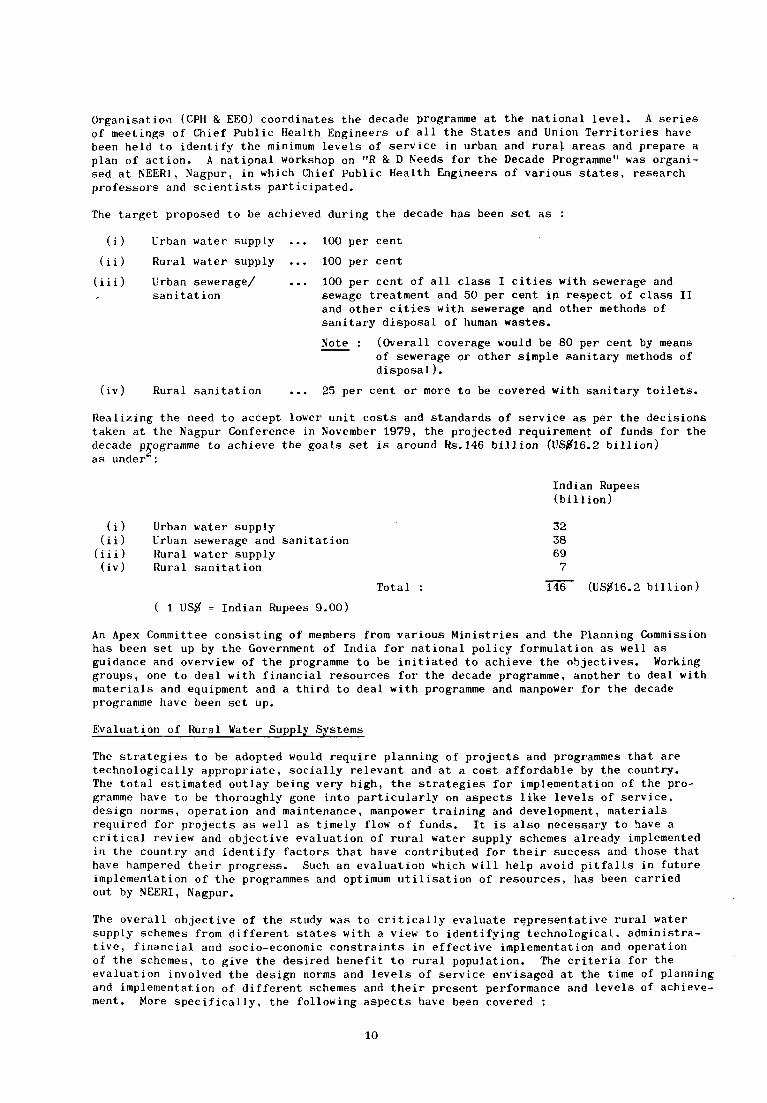
Organisation (CPH & EEO) coordinates the decade programme at the national level. A seriesof meetings of Chief Public Health Engineers of all the States and Union Territories havebeen held to identify the minimum levels of service in urban and rural areas and prepare aplan of action. A national workshop on "R & D Needs for the Decade Programme" was organi-sed at NEERI, Nagpur, in which Chief Public Health Engineers of various states, researchprofessors and scientists participated.
The target proposed to be achieved during the decade has been set as :
(i)
(ii)
(iii)
Urban water supply
Rural water supply
Urban sewerage/sanitation
(iv) Rural sanitation
100 per cent
100 per cent
100 per cent of all class I cities with sewerage andsewage treatment and 50 per cent in respect of class IIand other cities with sewerage and other methods ofsanitary disposal of human wastes.
Note : (Overall coverage would be 80 per cent by meansof sewerage or other simple sanitary methods ofdisposal).
25 per cent or more to be covered with sanitary toilets.
Realizing the need to accept lower unit costs and standards of service as per the decisionstaken at the Nagpur Conference in November 1979, the projected requirement of funds for thedecade programme to achieve the goals set is around Rs.146 billion (US$16.2 billion)as under
(i) Urban water supply(ii) Urban sewerage and sanitation(iii) Rural water supply(iv) Rural sanitation
( 1 US# = Indian Rupees 9.00)
Indian Rupees(billion)
3238697
Total 146 (US#16.2 billion)
An Apex Committee consisting of members from various Ministries and the Planning Commissionhas been set up by the Government of India for national policy formulation as well asguidance and overview of the programme to be initiated to achieve the objectives. Workinggroups, one to deal with financial resources for the decade programme, another to deal withmaterials and equipment and a third to deal with programme and manpower for the decadeprogramme have been set up.
Evaluation of Rural Water Supply Systems
The strategies to be adopted would require planning of projects and programmes that aretechnologically appropriate, socially relevant and at a cost affordable by the country.The total estimated outlay being very high, the strategies for implementation of the pro-gramme have to be thoroughly gone into particularly on aspects like levels of service,design norms, operation and maintenance, manpower training and development, materialsrequired for projects as well as timely flow of funds. It is also necessary to have acritical review and objective evaluation of rural water supply schemes already implementedin the country and identify factors that have contributed for their success and those thathave hampered their progress. Such an evaluation which will help avoid pitfalls in futureimplementation of the programmes and optimum utilisation of resources, has been carriedout by NEERI, Nagpur.
The overall objective of the study was to critically evaluate representative rural watersupply schemes from different states with a view to identifying technological, administra-tive, financial and socio-economic constraints in effective implementation and operationof the schemes, to give the desired benefit to rural population. The criteria for theevaluation involved the design norms and levels of service envisaged at the time of planningand implementation of different schemes and their present performance and levels of achieve-ment. More specifically, the following aspects have been covered :
10

(i) Collection of information such as design period, population, per-capitawater supply and existing conditions of services.
(ii) Survey of sources of water supplies, their quality and seasonal variations,
(iii) Technological aspects relating to system design, construction and operation.
(iv) Problems in operation and maintenance, frequency of breakdowns, availability ofspares, services facilities including manpower and training.
(v) Degree of service such as per-capita supply, duration of supply, location andnumber of public stand posts/hand pumps provision of house connections, etc.
(vi) Health status, health education, health impact and other indirect benefits.
Keeping in view the vastness of the country, a total of 66 schemes (Tables 4 and 5) fromdifferent states of India were selected for the study to represent the following categories:
(i) Schemes serving less than 1000 persons,
(ii) Schemes serving between 1000 and 10000 persons,
(iii) Simple hand pump tube wells.
(iv) Piped water supply schemes serving one or a group of villages with distributionthrough public stand posts alone.
(v) Piped water supply schemes with distribution through public stand posts as wellas individual house connections.
In order to avoid possible bias in the selection of schemes, Chief Engineers were requestedto provide a list of all the completed rural water supply schemes to be studied fromdifferent geographic locations within the state. From among these lists, eight to tenschemes were selected at random fulfilling the criteria laid for selection.
The field work comprises three major activities:
(i) Visits to the Public Health Engineering Departments to obtain information such asdesign data, engineering details, etc, about the schemes selected for evaluationand to hold discussions to discover their views and experiences on various aspectsof rural water supply programmes.
(ii) Field visits to villages to study the schemes in detail as they exist, collectwater samples for assessing water quality and to hold informal discussions withboth government (revenue) officials and local body representatives.
(iii) Personal interviews with the villagers (users of public water supply) to collectinformation on water supply service, health status, awareness of water relateddiseases and their control, personal hygiene and environmental sanitation, benefitsof water supply, etc. For this purpose, 5 per cent of the households in thevillage subject to a minimum of 30 and a maximum of 60, were selected at randomusing table of random numbers (specimen proformae developed and field tested aregiven in Appendix I).
With a view to compare the impact of providing an organised water supply on the healthstatus of the user community, the rate of incidence of water-borne diseases, etc, referencevillages were selected in addition to the study villages in each state. The referencevillages were so selected as to have a population and socio-economic conditions comparableto any of the study villages with the exception that it does not have an organised watersupply as yet and depends on water supply sources similar to those in the study villages.
The information and data collected from design office, field observations, personalinterviews and discussions with engineers, local body officials and representatives ofvillages were consolidated, analysed critically and an objective evaluation prepared foreach of the water supply schemes. Based on this study, a comprehensive evaluation reportbringing out the present status, the constraints and recommendations for future implemen-tation of rural water supply systems in India has been prepared.
11
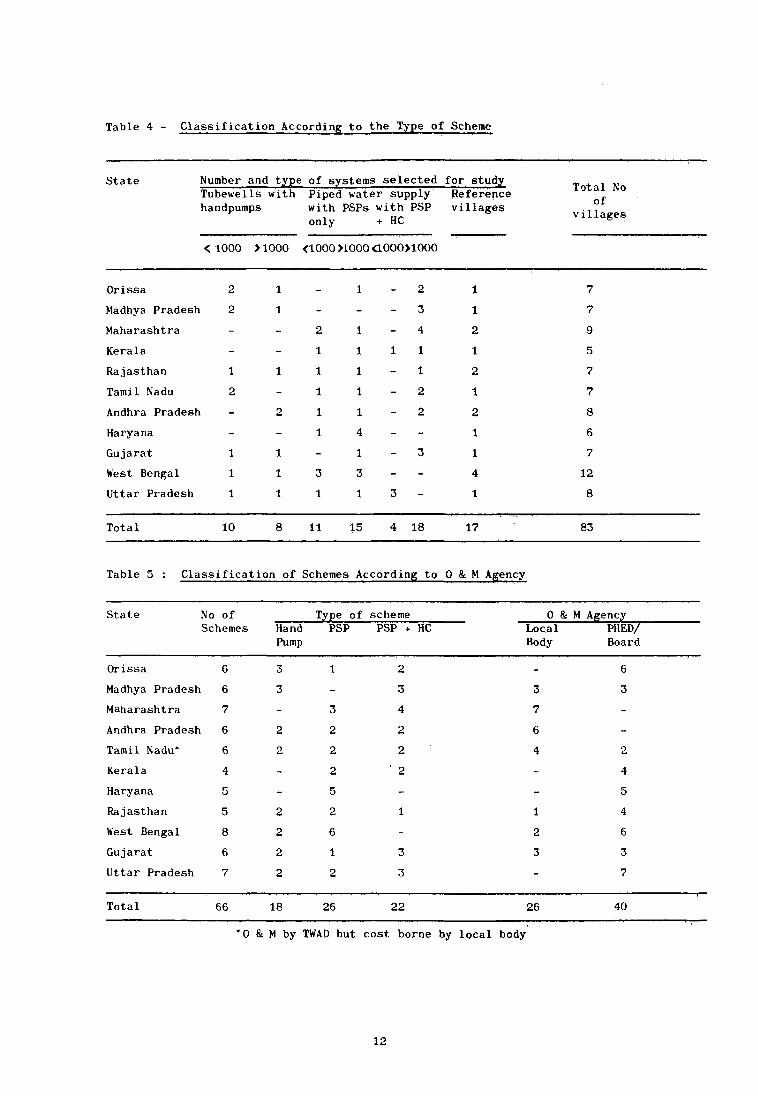
Table 4 - Classification According to the Type of Scheme
State Number and type of systems selected for studyTubewells with Piped water supply Referencehandpumps with PSPs with PSP villages
only + HC
< 1000 >1000 <1000 M000 dOOOMOOO
Total Noof
villages
Orissa
Madhya Pradesh
Maharashtra
Kerala
Rajasthan
Tamil Nadu
Andhra Pradesh
Haryana
Gujarat
West Bengal
Uttar Pradesh
2
2
-
-
1
2
-
-
1
1
1
1
1
-
-
1
-
2
-
1
1
1
-
-
2
1
1
1
1
1
-
3
1
1
-
1
1
1
1
1
4
1
3
1
2
3
4
1 1
1
2
2
-
3
-
3
1
1
2
1
2
1
2
1
1
4
1
7
7
9
5
7
7
8
6
7
12
8
Total 10 11 15 4 18 17 83
Table 5 : Classification of Schemes According to 0 & M Agency
State
Orissa
Madhya Pradesh
Maharashtra
Andhra Pradesh
Tamil Nadu*
Kerala
Haryana
Rajasthan
West Bengal
Gujarat
Uttar Pradesh
No ofSchemes
6
6
7
6
6
4
5
5
8
6
7
HandPump
3
3
-
2
2
-
-
2
2
2
2
Type ofPSP
1
-
3
2
2
2
5
2
6
1
2
schemePSP + HC
2
3
4
2
2
' 2
-
1
-
3
3
0 &LocalBody
-
3
7
6
4
-
-
1
2
3
_
M AgencyPHED/Board
6
3
-
-
2
4
5
4
6
3
7
Total 66 18 26 22 26 40
*0 & M by TWAD but cost borne by local body
12
R & D Strategy
With the above background, the strategy and technology options for implementing rural watersupply in regions with varying degrees of development and different hydrogeologicalconditions in addition to the difference between rural and urban environments become highlycomplex. The concept of commercialisation of water supply as a self-supporting proposition,let alone a profitable one, has seldom gained acceptance in rural areas of developingcountries. Hence, the approach and strategy to be adopted for rural water supply programmeshave to be imaginative and different from those for urban systems. The multi-disciplinaryaspects of the profession ad another dimension to developing appropriate technologies.It is a misconception to assume that small water supplies are merely "scaled down" versionsof urban installations requiring less engineering skill and ingenuity. The exact oppositemay often be the case.
Environmental engineers and scientists exposed to American and European technologicalinnovations have adhered to the line of least resistance in adopting technologies whichwere readily available. Such an approach has been useful in some cases, but has becomeirrelevant in a large number of cases. R & D does not stop simply with unravelling thebasic mechanisms through scientific efforts or technological adoptions through engineeringskills. It must be supported by other disciplines such as sociology, economics and healtheducation. Instances are not lacking where processes and technologies claimed to havebeen successful in a developed country have failed to take-off in a developing countrybecause social relevance and cultural acceptance were overlooked. The objectives of R & Deffort should be :
(i) Determination of techno-economic feasibility of various options whichare available for water supply and waste disposal;
(ii) Evaluation of economic and environmental system effects of technologieswhich provide for conservation of water, reclamation and reuse of waste-water;
(iii) Development of energy saving devices ; and
(iv) Technological innovations at intermediate technology levels to improveefficiency and enhance appropriateness.
Such an effort should be supported by modern tools of data collection, storage andretrieval. Information collection, collation and dissemination should be improved toprovide for continuous flow of information between operating agencies and researchinstitutions. Efforts undertaken to meet the decade programme requirements should thustake into consideration (i) the total concept and system approach, (ii) energy conservation,(iii) waste reuse and recycling, (iv) interaction with sociologists on aspects of communityparticipation, (v) economic analysis and cost effectiveness and (vi) effective linkagebetween user departments and research organisations.
Conclusion
In conclusion, preparatory work for the decade programme with emphasis on rural watersupply has been completed, which involved identification of problem villages, levels ofservice to be provided, strategy for plan of action on the basis of evaluation of completedschemes, financial resources required and constraints in organisational infrastructure.The programme has been launched at the national level for which political will and publicsupport have manifested itself and administrative action has been initiated. Availabilityof institutional infrastructure, technological packages, skilled manpower, materials andsupplies are assets in the total programme, but success or otherwise would depend uponeffective coordination to provide funds and materials at the right time, in the right placewith the right personnel.
13

References
1. WHO estimates submitted to the General Assembly of the United Nations by theSecretary General in his report on the International Drinking Water andSanitation Decade : Present situation and prospects (United NationsDocument A/35/150).
2. "India and International Water Supply and Sanitation Decade" - Paper presentedby Shri V Venugopalan, Adviser (PHEE), CPHEEO, Ministry of Wprks & Housing,Government of India at the 14 Annual Convention of the Indian Water WorksAssociation, held at Hyderabad during February 11-13, 1982.
3. International Drinking Water Supply & Sanitation Decade 1981-1990 <- Draft Datafor Decade Programme, December 1981.
14

APPENDIX I
NATIONAL ENVIRONMENTAL ENGINEERING RESEARCH INSTITUTE, NEHRU MARG : NAGPUR - 440 020
PROFORMA FOR INFORMATION ON HEALTH STATUS
H Q/Zonal Lab Date
Name of the Interviewer
Signature of the Interviewer
1. General Information
a) Name of the village
C D Block District State
b) Ward No House No
Number of persons in the family Adults Children
c) Respondent's Name
Sex ( ) Caste(Male-1, Female-2) S C-l, S T-2, Other-3)
Educational status ( )(llliterate-1, Primary-2, Middle school-3, High school-4,Higher education-5)
2. Sanitation and Personal Hygiene
a) How do you dispose of sullage .... ( )(Soakpit-1, Connected to drainage-2, Ordinary pit-3,Use in kitchen garden-4, No organised system-5)
b) What is your method of disposal of garbage and refuse .... ( )(Composting-1, Throwing around the house-2, Dustbin-3, Alloted pitsin the village-4, Pit in the house premises-5, Others (specify)-6
c) What is your method of disposal of animal dung ( )(Composting-1, Alloted pits-2, Fuel-3, Others (specify)-4, N A-5)
d) Where do you and members of the family go for defecation ... ( )Adult males : Openfield-1, Latrine-2, Both-3 ( )Adult females : Openfield-1, Latrine-2, Both-3 ( )Children male : Openfield-1, Latrine-2, Both-3 ( )Children female: Openfield-1, Latrine-2, Both-3 ( )Old and sick : Openfield-1, Latrine-2, Both-3 ( )
e) Type of Latrine ( )(Chainflushed-1, Handflushed-2, Conservancy system-3, Pit-4,Septic tank-5, Public latrine-6, Bore hole-7, Other (specify)-8,Not applicable-9)
f) Condition of Latrine ( )(Clean-1, Dirty-2, Not in use-3, Not applicable-4)
g) Do you wash hands after ablution ( )(Yes-1, No-2, Not applicable-3)
h) If yes, with what ( )(Soap-1, Mud-2, Ash-3, Others (specify)-4
i) Observe if the fingernails are properly cut ( )(Yes-1, No-2)
15

3. Health Education
a) What will happen if you drink unsafe water(Cause disease-1, Cause minor illness-2,Nothing happens-3, Does not know-4, 0thers(specify)-5
b) What will you do to make unsafe water safe(Boiling-1, Alum treatment-2, Disinfection-3,Straining through cloth-4, Decantation-5,Filter candle used-6, Does not know-7, Other devices-8)
c) Name a few water-borne diseases .(Cholera/Gastroenteritis-1, No-0Typhoid-2, No-0Dysentery/Diarrhoea-3, No-0Infectious hepatitis-4, No-0 (Jaundice)
d) Do you know the preventive measures of the above diseases ...(Water treatment-1, No-0Immunization-2, No-0Personal hygiene-3, No-0)
e) Do you go to a doctor immediately on falling sick(Yes-1, No-2)
f) Where do you go for medical treatment(Government hospital-1, Private hospital-2,Private medical practitioner-3,Household treatment-4, 0thers(specify)-5)
g) Specify the type of treatment(Allopathy-1, Homeopathy-2, Ayurvedic-3,Unani-4, 0thers(specify)-5)
M What is the importance of daily bath(Personal hygiene-1, Custom-2, Freshness-3,Does not know-4, Others(specify)-5)
i) Do you think mosquitoes can cause any illness(Yes-1, No-2, Does not know-3)
j) If yes, name the diseases(Malaria-1, Filaria-2, Both-3, Does riot know-4)
k) How mosquitoes can be controlled(Reducing the stagnation of water-1, Spray of insecticides-2,Spray of oil-3, Does not know-4, Any other (specify)-5)
1) Do houseflies play a role in transmission of diseases •(Yes-1, No-2, Does not know-3)
m) If yes, how(Contamination of food-1, Contact with body parts-2,Both-3, Does not know-4)
n) Where do houseflies breed(Refuse/Cowdung heaps-1, In water-2, Dirty places-3,Does not know-4, Any other (specify)-5)
Immunization Status
o) In the past, did any of the family members suffer from(Polio, Diphtheria/Whooping caughAetanus/Cholera/Typhoid/T B)(Yes-1, No-2, Does not remember-3)
16

p) Are these diseases fatal .., ( )(Yes-1, No-2, Does not know-3)
q) Can they be controlled by immunization ( )(Yes-1, No-2, Does not know-3)
r) Have any members of the family got ( )vaccinated in the past one yearTyphoid - (Yes-1, No-2, Does not remember-3) ........ ( )Cholera - (Yes-1, No-2, Does not remember-3) ( )Small pox - (Yes-1, No-2, Does not remomber-3) ( )
s) Are your children vaccinated against ( )Polio - (Yes-1, No-2, Does not remember-3, N A-4) ........ ( )T B - (Yes-1, No-2, Does not remember 3, N A-4) , ( )Small pox - (Yes-1, No-2, Does not remember,NA-4) ( )D P T - (Yes-1, No-2, Does not remember-3, N A-4) ( )
4. Morbidity and Mortality Data
a) Did you have cases of the following diseases in the family ?If yes, note the recurrence in the last three years
Cholera/Gastroenteritis (No of times , No-0) ( )Typhoid (No of times , No-0) ( )Dysentery/Diarrhoea (No of times , No-0) ( )Infective hepatitis (No of times , No-0) ( )Worm infestation (No of times , No-0) ( )Malaria (No of times ,No-0) ( )Polio (No of times , No-0) ( )
b) Did you find any reduction in the incidence of thefollowing diseases in your family after theintroduction of water supply
Cholera/Gastroenteritis ( )(Yes-1, No-2, Not applicable-3, Does not know-4)
Typhoid ( )(Yes-1, No-2, Not applicable-3, Does not know-4)
Dysentery/Diarrhoea ( )(Yes-1, No-2, Not applicable-3, Does not know-4)
Infective hepatitis ( )(Yes-1, No-2, Not applicable-3, Does not know-4)
Polio ( )(Yes-1, No-2, N A-3, Does not know-4)
Malaria ( )(Yes-1, No-2, N A-3, Does not know-4)
Filaria ( )(Yes-1, No-2, N A-3, Does not know-4)
c) Any deaths in the family during the past threeyears due to :
Cholera/Gastroenteritis ( )(Yes-1, No-2)
Typhoid ( )(Yes-1, No-2)
Infectious hepatitis (Jaundice) ( )(Yes-1, No-2)
Polio ( )(Yes-1, No-2)
Malaria ( )(Yes-1, No-2)
17

NATIONAL ENVIRONMENTAL ENGINEERING RESEARCH INSTITUTE, NEHRU MARG : NAGPUR - 440 020
PROFORMA FOR INFORMATION OX WATER SUPPLY
TYPE OF WATER SUPPLY SCHEME : Handpump/House Connection/Public Stand Post
Name of Village : Ward No : House No:
Respondent's Name :
1. a) Quantity (litres) of water obtained daily : Morning Evening
b) Is it sufficient Yes/No
c) If NOT, additional quantity (litres) required ...
d) Quantity (litres) of stored water daily discarded
2. Quantity (litres) used for different purposes :
Drinking ( ) Cooking ( ) Washing of clothes ( ) Washing utensils ( )Bathing ( ) Toilet & ablution ( ) Domestic Total ( )Cattle ( ) Any other ( )
3. Do you fetch water from other sources also Yes/No
If YES, Source Quantity(litres) Purpose
a) r _ _
b)
MorningEvening
Yes/No
YesA'o
MorningEvening
Yes/No
MorningEveningTotal
FromFrom
FromFrom
FromFrom
ToTO
ToTo
ToTo
4. a) Timings of water supply
b) Are the timings regular
c) Are the timings convenient
d) If NOT, indicate convenient timings
5. a) Is duration of water supply sufficient
b) If NOT, extra duration (minutes) required
6. Do you get extra supplies on special occasions Yes/No(Diwali, Holi, Fairs, Festivals)
7. Time (minutes) spent in fetching water Morning
Evening '
8. Difficulties (if) faced in meeting daily water requirement
a) Overcrowding b) Distance too long c) Lift too high
d) Insufficient pressure e) Personal reasons f) Any other
9. Are standposts conveniently located Yes/No/Not applicable
10. Do you need additional standposts in your locality Yes/No/Not applicable11. Are you satisfied with the quality of water supplied Yes/No
If NOT, reasons : a) Turbidity b) Bad odour c) Chlorine smeiid) Bad taste e) Any other
12. Do breakdowns occur in water supply Yes/No
a) Frequency of breakdowns/year
b) Reasons : Failure of (i) Electricity (ii) Machinery (iii) Organisation
18

13. Sources of water supply used during such breakdowns
a) River b) Canal c) Well d) Tank e) Any other (specify)
14. Do you experience problems in summer Yes/NoIf YES, nature of difficulty
15. Do you have an individual house connection Yes/Noi) If NOT, give reasons :
a) High water tax b) Distributory line far awayc) Public standpost quite near d) Well in housee) High house connection fee f) Any other (specify)
ii) If YES, your opinion about the water tax
a) High b) Reasonable c) Low d) No comments
iii) Are you interested in having a house connection Yes/NoIf YES, amount (Rs.) you would like to pay annually
16- What in your view are the benefits of piped water supply
a) Labour reduced in fetching water b) More time available for other workc) Reduction in illness d) Increase in property valuee) Improved personal hygiene f) Coining up of new industriesg) Any other (specify) h) No response
17. Any new problem cropped up due to introduction ofwater supply
If YES, specify
19


Annex 4bIndia Country Paper
International Water Supply and Sanitation Decade (1981-1990)
Global Status
Eighty per cent of the world's disease is linked to inadequate water or sanitation.
Every hour, between 1000 and 2500 Third World children under five die simply becausethey do not get clean water to drink or enough water to wash themselves properly.
Every hour, 50,000 children under five suffer from some form of diarrhoea.
Every year, about 6 million children under five die from diarrhoea.
Hour after hour, day after day, this is the price that the Third World's childrenpay for lack of clean water.
It is against this background that the United Nations has declared the 1980s theInternational Drinking Water Supply and Sanitation Decade. The launching of thedecade programme on 10 November 1980 marks a new era in the history of the U N .
During the 1960s and 1970s, there was some increase in the proportion of peopleserved by water supply and sanitation facilities. But this increase has been muchlower than the increase in population.
In 1975, 1350 million had no sanitation. 1980 this was 1730 million. The number ofrural people without access to clean water remained virtually the same (1106 millionin 1975 and 1143 million in 1980).
Community water supply in developing countries : percentages of population adequatelyserved
Urban population supplied with water Rural population withYear By house By public Total reasonable access to T o t a l
connections standposts urban water
14 29
22 38
29 43
Today 100 million more third world people have to drink dirty water than in 1975 and400 million more than in 1975 have no sanitation.
Investments for Decade Programme
The World Bank estimates that the total cost of clean water and sanitation for allby 1990 would be in excess of US$600 billion. This is on the assumption that inurban areas every household has a tap of its own and is connected to a seweragesystem and that rural households will be served with stand-pipes or handpumpsand individual latrines.
The World Bank also estimates that by using cheaper and more appropriate technologiesin both rural and urban areas, the costs could probably be halved to US$300 billionor less.
The bulk of this sum will have to be raised by the developing countries themselves.WHO estimates that atleast one fifth to one third of the total capital investmentwill be needed as external aid. This would mean that external assistance of US$11,000to US$19,000 will be required per minute.
Developed countries alone spent US$360 billion on defence in 1979. If they diverted10 days a year of their arms spending to the Decade, this would provide all theexternal aid needed.
21
1962
1970
1975
1980
32
50
57
_
25
17
20
_
58
67
77
75

Even if external aid could be raised, the developing countries would still need tospend something, like US# 20 billion every year from their own domestic resources.All these figures are only for capital expenditure. More money will be required tooperate and maintain the water supply and excrete disposal facilities.
Status of Water Supply and Sanitation in India
India with a total population of about 685 million has 575,936 villages in which nearly80 per cent of the people live. As of 1980, 67 per cent of urban population and 31 percentof rural population have been provided with reasonable access to safe water. In terms ofactual number, the people covered with water supply is about 263 million.
India formally launched upon the Decade Programme in April 1981. A rapid assessment ofthe status of drinking water supply and sanitation was undertaken during 1977-1980. Aseries of meetings of Chief Public Health Engineers of all the States and Union territorieshave been held to formulate guidelines on the minimum levels of service and to prepare aplan of action. A national workshop was organized at NEERI in 1979 to identify R & D needsfor the Decade Programme. The target set for the Decade Programme in India is :
(i) Urban water supply
(ii) Rural water supply
(iii) Urban sewerage/sanitation
(iv) Rural Sanitation
100 per cent
100 per cent
... 100 per cent of all Class I cities withsewage and sewage treatment and 50 percentin respect of Class II and other citieswith sewage and other methods of sanitarydisposal of human wastes.
Note: (Overall coverage would be 80 per cent by means of sewage orother simple sanitary methods of disposal)
... 25 per cent or more to be covered withsanitary toilets
The projected requirement of funds to achieve the target is as under:
Urban Water supplyUrban sewage and sanitationRural water supplyRural sanitation
The Strategy
Indian Rupees(billion)
3238697
146
The attainment of the targets for the Drinking Water Supply and Sanitation Decade willrequire new approaches both in national strategies and in international support.
Simple, cheap and safe community water supply and sanitation schemes which people acceptand use, should be promoted. Where schemes are understood and wanted by the community,people are likely to find more of the resources necessary to construct and operate them.If there is no appreciation of what communities want and need, blunders can be made.Several instances have been quoted as to how people destroyed or neglected water andsanitation facilities that were installed without prior consultation. Furthermore,technology must be appropriate. In addition to reduction in costs, installations shouldbe simple to operate and maintain using the knowledge available in the village or smalltown concerned and should encourage local employment. For example, slow sand filters canprovide simple, efficient and reliable means of purifying polluted waters for smallcommunity water supplies.
22
It has been increasingly recognised that the problem of rural water supply is closelylinked to that of environmental sanitation and that if any project is to be successful,the approach should be an integrated and multidisciplinary one. Not only myst appropriatetechnologies be applied but they must also be linked to other sectors of rural developmentincluding education of villagers on the importance of proper use of water supply andsanitation facilities. Community involvement and participation is another vital aspectwhich decides the success or failure of a water supply project or for that matter any ruraldevelopment programme. Increasing involvement of the community in not just the constructionand maintenance of the system, but in all stages of planning and implementation should beensured to achieve the real benefit of investment in improved water supply.
23


Annex 5
WATER SUPPLIES IN THE SEYCHELLESby Mr S Rousseau
Introduction
The goals for the 1981-1990 Water Decade were established at the UN Water Conference inMar del Plata, Argentina in 1977. The proposal at the Mar del Plata Conference was laterapproved by the UN General Assembly and the official slogan became "Clean Water andAdequate Sanitation for all by 1990". The aim was 100% coverage - an ideal that fewpeople believe can be achieved in full, and which has already been adjusted within WHOto 100% for water supply, 80/6 for urban sanitation, and 50% for rural sanitation.
The amount of money that needs to be spent to achieve the goal of the Pecade is put atbetween US$200 billion to US$500 billion. The bulk of this money is to come from thedeveloping countries themselves, and it must be noted that the developing countries haveother pressing needs beside water and sanitation. At US$80 million a day, the Decade'scall on international financial resources is daunting, even when put alongside other globalestimates : US$240 million a day is spent on cigarettes; tranquilisers for what WHO callsnon-essential uses cost US$10 million a day and the global arms bill is US$1400 milliona day.
It has been said that if the developed countries alone diverted 10 days a year of theirarms spending to the Decade it would produce all the external finance needed. Telling asthat statistic may be, it is hardly likely to produce an overnight conversion of politicalideologies to the tune of US$10 billion a year.
The message for the Decade that the UN is emphasing, in pushing forward the goals of theDecade, is the human and financial benefits.
As Arthur Brown, Chairman of Interagency Steering Committee Coordinating the UN DecadeActivities, put it, "The humanitarian arguments are overwhelming. In addition it is afield in which technology is relatively simple and readily available, the cost effective-ness is very high and the results are quickly and clearly visible. If the Decade is onlypartially successful in achieving its goal for clear drinking water and sanitation forall by 1990 it would have more impact than any United Nations programme ever launched, inalleviating human suffering and increasing human potential."
Seychelles Action's Plan For The Decade
The Seychelles Water Authority with the help of a WHO expert Dr J W Kwaniana Duncanproduced a report ICP/RSM/002 which was a Rapid Assessment of current and projectedsector development to meet the objectives of the Decade.
The report made the following recommendations:
(i) Identification of a national focal point to be entrusted with coordination for theformulation of appropriate sector policies, plans and programmes and located in theWater and Sewerage Section of the Public Works Division. (The Seychelles WaterAuthority was formed on 1 January 1981 and took over the functions of the Waterand Sewerage Division). The focal point is now Mr N F Nicholson, Engineer/Managerof SWAL.
(ii) Government should conduct manpower training and survey studies to determine presentand future manpower needs in the sector as well as technical support for fellowships,curriculum planning, experts and teachers; establishment of training institutionsand provision of technical and teaching materials and equipment.
(iii) External technical and financial assistance should be assured in the developmentand provision of low-cost technologies to provide sector facilities to marginalpopulation especially in the outer islands of the Republic.
(iv) Further groundwater explorations should be undertaken, supported by externalcooperation in the coralline islands, to determine maximum yield of aquifers.
25

The report also outline the external inputs required to meet the Decade Goals as follows:
To review the water tariff introduced on 1 January, 1980. The present tariffrecovers the cost of operation and maintenance costs, for water supply and seweragedisposal and minimal replacement of existing works. No charge is made for sewerage.
To assist with the development of low-cost technology units to provide water supplyand sanitation facilities to marginal population groups.
To assist with the development of training programmes. The prospects for comprehensivemanpower sector development programmes are not bright as there are no sub-professionaltraining institutions in Seychelles. However in-service training is being providedfor junior technical personnel.
To assist with a Sanitation and Health Education Programme.
Evaluation of Existing Technologies Which Are Suitable For Rural Application
(i) Ceramic candle pressure filters: These filter units will produce potable water tosupply up to 250-300 persons.
The body of the filter is of aluminium and steel construction, coated with non-toxicplastic and utilises 10 or 20 ceramic elements. The elements may be impregnatedwith silver nitrate which is a bactericide. Water passing through such filters ispotable without further treatment. On larger schemes, the water is dosed withchlorine to protect it during transportation to the consumers.
Performance of unit: Seychelles installed the first such filter unit in 1977 tosupply Anse Louis Village on the main island of Mahe. The unit is now supplyinga village with population of approximately 300 inhabitants.
The output of the unit is regularly monitored and performs satisfactorily providedthe elements are replaced regularly. Dosing chlorine with tablets or chloride oflime gives additional protection to the supply.
(ii) Small package water treatment plant utilising pressure filter of capacity of 14 m /hr.The body of the filter is made of galvanised mild steel. Filter media is quartz sandand activated carbon for colour removal.
Performance of filter: One such filter has just been installed at Quatre Borne avillage in the south of Mahe. The filter unit has not run for a sufficient lengthof time for its performance to be fully assessed.
(iii) Vertical raked pressure filters: Where available head is not great SWAL have theintention of using vertical manually raked pressure filters. SWAL have had noexperience with this type of filter, however the manufacturer of these units claimsthat after chlorination a potable water meeting the standard of WHO will be achieved.Funds are being sought to install this type of filter on Praslin.
(iv) Slow sand filters: SWAL have in operation two works which utilise slow sand filters.It is well know that after the initial cost of construction slow sand filters costleast to operate but the shortage of flat land means that slow sand filters arenot viable.
Suitability and performance: The filters at Rochon, which where slow sand filterswere commissioned in 1969 and give satisfactory results. Monitoring shows that 96%of bacteria is removed. The filtered water is chlorinated to give a safe supplyof drinking water.
After periods of rain storms when the bacteria counts increases it has been observedthat the percentage of removal decreases. At these times the colour of the wateralso increases and the filtered water often has colour and turbidity measurementsabove the WHO maximum permissible. Duration of such incidences is short.
Slow sand filters suitability and performance for small or large communities are welldocumented in many papers (for example, slow sand filtration - L Huisman C W E Wood;Slow sand filtration Project Report Phase I by NEERI).
26

(v) Rapid gravity filtration: This type of filtration is generally employed to treat largevolumes of water;,but can also be used to supply small communities. More attentionhas to be paid to the filtered water quality. Two works which utilises R G F are inoperation on Mahe. Performance of one has been very satisfactory. The underdrainsystem on the other works failed shortly after acceptance necessitating extensiverepair work.
(vi) Shallow wells: Some of the coralline islands depend on shallow wells for the supplyof water. These are of course susceptible to pollution, from dirty buckets andinadequate protection from surface water pollution.
Installation of hand pumps and proper drainage around the well is one way of reducingthe incidence of pollution and the wells can be used to supplement rainwater roofcatchment. Consumers of such supplies are educated to sterilise drinking water byeither boiling or filtration, using a domestic gravity ceramic filter. (The ceramicis of similar material as the sterasyl candle filters)
Possible Area For Collaborative Research and Development Under The CSC Project
1) The use of crushed coral for pH correction of water.
2) The use of quick or slaked lime for pH correction.
3) Testing of locally available materials for use with different types of filter:
- slow sand filters;rapid gravity filters;
- pressure filters.
4) The use of activated carbon for the removal of colour.
5) Economic analysis of the use of the different type of filters.
Table 1: Community Water Supply
Urban PopulationServed
Rural PopulationServed
Grand Total
By HouseConnections
By PublicStandposts
Sub-total
1975
No'000
12.1
5.0
17.1
23.7
40.8
%
57
23
80
65
71
No•000
18.4
2.7
21.1
33.1
54.2
1980
%
75
11
86
80
82
Table 2 : Excreta Disposal
Urban PopulationServed
Urban and Rural
Rural Population withAdequate Disposal Systems
Grand Total
1975
1i
Connected tcPublicSewerageSystemsPit latrinesSeptic tankSoakwaySystemsBucketLatrines
No000
19.4
1.5
32.8
53.7
%
-
90
7
90
93
1980No'000
1.0
22.3
1.2
39.3
63.8
%
4
91
5
95
97Estimated Population: 57 850 (1975) and 65 900 (1980) 63% iiural and 37% Urban
27


Annex 6
VILLAGE WATER SUPPLIES IN PAPUA NEW GUINEAby W Guthrie
Introduction
Papua New Guinea is a country located at the cross roads of Asia and the Pacific. It isthe eastern half of the island of New Guinea plus the adjacent islands to the east inclu-ding Bougainville, the most northerly of the Solomon Islands. The land area of 4 77500 kmlies between 1 and 9 south latitude and supports a population of 3 million people. Threequarters of the people are subsistence farmers living in small groups or villages within160 rural local government councils.
Political Development
At independence in 1975 the country was divided into about 20 administrative districtswith a centralised bureaucracy in Port Moresby by which all major decisions and most minorones were made. However almost immediately pressure was applied by various quarters fora larger degree of autonomy in the running of the districts. The pressure lead to thenational government defining its powers and assets of national importance and relegatingall the.rest to the respective districts, renamed provinces, complete with elected assemb-lies and a financial allocation with very few strings attached. Large functional areas ofthe health department were decentralised as were the powers over local government councilsso that almost overnight the national government removed itself from the direct controlof village water supplies.
A policy is presently being drawn up allowing some measure of direction to be given bythe national government towards the spending of funds which it is preparing to allocatefor improving rural water supplies. At the moment the picture is not clear particularlywith respect to how much freedom the provinces should have in developing programmes. Ifthere is a wide divergence in approach between provinces the planning authorities may havedifficulty in setting priorities.
HISTORY OF WATER SUPPLIES
The country has had recent but intensive contact with western society with rapid technolo-gical change in the past 20 years. A generally high rainfall has meant that water suppliesat rural level have had a low priority in the minds of most people, especially with thenational government. The capital, Port Moresby, is located in the driest part of thecountry getting just over 1.0m of rain per year. The urban area is provided with anextensive gravity reticulated supply from the mountains to the north. The rural areas,which rely mainly on ground water, are the recipient of an expanded programme of villagewater supply construction funded by national government. Most of the rest of the countryreceives rainfall averaging 2.0 to 2.5m per annum with a few areas receiving as high as4.5m.
Apart from church missions and institutional supplies, the health department has been themost active in rural water supply construction. Various departmental programmes over thelast 30 years have been supplemented by a nationally subsidized programme using localgovernment councils as the sponsoring agent. This programme, an annual event, began in1969 and was intended to finance a wide range of projects of civil and architectural needs,of which water supply was only one. Although the annual government subsidy had reachedVS09 million by 1975, the year of independance, only a small portion of this was for watersupplies, thus reflecting the low priority the people, through their councils, attach tothis field.
Although agencies like the Health Department and the engineers of Local Government, anadvisory body attached to the Department of Works and Supply, push for an improved levelof village water supply useage, the people put their priority oh roads, bridges andprimary education.
Only recently has the national government sponsored programmes directly affecting villagewater supplies. The first of these was a project funded by UNICEF which acted as ademonstration to villagers in the highlands. Following the initial project construction,
29
the staff have remained to build the water supplies arising from the interest generatedby the demonstrations. A large portion of the money spent on the self-generated projectswas raised by the people requesting the supply. It was hoped the interest in constructionwould remain with the people when maintenance was required. It is too soon to tell whetherthis aim has been achieved.
There is a proposal before the planning office now for an Asian Development Bank assistedprogramme for village water supply construction in six provinces. The effectiveness ofthe policies now being formulated will be assessed when applied to the six provinces firstselected following which all provinces will be included in the programme.
Other National Agencies Involved in Water Supplies.
1. Appropriate Technology Development Institute. Located at the University of Technologyin Lae, the institute was formed in 1978. Its purpose is to undertake research intotechniques which can lead to the local manufacture of items better suited to PapuaNew Guinea market requirements. In the field of water supplies they are investigatingthe performance of a locally produced hydraulic ram as well as a new brand importedhand pump from Bangladesh for use on shallow wells.
They have been co-workers with the Local Government Technical Service in developinga technique for making ferrocement water storage tanks and are currently undertakingan investigation into a suitable material for ground level water catchment at therequest of one of the provincial governments.
2. Local Government Technical Service.
This group of roughly 100 artisans is a section of the Department of Works and Supplyand specializes in the technical requirements of small rural projects mainly roads,bridges and water supplies. In the group are half a dozen engineers and architectswho undertake design and supervise construction where required. In addition they runa school for the teaching of elementary skills of civil engineering to people who willbe employed by the local government councils. One of the courses is for people whowill construct and maintain village water supplies and consists mainly of basicplumbing skills. Part of the course is devoted to pointing out the need for improvedwater supplies so that the graduates can act as educators and assist in overcomingthe reluctance of village leaders to attach a high priority to rural hygiene throughincreased water useage. The school has 2 instructors and averages 15 students inclu-ding one or two each year from the Health Department, usually Health Inspectors whoseduties include water supply construction. Emphasis is on practical work and agraduating class will have built actual supplies needed by the community withintravelling distance of the school. Projects include spring improvements, small dams,polythene and PVC pipe joining, taps and standpipes, shallow wells and handpumps,galvanized iron and ferrocement tank construction, roof, gutter and downpipe plumbing,hydraulic ram installation, galvanized pipe threading and being familiar with termsused in pipe fittings and connections.
3. Bilateral agencies such as NZ Aid, International Human Assistance Programme andservice clubs provide direct financial assistance to water supplies according tocriteria laid down by the PNG Government. Large schemes may only be funded if theproject is already approved in the national budget. Financial assistance outsidethe budget is only allowed for project less than K2,000.
MAJOR PROBLEM AREAS
The major obstacle facing Papua New Guinea on water supplies is a social, not technicalone. Villagers are not particularly concerned about the need to have an improved supplyof drinking water. For most of the year, all but a few parts of the country have asupply of water sufficient for traditional purposes. Without a' greater public awarenessof the need for increased quantities of potable waters, efforts by the Health Departmentand national planners to force the pace of construction will meet resistence by the users.There is ample evidence that existing supplies are not being maintained and the neglect iswasting up to 50% of the funds spent on construction in any given year. Irrespective ofwhat percentage is considered "acceptable" waste, a more effective health educationprogramme is a pre-requisite to any stepped up construction activity. All too often the
30

village identifies the constructing authority as the agent for operation and maintenance,despite efforts to convey that it is the user who has the responsibility. As long as thewater supply is seen to be superfluous to the real needs of the community the situationwill not alter.
Aside from the long term goal of increased awareness through education certain factorscan improve the situation.
The identification of a community leader or person sufficiently concerned to act as afocus for community action is one. Getting the support of a service group such as a women'sorganization, a youth group or church association can provide an effective substitute forgeneral community concern. Identifying local leadership is thus a useful activity in awater supply programme for PNG.
31


Annex 7
TECHNOLOGY CHOICE FOR RURAL WATER SUPPLY
by Dr B B Sundaresan, R Paramasivam and V A Mhaisalkar, National EnvironmentalEngineering Research Institute.
Introduction
With the launching of the International Water Supply and Sanitation Decade (1981-1990)programme, rural water supply in developing countries is receiving systematic attention fromgovernments and international, bilateral and non-government organisations. Preparatorywork has started in member countries to assess the magnitude of the problem, likely invest-ments needed, material and manpower resources required and to formulate action plans toachieve the set target. For 100 per cent coverage (allowing for population growth) 1.8billion people in developing countries will need to be reached with clean water duringthe decade . According to a World Bank estimate, the total cost of clean water andsanitation for all by 1990 would be in excess of US#600 billion. The Bank has also estimatedthat by using cheaper and more appropriate technologies in both urban and rural areas, thecost could probably be halved to US#300 billion or less' '. It is, therefore, imperativethat the planning strategy, the methods of field delivery and technology to be adopted haveto be imaginative, innovative and appropriate. This paper outlines some of the technolo-gical considerations for rural water supply and presents a few examples relevant to thesocio-economic environment of developing countries.
Technology considerations
The major thrust during the decade programme will be directed towards the underserved andunder privileged rural masses of the Third World. They present complex situations andpeculiar problems. They are in small clusters, sparsely populated and often widely separa-ted with poor communication facilities. They are socially poorly organised, have differentsocio-cultural backgrounds and are dependent mainly on agriculture. The literacy level islow, skilled people, materials of construction, chemicals and electricity are scarce or notavailable. The technology package, therefore, should be simple, efficient, cost effectiveand economic. Science is universal, but technology has to be local. There is often atendency to oversimplify rural water supply systems as 'scaled down1 versions of urbansystems requiring less engineering skill and ingenuity, but the exact opposite may bethe case.
Integrated approach
It has been increasingly recognised that the problem of rural water supply is closelylinked to that of environmental sanitation and that if any project is to be successful,the approach should be an integrated and multi-disciplinary one. Not only must appropriatetechnologies be applied but they must also be linked to other sectors of rural developmentincluding education of villagers on the importance of proper use of water supply and sani-tation facilities, however, simple they may be. Community involvement and participationis another vital aspect which decides the success or failure of a water supply project orfor that matter any rural development programme. Increasing involvement of the communityin not just the construction and maintenance of the system, but all stages of planning andimplementation should be ensured to achieve the real benefit of investment in improvedwater supply.
Levels of Service
(i) Accessibility: The choice of technology is governed among other things by theintended levels of service - accessibility, per-capital supply and water qualitystandards. The accessibility of safe water supply in relation to the householdswhere it is to be used, is one of the crucial factors in enhancing its health andsocio-economic value. Ideally, a piped water supply with one or several taps ineach household is the obvious solution. But this is the most expensive. Thesimplest of the installations, a sanitary dug well or a bore-well fitted with ahand pump located not only from the point of view of accessibility but alsoaccording to the hydrogeological conditions will be the least expensive.
In an intermediate stage, a simple piped water supply system with distributionthrough public stand posts can provide water in acceptable quantities at distances
33
that are tolerable from a carrying point of view. One point source (hand pumpor PSP) for every 200-250 population and PSPs with 2 taps located at adistance of 100-200 meters are generally found to provide a satisfactory levelof service.
(ii) Per-capita supply: The per-capita supply varies greatly according to the populationserved, the technology used for producing water, the mode of distribution and theavailability of water at the source. A minimum of 40 litres per capita per daywhen supplied through point sources and 70 litres when piped is generally consideredsatisfactory^'.
(iii) Water quality standards: The standards of physical, chemical and bacteriologicalquality of drinking water should primarily aim at safeguarding public health andset as high as practical. The quality standards must be based on a realisticappraisal of local conditions and the possibilities of producing safe water, giventhe technology available. They can not be rigid but should be flexible and capableof being updated in tune with advances in knowledge about the occurrence, distribu-tion and health significance of substances in water.
Source Selection
By a judicious choice of the source of water supply, the need for treatment and the conserquent recurring cost could be minimised if not altogether eliminated. The source selectionmust be preceded by a detailed sanitary survey and when selected should be protected frompossible contamination. For purposes of evaluating raw water quality with respect toits treatment, the following criteria may be considered:
(i)Water requiring no treatment - this group is generally limited to undergroundwaters not subject to any possibility of contamination and satisfying in allrespects the requirements of drinking water quality.
(ii)Water requiring simple chlorination or its equivalent - this group includes bothunderground and surface waters subject to minimal pollution (total coliform notmore than 50 per 100 ml in any month) and meeting the physico-chemical qualityrequirements.
(iii)Waters requiring complete treatment (coagulation, filtration) including continuouspost-chlorination - this group includes all waters containing organic and inorganiccontaminants (turbidity, colour, bacterial pollution etc.)
(iv)Waters requiring special treatment e g iron and fluoride bearing waters,brackish waters etc.
The order of priority for selection of source would be as under:
(i) Water requiring no treatment to meet the quality requirements and which can bedelivered by gravity, e g springs and protected drainage areas.
(ii) No treatment but requires pumping, e g well waters.
(iii) Requires simple treatment such as storage, chlorination, slow sand filtrationor a combibation of these and could be supplied by gravity.
(iv) Simple treatment as in (iii) but requires pumping before delivery.
Rain Water Collection or Harvesting
In arid and semi-arid regions and in tropical islands where sources of surface water andground water of satisfactory quality are unavailable or costly to develop, rain watercontinues to be the only source of domestic water supply. Rain water harvesting requiresadequate provision for the interception, collection and storage of water. Either roofs orspecially prepared ground surfaces can function as catchment areas. When stored for longperiods, suitable measures to preserve the quality have to be adopted. In Central Mali,Botswana, Senegal and Sudan simple and ingenious methods to collect and store rain waterare reported to have been developed^4). In Gibralter and Jamaica, rain water harvestingis one of the very few options open for public water supply. Consumption from the limitedpublic supply is reduced by numerous privately owned systems which collect rain water fromindividual house roofs^'.
34

Spring Water
In mountainous and hilly areas, spring water, when properly protected by suitable measurescan provide a perennial source of supply without any treatment. Before development of aspring, a thorough sanitary survey should be carried out to obtain information on theorigin of ground water, the nature of the water-bearing strata, the quality and yield ofspring water during various seasons, the topography and vegetation of the surroundingarea and the presence of possible sources of contamination. More detailed descriptionof the methods of tapping spring water is presented elsewhere ^ ) .
Infiltration Galleries
An infiltration gallery is a simple means of obtaining naturally filtered water fromsub-surface. Essentially, it is a porous barrel laid within the sandybed, either axiallyor across a river course. A collecting well at the shore-end of the gallery serves asthe sump from where the filtered supply is pumped to serve the consumers. The normalcross-section of a gallery comprises of a loosely jointed or a perforated pipe envelopedby filter media of graded sizes making up a total depth of 2-3 m (Fig 1). Such a systemextensively practised in southern part of India for several decades eliminates the needfor extensive treatment units such as settling tanks, filters etc, which are beyond thecapacity of many rural and semi-urban communities. For small supplies, an infiltrationwell constructed right on a river bank can provide a simple source of filtered water.
Water Conveyance
Bamboo pipes which have been traditionally used in hill villages in Taiwan, Indonesia andthe Philippines to transport water under gravity can provide a simple, low cost alternativeto metal or plastic pipes. Recently 24 Indonesian villages on the slopes of Merapi Valcano,Java have laid a 90 km network of bamboo pipelines to supply water to 60000 people. Watersupply projects using bamboo pipes are currently in progress in three Tanzanian villages.Buried and treated with preservatives, some bamboo pipes in Taiwan have been supplyingsafe water for more than 15 years'^'.
Water Treatment
The treatment technology for rural drinking water will be primarily governed by twoimportant considerations, the (raw) water quality and the size of the community to beserved.
Ground Water
Ground water tapped by any one of the conventional methods such as driven wells, anddrilled wells is usually free from turbidity and colour, bacteriologically safe andhence good enough to drink without any treatment. However, experience has shown thatopen shellow dung wells in rural areas are prone to faecal contamination. Proper disin-fection of water from these wells with simple methods should be ensured to protectpublic health.
(i) Pot Chlorination: An earthen pot of 7 to 10 litres capacity with 6-8 mm diameterholes at the bottom is half filled with pebbles and pea-gravel of 20-40 mm size.Bleaching powder and sand (in a 1 to 2 mixture) is placed on the top of thepea-gravel and the pot is further filled with pebbles upto the neck. The potis then lowered into the well with its mouth upon (Fig 2). A pot containingabout 1.5 kg of bleaching powder should provide for about a week adequatechlorination of a well from which water is drawn at a rate of 1000-2000 litresper day. For small household wells, a unit consisting of two cylindrical pots(Fig 3), one inside the other has been found to work well (6). Other devicesfor well disinfection include drip feed chlorinators and constant headsolution feed dosers.
When water from a well is pumped to an elevated service reservoir for supplyby gravity, bleaching powder solution may be dosed by an arrangement as shownin Fig 4. Alternatively a differential pressure bleaching powder solutiondoser (Fig 5) can be used. The pressure difference created by insertion of anorifice or venturi in the delivery main is used to inject controlled quantitiesof solution into the water to be disinfected.
35

(ii) Iron removal: Ground waters often contain significant amounts of iron which isobjectionable from both aesthetic and economic considerations. The iron can beoxidised in simple aeration units and removed in a sand filter with or withoutprior settling. A household iron removal unit which can be used in conjunctionwith a hand'(force) pump is shown in Fig 6.
(iii) Defluoridation : There are several instances in India and parts of Africa whereground water is readily available for community water supplies but poses problemsdue to the presence of excessive fluorides. The Nalgonda technique developed byNEERI is a simple method for removal of fluorides. Depending upon the fluoridecontent and alkalinity of water, required quantities of bleaching powder and alumare added and the contents are thoroughly stirred for 10 minutes and allowed tosettle for 1-2 hours. The supernatant, which is free from excess fluorides is fitfor drinking. The method is amenable for application to individual as well ascommunity water supplies.
Surface Water
Waters drawn from surface sources such as ponds and lakes, canals and rivers are usuallypolluted and hence should be treated for domestic supply. The type and degree of treatmentwould depend upon the raw water quality, its seasonal variations, the size of community tobe served and other local conditions.
(i) Slow Sand Filtration: Is an excellent and most practical method of water treatmentfor rural and semi-urban water supplies. Slow sand filters (Figure 7) are simpleto construct, operate and maintain, produce a high quality filtered water requireno chemicals and are cost effective. When long periods of high turbidity areanticipated, simple pre-treatment such as storage, river-bed filtration or horizon-tal flow roughing filtration can sufficiently reduce the turbidity for treatmentby slow sand filters. They require a relatively larger area than conventionaltreatment systems, but this is not a constraint in rural areas of developingcountries.
(ii) Package Treatment Plants: Can play an important role in providing safe water tosmall communities and urban-fringe areas not served with piped water supply. Theyare usually pre-fabricated and pre-assembled and therefore have the advantages ofstandardisation and centralised supervision in their manufacture. Packaged plantsprovide for various unit processes and operations in a compact system. By virtueof their constructional and operational features, they require chemicals andskilled operating staff which means they are best suited to richer communitiesand institutions. A variety of package plants are commercially available tosuit specific requirements.
Solar Stills for Fresh Water
In tropical areas with abundant sunshine, solar energy can be effectively harnessed toproduce fresh water from saline or brackish water in solar stills. The technique is simplein operation and has a low maintenance cost. However, they have a low output per unit areaand require a higher initial investment. Their use is therefore limited to supplyingdrinking water to isolated communities, light houses, saltworks etc. Following extensivelaboratory and pilot plant studies, the Central Salt and Marine Chemicals ResearchInstitute (CSMCRI), Bhavnagar has installed solar stills at Navinar light house (nearJamnagar) to supply drinking water and several other units to produce distilled water.There are a few large installations of 'greenhouse' type in full scale operation to supplylarger communities, notably in Greece, Spain and Algeria*'4'.
Household Treatment
Isolated dwellings and farm houses with no access to piped water supply have to resort tohousehold purification methods. Some of these, which can also be used as emergencymeasures when a regular supply is disrupted, are briefly mentioned below:
a) Domestic Sand Filter: The unit which is essentially a mini-slow sand filter(Fig 8) consists of a drum 40 cm dia and 100 cm deep made of G I, ferrocement orany other local material. It is filled with 5 cm layers each of 3.0-6.0 mmgravel and 0.7-1.4 mm coarse sand topped with 40 cm of fine sand of 0.2-0.3 mm
36

size. Water to be filtered is allowed to flow into the unit through a strainer-cum-distributor placed at the top. It filters slowly through the sand layer andis collected in a storage vessel. The unit can give about 100 litres of cleanwater per day which can satisfy the drinking and cooking needs for a family of6-8 persons.
(b) Candle Filters: Ceramic candle filters of the 'Berkefeld' type can provide aconvenient means of household water treatment. The filter unit is made up oftwo containers vith the filter candles attached to the upper container andcovered with a removable lid (Fig 9). Water to be purified is poured into thetop container, trickles through the candle(s) and is stored for use in thelower compartment. Only clean water should be used with ceramic filters asturbid water will clog the candles quickly. The candles need periodic cleaning/replacement depending upon their useful life. Manufactured indigenously by anumber of Indian firms such filters are available in the market under differenttrade names.
(c) Chlorine Tablets & Ampoules: Chlorine containing compounds made from bleachingpowder in tablet form and ampoules of chlorine solution are readily availablein many countries. In India, based on the know-how developed by NEERI, a numberof firms are manufacturing these. They are quite good for disinfecting smallquantities of water but are costly. After adding the chemical in the prescribedquantity, the water is stirred and allowed to stand for 30 minutes beforeconsumption. If the water is turbid, it may be necessary to increase the doseof the chemical.
Water Distribution
Water supply through individual house connections with one or more taps located at conve-nient points within the house and in adequate quantity and pressure will be the most idealmethod of water distribution. It is also the most expensive system. Where people canafford such a system, it can produce social, economic and health benefits. It can alsoyield a revenue to the water agency to partly or wholly offset the operation and maintenancecost of the system. On the other hand, such a system is beyond the economic means of mostof the communities in developing countries. Wastewater and sullage resulting from such awater supply, if not properly drained away, will create not only unsightly conditions, butalso pose health hazards. For instance, the population at risk to filariasis in India hasbeen steadily increasing with increase in water supply coverage. Stand-posts, for example,are subject to vandalism and negligence in use which can lead to wastage. They limit theuse of water thereby reducing personal and domestic hygiene standards. In addition, it isoften difficult to collect revenues from users of standposts. Inspite of their many short-comings, public stand posts should be preferred as the intermediate choice if water has tobe distributed to a large number of people at a minimum cost and in a short span of time.The delivery system could be upgraded in stages as the community's economic status improves.
Conclusion
Summing up,the paper is an attempt to focus some of the important considerations in thechoice of technology for rural water supply in the context of the decade goal to providewater for all by the year 1990. A few examples of water supply technology appropriate tothe socio-economic environment of rural communities in developing countries have beenreviewed. The importance of an integrated approach to water supply and sanitation,community participation and education has been indicated.
References
1. Comprehensive Report on the International Drinking Water and Sanitation Decadefor the U N General Assembly, UN, New York, 1980.
2. Water Supply and Waste Disposal, Poverty and Basic Needs Series, World Bank,Washington, DC 1980.
3. Manual on Water Supply & Treatment (2nd Edition, 1976, CPH & EEO,Ministry of Works & Housing, New Delhi.
4. Martin Beyer : Drinking Water for Every Village - Choosing appropriate technologies-Assignment Children, Water & Community Development, 34,April issue, 1976, UNICEF.
5. Earthscan Press Briefing Document, No 22, September 1980.6. Small Community Water Supplies - Technology of Small Water Supply Systems in
Developing Countries - IRC Technical Paper Series 18, August 1981.
37
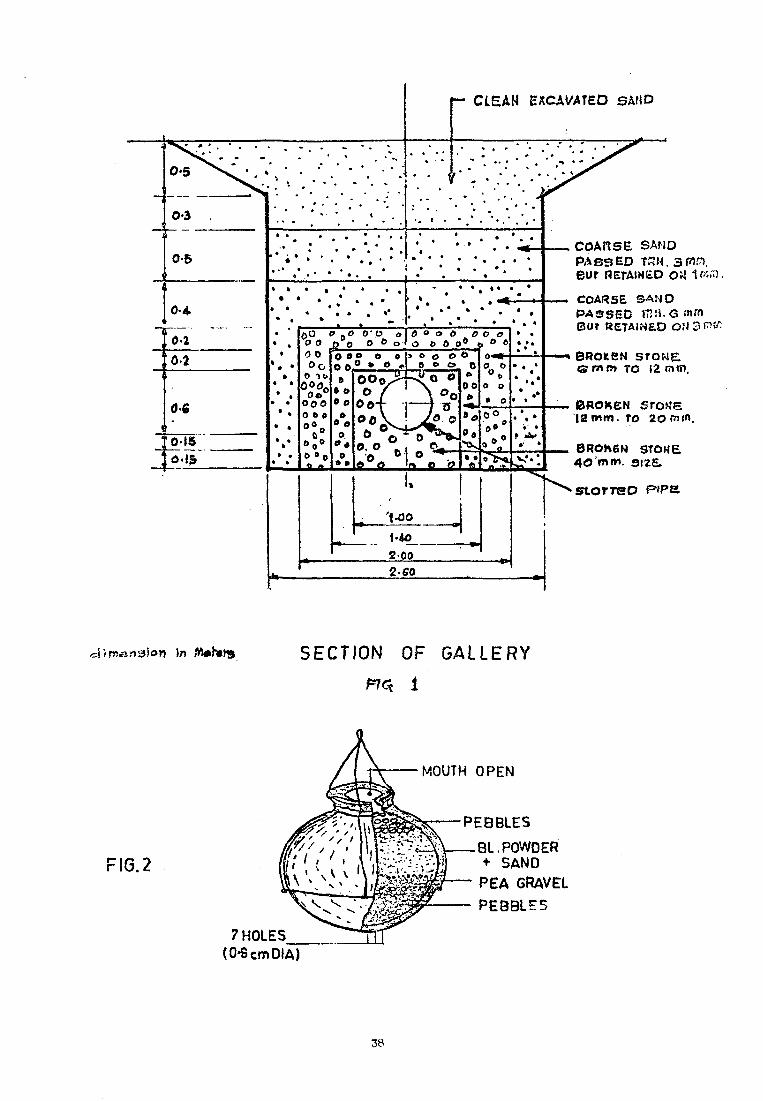
I— CLEAN EXCAVATED SAND
COARSE SAHDPASSED TRH. 3Pin.EOF RETAIN£D OH 1f»
COARSE SANDPASSED 1T2M.G «'«m0or RETAINED
BROKENTO i2 mm.
BROKEN Sros'5|2 mm. To 2O
8ROh6N STOME4O'mm.
StOTTBD
In SECTION OF GALLERY
1
FIG.2
7H0LES__(0-ScmDlA)
MOUTH OPEN
PE8BLES
BL. POWDER+ SAND
PEA GRAVELPEBBLES
38

FIG. 3PLASTIC OREARTHEN BLEACHING
-POWDER 4SAND
' FiG.
CHEMrCAL_
saunoN
CONSTANT HEADDOSING
illCONNECTION TOMAKEUP TANK
STOPCOCK-^
SOURCE OF3'wTPLY
SiMPLE CHLCRINATiG.v SYSTEMS
FJ0.3 : CHFFEPIENTIAL PRESSURE 6. P SOLUTION DO3ER
39
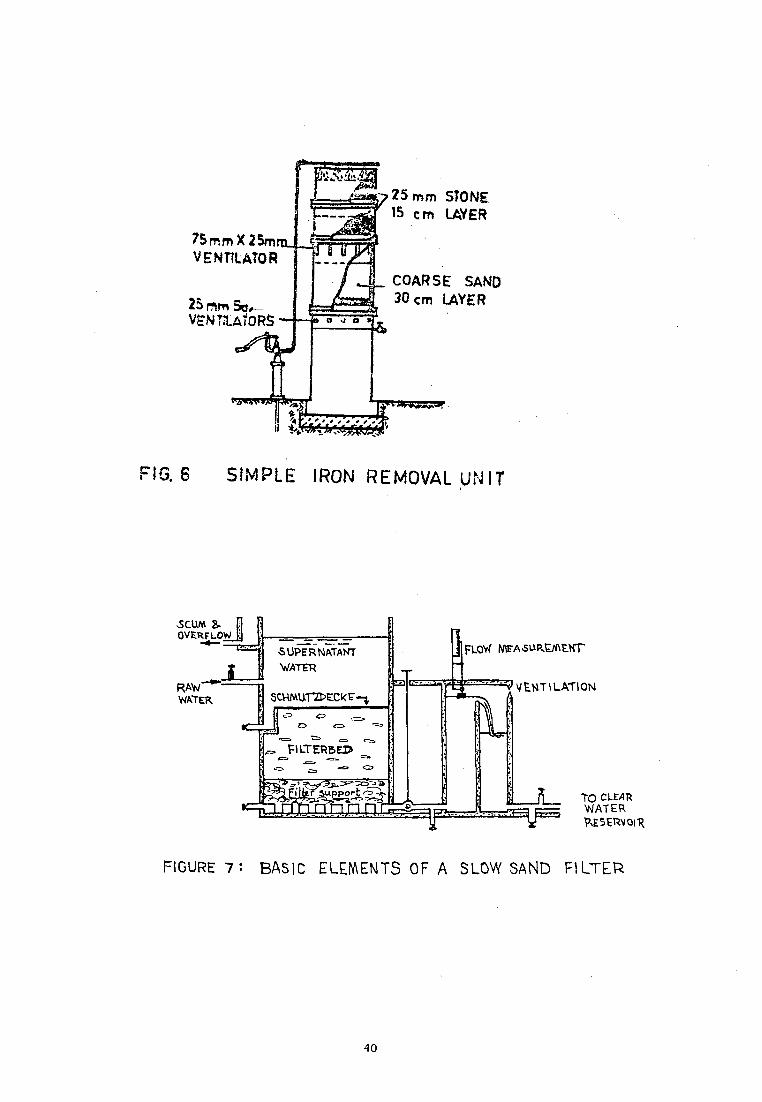
75 mm X 25mVENTILATOR
STONEIS cm LAYER
COARSE SAND30 cm LAYER
FIG. 8 SIMPLE IRON REMOVAL UNIT
•SCUIA X. |i]OVERFLOW
RAWWATER
SUPERNATANTWATER
FILTERBEJ*
"=3
FLOW ^AE•A6UR.E/<\EK^
^VENTILATION
TOWATER
FIGURE 7 : BASIC ELEMENTS OF A SLOW SAND FILTER
40

KILTS?? van
40 Cm DIA
• UKmm~.tQCm K
40 Cm
100 Cm
PIT* ) RATED T«AY(REMOVABLE)
4 0 Cm
A 9Cm j#«»«%w»w«» VMI
FILTERED WATERSTORAGE VESSEL
40 Cm DIA->-
•5?*
^
WL
» g i% i. ts * -i n „
P50E3TAL
50 Cm
SECTJON FILTER UNIT
r -2? im PERFORATIONS
HOUSE HOLD FILTER UNIT
FIG. 8
41

WATER CQNiTAINSft
CAWOLc
Fig.9 CANOLE- FILTER
42

Annex 8
RURAL WATER SUPPLY SYSTEMS IN TAMIL NADU - PLANNING AND IMPLEMENTATION
by R Krishnaswamy, Chief Engineer (G & C), Tamil Nadu Water Supply & Drainage Board.
Introduction
The objective of the Rural Water Supply Programme is to make safe, potable and perennialwater available in close proximity to the rural population. It implies among other things,that the system should be operated with a technology able to withstand rural conditions,capable of being restored in minimum time and at lowest cost in case of any breakdown andrequiring the minimum maintenance by levels of technical personnel normally available inthese areas. The national policy states that the government should strive to promote thewelfare of the people independent of location, status, customs, habits etc. Thus thepriority for water supply systems for rural areas lies on par with urban areas. In India,where about 80 per cent of the population live in rural areas and the country's overalleconomy is agriculturally oriented the physical, social and economic development of thissector requires no further emphasis. If the targets of International Drinking Water Supplyand Sanitation Decade are to be reached, the investment on rural water supply on globalbasis should be raised to 3.9 times the current level. This document expresses thevarious stages of development in planning and implementation of rural water supply systemsin Tamil Nadu.
Geographical Background
Tamil Nadu State lies between latitude 8°5" and 13°35' North and between longitude 76°15'and 80°20' East. The state extends to 130069 sq km with a long coastal line of about1000 km. The climate is tropical with certain areas under temperate conditions-for part -of the year. The temperature varies from 18°C to 43°C averaging 30°C in the plains. Theaverage precipitation is 945.7 mm and varies from 500 to 1750 mm. There is a narrowstretch of high mountains along the western edge of the state and this forms the importantwater shed Most of the rivers flow from West to East. About 73.4 per cent of the areais archean (hard rock), and the balance is sedimentary.
There are 5 major river systems and over 95 per cent of surface water utilisation is forirrigation through riparian rights. As regards ground water potential, it is estimatedthat about 18,000 M m of recharge is available and that it is under various stages ofexploitation. About 13,000 M m is being extracted at present and the balance could beharnessed in specific areas. In absence of legislation to control extraction of groundwater, the water table in many areas of the State is progressively going down. Thishydrological imbalance forces unnecessary annual expenditure by way of deepening thewells and wastage of energy by way of extra lift of water.
In this State over two-thirds of urban water supply and invariably all the rural watersupplies are from ground water.
Demographic Background
As per census figures the population of Tamil Nadu has grown as follows :
Year Population in million
1941 ... 26.27
1951 ... 30.12
1961 ... 33.69
1971 ... 41.20
1981 ... 48.30
The population growth has put a heavy load on developmental activities including provisionof drinking water supply. The rural population as per the 1981 census is 28.80 million.This population is spread over 378 panchayat unions. From a study made during themiddle of last.decade, the rural areas have been identified into 47,075 habitations, thedetails of which will be dealt with later.
43

Rural Water Supply Background
Till late 1970, provision of drinking water supply in rural areas was not adequate andbudget provision in this sector was far below the demand. A total sum of Rs.201.24million has been spent in this sector from 1895-1971. There was no comprehensive programmetill about 1971, resulting in stagnation in the provision of rural water supply to villages,A modest start was made from the end of 1971-72 based on the then available statistics.Subsequently in 1973-74 a study was made on the status of drinking water supply in ruralareas based on the additional statistics from various organisations and the villages wereclassified under three heads :
scarcity villagesendemic villagesinadequate villages
Scarcity village refers to one without any potable water source within 1.6 km, where thewater table is more than 15 m below ground level or where there is inadequate water supplyto weaker sections; endemic village-refers to one which need either the protection of theexisting source or treatment of water available in the source, (cholera endemic, guineaworm infested etc, or due to non-potability); and inadequate village refers to one whichdoes not have adequate or sufficient water supply or supply is not perennial.
A programme was evolved and water supply to endemic and scarcity villages was providedfrom 1974 to 1976. Due to drought conditions, additional schemes were also taken upduring 1976-77 to provide water supply to villages affected by drought. However, a largenumber of representations from the public came during the progress of the above works.Subsequently a review of the earlier classifications indicated the following:
the unit namely village was not clearly defined
the data was not collected on a scientific pattern but based on views ofindividual revenue officers
the data were collected in some places where the officers did not haveadequate knowledge of that area, nor did they check the water sourcesscientifically
the statistics were inaccurate due to several reasons such as misclassification,non-reporting etc.
Hence, to eliminate the above short comings, a re-survey was taken up in 1976. This timethe term 'habitation' as a unit was introduced and defined as a 'cluster of houses witha minimum population of 100 and more than 250 metres away from a neighbouring habitation'.A good source has been defined as a 'publically owned, protected, perennial source ofpotable water'. The data were then collected by over 5000 gram-sevaks (village levelworkers) and were checked by various other officers. The results of the above re-surveybrought out the following six categories of habitation:
Classification Definition No of habitations
Type 1 Habitations with no source within 1 kmdistance from the habitation 3,567
Type 2 Habitations where the source yield onlynon-potable water for a distance upto 1 km 2,051
5,610
Type 3 Habitations where water is potable and perennialbut the source is either privately owned orunprotected 4,955
Type 5 Habitations where there is no good source withi,nthe habitations but an alternative good sourceis available within 1 km
Type 6 Habitations where there is good source available
Total:
44

Planning of Rural Water Supply Systems
Although the priority was defined as above, in the first instance habitations coming undertypes 1 and 2 were taken up in 1977-78 under the minimum needs programme in the StateGovernment sector and under the accelerated rural programme under the Central GovernmentSector. The water supply systems in rural areas are installed conforming to the followingnorms:
NORMS FOR RURAL WATER SUPPLY PROGRAMME
Population Group(ultimate stage)
SourceService Reservoir Distribution
mains
1. 0-300
2. 301-750
3. 751-1500
4. 1501-3000
a. One deep borewell with hand pumpif the source is inside thehabitation
( or )
b. One deep borewell with power pumpif the source is outside thehabitations
One deep borewell with powerpump irrespective of whetherthe source is inside or outsidethe habitation
-do-
-do-
10,000 litres withstaging height of6 m
15,000 litres withstaging heightof 6 m
30,000 litreswith a stagingheight of 6 m
60,000 litres withstaging heightof 7.5 m
500 m length
1000 m length
1500 m length
2000 m length
5. Above 3000 -do- 100,000 litreswith a stagingheight of 7.5 m
2500 m length
NOTE : 1. Ultimate population2. Per-capita supply3. Public fountains
130 per cent of present population40 litres/dayOne public fountain for every 150-present population
The total cost of covering all the habitations is about Rs. 4,200 million.
By 1980, the work on providing water supply to habitations 1 and 2 was nearing completion.At this stage the Government of Tamil Nadu revised the priority of providing water supply.Integrated development of a region was taken up and water supply was clubbed with otherneeds of the rural areas such as roads, schools etc, the region prioritised and habitationscoming under types 1 to 5 were taken up in the region. This facilitated development ofthe entire region in all aspects. Incidentally this provided facilities for planning andimplementing comprehensive water supply schemes in most of the regions. The aboveprogramme was taken up in 3 phases comprising:
I Phase
II Phase
III Phase
69 Panchayat Unions
150 Panchayat Unions
159 Panchayat Unions
The above three phases have been taken up from the years 1980-81, 1981-82 and 1982-83onwards respectively. Under this programme, all the habitations upto category V will becompleted by 1985. Provision of water supply to habitations under type 6 where the watersupply is inadequate will be taken up during the period 1985-1990. Thus it is planned tocomplete the rural water supply systems in accordance with the International Water Supplyand Sanitation Decade Plan of 1981-1990.
45

1977-78
1978-79
1979-80
1980-81
1981-82
1,140
1,404
843
1,196
606
Implementation
Implementation of rural water supply poses a lot of problems in locating the source andmode of construction. However, the problem of locating the source is being tackled bytrained geologists using geophysical equipments and by other methods. The TWAD Board haveacquired 69 drilling rigs to implement the programme. RCC service reservoirs are construc-ted for maintenance-free service. Wherever required, alternative materials like PVC, HDPE,AC are used for pipe lines. A central purchase and stores organisations has been developedto plan and procure materials for the schemes. Research and development activities havealso been oriented in providing necessary plant in rural areas for removal of iron in water.A method for lifting water using Gobar Gas has also been taken up on trial basis and iscurrently under evaluation.
The works so far completed are furnished below:
Financial year Habitations benefitted Expenditure incurredType 1 and 2 Type 3 to 5 (Rs. in millions)
71.5
86.03
102.23
1,104 180.70
3,052 300.00
The remaining works are programmed to be completed as contemplated earlier. In thisconnection, it is to be pointed out that the initial finance for rural water supply systemsare met from State and Central Funds. The Government have arrived at a norm of slashingpercentage from 60 to 5 to be contributed by the Panchayat Unions depending on theirfinancial conditions towards cost of providing these rural water supply schemes. But nopanchayat has come forward to share the cost of the system.
Community Participation
Community participation, a tool for planning and management, may be distilled into thefollowing four criteria :
a. involvement in planning programmes
b. involvement in implementing programmes
c. sharing benefits of programmes
d. involvement in evaluation of programmes.
Taking into account the educational and socio-economic aspects of the community, it ispossible to involve the community in sharing the benefits of the programmes. The ruralmass in Tamil Nadu is fully prepared to share the benefits of the programme and that isa very important element in planning and implementation.
Operation and Maintenance
At present about 27,000 hand pumps and 11,900 power pumps are under operation in Tamil Nadu.A three-tier system was developed in Tamil Nadu, which was also extended to other parts ofthis country. Under this system, the hand pumps are maintained by personnel such as pumpcaretakers at habitation level, a fitter at Union level and a mobile team at Divisionlevel. The village caretakers are trained to carry out minor repairs and for day to daymaintenance works. A fitter is located at union level and is meant for limited repairsbeyond the capacity of the caretaker. A mobile team is located in division level (oneor more in a District) for major repairs on pumps.
46

With power pump schemes, a mobile team with all facilities is provided for repairs of ablock of 500 power pumps and an electrician for a block of 100 pumps. Operation of thepumps is carried out by local bodies.
As mentioned earlier the real benefit of providing a social welfare programme such as ruralwater supply depends largely on the ability of a system to be put back into use in theshortest possible time, preferably at village level itself with the men, materials andmethods available locally. In this regard, the present India Mark II pump was consideredbetter to other types of hand pumps based on the periodicity of major repairs, longivityetc. However, the above pump requires a mobile team whenever the pump has to be taken outfor repairs. UNDP in collaboration with World Bank has programmed to take up field testingand development of a rural water supply hand pump with a view to improve upon the perfor-mance and reduce the cost of maintenance. The TWAD Board is in a position to participatein the UNDP World Bank project as the monitoring - maintenance organisation of theState has been well established and is also active.
47


Annex 9
PACKAGE TREATMENT PLANTS-AN EFFECTIVE TOOL FOR RURAL WATER SUPPLY
by H V Krishnaswamy, General Manager & S R Alagarsamy, Joint Manager (PH),Richardson & Cruddas (1972) Ltd, First Line Beach, Madras-600001, India.
Introduction
The water supply systems in rural areas depend mostly on ground waters and occasionallyimpounded tank/lake waters. Though the quality of such waters, especially the groundwaters are considered superior to other waters such as river water with respect to turbidityand bacterial quality,ground water can be worse in certain respects due to the presence ofchemical constituents such as iron and fluoride.
Water Quality
Ground water, which is the major potential source of rural water supply systems in thecountry, is contaminated either with iron or fluoride. Figure 1 shows the states andzones where the iron bearing ground exi6t in India. It shows that the iron bearing watersare found in pockets, in the Southern, Central, Eastern and North Eastern parts of India.
A survey conducted on the quality of ground waters in and around Madras City, indicatea varied concentration of turbidity, iron etc in ground water (Table I).
Figure 1 - States Showing Pockets of Iron Bearing Water in India
NAGIAND
49

Table I: Characteristics Of Groundwater In And Around Madras City
1.
2 .
3 .
4 .
Location
Saligram, Madras
Bhana Veedu Thottam
Sriharikota
Avadi, Madras
Source
Open well
Open well
Open wellBore wellBore wellBore wellBore wellBore well
Bore well*
II II I IIVV
New Wells
pH
6.4-7.2
6.4-6.7
6 .76 . 86 .26 .76 .46 .7
6.8-7.2
CharacteristicsTurbidity(mg/l)SiO2
165-370
8-14
702447
400*900*
1160*
87-94
Total iron '(Fe)mg/1
6.4-9.4
0.5-1.8
3.52 .43 .32 .62 .43 .2
5.0-6.2
From Table I, it can be seen, that the turbidity and total iron content of open wellwaters vary from 8 to 370 mgA and 0.5-9.4 mg/L respectively. In the case of bore wellwaters, (except the new ones) the turbidity and total iron content were in the range of24-94 mg/l and 2.4-6.2 mgA respectively.
Similarly, it is seen that the ground water of certain zones in 7 states, namely Kerala,Tamilnadu, Andhra Pradesh, Maharastra, Rajasthan, Haryana and Punjab are known to containfluoride in varying degrees (Fig 2). The fluoride bearing ground waters is reported tocontain fluorides ranging from 1.50 to 5.00 ppnr . It is also shown' ' that the impoundedlake/tank waters contain turbidity in the order of 28-42 mg/l. Hence, the ground waterswhich are tapped for rural water supply systems through dug wells and bore wells, alsorequire treatment for removal of iron or fluoride and improvement in turbidity andbacterial quality.
Figure 2 : States Showing Pockets of Fluoride Beaching Water in India.
#«5
k MIA50
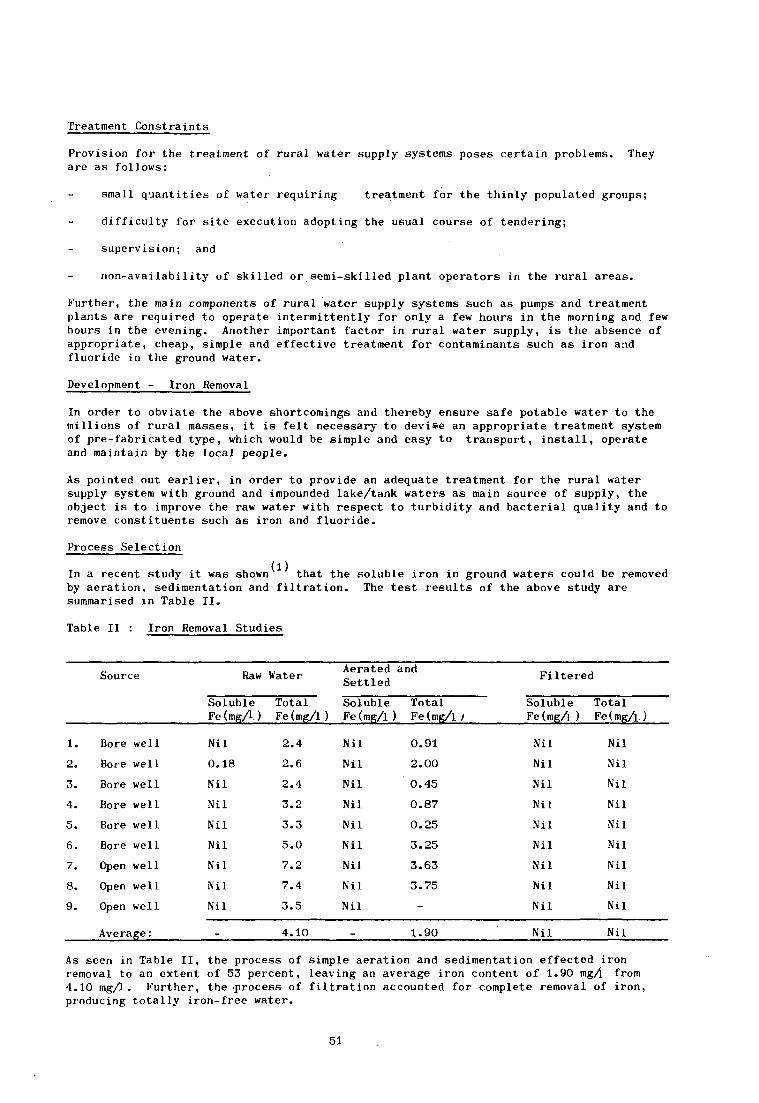
Treatment Constraints
Provision for the treatment of rural water supply systems poses certain problems. Theyare as follows:
small quantities of water requiring treatment for the thinly populated groups;
difficulty for site execution adopting the usual course of tendering;
supervision; and
non-availability of skilled or semi-skilled plant operators in the rural areas.
Further, the main components of rural water supply systems such as pumps and treatmentplants are required to operate intermittently for only a few hours in the morning and fewhours in the evening. Another important factor in rural water supply, is the absence ofappropriate, cheap, simple and effective treatment for contaminants such as iron andfluoride in the ground water.
Development - Iron Removal
In order to obviate the above shortcomings and thereby ensure safe potable water to themillions of rural masses, it is felt necessary to devise an appropriate treatment systemof pre-fabricated type, which would be simple and easy to transport, install, operateand maintain by the local people.
As pointed out earlier, in order to provide an adequate treatment for the rural watersupply system with ground and impounded lake/tank waters as main source of supply, theobject is to improve the raw water with respect to turbidity and bacterial quality and toremove constituents such as iron and fluoride.
Process Selection
In a recent study it was shown that the soluble iron in ground waters could be removedby aeration, sedimentation and filtration. The test results of the above study aresummarised in Table II.
Table II : Iron Removal Studies
1.
2.
3.
4.
5.
6.
7.
8.
9.
Source
Bore well
Bore well
Bore well
Bore well
Bore well
Bore well
Open well
Open well
Open well
Average:
Raw
SolubleFe(mgA)
Nil
0.18
Nil
Nil
Nil
Nil
Nil
Nil
Nil
-
Water
TotalFe(mg/1)
2.4
2.6
2.4
3.2
3.3
5.0
7.2
7.4
3.5
4.10
AeratedSettled
SolubleFe (mg/l ;
Nil
Nil
Nil
Nil
Nil
Nil
Nil
Nil
Nil
-
and
Total) Fe(mg/l;
0.91
2.00
0.45
0.87
0.25
3.25
3.63
3.75
-
1.90
Filtered
SolubleFe (mgA )
Nil
Nil
Nil
Nil
Nil
Nil
Nil
Nil
Nil
Nil
TotalFe(mg/i )
Nil
Nil
Nil
Nil
Nil
Nil
Nil
Nil
Nil
Nil
As seen in Table II, the process of simple aeration and sedimentation effected ironremoval to an extent of 53 percent, leaving an average iron content of 1.90 mg/l from4.10 mg/l . Further, the process of filtration accounted for complete removal of iron,producing totally iron-free water.
51
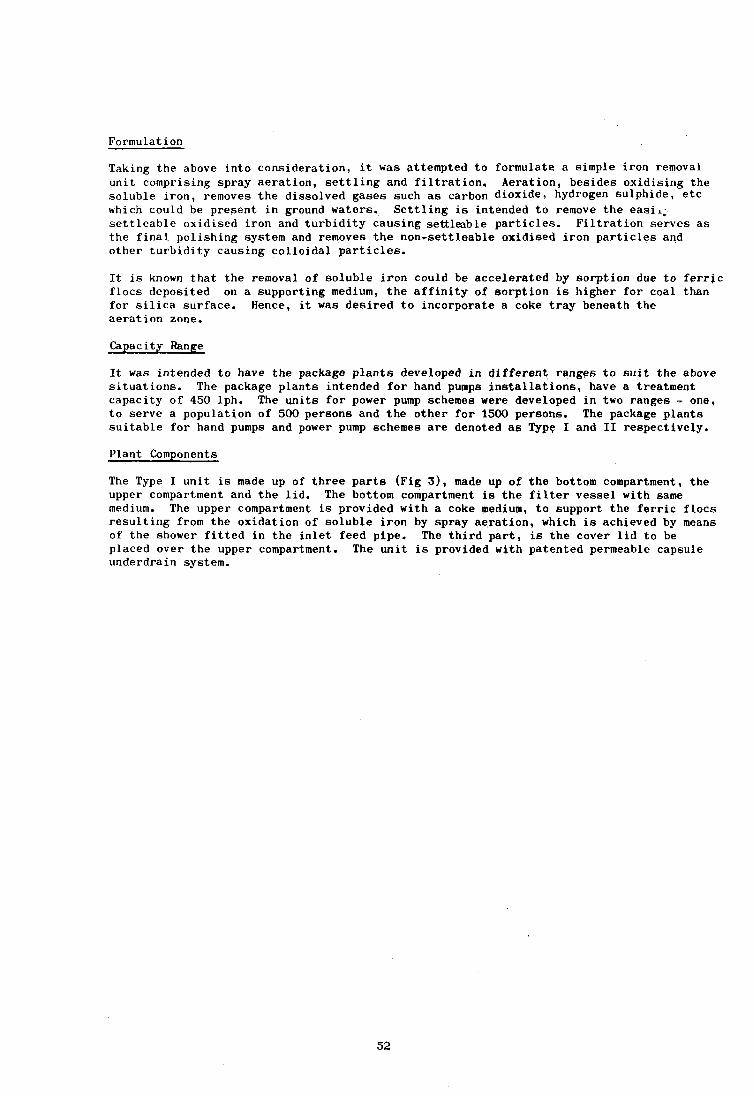
Formulation
Taking the above into consideration, it was attempted to formulate a simple iron removalunit comprising spray aeration, settling and filtration. Aeration, besides oxidising thesoluble iron, removes the dissolved gases such as carbon dioxide, hydrogen sulphide, etcwhich could be present in ground waters. Settling is intended to remove the easij.;settleable oxidised iron and turbidity causing settleable particles. Filtration serves asthe final polishing system and removes the non-settleable oxidised iron particles andother turbidity causing colloidal particles.
It is known that the removal of soluble iron could be accelerated by sorption due to ferricfloes deposited on a supporting medium, the affinity of sorption is higher for coal thanfor silica surface. Hence, it was desired to incorporate a coke tray beneath theaeration zone.
Capacity Range
It was intended to have the package plants developed in different ranges to suit the abovesituations. The package plants intended for hand pumps installations, have a treatmentcapacity of 450 lph. The units for power pump schemes were developed in two ranges - one,to serve a population of 500 persons and the other for 1500 persons. The package plantssuitable for hand pumps and power pump schemes are denoted as Type I and II respectively.
Plant Components
The Type I unit is made up of three parts (Fig 3), made up of the bottom compartment, theupper compartment and the lid. The bottom compartment is the filter vessel with samemedium. The upper compartment is provided with a coke medium, to support the ferric floesresulting from the oxidation of soluble iron by spray aeration, which is achieved by meansof the shower fitted in the inlet feed pipe. The third part, is the cover lid to beplaced over the upper compartment. The unit is provided with patented permeable capsuleunderdrain system.
52
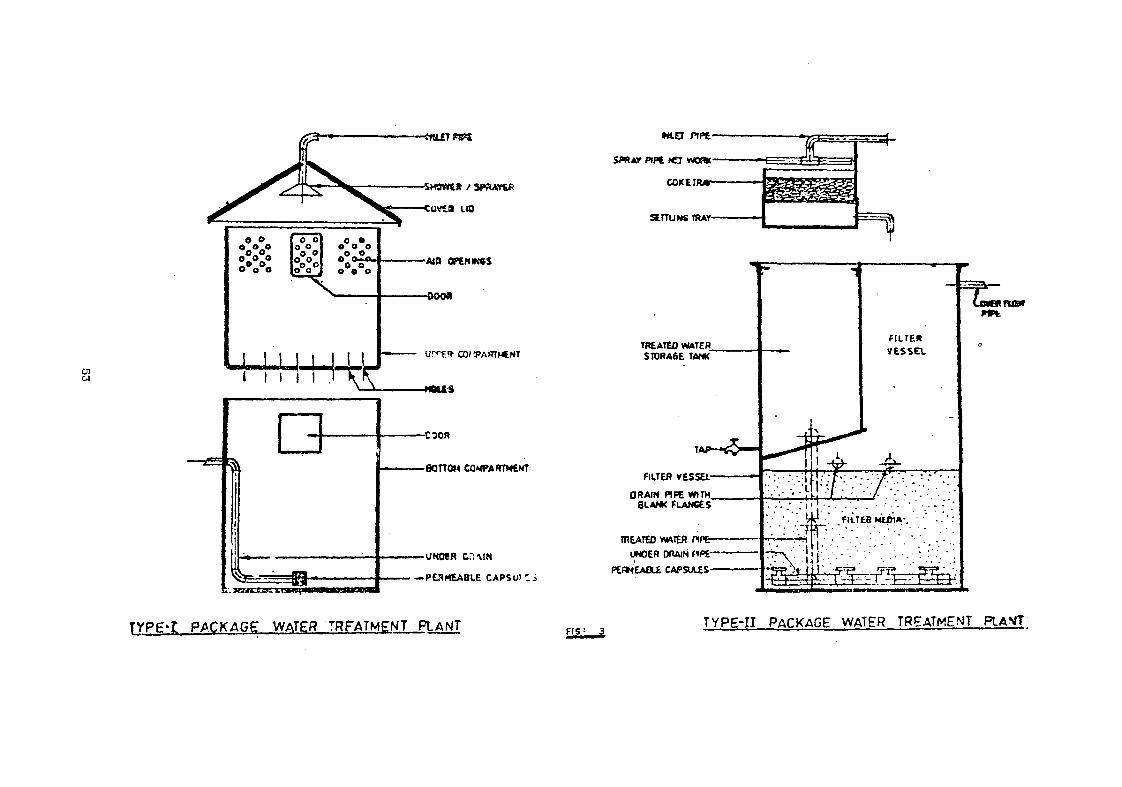
O!
f t f r COfPABTMtNT
-coon
-BOTTOM COMPARTMENT
-UNOfR C":MN
TREATED WATERST0RA6E TAMK
DRAIN pire WITHBLANK FLANGES
mEATED VWVTEflUNDER DOWN F<PE-
PERMEAOi CAPSIZES
TYPg-I PACKAGE WATER TRFATMENT PLANT TYPE-I I PACKAGE WATER TREATMENT PLANT

The Type II package treatment plants comprise the main filter vessel containing filtermedium with PVC laterals and patented under drain permeable capsules (Fig 3). The plantsare also provided with in-built treated water storage tanks. The accomplishment of ironremoval components, consisting of a coke tray and a settling chamber, is placed over thetreated water storage tank. The raw water is pumped and sprayed over the coke mediumthrough a spray pipe network and thereafter allowed to settle in the lower compartmentbefore filtration takes place in the main filter compartment. The treated water storagetank is provided with taps through which water is drawn into pots and vessels.
Plant Performance
The performance of package plants was observed on demonstration units located in and aroundMadras. The data collected over a period of five months are presented in Table III.
Table
1.
2.
3.
4.
5.
Ill:
Raw
6.4
6.4
6.7
6.7
6.7
Performance of Package
pHTreated
7.2
6.9
7.2
7.2
6.7
Plants At Bhanaveeduthottam
TurbidityRaw
13.0
12.7
13.7
12.0
8.0
(mgATreated
1.2
1.2
1.2
1.2
0.35
IronRaw
1.2
0.5
0.65
1.75
1.50
(Fe)mg/1Treated
0.1
Nil
0.1
0.20
0.15
The performance data presented in Table III, are in respect of Type II package plant putup at a village known as Bhanaveedu Thottam near Poonamalli on the outskirts of Madras.The plant was installed in November 1977 for treating water of a shallow open well. Theplant did not require washing operations after 3 months of usage. This is due to the lowturbidity and low iron content of raw water.
The experience in the other case with Type II plant at Sevasamajam Boys' Home, Saligram(Madras) was very different. Upon installation, the plant was commissioned and the qualityof treated water was found to deteriorate after 2 days of operation. This was investigatedand the behaviour of the plant was attributed to the high turbidity and iron present in theraw water (Table IV).
Table IV: Raw Water Characteristics At Saligram
PH Turbidity mg/L SiO Iron mg/i Fe
1. 6.4
2. 6.6
3. 7.1
4. 7.2
5. 6.8
310
265
165
220
370
6.4
6.5
7.2
6.6
9.6
In order to reduce the turbidity on the filter, a plain pre-settling tank was incorporatedbefore the filter unit. By providing the plain pre-settling tank, the load on the filterwas considerably reduced (Table V), thereby improving the performance of package plant.
54

Table V: Characteristics of Settled Water at Saligram
1.
2.
3.
4.
pH
6.5
7.3
6.9
7.3
Turbidity mg/l 6iO2
26
20
53
43
Iron Fe mg/i
2.95
3.25
3.40
3.25
The removal of turbidity and iron was estimated at 86 and 56 per cent respectively. Thesettled water was found to have a moderate turbidity, varying from 20 to 53 units and ironvarying from 2.95 to 3.40 mg/x. After making provision for the settling tank, the filtermedium of the package plant required washing once in 7 to 10 days after operation.
The package plants were also found to improve the bacterial quality of treated water, asseen from the data presented in Table VI.
Table VI: Bacterial Quality of Treated Water at Bhanaveedu Thottam
Total Faecal E Coli Total plate countSource coliform coliform MPN/100 ml MPN/ml
PN/100 ml MPN/100 ml
Raw water 2.1 x 10³ to 3.9 x 10^ to 2.3 x 10^ to 1 x 10?
4.6 x 10³ 7.5 x 10 4.3 x 10
Treated water 4.3 x 10 to 9.0 x 10 4 x 10 to 4.3 x 10³
9.3 x 10 9 x 10
Although the package plants could improve the bacterial quality of treated water, thetreated water would still require disinfection which could be carried out with the patentedPVC chlorine cartridge employing bleaching powder, especially in the treated water storagetank of Type II plants.
Material For Construction
In order to bring down the cost of the plants, the Type I Units were first made in RCC andmarketed. Subsequent experience in handling and transportation of individual and bulkunits, especially to distant places had indicated damages to the units and hence, it wasattempted to make the plants in mild steel with epoxy painting inside and attractive enamelpainting on the outside. Although the mild steel units are stronger and non-breakable, theycall for regular maintenance such as painting, due to rapid corrosion of units especiallylocated on coastal areas. In order to improve the units and make them free from regularmaintenance of plants shells, it was desired to completely fabricate the plants in FRP.Thus, the Type I plants are now made available in RCC, M S and F R P .
The empty weights of these units are presented in Table VII.
Table VII: Empty Weights Of Type I Units:
Type of Unit Weight in Kgs
R C C 200
M S 80
F R P 12
In view of the large sizes involved in Type II Units, the plants are fabricated in M Swith epoxy painting inside and attractive enamel paint on the outside.
55
Placement Of Package Plants
The Type II plants can be located on or below ground level, to suit the handpumps or beprovided at elevated positions adjacent to existing overhead storage tanks of residentialbuildings. The plants can also be provided at the floor levels of houses with tappingfrom the overhead tank. In such cases, a storage tank of adequate capacity may be providedif required. Installation of Type I plants for existing lift (hand) pumps call for loweringthe unit in a pit (Fig 4), as the plant height is more than the pump spout height fromthe base alternatively, the pump base can be lifted on to a pedestal, facilitating theposition of package plant on or near ground level. In case of an alternative arrangementfor operating the pump handle with ease, it may be necessary to provide an operating plat-form of sufficient height in line with pump pedestal level. The Type I plants can also beinstalled at ground level with force lift (hand) pumps. In this case, both the pump base andthe plant base will be kept on or above ground level as shown in Figure 4.
Type II plants can be mounted on masonry pedestals at ground level. While the raw water iseither pumped or fed from elevated storage tanks, the treated water can be collected in pots,vessels, etc from the taps provided in the package plant. The arrangement is shown in Fig 5.
Type II units can also be mounted on stagings of required height of gravity distribution oftreated water to the required places (Fig 5). In this case, the staging platform should belarge enough to accommodate operating personnel at the time of installation and cleaningof package plant.
In the case of existing water supply installations having well, raw water pumps and overheadtank, the package plant can be incorporated in between the raw water pumps and the overheadtank. The treated water from the package plant has to be collected in a sump (an additionalprovision). The existing pumps will first feed the water into the plant and the treated waterwill then be collected in the sump. After operating the plant for the required duration, thetreated water collected in the sump can be pumped to the overhead tank by the existing rawwater pumps.' For this operation, suction and delivery lines should be provided as shownin Figure 5.
56

x**\
PLANT
TYPE - I PACKAGE PUNT KSTAULATION WfTH EXSTfrC LFTHAND PUMP
IYf>E-I PACKASE PLANT
FORCE UFT HAND PVJNP
TYPE-I PACKAGE RANT INSTALLATION WITH FORCE LIFT HAND P l M 1
ilS—4-

II
^ I I PLANT AT ElEVATON. TYPE n PLANT AT GROlND IB/EL
00
WTTH5TYPE-n PLANT
AND (MR HEAD TANK

Filter Washing
The package plants will require washing of the filter medium. Necessity of washing isascertained as and when there is overflow through the overflow pipe provided in the filtercompartment of the units. The interval between successive washings varies and depends onthe initial turbidity and iron content. Experience indicates a smaller interval of one weekfor turbidity around 40 mg/l and 1-2 months for waters with low turbidities (less than 10mg/l). Washing of the filter medium involves removal of first 6 to 10 cms of filter medium andwashing is done manually with water so as to free it from sediment.
The coke medium needs washing once in 6 to 24 months, depending on the iron content in rawwater. In the case of Type I, plant door openings are provided in both bottom and uppercompartments to enable removal of the top layer of the filter medium and coke, when required.The unit is also provided with a drain pipe to empty the water in the bottom compartmentprior to the removal of filter medium for washing. The Type II unit is provided with drainpipes and blank flanges which can be removed to drain out the water column on the filter bed.These plants are also provided with conventional backwashing arrangement by reversing theflow from treated water storage tank to the filter unit. This is found useful for lowturbidity waters. The wash water will be collected through the drain pipe provided just abovethe top of the filter medium.
Installations In India
A sizable number of R&C Package plants have been installed in various parts of the country.The total number of units installed at present is 178, of which the Type I units there are147, of Thpe II-A 18, and of Type II-B 13. The state-wise deployment is shown in Figure 6.
Figure 6: Installation of R 8c C Plants In India
59

Package Plant For Fluoride Removal
Similar to the package plant developed and marketed, efforts have already been made todevelop a defluoridation unit-fluoride removal plant suitable for hand pump installations.The treatment system selected for the development pf defluoridation package plant is ofconventional chemical treatment employing alum and lime. It was shown ( ' in a case study,that with the alum-lime treatment the raw water fluoride content of 2.6 mg/l could bereduced to 1.0 mg/l. The fluoride removal pattern, was investigated and is graphicallyrepresented in Figure 7.
The first testing installation is to be deployed shortly in the field. The demonstrationpackage plant consists of chemical dosing system, flocculatIon, settling and package plantfiltration unit (Fig 8).
Summary
Water treatment in rural areas and isolated colonies poses great problems, as the in situexecution of conventional treatment systems such as slow sand and rapid sand filters are notfeasible and practical, due to the large number of dwellings that use the hand pump andpower pump schemes as the mode of water supply.
Prefabricated package units will provide an ideal solution for such situations. The packageplants developed for hand and power pump schemes for water having iron and turbidity haveyielded excellent results. The treated water quality of such package plants is well withinthe acceptable standards in respect of turbidity and iron. The plants are easy to instal,operate and maintain. They do not involve addition of chemicals or use of mechanicalinstruments.
References
1. S R Alagarsamy and M Gandhirajan, - "Package Water Treatment Plants for Rural andIsolated Communities", Journal of the IWWA Vol, XIII No 1, Jan-March 1981
2. "Defluoridation", - Technical Digest No 1 - National Environmental EngineeringResearch Institute, Nagpur.
3. M R Balasubraraanian and M Gandhirajan, - "Cyclic Coagulation of Surface Waters inLaterite Soils", J Indian Chem Soc, Vol LV, May 1978, pp 522-523.
4. S R Alagarsamy, M Gandhirajan and K V Ravichandran - "Treatment Proposal for an ExistingFluoride Bearing Water Supply System", Journal of the IWWA Vol XIV No 1 Jan-March 1982.
60

Annex 10
PACKAGE PLANTS FOR RURAL WATER SUPPLY
by V A Mhaisalkar, R Paramasivam and Mrs S S Dhage, National Environmental EngineeringResearch Institute, Nagpur-20, India.
Introduction
An adequate supply of safe water is regarded as an every day necessity of life in largecentres of population. This basic amenity, however, is not readily available to smallcommunities and institutions which are remote from public water supply undertakings. Smallwater systems can not benefit from economies of scale as do large urban systems, becausethe number of connections served is small. Certain types of services however, must beprovided no matter how few the service connections. Package water treatment plants can meetthe needs of such communities wherever there is a source of supply suitable for extraction.Package plants incorporate various unit processes and operations in a compact system. Theyare usually pre-fabricated and pre-assembled and therefore, have the advantages of standar-disation and centralised expert supervision in their manufacture. By virtue of theirconstruction and operational features, they generally require chemicals and skilled opera-ting staff, which can be more readily provided only by economically independent communities.This paper briefly presents the basic requirements of a package plant, factors influencingtheir choice, reviews available in design and experience and describes a simple systembeing developed in NEERI.
Requirements Of A Package Plant
Package plants should be capable of producing finished water, of quality comparable tothat obtainable from any conventional field installation. To suit rural areas and isolatedcommunities, a package plant, should as far as possible satisfy the following requirements:
low capital cost
simplicity of operation and maintenance
maximum reliability with minimum mechanical equipment
low operation and maintenance cost
quick and easy to install with minimum on-site construction work.
Factors Influencing The Choice Of Package Plants
The specification and choice of any individual plant, will depend on the quality and natureof water to be treated and the desired quality of the finished water. For example, aspring water with low turbidity may need only filtration followed by chlorination, whereasriver water may need coagulation, clarification, filtration and chlorination. Where thesurface water contains not more than 20-30 units of turbidity and colour less than 10 ppm,alum addition followed by direct filtration and chlorination should prove adequate. Groundwater often contains a significant amount of unoxidised iron or fluorides. In such cases,it is necessary to provide for settlement followed by filtration and chlorination. Availa-bility of a regular supply of chemicals and trained operators, is a crucial factor in thesuccessful application of package plants. From practical considerations it may not beeconomical to design a plant for less than a few hundred population. The maximum capacityupto which a package plant can be economical will depend upon local conditions. Restrictionon the size of an individual unit is governed by transport facilities and road clearance.
Package Plants In India
In India, package water treatment plants have been in use for several years, mainly forindustrial and swimming pool water treatment. More recently, these plants find increasingapplication in community water supplies. A few of the conventional types and recentlydeveloped systems are briefly described :
Pressure Filters
Wellknown as package plants, these are suited for direct filtration of alum dosed rawwaters with low turbidity (<20 units). They have been used extensively for small water
61

supplies in collieries and also for rural water supplies in Andhra Pradesh and in a fewother states. Experience with pressure filters for rural water supplies, however, hasnot been satisfactory because of poor operation and maintenance.
When raw water turbidity exceeds above 20 units for long periods, provision for clarifica-tion preceeding filtration is essential. Package plants are available which incorporatechemical dosing, clarification, filtration and disinfection i e from source to overheaddistribution reservoir with one step pumping. With trained staff manning these plants,high quality finished water could be obtained.
Package Slow Sand Filters
Where raw water turbidity is uniformly low (<30 units), package plants employing slowsand filters can provide the appropriate treatment technology. These filters can also beused to purify water from open dug wells, which are generally found to be grossly contami-nated. Filter units made of pre-cast R C C pipes having a diameter of 1.0 m and operatingfor 24 hours a day at a filtration rate of 0.1-0.2 m/hr depending upon the raw waterquality, can produce 1.9-3.8 m of filtered water per day. At a rate of 10 litre percapita (only for cooking and drinking) this can cater to the needs of 190-380 population.As a second line of defence, chlorination may be desirable. The system consists of rawwater storage tank, filter unit and filtered water storage tank. Preceeded by aeration,such units can be used for treating iron bearing ground waters.
Multi-inlet, Multi-outlet (MIMO) Filters
Developed at Roorkee University , the package consists of (i) an inlet-cura-stillingchamber, (ii) parallel flow alum doser, (iii) solid media flocculator, (iv) multi-bottomsettler, and (v) MIMO filter and parallel flow chlorine doser (Fig 1) The specialfeatures of the design are the multi-bottom settler and the MIMO filter. The multi-bottomsettler consists of closely spaced inclined plates set at a slope sufficient to induceself cleaning action. The detention time is only 5-10 minutes as compared to 2-3 hoursin conventional units. The settled water is distributed to the filter through a number ofinlets and the filtered water is also collected by a number of outlets. Because of this,the filtration rate is as low as 2.4 m/hr. The filter sand used is rather fine and thedepth of sand between the inlet and outlet is also less (20 cm) than the conventional.Such units are reported to give satisfactory performance with raw waters of turbidityas high as 4000 units.
Commercial Designs
There are a number of commercial firms in India who have developed their own designs ofpackage plants under different trade names. These plants which are essentially based onknown principles of water treatment, have their special characteristics of design andoperation. Small package plants with provision for manual chemical addition and mixingand operated on batch a system, are also marketted.
Lessons From Experience
There is limited published information on the performance of various types of packageplants used in India. The findings of performance evaluation studies of package watertreatment plants in USA highlighted below, however, should serve as a pointer to theshape of things that may exist in developing countries. Ninety per cent of the watersystems in the US serve less than 10,000 people and account for 21 per cent of the popula-tion served by community systems. Small systems tend to have more water quality problemsand facility deficiencies than do large systems.„•,Table 1 summarises results from thecommunity water supply survey conducted in 1969 . It can be seen from the Table, that50 per cent of the utilities serving 500 people or less did not meet the USPHS drinkingwater standards. As utility size increases, the percentage of utilities meeting thestandards increased.
62
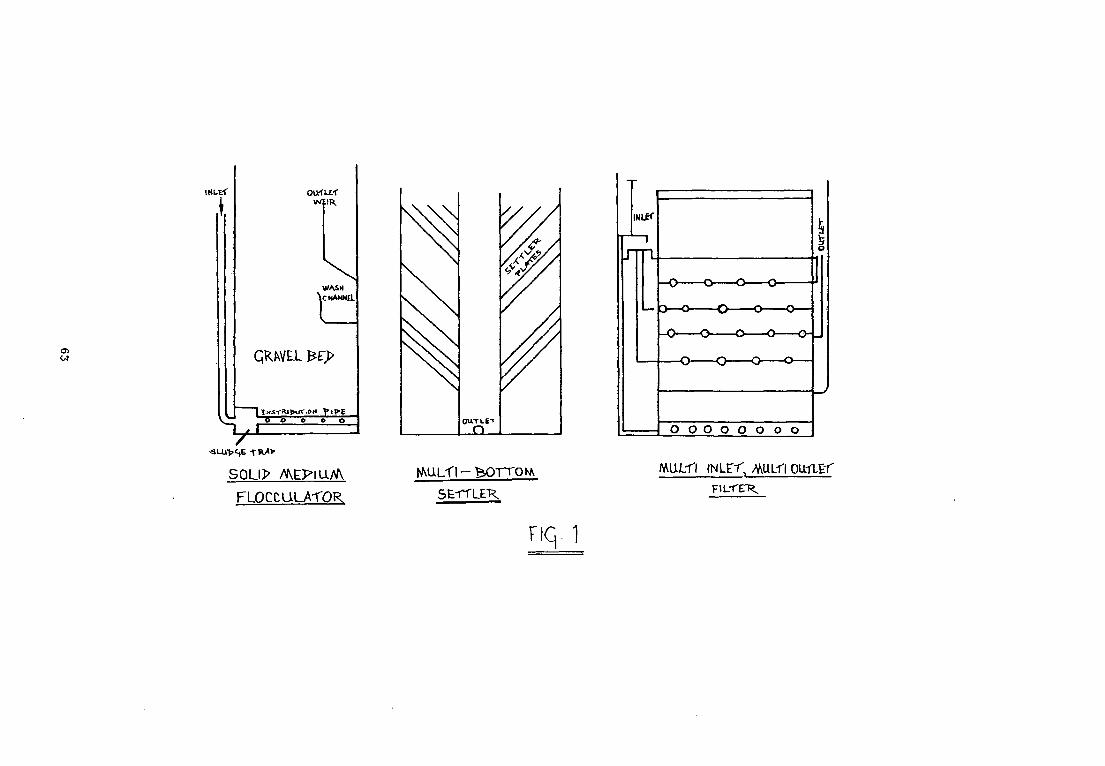
at01
WASH\cHANNfl.
QKWE1
^O O O
SOU>
FLOCCULArOR
OU.TLET
n O O O O O O O o
MULf l (NLC^ /VyUL-n OUfLET
5E-TTLEK
nq. 1

AlJUAV
W*f£R INUfL
WA1TR OU-fLET
5?WATER, acru-r-^i:
BACKWASH WATtR INLET —»-
O iQo JU3O 300
(E5 051mm UC 1-40—)
^rry SI2.E
FIQ 2:WA1ER TREAfMeNT PLANT
64

Table 1 - Summary Of Water Quality Evaluation
500 or less
Population Group Served
501-100,000 Greater than All Populations100,000
Number of systems 446 501 22 969
Percent of Systems
Evaluation of systems
Met drinking waterstandards 50
Exceeded recommendedlimits 26
Exceeded mandatorylimits 24
Survey populationin each group(in thousands) 88
67
22
11
4,552
73
27
13,463
59
25
16
18,103
A recent evaluation_study of 36 package water treatment plants constructed in the 1970'sshow the following ° :
The majority of sites visited had personnel who did an inadequate job of plant operation.In one case, an operator was incorrectly reading a burette, causing all of his titrationcalculations to be off by a factor of 10. In another case, the operator was not determiningturbidity properly. At most plants, chemicals had been purchased according to the manufac-turer's recommendations and were used in the same dosage every day regardless of raw waterquality. Some operators had not purchased chemicals or had not added chemicals that hadbeen purchased. Coliforms were detected in the finished water of 3 out of the 31 plants inoperation. Eight did not meet the federal turbidity standard of 1 NTU. The reportconcludes that package plants when properly operated and maintained are capable of provi-ding good quality drinking water. All these indicate the need for greater simplicity andbetter reliability of package water systems.
Work At NEERI
As part of its R & D on simple, low cost water treatment methods, NEERI is currentlyworking on the development of a package plant suitable for treating surface waters ofvarying turbidity. The system provides for chemical (alum) dosing, flocculation, clarifi-cation and filtration in one modular unit. The special features of the design are the useof unconventional coagulation/flocculation system and elimination of practically allmechanical equipment (excepting valves and piping). A schematic of the unit is shown inFigure 2.
Raw water dosed with the coagulant chemical enters the unit at the bottom of the hopper andrises upward through the pebble bed where coagulation and flocculation take place. Thepebble bed and the space above can function as a sludge blanket clarifier. The clarifiedwater then flows down the filter in the annular space between the cylindrical portions.The filtered water is collected from the outlet provided just above the sand level of thefilter.
Though this would limit the maximum permissible headloss, the chances of air-binding andoccurrence of negative head with the attendant problems are liminated. No rate controller
65

is required and the filter would operate with a variable head i e the water level above thesand bed will continually increase as the filtration proceeds. When the permissible (pre-determined) maximum level is reached, the filter is back-washed as in the case of a conven-tional filter. Only hardwash for a period of 10 minutes is adequate to leave a clean bed.There is no need for a headloss indicator. The entire unit can be made of steel, or fibrereinforced plastic.
A laboratory unit designed to treat 90 litres/hour has been fabricated (design data inTable 2) and its performance studied for treating raw water with a turbidity in the rangeof 50-300 NTU. The performance data are presented in Table 3. It can be seen that witha raw water turbidity upto 300 NTU, a settled and filtered water turbidity of less than20 NTU and 1 NTU respectively could be consistently obtained. Further studies are inprogress to assess the performance of the plant with raw waters of different turbidity andat different flow rates.
Table 2 Design Data
Design flow rate :
Pebble bed flocculator:Media size :Depth :
Clarifier:Surface overflow rate :Detention time :
Filter:Rate of filtration :Filter sand :Effective size :Uniformity coefficient :Depth :
Supporting gravel (graded):Size :Depth :
90 litAr
25 to 38 mm30 cm
i • «3 m/nr1 hr 45 minutes
1.01 mAr
0.52 mm1.460 cm
0.7 to 25 mm27.5 cm
Underdrain system - Perforated G I Pipe of 12 mm diameter with 6 mm diameter orifices(26 nos ) spaced at 5 cm c/c.
Table 3 :
Raw WaterTurbidity(NTU)
95-120
160-210
54-110
260-300
58-120
Performance Data
Alumdose(mg/1)
20
60
50
50
30
TurbiditySettled water
10-18
6.5-18
4-14
7-18
12-24
- NTUFiltrate
0.2-0.5
0.2-0.8
0.2-0.6
0.5-1.0
0.4-1.0
Lengthof run(hrs)
72
46
48
26
26
Terminalheadloss(cms)
58.5
50.0
48.0
-
23.0
66
Conclusion
In the coming years, greater application of package plants will be made, stimulated bythe rising construction costs that preclude the use of custom designed treatment facilitiesfor small communities. Experience with package plants in India and the USA indicates thatwith proper selection operation and maintenance, these plants are capable of producingfinished water to meet the requirements of quality standards. The need for more simplicityand greater reliability of these plants should prompt further research and developmentto evolve systems that are appropriate to the needs of small communities in developingcountries.
References
1. "Low Cost Water Treatment for Developing Countries" Second InternationalConference, Loughborough University, V K 1975 - Patwardhan, S V.
2. Community Water Supply Study : Analysis pf National Survey Findings, U S Departmentof Health, Education and Welfare, Public Health Service, Environmental HealthService, Bureau of Water Hygiene, July 1970 p i.
3. Package Water Treatment Plants, Vol I. A Performance Evaluation,EPA-600-2-80-008a, July 1980.
67


Annex lla
SLOW SAND FILTERS FOR SAFE WATER IN RURAL AREAS
by R Paramasivam & V A Mhaisalkar, National Environmental Engineering ResearchInstitute, Nagpur 400 020, India.
Introduction
Modern technology offers a choice of treatment methods that can produce virtually anydesired quality of product water from any source. The limiting factor is cost ratherthan technology. Water supply systems for villages have to be technologically sound,economically viable, environmentally compatible and socially relevant. When ground waterof acceptable quality and in adequate quantity is readily available, it would be the firstchoice due to simplicity and economy. There are numerous instances, however, where groundwater is not available or if available poses problems due to excessive fluorides, iron andmanganese or high salinity. In such cases, surface waters may be the only sources of watersupply. These are invariably polluted and have to be treated for domestic supplies. Thetreatment system should be such that it meets the real needs of the population and iswithin the capabilities of the community to implement, operate and maintain.
Slow Sand Filtration
Slow sand filtration is essentially a biological purification process in which the waterto be treated is passed through a bed of filter medium, usually sand. During its passage,the suspended and colloidal impurities are retained in the bed, harmful bacteria, virusesand cysts are substantially reduced or eliminated, organic matter is broken down intosimple innocuous substances and a safe water is produced. The advantages of the processsuch as its simplicity of design, operation and maintenance and its ability to bring abouta simultaneous improvement in physical, chemical and bacteriological quality of raw watermake it an appropriate technique for small and medium water supplies in developing countries.In each of its functions, it represents the nearest approach to the processes that occur innature and has unusual powers to suffer misuse without failure and a capacity for self-regeneration after such misuse . When raw water turbidity is high (30 NTU) for longperiods, pre-treatment by storage, sedimentation or simple rapid filtration may benecessary.
The slow sand filter essentially consists of a water-tight cistern containing a supernatantraw water reservoir, a bed of filter sand, a system of underdrains and a set of filterregulation and control devices (Fig 1). It is cleaned periodically by removing 2-3 cmlayer of filter sand including the biologically active film on top. These filters requirea relatively larger area and manual labour for cleaning, both of which are readily availa-ble at low cost in rural areas of developing countries.
Integrated Research and Demonstration Project
Eversince their introduction for purification of municipal water supply about 150 years ago,slow sand filters continue to enjoy the reputation as a reliable means of water treatment.Even today industrialised cities like London, Antwerp and Amsterdam use slow sand filtersin large numbers. There is a general, however, misconception among water supply professionalsin developing countries, that slow sand filters are old fashioned and therefore inferior tothe more recent but sophisticated systems. In order to demonstrate the relevance andefficacy of slow sand filters and to promote their large scale use for rural water supplies,a research and demonstration project was taken up by NEERI in collaboration with theInternational Reference Centre (IRC) for Community Water Supply and Sanitation, TheNetherlands.
Applied Research
The project has been implemented in two phases. In the first phase, literature surveyand applied research on pilot as well as full scale installations of slow sand filters werecarried out under different operating conditions and raw water quality. Specifically theperformance of filters in relation to the following was studied:
the quality of raw water with regard to turbidity and bacterial pollution;
the effect of filtration rates higher than the traditional 0.1 m/hr (2 gallons/sq ft/hr);
69
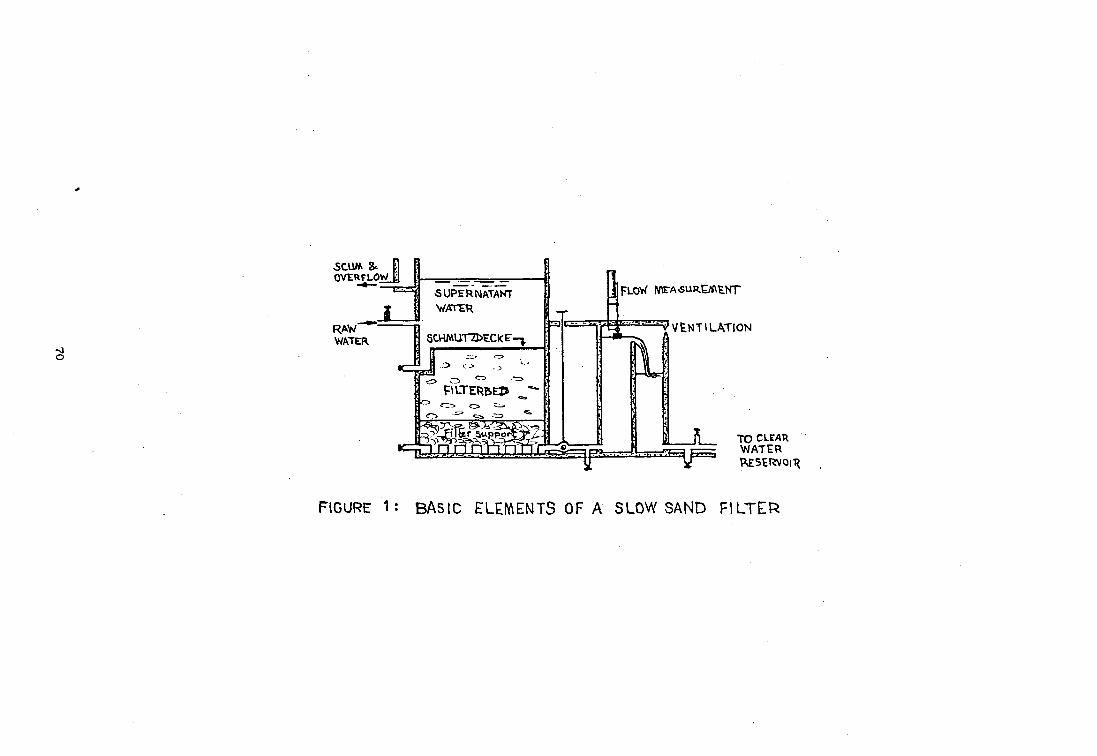
8. ElOVERFLOW H
RAWWATER
SUPERNATAKTWATER
5=9 C J _ °
FLOW ME-ASUR.E/i\tNT
^VENTILATION
? p>? •. r H , •• *?̂ =3 H T
TO Cl.E/»TlWATER
FIGURE 1 : BASIC ELEMENTS OF A SLOW SAND FILTER
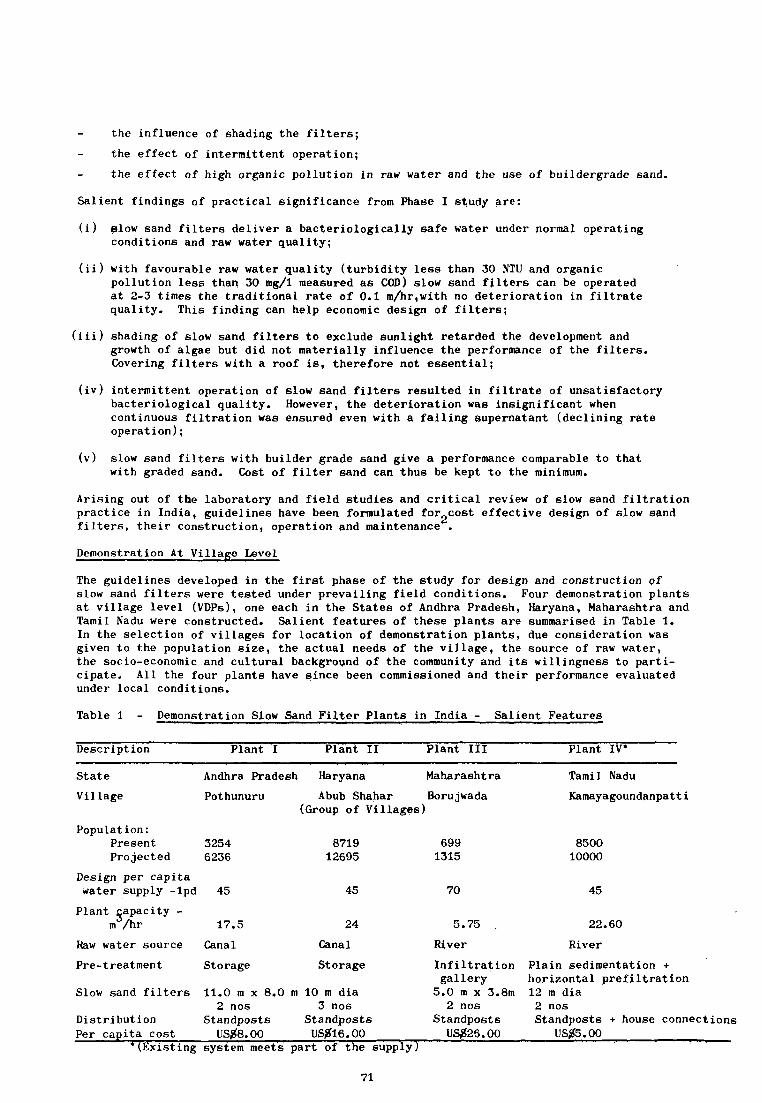
the influence of shading the filters;
the effect of intermittent operation;
the effect of high organic pollution in raw water and the use of buildergrade sand.
Salient findings of practical significance from Phase I study are:
(i) slow sand filters deliver a bacteriologically safe water under normal operatingconditions and raw water quality;
(ii) with favourable raw water quality (turbidity less than 30 NTU and organicpollution less than 30 mg/1 measured as COD) slow sand filters can be operatedat 2-3 times the traditional rate of 0.1 m/hr,with no deterioration in filtratequality. This finding can help economic design of filters;
(iii) shading of slow sand filters to exclude sunlight retarded the development andgrowth of algae but did not materially influence the performance of the filters.Covering filters with a roof is, therefore not essential;
(iv) intermittent operation of slow sand filters resulted in filtrate of unsatisfactorybacteriological quality. However, the deterioration was insignificant whencontinuous filtration was ensured even with a falling supernatant (declining rateoperation);
(v) slow sand filters with builder grade sand give a performance comparable to thatwith graded sand. Cost of filter sand can thus be kept to the minimum.
Arising out of the laboratory and field studies and critical review of slow sand filtrationpractice in India, guidelines have been formulated for_cost effective design of slow sandfilters, their construction, operation and maintenance .
Demonstration At Village Level
The guidelines developed in the first phase of the study for design and construction ofslow sand filters were tested under prevailing field conditions. Four demonstration plantsat village level (VDPs), one each in the States of Andhra Pradesh, Haryana, Maharashtra andTamil Nadu were constructed. Salient features of these plants are summarised in Table 1.In the selection of villages for location of demonstration plants, due consideration wasgiven to the population size, the actual needs of the village, the source of raw water,the socio-economic and cultural background of the community and its willingness to parti-cipate. All the four plants have since been commissioned and their performance evaluatedunder local conditions.
Table 1 - Demonstration Slow Sand Filter Plants in India - Salient Features
Description
State
Village
Population:PresentProjected
Plant I
Andhra Pradesh
Pothunuru
32546236
Plant II
Haryana
Abub Shahar(Group of Villages)
871912695
Plant III
Maharashtra
Borujwada
6991315
Plant IV*
Tamil Nadu
Kamayagoundanpatt i
850010000
Design per capitawater supply -lpd
Plant capacity -m3/hr
Raw water source
Pre-treatment
Slow sand filters
DistributionPer capita cost
45
17.5
Canal
Storage
45
24
Canal
Storage
70 45
11.0 m x 8.0 m 10 m dia2 nos 3 nos
Standposts StandpostsUS#8.00 USgl6.00
5.75 .
River
Infiltrationgallery5.0 m x 3.8m2 nos
StandpostsUS#26.00
22.60
River
Plain sedimentation +horizontal prefiltration12 m dia2 nosStandposts + house connections
US$5.00'(Existing system meets part of the supply)
71

Project Organisation
A noteworthy feature of the project is the integrated, multidisciplinary and collaborativeeffort among research workers, field engineers, government agencies and policy makers atlocal, national and international levels. In order to effectively plan, organise and im-plement the country programme and keeping in view the future large scale implementation ofslow sand filtration for rural water supplies, a Project Managing Committee (PMC) was cons-tituted with Director, NEERI, Chief Public Health Engineers of the participating states,Advisor, Central Public Health and Environmental Engineering Organisation (CPH & EEO),Ministry of Works and Housing, Government of India, Director, Central Health EducationBureau (CHEB), and representative of WHO & IRC as members. The PMC reviewed from time totime the progress of the programme and provided guidelines for successful implementation.
Health Education
Clean water alone will not significantly alter the health status of a community unless aneffective health education programme forms an integral part of the water supply project,in order to bring about desirable change in the knowledge, attitude and practice of theusers. In Thailand, for instance, many villages after bore-holes were drilled providingcopious clean water, people continued to get their drinking water from the village pondswhere the water-buffalo lived. They complained that the water from the bore-holes had notaste, and only an extensive education programme convinced them that deaths of theirchildren and their recurrent diarrhoea was the result of contamination of their traditionalwater source .
A health education strategy developed by Central Health Education Bureau (CHEB), New Delhi,with modifications to suit the local needs and requirements has been implemented in theproject villages by the state and local agencies with overall coordination by NEERI. Popu-lar lectures were delivered to villagers on hygiene, collection and disposal of sullageand refuse. This was supplemented by audio-visual films and display of charts, posters andflashcards on a number of health related topics like nutrition, family welfare, cholera,malaria, filaria and control of water-borne diseases through supply of safe water. Thecommunity response to these programmes has been encouraging.
Community Participation
It is increasingly recognised that the success of any rural development programme includingwater supply, depends very much on effective participation by the community. Programmeshave been most successful where the community is involved right from planning to implemen-tation. This has been achieved to a large measure in this demonstration project. It wasnot surprising that in one village, the leaders were not well informed and therefore hadsome mis-conception about the suitability and efficacy of slow sand filtration for waterpurification. A detailed discussion between the agency staff and the leaders with a genuineexchange and accommodation of views could establish mutual understanding and confidence.This has greatly enhanced the involvement and commitment of the community towards lastingoperation and maintenance of the water supply system when handed over. An individualselected from among the local residents of the village has been given on-the-job trainingin routine operation and maintenance of the plant as well as the distribution system.
Conclusion
The integrated research-cum-demonstration project has established the efficacy of slow sandfilters, for small and medium water supplies. With the new knowledge gained throughlaboratory research and field studies, it is now possible to design cost effective slowsand filter systems for community water supplies. The impact of the study is evidentfrom the renewed interest of water supply professionals in slow sand filtration. In thedesign of new schemes, due consideration is given to this method of water treatment inview of its advantages.
The strategy followed in the development, testing and evaluation of various technical,organisational and social aspects of the programme at local and national level has servedas a model for future large scale implementation of rural water supply programmes. Thisacquires special significance in the context of the 'Decade' programme which aims atproviding safe drinking water for all by the year 1990. The project is also an example
72

of how Technical Cooperation among Developing Countries can play a vital role in evolvingappropriate treatment technologies for solving water supply problems of common concern formutual benefits.
References
1. L Huisman and W E Wood - Slow Sand Filtration, WHO, Geneva, 1974.
2. R Paramasivam, V A Mhaisalkar & P M Berthouex - Slow Sand Filter Design andConstruction in Developing Countries. J American Water Works Association, April 1981.
3. Peter G Bourne - The I) N International Drinking Water Supply and Sanitation Decade,AQUA No 8, 1980,pp 17-18.
73


Annex lib
SLOW SAND FILTRATION - APPROPRIATE TECHNOLOGY FOR SAFE WATER
by ir. H A Heijnen, International Reference Centre for Community Water Supplyand Sanitation, WHO Collaborating Centre, P 0 Box 5500, H M Rijswijk, The Netherlands.
1. Introduction
To promote the large scale application of slow sand filtration (SSF)
for community water supply in developing countries, a number of
research institutes and water supply agencies in developing countries
initiated the integrated research and demonstration project on slow
sand filtration, in close collaboration with the International
Reference Centre for Community Water Supply and Sanitation. The
project embraces applied research, demonstration programmes, the
exchange of information and the transfer of knowledge and experience.
These are the preparation for large scale implementation programmes.
All project activities are implemented in and by the developing
countries themselves and coordinated by IRC.
The project comprises the following phases:
1. Applied research by institutions in participating countries on
the basis of international collaboration.
2. Development and implementation in an integrated way of village
demonstration plants by the participating countries.
3. Dissemination and exchange of information on research and demon-
stration activities to other developing countries, to stimulate
larger scale use of slow sand filtration.
RESEARCH, PHASE I
Applied research in Phase I of the project was executed from 1976 to
1978 by research institutes in Ghana, India, Kenya, Sudan and
Thailand.
Apart from gaining experience with the slow sand filtration process,
the specific objective of these programmes was to develop appropriate
criteria for the design, construction, operation and maintenance of
slow sand filtration schemes under local conditions in these
countries.
75

Specifically the performance of SSF was investigated in relation to:
effluent quality under various levels of bacterial pollution an
turbidity in the raw water.
effect of filtration rates higher than the standard 0.1 m/hr.
influence of shading of filters,
effect of intermittent operation.
effects of organic and bacteriological overloading,
use of ungraded sand as filter medium,
effects of pre-treatment.
Basic e lements of a slow sand filter.
SCUM OUTLET
TO DRAIN
VENTILATION
FILTERED —WATER SUPPUFOR BACKFILLING
The EquipmentA slow sand filter basically consists of abox containing a supernatant raw waterlayer, a bed of filter medium, a system ofunderdrainsand a set of filter regulationand control devices Figure I shows thebasic elements The filter box can be madeof concrete, ferrocement. stone masonryor simply dug out in the soil, withprotected sloping sidesThe depth of the tank is about 3 m and thearea can vary from a few tens to severalhundreds of square metres At the bottomof the tank an underdrain system (the filterbottom'! supports the filter bed and drainsaway the filtered water The bed iscomposed of fine sand, usually ungraded,free from clay and loam, and with as littleas possible organic matter in it The filterbed normally is about 1.0 m thick, and thewater lo be treated Ithe supernatantwateri is at a depth of 1.0-1.5 m above thefiller bed
The slow sand filter is provided with twomain influent and effluent lines Valves Band F in these lines are meant respectivelyto keep constant the raw water level andthe filtration rate For clarity of illustrationall influent and effluent lines necessary forproper operation and maintenance areshown separately in Fig I. but in practicethe\ are combined and placed together tosave on construction costs
TO DRAIN
FILTEREDC H H WATER
OUTLETK
TO DRAIN
The ProcessSlow sand filtration is a purificationprocess in which the water to be treated ispassed through a porous bed of filtermedium During this passage, the waterquality improves considerably by degra-dation of organic matter, by reduction of thenumber of micro-organisms (bacteria,viruses, cystsl. by removal of suspendedand colloidal material, and by changes inits chemical composition In a mature beda thin layer called the Schmutzdeckeforms on the surface of the bed ThisSchmutzdecke consists of a great varietyof biologically very active micro-organismswhich break down organic matter, while agreat deal of suspended inorganic matteris also retained by straining The cleaningof the slow sand filters is relatively simpleand is done by periodical removal of thetop layer of the filter bed. including theSchmutzdecke. The effect of thepurification process on the water qualitydepends on many (actors, such as rawwater quality, the rate of filtration, grainsize of the filter medium, the temperatureand the oxygen content of the water
76

The investigations in Phase I confirmed the reliability and efficiency
of slow sand filters and led to the compilation of a handbook on
design and construction incorporating the existing knowledge and th$
research findings (IRC Technical Paper 11).
Photo 1. Silt traps as pre-treatment, Peace River Demonstration
Plant, Jamaica.
77

DEMONSTRATION, PHASE II
The next and most recent emphasis of the project was placed on the
implementation of the demonstration programmes. During this phase
Colombia and Jamaica also joined the project.
In Phase II the primary aim of the project is to demonstrate at the
village level the effectiveness of slow sand filtration as a simple
and reliable purification technique able to produce safe drinking
water at a low recurrent cost. This is accomplished by the implemen-
tation of a number of so-called village demonstration plants, inte-
grated water supply projects in selected villages.
In each of the participating countries the villages were selected on
the basis of the following main criteria:
surface water should be the only source of drinking water avail-
able. The characteristics of the raw water should further allow
for treatment through SSF.
the provision of an adequate water supply system should further
be a priority need of the community.
the community should be willing to actively participate in the
planning, construction and management of the water supply scheme,
for the sake of the SSF-project it was necessary to ensure that
the final results of the demonstration phase would have a wide
validity. To warrant this a certain measure of diversity needed
to be incorporated in the project. Sites for the village demon-
stration plants were therefore chosen to represent a variety of
climatic and geographic conditions, and socio-cultural and
socio-economic settings.
Phase II also includes the development, testing and evaluation of
models for the organizational and institutional infrastructure, at
national and local levels, required for the repetition of these
projects within the scope of large-scale implementation programmes.
78
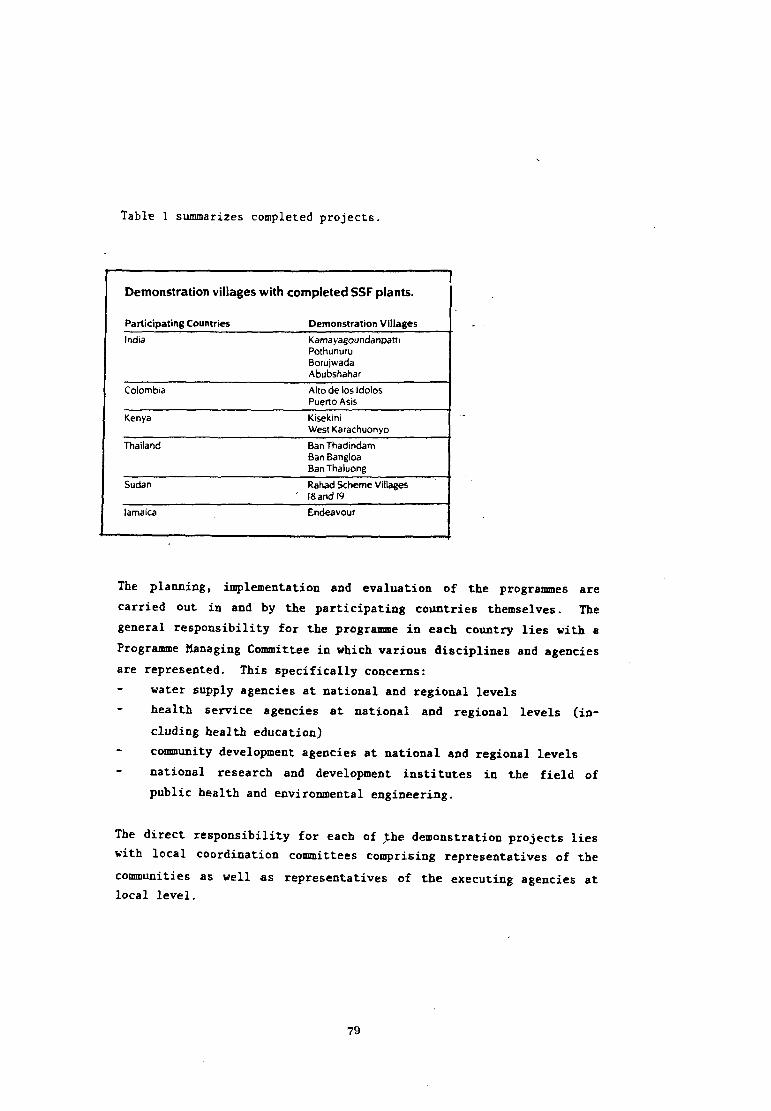
Table 1 summarizes completed projects.
Demonstration villages with completed SSF plants.
Participating Countries Demonstration Villages
India
Colombia
Kenya
Thailand
Sudan
Jamaica
KamayagoundanpattiPothunuruBorujwadaAbubshahar
Alto de los IdolosPuerto Asis
KisekiniWest Karachuonyo
Ban ThadindamBan BangloaBan Thaluong
Rahad Scheme Villages' 18 and 19
Endeavour
The planning, implementation and evaluation of the programmes are
carried out in and by the participating countries themselves. The
general responsibility for the programme in each country lies with a
Programme Managing Conmittee in which various disciplines and agencies
are represented. This specifically concerns:
water supply agencies at national and regional levels
health service agencies at national and regional levels (in-
cluding health education)
community development agencies at national and regional levels
national research and development institutes in the field of
public health and environmental engineering.
The direct responsibility for each of the demonstration projects lies
with local coordination committees comprising representatives of the
communities as well as representatives of the executing agencies at
local level.
79
Because of the broad composition of the committees, the various compo-
nents of the demonstration projects and the organizational require-
ments can be taken care of in an integrated way.
A major function of the committees is the establishment and/or streng-
thening of multidisciplinary collaboration at national and local
levels, so that liaison is maintained with other sectors such as
primary health care and integrated rural development.
Involving the community
As is now widely recognised, the introduction of any water supply
scheme to a community should not solely be based on technical consid-
erations but should also take into account the views and wishes of the
future consumers. Further, to ensure optimum health impact of the
water supply, the population needs to be extensively and repeatedly
informed about the health implications that the provision of safe
water may have when used in a hygienic way. Thus, to support the
smooth integration of the water supply scheme in the community a
Community Education and Participation component was included in the
programme for Phase II. Through greater perception of health benefits
and through the sharing of views with the water supply agency and
contributions in labour, cash and kind, an understanding of the impor-
tance of and a feeling of propriety towards the water supply scheme,
will be created within the community. This should eventually lead to
the self-reliant management of the scheme and a responsible behaviour
towards it of each of the community members.
The majority of the participating countries have now completed the
construction of the village demonstration plants and are presently
monitoring the performance of the system and evaluating the effec-
tiveness of the integrated approach.
80

Full reports on the specific country activities are being finalized. Those
on the SSF-projects in Colombia, Thailand, India and Jamaica (interim
only) will be available shortly.
As a follow up to the demonstration phase a third and final phase has been
initiated during 1981 which focuses on the dissemination of the results
obtained in the SSF-project through distribution and commissioning of
publications on the subject and the organisation of (inter)national
seminars.
In the context of Phase III of the project attention is also given to a
number of research topics identified in phase II. Investigations are
presently carried out on the following:
The economic and management implications of declining rate
, filtration/ India.
The design of a suitable and fool-proof inlet control arrangement for
slow sand filters/India.
The minimum thickness of the filter medium required to produce a
bacteriologically safe water, in relation to the filtration velocity
and the range of temperatures prevailing under (sub)-tropical
climatic conditions/India.
comparison of efficiency between upflow and downflow slow sand
filtration /Colombia
performance testing of existing SSF plants/Cameroon
development of small prefabricated filters/India
(horizontal roughing filtration/Tanzania)
Following this rather extensive introduction on the slow sand filtration
project I now like to discuss with you a number of interesting features of
the projects executed. I will concentrate on the results of phase II as
these from a practical point of view are the most interesting. As Mr.
Paramasivam in the next introduction will brief you in detail on the
Indian achievements in the various research activities executed by the
National Environmental Engineering Research Instiute and in the actual
application of SSF in the four village demonstration plants, I will deal
only very superfcially with the SSF project in India.
81

2. Design and Construction
The most essential information required for the planning and design of
rural water supply schemes concerns the level of service and the size of
the population to be served. The executing water agency should, in
consultation with the community, decide upon the level of service. This
will include decisions on the number and siting of standposts, the number
of house connections and the quantity of water supplied per person per
day. Population figures can be retrieved from the available national
census data. However, care should be taken with regard to the general
reliability of the census and it is also worthwhile to check whether the
population covered by the village name in the census is the same as the
population and area, that will be served by the new system. If doubts
remain, the engineering department should try to gather its own data in
order to avoid designing a plant which is out of tune with the
requirements of the community. Since most rural communities do not
comprise more than 5,000 people, this data gathering exercise is usually
quite feasible.
The daily output of the plant can now be determined from the data
collected. Additional information on the growth-rate of the community and
the expected rise in water requirements for drinking and economic purposes
(farming, watering of cattle), can be combined with the present demand in
order to obtain an estimate of the future drinking water requirements of
the community.
As there is little economy of scale in the design of a slow sand filter,
there is little to be gained by increasing the size of a filter in order
to provide service over a longer time into the future. Moreover in
developing countries where governments have to be extremely thrifty and
where capital is scarce, it is only sensible to reduce the initial
investment in water works and so minimize the amount of money tied up in
yet unused capacity.
82
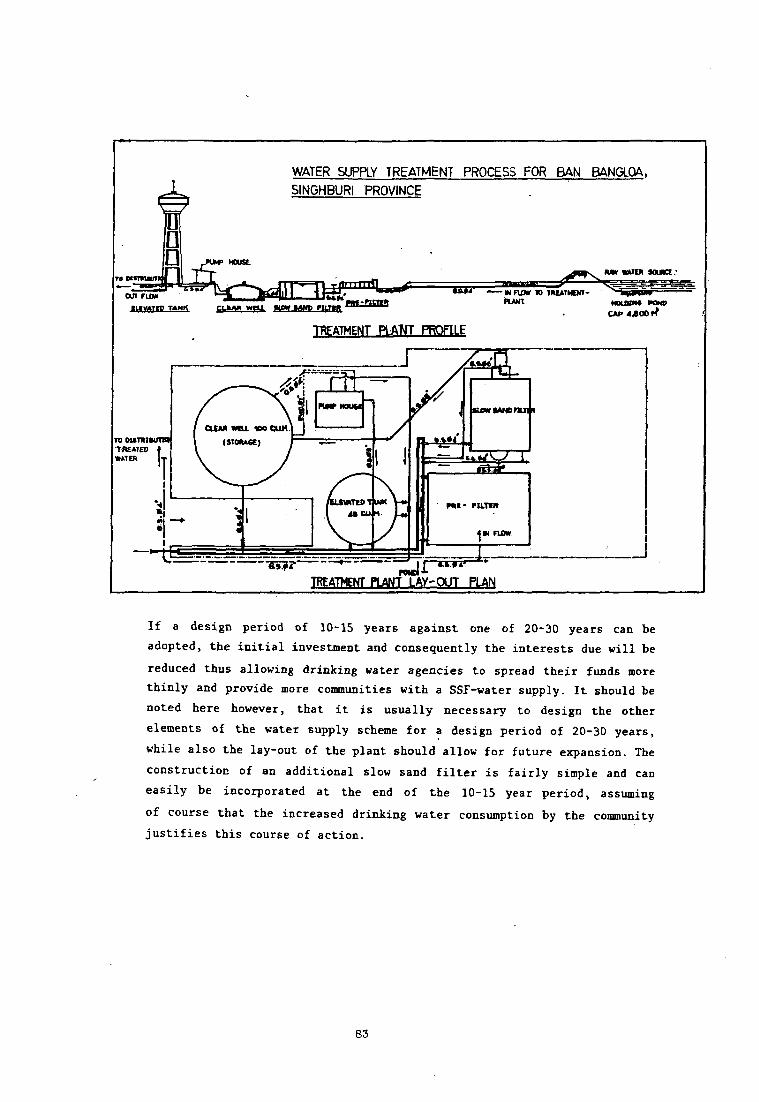
WATER SUPPLY TREATMENT PROCESS FOR BAN BANGLOA,
SINGHBUR1 PROVINCE
OUT FLOW
IHVATtP TANK
• • F I D * ID TRtATMOIT-
CL*A» weu.m-nmit Moutnw N N P
CAP 4*00 ff
TREATMENT PLATfT PROFILE
TREATMENT PLANT LAY-OUT PLAN
If a design period of 10-15 years against one of 20-30 years can be
adopted, the initial investment and consequently the interests due will be
reduced thus allowing drinking water agencies to spread their funds more
thinly and provide more communities with a SSP-water supply. It should be
noted here however, that it is usually necessary to design the other
elements of the water supply scheme for a design period of 20-30 years,
while also the lay-out of the plant should allow for future expansion. The
construction of an additional slow sand filter is fairly simple and can
easily be incorporated at the end of the 10-15 year period, assuming
of course that the increased drinking water consumption by the community
justifies this course of action.
83
I
During the planning phase of the water treatment plant sufficient
attention should be given to introduce such elements in the final design
as to ensure safe and uninterrupted operation of the system. Hence at
least two filter units should be provided. In this case, when one filter
is taken out of service for cleaning purposes, the other filter will still
be running at an acceptable filtration rate of 0.2 m/hr (i.e. twice the
normal design rate of 0.1 m/hr).
As indicated earlier 14 demonstration plants have been constructed in the
context of the SSF-project. They serve present populations ranging from
1000-15.000 inhabitants, with a daily quota between 45-150 liters per
head. The construction of the headworks, filters, storage reservoirs etc.
has been executed by contractors and skilled labourers hired for the job.
Unskilled work such as trench digging and excavations as well as locally
available building materials were usually provided free by the community
as part of their contribution to the project.
Special features
The underdrains of the plant at Kamayagoundanpatti (India) consist of a
system of PVC pipe manifold and laterals with locally developed permeable
capsules which are placed at 1.0 m c/c and topped with a thin layer of pea
gravel. This type of underdrain has been found to be effective and
cheaper than .the. conventional ones.
In general hard broken stone, which is more readily available and cheaper
than rounded pebbles, has been used as supporting gravel layers.
As is more or less common in Latin American the treatment plant in Alto de
los Idolos/Colombia included two upflow slow sand filters. This has
operational advantages since cleaning of the filters can very easily be
achieved by reversing the flow and allowing the supernatant to rapidly
drain to waste. Although the efficiency of the filters was more than 80%
in reducing the M.P.N. index of total coliforum in 3 out of the 4 samples
collescted, the bacteriological quality was not satisfactory. It was
therefore decided to adapt one of the two filters into a downflow slow
sand filter and make a comparative study of the operational and
84

bacteriological performance of up-flow and down-flow slow sand filtration.
The programme of investigations will comprise the monthly monitoring of
pH, temperature, turbidity, color, iron and E.Coli at the inlet and the
outlet of the filters. The research programme will last one year,
starting from June 1981.
Preliminary results indicate that the performance of the downflow filter
is markedly better than that of the upflow filter. Bacteriological
efficiency of the downflow filter ranges from 85-95%, while turbidity and
color are usually reduced below 1 unit and iron below D.I mg/1. The
upflow filter presently seems not capable of removing more than 80-90% of
bacteriological pollution. The physico-chemical efficiency is also
considerably lower than the downflow filter.
However the limited number of, especially bacteriological, samples taken
does not yet allow for firm statements with regard to the performance of
either type of filtration.
Photo 2 Promoter checking for chlorine content
Alto de los Idolos, Colombia
85

3. Operation and Maintenance
The most effective way to operate a slow sand filter is to run it for 24
hours a day. Applying that mode of operation ensures an effluent quality
of excellent hygienic standards. However, if that is not possible, the
only alternative which is then acceptable is declining rate filtration.
This specific mode of operation can be applied to bridge the gap between
shifts of full-scale operation of the filter.
At the end of a shift the operator closes the inlet valve butthe filtration regulating valve is kept in the normal position.The supernatant water will drain through the filter at acontinuously declining rate, in that way still producingfiltered water even though the operator is absent. Operating thefilters at declining rate requires a larger filterbed area thancontinuous operation but is sometimes necessary in case ofintermittent power supplies, or to reduce the cost of fuel andoperator's wages. The effluent quality of filters which betweenshifts are operated at declining rate, is quite acceptable andonly a slight deterioration of the overall bacteriologicalperformance of the filters can be noted.A refinement of this technique can be applied in treatmentplants where the pumping capacity is higher than required.Instead of throttling the pumps it can be considered to allowthe supernatant to rise 10 to 15 cm above the design raw waterlevel, then cut the pumps and allow filtration to take placetill about 10-15 cm below design raw water level (2-3 hrs).Subsequently the pumps are started again and the process isrepeated. Such a mode of operation can reduce actual runningtime of pumps by well over 50% and thus leads to a considerablereduction in the cost of fuel. The slight variation offiltration velocity is not likely to have a lot of influence onthe effluent quality.
Intermittent operation should not be allowed since it has been shown
conclusively that an unacceptable breakthrough of bacteriological
pollution occurs 4-5 hours after restarting the filters.
Two main features of the slow sand filtration are the relatively easy
operation and the considerable improvement of physical and bacteriological
characteristics of the raw water treated. Ease of operation very much
depends on proper design and construction, while the efficiency of the
purification process fully depends on the time allowed for the development
of the filterskin and the bacteriological flora. Temperature and raw water
quality determine to a great extent, the period required for so-called
86

ripening. This period may range from several weeks to a few months. Since
ripening may take quite some time, it is evident that proper chlorination
has to be applied in those cases when public demand forces the waterworks
authorities to supply water from the plant, before ripening is completed.
Under normal operating conditions, the filtration rate will be kept as
constant as possible. However, due to clogging, the resistance of the
filterbed gradually increases and therefore, the operator has to
compensate for that by opening the valve regulating the filter velocity a
little bit every day. When the regulating valve has been fully opened and
the rate of flow starts to decrease the filter has to be taken out of
service for cleaning.
Depending on the seasonal variation of the raw water quality, especially
with reference to turbidity, the interval between consecutive cleaning
operations may vary between 60 and 90 days.
Cleaning of the filterbed is accomplished by draining the supernatant
water and scraping the top 1-2 cms of the bed.
After cleaning, the filter has to be refilled with water. This process,
called backfilling, has to be done from the bottom up in order to drive
out the air bubbles which have been introduced during the cleaning
exercise. In the absence of a overhead storage tank, backfilling may well
be realized by using filtered water from the adjacent filter. If this
method of operation leads to a temporarily reduced output of the plant,
the population should be informed in advance about the reduced supply.
When the filter is put back into service, a period of at least 24 hours is
required to allow for re-ripening of the bed. After that period, the
bacteriological flora has sufficiently re-established itself to be able to
produce safe effluent which can then be put back into the supply. It
should be noted here that in the cooler areas in the tropics (e.g.
mountains), this ripening period might have to be extended to a few days.
Furthermore in order to enhance the simplicity, reliability and
cost-effectiveness of the overall-treatment system, the possibilities for
gravity flow should be exploited to the maximum. A gravity system allows
87
filtration to take place continuously. This is the optimum mode of slow
sand filter operation; it also leads to a considerable increase in
reliability, since there are no pumps required which may break down or not
run at all because of lack of fuel or power. Even if only a partial
gravity system can be designed, preference should be given to such a
design over that of a fully-pumped system.
At Ban Thadindam/Thailand the raw water is taken from animponded spring. The Slow Sand Filter is constructed on a slopeproviding sufficient head to supply the consumers by gravitywithout the need for pumping. The operator of this plant hasshown very poor attention to his work because he complained thatthe salary paid to him is too low. Most of his time, he spendsoutside the village working on his farm. In spite of this, hisabsence does not trouble the villagers since the water issupplied by gravity and the system has automatically continuedto function adequately in quantity and quality. - This is a veryideal situation for a village water supply.
4. Pre-treatment
The most important drawback of the slow sand filtration process is its
vulnerability toward excessive turbidity. Raw waters with turbidity
values of 50 NTU or more for periods of a few weeks cause rapid clogging
of the slow sand filters. From an operational point of view the frequent
cleaning activities and thus reduced output which are caused by high
turbidities are not acceptable. Pre-treatment can then offer a solution.
Various types of pre-treatment have been used in the demonstration plants
of the SSF-projects.
Irrigation-canals and storage reservoirs.
In Haryana/India, Rahad/Sudan and Ban Bangloa/Thailand water is abstracted
from irrigation canals. The low velocity of the canals obviously led
already to a settling of suspended particles. For management reasons the
irrigation authorities usually close down the canals for a period pf four
to six weeks each year. Thus in addition the water supply schemes needed
a storage reservoir with sufficient capacity to cover the no-intake
period. In Abub Shahar/Haryana this system is functioning quite well with
turbidities of the raw (irrigation) water between 0.3-7.A NTU and after
storage (before filtration) between 0.2 and 1.5 NTU.
88
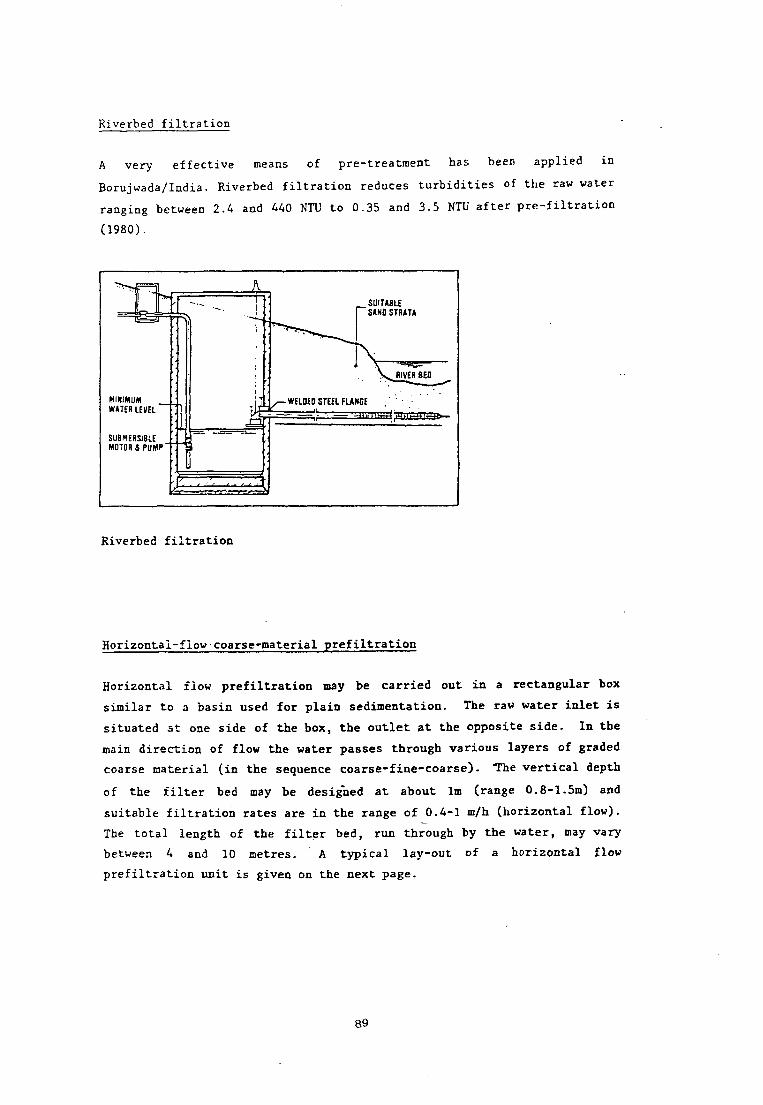
Riverbed filtration
A very effective means of pre-treatraent has been applied in
Borujwada/India. Riverbed filtration reduces turbidities of the raw water
ranging between 2.4 and 440 NTU to 0.35 and 3.5 NTU after pre-filtration
(1980).
MINIMUMWATER LEVEL"
SUBMERSIBLEMOTOR 4 PUMP
J3T
SUITABLESAND STRATA
-WELDED STEEL FUNGE
Riverbed filtration
Horizontal-flow coarse-material prefiltration
Horizontal flow prefiltration may be carried out in a rectangular box
similar to a basin used for plain sedimentation. The raw water inlet is
situated at one side of the box, the outlet at the opposite side. In the
main direction of flow the water passes through various layers of graded
coarse material (in the sequence coarse-fine-coarse). The vertical depth
of the filter bed may be designed at about lm (range 0.8-1.5m) and
suitable filtration rates are in the range of 0.4-1 m/h (horizontal flow).
The total length of the filter bed, run through by the water, may vary
between 4 and 10 metres. A typical lay-out of a horizontal flow
prefiltration unit is given on the next page.
89
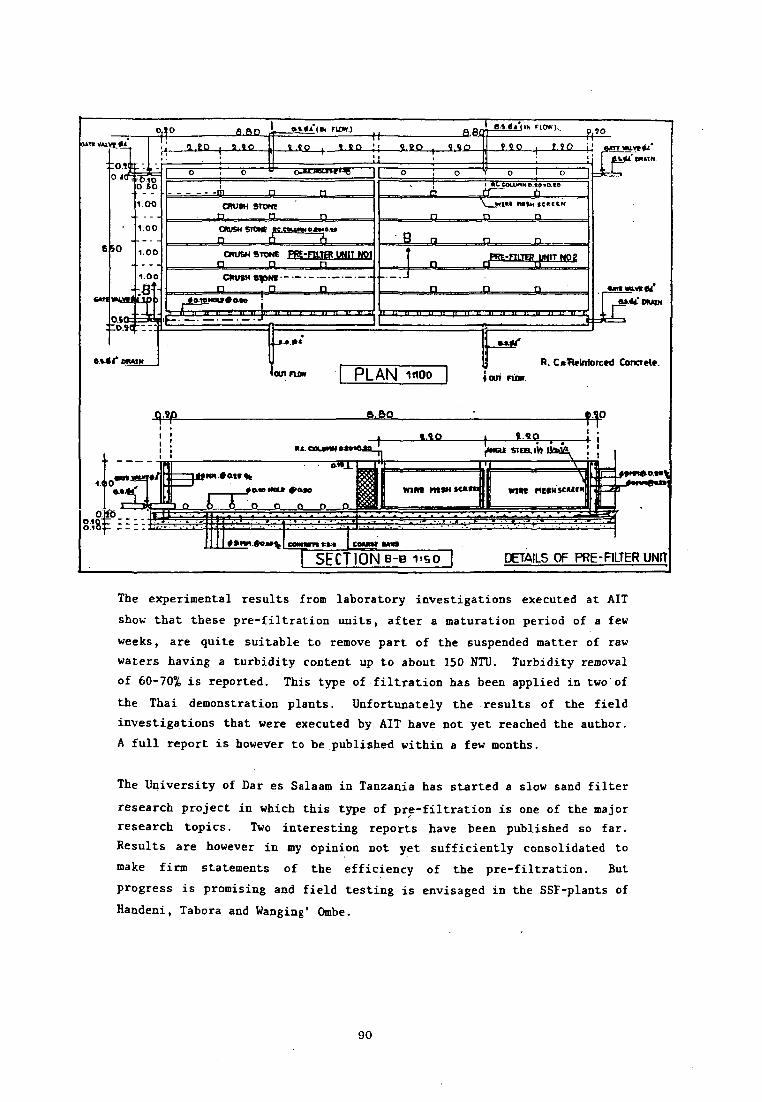
i.to , a.to
>0
::o.sc~
1.00
1.00
1.00
6 V « l * OHMH
tin, raw.) _a.Bit .to . I I P .' ' 9 BO • 1 to
} BV«1*(IN FltW).
9 3 0 i t ? 0
CRUSH STOW
CRUSH STONE »C.CTUm»0.1M».t«
_n A rSCRUSH STONE PBt-FlLTa UW1T W01
n n n
we COLUWN p.to »o.te
Wt-FIITB? UWTT WQg
a n FLOW PLANF
BWtN.
R. C«^»lntorced Concrete.
Fin*
SECTION B- DETAILS OF PRE-FILTER UNIT
The experimental results from laboratory investigations executed at AIT
show that these pre-filtration units, after a maturation period of a few
weeks, are quite suitable to remove part of the suspended matter of raw
waters having a turbidity content up to about 150 NTU. Turbidity removal
of 60-70% is reported. This type of filtration has been applied in two of
the Thai demonstration plants. Unfortunately the results of the field
investigations that were executed by AIT have not yet reached the author.
A full report is however to be published within a few months.
The University of Dar es Salaam in Tanzania has started a slow sand filter
research project in which this type of pre-filtration is one of the major
research topics. Two interesting reports have been published so far.
Results are however in my opinion not yet sufficiently consolidated to
make firm statements of the efficiency of the pre-filtration. But
progress is promising and field testing is envisaged in the SSF-plants of
Handeni, Tabora and Wanging' Ombe.
90
5. Financial implications
Capital investment and running expenditures should be considered together
when deciding what the financial implications are of a choice between slow
sand filtration and rapid filtration.
Financial departments of governments and international donor agencies, of
old, have only looked at the initial investment since that for them was
the most direct burden on their budget. Over the last few years it is
more and more being recognised that operation and maintenance are vital to
continued running of the systems already installed. Budget experts are
now starting to point out that the cost of operation and maintenance is
growing so rapidly that government budgets will not be able to support the
upkeep of the existing and future systems since these would absorb too
much of the national budget. This situation calls for action.
Governments should support promotional activities of water supply agencies
to charge fair and payable water rates from their consumers and also urge
them to design those systems for which the total economic and social cost
(cost of capital investment and running expenditures) is minimal.
In this respect slow sand filtration can play an important role. Its
capital outlay may be slightly higher than conventional treatment systems
but running cost are a lot lower. Furthermore, its simplicity of
operation and maintenance adds to the reliability of the system, and so
ensures that the consumers are always provided with a good quality water.
Calculations in Thailand indicate that the break-even point for slow or
rapid filtration is reached after about 8 years (1980). After 8 years
slow sand filtration becomes the cheaper option.
Up to 2 mid the cost of construction of slow and rapid filters in India
(1978-1980) was comparable. • Added to the fact that operation and
maintenance costs for a slow sand filter are always lower than that of a
rapid sand filter plant, the logical conclusion must be that slow sand
filters are economical upto a population of about 50,000 (a plant of 2.5
mid to provide a per capita supply of 50 lpd). It can be seen from the
91

population census of India that this population size covers almost the
entire rural communities and nearly 90 per cent of towns in the country.
6. Community Participation
The availability of sufficient and safe water is a basic human right,
which at present is still only a privilege of a minority of the people
living in rural areas and urban fringes of developing countries. In many
countries therefore communities are required to assist the responsible
water supply agencies with the construction and operation of the water
supply scheme. This type of participation is often initiated or
stimulated by the agencies in order to reduce the cost of (unskilled)
labour and building material while furthermore a lesser initial cash
investment from the agency is required through a community contribution.
This then should make it possible to serve more communities with the
limited funds available.
This approach has also been used in the various SSF country projects.
However in several cases the project committees have tried to go beyond
the above described agency-oriented approach and create a more genuine
community involvement also in the planning, maintenance and management.
And rightly so, because it should be recognized that the community has a
right to participate in decision making with regard to any aspect of the
new scheme. Certainly, engineering and financial conditions may restrict
the number of alternatives that can be offered to the community but users
have a legitimate interest both in the reasons for major choices and in
more detailed questions such as the siting and number of standposts.
Planning in consultation with the community will result in a service which
meets the needs of the users more closely and which will therefore be
better appreciated, more carefully used, and protected against vandalism
and other negative attitutes.
The following steps are usually found in the Community Participation
process:
application for the installation of a water supply scheme by a
community (Harambee villages/Kenya) or identification (and promotion)
by the agency which leads to a formal application by the community
(Colombia).
92

sanitary, engineering and socio-economic survey by the water supply
agency. In the context of the SSF-project a baseline survey was
executed by the health agency participating in the project (ref.
health education).
consultation with the community about the water supply scheme,
setting up of a water committee discussion of the baseline survey
results (Jamaica) and the directions derived therefrom with regard to
the health education programme.
signing of a contract between the community and the agency for the
construction of the scheme. The contract lays down the
responsibilities of the agency and the community with reference to
cash, loans, materials and labour to be provided.
transfer of the management of the scheme to the local water committee
with continued supervision and maintenance assistance from the water
agency.
An example of this sequence of steps is given here for the projects
started by the Instituto Nacional de Salud (National Institute for Health)
in Colombia which in principle is responsible for water and sanitation
projects in rural communities with less than 2500 inhabitants. This
institute (I.N.S.) employs special promotors who are trained in community
mobilisation etc. to stimulate the community involvement.
After the preliminary project allocation the technical andsocio-economic feasibility is determined. The socio-economicstudy includes existing environmental sanitaiton conditions andwillingness and capacity of the households to contribute of theproject. The preliminary design, including estimatedconstruction costs in cash and kind for user households andestimated user rates, is presented to a users' assembly. Forthe construction of the water supply scheme a contract is madeup between the junta de accion comunal (JAC), an electedcommunity development committee which acts as the localrepresentative of the community, and I.N.S. This contract isGountersigned by all heads of households participating in thescheme.
All unskilled labour and local materials are donated by thefuture users. They also pay part of the construction costs, inthe form of a community loan and sometimes a household deposit.The terms of the loan depend on the economic conditions as
93

apparent from the socio-economic study. The value of localcontributions to construction can vary from 5% to over 25% ofthe costs, depending on the type of works. The loan is paidback from the user rates. There are great differences betweenthe communities in the size of the household contribution incash and kind.
In general, users pay a flat rate. This rate covers operationand maintenance costs, loan repayment and reserves. When thepromotor finds a great variation in capacity to contribute hemay propose a weighted rate. This is still rare, however. Themajor constraint is the identification of valid and acceptableindicators of payment capacity.
Voluntary labour is only given by user households. Eachhousehold sends one adult member on a fixed day of the week.This facilitates a smooth labour organization and limits thenegative effect of labour withdrawal from local agriculture.
Once completed the system is managed by an administrativecommittee. This consists of a member of the JAC, a userrepresentative and an I.N.S. promotor. The continued I.N.S.supervision is a condition for a successful management. Abetter coverage by the mobile promotors and better training ofthe committees must lead to a better administration, especiallywith regard to rate payment.
The project in Thailand ran along similar lines. In Jamaica, however, the
potential for participation in the construction, operation and maintenance
and management was very limited for a number of reasons:
The supply of drinking water has always been a government service,
for which the user pays taxes and rates.
The communities within the parishes (districts) are no real units in
an administrative or social sense. Migration to urban areas and
abroad is high. This affects the feelings of togetherness and the
availability of voluntary labour.
The unions are strong and would certainly object against voluntary
labour in construction and operation and maitenance.
However, through the efforts of the health education bureau in Jamaica the
local health committee in St. James was resuscitated. Meetings of the
committee with the water agency and the health education bureau led to an
increased awareness of the health and access benefits of the water supply
scheme. This in turn resulted in a large number of applications for a
house connection which managementwise is very beneficial to the water
agency.
94

A few positive effects of the participation programme need still to be
mentioned.
The little extra money left over after payment of loans and operating
expenditures has in Alto de los Idolos over the last two years
resulted in the construction of an office/store for the water
committee, the protection of the intake through an afforestation
programme and the provision of a loan for the rebuilding of a local
primary school. New developments which the community was not able to
undertake before the water supply scheme was constructed.
Similar effects have been noted in Ban Bangloa/Thailand where the
profits of the water supply were to be used for the setting up of an
agricultural cooperative.
7. Health Education
Before a start was made with the health education programmes a baseline
(health) survey was executed in the project villages. This survey was
used to draw up a syllabus of topics and habits which needed to be
discussed during the health education sessions with the community.
The impression exists that during the health education programmes executed
during the SSF-project the top-down teaching method was used more widely
than the dialogue.
However, in the area of health education, the aim is to bring about
voluntary changes in practices. People must feel that it is in their own
interest to change. This implies not only that it is useless just to tell
people to caange, but that in explaining why it is in their interest the
community worker must be thoroughly familiar with the problems faced by
the people. Communication from the people to the community workers, as
well as in the other direction, is essential. The best way of providing a
continuous two-way communication is through community participation in the
process of education itself. This provides for a constant interaction in
which infortaation retarding problems and ideas about solutions pass in
both directions. It can also have the effect that the example and
influence of some community members and the authority of the community as
95

a whole may be brought to bear on the actions of all. When people
decide together to adopt a change, there is a good chance that they will
do so successfully.
The likelihood of achieving a significant effect on health practices
through community participation can be expected to be much greater if the
community has also participated in the planning and installation of the
water supply. It will be possible to develop a greater interest and
deeper understanding of both clean water and of the complementary behavior
changes which are required for the prevention of water related diseases.
In most of the programmes the emphasis was on films and other audio-visual
means. In addition, in Kenya for instance, community meetings were
organised to discuss the educational topics. Consultations were further
held with opinion leaders and women's groups. Through posters, folk songs
and health education teaching at schools in the project area further
discussions were stimulated.
96

BIBLIOGRAPHY
I.N.S. Status Report on Slow Sand Filtration Project in Colombia,C. Huraberto Peralta, M. Santacruz: September 1980, 23 pp.
IRC Technical Paper 11, Slow Sand Filtration for Community WaterSupply and Sanitation, A Design and Construction Manual,J.C. van Dijk and J.H.L.M. Oomen, December 1978, 180 pp.
IRC Technical Paper 17, Community Participation in Water andSanitation; concepts, strategies and methods,A.T. White, June 1981, 180 pp.
IRC Bulletin 14, Community Education and Participation in the SlowSand Filtration Project, Report of an International Meeting held inVoorburg, the Netherlands, 29 May - 2 June, 1978,July 1979, 58 pp.
IRC Bulletin 16, Slow Sand Filtration for Community Water Supplyin Developing Countries. Report of an International AppraisalMeeting held in Nagpur, India, September 15-19, Nagpur, India;December 1980, 100 pp.
IRC Occasional paper 17, Papers presented at the InternationalAppraisal Meeting, September 15-19, Nagpur, India;December 1980, 100 pp.
IRC Occasional Paper 19, Report on the Slow Sand FiltrationDemonstration Projects in Colombia, Chr. van Wijk, H.A. Heijnen,Revised April 1982, 120 pp.
NEERI Status Report on Slow Sand Filtration Project in India,September 1980, 30 pp.
NWA Status Report on Slow Sand Filtration Project in Jamaica,J.A. O'Connor, B.L. Muir, September 980, 36 pp.
PWWA Status Report on Slow Sand Filtration Project In Thailand,Sunanta Buaseemuang, Anan Saipetch, September 1980, 18 pp.
PWWA Interim Report on Slow Sand Filtration Research Project,undated, 39 pp.
97


Annex 12
EXPERIENCES IN COMMUNITY EDUCATION AND PARTICIPATION (CEP) IN WATER SUPPLY ANDSANITATION PROGRAMME - by Dr P V R C Panicker, Mrs A S Gadkari, M W Joshi andA V Talkhande', National Environmental Engineering Research Institute, Nagpur-440020,India.
Introduction
It is generally agreed that community education and participation is essential to thelong term success of water supply and sanitation facilities. The socio-economic, culturaland political conditions in different areas within the country (like India) and fromcountry to country may vary, and therefore the experiences in field-work will also vary.In India, NEERI has pioneered an integrated rural development programme in a few villagesaround Nagpur. NEERI has also introduced Slow Sand Filtration demonstration plants infour states of India, in collaboration with IRC (Netherlands). Experiences gained duringthe introduction of water and sanitation in these projects are presented in this paper.
Community Education
Drinking water supply through slow sand filter plants was introduced in Abub Shahar(Haryana), Borujwada (Maharashtra), Kamayagoundanpatti (Tamil Nadu) and Pothunuru (AndhraPradesh) by NEERI through state PHE Departments with financial aid from WHO-IRC. Communityeducation and participation activities were intended to prepare the community for effectiveutilization of improved water supply and sanitation facilities and were developed in closecooperation with CHEB, New Delhi, as well as with the state health education bureaus ofthe four participating states. A uniform methodology was followed in all the projectvillages, except for some minor changes to suit the local conditions and needs.
Educational diagnosis
To diagnose the educational needs of the community and to prepare an appropriate designand implementation strategy for the field delivery system, the following information wascollected through personal interviews with members of the community:
(a) general information of the village, with reference to socio-economic,cultural and political aspects;
(b) demographic information of families, existing facilities for water andsanitation, their knowledge, attitude and practice (KAP) of these systems,the problems faced and the various diseases associated.
The awareness of personal hygiene and clean environment was poor in most of the households.Most of them expressed the need to have a better system of water supply in their villageso that it would add to their convenience. Only a few realised that the new system oftreatment through slow sand filters, would be much safer than the one existing. The roleof drinking water in the transmission of some communicable diseases was known only to theeducated few. The communities, in general, did not fully avail of the benefit of immuni-zation programmes, since many of them did not realise that vaccination would benefit them.
For drinking water, a number of sources were in use in these villages. Dung wells,hand-pump tube wells and also river water were used and the people were not consciousof the quality.
Sanitary conditions in these villages were also very unsatisfactory. Open surface drainsexisted (though partially) in two villages. Open-field defecation was the common practicein all the villages, except in the case of a few families who had latrines in theirpremises. Composting of garbage and dung was done in two villages, though the processwas not scientifically followed.
Education Strategy
Based on these findings, community education strategy was formulated and implementedthrough committees at various levels. Training of the community health workers andleaders (formal and informal) was conducted to prepare them to undertake the field workin educating the community. They were expected to organise meetings and deliver informa-tion on various aspects of health and disease, water supply, personal hygiene, environmentalsanitation etc, at the grass-root level.
99

The educational activities comprised of mass meetings, group meetings, individual contacts,visits of doctors, exhibitions, medical examination of school children, display of postersand short slogans screening movie films, immunization campaign and technical demonstrationssupported by a number of educational aids.
Results
After the introduction of educational activities into the community, changes noticed wereremarkable. During evaluation, it was found that the communities in all the four villageshave accepted the treated water from SSF plants. They use only tap water for cooking anddrinking purposes. The drinking water was stored in clean.earthen or metalware, dependingon the economic status of the family.
The inputs in health education has also improved the hygienic habits of the people. Infor-mation and communication methods have shown a favourable change in knowledge, attitude andpractice of the people. This was apparent from the increase in construction of latrines,compost pits, soakage pits, biogas plants and taking house-connections for safe watersupply, in all the four villages.
The village Borujwada, has shown much more improvements than the other villages, due tp moreinputs by way of the integrated development programme which was started in 1975. In thisvillage, the community has accepted and is satisfied with the quality of treated water fromSSF plant and uses only tap water for cooking and drinking. With the result, the rope whichwas used earlier to draw water from the traditional well is now being used for other purposes.Only a few people go to river for washing clothes and bathing.
The drinking water was found stored in clean earthen or metalware, depending on the economiccondition of the family. These containers were also found well covered, and a tumbler witha long handle was kept separately for taking out water for drinking in almost every family.The fact that all the 25 samples of water collected on different occasions from the storagevessels of individual households, selected at random, were negative to E.coli is a clearindication of good domestic hygiene. In a large measure, this can be attributed to theimpact of educational inputs on the community.
Latrines have been constructed and have been in use during the last two years, in everyfamily. Improvement was also noticed in the status of personal hygiene of adults andchildren. In addition to the above, there was an appreciable change in the knowledge ofthe community regarding water-borne and water related diseases, with reference to thebase-line data.
Except for a few cases of diarrhoea and dysentery, incidence of cholera, typhoid andjaundice were not reported from this village after the SSF plant has been put intooperation.
A resurvey of the population for enteric parasitoses and anaemia (by stool and bloodexamination) has revealed that the prevalence of parasitic infection has come down to54 per cent (1981) as against 70 per cent in 1975. Similarly an appreciable improvementhas been found in haemoglobin level also. Anaemia was detected in 74 per cent of thepopulation in 1975, whereas in 1981 only 44 per cent were anaemic.
A definite improvement has also been noticed in the environmental conditions in the villageBorujwada. Patches of nightrsoil and the faecal stench of the days of open-field defeca-tion no longer exist in this village - a testimony of the acceptance and use of latrinesby the community.
A good number of soakpits are working in the village to take care of wastewater from housesand public stand posts. Refuse and dung are composted in pits. A biogas plant has alsobeen put up recently in one of the houses. Street lights have been installed in the entirevillage. Many families have taken house connections for electricity and from water distri-bution system. A flour-mill and a fodder-cutting plant run on electricity, have also beeninstalled in the village.
All these ultimately point out a real awakening of the community of the village Borujwadaas a whole, to improve their conditions of living in a better environment. And this awake-ning has been the result of various inputs into the village over a long period in general,and a sustained effort of community education in particular.
100
Community Participation
In all the four project villages the communities participated in a number of ways- Educa-tion activities were conducted with the full involvement of the formal and informal leadersof the community.
Meeting a part of the total expenditure of the treatment plant by the community is consi-dered a good form of their participation. In Abubshahar an amount of Rs.20,000 was raisedby the community for this purpose. Similarly in Kamayagoundanpatti, Rs.361,000 was taken0:1 loan from LIC by the local body to partly meet the expenditure.
In Borujwada, the land required for the construction of SSF plant and the overheadreservoir was readily given by the owners. The community was very much involved duringthe planning of the project including site selection and location of the stand posts andcontributed Rs. 20,000 towards their share of the expenditure on the project. Now, theplant is operated by two persons of the village who were also associated with the construc-tion of the plant right from the beginning. The maintenance and administration of the SSFplant and the distribution system are managed entirely by the village representatives.This has imbibed the feeling of responsibility in the community to properly operate andmaintain the plant, in their own interest.
Similarly in the sanitation programme, towards the construction of latrines, the house-holders have borne the cost of constructing the superstructure with materials of theirchoice. Manual labour involved in the transportation of building materials and construc-tion was also borne by the individual household.
The research and demonstration project is a unique experiment in multi-disciplinary andinter-agency approach towards a common goal-improvement and protection of public health.To bring about through health education, a favourable attitude and behavioural change intradition-bound village folk with low level of general education and poor economic condi-tions is a slow process. It requires sustained efforts from both the community and serviceagencies and effective coordination between them. There are also a few constraints whichshould be recognised. The socio-political makeup of the community has a significanteffect on the success of such peripheral activities. Frequent changes in communityleadership and government machinery adversely affect such programmes. Health education,though a part of the routine activity of the health staff, is generally not given thepriority it deserves. Nonetheless the project has served an important objective ofdemonstrating a methodology for guided introduction of community education for effectiveuse of protected water supply.
101


Annex 13
PUNNING CONSIDERATIONS IN RURAL WATER SUPPLY DISTRIBUTION SYSTEMS
by A Raman, Scientist & Head, NEERI Delhi Zonal Laboratory.
Introduction
This paper discusses some of the aspects that require consideration when planning a distri-bution system component of Rural Water Supply Schemes (RWS). The topics discussed are,the objectives to be set out in planning the distribution systems and the various optionsavailable. Community participation and revenue collection aspects are also discussed.
Objectives In Planning
The major objective in planning a village distribution system, should be to ensureconvenient distribution of water. This requires that distribution points be close tousers and that there is an adequate number to avoid overcrowding. Convenient distributionwill save time and labour required for water drawal. It may also promote health, byinducing people to draw more water and use it for personal hygiene.
Other objectives in planning are:
preserve water quality by preventing back-siphonage into pipelines;
reduce stagnation of spill-water and sullage;
reduce wastage and misuse of water; and
facilitate system management (operation and revenue collection).
Distribution System Options
The options available for village water supply distribution are :
public stand posts (PSP);
distribution reservoirs with taps (DR); and
house connections (HC).
The PSP system does not provide high degree of convenience. It may not be of benefit tohealth, because quantity of water drawn is restricted and drinking water is liable tocontamination, during storage.
Distribution reservoirs often involve longer fetching distances than a PSP system and maybe less convenient. They are suited only for very small communities.
HC systems give a good degree of convenience. They have greater health promotion potentialthan PSP systems, because they encourage greater water use and give less chance for post-contamination of water. Also they are better suited for revenue collection. They willgenerate, however, more sullage, requiring concurrent arrangements for sullage collectionand disposal. They also encourage water misuse, e g for gardening and cattle washing.
While HC systems are seen to have several advantages over PSP systems, they cost morebecause of the increased water demand, longer runs of pipe required to serve all localities(especially when houses are scattered), and the need for sullage drains. In developingcountries, cost of individual RWS schemes has to be kept to a minimum so that limitedresources available can be used to serve as much of the population as possible. This factorweighs against the general adoption of HC systems and favours the use of PSP system.
The question arises as to why HC system can not be provided on the pipes to be run to thePSP system, as there will no increase in installation costs. The problem here would beone of social acceptance of a privilege, made available only to a section of the villagepopulation.
103

A rational policy in regard to HC and PSP systems for village water supply is as follows:
provide HC system where pipelength required is only marginally greater than for PSPsystem, with PSP system limited to poor areas;
where pipelength required for HC system is significantly greater than for PSP system,then provide PSP system in the first instance. This is done in such manner, thatit can be upgraded to the HC system at a later stage. The upgrading could be donewhen the village is ready to meet the upgrading cost or when national resourcesimprove. It should be stressed, that when HC systems are contemplated, propersullage collection and disposal arrangement should also be provided.
Design Parameters
Direct pumping into a distribution system is not desirable. The supply to PSP and HCsystem should be only through an elevated service reservoir located within each village.The reservoir capacity should not be less than 40 per cent of the ultimate daily supply.The reservoir elevation required should not be more than 6-7 m. This presents possibili-ties for masonry construction of the reservoirs (except floor slab and roof slab) forsmall villages, such as prefabricating the reservoirs, using reinforced fibre glass orpressed steel.
The distribution system lay-out can be either branched or looped. In village conditions,the former can often be used on its own. The layout should suit requirements for everyhouse that may want a connection in the future, but in order to reduce cost, initial piperuns should be kept to the minimum serving only the PSP systems and omitting all looping.
Pipe sizes should suit the ultimate requirements. The sizes will be influenced by thepeak factor assumed for design and increase in pipe sizes may not increase costs signifi-cantly. Hence, an ample peak factor, say 3, should be chosen for village distributionsystems.
Pressure provision may not affect costs greatly, but high pressure will cause leakageand wastage. A minimum main pressure of 6 m should suffice in village schemes.
Public Stand Posts
The PSP is the point of contact between water supply technology and the public. Hence,maximum care should go into planning, construction and upkeep. The PSP system has inherentdisadvantages already discussed, and planning should aim to minimise them.
Walking distance to the PSP system should be small (not greater than 500 m and preferablyonly 200 m) and less than to the old village sources. Also their number should beadequate inorder to prevent overcrowding (not less than 1 per 250 persons).
The minimum discharge rate required at a PSP is a matter for rational design. For examplea tap serving 125 persons with 40/lpd supply and peak factor of 3, will require a dischargecapacity of 11/1 pm. Irrespective of design requirements, discharge capacity should notbe less than 5/lpm. This poor discharge makes people damage taps, nor should dischargebe greater than 15-20/lpm, which will then increase wastage. The tap size and the leadpipe size of the PSP systems should be designed to give the required discharge at thepressure available in the main.
Both, waste-not taps and ordinary screw taps have been used for PSP systems. The formercosts more than the latter, and do not seem to have any special advantage, which will bediscussed later. Hence, a sturdy, drip-proof screw tap would be sufficient for PSP systems.A stopcock preceding the tap is always desirable.
The PSP structure costs are a small fraction of the total cost of an RtfS scheme. Thereis, therefore, no advantage gained in cutting its cost at the sacrifice of convenienceto the users and at the risk of damage. In many villages, PSP system attempts ateconomizing have often led to breakage of pillars, leaking of pipe-joints, splashing ofwater outside the platforms, cracking or tilting of platforms due to undermining offoundations by spilt- water,and water stagnation in and around the platforms. All thisresults in great inconvenience to the public.
104

It is necessary that PSP systems are planned and constructed so as to eliminate theseproblems. Also, the tap arrangements should suit local customs such as, collection (typeof vessel, method of fetching). Special attention is necessary for the removal of spiltwater. Wherever possible, it should be led into ponds where it may be used by cattle orled to fields for irrigation crops or into drains. Soakaways should be used only wherethe soil is permeable. The inconvenience to the public from spilt water can be greatlyreduced by locating PSP systems in peripheral streets of villages.
Auxiliary facilities at PSP system for washing clothes, bathing of children, and cattlewatering also require consideration. They are desirable, as they help to increase thebenefits of the scheme. The auxiliary facilities, however, should be located away fromthe taps, otherwise it may lead to contamination of the water which is being drawn fordomestic use.
Virtues Of Intermittent And Continuous Supply
In India, most RWS schemes are designed for 24 an hour supply with a peak factor of2-2-5. In practice, however, the water is supplied only intermittently, 2-3 hours in themorning and about the s• ie period in the evening. This practice, is probably the samein many developing countries.
The strongest objection to intermittent supply, is that it presents serious possibilitiesfor pollution through back-siphonage. The danger is particularly serious in house connec-tion systems, because of the difficulty in ensuring proper plumbing of private connectionsunder village conditions.
Intermittent supply has also other objectionable features. It generates overcrowiding atpublic standposts and restricts water use because of the inconvenience of supply timings.It also restricts auxilary use of public stand posts for such desirable activities, suchas childrens bath, washing of clothes and cleaning of utensial.s.
Intermittent supply will also increase installation cost, as its rational design requiresadoption of a higher peak flow factor and a provision for an increase number of standposts.It will also increase operational requirements, because of the need valve operations forat least 4 times a day, whereas a continuous system may require no valve operations. Theforegoing points indicate, that intermittent supply is undesirable for RWS schemes andcontinuous supply seems appropriate.
Two arguments are usually raised, however, against continuous supply in RWS schemes. Thefirst, is that it presents greater possibilities for wastage. It will be discussed laterthat intermittent supply may itself be a cause of wastage and wastage in continuous supplymay not be very difficult to control.
The second argument has been, that, a continuous system presents difficulty in distributinga limited quantity against a higher demand. This difficulty may not be real in PSP schemesunless they have been designed for very low rates of supply. The drawals in these schemes,seldom exceed 25-30 lpd per head. The problem is often one of making the people draw anduse more water from the PSP systems so that it may improve health. In HC schemes thedifficulty under discussion may indeed arise, but it should be met by an escalating ratestructure based on metered supply and not by a proposition which risks health, besidesbeing costly.
Control Of Wastage
Wastage of water has to be controlled, as it means increase in operational cost andshortage of water for the population it serves.
In PSP schemes, some wastage occurs when pots and buckets are being filled, but suchwastage will be small and is unavoidable.
More serious wastage occurs at PSP systems under the following situations:
when taps are left open after the water is drawn. Open taps have been encounteredfrequently in intermittent systems and they have been found to cause considerablewastage of water towards the end of the supply periods when the drawal reduces;
105

when taps are removed altogether. In village conditions, this situation arisesnot so much due to theft or vandalism as in urban areas, but due to attempts toincrease the discharge of PSP system with poor pressure.
Costly waste-not taps have been tried in order to control wastage at village PSP system,but have been ineffective. These taps have to be held by hand while filling the user'scontainers and this become a bother. The taps are, therefore, very often propped up orwedged so as to remain open continuously which serves no purpose.
Intermittent supply is often thought of as a method for reducing wastage, but the practiceas discussed, appears to be one of the causes of wastage. The only effective strategy forwaste-control at village PSP system appears to be, to provide continuous supply at adequatepressure thus removing the irritants in the supply and to promote social control overvandalism and wilful wastage.
In rural water supplies with house connections, the problem may be one of misuse of thelimited quantity of protected water for gardening and washing of cattle, than of wastage.It is doubtful whether intermittent supply can check such misuse. The effective way maybe to meter house connection and have an escalating rate structure which will discourageexcess drawal, even with continuous supply.
Revenue Collection
The discussion here, is not concerned with whether to collect water charges in villagewater supply schemes or how much to collect. It is concerned, with the possible strategiesfor collection of water charges under different types of distribution systems.
In the PSP system, the suggestions for collecting water charges have been:
collection at the PSP when any one draws the supply;
collection as a surcharge or a general tax;
collection as a separate watercharge from each household.
The first suggestion will not be practical in village conditions (for various reasons,such as need for a guard at each PSP and abuse of position by the guard) and it may not bedesirable, as it will restrict water use.
The second suggestion may not be feasible, as levels of general tax in villages are verylow and surcharge for the water supply may have to be as much or greater than the basic tax.Also, there is the problem, that general taxes are collected only at yearly intervals.The third suggestion may be practical in a village situation.
With regard to HC system, charging the beneficiaries may not be difficult and the chargescould be on a fixed or metered basis. The second alternative is preferable, as it willhelp to control misuse of water, as discussed earlier.
The main problem in revenue collection in village water supplies is dealing with defaultedpayments. In PSP systems, there can be no penal action such as cutting-off supply and inHC systems penal action may not be practical because of the social position of thedefaulters. Also, there may be a danger of damage to the system in case of penal actions.
The only way of checking payment default in the village situation, is to exercise socialpressure against the defaulters whether they come under HC or PSP systems. Social controlcan only be effective when water rate collection is enjoined by the local communityorganisation, rather than a water authority based outside the community.
Community Participation
It accepted that community participation is essential for the successful working of arural water supply scheme. Community participation is primarily needed in managing thedistribution system, forming as it does, the interface between technology and thecommunity.
106

The community should be consulted at the planning stage, where it will be ascertainedwhether the PSP system of distribution is acceptable to the people. If the people desirea HC supply, they should be informed of the cost and the final choice should be made withtheir approval. Community opinion should also be sought on location of standposts and thestandpost details. The construction of auxiliary facilities at PSP system should be thecommunity's initiative.
It is at the operation stage that community participation is most important, vis-a-vis,the distribution system. Without such participation, there may be damage to public standposts, wilful wastage of water and even final failure of the scheme.
It may be best if the operation of the village distribution system is left to the villagecommunity, even though operation of the treatment works, pumping stations and transmissionmains are retained by the water authority. The devolution suggested, will increase theinvolvement of the community leaders and motivate them to control wastage and vandalism.
The operational requirement in a village distribution system will be small, particularlywhen continuous supply is practised. Maintenance will also be small and will consist onlyof repair of leaky taps, upkeep of PSP structures and attention to spillage disposalarrangements. A caretaker nominated by the community, should cary out these jobs withoutmuch effort with minimal training. As regards collection of water charges, withoutcommunity involvement it may not be possible to deal with defaulted payments.
Conclusions
The paper has discussed some aspects that have to be considered when planning villagewater supply distribution systems. The discussion is based on the community response tovillage water supply schemes observed in the north-west regions of India. It is concludedthat community response will depend on social, economic and cultural characteristics andwill vary from community to community.
Some of the aspects delt with in this paper, demand detailed field studies. One importantfield for further study, would be the advantages of intermittent and continuous supply invillage situations. Another would be the virtues of PSP and HC systems. Further studyis also necessary on field performance of different types of taps and different approachesto system maintenance.
107

SECTION OF GOLLXCfOR WELL
r ft OOF S~A& C'-^K.T
/ W£ATH£.f<.N^ COURSE.
3-S5"IX
i ,
. '6 (.?« ! i3 0 0 - - . 95 BT^AIN TIDES ! I
To BE a>xiv£N
CO NJ f R t -
108
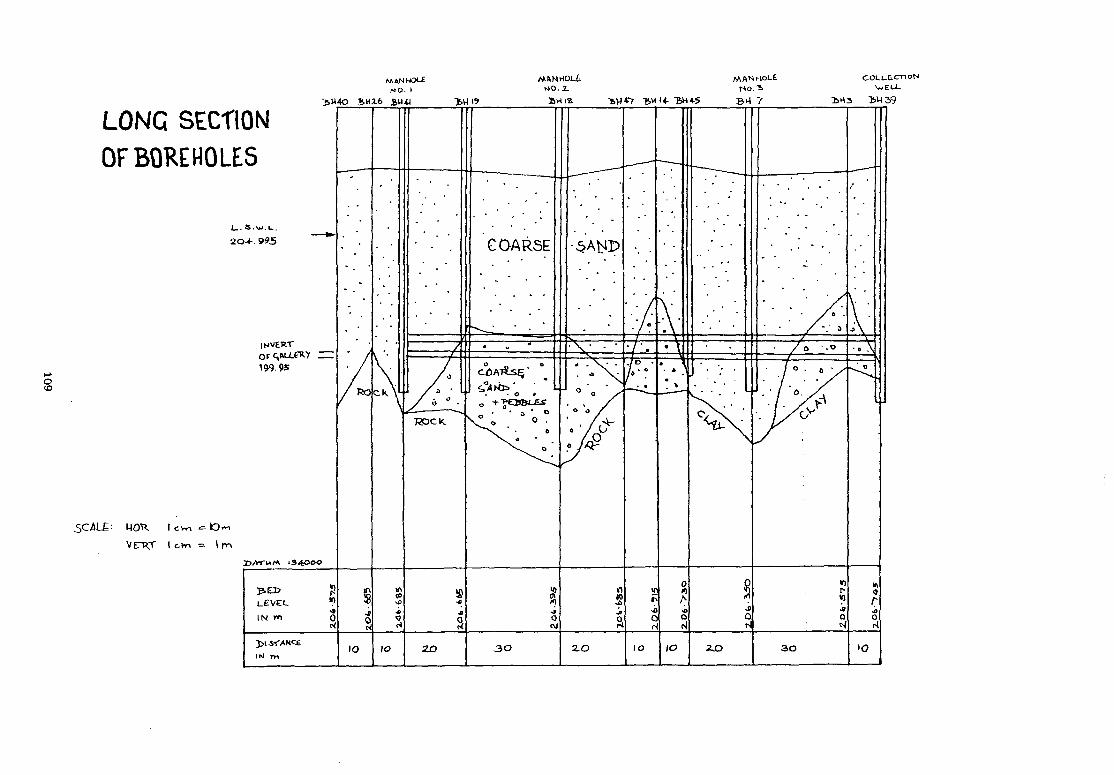
LONG SECTIONOF BOREHOLES
AkANHOU!MO. Z.
BHlS
COLLGCTioN
•BH4-S
HO.1
U. S.w.L.
2CM-. 995
INVERTorc,wx199.9S
5C/LE: MOT?. I cw,
VETRT I c-Vn = I rn
DATUM 134POO
5-EDL.EVEU
IO
GO-ARSE
2 . 0 10 Z.O 3 0

BACK F'tl. WITH C»(iV<r<D ««rl«i*L»
fait r»M »My soar of o«*A».c
/>!»*"
TYPICAL S£CTIOW QC AU
/MFIL7RATIOH
110

"round Level
LITHOLOG OFBORE WELLEPDK-3
4.OOM
14.OOM
LOCATION:MANAMELKUDI10 02" 30", -S5.O0M79 1400" N N
4 8
59.OOM
UNION=AVUDAIYARKOIL
DIST - PUDUKOTTAI
80.00M
157.OOM
530.OOM
54 LOOM
545.OOM
Sand medium tocoarse grained
Clay admixed withminor sands
Sandstone admixed withminor clay with fossils
Clay greenish to darkbrown, with minor sands& silt
Sandstone roundedwith clay; limestone
Clay dark grey toblack intercalatedwith silt stone; SSTfine grained with fossil
Sandstone; fine tocoarse grained mostlywith quartz with minorclay plastic and sticky
Clay; Brown toyellow plastic stickyadmixed with minor sand-stone and limestone
Basement rockMassive charnockite
111


Annex 14
GROUND WATER EXTRACTION AND SUPPLY THROUGH TUBE WELLS, RADIAL COLLECTORWELLS AND INFILTRATION GALLERIES INCLUDING CASE STUDIESby Shri G Haridass, Exective Engineer (Research Division) Tamil Nadu WaterSupply & Drainage Board, Madras
Introduction
Utilisation of ground water as a source dates from ancient times. With the developmentof various technologies and industries, the necessity for perennial and potable waterwas felt that the 17th century onwards. The Science of hydrology was founded in the17th century and geology was developed in the 18th century. From those days, the fieldof ground water hydrology has develped a lot. In the last few decades, ground waterexploitation has increased hundred-fold. In spite of these facts, a large number ofintricacies about ground water hydraulics are yet to be solved and require a lot ofexperience and efficient intrepretation.
A conservative estimate indicates that over 97 per cent of all the fresh water availablein the planet is in underground reservoirs. Ground water storage is a changing phenomenondepending on various factors at both micro as well as macro levels. Hence the study ofground water supply and extraction through various means requires a detailed study,especially in the case of community water supplies with regard to dependability, economyetc. Further ground water sources can be broadly classified as sub surface aquifers anddeep aquifers. The former requires detailed investigation on the nature of soil and therecharge characteristics whereas the latter requires a detailed study of the geology ofthe strata as well as hydrological aspects. In any case, ground water is invariablymoving under hydraulic priniciples. The flow rate through any porous media is pro-portional to the hydraulic gradient and inversely proportional to the length of flow.In this document, the factors affecting the variations in the above parameters andthereby the extraction and supply through various ground water sources will be dealtwith.
Geological Considerations
Rocks can be broadly classified as igneous, sedimentary and metamorphic, based on theirorigin.. Igneous rocks are apoor source for water unless the fault and fracture patternsformed due to tectonic activities are favourable. However, in case of Basalt lavas(extensive in North India) it is a good source of aquifer due to large joint openingsand other cavities. In case of sedimentary rocks, good aquifers can be met with inunconsolidated sedimentary deposits including gravel, sand, silt and clay. The yieldis poor in case of consolidated and cemented sand stones, siltstones, conglomeratesetc. Limestone formations with solution channels and caverns are also good aquifers.Metamorphic rocks such as Gneiss, schists, marbles, quartizite etc., have poor yield anddepend on the characteristcs of the primary rocks.
The more the decomposition and weathering, the more the water bearing capacity of therock increases. The porosity of rock varies from 1.5 percent in slightly weatheredrock to as much as 40 per cent in highly decomposed rock.
The characteristics of various formations are detailed below:
Gravel
Gravel and Sand
Sand
Sand stone
Porosity(Percent)
25
20
35
15
Specific yield(Per cent)
22
16
25.
8
Pemeabilitym/day
600 .-
200 -
250
.005 -
1000
800
2
113

Ground Water Supply in Tamil Nadu
Nearly two thirds of Urban Water Supply Schemes depend on ground water as theirsource. 90 per cent of such ground water sources are from sub surface in variousriver beds. The balance is extracted from deep aquifers. Invariably the ruralwater supply schemes are provided with ground water sources, especially throughtube wells except in case of a few comprehensive schemes and for places near tosub-surface sources.
Ground Water Supply in Tamil Nadu is appreciable in various river basins wherequaternary alluvium is present. In Cauvery delta the transmissivity per food widthvaries from 200-300,000 gpd/ft, with an average of 20,000 gpd/ft. In most of thealluvium in Palar the co-effiencent of permeability ranges from 12 500 to 20 000gpd/ft^. Where the thickness of sand varies from 2 to 12 m in general and upto22m in certain places. Most of the rivers in this state are non perennial and asalready stated only flow for a few days or a few months in a year. But at plains,most of these river beds offer good sub surface flows. A large number of infil-tration wells, infiltration galleries and collector wells in addition to siphon wellsare located in these river beds to supply a number of Urban Water Supply Schemes anda few Rural Water Supply Schemes. There are certain regions of artesian aquifersespecially in Neiveli (sand stone) and in East Ramanathapuram regions. Controlledexploitation of these regions became imminent due to possibility of salt waterintrusion as they happened to be near sea shore. In hard rock (Archaean) regions,water is available in certain regions where there is sufficient weathering anddeoraposition.
In general tube wells are preferred in the hard rock zones as the quantity availablewill be less than 100 - 250 1pm. Most of these tube wells or bore wells are meantfor Rural Water Supply Schemes as well as for Urban communities in scarcity areas.
Tube Wells
Tube wells are invariably preferred in Rural Water Supply Schemes in Tamil Nadu forthe following reasons.
1 Large variation in ground water level in various places due tovagaries of rainfall.
2 The well could be installed within a day for extraciton of water insmall quantities
3 The method is cheaper in the case of small water supply shemes up to about1000 lpm where enough ground water is available at or near the pointof consumption
4 Where the aquifer is very deep with low co efficient of permeabilityor where good aquifers are available below 10 to 20 m or more
Detailed surveys on the geology are undertaken and resistivity meters are used forlocating the points for bore wells.
In the case of hard rock regions generally 125 mm or 150 mm bores are drilled atvarying depths. The casing pipe is limited to the top soil cover and fixed on thehard rock. The development of the well is carried out and the yield is tested basedon pumping tests after development. In the case of sedimentary regions, pilot boreholes are sometimes carried out and depending on the bore log or lithology,development of a production well is carried out. The yield tests are conductedgenerally be constant discharge tests and observing the drawdowns. A typical detailof a bore well is shown in appendix 1.
Collector Wells
These are caissons of 4 to 6 m internal diameter sunk into an aquifer to a greaterdepth and at times upto an impermeable stratum. The bottom of the well is plugged.This type of well is suitable for aquifers of 10 to 25m depth with sufficient subsurface flow. Radial slotted steel pipes of 2OO-3OOmm dia are driven horizontallyinto the aquifer at the most likely level of the aquifer in different directions.
114

Appendix 1
1.1 Comprehensive Water Supply Scheme to Manamelkudi and47 Other Habitations - Using Tube Wells as Source
A comprehensive water supply scheme to Manamelkudi and 47 other habitationsin Avudayarkoil Panchayat Union was designed with a common deep bore well as thesource. The population of all the 48 habitations is 30, 255 in 1978 andultimate population is worked out as 39,338. At the rate of 40 lpcd, andadopting 16 hour of pumping the requirement was worked out as 1210 lpm.
There is no perennial river or potential aquifer at sub surface level in thisarea. Being tertiary sedimentary deposit area with sufficient ground waterpotential, it was proposed to have bore wells as the source for this scheme.However, in this area all shallow bore wells upto 60 m depth as well as deepbore wells upto 150 m depth put down earlier are found to contain only brackishwater. An existing artesian well put down at Manamelkudi, of about 304 mdepth indicated that the quality of water below 150 m depth is potable. Thediameter of the above artesian bore well is only 100 mm; hence it was proposedto put down deep bore wells of larger diameter for about 360 m depth in thesame area to draw the requirements of the proposed comprehensive water supplyscheme. Further study of ground water in this region was taken up and it wasdecided to locate two bore wells, to provide water supply to all the abovehabitations.
An artesian bore well of 356 mm x 203 mm was sunk upto 527 m. The logging ofthe well was carried out and it was decided to provide blank pipes and slottedpipes at locations shown in the plan. The yield after development of the wellwas also found to be 979.66 lpm for a draw-down of 6.1 m. Hence it was decidedto provide water supply to all the habitations from this well at the firstinstance and to provide another bore well at a later date when necessity arises.
The scheme has been commissioned and is working satisfactorily.
1.2 Litholog details of borewells
Location : Manamel Kudi
Union : Avadaiyar Koil
District : Pudukottai
Latitude : 10° 02 30
o ' "
Longitude : 79 14 00
Bore hole Diameter
400 mm = GL - 24.0 m
250 mm = 24.0 m - 526.0 m
222 mm = 526.Urn - 545.0m
Type of mud : Bentonite
Mud resistivity : 2.8 Ohm m/25°C
Free flow test
Step Draw Down
Calculated yield for 6.1m draw-down is 979.66 lpm
115

Limestone 5 2 10 -2
Clay 45 3 0.1
Quartizite, granite 1 ,5 .01
In general, in highly weathered igneous and metamorphic rocks tube wells or dug wellscan yield between 45 - 120 1pm and at some places as much as 250 lpm. In unconsolidatedformations, the yield will vary depending on the type of aquifer.
For classification of geological age the systems are classified as below in order ofabsolute back dates in years.
Geological time scale systems
System Absolute dates in million years
Quaternary 0 - 2 5
Tertiary 2 5 - 6 5
Cretaceous 65 - 140
Jurassic 140 - 200
Iriassic 200 - 240
Permian 240 - 290
Carboniferouc 290 - 350
Cambrian 505 - 605
Pre Cambrian 605 - 2500
Archaean 2500
Hydrology and Hydrogeology of Tamil Nadu
This rock classified according to age in Tamil Nadu is as follows:
Archaean 73.4 per cent
Sedimentaries
Gondwana (clay) 1.9 per cent
Cretaceous 1.2 per cent
Tertiary 6.7 per cent
Quaternary allunium 16.8 per cent
Tamil Nadu has a net area of 1,300,357 km. The average annual rainfall is 945.7 mm.The distribution of rainfall is 19 per cent between January - May, 34 per centbetween June - September and 47 per cent between October .- December. The annualprecipitation amounts to about 123 km^, whereas that actually utilized is around25 km-*. The average annual ground water recharge is estimated to be 18 km3. Thereare about 1.6 million wells in existance in Tamil Naduc The current rate of extra-ction is in the order of 13 Km3. Hence there are further chances of extraction of anadditional 5 to 6 Km3 of ground water. With a proper Engineering Management, it couldstill be possible to tap as much as 45 Km3 of ground water based on precipitation.This can be achieved by improved land use patterns, artificial ground water recharge,basinwise ground water development and conjuctive use of both surface and ground water.
116
Appendix 2
Water supply scheme for Kovilpatti and way side villagesfrom radial collector well in Tamiraparani River
The above scheme required the provision of a water supply to the tune of 8.31 mid(1.92 mgd) at the intermediate stage and 11.67 mid (2.57 mgd) at the ultimate stage.Forecasting a future extension of water supply to some other beneficiaries, it wasdecided to abstract 15 mid (3.3 mgd) of water from Tamiraparani River through acollector well. The river is a perennial one, but the summer flow is insufficientto feed the scheme. Hence it was decided to abstract sub-surface flow from theriver. The strata is a very good aquifer with coarse sand and pebbles. A minternal diameter collector well was sunk upto 8.52 m below the bed level and radialdrains were provided at 5.32 in below ground level for a total length of 330 m.Yield test for the above well was conducted and found to be in excess of 11.67 mid(3.3 mgd)
The scheme was commissioned in 1975 and has functioned satisfactorily for over 7years. The details of the radial collector well are shown in the enclosed sketch.
Appendix 3
Comprehensive water supply scheme for Kaipadi Town Panchayat andother Panchayats using infiltration gallergy as source
A proposal of tap water to town Panchayats, Katpadi, Kalinjur, Dharapadavedu andvillage Panchayat Virudampet in North Arcot District was formulated with the RiverPalar as the source,, Even though there is no surface flow in the River Palar formost of the months of the year, there is sufficient sub-surface flow and hence theRiver Palar was chosen as the source.
The requirement of water for the intermediate stage in 1991 will be 4.14 millionlitres (4,313 lpm) and for the ultimate stage in 2006 will be 5.36 million litres(5.584 lpm). To abstract this quality, an infiltration gallery for a length of136 m with 3 Nos of manhole wells, was proposed and installed. The manhole wellsalso have porous block steining for 3.45 m, to act as infiltration wells. The salientdetails of headworks are:
Average bed level of river : 206,645 m
Low summer water level : 204.995 m
Invert of gallery : 199.950 mPVC slotted pipes
Maximum Flood level : 209.520 m
The scheme was brought into beneficial use in 1976. The details of river strata andthe alignment of the gallery is shown in figure. A typical cross section of agallery is also appended.
117

Collector wells are favourable for drawing watjer from 5 raid to about 50 mid froma single structure. As the driving of radials progress fine media are desanded and aninsitu filter is created. The collector well utilises as much as 90 per cent ofavailable head of water and the entrance velocity upto 5ra/sec is obtained whichaccounts for low operation costs. The system is limited to places where a coarsemedium is available (2 mm) and where the depth of aquifer exceeds 8 m. The extra-ction can be carried out at different layers of the strata depending on theavailability of coarse media. One of the collector wells installed in Tamil Nadu isshown as detailed in appendix 2.
Infiltration Galleries
Infiltration galleries are structures resembling a filter insitu. They are locatedin potential aquifers or river beds or other unconsolidated shallow aquifers of5-10 m depth. They are favourable in places where either an impermeable layer ismet with, below shallow depths, or salt water instrusion may be likely to arise.Galleries are preferred where the requirements of infiltration wells or tube wellswill be too great and where sufficient ground water potential exists. The alignmentof the gallery is made based on the strata characteristics obtained from test bores.Galleries are alighned along with test bores having coarse media as well as withoutany clay pockets.
The structure is made of perforated pipes qr loose jointed pipes horizontally laidaround which stone and sand media are spread out as in the case of a filter. Themedia vary from broken stone (38 mm) down to find sand (retained in 70 micron sieve).The gallery is connected to manhole we,lls at 75 m intervals and collection or pumpingis made from a collecting well which creates sufficient draw-down for permeationthrough the gallery. The rate of extraction varies with the sub-surface flow ofwater and generally around 30 lpm/m length of gallery. In some cases sub survacebarrages are provided down stream which will help in inundating the strata.
A case of infiltration gallery functioning in Tamil Nadu is detailed in appendix 3.
118

Annex 15
Role of solar distillation in Rural Water Supplyby: Dr R Pitchai, Director & Professor andT Damodara Rao, Visiting Faculty, Centre forEnvironmental Studies College of Engineering, Guindy, Madras-25
Introduction
In Tamilnadu, availability of surface water for public water supplies is limited.This has necessitated exploitation of ground water to a large extent. At present, thewater from many of the bore-wells installed suffers from excessive amounts of con-stituents like iron, fluoride, nitrate and dissolved solids. tJhen no alternativesource is available, the users have to use the poor quality water with attendantproblems. To some extent, it is possible to provide for removal of iron and floride.Removal of nitrate is also technically feasible.
Removal of dissolved solids is feasible by chiefly two methods, viz., reverse osmosistechnique and solar distillation. Reverse osmosis is being tried in many places butit requires a high energy usage and sophisticated technology. Solar distillation onthe other hand, is simple and uses only the abundant available solar energy. However,costwise, solar distillation is very expensive and can be tried only where no otheralternative is possible.
PRINCIPLE AI:D CONSTRUCTION OF SOLAR DISTILLATION STILL
The heat part of the solar energy is trapped in a glass windowed vapour tightcontainer with available brackish or saline water. This heat raises the temperatureof the brackish water to about 70°C or more. At this temperature, the water evapo-rates and is obstructed by the glass pane. The vapour condenses on the under side ofthe glass pane and flows down the slope of the glass pane to be collected by a dis-tillate gutter which draws out the distillate. The structure can be of wood ormanonry. Yields of 2 litres per square metre per day are usual. The unit can beused independent of the quality of water available. The distillate, being pure water,can be used immediately. If precautions are taken no disinfection may be needed.The glass panes are given a slop to facilitate the condensed vapour to flow easilyto distillate gutter. The solar still can be constructed to have double slopedglass panes or with sloping on one side as required.BF.IEF DESCRIPTION OF SOLAR DISTILLATION STILL ATPERARIGHAR ANNA UNIVERSITY OF TECHNOLOGY
The Perarignar Anna University of Technology at Madras has 2 units at the Centre forEnvironmental Studies and one unit at Kovalam. The former are small units, one ofwhich is made of wood and the other built of masonry. The solar distillation stillat Kovalam is a fairly large unit which is under study and is supplying about 500litres of water per day to about 20 families in the vicinity.
The wooden model has a size of 1.83 m x 1.22 m. This was constructed in 1973. Itis now used for study in improving yield of distillate on a pilot scale. Usually ityields about 5 litres per day. The entire yield is obtained in the daylight hours.No yield is noticed during the nighto
The masonry model was constructed in 1979. There are two stills of 1.80 m x 1.04 msize separated by a trough 0.50 m wide. There is provision in this design to harvestthe water falling as rain on the still area in the rainy season since it is of thesame qualiry. Further, during rains, no distillation may occur and the rain watermay be a good substitute for the distillate. The cost of this unit was Rs 1 100/-.This unit has a total surface area of 5.58 sq metes of which 3.74 square metres areof glass. The yield has been recorded continuosly for 3 years and varies daily from7 litres in the cooler period to 10 litres in the hot season.
The solar distillation unit at Kovalam, a hamlet 30 km south of Madras on the sea shore,is modelled on the masonry unit at the Centre for Environmental Studies. There are16 bays each 14.S m x 1.04 m in size. The total area of glass panel amounts to 250square metres. The daily yield recorded shows a variation from 400 litres in Jlovember-December to 700 litres in May-June.
119

As mentioned before, about 20 families nearby use the water in the focal wells issaline and cannot be used. The cost of this unit was Rs 80 000/- approx.
EXPERIENCES IN SOLAR DISTILLATION TECHNIQUE
In the day to day maintenance of the solar distillation still at Kovalam many problemsare encountered. The plumbing arrangements, the pumping and feeding of water intothe still to maintain a depth of 5 cm, profuse growth of algae in the stagnant waterin the still, choking of the water pipes, deposition of fine sand on glass surface,vadalism from nearby school children and breakage of glass panes due to many factorsare some of the frequent recurring problems. Unless these are successfully handledthe yield of the solar still can deteriorate rapidly. One paid labourer is nowemployed to look after the still, pump water into it from a brackish water well nearbyand distribute the distillate. He gets Rs 10/- per day. The annual maintenance forcleaning the still free of algae and salt deposits, replacingbroken glass panes,securingthe glass masonry seal by use of tape etc will cost again about Rs 5 000/- annually.The total maintenance per year may be about Rs 8 500/- annually. The average yieldis about 500 litres per day. On this basis, not taking into consideration the cost ofthe solar still the water from the solar distillation still will cost about Rs 46.6 per1000 litres. —
The smaller masonry unit at Centre for Environmental Studies costing Rs 1 100/-can however be adopted for an individual house to supply the drinking water,where no other source for drinking water exists. In such a case costing ofwater many not have the same importance and the sole fact of potable wateravailability will decide the adoption of the still.
STUDIES ON IMPROVEMENT OF YIELD
In many evaporation pan studies, it has been observed that daily evaporation ratesin Madras range from 2 mm to 8 mm per day. Even though a heat trap using glass panelsis used in solar stills, the yield is very low compared to natural solar evaporation.Using the multiple effect it should be possible to achieve a rate of evaporationin excess of natural evaporation. Towards this end, studies have been carriedout at the Centre for Environmental Studies.
In one study, pebbles were us'ed in the masonry solar distillation still at theCentre for Environmental Studies. This increases the yield by about 20%. In anotherstudy a black dye was used to render the water contents of the solar still black andthereby attain a higher absorption of solar heat. This resulted in a 50% increasein yield. Surprisingly, a combination of pebble and dye was not as effective as dyealone and gave only about 40% increase in yield. There are further problems inapplication of this technique to larger solar distillation units which are yet to bestudied. Future studies will aim at increasing the trapping of solar heat by givingcoatings to glass panels used. Methods to use the latent head of vapourisation whenthe vapour condenses should also be worked out to increase the distillate yield.
APPLICABILITY OF SOLAR DISTILLATION TO RURAL WATER SUPPLIES
Theoostofthesolar distillation technique is very high and consequently this can beused only in situations where other alternatives are not available. However, thetechnology is simple and with reasonable care, it should be possible to obtain ayield consistently. However, individual houses can be given small distillation unitswith say 4 square metre units upplying about 10 litres/day for the drinking water needsonly in very difficult areas. Probably maintenance of these units can be much simplerthan large units supplying water to a community. In exceptional circumstances, largeunits may also be justified and the present know-how is sufficient for its maintenance.Looking at the cost of the product water, it would appear that this solar energy fordrinking water can be only a very special application. However, if methods forincreasing the yield were to succeed spectacularly, solar distillation may become ahighly desirable method which can be independent of rain, by reclaiming sea water.
ACKNOWLEDGEMENTS
The authors thank the authorities of Perarignar Anna University of Technology forpermission and encouragement for preparing and presenting this paper.
120