Embed Size (px)
Citation preview
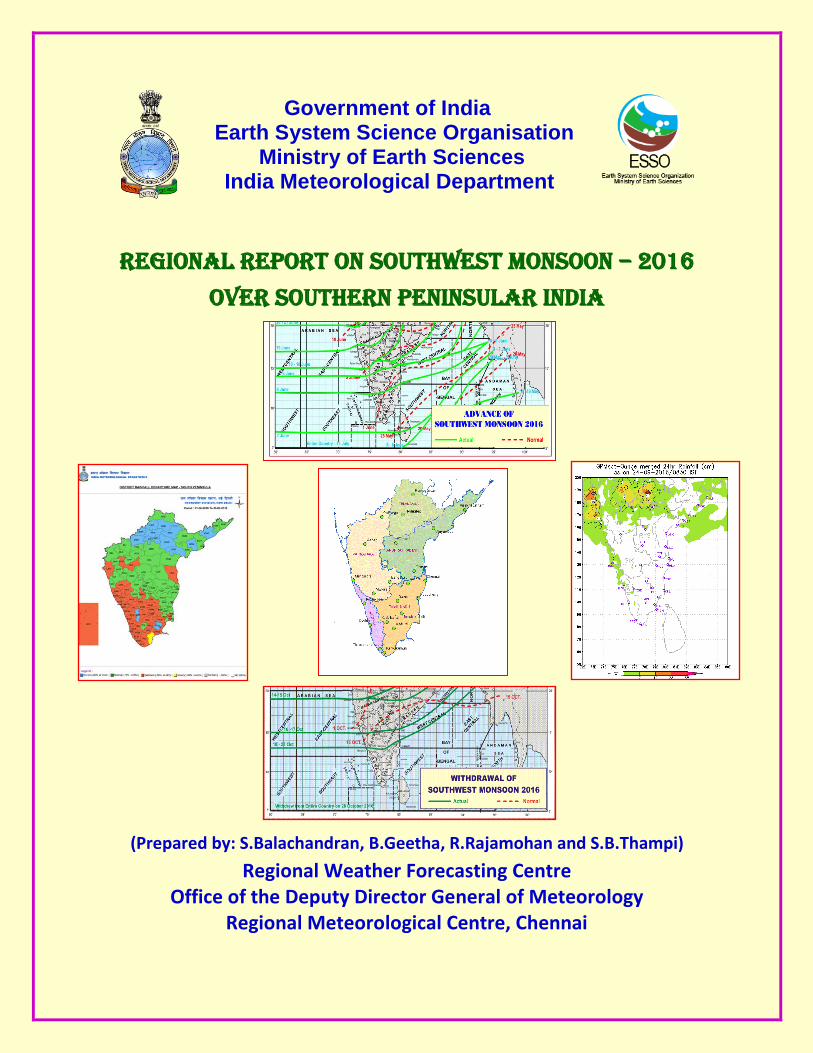
Government of India Earth System Science Organisation
Ministry of Earth Sciences India Meteorological Department
REGIONAL REPORT ON SOUTHWEST MONSOON – 2016
OVER SOUTHERN PENINSULAR INDIA
(Prepared by: S.Balachandran, B.Geetha, R.Rajamohan and S.B.Thampi)
Regional Weather Forecasting Centre Office of the Deputy Director General of Meteorology
Regional Meteorological Centre, Chennai
1
HIGHLIGHTS
During 2016, onset of southwest monsoon (SWM) over Kerala took place on 8th
June, 7
days behind the normal schedule of 1st June and covered the entire southern peninsular
India by 19th
June.
Rainfall during the SWM season of June-September, 2016 over the southern Indian
peninsular region comprising of the five states of Andhra Pradesh, Telangana, Karnataka,
Kerala and Tamil Nadu and two union territories of Puducherry and Lakshadweep was
92% of its long period average (LPA).
Seasonal rainfall over the nine meteorological subdivisions over the region, viz., Coastal
Andhra Pradesh (CAP), Telangana (TEL), Rayalaseema (RYS), Tamil Nadu
&Puducherry (TN&PDC), Coastal Karnataka (CK), North Interior Karnataka (NIK),
South Interior Karnataka (SIK), Kerala (KER),Lakshadweep (LAK) and were 14%, 19%,
-2%, -19%, -21%, 4%, -21%, -34% and -25% and respectively.
Five meteorological subdivisions in the region received normal rainfall (-19% to +19%)
and four subdivisions ended up deficient (≤-20%) at the end of the season. KER and CK
which receive about 200 cm and 300 cm of rainfall respectively during SWM came under
deficient category with -34% and -21% respectively.
On the monthly scale, sub-divisional rainfall distribution was (i) excess over 6
subdivisions and normal over 3 subdivisions in June (ii) 3 subdivisions received excess
rainfall, 3-normal and 3-deficient in July (iii) 8 subdivisions ended up deficient and 1-
scanty in August and (iv) 2 subdivisions received excess rainfall , 1-normal, 5-deficient
and 1-scanty in September.
Withdrawal of SWM 2016 from the region commenced on 15th
October. It withdrew from
the entire region on 28th
October 2016.
2
1. Onset and Advance
Normally, onset of SWM over Kerala takes place on 1st June and advances gradually into
other parts of India. It covers the entire southern peninsular India (SP) comprising of five states
(Andhra Pradesh, Telangana, Kerala, Karnataka and Tamil Nadu) and two union territories
(Puducherry and Lakshadweep) and divided into nine meteorological subdivisions of Coastal
Andhra Pradesh (CAP), Telangana (TEL), Rayalaseema (RYS), Tamil Nadu & Puducherry
(TN&PDC), Coastal Karnataka (CK),North Interior Karnataka (NIK), South Interior Karnataka
(SIK), Kerala (KER) and Lakshadweep (LAK) by 10th
June. During 2016, onset of SWM over
Kerala took place on 8th
June, 7 days behind the normal date. It covered the states of Kerala and
Tamil Nadu by 9th
June, Andhra Pradesh by 18th
June and then Telangana and Karnataka by 19th
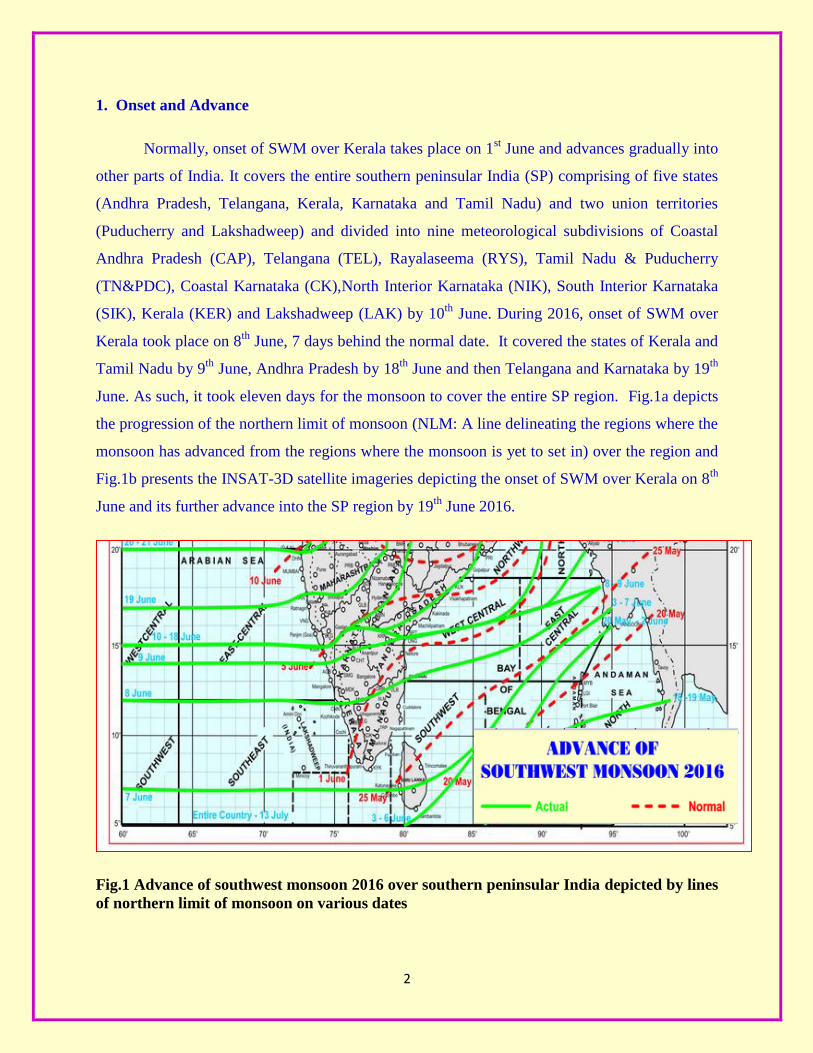
June. As such, it took eleven days for the monsoon to cover the entire SP region. Fig.1a depicts
the progression of the northern limit of monsoon (NLM: A line delineating the regions where the
monsoon has advanced from the regions where the monsoon is yet to set in) over the region and
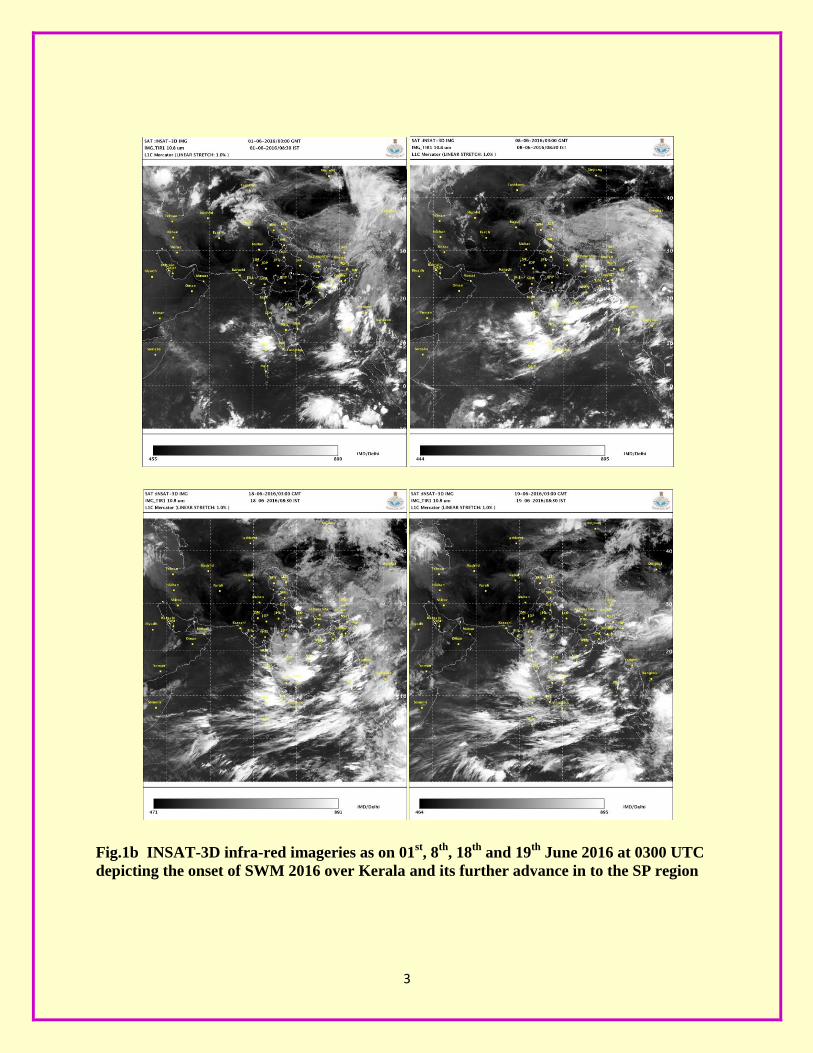
Fig.1b presents the INSAT-3D satellite imageries depicting the onset of SWM over Kerala on 8th
June and its further advance into the SP region by 19th
June 2016.
Fig.1 Advance of southwest monsoon 2016 over southern peninsular India depicted by lines
of northern limit of monsoon on various dates
3
Fig.1b INSAT-3D infra-red imageries as on 01st, 8
th, 18
th and 19
th June 2016 at 0300 UTC
depicting the onset of SWM 2016 over Kerala and its further advance in to the SP region
4
2. Rainfall distribution
2.1 Spatialrainfall distribution
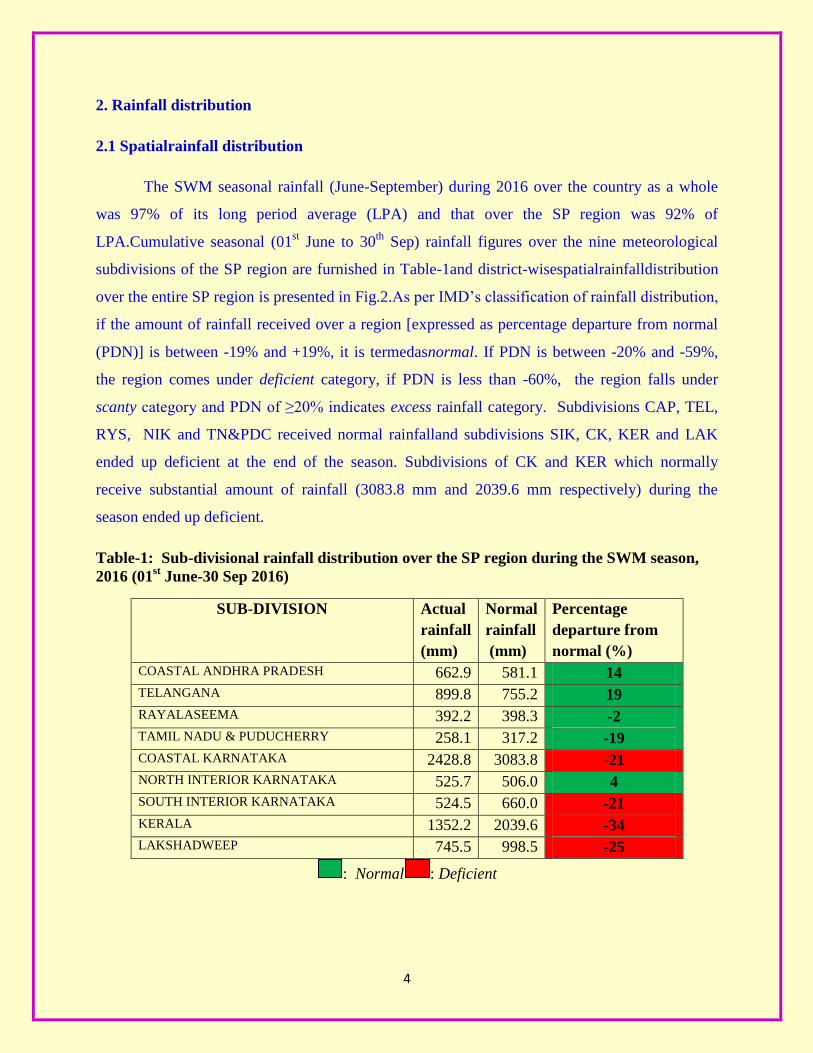
The SWM seasonal rainfall (June-September) during 2016 over the country as a whole
was 97% of its long period average (LPA) and that over the SP region was 92% of
LPA.Cumulative seasonal (01st June to 30
th Sep) rainfall figures over the nine meteorological
subdivisions of the SP region are furnished in Table-1and district-wisespatialrainfalldistribution
over the entire SP region is presented in Fig.2.As per IMD’s classification of rainfall distribution,
if the amount of rainfall received over a region [expressed as percentage departure from normal
(PDN)] is between -19% and +19%, it is termedasnormal. If PDN is between -20% and -59%,
the region comes under deficient category, if PDN is less than -60%, the region falls under
scanty category and PDN of ≥20% indicates excess rainfall category. Subdivisions CAP, TEL,
RYS, NIK and TN&PDC received normal rainfalland subdivisions SIK, CK, KER and LAK
ended up deficient at the end of the season. Subdivisions of CK and KER which normally
receive substantial amount of rainfall (3083.8 mm and 2039.6 mm respectively) during the
season ended up deficient.
Table-1: Sub-divisional rainfall distribution over the SP region during the SWM season,
2016 (01st June-30 Sep 2016)
: Normal : Deficient
SUB-DIVISION
Actual
rainfall
(mm)
Normal
rainfall
(mm)
Percentage
departure from
normal (%)
COASTAL ANDHRA PRADESH 662.9 581.1 14
TELANGANA 899.8 755.2 19
RAYALASEEMA 392.2 398.3 -2
TAMIL NADU & PUDUCHERRY 258.1 317.2 -19
COASTAL KARNATAKA 2428.8 3083.8 -21
NORTH INTERIOR KARNATAKA 525.7 506.0 4
SOUTH INTERIOR KARNATAKA 524.5 660.0 -21
KERALA 1352.2 2039.6 -34
LAKSHADWEEP 745.5 998.5 -25
5
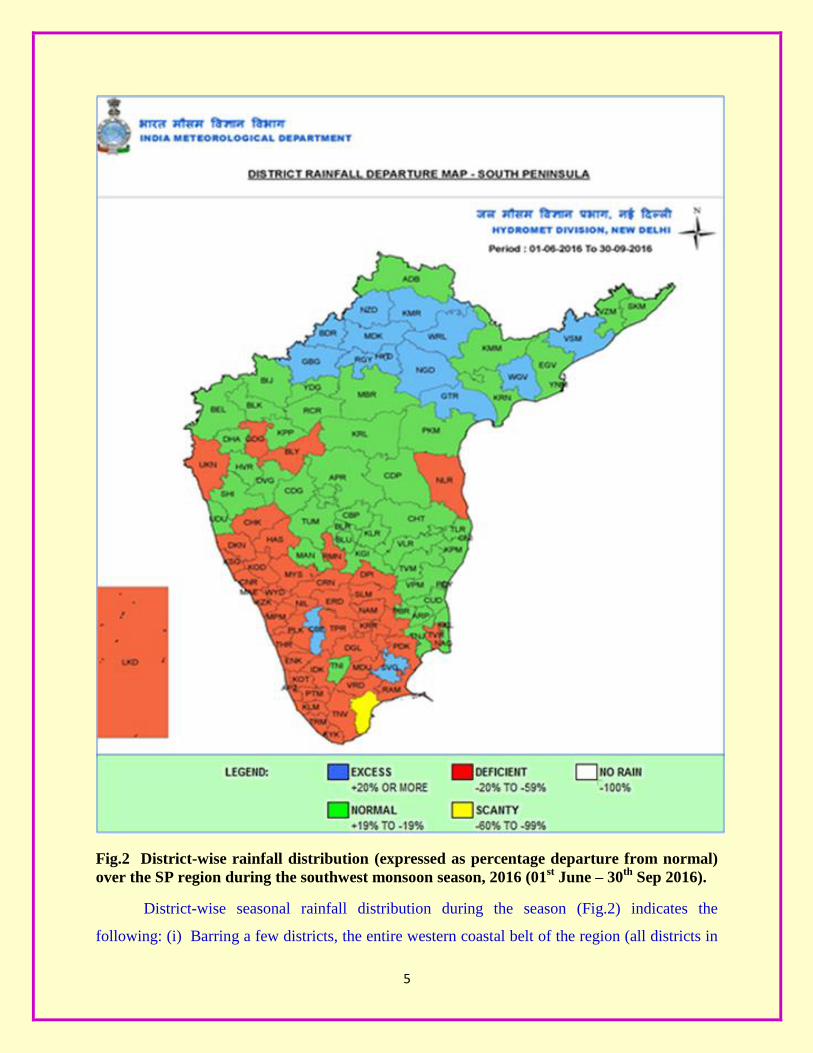
Fig.2 District-wise rainfall distribution (expressed as percentage departure from normal)
over the SP region during the southwest monsoon season, 2016 (01st June – 30
th Sep 2016).
District-wise seasonal rainfall distribution during the season (Fig.2) indicates the
following: (i) Barring a few districts, the entire western coastal belt of the region (all districts in
6
Kerala and many districts in CK) and most of the western districts of TN came under the
deficient category. Districts in the northern parts of the region received normal to excess
rainfall, with most districts in TEL and a few in NIK and CAP recording excess rainfall.
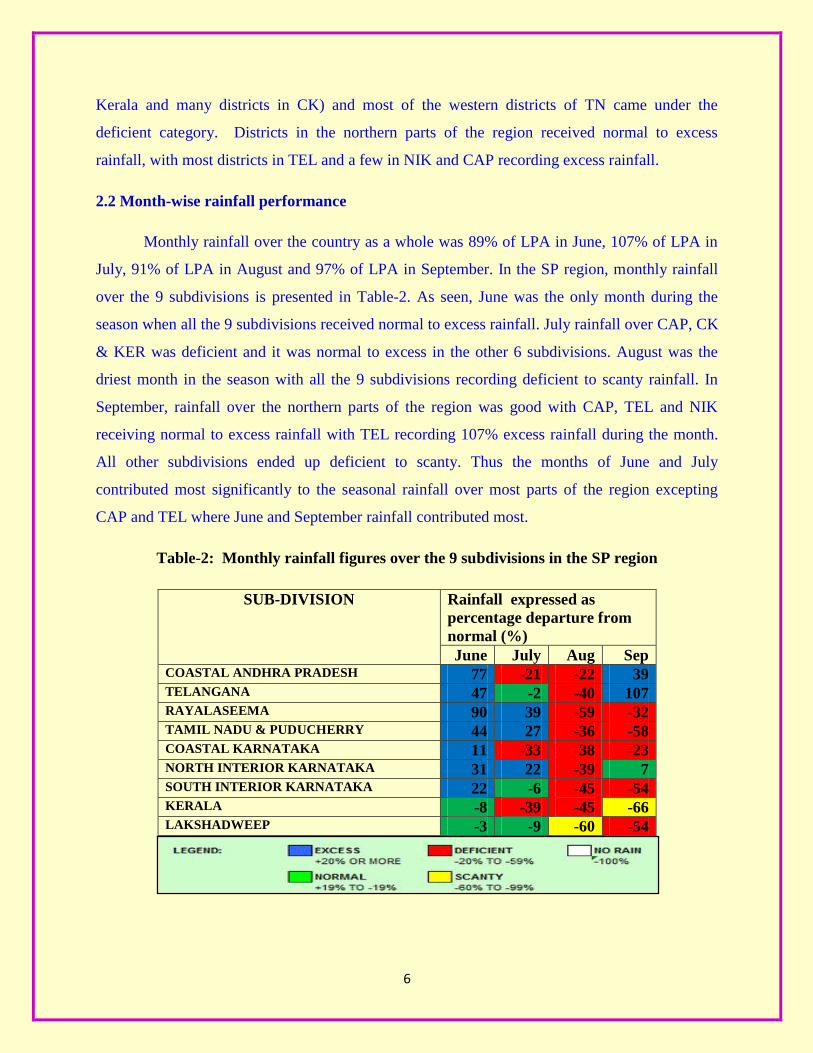
2.2 Month-wise rainfall performance
Monthly rainfall over the country as a whole was 89% of LPA in June, 107% of LPA in
July, 91% of LPA in August and 97% of LPA in September. In the SP region, monthly rainfall
over the 9 subdivisions is presented in Table-2. As seen, June was the only month during the
season when all the 9 subdivisions received normal to excess rainfall. July rainfall over CAP, CK
& KER was deficient and it was normal to excess in the other 6 subdivisions. August was the
driest month in the season with all the 9 subdivisions recording deficient to scanty rainfall. In
September, rainfall over the northern parts of the region was good with CAP, TEL and NIK
receiving normal to excess rainfall with TEL recording 107% excess rainfall during the month.
All other subdivisions ended up deficient to scanty. Thus the months of June and July
contributed most significantly to the seasonal rainfall over most parts of the region excepting
CAP and TEL where June and September rainfall contributed most.
Table-2: Monthly rainfall figures over the 9 subdivisions in the SP region
SUB-DIVISION
Rainfall expressed as
percentage departure from
normal (%)
June July Aug Sep COASTAL ANDHRA PRADESH 77 -21 -22 39 TELANGANA 47 -2 -40 107 RAYALASEEMA 90 39 -59 -32 TAMIL NADU & PUDUCHERRY 44 27 -36 -58 COASTAL KARNATAKA 11 -33 -38 -23 NORTH INTERIOR KARNATAKA 31 22 -39 7 SOUTH INTERIOR KARNATAKA 22 -6 -45 -54 KERALA -8 -39 -45 -66 LAKSHADWEEP -3 -9 -60 -54
7
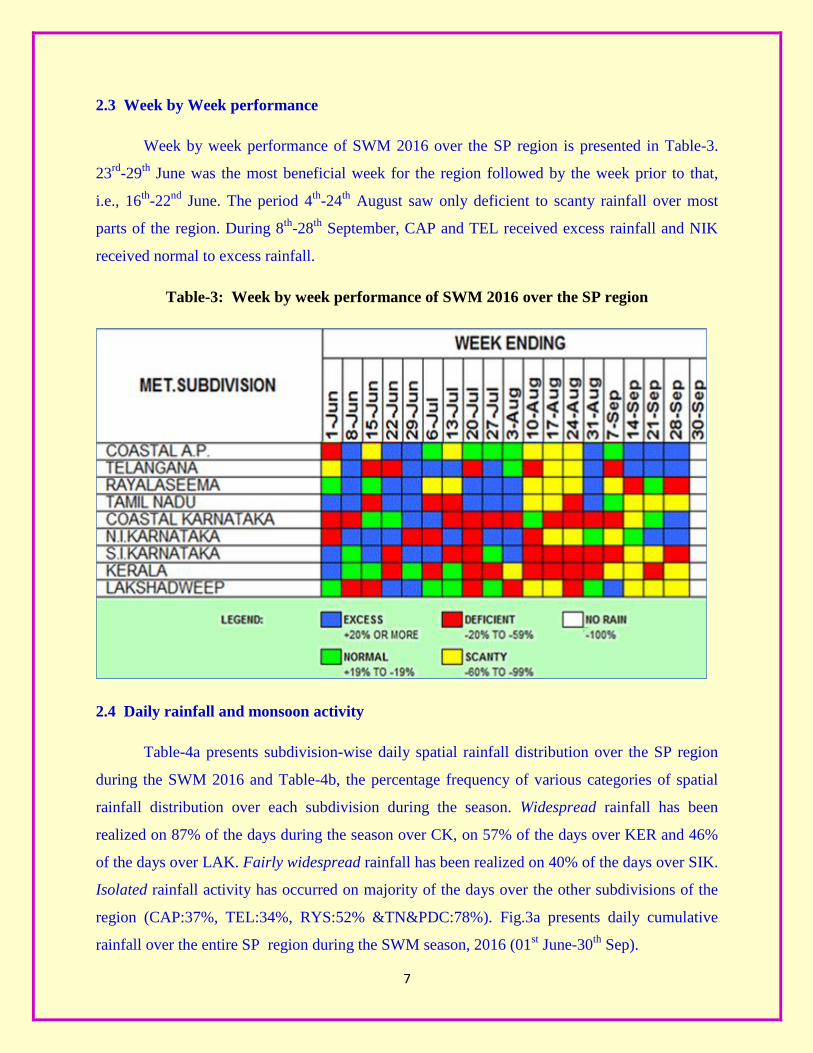
2.3 Week by Week performance
Week by week performance of SWM 2016 over the SP region is presented in Table-3.
23rd
-29th
June was the most beneficial week for the region followed by the week prior to that,
i.e., 16th
-22nd
June. The period 4th
-24th
August saw only deficient to scanty rainfall over most
parts of the region. During 8th
-28th
September, CAP and TEL received excess rainfall and NIK
received normal to excess rainfall.
Table-3: Week by week performance of SWM 2016 over the SP region
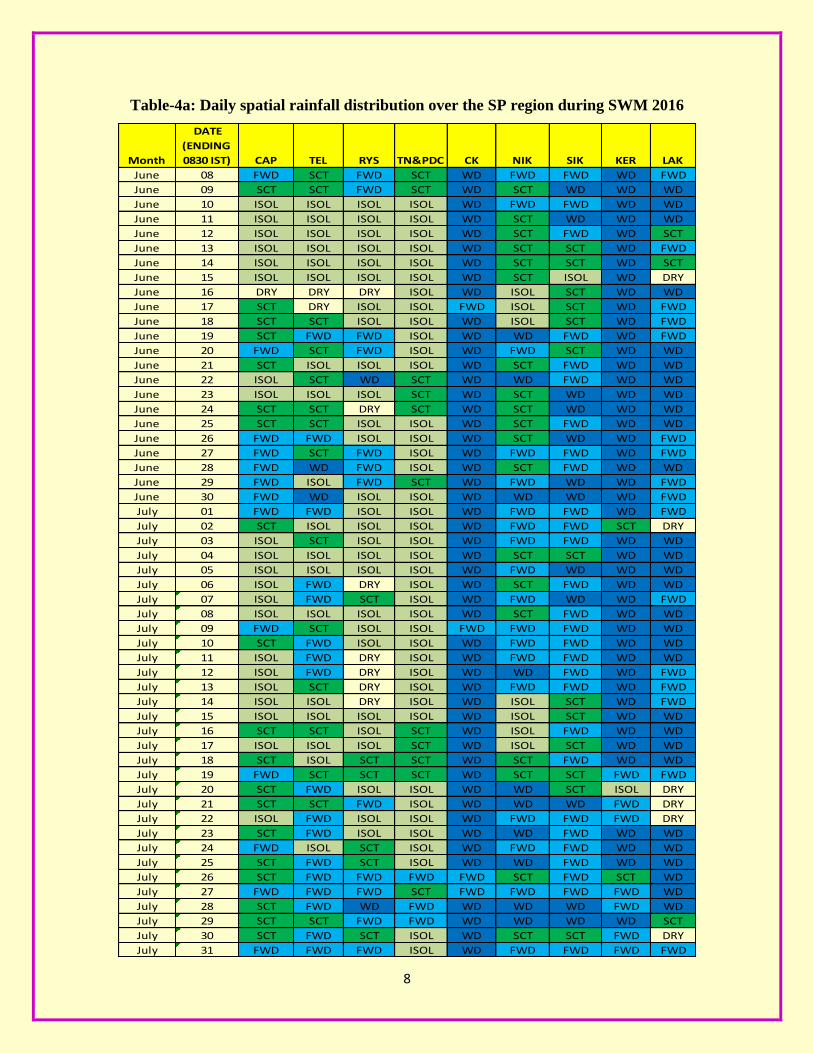
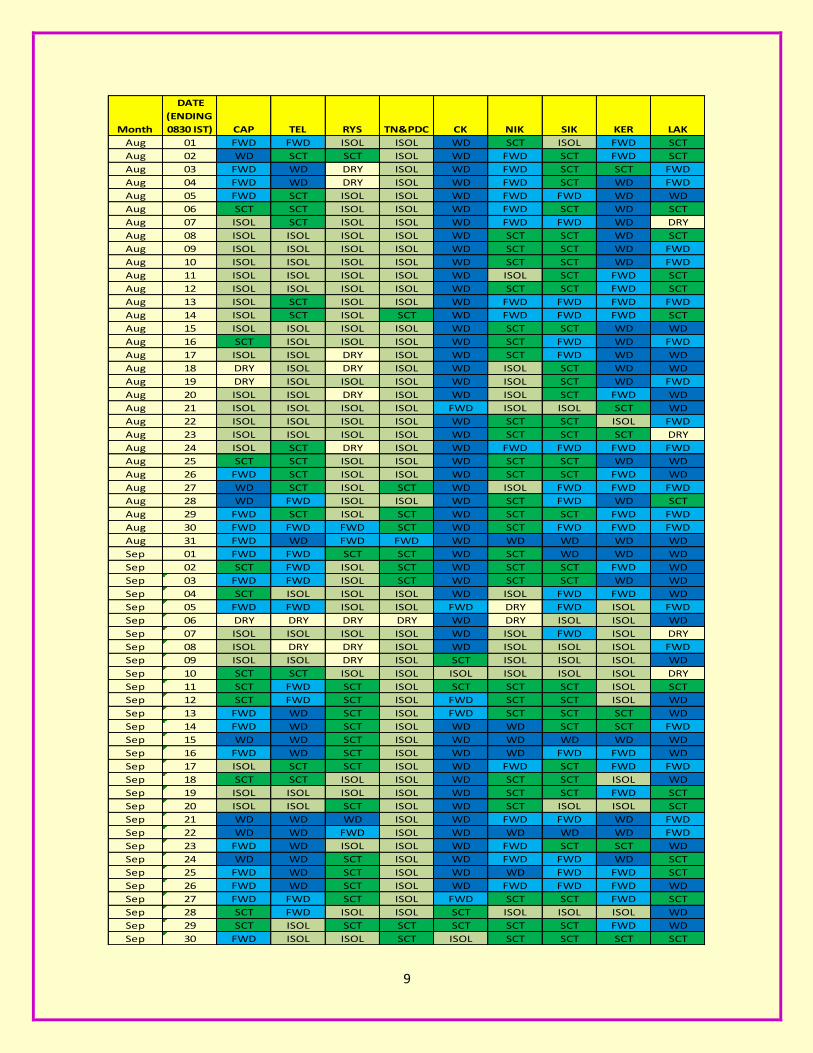
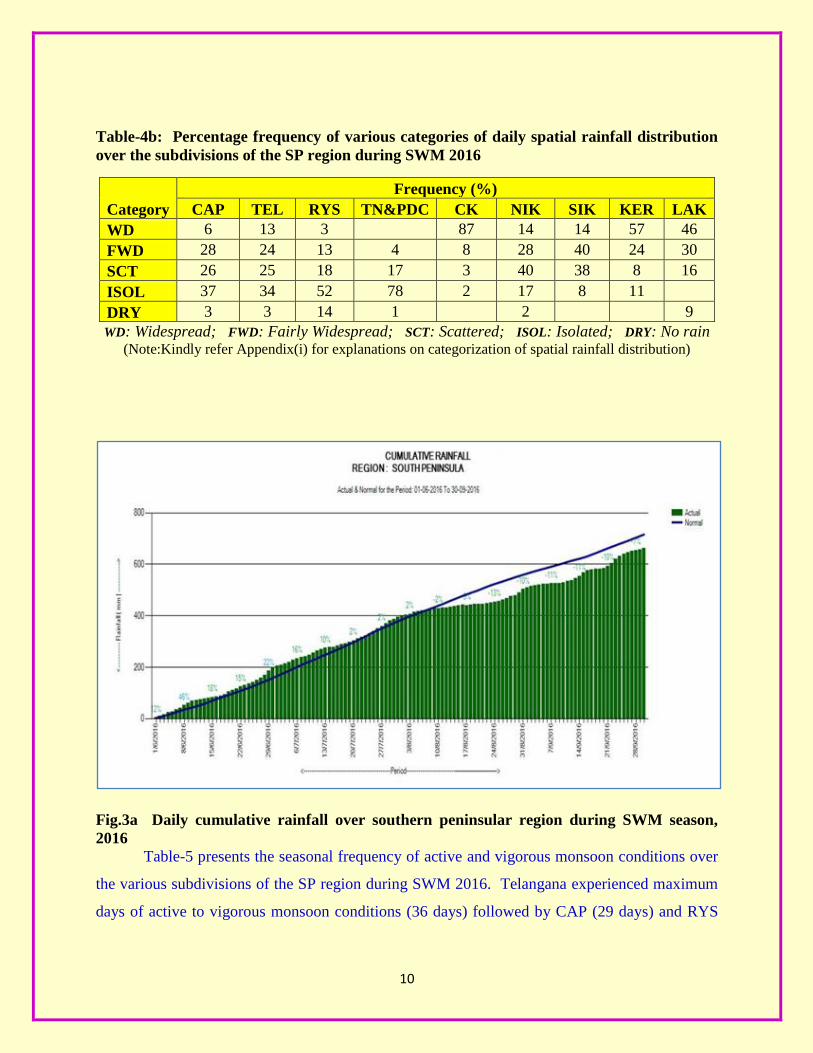
2.4 Daily rainfall and monsoon activity
Table-4a presents subdivision-wise daily spatial rainfall distribution over the SP region
during the SWM 2016 and Table-4b, the percentage frequency of various categories of spatial
rainfall distribution over each subdivision during the season. Widespread rainfall has been
realized on 87% of the days during the season over CK, on 57% of the days over KER and 46%
of the days over LAK. Fairly widespread rainfall has been realized on 40% of the days over SIK.
Isolated rainfall activity has occurred on majority of the days over the other subdivisions of the
region (CAP:37%, TEL:34%, RYS:52% &TN&PDC:78%). Fig.3a presents daily cumulative
rainfall over the entire SP region during the SWM season, 2016 (01st June-30
th Sep).
8
Table-4a: Daily spatial rainfall distribution over the SP region during SWM 2016
Month
DATE
(ENDING
0830 IST) CAP TEL RYS TN&PDC CK NIK SIK KER LAK
June 08 FWD SCT FWD SCT WD FWD FWD WD FWD
June 09 SCT SCT FWD SCT WD SCT WD WD WD
June 10 ISOL ISOL ISOL ISOL WD FWD FWD WD WD
June 11 ISOL ISOL ISOL ISOL WD SCT WD WD WD
June 12 ISOL ISOL ISOL ISOL WD SCT FWD WD SCT
June 13 ISOL ISOL ISOL ISOL WD SCT SCT WD FWD
June 14 ISOL ISOL ISOL ISOL WD SCT SCT WD SCT
June 15 ISOL ISOL ISOL ISOL WD SCT ISOL WD DRY
June 16 DRY DRY DRY ISOL WD ISOL SCT WD WD
June 17 SCT DRY ISOL ISOL FWD ISOL SCT WD FWD
June 18 SCT SCT ISOL ISOL WD ISOL SCT WD FWD
June 19 SCT FWD FWD ISOL WD WD FWD WD FWD
June 20 FWD SCT FWD ISOL WD FWD SCT WD WD
June 21 SCT ISOL ISOL ISOL WD SCT FWD WD WD
June 22 ISOL SCT WD SCT WD WD FWD WD WD
June 23 ISOL ISOL ISOL SCT WD SCT WD WD WD
June 24 SCT SCT DRY SCT WD SCT WD WD WD
June 25 SCT SCT ISOL ISOL WD SCT FWD WD WD
June 26 FWD FWD ISOL ISOL WD SCT WD WD FWD
June 27 FWD SCT FWD ISOL WD FWD FWD WD FWD
June 28 FWD WD FWD ISOL WD SCT FWD WD WD
June 29 FWD ISOL FWD SCT WD FWD WD WD FWD
June 30 FWD WD ISOL ISOL WD WD WD WD FWD
July 01 FWD FWD ISOL ISOL WD FWD FWD WD FWD
July 02 SCT ISOL ISOL ISOL WD FWD FWD SCT DRY
July 03 ISOL SCT ISOL ISOL WD FWD FWD WD WD
July 04 ISOL ISOL ISOL ISOL WD SCT SCT WD WD
July 05 ISOL ISOL ISOL ISOL WD FWD WD WD WD
July 06 ISOL FWD DRY ISOL WD SCT FWD WD WD
July 07 ISOL FWD SCT ISOL WD FWD WD WD FWD
July 08 ISOL ISOL ISOL ISOL WD SCT FWD WD WD
July 09 FWD SCT ISOL ISOL FWD FWD FWD WD WD
July 10 SCT FWD ISOL ISOL WD FWD FWD WD WD
July 11 ISOL FWD DRY ISOL WD FWD FWD WD WD
July 12 ISOL FWD DRY ISOL WD WD FWD WD FWD
July 13 ISOL SCT DRY ISOL WD FWD FWD WD FWD
July 14 ISOL ISOL DRY ISOL WD ISOL SCT WD FWD
July 15 ISOL ISOL ISOL ISOL WD ISOL SCT WD WD
July 16 SCT SCT ISOL SCT WD ISOL FWD WD WD
July 17 ISOL ISOL ISOL SCT WD ISOL SCT WD WD
July 18 SCT ISOL SCT SCT WD SCT FWD WD WD
July 19 FWD SCT SCT SCT WD SCT SCT FWD FWD
July 20 SCT FWD ISOL ISOL WD WD SCT ISOL DRY
July 21 SCT SCT FWD ISOL WD WD WD FWD DRY
July 22 ISOL FWD ISOL ISOL WD FWD FWD FWD DRY
July 23 SCT FWD ISOL ISOL WD WD FWD WD WD
July 24 FWD ISOL SCT ISOL WD FWD FWD WD WD
July 25 SCT FWD SCT ISOL WD WD FWD WD WD
July 26 SCT FWD FWD FWD FWD SCT FWD SCT WD
July 27 FWD FWD FWD SCT FWD FWD FWD FWD WD
July 28 SCT FWD WD FWD WD WD WD FWD WD
July 29 SCT SCT FWD FWD WD WD WD WD SCT
July 30 SCT FWD SCT ISOL WD SCT SCT FWD DRY
July 31 FWD FWD FWD ISOL WD FWD FWD FWD FWD
9
Month
DATE
(ENDING
0830 IST) CAP TEL RYS TN&PDC CK NIK SIK KER LAK
Aug 01 FWD FWD ISOL ISOL WD SCT ISOL FWD SCT
Aug 02 WD SCT SCT ISOL WD FWD SCT FWD SCT
Aug 03 FWD WD DRY ISOL WD FWD SCT SCT FWD
Aug 04 FWD WD DRY ISOL WD FWD SCT WD FWD
Aug 05 FWD SCT ISOL ISOL WD FWD FWD WD WD
Aug 06 SCT SCT ISOL ISOL WD FWD SCT WD SCT
Aug 07 ISOL SCT ISOL ISOL WD FWD FWD WD DRY
Aug 08 ISOL ISOL ISOL ISOL WD SCT SCT WD SCT
Aug 09 ISOL ISOL ISOL ISOL WD SCT SCT WD FWD
Aug 10 ISOL ISOL ISOL ISOL WD SCT SCT WD FWD
Aug 11 ISOL ISOL ISOL ISOL WD ISOL SCT FWD SCT
Aug 12 ISOL ISOL ISOL ISOL WD SCT SCT FWD SCT
Aug 13 ISOL SCT ISOL ISOL WD FWD FWD FWD FWD
Aug 14 ISOL SCT ISOL SCT WD FWD FWD FWD SCT
Aug 15 ISOL ISOL ISOL ISOL WD SCT SCT WD WD
Aug 16 SCT ISOL ISOL ISOL WD SCT FWD WD FWD
Aug 17 ISOL ISOL DRY ISOL WD SCT FWD WD WD
Aug 18 DRY ISOL DRY ISOL WD ISOL SCT WD WD
Aug 19 DRY ISOL ISOL ISOL WD ISOL SCT WD FWD
Aug 20 ISOL ISOL DRY ISOL WD ISOL SCT FWD WD
Aug 21 ISOL ISOL ISOL ISOL FWD ISOL ISOL SCT WD
Aug 22 ISOL ISOL ISOL ISOL WD SCT SCT ISOL FWD
Aug 23 ISOL ISOL ISOL ISOL WD SCT SCT SCT DRY
Aug 24 ISOL SCT DRY ISOL WD FWD FWD FWD FWD
Aug 25 SCT SCT ISOL ISOL WD SCT SCT WD WD
Aug 26 FWD SCT ISOL ISOL WD SCT SCT FWD WD
Aug 27 WD SCT ISOL SCT WD ISOL FWD FWD FWD
Aug 28 WD FWD ISOL ISOL WD SCT FWD WD SCT
Aug 29 FWD SCT ISOL SCT WD SCT SCT FWD FWD
Aug 30 FWD FWD FWD SCT WD SCT FWD FWD FWD
Aug 31 FWD WD FWD FWD WD WD WD WD WD
Sep 01 FWD FWD SCT SCT WD SCT WD WD WD
Sep 02 SCT FWD ISOL SCT WD SCT SCT FWD WD
Sep 03 FWD FWD ISOL SCT WD SCT SCT WD WD
Sep 04 SCT ISOL ISOL ISOL WD ISOL FWD FWD WD
Sep 05 FWD FWD ISOL ISOL FWD DRY FWD ISOL FWD
Sep 06 DRY DRY DRY DRY WD DRY ISOL ISOL WD
Sep 07 ISOL ISOL ISOL ISOL WD ISOL FWD ISOL DRY
Sep 08 ISOL DRY DRY ISOL WD ISOL ISOL ISOL FWD
Sep 09 ISOL ISOL DRY ISOL SCT ISOL ISOL ISOL WD
Sep 10 SCT SCT ISOL ISOL ISOL ISOL ISOL ISOL DRY
Sep 11 SCT FWD SCT ISOL SCT SCT SCT ISOL SCT
Sep 12 SCT FWD SCT ISOL FWD SCT SCT ISOL WD
Sep 13 FWD WD SCT ISOL FWD SCT SCT SCT WD
Sep 14 FWD WD SCT ISOL WD WD SCT SCT FWD
Sep 15 WD WD SCT ISOL WD WD WD WD WD
Sep 16 FWD WD SCT ISOL WD WD FWD FWD WD
Sep 17 ISOL SCT SCT ISOL WD FWD SCT FWD FWD
Sep 18 SCT SCT ISOL ISOL WD SCT SCT ISOL WD
Sep 19 ISOL ISOL ISOL ISOL WD SCT SCT FWD SCT
Sep 20 ISOL ISOL SCT ISOL WD SCT ISOL ISOL SCT
Sep 21 WD WD WD ISOL WD FWD FWD WD FWD
Sep 22 WD WD FWD ISOL WD WD WD WD FWD
Sep 23 FWD WD ISOL ISOL WD FWD SCT SCT WD
Sep 24 WD WD SCT ISOL WD FWD FWD WD SCT
Sep 25 FWD WD SCT ISOL WD WD FWD FWD SCT
Sep 26 FWD WD SCT ISOL WD FWD FWD FWD WD
Sep 27 FWD FWD SCT ISOL FWD SCT SCT FWD SCT
Sep 28 SCT FWD ISOL ISOL SCT ISOL ISOL ISOL WD
Sep 29 SCT ISOL SCT SCT SCT SCT SCT FWD WD
Sep 30 FWD ISOL ISOL SCT ISOL SCT SCT SCT SCT
10
Table-4b: Percentage frequency of various categories of daily spatial rainfall distribution
over the subdivisions of the SP region during SWM 2016
Category
Frequency (%)
CAP TEL RYS TN&PDC CK NIK SIK KER LAK
WD 6 13 3 87 14 14 57 46
FWD 28 24 13 4 8 28 40 24 30
SCT 26 25 18 17 3 40 38 8 16
ISOL 37 34 52 78 2 17 8 11
DRY 3 3 14 1 2 9
WD: Widespread; FWD: Fairly Widespread; SCT: Scattered; ISOL: Isolated; DRY: No rain (Note:Kindly refer Appendix(i) for explanations on categorization of spatial rainfall distribution)
Fig.3a Daily cumulative rainfall over southern peninsular region during SWM season,
2016
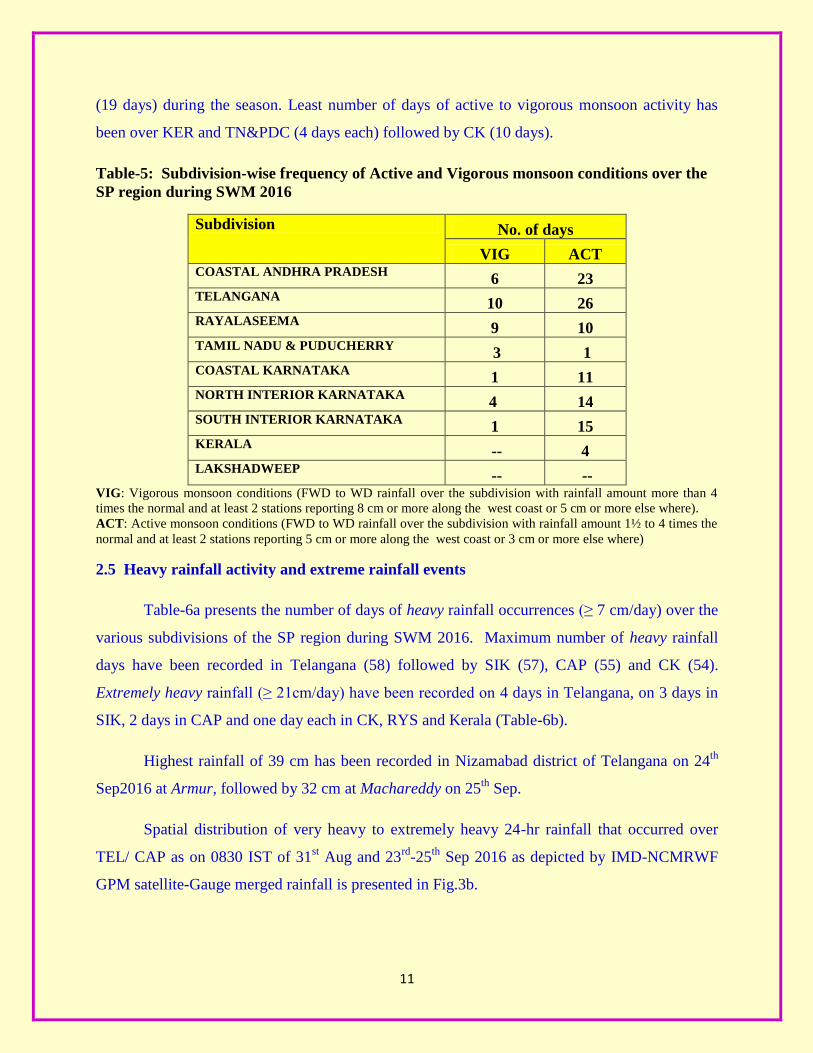
Table-5 presents the seasonal frequency of active and vigorous monsoon conditions over
the various subdivisions of the SP region during SWM 2016. Telangana experienced maximum
days of active to vigorous monsoon conditions (36 days) followed by CAP (29 days) and RYS
11
(19 days) during the season. Least number of days of active to vigorous monsoon activity has
been over KER and TN&PDC (4 days each) followed by CK (10 days).
Table-5: Subdivision-wise frequency of Active and Vigorous monsoon conditions over the
SP region during SWM 2016
Subdivision No. of days
VIG ACT COASTAL ANDHRA PRADESH
6 23 TELANGANA
10 26 RAYALASEEMA
9 10 TAMIL NADU & PUDUCHERRY
3 1 COASTAL KARNATAKA
1 11 NORTH INTERIOR KARNATAKA
4 14 SOUTH INTERIOR KARNATAKA
1 15 KERALA
-- 4 LAKSHADWEEP
-- -- VIG: Vigorous monsoon conditions (FWD to WD rainfall over the subdivision with rainfall amount more than 4
times the normal and at least 2 stations reporting 8 cm or more along the west coast or 5 cm or more else where).
ACT: Active monsoon conditions (FWD to WD rainfall over the subdivision with rainfall amount 1½ to 4 times the
normal and at least 2 stations reporting 5 cm or more along the west coast or 3 cm or more else where)
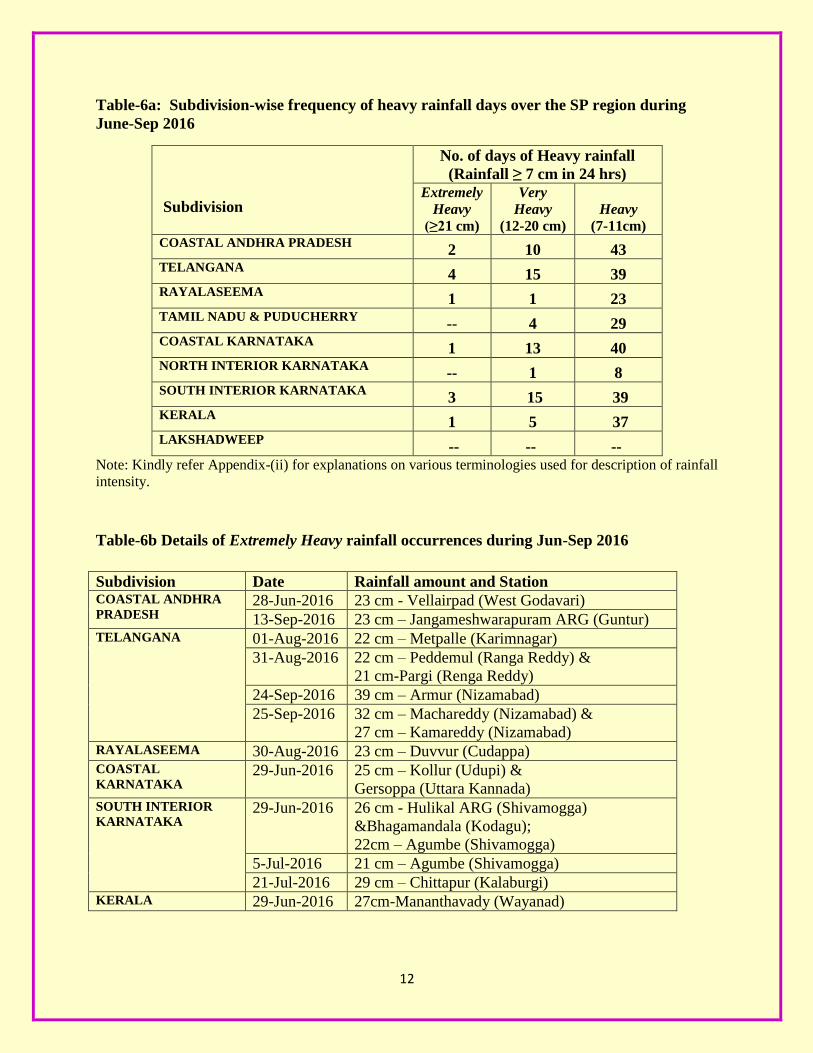
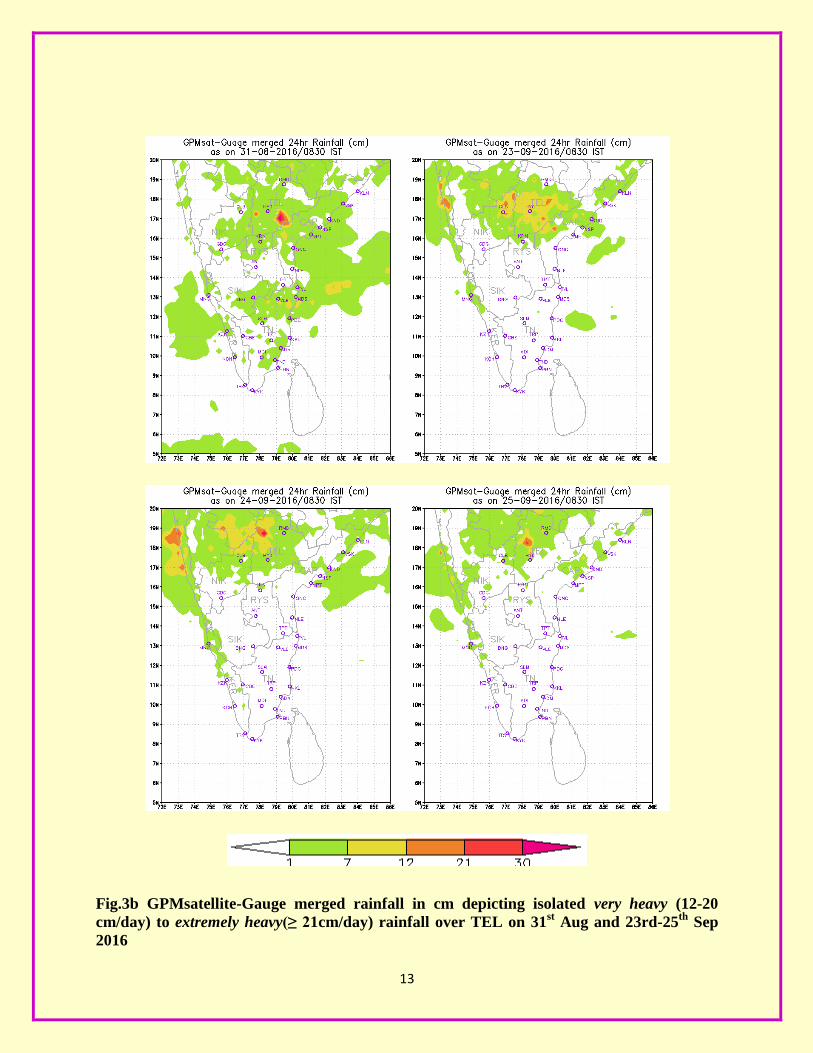
2.5 Heavy rainfall activity and extreme rainfall events
Table-6a presents the number of days of heavy rainfall occurrences (≥ 7 cm/day) over the
various subdivisions of the SP region during SWM 2016. Maximum number of heavy rainfall
days have been recorded in Telangana (58) followed by SIK (57), CAP (55) and CK (54).
Extremely heavy rainfall (≥ 21cm/day) have been recorded on 4 days in Telangana, on 3 days in
SIK, 2 days in CAP and one day each in CK, RYS and Kerala (Table-6b).
Highest rainfall of 39 cm has been recorded in Nizamabad district of Telangana on 24th
Sep2016 at Armur, followed by 32 cm at Machareddy on 25th
Sep.
Spatial distribution of very heavy to extremely heavy 24-hr rainfall that occurred over
TEL/ CAP as on 0830 IST of 31st Aug and 23
rd-25
th Sep 2016 as depicted by IMD-NCMRWF
GPM satellite-Gauge merged rainfall is presented in Fig.3b.
12
Table-6a: Subdivision-wise frequency of heavy rainfall days over the SP region during
June-Sep 2016
Subdivision
No. of days of Heavy rainfall
(Rainfall ≥ 7 cm in 24 hrs)
Extremely
Heavy
(≥21 cm)
Very
Heavy
(12-20 cm)
Heavy
(7-11cm) COASTAL ANDHRA PRADESH
2 10 43 TELANGANA
4 15 39 RAYALASEEMA
1 1 23 TAMIL NADU & PUDUCHERRY
-- 4 29 COASTAL KARNATAKA
1 13 40 NORTH INTERIOR KARNATAKA
-- 1 8 SOUTH INTERIOR KARNATAKA
3 15 39 KERALA
1 5 37 LAKSHADWEEP
-- -- -- Note: Kindly refer Appendix-(ii) for explanations on various terminologies used for description of rainfall
intensity.
Table-6b Details of Extremely Heavy rainfall occurrences during Jun-Sep 2016
Subdivision Date Rainfall amount and Station COASTAL ANDHRA
PRADESH 28-Jun-2016 23 cm - Vellairpad (West Godavari)
13-Sep-2016 23 cm – Jangameshwarapuram ARG (Guntur) TELANGANA 01-Aug-2016 22 cm – Metpalle (Karimnagar)
31-Aug-2016 22 cm – Peddemul (Ranga Reddy) &
21 cm-Pargi (Renga Reddy)
24-Sep-2016 39 cm – Armur (Nizamabad)
25-Sep-2016 32 cm – Machareddy (Nizamabad) &
27 cm – Kamareddy (Nizamabad) RAYALASEEMA 30-Aug-2016 23 cm – Duvvur (Cudappa) COASTAL
KARNATAKA 29-Jun-2016 25 cm – Kollur (Udupi) &
Gersoppa (Uttara Kannada) SOUTH INTERIOR
KARNATAKA 29-Jun-2016 26 cm - Hulikal ARG (Shivamogga)
&Bhagamandala (Kodagu);
22cm – Agumbe (Shivamogga)
5-Jul-2016 21 cm – Agumbe (Shivamogga)
21-Jul-2016 29 cm – Chittapur (Kalaburgi) KERALA 29-Jun-2016 27cm-Mananthavady (Wayanad)
13
Fig.3b GPMsatellite-Gauge merged rainfall in cm depicting isolated very heavy (12-20
cm/day) to extremely heavy(≥ 21cm/day) rainfall over TEL on 31st Aug and 23rd-25
th Sep
2016
14
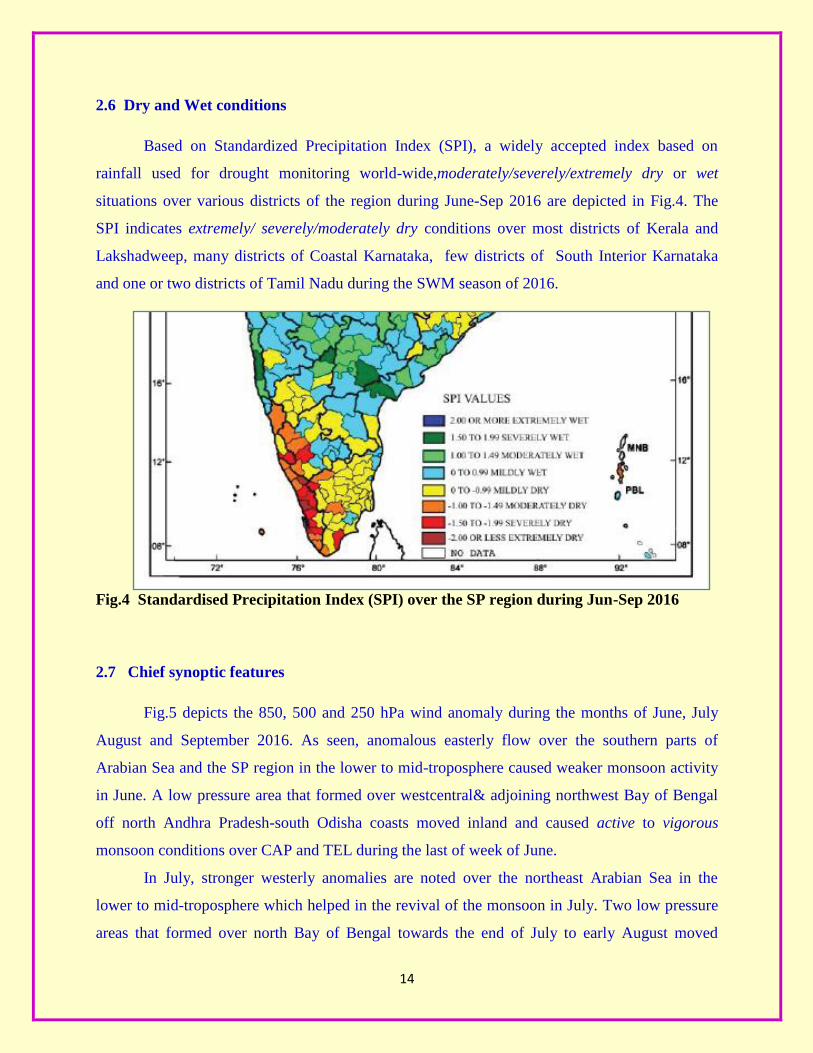
2.6 Dry and Wet conditions
Based on Standardized Precipitation Index (SPI), a widely accepted index based on
rainfall used for drought monitoring world-wide,moderately/severely/extremely dry or wet
situations over various districts of the region during June-Sep 2016 are depicted in Fig.4. The
SPI indicates extremely/ severely/moderately dry conditions over most districts of Kerala and
Lakshadweep, many districts of Coastal Karnataka, few districts of South Interior Karnataka
and one or two districts of Tamil Nadu during the SWM season of 2016.
Fig.4 Standardised Precipitation Index (SPI) over the SP region during Jun-Sep 2016
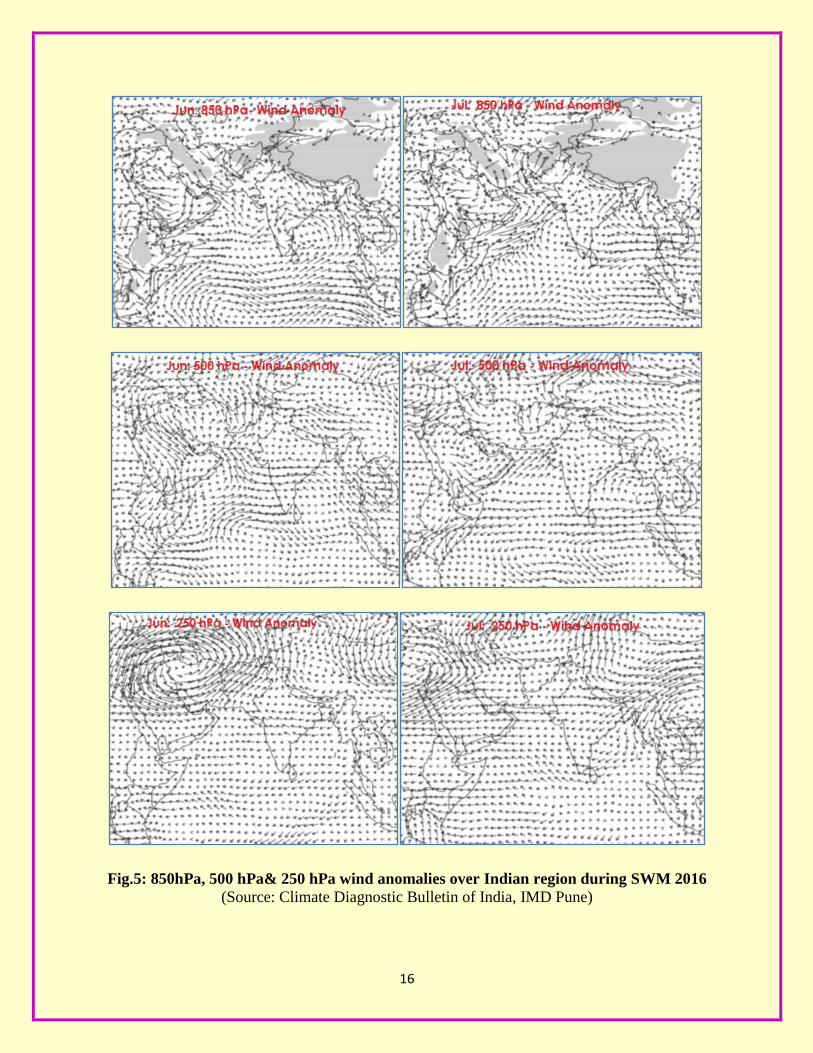
2.7 Chief synoptic features
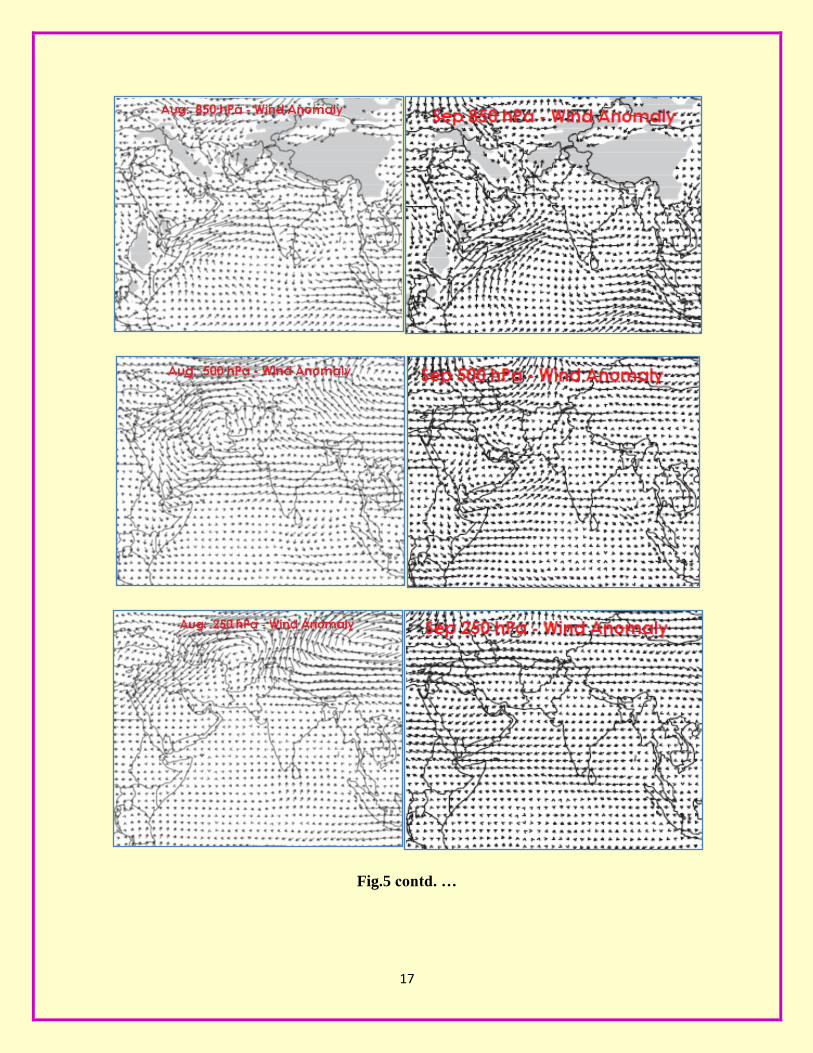
Fig.5 depicts the 850, 500 and 250 hPa wind anomaly during the months of June, July
August and September 2016. As seen, anomalous easterly flow over the southern parts of
Arabian Sea and the SP region in the lower to mid-troposphere caused weaker monsoon activity
in June. A low pressure area that formed over westcentral& adjoining northwest Bay of Bengal
off north Andhra Pradesh-south Odisha coasts moved inland and caused active to vigorous
monsoon conditions over CAP and TEL during the last of week of June.
In July, stronger westerly anomalies are noted over the northeast Arabian Sea in the
lower to mid-troposphere which helped in the revival of the monsoon in July. Two low pressure
areas that formed over north Bay of Bengal towards the end of July to early August moved
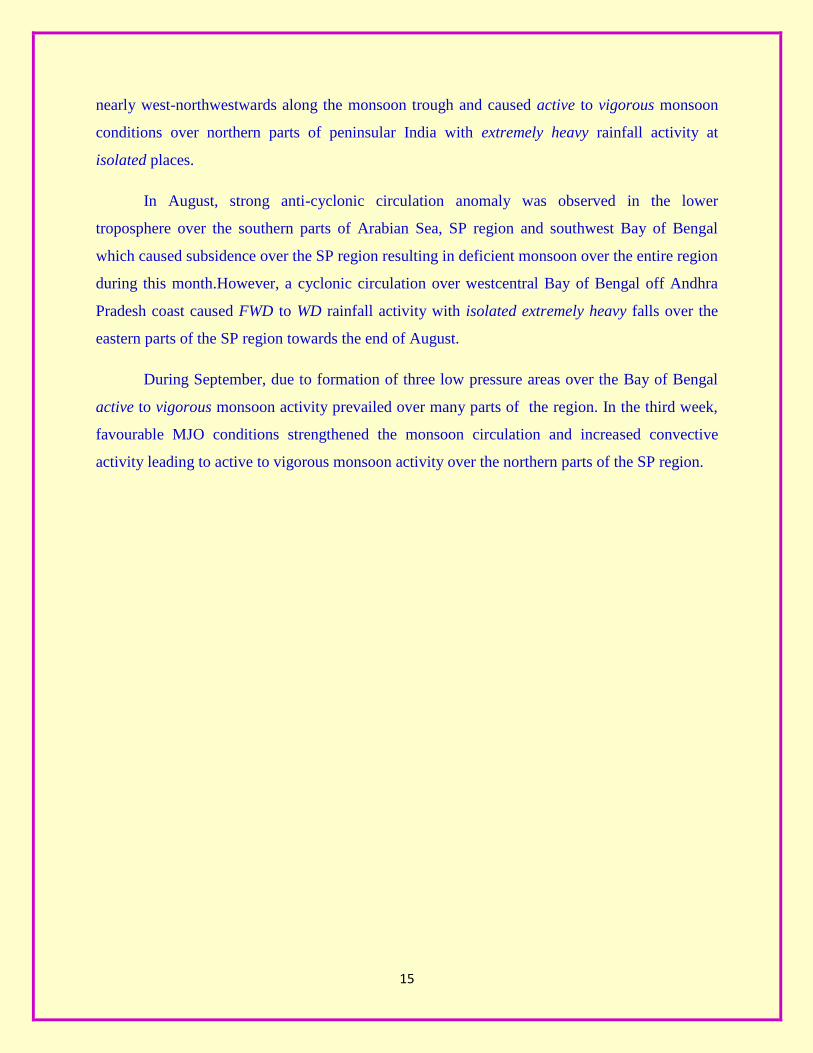
15
nearly west-northwestwards along the monsoon trough and caused active to vigorous monsoon
conditions over northern parts of peninsular India with extremely heavy rainfall activity at
isolated places.
In August, strong anti-cyclonic circulation anomaly was observed in the lower
troposphere over the southern parts of Arabian Sea, SP region and southwest Bay of Bengal
which caused subsidence over the SP region resulting in deficient monsoon over the entire region
during this month.However, a cyclonic circulation over westcentral Bay of Bengal off Andhra
Pradesh coast caused FWD to WD rainfall activity with isolated extremely heavy falls over the
eastern parts of the SP region towards the end of August.
During September, due to formation of three low pressure areas over the Bay of Bengal
active to vigorous monsoon activity prevailed over many parts of the region. In the third week,
favourable MJO conditions strengthened the monsoon circulation and increased convective
activity leading to active to vigorous monsoon activity over the northern parts of the SP region.
16
Fig.5: 850hPa, 500 hPa& 250 hPa wind anomalies over Indian region during SWM 2016
(Source: Climate Diagnostic Bulletin of India, IMD Pune)
17
Fig.5 contd. …
18
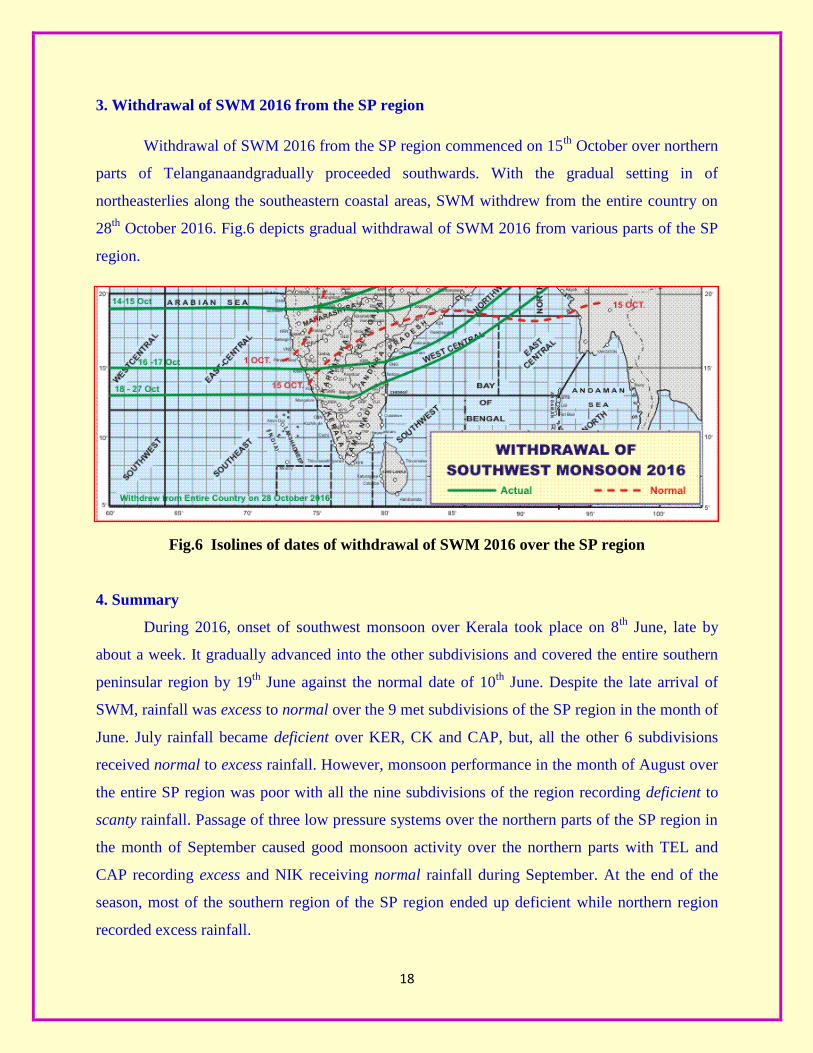
3. Withdrawal of SWM 2016 from the SP region
Withdrawal of SWM 2016 from the SP region commenced on 15th
October over northern
parts of Telanganaandgradually proceeded southwards. With the gradual setting in of
northeasterlies along the southeastern coastal areas, SWM withdrew from the entire country on
28th
October 2016. Fig.6 depicts gradual withdrawal of SWM 2016 from various parts of the SP
region.
4. Summary
Fig.6 Isolines of dates of withdrawal of SWM 2016 over the SP region
4. Summary
During 2016, onset of southwest monsoon over Kerala took place on 8th
June, late by
about a week. It gradually advanced into the other subdivisions and covered the entire southern
peninsular region by 19th
June against the normal date of 10th
June. Despite the late arrival of
SWM, rainfall was excess to normal over the 9 met subdivisions of the SP region in the month of
June. July rainfall became deficient over KER, CK and CAP, but, all the other 6 subdivisions
received normal to excess rainfall. However, monsoon performance in the month of August over
the entire SP region was poor with all the nine subdivisions of the region recording deficient to
scanty rainfall. Passage of three low pressure systems over the northern parts of the SP region in
the month of September caused good monsoon activity over the northern parts with TEL and
CAP recording excess and NIK receiving normal rainfall during September. At the end of the
season, most of the southern region of the SP region ended up deficient while northern region
recorded excess rainfall.
19
Acknowledgements
This report is a compilation of real-time observational data and analytical products
generated by various IMD offices including IMD New Delhi, Pune, Hyderabad, Bangalore and
Thirvananthapuram as well as Raingauge networks of various state governments. Contribution
from all officials involved in generation of data and analytical products used for preparation of
this report is duly acknowledged.
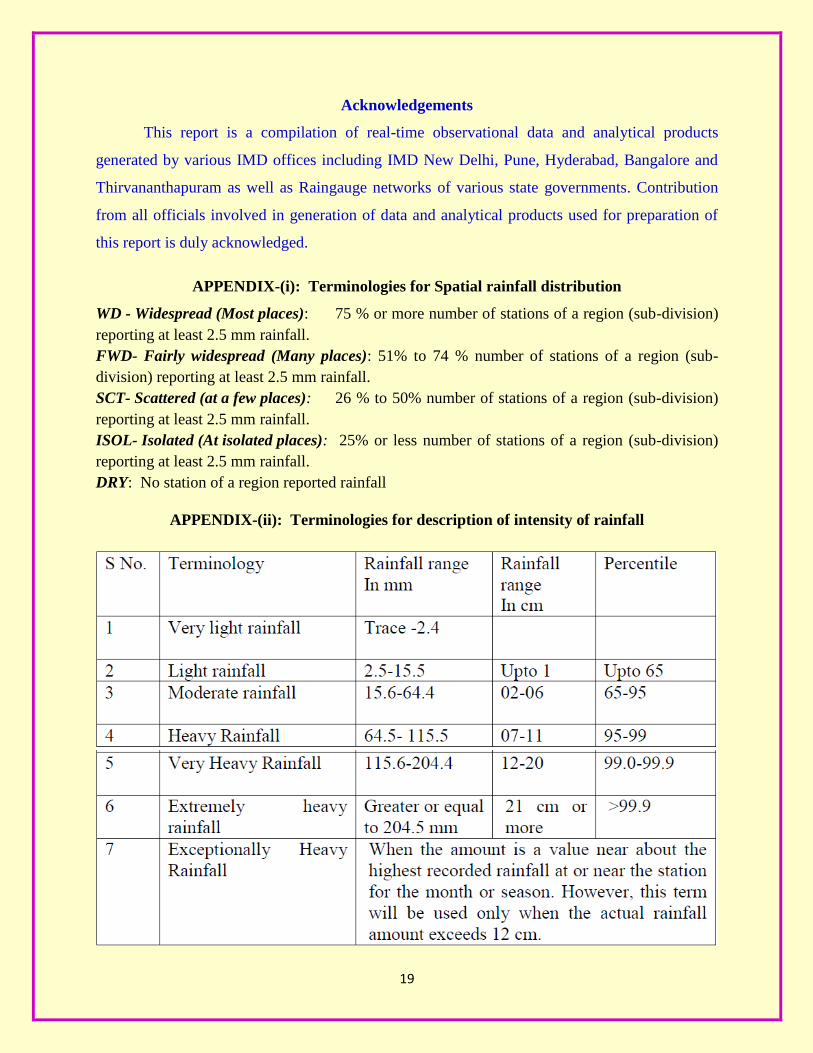
APPENDIX-(i): Terminologies for Spatial rainfall distribution
WD - Widespread (Most places): 75 % or more number of stations of a region (sub-division)
reporting at least 2.5 mm rainfall.
FWD- Fairly widespread (Many places): 51% to 74 % number of stations of a region (sub-
division) reporting at least 2.5 mm rainfall.
SCT- Scattered (at a few places): 26 % to 50% number of stations of a region (sub-division)
reporting at least 2.5 mm rainfall.
ISOL- Isolated (At isolated places): 25% or less number of stations of a region (sub-division)
reporting at least 2.5 mm rainfall.
DRY: No station of a region reported rainfall
APPENDIX-(ii): Terminologies for description of intensity of rainfall