Embed Size (px)
Citation preview
Regional RepoRton Arms Exportsin 2011


REGIONAL REPORT ON ARMS EXPORTS IN 2011

2
REGIONAL REPORT ON ARMS EXPORTS IN 2011
The South Eastern and Eastern Europe Clearinghouse for the Control of Small Arms and Light Weapons (SEESAC) has a mandate from the United Nations Development Programme (UNDP) and the Regional Cooperation Council (RCC) to support all national and international stakeholders by strengthening national and regional capacity to control and reduce the proliferation and misuse of small arms and light weapons, and thus contribute to enhanced stability, security and development in South Eastern and Eastern Europe.
For further information contact:SEESAC CoordinatorHadži Melentijeva 3011000 BelgradeSerbiaTel: (+381) (11) 344 6353; 383 6972; 383 6974Fax: (+381) (11) 344 6356www.seesac.org
REGIONAL REPORT ON ARMS EXPORTS IN 2011, BELGRADE, 2013
ACKNOWLEDGEMENTSWe would like to express our gratitude to the national authorities responsible for arms exports control in Albania, Bosnia and Herzegovina, Croatia the former Yugoslav Republic of Macedonia and Serbia who have made this report possible. The publication of the Regional Report on Arms Exports in 2011 was generously supported by the Ministry of Foreign Affairs of the Kingdom of Norway through the Phase II of SEESAC’s Support for an Arms Control Programme in the Western Balkans project.
© SEESAC 2013 - All rights reservedISBN: 978-86-7728-186-1
The views expressed in this report do not necessarily represent those of the Regional Cooperation Council or the United Nations Development Programme. The designations employed and the presentation of material in this publication do not imply the expression of the Regional Cooperation Council or the United Nations Development Programme concerning 1) the legal status of any country, territory or area, or of its authorities or armed groups; or 2) the delineation of its frontiers or boundaries.

3
REGIONAL REPORT ON ARMS EXPORTS IN 2011
INTRODUCTION
The possibility of producing a regional annual report on arms exports for South East Europe was discussed at the EU outreach events in Serbia (December 2007) and Slovenia (May 2008). Under the auspices of SEESAC, an agreement was reached to produce a regional report at a conference in Montenegro (June 2009).
All states in the region had already produced national reports that contain detailed information on their arms exports and with the support of SEESAC, twenty eight (28) reports were translated into English and printed. These national reports should remain the primary source of information on each country’s arms exports.
The production of a regional annual report on arms exports is intended to help to consolidate the gains in transparency that have already been made in the region, while also demonstrating an ability and willingness to uphold the commitments associated with the Council Common Position 2008/944/CFSP defining common rules governing control of exports of military technology and equipment.
The report is a practical example of successful co-operation within the framework of the Regional Co-operation Council (RCC). Moreover, the report is evidence of the existing administrative capacity in the region and the desire to further comply with EU policies in the field of export controls.
The present report contains detailed information on arms exports of Albania, Bosnia and Herzegovina, Croatia, the former Yugoslav Republic of Macedonia and Serbia during 2011. A single, unified method for data collection and reporting was used by all five participating countries and it includes the number and value of all arms export licences issued in 2011, as well as the value of all exports which were realized based on those licences, regardless of whether the utilization took place in 2011 or 2012.
Furthermore the report contains data on transfers to United Nations-mandated or other international missions, key national legislation governing arms transfers, details of regional activities in which at least two states in the region participated and contact information for different ministries tasked with controlling transfers of conventional weapons.
The production of the regional report was made possible through the generous support of the Ministry of Foreign Affairs of the Kingdom of Norway to SEESAC implemented project Support for an Arms Control Programme in the Western Balkans.


5
REGIONAL REPORT ON ARMS EXPORTS IN 2011
CONTENTS
ANNEXES ............................................................................................................................................7
I. BRIEF DESCRIPTION OF EU COMMON MILITARY LIST CATEGORIES .................................................9
II. TABLES SETTING OUT EXPORTS PER DESTINATION, PER REGION AND WORLD WIDE ..................10EXPORTS WORLDWIDE ....................................................................................................................10ARMS EXPORTS PER DESTINATION .................................................................................................12ARMS EXPORTS PER REGION ...........................................................................................................44Central America and the Caribbean .................................................................................................44(Antigua and Barbuda, Bahamas, Barbados, Belize, Costa Rica, Cuba, Dominica, Dominican Republic, El Salvador, Grenada, Guatemala, Haiti, Honduras, Jamaica, Mexico, Nicaragua, Panama, Saint Kitts and Nevis, Saint Lucia, Saint Vincent and Grenadines, Trinidad and Tobago)
North Africa ......................................................................................................................................45(Algeria, Libya, Morocco, Tunisia)
Central Asia ......................................................................................................................................46(Kazakhstan, Kyrgyzstan, Tajikistan, Turkmenistan, Uzbekistan)
European Union ................................................................................................................................48(Austria, Belgium, Bulgaria, Cyprus, Czech Republic, Denmark; Denmark (Greenland), Denmark (Faeroes), Estonia, Finland, France, France (French Polynesia), France (Mayotte), France (New Caledonia), Germany, Greece, Hungary, Ireland, Italy, Latvia, Lithuania, Luxembourg, Malta, Netherlands, Netherlands (Aruba), Netherlands (Netherlands Antilles), Poland, Portugal, Romania, Slovakia, Slovenia, Spain, Sweden, United Kingdom, United Kingdom (Bermuda), United Kingdom (Cayman Islands), United Kingdom (Channel Islands), United Kingdom (Gibraltar), United Kingdom (St Helena), United Kingdom (Turcs and Caicos Islands)
Middle East .......................................................................................................................................50(Bahrain, Egypt, Iran, Iraq, Israel, Jordan, Kuwait, Lebanon, Oman, Palestinian controlled territories, Qatar, Saudi Arabia, Syria, United Arab Emirates, Yemen
North America ..................................................................................................................................52(Canada, United States)
North East Asia .................................................................................................................................54(China (Mainland), China (Hong Kong), China (Macao), Korea (Democratic People’s Republic of), Korea (Republic of), Japan, Mongolia, Taiwan)
Oceania.............................................................................................................................................55(Australia, Fiji, Kiribati, Marshall Islands, Micronesia (Fed. States of), Nauru, New Zealand, Palau, Papua New Guinea, Samoa, Solomon Islands, Tonga, Tuvalu, Vanuatu)
Other European Countries ...............................................................................................................56(Albania, Andorra, Armenia, Azerbaijan, Belarus, Bosnia and Herzegovina, Croatia, Georgia, Holy See, Iceland, Liechtenstein, the former Yugoslav Republic of Macedonia, Republic of Moldova, Monaco, Montenegro, Norway, Russian Federation, Serbia, St Marino, Switzerland, Turkey, Ukraine)
South America .................................................................................................................................58 (Argentina, Bolivia, Brazil, Chile, Colombia, Ecuador, Guyana, Paraguay, Peru, Suriname, Uruguay, Venezuela)

6
REGIONAL REPORT ON ARMS EXPORTS IN 2011
South Asia ........................................................................................................................................60(Afghanistan, Bangladesh, Bhutan, India, Maldives, Nepal, Pakistan, Sri Lanka)
South East Asia ................................................................................................................................62(Brunei, Cambodia, Indonesia, Laos, Malaysia, Myanmar, Philippines, Singapore, Thailand, Timor Leste, Vietnam)
Sub-Saharan Africa ..........................................................................................................................64(Angola, Benin, Botswana, Burkina Faso, Burundi, Cameroon, Cape Verde, Central African Republic, Chad, Comoros, Congo (Republic of), Congo (Democratic Republic of), Djibouti, Equatorial Guinea, Eritrea, Ethiopia, Gabon, Gambia, Ghana, Guinea, Guinea-Bissau, Ivory Coast, Kenya, Lesotho, Liberia, Madagascar, Malawi, Mali, Mauritania, Mauritius, Mozambique, Namibia, Niger, Nigeria, Rwanda, Sao Tome and Principe, Senegal, Seychelles, Sierra Leone, Somalia, South Africa, Sudan, Swaziland, Tanzania, Togo, Uganda, Zambia, Zimbabwe)
III. TABLES SHOWING EXPORTS TO UNITED NATIONS-MANDATED OR OTHER INTERNATIONAL MISSIONS IN 2011 ...............................................................................................66
IV. INFORMATION ON NATIONAL LEGISLATION RELEVANT TO ARMS EXPORT CONTROL ..................67
V. TABLE OF REGIONAL ACTIVITIES IN WHICH STATES PARTICIPATED DURING 2011 .......................73
VI. TABLE SHOWING INTERNET ADDRESSES AND CONTACT DETAILS OF NATIONAL AUTHORITIES RESPONSIBLE FOR ARMS EXPORT CONTROL ..........................................................74

7
REGIONAL REPORT ON ARMS EXPORTS IN 2011
ANNEXES
The Information on Conventional Arms Exports by Albania, Bosnia and Herzegovina, Croatia, Serbia and the former Yugoslav Republic of Macedonia in the period from 1 January to 31 December 2011. The attached tables contain the following information:
I. BRIEF DESCRIPTION OF EU COMMON MILITARY LIST CATEGORIESII. TABLES SETTING OUT EXPORTS PER DESTINATION, PER REGION AND WORLDWIDE Figures are broken down by State, and where possible by EU Common Military List category (1),
where (a) = number of licenses issued, (b) = value of licenses issued in Euros and (c) = the value of arms exports in Euros (2) (3) (4)
III. TABLE SHOWING EXPORTS TO UNITED NATIONS-MANDATED OR OTHER INTERNATIONAL MISSIONS IN 2011
IV. INFORMATION ON NATIONAL LEGISLATION RELEVANT TO ARMS EXPORT CONTROLV. TABLE OF REGIONAL ACTIVITIES IN WHICH STATES PARTICIPATED DURING 2011VI. TABLE SHOWING INTERNET ADDRESSES AND CONTACT DETAILS OF NATIONAL AUTHORITIES
RESPONSIBLE FOR ARMS EXPORT CONTROL
1 See page 9 below for brief descriptions of Military List categories..2 In many cases, transfers of controlled goods may pass through two or more states covered by this report
before being delivered to their final destination. For this reason, there is likely to be a considerable amout of double counting in this report, with the same transfer being reported multiple times by different states. The report should not, therefore, be used to generate an estimate of the combined value of the region’s arms exports.
3 To make the table more readable, nil values and/or the mention ‘not available’ are omitted, and empty rows deleted.
4 Concerning the Republic of Serbia: The Annual Report of the Republic of Serbia includes, inter alia, data on arms exports broken down by export
destination – i.e. the country of the buyer, together with the data on the end-user country - while agreed method in the Regional Report is to have data broken down only by end-user country. For this reason, data from the Annual Report of the Republic of Serbia may be different from the data published in the Regional Annual Report.
The Republic of Serbia’s national regulations allow for situations where a number of different products - which may cover a range of different control categories - are attached to one license. Such transfers have been marked with a single asterisk (*).


9
REGIONAL REPORT ON ARMS EXPORTS IN 2011
I. BRIEF DESCRIPTIONS OF EU COMMON MILITARY LIST CATEGORIES
(CF. OJ C 90 OF 11 MARCH 2013 FOR THE FULL EU COMMON MILITARY LIST)
ML1 Smooth-bore weapons with a calibre of less than 20 mm, other arms and automatic weapons with a calibre of 12,7 mm (calibre 0,50 inches) or less and accessories, and specially designed components therefor
ML2 Smooth-bore weapons with a calibre of 20 mm or more, other weapons or armament with a calibre greater than 12,7 mm (calibre 0,50 inches), projectors and accessories, and specially designed components therefor
ML3 Ammunition and fuse setting devices, and specially designed components thereforML4 Bombs, torpedoes, rockets, missiles, other explosive devices and charges and related equipment
and accessories, and specially designed components thereforML5 Fire control, and related alerting and warning equipment, and related systems, test and alignment
and countermeasure equipment, specially designed for military use, and specially designed components and accessories therefor
ML6 Ground vehicles and components.ML7 Chemical or biological toxic agents, ‘riot control agents’, radioactive materials, related equipment,
components and materialsML8 ‘Energetic materials’, and related substancesML9 Vessels of war, (surface or underwater) special naval equipment, accessories, components and
other surface vesselsML10 ‘Aircraft’, ‘lighter than air vehicles’, Unamnned Airborne Vehicles (“UAVs”), aero-engines and
‘aircraft’ equipment, related equipment and components, specially designed or modified for military use.
ML11 Electronic equipment , “spacecraft” and components, not specified elsewhere on the EU Common Military List, and specially designed components therefor
ML12 High velocity kinetic energy weapon systems and related equipment, and specially designed components therefor.
ML13 Armoured or protective equipment, constructions and componentsML14 Specialised equipment for military training or for simulating military scenarios, simulators
specially designed for training in the use of any firearm or weapon specified by ML1 or ML2, and specially designed components and accessories therefor
ML15 Imaging or countermeasure equipment, specially designed for military use, and specially designed components and accessories therefor
ML16 Forgings, castings and other unfinished products are specially designed for any products specified by ML1 to ML4, ML6, ML9, ML10, ML12 or ML19
ML17 Miscellaneous equipment, materials and ‘libraries’, and specially designed components thereforML18 Production equipment and components.ML19 Directed energy weapon systems (DEW), related or countermeasure equipment and test models,
and specially designed components thereforML20 Cryogenic and ‘superconductive’ equipment, and specially designed components and accessories thereforML21 ‘Software’.ML22 ‘Technology’.
The latest version of the EU Military List is available at http://eur-lex.europa.eu/LexUriServ/LexUriServ.do?uri=OJ:C:2013:090:0001:0037:EN:PDF

10
REGIONAL REPORT ON ARMS EXPORTS IN 2011
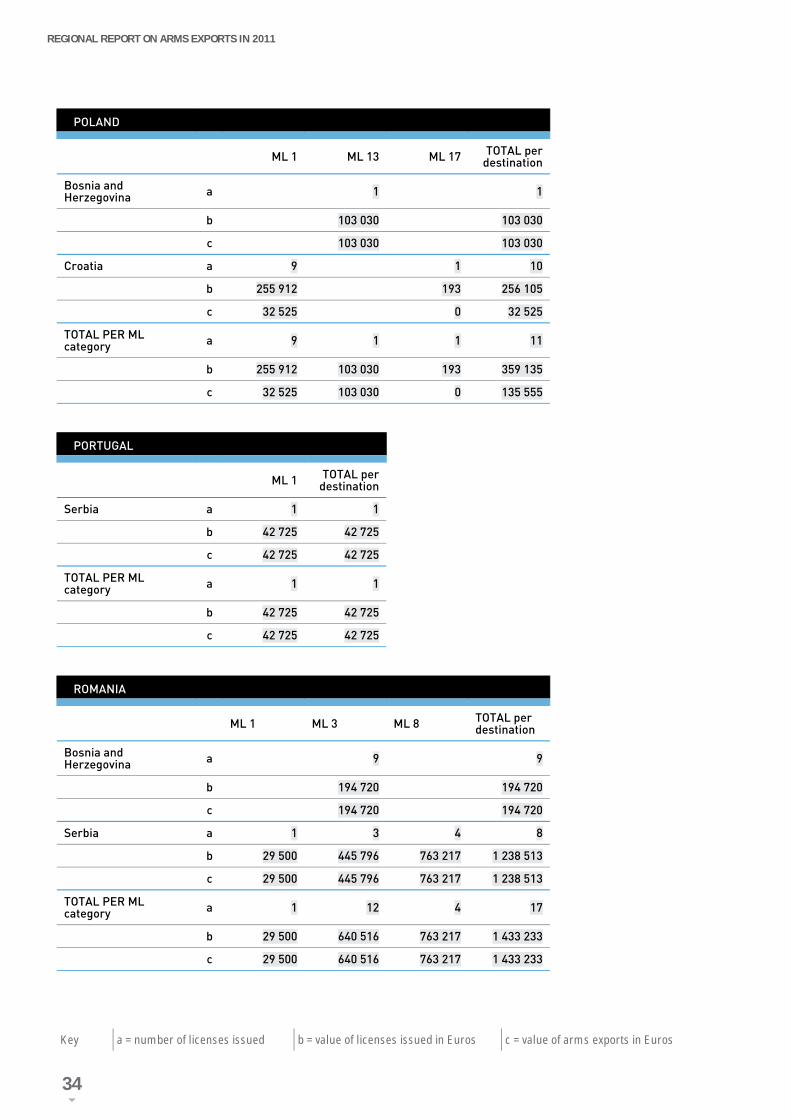
Key a = number of licenses issued b = value of licenses issued in Euros c = value of arms exports in Euros
II. TABLES SETTING OUT EXPORTS PER DESTINATION, PER REGION AND WORLDWIDE
WORLDWIDE
ML 1 ML 2 ML 3 ML 4 ML 5 ML 6Albania a 3 0 8 1 0 0
b 966 405 0 9 702 672 932 967 0 0c 633 308 0 2 602 205 0 0 0
Bosnia and Herzegovina a 6 3 71 1 4 0b 3 356 636 4 723 699 48 269 799 76 240 160 923 0c 3 305 408 4 629 538 32 130 325 76 240 160 923 0
Croatia a 81 1 3 0 0 2b 145 241 216 7 576 1 390 0 0 782 868c 50 543 007 7 576 333 0 0 782 868
The former Yugoslav Republic of Macedonia a 1 0 1 0 0 0
b 2 095 0 10 200 0 0 0c 2 095 0 10 200 0 0 0
Serbia* a 98 17 121 14 0 4b 21 820 199 11 095 291 173 076 643 11 883 059 1 814 758 1 475 982c 10 624 689 5 999 550 63 911 577 10 769 571 62 597 1 453 664
TOTAL PER ML category a 189 21 204 16 4 6b 171 386 551 15 826 565 231 060 704 12 892 266 1 975 681 2 258 850c 65 081 823 10 636 664 98 654 639 10 845 811 223 520 2 236 532
WORLDWIDE
ML 7 ML 8 ML 10 ML 11 ML 13 ML 14Albania a 0 0 0 0 0 0
b 0 0 0 0 0 0c 0 0 0 0 0 0
Bosnia and Herzegovina a 0 0 1 3 1 0b 0 0 37 265 380 254 103 030 0c 0 0 20 165 380 254 103 030 0
Croatia a 0 0 0 4 35 0b 0 0 0 332 182 6 374 625 0c 0 0 0 71 591 4 856 442 0
The former Yugoslav Republic of Macedonia a 1 0 0 0 0 0
b 2 575 0 0 0 0 0c 2 575 0 0 0 0 0
Serbia* a 1 39 2 0 12 0b 25 352 20 075 473 7 608 238 38 640 1 720 287 11 500c 25 352 12 820 676 7 608 238 38 640 1 720 287 0
TOTAL PER ML category a 2 39 3 7 48 0b 27 927 20 075 473 7 645 503 751 076 8 197 942 11 500c 27 927 12 820 676 7 628 403 490 485 6 679 759 0
WORLDWIDE
ML 15 ML 16 ML 17 ML 18 ML 21 ML 22 TOTAL per destination
Albania a 0 0 0 0 0 0 12b 0 0 0 0 0 0 11 602 044c 0 0 0 0 0 0 3 235 513
Bosnia and Herzegovina a 0 2 0 0 0 0 92b 0 304 770 0 0 0 0 57 412 616c 0 304 770 0 0 0 0 41 110 653
Croatia a 0 0 4 1 1 0 132b 0 0 4 084 1 496 10 0 152 745 445c 0 0 2 526 1 496 10 0 56 265 848
The former Yugoslav Republic of Macedonia a 0 0 0 0 0 0 3
b 0 0 0 0 0 0 14 870c 0 0 0 0 0 0 14 870
Serbia* a 0 0 2 4 0 10 324b 496 000 0 14 738 216 5 111 450 0 14 439 141 285 430 229c 0 0 512 550 5 111 450 0 4 200 116 124 858 956
TOTAL PER ML category a 0 2 6 5 1 10 563b 496 000 304 770 14 742 300 5 112 946 10 14 439 141 507 205 204c 0 304 770 515 076 5 112 946 10 4 200 116 225 459 156
EXPORTS WORLDWIDE
Key a = number of licenses issued b = value of licenses issued in Euros c = value of arms exports in Euros

11
REGIONAL REPORT ON ARMS EXPORTS IN 2011
4%
EXPORTS WORLDWIDE
225.485.840 € 44%OF VALUEOF LICENSES ISSUED
WAS USED507.205.204 € VALUE OF LICENSES ISSUED IN EUROS
EXPORTS GROWTHCOMPARED TO 201068,12 % EXPORTS GROWTHCOMPARED TO 2009
563LICENSESISSUED WORLDWIDE
H1H10
1,44%
ALBANIA FYR OF MACEDONIA CROATIA SERBIABOSNIA AND HERZEGOVINA
ML221,86%
100%
ML210,00000004%
100%
ML160,14%
100%
0,97%
0,003%
5,08%
ML128,87%
16,32%
77,63%
5,079%
ML24,72%
56,404%
43,525%
0.000003%
2,638%
0,010%
ML3
64,783%
43,75%
32,569%
0,70%
ML44,81%
99,30%
ML50,10%
71,99%
28,01%
ML60,99%
65,00%
35,00%
ML85,69%
100%
9,22%
ML70,01%
90,78%
ML103,38%
99,74%
0,26% 14,59% 7,88%
ML110,22%
77,53%
1,54%
ML132,96%
72,71%
25,75%
ML170,23%
0,49%
99,51%
ML182,27%
0,03%
99,97%
0,006%
18,23%
24,95%
55,38%
2011
2010
2009
11Transfers of controlled goods may pass through two or more states covered by this report before being delivered to their final destination. For this reason, there is likely to be a considerable amout of double counting in this report, with the same transfer being reported multiple times by different states. The report should not, therefore, be used to generate an estimate of the combined value of the region’s arms exports.
REGIONAL REPORT ON ARMS EXPORTS IN 2011

12
REGIONAL REPORT ON ARMS EXPORTS IN 2011
Key a = number of licenses issued b = value of licenses issued in Euros c = value of arms exports in Euros
AFGHANISTAN
ML 1 ML 2 ML 3 ML 13 ML 22 TOTAL per destination
Bosnia and Herzegovina a 3 1 4
b 4 629 538 911 500 5 541 038
c 4 629 538 911 500 5 541 038
Serbia* a 1 5 1 0 7
b 1 191 412 6 107 849 37 887 107 259 7 444 406
c 1 158 181 3 952 553 37 887 86 380 5 235 002
TOTAL PER ML category a 1 3 6 1 0 11
b 1 191 412 4 629 538 7 019 349 37 887 107 259 12 985 444
c 1 158 181 4 629 538 4 864 053 37 887 86 380 10 776 040
ALBANIA
ML 3 TOTAL per destination
Bosnia and Herzegovina a 1 1
b 48 750 48 750
c 14 625 14 625
TOTAL PER ML category a 1 1
b 48 750 48 750
c 14 625 14 625
ALGERIA
ML 2 ML 5 ML 17 ML 22 TOTAL per destination
Serbia* a 3 0 1 0 4
b 1 700 803 120 780 14 183 332 98 928 16 103 844
c 1 008 931 62 597 0 84 724 1 156 252
TOTAL PER ML category a 3 0 1 0 4
b 1 700 803 120 780 14 183 332 98 928 16 103 844
c 1 008 931 62 597 0 84 724 1 156 252
ARMS EXPORTS PER DESTINATION IN 2011

13
REGIONAL REPORT ON ARMS EXPORTS IN 2011
Key a = number of licenses issued b = value of licenses issued in Euros c = value of arms exports in Euros
AUSTRALIA
ML 1 ML 3 TOTAL per destination
Serbia a 3 1 4
b 233 532 131 155 364 687
c 233 532 131 155 364 687
TOTAL PER ML category a 3 1 4
b 233 532 131 155 364 687
c 233 532 131 155 364 687
ANGOLA
ML 3 TOTAL per destination
Serbia a 1 1
b 158 900 158 900
c 158 900 158 900
TOTAL PER ML category a 1 1
b 158 900 158 900
c 158 900 158 900
ARGENTINA
ML 1 ML 13 TOTAL per destination
Croatia a 1 1
b 37 100 37 100
c 15 900 15 900
Serbia a 1 1
b 35 201 35 201
c 35 201 35 201
TOTAL PER ML category a 1 1 2
b 35 201 37 100 72 301
c 35 201 15 900 51 101

14
REGIONAL REPORT ON ARMS EXPORTS IN 2011
Key a = number of licenses issued b = value of licenses issued in Euros c = value of arms exports in Euros
AUSTRIA
ML 1 ML 3 ML 4 ML 8 TOTAL per destination
Bosnia and Herzegovina a 1 1
b 19 205 70 290 89 495
c 19 205 70 290 89 495
Serbia a 6 5 11
b 737 129 104 460 841 589
c 678 427 95 160 773 587
TOTAL PER ML category a 6 1 0 5 12
b 737 129 19 205 70 290 104 460 931 084
c 678 427 19 205 70 290 95 160 863 082
AZERBAIJAN
ML 2 ML 15 ML 18 ML 22 TOTAL per destination
Serbia a 1 0 4 1 6
b 4 160 000 496 000 5 111 450 1 129 937 10 897 387
c 0 0 5 111 450 0 5 111 450
TOTAL PER ML category a 1 0 4 1 6
b 4 160 000 496 000 5 111 450 1 129 937 10 897 387
c 0 0 5 111 450 0 5 111 450
BAHRAIN
ML 3 ML 13 TOTAL per destination
Serbia a 1 5 6
b 76 300 392 338 468 638
c 0 392 338 392 338
TOTAL PER ML category a 1 5 6
b 76 300 392 338 468 638
c 0 392 338 392 338

15
REGIONAL REPORT ON ARMS EXPORTS IN 2011
Key a = number of licenses issued b = value of licenses issued in Euros c = value of arms exports in Euros
BANGLADESH
ML 3 ML 4 ML 13 TOTAL per destination
Croatia a 1 1
b 1 344 000 1 344 000
c 0 0
Serbia a 2 2 4
b 1 560 051 1 017 867 2 577 919
c 1 560 051 1 017 867 2 577 919
TOTAL PER ML category a 2 2 1 5
b 1 560 051 1 017 867 1 344 000 3 921 919
c 1 560 051 1 017 867 0 2 577 919
BELARUS
ML 3 TOTAL per destination
Serbia a 1 1
b 214 500 214 500
c 0 0
TOTAL PER ML category a 1 1
b 214 500 214 500
c 0 0
BELGIUM
ML 1 ML 3 ML 8 TOTAL per destination
Croatia a 1 1
b 379 379
c 379 379
Serbia a 6 2 8
b 7 115 288 63 470 7 178 758
c 4 879 831 63 470 4 943 301
TOTAL PER ML category a 1 6 2 9
b 379 7 115 288 63 470 7 179 137
c 379 4 879 831 63 470 4 943 681

16
REGIONAL REPORT ON ARMS EXPORTS IN 2011
Key a = number of licenses issued b = value of licenses issued in Euros c = value of arms exports in Euros
BOSNIA AND HERZEGOVINA
ML 1 ML 2 ML 3 ML 4 ML 8 ML 13 ML 14 TOTAL per destination
Croatia a 3 1 4
b 73 627 2 090 75 717
c 66 687 2 090 68 777
Serbia* a 4 1 4 1 5 0 15
b 229 029 3 244 212 811 185 500 1 854 975 11 500 2 497 059
c 222 951 3 244 212 811 184 750 1 537 259 0 2 161 015
TOTAL PER ML category a 7 1 4 1 5 1 0 19
b 302 656 3 244 212 811 185 500 1 854 975 2 090 11 500 2 572 777
c 289 638 3 244 212 811 184 750 1 537 259 2 090 0 2 229 792
BOTSWANA
ML 1 TOTAL per destination
Serbia a 1 1
b 25 444 25 444
c 25 444 25 444
TOTAL PER ML category a 1 1
b 25 444 25 444
c 25 444 25 444
BRAZIL
ML 1 TOTAL per destination
Serbia a 1 1
b 2 220 2 220
c 0 0
TOTAL PER ML category a 1 1
b 2 220 2 220
c 0 0

17
REGIONAL REPORT ON ARMS EXPORTS IN 2011
Key a = number of licenses issued b = value of licenses issued in Euros c = value of arms exports in Euros
BURKINA FASO
ML 1 ML 3 TOTAL per destination
Albania a 1 1 2
b 11 325 48 490 59 815
c 11 325 48 490 59 815
Serbia a 1 1
b 28 980 28 980
c 28 980 28 980
TOTAL PER ML category a 2 1 3
b 40 305 48 490 88 795
c 40 305 48 490 88 795
BULGARIA
ML 1 ML 2 ML 3 ML 8 ML 13 TOTAL per destination
Albania a 1 1
b 3 207 864 3 207 864
c 960 838 960 838
Bosnia and Herzegovina a 1 1
b 1 156 170 1 156 170
c 1 156 170 1 156 170
Croatia a 2 3 5
b 132 500 199 894 332 394
c 11 120 194 560 205 680
Serbia a 5 1 5 10 21
b 82 891 183 803 1 949 600 9 249 895 11 466 189
c 40 200 183 803 565 224 4 577 807 5 367 033
TOTAL PER ML category a 7 1 7 10 3 28
b 215 391 183 803 6 313 634 9 249 895 199 894 16 162 617
c 51 320 183 803 2 682 232 4 577 807 194 560 7 689 721

18
REGIONAL REPORT ON ARMS EXPORTS IN 2011
Key a = number of licenses issued b = value of licenses issued in Euros c = value of arms exports in Euros
CAMEROON
ML 1 ML 3 TOTAL per destination
Serbia a 1 3 4
b 52 000 1 556 000 1 608 000
c 52 000 1 283 000 1 335 000
TOTAL PER ML category a 1 3 4
b 52 000 1 556 000 1 608 000
c 52 000 1 283 000 1 335 000
CANADA
ML 1 ML 2 ML 3 TOTAL per destination
Serbia* a 5 0 1 6
b 54 252 170 225 656 280 078
c 54 071 17 225 531 279 620
TOTAL PER ML category a 5 0 1 6
b 54 252 170 225 656 280 078
c 54 071 17 225 531 279 620
CHILE
ML 3 ML 8 TOTAL per destination
Bosnia and Herzegovina a 1 1
b 105 358 105 358
c 105 358 105 358
Serbia a 2 1 3
b 1 441 836 437 625 1 879 462
c 1 441 241 433 916 1 875 156
TOTAL PER ML category a 3 1 4
b 1 547 194 437 625 1 984 820
c 1 546 599 433 916 1 980 514

19
REGIONAL REPORT ON ARMS EXPORTS IN 2011
Key a = number of licenses issued b = value of licenses issued in Euros c = value of arms exports in Euros
CHINA (MAINLAND)
ML 13 TOTAL per destination
Croatia a 1 1
b 178 178
c 178 178
TOTAL PER ML category a 1 1
b 178 178
c 178 178
COLOMBIA
ML 13 TOTAL per destination
Croatia a 1 1
b 5 750 5 750
c 5 750 5 750
TOTAL PER ML category a 1 1
b 5 750 5 750
c 5 750 5 750
CONGO (DEMOCRATIC REPUBLIC OF)
ML 1 ML 2 ML 4 ML 6 TOTAL per destination
Albania a 1 1
b 510 807 510 807
c 177 710 177 710
Serbia* a 1 1 1 3
b 659 817 846 318 260 325 1 766 460
c 659 817 846 318 260 325 1 766 460
TOTAL PER ML category a 1 1 1 0 4
b 510 807 659 817 846 318 260 325 2 277 267
c 177 710 659 817 846 318 260 325 1 944 170

20
REGIONAL REPORT ON ARMS EXPORTS IN 2011
Key a = number of licenses issued b = value of licenses issued in Euros c = value of arms exports in Euros
CROATIA
ML 1 ML 3 TOTAL per destination
Serbia a 1 3 4
b 13 340 152 291 165 631
c 12 553 152 291 164 844
TOTAL PER ML category a 1 3 4
b 13 340 152 291 165 631
c 12 553 152 291 164 844
CYPRUS
ML 2 ML 3 TOTAL per destination
Serbia a 1 1 2
b 4 732 41 731 46 463
c 4 732 41 731 46 463
TOTAL PER ML category a 1 1 2
b 4 732 41 731 46 463
c 4 732 41 731 46 463
CZECH REPUBLIC
ML 1 ML 2 ML 3 ML 6 TOTAL per destination
Albania a 3 3
b 5 035 678 5 035 678
c 1 175 010 1 175 010
Croatia a 2 2
b 1 690 1 690
c 1 690 1 690
Serbia a 4 2 1 2 9
b 579 585 761 517 3 000 629 587 1 973 689
c 474 658 644 670 3 000 629 587 1 751 915
TOTAL PER ML category a 6 2 4 2 14
b 581 275 761 517 5 038 678 629 587 7 011 057
c 476 348 644 670 1 178 010 629 587 2 928 615

21
REGIONAL REPORT ON ARMS EXPORTS IN 2011
Key a = number of licenses issued b = value of licenses issued in Euros c = value of arms exports in Euros
DENMARK (GREENLAND)
ML 1 TOTAL per destination
Serbia a 1 1
b 39 884 39 884
c 39 884 39 884
TOTAL PER ML category a 1 1
b 39 884 39 884
c 39 884 39 884
EGYPT
ML 1 ML 3 ML 4 ML 6 ML 8 ML 11 ML 17 ML 22 TOTAL per destination
Bosnia and Herzegovina a 3 1 4
b 524 200 348 294 872 494
c 422 678 348 294 770 972
Croatia a 1 1
b 245 245
c 0 0
Serbia a 1 1 2 1 1 1 3 10
b 912 223 957 954 015 586 070 1 187 232 554 884 3 225 903 6 732 973
c 0 223 957 505 844 563 751 339 384 512 550 2 082 865 4 228 352
TOTAL PER ML category a 2 4 1 1 1 1 1 3 15
b 1 157 748 157 954 015 586 070 1 187 232 348 294 554 884 3 225 903 7 605 712
c 0 646 635 505 844 563 751 339 384 348 294 512 550 2 082 865 4 999 324
EQUATORIAL GUINEA
ML 3 TOTAL per destination
Serbia a 2 2
b 1 156 500 1 156 500
c 908 250 908 250
TOTAL PER ML category a 2 2
b 1 156 500 1 156 500
c 908 250 908 250

22
REGIONAL REPORT ON ARMS EXPORTS IN 2011
Key a = number of licenses issued b = value of licenses issued in Euros c = value of arms exports in Euros
FINLAND
ML 6 TOTAL per destination
Croatia a 1 1
b 32 868 32 868
c 32 868 32 868
TOTAL PER ML category a 1 1
b 32 868 32 868
c 32 868 32 868
THE FORMER YUGOSLAV REPUBLIC OF MACEDONIA
ML 1 ML 3 TOTAL per destination
Bosnia and Herzegovina a 1 1
b 330 300 330 300
c 330 300 330 300
Croatia a 1 1
b 1 057 1 057
c 0 0
Serbia a 2 2 4
b 60 042 93 269 153 311
c 60 042 93 269 153 311
TOTAL PER ML category a 2 4 6
b 60 042 424 626 484 668
c 60 042 423 569 483 611
FRANCE (NEW CALEDONIA)
ML 1 TOTAL per destination
Serbia a 1 1
b 19 258 19 258
c 19 258 19 258
TOTAL PER ML category a 1 1
b 19 258 19 258
c 19 258 19 258

23
REGIONAL REPORT ON ARMS EXPORTS IN 2011
Key a = number of licenses issued b = value of licenses issued in Euros c = value of arms exports in Euros
FRANCE
ML 1 ML 4 ML 8 ML 22 TOTAL per destination
Serbia a 3 1 2 1 7
b 126 916 49 600 132 500 215 727 524 743
c 97 991 49 600 132 500 215 727 495 818
TOTAL PER ML category a 3 1 2 1 7
b 126 916 49 600 132 500 215 727 524 743
c 97 991 49 600 132 500 215 727 495 818
GEORGIA
ML 4 TOTAL per destination
Albania a 1 1
b 932 967 932 967
c 0 0
TOTAL PER ML category a 1 1
b 932 967 932 967
c 0 0
GERMANY
ML 1 ML 3 ML 13 TOTAL per destination
Bosnia and Herzegovina a 1 1
b 14 929 14 929
c 14 929 14 929
Croatia a 1 7 8
b 6 645 22 524 29 169
c 6 645 22 475 29 120
Serbia a 1 3 4
b 36 453 12 543 980 12 580 433
c 36 453 1 320 319 1 356 772
TOTAL PER ML category a 2 4 7 13
b 43 098 12 558 909 22 524 12 624 531
c 43 098 1 335 248 22 475 1 400 821

24
REGIONAL REPORT ON ARMS EXPORTS IN 2011
Key a = number of licenses issued b = value of licenses issued in Euros c = value of arms exports in Euros
GREECE
ML 1 ML 3 TOTAL per destination
Croatia a 1 1
b 21 280 21 280
c 21 280 21 280
Serbia a 1 1
b 43 081 43 081
c 41 407 41 407
TOTAL PER ML category a 1 1 2
b 21 280 43 081 64 361
c 21 280 41 407 62 687
GUATEMALA
ML 1 ML 3 TOTAL per destination
Croatia a 5 5
b 236 268 236 268
c 144 755 144 755
Serbia a 1 2 3
b 31 520 376 349 407 869
c 31 520 376 349 407 869
TOTAL PER ML category a 6 2 8
b 267 788 376 349 644 137
c 176 275 376 349 552 624

25
REGIONAL REPORT ON ARMS EXPORTS IN 2011
Key a = number of licenses issued b = value of licenses issued in Euros c = value of arms exports in Euros
INDIA
ML 2 ML 3 ML 8 TOTAL per destination
Croatia a 1 1
b 7 576 7 576
c 7 576 7 576
Serbia a 2 1 3
b 37 394 2 864 847 2 902 241
c 37 394 2 864 847 2 902 241
TOTAL PER ML category a 1 2 1 4
b 7 576 37 394 2 864 847 2 909 817
c 7 576 37 394 2 864 847 2 909 817
HUNGARY
ML 1 ML 3 TOTAL per destination
Bosnia and Herzegovina a 3 3
b 543 835 543 835
c 176 526 176 526
Croatia a 1 2 3
b 2 695 333 3 028
c 2 606 333 2 938
TOTAL PER ML category a 1 5 6
b 2 695 544 168 546 863
c 2 606 176 859 179 464

26
REGIONAL REPORT ON ARMS EXPORTS IN 2011
Key a = number of licenses issued b = value of licenses issued in Euros c = value of arms exports in Euros
INDONESIA
ML 1 ML 2 ML 3 TOTAL per destination
Bosnia and Herzegovina a 1 1
b 63 125 63 125
c 63 125 63 125
Serbia a 1 3 5 9
b 258 888 548 205 2 623 384 3 430 477
c 258 888 548 205 2 623 384 3 430 477
TOTAL PER ML category a 1 3 6 10
b 258 888 548 205 2 686 509 3 493 602
c 258 888 548 205 2 686 509 3 493 602
IRAQ
ML 1 ML 2 ML 3 ML 4 ML 5 ML 10
Bosnia and Herzegovina a 1
b 90 700
c 90 700
Croatia a 1
b 6 477 273
c 6 477 273
Serbia* a 3 1 4 1 0 1
b 2 820 359 139 104 26 153 198 7 904 971 1 693 978 7 363 238
c 2 715 258 92 736 21 177 299 7 255 819 0 7 363 238
TOTAL PER ML category a 4 1 4 1 1 1
b 9 297 632 139 104 26 153 198 7 904 971 1 784 678 7 363 238
c 9 192 531 92 736 21 177 299 7 255 819 90 700 7 363 238

27
REGIONAL REPORT ON ARMS EXPORTS IN 2011
Key a = number of licenses issued b = value of licenses issued in Euros c = value of arms exports in Euros
IRAQ
ML 11 ML 13 ML 22 TOTAL per destination
Bosnia and Herzegovina a 1
b 90 700
c 90 700
Croatia a 1 2
b 115 000 6 592 273
c 115 000 6 592 273
Serbia* a 0 1 11
b 38 640 8 982 253 55 095 741
c 38 640 1 086 441 39 729 432
TOTAL PER ML category a 0 1 1 14
b 38 640 115 000 8 982 253 61 778 714
c 38 640 115 000 1 086 441 46 412 405
ISRAEL
ML 3 ML 4 ML 8 TOTAL per destination
Bosnia and Herzegovina a 7 7
b 141 050 141 050
c 139 050 139 050
Serbia a 9 2 2 13
b 1 669 716 345 055 2 633 800 4 648 571
c 532 655 329 640 1 653 882 2 516 177
TOTAL PER ML category a 16 2 2 20
b 1 810 766 345 055 2 633 800 4 789 621
c 671 705 329 640 1 653 882 2 655 227

28
REGIONAL REPORT ON ARMS EXPORTS IN 2011
Key a = number of licenses issued b = value of licenses issued in Euros c = value of arms exports in Euros
ITALY
ML 1 ML 3 ML 8 ML 13 TOTAL per destination
Bosnia and Herzegovina a 1 1
b 8 520 8 520
c 8 520 8 520
Croatia a 1 2 3
b 540 299 650 300 190
c 540 299 650 300 190
Serbia a 1 2 1 4
b 23 650 441 770 484 124 949 544
c 23 650 441 770 247 363 712 783
TOTAL PER ML category a 2 3 1 2 8
b 24 190 450 290 484 124 299 650 1 258 254
c 24 190 450 290 247 363 299 650 1 021 493
JORDAN
ML 1 ML 3 TOTAL per destination
Serbia a 1 1 2
b 139 104 69 552 208 656
c 139 104 69 552 208 656
TOTAL PER ML category a 1 1 2
b 139 104 69 552 208 656
c 139 104 69 552 208 656
KAZAKHSTAN
ML 13 TOTAL per destination
Croatia a 2 2
b 103 490 103 490
c 103 490 103 490
TOTAL PER ML category a 2 2
b 103 490 103 490
c 103 490 103 490

29
REGIONAL REPORT ON ARMS EXPORTS IN 2011
Key a = number of licenses issued b = value of licenses issued in Euros c = value of arms exports in Euros
KENYA
ML 3 TOTAL per destination
Serbia a 3 3
b 3 945 411 3 945 411
c 3 945 411 3 945 411
TOTAL PER ML category a 3 3
b 3 945 411 3 945 411
c 3 945 411 3 945 411
KOSOVO*
ML1 ML3 ML7 TOTAL per destination
The former Yugoslav Republic of Macedonia a 1 1 1 3
b 2 095 10 200 2 575 14 870
c 2 095 10 200 2 575 14 870
TOTAL PER ML category a 1 1 1 3
b 2 095 10 200 2 575 14 870
c 2 095 10 200 2 575 14 870
KUWAIT
ML 3 TOTAL per destination
Bosnia and Herzegovina a 1 1
b 1 017 897 1 017 897
c 1 017 897 1 017 897
TOTAL PER ML category a 1 1
b 1 017 897 1 017 897
c 1 017 897 1 017 897
* This designation is without prejudice to positions on status, and is in line with UNSC 1244 and the ICJ Opinion on the Kosovo Declaration of Independence.

30
REGIONAL REPORT ON ARMS EXPORTS IN 2011
Key a = number of licenses issued b = value of licenses issued in Euros c = value of arms exports in Euros
KYRGYZSTAN
ML 1 TOTAL per destination
Serbia a 1 1
b 13 175 13 175
c 13 175 13 175
TOTAL PER ML category a 1 1
b 13 175 13 175
c 13 175 13 175
MALAYSIA
ML 3 ML 5 TOTAL per destination
Bosnia and Herzegovina a 1 1 2
b 181 000 22 831 203 831
c 181 000 22 831 203 831
TOTAL PER ML category a 1 1 2
b 181 000 22 831 203 831
c 181 000 22 831 203 831
MONTENEGRO
ML 1 ML 3 ML 4 ML 7 ML 8 ML 10 TOTAL per destination
Bosnia and Herzegovina a 1 1
b 37 265 37 265
c 20 165 20 165
Serbia a 2 1 2 1 2 8
b 7 895 10 460 38 503 7 500 96 828 161 186
c 7 895 4 670 38 503 7 500 11 872 70 439
TOTAL PER ML category a 2 1 2 1 2 1 9
b 7 895 10 460 38 503 7 500 96 828 37 265 198 451
c 7 895 4 670 38 503 7 500 11 872 20 165 90 604

31
REGIONAL REPORT ON ARMS EXPORTS IN 2011
Key a = number of licenses issued b = value of licenses issued in Euros c = value of arms exports in Euros
MYANMAR
ML 2 ML 22 TOTAL per destination
Serbia* a 1 0 1
b 2 655 595 486 201 3 141 796
c 2 575 095 486 201 3 061 296
TOTAL PER ML category a 1 0 1
b 2 655 595 486 201 3 141 796
c 2 575 095 486 201 3 061 296
NAMIBIA
ML 1 ML 13 ML 22 TOTAL per destination
Croatia a 3 3
b 676 739 676 739
c 676 739 676 739
Serbia a 2 1 3
b 49 143 21 200 70 343
c 44 403 11 720 56 123
TOTAL PER ML category a 2 3 1 6
b 49 143 676 739 21 200 747 082
c 44 403 676 739 11 720 732 862
NETHERLANDS
ML 3 TOTAL per destination
Bosnia and Herzegovina a 1 1
b 121 420 121 420
c 121 420 121 420
Serbia a 1 1
b 199 480 199 480
c 199 480 199 480
TOTAL PER ML category a 2 2
b 320 900 320 900
c 320 900 320 900

32
REGIONAL REPORT ON ARMS EXPORTS IN 2011
Key a = number of licenses issued b = value of licenses issued in Euros c = value of arms exports in Euros
NEW ZEALAND
ML 1 ML 3 ML 21 TOTAL per destination
Croatia a 1 1
b 10 10
c 10 10
Serbia a 1 1 2
b 49 904 135 950 185 854
c 49 904 135 950 185 854
TOTAL PER ML category a 1 1 1 3
b 49 904 135 950 10 185 864
c 49 904 135 950 10 185 864
NIGER
ML 13 TOTAL per destination
Croatia a 1 1
b 115 000 115 000
c 115 000 115 000
TOTAL PER ML category a 1 1
b 115 000 115 000
c 115 000 115 000
NORWAY
ML 3 TOTAL per destination
Serbia a 1 1
b 184 029 184 029
c 184 029 184 029
TOTAL PER ML category a 1 1
b 184 029 184 029
c 184 029 184 029

33
REGIONAL REPORT ON ARMS EXPORTS IN 2011
Key a = number of licenses issued b = value of licenses issued in Euros c = value of arms exports in Euros
PAKISTAN
ML 1 ML 3 TOTAL per destination
Serbia a 2 1 3
b 87 906 35 992 123 898
c 58 346 35 992 94 338
TOTAL PER ML category a 2 1 3
b 87 906 35 992 123 898
c 58 346 35 992 94 338
PERU
ML 1 ML 13 TOTAL per destination
Croatia a 2 2
b 43 200 43 200
c 21 600 21 600
Serbia a 2 2
b 119 415 119 415
c 26 685 26 685
TOTAL PER ML category a 2 2 4
b 119 415 43 200 162 615
c 26 685 21 600 48 365
PHILIPPINES
ML 1 ML 3 TOTAL per destination
Croatia a 4 4
b 140 694 140 694
c 140 694 140 694
Serbia a 14 14
b 2 405 686 2 405 686
c 2 405 686 2 405 686
TOTAL PER ML category a 4 14 18
b 140 694 2 405 686 2 546 380
c 140 694 2 405 686 2 546 380
34
REGIONAL REPORT ON ARMS EXPORTS IN 2011
Key a = number of licenses issued b = value of licenses issued in Euros c = value of arms exports in Euros
POLAND
ML 1 ML 13 ML 17 TOTAL per destination
Bosnia and Herzegovina a 1 1
b 103 030 103 030
c 103 030 103 030
Croatia a 9 1 10
b 255 912 193 256 105
c 32 525 0 32 525
TOTAL PER ML category a 9 1 1 11
b 255 912 103 030 193 359 135
c 32 525 103 030 0 135 555
PORTUGAL
ML 1 TOTAL per destination
Serbia a 1 1
b 42 725 42 725
c 42 725 42 725
TOTAL PER ML category a 1 1
b 42 725 42 725
c 42 725 42 725
ROMANIA
ML 1 ML 3 ML 8 TOTAL per destination
Bosnia and Herzegovina a 9 9
b 194 720 194 720
c 194 720 194 720
Serbia a 1 3 4 8
b 29 500 445 796 763 217 1 238 513
c 29 500 445 796 763 217 1 238 513
TOTAL PER ML category a 1 12 4 17
b 29 500 640 516 763 217 1 433 233
c 29 500 640 516 763 217 1 433 233

35
REGIONAL REPORT ON ARMS EXPORTS IN 2011
Key a = number of licenses issued b = value of licenses issued in Euros c = value of arms exports in Euros
RUSSIAN FEDERATION
ML 1 ML 3 ML 13 TOTAL per destination
Croatia a 3 3
b 615 360 615 360
c 489 360 489 360
Serbia a 1 1 2
b 22 158 263 22 421
c 22 158 263 22 421
TOTAL PER ML category a 1 1 3 5
b 22 158 263 615 360 637 781
c 22 158 263 489 360 511 781
SAUDI ARABIA
ML 1 ML 3 ML 13 TOTAL per destination
Albania a 1 1
b 177 710 177 710
c 177 710 177 710
Bosnia and Herzegovina a 2 2
b 26 787 656 26 787 656
c 18 631 601 18 631 601
Croatia a 1 3 4
b 1 794 351 300 353 094
c 1 794 351 300 353 094
TOTAL PER ML category a 1 3 3 7
b 1 794 26 965 366 351 300 27 318 460
c 1 794 18 809 311 351 300 19 162 405
36
REGIONAL REPORT ON ARMS EXPORTS IN 2011
Key a = number of licenses issued b = value of licenses issued in Euros c = value of arms exports in Euros
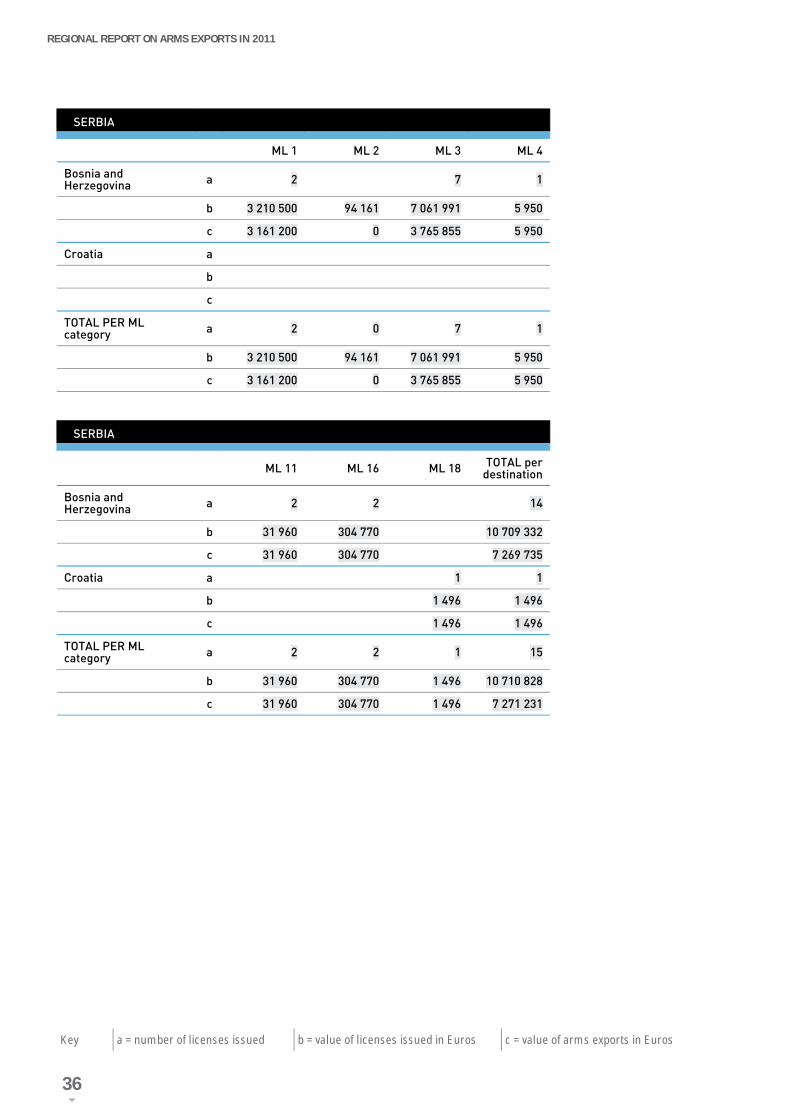
SERBIA
ML 1 ML 2 ML 3 ML 4
Bosnia and Herzegovina a 2 7 1
b 3 210 500 94 161 7 061 991 5 950
c 3 161 200 0 3 765 855 5 950
Croatia a
b
c
TOTAL PER ML category a 2 0 7 1
b 3 210 500 94 161 7 061 991 5 950
c 3 161 200 0 3 765 855 5 950
SERBIA
ML 11 ML 16 ML 18 TOTAL per destination
Bosnia and Herzegovina a 2 2 14
b 31 960 304 770 10 709 332
c 31 960 304 770 7 269 735
Croatia a 1 1
b 1 496 1 496
c 1 496 1 496
TOTAL PER ML category a 2 2 1 15
b 31 960 304 770 1 496 10 710 828
c 31 960 304 770 1 496 7 271 231

37
REGIONAL REPORT ON ARMS EXPORTS IN 2011
Key a = number of licenses issued b = value of licenses issued in Euros c = value of arms exports in Euros
SLOVENIA
ML 1 ML 3 ML 13 ML 22 TOTAL per destination
Croatia a 4 1 5
b 151 140 10 800 161 940
c 15 865 10 800 26 665
Serbia a 3 1 2 1 7
b 63 545 417 000 16 080 35 400 532 025
c 39 454 417 000 16 080 9 723 482 257
TOTAL PER ML category a 7 1 3 1 12
b 214 685 417 000 26 880 35 400 693 965
c 55 319 417 000 26 880 9 723 508 922
SLOVAKIA
ML 1 ML 3 TOTAL per destination
Bosnia and Herzegovina a 2 2
b 195 996 195 996
c 62 421 62 421
Croatia a 1 1
b 192 200 192 200
c 21 690 21 690
Serbia a 1 1
b 90 974 90 974
c 90 974 90 974
TOTAL PER ML category a 1 3 4
b 192 200 286 970 479 170
c 21 690 153 395 175 085

38
REGIONAL REPORT ON ARMS EXPORTS IN 2011
Key a = number of licenses issued b = value of licenses issued in Euros c = value of arms exports in Euros
SOUTH AFRICA
ML 1 TOTAL per destination
Serbia a 2 2
b 21 645 21 645
c 21 645 21 645
TOTAL PER ML category a 2 2
b 21 645 21 645
c 21 645 21 645
SPAIN
ML 1 ML 3 ML 17 TOTAL per destination
Bosnia and Herzegovina a 11 11
b 1 418 578 1 418 578
c 1 418 578 1 418 578
Croatia a 3 1 4
b 17 198 452 17 650
c 17 198 452 17 650
TOTAL PER ML category a 3 11 1 15
b 17 198 1 418 578 452 1 436 228
c 17 198 1 418 578 452 1 436 228
SWITZERLAND
ML 1 ML 3 ML 8 TOTAL per destination
Bosnia and Herzegovina a 1 8 9
b 2 250 6 769 473 6 771 723
c 2 250 3 188 421 3 190 671
Serbia a 1 1 2
b 181 200 40 500 221 700
c 745 0 745
TOTAL PER ML category a 2 8 1 11
b 183 450 6 769 473 40 500 6 993 423
c 2 995 3 188 421 0 3 191 416

39
REGIONAL REPORT ON ARMS EXPORTS IN 2011
Key a = number of licenses issued b = value of licenses issued in Euros c = value of arms exports in Euros
TAJIKISTAN
ML 1 ML 3 ML 10 TOTAL per destination
Serbia a 2 1 1 4
b 132 580 6 240 245 000 383 820
c 3 600 6 240 245 000 254 840
TOTAL PER ML category a 2 1 1 4
b 132 580 6 240 245 000 383 820
c 3 600 6 240 245 000 254 840
THAILAND
ML 1 ML 3 TOTAL per destination
Bosnia and Herzegovina a 2 2
b 88 238 88 238
c 88 238 88 238
Serbia a 1 6 7
b 43 900 1 324 797 1 368 697
c 43 900 1 323 290 1 367 190
TOTAL PER ML category a 1 8 9
b 43 900 1 413 035 1 456 935
c 43 900 1 411 528 1 455 428

40
REGIONAL REPORT ON ARMS EXPORTS IN 2011
Key a = number of licenses issued b = value of licenses issued in Euros c = value of arms exports in Euros
TURKEY
ML 3 ML 4 ML 5 ML 13 ML 22 TOTAL per destination
Bosnia and Herzegovina a 1 2 3
b 6 630 47 392 54 022
c 6 630 47 392 54 022
Croatia a 1 1
b 2 550 2 550
c 2 550 2 550
Serbia* a 0 1 1
b 100 464 136 334 236 798
c 100 464 136 334 236 798
TOTAL PER ML category a 1 0 2 1 1 5
b 6 630 100 464 47 392 2 550 136 334 293 370
c 6 630 100 464 47 392 2 550 136 334 293 370
TURKMENISTAN
ML 2 ML 7 ML 13 TOTAL per destination
Serbia* a 1 0 4 5
b 87 867 17 852 1 273 983 1 379 702
c 87 867 17 852 1 273 983 1 379 702
TOTAL PER ML category a 1 0 4 5
b 87 867 17 852 1 273 983 1 379 702
c 87 867 17 852 1 273 983 1 379 702
UGANDA
ML 1 ML 2 ML 3 ML 4 TOTAL per destination
Serbia a 1 1 1 1 4
b 1 259 650 147 450 35 000 40 765 1 482 866
c 57 574 147 450 35 000 40 765 280 789
TOTAL PER ML category a 1 1 1 1 4
b 1 259 650 147 450 35 000 40 765 1 482 866
c 57 574 147 450 35 000 40 765 280 789

41
REGIONAL REPORT ON ARMS EXPORTS IN 2011
Key a = number of licenses issued b = value of licenses issued in Euros c = value of arms exports in Euros
UKRAINE
ML 3 ML 8 TOTAL per destination
Serbia a 2 2 4
b 373 296 162 000 535 296
c 373 296 100 000 473 296
TOTAL PER ML category a 2 2 4
b 373 296 162 000 535 296
c 373 296 100 000 473 296
UNITED ARAB EMIRATES
ML 13 TOTAL per destination
Croatia a 1 1
b 2 430 000 2 430 000
c 2 430 000 2 430 000
TOTAL PER ML category a 1 1
b 2 430 000 2 430 000
c 2 430 000 2 430 000
UNITED KINGDOM
ML 1 ML 3 ML 17 TOTAL per destination
Bosnia and Herzegovina a 3 3
b 43 808 43 808
c 43 808 43 808
Croatia a 3 2 5
b 15 130 3 439 18 569
c 13 763 2 073 15 836
Serbia a 2 4 6
b 5 325 20 844 864 20 850 188
c 5 325 590 465 595 790
TOTAL PER ML category a 5 7 2 14
b 20 454 20 888 672 3 439 20 912 565
c 19 088 634 273 2 073 655 434

42
REGIONAL REPORT ON ARMS EXPORTS IN 2011
Key a = number of licenses issued b = value of licenses issued in Euros c = value of arms exports in Euros
UNITED STATES
ML 1 ML 2 ML 3 ML 11 TOTAL per destination
Albania a 1 1
b 444 273 444 273
c 444 273 444 273
Bosnia and Herzegovina a 3 1 4
b 143 886 515 450 659 336
c 141 958 47 750 189 708
Croatia a 36 4 40
b 137 458 056 332 182 137 790 238
c 43 510 555 71 591 43 582 146
Serbia a 22 1 4 27
b 12 850 279 42 983 75 829 195 88 722 457
c 3 719 410 42 983 10 852 976 14 615 369
TOTAL PER ML category a 62 1 5 4 72
b 150 896 494 42 983 76 344 645 332 182 227 616 304
c 47 816 196 42 983 10 900 726 71 591 58 831 496
URUGUAY
ML 1 ML 3 TOTAL per destination
Serbia a 1 3 4
b 18 254 412 134 430 388
c 0 412 134 412 134
TOTAL PER ML category a 1 3 4
b 18 254 412 134 430 388
c 0 412 134 412 134

43
REGIONAL REPORT ON ARMS EXPORTS IN 2011
Key a = number of licenses issued b = value of licenses issued in Euros c = value of arms exports in Euros
YEMEN
ML 3 TOTAL per destination
Albania a 1 1
b 1 110 720 1 110 720
c 222 144 222 144
TOTAL PER ML category a 1 1
b 1 110 720 1 110 720
c 222 144 222 144
VENEZUELA
ML 3 TOTAL per destination
Serbia a 1 1
b 957 957
c 0 0
TOTAL PER ML category a 1 1
b 957 957
c 0 0
VIETNAM
ML 4 TOTAL per destination
Serbia a 1 1
b 400 000 400 000
c 400 000 400 000
TOTAL PER ML category a 1 1
b 400 000 400 000
c 400 000 400 000

44
76%
EXPORT TO CENTRAL AMERICA AND THE CARIBBEAN
552.624 € 86%OF VALUEOF LICENSES ISSUED
WAS USED
EXPORTS GROWTHCOMPARED TO 201011,62% EXPORTS GROWTHCOMPARED TO 2009
8 LICENSESISSUED
CENTRAL AMERICA AND THE CARIBBEAN
CROATIA SERBIA
73,81%
26,19%
644.137 € VALUE OF LICENSES ISSUED IN EUROS
H1H10
ML368,1%
100%
ML131,9%
82,12%
17,88%
2011
2010
2009
ARMS EXPORTS PER REGION IN 2011
44 Transfers of controlled goods may pass through two or more states covered by this report before being delivered to their final destination. For this reason, there is likely to be a considerable amout of double counting in this report, with the same transfer being reported multiple times by different states. The report should not, therefore, be used to generate an estimate of the combined value of the region’s arms exports.
CENTRAL AMERICA AND THE CARIBBEAN
ML 1 ML 3 TOTAL per destination
Croatia a 5 5 b 236 268 236 268 c 144 755 144 755Serbia a 1 2 3 b 31 520 376 349 407 869 c 31 520 376 349 407 869TOTAL PER ML category a 6 2 8 b 267 788 376 349 644 137 c 176 275 376 349 552 624
Key
a = number of licenses issued
b = value of licenses issued in Euros
c = value of arms exports in Euros

45
REGIONAL REPORT ON ARMS EXPORTS IN 2011
Key a = number of licenses issued b = value of licenses issued in Euros c = value of arms exports in Euros
94%
EXPORT TO NORTH AFRICA
1.156.252 € 7%OF VALUEOF LICENSES ISSUED
WAS USED€ VALUE OF LICENSES ISSUED IN EUROS
EXPORTS DECLINECOMPARED TO 201052,97 % EXPORTS DECLINECOMPARED TO 2009
4 LICENSESISSUED
NORTHAFRICA
SERBIAML55,41%
100%100%
ML227,33%
100%
E11EEEEE10000000001
ML287,26%
100%
2011
2010
2009
NORTH AFRICA
ML 2 ML 5 ML 17 ML 22 TOTAL per destination
Serbia a 2 0 1 0 4b 1 700 803 120 780 14 183 332 98 928 16 103 844c 1 008 931 62 597 0 84 724 1 156 252
TOTAL PER ML category a 2 0 1 0 4b 1 700 803 120 780 14 183 332 98 928 16 103 844c 1 008 931 62 597 0 84 724 1 156 252
Key
a = number of licenses issued
b = value of licenses issued in Euros
c = value of arms exports in Euros
45Transfers of controlled goods may pass through two or more states covered by this report before being delivered to their final destination. For this reason, there is likely to be a considerable amout of double counting in this report, with the same transfer being reported multiple times by different states. The report should not, therefore, be used to generate an estimate of the combined value of the region’s arms exports.
REGIONAL REPORT ON ARMS EXPORTS IN 2011

46
34%
EXPORT TO CENTRAL ASIA
1.751.207 € 93%OF VALUEOF LICENSES ISSUED
WAS USED 1.880.187 € VALUE OF LICENSES ISSUED IN EUROS
EXPORTS DECLINECOMPARED TO 2010363,26% EXPORTS GROWTHCOMPARED TO 2009
12LICENSESISSUED
CROATIA SERBIA
ML1
ML7
ML2
ML10
ML3
ML13
0,96%
1,02%
5,02%
13,99%
0,35%
78,66%
100%
100%100%
CENTRALASIA
E1E10
100% 100%
92,49%
7,51%
94%
6%
2011
20102009
46 Transfers of controlled goods may pass through two or more states covered by this report before being delivered to their final destination. For this reason, there is likely to be a considerable amout of double counting in this report, with the same transfer being reported multiple times by different states. The report should not, therefore, be used to generate an estimate of the combined value of the region’s arms exports.
REGIONAL REPORT ON ARMS EXPORTS IN 2011

47
REGIONAL REPORT ON ARMS EXPORTS IN 2011
Key a = number of licenses issued b = value of licenses issued in Euros c = value of arms exports in Euros
CENTRAL ASIA
ML 1 ML 2 ML 3 ML 7
Croatia a
b
c
Serbia a 3 1 1
b 145 755 87 867 6 240 17 852
c 16 775 87 867 6 240 17 852
TOTAL PER ML category a 3 1 1
b 145 755 87 867 6 240 17 852
c 16 775 87 867 6 240 17 852
CENTRAL ASIA
ML 10 ML 13 TOTAL per destination
Croatia a 0 2 2
b 0 103 490 103 490
c 0 103 490 103 490
Serbia a 1 4 10
b 245 000 1 273 983 1 776 697
c 245 000 1 273 983 1 647 717
TOTAL PER ML category a 1 6 12
b 245 000 1 377 473 1 880 187
c 245 000 1 377 473 1 751 207
Key a = number of licenses issued b = value of licenses issued in Euros c = value of arms exports in Euros

48
36%
EXPORT TO EUROPE UNION
24.431.936 € 34%OF VALUEOF LICENSES ISSUED
WAS USED 72.119.040 € VALUE OF LICENSES ISSUED IN EUROS
EXPORTS DECLINECOMPARED TO 201032,99%% EXPORTS GROWTHCOMPARED TO 2009
180LICENSESISSUED
ALBANIA CROATIA SERBIABOSNIA AND HERZEGOVINA
ML1
ML6
ML2
ML8
ML3
ML17
6,85%
2,71%
3,41%
24,06%
58,90%ML4
0,49%
0,01%
100%
100%
EUROPEUNION
E11EEEEE10
91,31%
8,69%
58,63%41,37%
14,85%22,35%
95,04%
ML220,92%
100%
100%
ML132,65%
100%
0.002%4,96% 2,49%
74,49%
8,74%
13,87%
2,90%
62,80%
15,93%
81,58%
2011
20102009
48 Transfers of controlled goods may pass through two or more states covered by this report before being delivered to their final destination. For this reason, there is likely to be a considerable amout of double counting in this report, with the same transfer being reported multiple times by different states. The report should not, therefore, be used to generate an estimate of the combined value of the region’s arms exports.
REGIONAL REPORT ON ARMS EXPORTS IN 2011

49
REGIONAL REPORT ON ARMS EXPORTS IN 2011
Key a = number of licenses issued b = value of licenses issued in Euros c = value of arms exports in Euros
EUROPE UNION
ML 1 ML 2 ML 3 ML 4 ML 6
Albania a 0 0 4 0 0
b 0 0 8 243 542 0 0
c 0 0 2 135 848 0 0
Bosnia and Herzegovina a 0 0 33 0 0
b 0 0 3 717 181 70 290 0
c 0 0 3 216 297 70 290 0
Croatia a 29 0 2 0 1
b 797 309 0 333 0 32 868
c 145 300 0 333 0 32 868
Serbia a 29 4 29 1 2
b 1 786 860 950 052 44 136 563 49 600 629 587
c 1 527 524 833 205 9 036 997 49 600 629 587
TOTAL PER ML category a 58 4 68 1 3
b 2 584 169 950 052 56 097 619 119 890 662 455
c 1 672 825 833 205 14 389 475 119 890 662 455
EUROPE UNION
ML 8 ML 13 ML 17 ML 22 TOTAL per destination
Albania a 0 0 0 0 4
b 0 0 0 0 8 243 542
c 0 0 0 0 2 135 848
Bosnia and Herzegovina a 0 1 0 0 34
b 0 103 030 0 0 3 890 501
c 0 103 030 0 0 3 389 617
Croatia a 0 13 4 0 49
b 0 532 868 4 084 0 1 367 462
c 0 527 485 2 526 0 708 512
Serbia a 24 2 0 2 93
b 10 797 666 16 080 0 251 127 58 617 535
c 5 879 517 16 080 0 225 450 18 197 960
TOTAL PER ML category a 24 16 4 2 180
b 10 797 666 651 978 4 084 251 127 72 119 040
c 5 879 517 646 595 2 526 225 450 24 431 936
Key a = number of licenses issued b = value of licenses issued in Euros c = value of arms exports in Euros

50
88%
EXPORT TO MIDDLE EAST
77.500.396 € 73%OF VALUEOF LICENSES ISSUED
WAS USED 106.728.418 € VALUE OF LICENSES ISSUED IN EUROS
EXPORTS GROWTHCOMPARED TO 201049,86 % EXPORTS GROWTHCOMPARED TO 2009
67LICENSESISSUED
MIDDLE EAST
ML20,12%
100%
0.51%
ML109,50%
100%
ML82,57%
100%
ML410,44%
100%
ML50,12%
100%
H1H10
ALBANIA CROATIA SERBIABOSNIA AND HERZEGOVINA
ML112,04%
69,42%
30,58%
ML354,99%
0,94%
47,43%
51,63%26,65%
12,10%60,74%
ML60,73%
100%
ML134,24%
88,07%
11,93%
ML110,50%
90,01%
9,99%
ML224,09%
100%
ML170,66%
100%
2011
2010
2009
50 Transfers of controlled goods may pass through two or more states covered by this report before being delivered to their final destination. For this reason, there is likely to be a considerable amout of double counting in this report, with the same transfer being reported multiple times by different states. The report should not, therefore, be used to generate an estimate of the combined value of the region’s arms exports.
REGIONAL REPORT ON ARMS EXPORTS IN 2011

51
REGIONAL REPORT ON ARMS EXPORTS IN 2011
Key a = number of licenses issued b = value of licenses issued in Euros c = value of arms exports in Euros
MIDDLE EAST
ML 1 ML 2 ML 3 ML 4 ML 5 ML 6 ML 8
Albania a 0 0 2 0 0 0 0
b 0 0 1 288 430 0 0 0 0
c 0 0 399 854 0 0 0 0
Bosnia and Herzegovina a 0 0 13 0 1 0 0
b 0 0 28 470 803 0 90 700 0 0
c 0 0 20 211 226 0 90 700 0 0
Croatia a 3 0 0 0 0 0 0
b 6 479 312 0 0 0 0 0 0
c 6 479 067 0 0 0 0 0 0
Serbia a 5 1 16 4 0 1 3
b 2 960 375 139 104 28 192 724 9 204 041 1 693 978 586 070 3 821 032
c 2 854 362 92 736 22 003 463 8 091 303 0 563 751 1 993 266
TOTAL PER ML category a 8 1 31 4 1 1 3
b 9 439 687 139 104 57 951 957 9 204 041 1 784 678 586 070 3 821 032
c 9 333 429 92 736 42 614 543 8 091 303 90 700 563 751 1 993 266
MIDDLE EAST
ML 10 ML 11 ML 13 ML 17 ML 22 TOTAL per destination
Albania a 0 0 0 0 0 2
b 0 0 0 0 0 1 288 430
c 0 0 0 0 0 399 854
Bosnia and Herzegovina a 0 1 0 0 0 15
b 0 348 294 0 0 0 28 909 797
c 0 348 294 0 0 0 20 650 220
Croatia a 0 0 5 0 0 8
b 0 0 2 896 300 0 0 9 375 612
c 0 0 2 896 300 0 0 9 375 367
Serbia a 1 0 5 1 4 42
b 7 363 238 38 640 392 338 554 884 12 208 155 67 154 579
c 7 363 238 38 640 392 338 512 550 3 169 307 47 074 955
TOTAL PER ML category a 1 1 10 1 4 67
b 7 363 238 386 934 3 288 638 554 884 12 208 155 106 728 418
c 7 363 238 386 934 3 288 638 512 550 3 169 307 77 500 396
Key a = number of licenses issued b = value of licenses issued in Euros c = value of arms exports in Euros
52
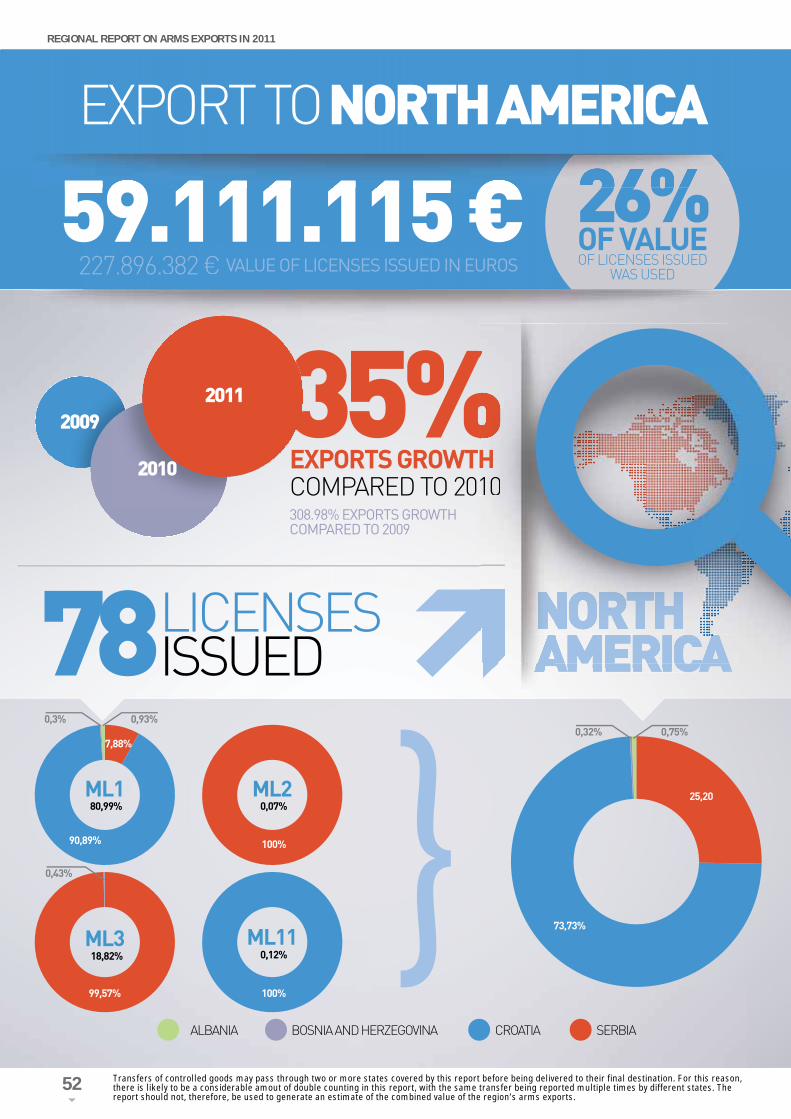
35%
EXPORT TO NORTH AMERICA
59.111.115 € 26%OF VALUEOF LICENSES ISSUED
WAS USED 227.896.382 € VALUE OF LICENSES ISSUED IN EUROS
EXPORTS GROWTHCOMPARED TO 2010308.98% EXPORTS GROWTHCOMPARED TO 2009
78LICENSESISSUED
NORTH AMERICA
H1H10
ALBANIA CROATIA SERBIABOSNIA AND HERZEGOVINA
ML180,99%
ML20,07%
100%
ML110,12%
100%
ML318,82%
7,88%
90,89%
100%
0,3% 0,93%
0,43%
0,32% 0,75%
25,20
73,73%
2010
2011
99,57%
2009
52 Transfers of controlled goods may pass through two or more states covered by this report before being delivered to their final destination. For this reason, there is likely to be a considerable amout of double counting in this report, with the same transfer being reported multiple times by different states. The report should not, therefore, be used to generate an estimate of the combined value of the region’s arms exports.
REGIONAL REPORT ON ARMS EXPORTS IN 2011

53
REGIONAL REPORT ON ARMS EXPORTS IN 2011
Key a = number of licenses issued b = value of licenses issued in Euros c = value of arms exports in Euros
NORTH AMERICA
ML 1 ML 2 ML 3 ML 11 TOTAL per destination
Albania a 1 0 0 0 1
b 444 273 0 0 0 444 273
c 444 273 0 0 0 444 273
Bosnia and Herzegovina a 3 0 1 0 4
b 143 886 0 515 450 0 659 336
c 141 958 0 47 750 0 189 708
Croatia a 36 0 0 4 40
b 137 458 056 0 0 332 182 137 790 238
c 43 510 555 0 0 71 591 43 582 146
Serbia a 27 1 5 0 33
b 12 904 531 43 153 76 054 851 0 89 002 535
c 3 773 481 43 000 11 078 507 0 14 894 988
TOTAL PER ML category a 67 1 6 4 78
b 150 950 746 43 153 76 570 301 332 182 227 896 382
c 47 870 267 43 000 11 126 257 71 591 59 111 115
Key a = number of licenses issued b = value of licenses issued in Euros c = value of arms exports in Euros

54
REGIONAL REPORT ON ARMS EXPORTS IN 2011
Key a = number of licenses issued b = value of licenses issued in Euros c = value of arms exports in Euros
EXPORT TO NORTH EAST ASIA
178 € 100%OF VALUEOF LICENSES ISSUED
WAS USED178€ VALUE OF LICENSES ISSUED IN EUROS
THERE WERE NO EXPORTS TO NORTH EAST ASIA IN 2009 AND 2010
CROATIAML13100%
100%100%
NORTHEAST ASIA1 LICENCE
ISSUED
54 Transfers of controlled goods may pass through two or more states covered by this report before being delivered to their final destination. For this reason, there is likely to be a considerable amout of double counting in this report, with the same transfer being reported multiple times by different states. The report should not, therefore, be used to generate an estimate of the combined value of the region’s arms exports.
NORTH EAST ASIA
ML 13 TOTAL per destination
Croatia a 1 1b 178 178c 178 178
TOTAL PER ML category a 1 1b 178 178c 178 178
Key
a = number of licenses issued
b = value of licenses issued in Euros
c = value of arms exports in Euros
REGIONAL REPORT ON ARMS EXPORTS IN 2011

55
REGIONAL REPORT ON ARMS EXPORTS IN 2011
Key a = number of licenses issued b = value of licenses issued in Euros c = value of arms exports in Euros
19%
EXPORT TO OCEANIA
550.551 € 100%OF VALUEOF LICENSES ISSUED
WAS USED550.551 € VALUE OF LICENSES ISSUED IN EUROS
EXPORTS DECLINECOMPARED TO 2010 131,64% EXPORTS GROWTHCOMPARED TO 2009
7 LICENSESISSUED OCEANIA
CROATIA SERBIA
0,002%
ML151,48%
ML348,52%
100%
ML210,002%
100%100%99,998%
,002%
2011
2010
2009
55Transfers of controlled goods may pass through two or more states covered by this report before being delivered to their final destination. For this reason, there is likely to be a considerable amout of double counting in this report, with the same transfer being reported multiple times by different states. The report should not, therefore, be used to generate an estimate of the combined value of the region’s arms exports.
OCEANIA
ML 1 ML 3 ML 21 TOTAL per destination
Croatia a 0 0 1 1b 0 0 10 10c 0 0 10 10
Serbia a 4 2 0 6b 283 436 267 105 0 550 541c 283 436 267 105 0 550 541
TOTAL PER ML category a 4 2 1 7b 283 436 267 105 10 550 551c 283 436 267 105 10 550 551
Key
a = number of licenses issued
b = value of licenses issued in Euros
c = value of arms exports in Euros
REGIONAL REPORT ON ARMS EXPORTS IN 2011

56
REGIONAL REPORT ON ARMS EXPORTS IN 2011
EXPORT TO OTHER EUROPEAN COUNTRIES
20.858.880 € 58%OF VALUEOF LICENSES ISSUED
WAS USED35.812.885 € VALUE OF LICENSES ISSUED IN EUROS
94LICENSESISSUED
OTHER EUROPEAN COUNTRIES
ALBANIA FYR OF MACEDONIA CROATIA SERBIABOSNIA AND HERZEGOVINA
0,08%
0,07%
ML110,15%
100%
ML100,10%
100%
ML87,90%
100%
ML20,02%
100%
ML50,23%
100%
ML117,33%
0,06%
3.39%
87,52%
9,03%0.22%
ML340,05%
0,12%12,21%
87,45%
ML41,59%
1,80%
98,20%
ML63,59%
100%
ML70,05%
74,44%
25,56%
ML132,37%
100%
ML161,46%
100%
ML220,65%
100%
ML1824,51%
0,03%
99,97%
52,16%
6,56%
41,13%
2011
2010
2009 58%EXPORTS GROWTHCOMPARED TO 201017,07 EXPORTS GROWTHCOMPARED TO 2009
56 Transfers of controlled goods may pass through two or more states covered by this report before being delivered to their final destination. For this reason, there is likely to be a considerable amout of double counting in this report, with the same transfer being reported multiple times by different states. The report should not, therefore, be used to generate an estimate of the combined value of the region’s arms exports.
REGIONAL REPORT ON ARMS EXPORTS IN 2011

57
REGIONAL REPORT ON ARMS EXPORTS IN 2011
Key a = number of licenses issued b = value of licenses issued in Euros c = value of arms exports in Euros
OTHER EUROPEAN COUNTRIES
ML 1 ML 2 ML 3 ML 4 ML 5 ML 6 ML 7 ML 8Albania a 0 0 1 1 0 0 0 0
b 0 0 122 210 932 967 0 0 0 0
c 0 0 18 013 0 0 0 0 0
Bosnia and Herzegovina
a 3 0 18 1 2 0 0 0
b 3 212 750 94 161 14 217 144 5 950 47 392 0 0 0
c 3 163 450 0 7 305 831 5 950 47 392 0 0 0
Croatia a 4 0 1 0 0 1 0 0
b 129 577 0 1 057 0 0 750 000 0 0
c 122 637 0 0 0 0 750 000 0 0
The former Yugoslav Republic of Macedonia
a 1 0 1 0 0 0 1 0
b 2 095 0 10 200 0 0 0 2 575 0
c 2 095 0 10 200 0 0 0 2 575 0
Serbia a 11 2 15 3 0 0 1 10
b 513 664 4 163 244 1 240 919 324 467 0 0 7 500 2 154 303
c 326 343 3 244 1 020 629 323 717 0 0 7 500 1 649 131
TOTAL PER ML category
a 19 2 36 5 2 1 2 10
b 3 858 086 4 257 405 15 591 530 1 263 384 47 392 750 000 10 075 2 154 303
c 3 614 525 3 244 8 354 673 329 667 47 392 750 000 10 075 1 649 131
OTHER EUROPEAN COUNTRIES
ML 10 ML 11 ML 13 ML 14 ML 15 ML 16 ML 18 ML 22 TOTAL per destination
Albania a 0 0 0 0 0 0 0 0 2
b 0 0 0 0 0 0 0 0 1 055 177
c 0 0 0 0 0 0 0 0 18 013
Bosnia and Herzegovina
a 1 2 0 0 0 2 0 0 29
b 37 265 31 960 0 0 0 304 770 0 0 17 951 392
c 20 165 31 960 0 0 0 304 770 0 0 10 879 518
Croatia a 0 0 5 0 0 0 1 0 12
b 0 0 620 000 0 0 0 1 496 0 1 502 130
c 0 0 494 000 0 0 0 1 496 0 1 368 132
The former Yugoslav Republic of Macedonia
a 0 0 0 0 0 0 0 0 3
b 0 0 0 0 0 0 0 0 14 870
c 0 0 0 0 0 0 0 0 14 870
Serbia a 0 0 0 0 0 0 4 2 48
b 0 0 0 11 500 496 000 0 5 111 450 1 266 271 15 289 316
c 0 0 0 0 0 0 5 111 450 136 334 8 578 347
TOTAL PER ML category
a 1 2 5 0 0 2 5 2 94
b 37 265 31 960 620 000 11 500 496 000 304 770 5 112 946 1 266 271 35 812 885
c 20 165 31 960 494 000 0 0 304 770 5 112 946 136 334 20 858 880
Key a = number of licenses issued b = value of licenses issued in Euros c = value of arms exports in Euros

58
53%
EXPORT TO SOUTH AMERICA
2.497.784 € 94%OF VALUEOF LICENSES ISSUED
WAS USED2.659.051 € VALUE OF LICENSES ISSUED IN EUROS
EXPORTS DECLINECOMPARED TO 201012,59 % EXPORTS DECLINECOMPARED TO 2009
17LICENSESISSUED
SOUTH AMERICA
BOSNIA AND HERZEGOVINA CROATIA SERBIA
E1E10
ML12,48%
ML378,42%
100%
ML131,73%
100%
ML817,37%
100%
1,73%
94,05%
4,22%
94,62%
5,38%
2011
2010
2009
58 Transfers of controlled goods may pass through two or more states covered by this report before being delivered to their final destination. For this reason, there is likely to be a considerable amout of double counting in this report, with the same transfer being reported multiple times by different states. The report should not, therefore, be used to generate an estimate of the combined value of the region’s arms exports.
REGIONAL REPORT ON ARMS EXPORTS IN 2011

59
REGIONAL REPORT ON ARMS EXPORTS IN 2011
Key a = number of licenses issued b = value of licenses issued in Euros c = value of arms exports in Euros
SOUTH AMERICA
ML 1 ML 3 ML 8 ML 13 TOTAL per destination
Bosnia and Herzegovina a 0 1 0 0 1
b 0 105 358 0 0 105 358
c 0 105 358 0 0 105 358
Croatia a 0 0 0 4 4
b 0 0 0 86 050 86 050
c 0 0 0 43 250 43 250
Serbia a 5 6 1 0 12
b 175 089 1 854 928 437 625 0 2 467 643
c 61 886 1 853 375 433 916 0 2 349 176
TOTAL PER ML category a 5 7 1 4 17
b 175 089 1 960 286 437 625 86 050 2 659 051
c 35 201 1 958 733 433 916 43 250 2 471 099
Key a = number of licenses issued b = value of licenses issued in Euros c = value of arms exports in Euros

60
REGIONAL REPORT ON ARMS EXPORTS IN 2011
40%
EXPORT TO SOUTH ASIA
16.358.114 € 82%OF VALUEOF LICENSES ISSUED
WAS USED19.941.078 € VALUE OF LICENSES ISSUED IN EUROS
EXPORTS DECLINECOMPARED TO 201059,55% EXPORTS GROWTHCOMPARED TO 2009
23LICENSESISSUED
SOUTHASIA
BOSNIA AND HERZEGOVINA CROATIA SERBIA
ML1
ML4
ML2
ML8
ML3
ML13
7,44%
6,22%
28,35%
17,51%
39,72%
0,23%
100%
100%100%100%
ML220,53%
100%
0,16%
E1EE100000000000000000001111
99,84% 85,97%
14,03%
0,05%
33,87%
66,08%
2010
20112009
60 Transfers of controlled goods may pass through two or more states covered by this report before being delivered to their final destination. For this reason, there is likely to be a considerable amout of double counting in this report, with the same transfer being reported multiple times by different states. The report should not, therefore, be used to generate an estimate of the combined value of the region’s arms exports.
REGIONAL REPORT ON ARMS EXPORTS IN 2011

61
REGIONAL REPORT ON ARMS EXPORTS IN 2011
Key a = number of licenses issued b = value of licenses issued in Euros c = value of arms exports in Euros
SOUTH ASIA
ML 1 ML 2 ML 3 ML 4
Bosnia and Herzegovina a 0 3 1 0
b 0 4 629 538 911 500 0
c 0 4 629 538 911 500 0
Croatia a 0 1 0 0
b 0 7 576 0 0
c 0 7 576 0 0
Serbia a 3 0 10 2
b 1 279 318 0 7 741 287 1 017 867
c 1 216 528 0 5 585 991 1 017 867
TOTAL PER ML category a 3 4 11 2
b 1 279 318 4 637 114 8 652 787 1 017 867
c 1 216 528 4 637 114 6 497 491 1 017 867
SOUTH ASIA
ML 8 ML 13 ML 22 TOTAL per destination
Bosnia and Herzegovina a 0 0 0 4
b 0 0 0 5 541 038
c 0 0 0 5 541 038
Croatia a 0 1 0 2
b 0 1 344 000 0 1 351 576
c 0 0 0 7 576
Serbia a 1 1 0 17
b 2 864 847 37 887 107 259 13 048 464
c 2 864 847 37 887 86 380 10 809 500
TOTAL PER ML category a 1 2 0 23
b 2 864 847 1 381 887 107 259 19 941 078
c 2 864 847 37 887 86 380 16 358 114
Key a = number of licenses issued b = value of licenses issued in Euros c = value of arms exports in Euros

62
34%
EXPORT TO SOUTH EAST ASIA
11.160.537 € 99%OF VALUEOF LICENSES ISSUED
WAS USED11.242.544 € VALUE OF LICENSES ISSUED IN EUROS
EXPORTS GROWTHCOMPARED TO 201092.49% EXPORTS GROWTHCOMPARED TO 2009
41LICENSESISSUED
SOUTHEAST ASIA
BOSNIA AND HERZEGOVINA CROATIA SERBIA
ML1
ML4
ML2
ML5
ML3
ML22
3,97%
3,58%
27,99%
0,20%
59,90%
4,36%
68,28%100%
100%
95,56%
3,18%
1,26%
100%100%
95,03%
31,72%
4,97%
2011
2010
2009
62 Transfers of controlled goods may pass through two or more states covered by this report before being delivered to their final destination. For this reason, there is likely to be a considerable amout of double counting in this report, with the same transfer being reported multiple times by different states. The report should not, therefore, be used to generate an estimate of the combined value of the region’s arms exports.
REGIONAL REPORT ON ARMS EXPORTS IN 2011

63
REGIONAL REPORT ON ARMS EXPORTS IN 2011
Key a = number of licenses issued b = value of licenses issued in Euros c = value of arms exports in Euros
SOUTH EAST ASIA
ML 1 ML 2 ML 3 ML 4
Bosnia and Herzegovina a 0 0 4 0
b 0 0 332 363 0
c 0 0 332 363 0
Croatia a 4 0 0 0
b 140 694 0 0 0
c 140 694 0 0 0
Serbia a 2 4 25 1
b 302 788 3 203 800 6 353 867 400 000
c 302 788 3 123 300 6 352 360 400 000
TOTAL PER ML category a 6 4 29 1
b 443 482 3 203 800 6 686 230 400 000
c 443 482 3 123 300 6 684 723 400 000
SOUTH EAST ASIA
ML 5 ML 22 TOTAL per destination
Bosnia and Herzegovina a 1 0 5
b 22 831 0 355 194
c 22 831 0 355 194
Croatia a 0 0 4
b 0 0 140 694
c 0 0 140 694
Serbia a 0 0 32
b 0 486 201 10 746 656
c 0 486 201 10 664 649
TOTAL PER ML category a 1 0 41
b 22 831 486 201 11 242 544
c 22 831 486 201 11 160 537
Key a = number of licenses issued b = value of licenses issued in Euros c = value of arms exports in Euros

64
37%
EXPORT TO SUB-SAHARAN AFRICA
9.556.267 € 82%OF VALUEOF LICENSES ISSUED
WAS USED11.626.910 € VALUE OF LICENSES ISSUED IN EUROS
EXPORTS DECLINECOMPARED TO 20102,91 EXPORTS GROWTHCOMPARED TO 2009
31LICENSESISSUED
SUB-SAHARANAFRICA
EEE11EEEEEEEEEEEEEE1000000000000000000011111
CROATIA SERBIAALBANIA
ML1
ML4
ML2
ML6
ML3
ML13
4,39%
9,28%
8,45%
2,72%
66,8%
8,29%
100%100%100%
ML220,12%
100%
100%
54,89%
45,11%
99,24%
0,76%2,49%
8,28%
89,23%
2010
20092011
64 Transfers of controlled goods may pass through two or more states covered by this report before being delivered to their final destination. For this reason, there is likely to be a considerable amout of double counting in this report, with the same transfer being reported multiple times by different states. The report should not, therefore, be used to generate an estimate of the combined value of the region’s arms exports.
REGIONAL REPORT ON ARMS EXPORTS IN 2011

65
REGIONAL REPORT ON ARMS EXPORTS IN 2011
Key a = number of licenses issued b = value of licenses issued in Euros c = value of arms exports in Euros
SUB-SAHARAN AFRICA
ML 1 ML 2 ML 3 ML 4
Albania a 2 0 1 0
b 522 132 0 48 490 0
c 189 035 0 48 490 0
Croatia a 0 0 0 0
b 0 0 0 0
c 0 0 0 0
Serbia a 8 2 10 2
b 1 436 862 807 267 6 851 811 887 084
c 230 046 807 267 6 330 561 887 084
TOTAL PER ML category a 10 2 11 2
b 1 958 994 807 267 6 900 301 887 084
c 419 081 807 267 6 379 051 887 084
SUB-SAHARAN AFRICA
ML 6 ML 13 ML 22 TOTAL per destination
Albania a 0 0 0 3
b 0 0 0 570 622
c 0 0 0 237 525
Croatia a 0 4 0 4
b 0 791 739 0 791 739
c 0 791 739 0 791 739
Serbia a 0 0 1 24
b 260 325 0 21 200 10 264 549
c 260 325 0 11 720 8 527 003
TOTAL PER ML category a 0 4 1 31
b 260 325 791 739 21 200 11 626 910
c 260 325 791 739 11 720 9 556 267
Key a = number of licenses issued b = value of licenses issued in Euros c = value of arms exports in Euros

66
REGIONAL REPORT ON ARMS EXPORTS IN 2011
III. TABLE SHOWING EXPORTS TO UNITED NATIONS-MANDATED OR OTHER INTERNATIONAL MISSIONS IN 2011
Destination country:
Kosovo*
EXPORTING STATE UNITED NATIONS-MANDATED OR OTHER INTERNATIONAL MISSIONS
DESCRIPTION OF GOODS
The former Yugoslav Republic of Macedonia
United Nations Mission to Kosovo (UNMIK)
Pepper Spray
Cyprus
EXPORTING STATE UNITED NATIONS-MANDATED OR OTHER INTERNATIONAL MISSIONS
DESCRIPTION OF GOODS
Republic of Serbia United Nations to Cyprus (UNFICYP)
Rifles, pistols, protective equipment
Cyprus
EXPORTING STATE UNITED NATIONS-MANDATED OR OTHER INTERNATIONAL MISSIONS
DESCRIPTION OF GOODS
Republic of Serbia United Nations Interim Force in Lebanon (UNFIL)
Rifles, pistols, protective equipment
* This designation is without prejudice to positions on status, and is in line with UNSC 1244 and the ICJ Opinion on the Kosovo Declaration of Independence.

67
REGIONAL REPORT ON ARMS EXPORTS IN 2011
IV. INFORMATION ON NATIONAL LEGISLATION RELEVANT TO ARMS EXPORT CONTROL
STATE NATIONAL LEGISLATION EU CODE OF CONDUCT / EU COMMON POSITION
BROKERING PROVISIONS
Republic of Albania Law No. 9707, date 5.4.2007 “On State Export Control of Arms Transfer, Dual Use Goods and Related Technologies”.
The Council of Ministers Decision No.43, date 16.01.2008 “On organizing, function and status of State Export Control Authority”
The Council of Ministers Decision 106, on 9.2.2011: “On the approval of the updated lists of military goods and related technologies with dual use, which undergo the import-export state control”.
The Council of Ministers’ Decision 305, on 25.3.2009 “On the designating procedure, regarding the issuing of assured legal documents in the field of state control activities of import-export, military goods, and related technologies of dual use”.
The Council of Ministers’ Decision 304, on 25.3.2009 “On the designating procedures regarding expertise’s fulfillment and the control by the State Control Authority of Exports”.
The Council of Ministers’ Decision 604, on 28.8.2003 “On approval, in principle, of code of conduct of European Union on weapons exports”.
The Council of Ministers’ Decision 341, 8.4.2009 “On designating fees for issued legal documents”.
The Council of Ministers’ Decision 76, on 30.12.2008 “On designated format, schedules and presentation time of reports”.
The Council of Ministers’ Decision 604, on 28.8.2003 “On approval, in principle, of code of conduct of European Union on weapons exports”.
Intention to be aligned with the Council’s Common Position 2008/944/CFSP.
Law No. 9707, date 5.4.2007 “On State Export Control of Arms Transfer, Dual Use Goods and Related Technologies”.
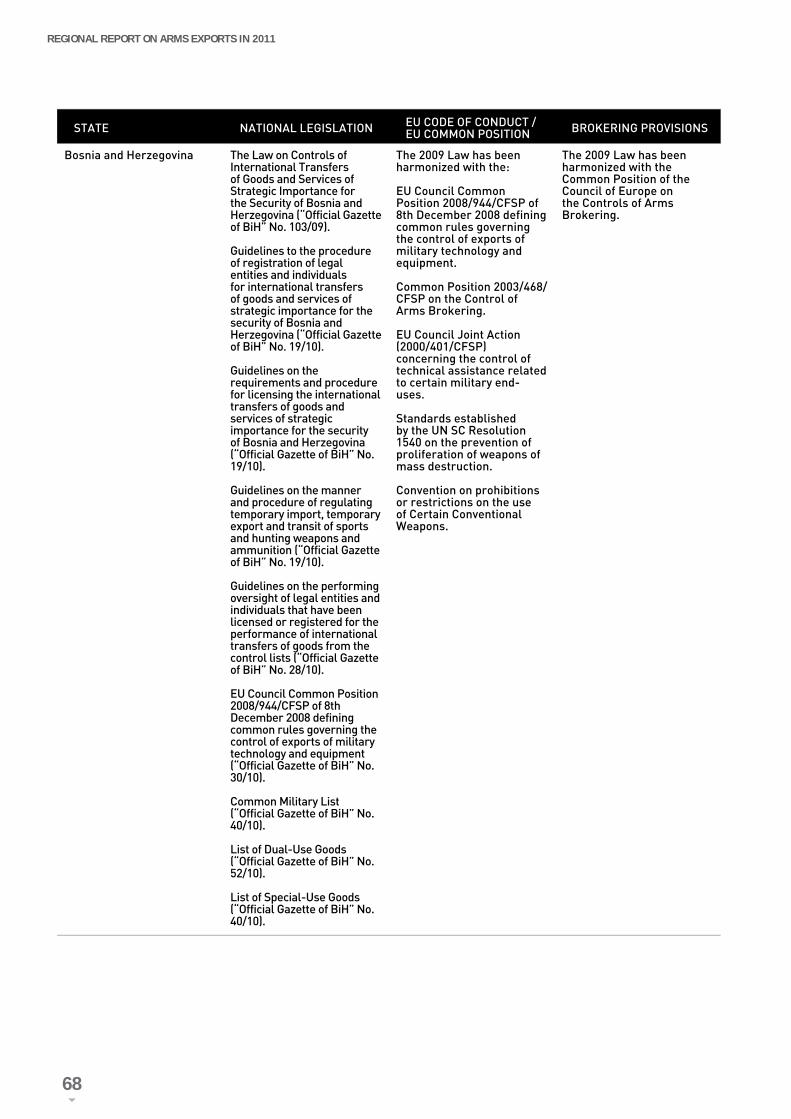
68
REGIONAL REPORT ON ARMS EXPORTS IN 2011
STATE NATIONAL LEGISLATION EU CODE OF CONDUCT / EU COMMON POSITION BROKERING PROVISIONS
Bosnia and Herzegovina The Law on Controls of International Transfers of Goods and Services of Strategic Importance for the Security of Bosnia and Herzegovina (“Official Gazette of BiH” No. 103/09).
Guidelines to the procedure of registration of legal entities and individuals for international transfers of goods and services of strategic importance for the security of Bosnia and Herzegovina (“Official Gazette of BiH” No. 19/10).
Guidelines on the requirements and procedure for licensing the international transfers of goods and services of strategic importance for the security of Bosnia and Herzegovina (“Official Gazette of BiH” No. 19/10).
Guidelines on the manner and procedure of regulating temporary import, temporary export and transit of sports and hunting weapons and ammunition (“Official Gazette of BiH” No. 19/10).
Guidelines on the performing oversight of legal entities and individuals that have been licensed or registered for the performance of international transfers of goods from the control lists (“Official Gazette of BiH” No. 28/10).
EU Council Common Position 2008/944/CFSP of 8th December 2008 defining common rules governing the control of exports of military technology and equipment (“Official Gazette of BiH” No. 30/10).
Common Military List (“Official Gazette of BiH” No. 40/10).
List of Dual-Use Goods (“Official Gazette of BiH” No. 52/10).
List of Special-Use Goods (“Official Gazette of BiH” No. 40/10).
The 2009 Law has been harmonized with the:
EU Council Common Position 2008/944/CFSP of 8th December 2008 defining common rules governing the control of exports of military technology and equipment.
Common Position 2003/468/CFSP on the Control of Arms Brokering.
EU Council Joint Action (2000/401/CFSP) concerning the control of technical assistance related to certain military end-uses.
Standards established by the UN SC Resolution 1540 on the prevention of proliferation of weapons of mass destruction.
Convention on prohibitions or restrictions on the use of Certain Conventional Weapons.
The 2009 Law has been harmonized with the Common Position of the Council of Europe on the Controls of Arms Brokering.

69
REGIONAL REPORT ON ARMS EXPORTS IN 2011
STATE NATIONAL LEGISLATION EU CODE OF CONDUCT / EU COMMON POSITION BROKERING PROVISIONS
Republic of Croatia Exports of weapons provided under the List of Weapons and Military Equipment (which is harmonized each year with the EU Military List) and weapons regulated under the National List of Non-military Weapons (hunting and sports weapons which are not included in the Military List) in the Republic of Croatia are regulated by the Law on Import and Export of Military and Non-Military Lethal Goods, published in the Official Gazette of RH (NN 86/2008).
The Law is harmonized with the EU Council Common Position defining common rules governing the control of exports of military technology and equipment.
The Law is harmonized with the Common Position of the Council of Europe on the Controls of Arms Brokering.

70
REGIONAL REPORT ON ARMS EXPORTS IN 2011
STATE NATIONAL LEGISLATION EU CODE OF CONDUCT / EU COMMON POSITION
BROKERING PROVISIONS
The former Yugoslav Republic of Macedonia
The Law on Foreign Trade (Official Gazette of the RM No. 45, 28 June 2002).
The Law on the Production of, and Trade In, the Arms and Military Equipment (Official Gazette of the RM No. 54, 15 July 2002).
Law on weapons (“Official Gazzete of the Republic of Macedonia, No.7/05,47/06, 42/07,86/08, 72/10,158/2011) and pursuant to the Article 22 of the Law Amending the Law on Weapons (Official Gazette of the Republic of Macedonia No. 142/2010), the Legislative Commission, adopted the official consolidated text of the Law on Weapons.
Unilaterally aligned with the EU Code of Conduct in November 2004.
Unilaterally aligned with the EU Common Position in July 2010.
The Law on Foreign Trade (Official Gazette of the RM No. 45, 28 June 2002).
The Law on the Production of, and Trade In, the Arms and Military Equipment (Official Gazette of the RM No. 54, 15 July 2002).
Specific legislation is being developed.
Unilaterally aligned with the EU Common Position 2003/468/ CFSP on the Control of Arms Brokering in June 2005.

71
REGIONAL REPORT ON ARMS EXPORTS IN 2011
STATE NATIONAL LEGISLATION EU Code of Conduct / EU Common Position
BROKERING PROVISIONS
Republic of Serbia Law on Foreign Trade in Weapons, Military Equipment and Dual-Use Goods (“Official Journal of Serbia and Montenegro”, nr. 7/05).
EU Code of Conduct on Arms Exports has been incorporated in the bylaw – Decree on the Licensing Criteria for Exports of Arms, Military Equipment and Dual-Use Goods (“Official Journal of SCG”, no.11/05).
On 20th November 2008 the Government of the Republic of Serbia adopted a Decision on accepting the criteria from the EU Code of Conduct on Arms Export and officially informed the EU Council’s General Secretariat thereof on 25th November 2008.
Provisions of Art. 6. item 4) of the Law define the scope of foreign trade, including ‘...mediation (brokering) re-export ... and other services ...’.
Art. 9 of the Law sets down that foreign trade is subject to a license from the competent ministry.
Art. 12, par. 1. prescribes a Register of persons that may perform foreign trade in controlled goods.
Art. 28, par. 1. prescribes maintaining a database.
Art. 34 prescribes keeping foreign transfers documentation for 10 years - which is in accordance with Art. 3. and Art. 4. of the EU Council’s Common Position (2003/468/CFSP) and the recommendation to perform export controls in the area of arms brokering according to the national legislation. These controls are carried out in the territory of the Republic of Serbia.


73
REGIONAL REPORT ON ARMS EXPORTS IN 2011
V. TABLE OF REGIONAL ACTIVITIES IN WHICH STATES PARTICIPATED DURING 20111
1 The table only includes activities related to arms export controls in which at least two states in the region participated.
HOST COUNTRY & DATE PARTICIPANTS STATE OR ORGANIZATION SUPPORTING THE ACTIVITY
DESCRIPTION OF THE ACTIVITY
Zagreb, Croatia 28 February-3 March 2011
Albania, Bosnia and Herzegovina, Croatia
RACVIAC Workshop; Regional Seminar on the Prohibition of Chemical Weapons
Zagreb, Croatia 17 March 2011
Albania, Bosnia and Herzegovina, Croatia, Serbia, the former Yugoslavia Republic of Macedonia
SEESAC 4th Meeting of the Regional Information Exchange Process on Arms Export Controls
Athens, United States of America28 March – 8 April 2011
Croatia, Serbia EXBS Training for the Implementation of Export Control of Military and Dual-Use
Podgorica, Montenegro4-5 May 2011
Albania, Bosnia and Herzegovina, Croatia, Serbia, the former Yugoslavia Republic of Macedonia
COARM and BAFA Workshop on Export Controls
Singapore 24-25 May 2011
Bosnia and Herzegovina, Croatia
12th International Conference on Exports Control
Jahorina, Bosnia and Herzegovina8-9 June 2011
Bosnia and Herzegovina, Croatia
EU and BAFA EU Cooperation in Export Control on Dual-Use Goods, Interagency Seminar on Dual-Use Export Controls
Budva, Montenegro23 June 2011
Albania, Bosnia and Herzegovina, Croatia, Serbia, the former Yugoslavia Republic of Macedonia
SEESAC 5th Meeting of the Regional Information Exchange Process on Arms Export Controls
Cavtat, Croatia 19-20 October 2011
Albania, Bosnia and Herzegovina, Croatia, Serbia
BAFA and RACVIAC Violation on Export Controls
Rakitje, Croatia 24-27 October 2011
Bosnia and Herzegovina, Croatia, Serbia
RACVIAC and OSCE SALW/Conventional Armament Workshop
Belgrade, Serbia9-10 November 2011
Albania, Bosnia and Herzegovina, Croatia, Serbia, the former Yugoslavia Republic of Macedonia
SEESAC 6th Meeting of the Regional Information Exchange Process on Arms Export Controls
Ispra, Italy 15-16 November 2011
Bosnia and Herzegovina, Croatia, Serbia
European Commission Joint Research Centre
Workshop on Technical Issues Related to the Implementation of the EU Export Control Regime for Dual-Use Goods

74
REGIONAL REPORT ON ARMS EXPORTS IN 2011
VI. TABLE SHOWING INTERNET ADDRESSES AND CONTACT DETAILS OF NATIONAL AUTHORITIES RESPONSIBLE FOR ARMS EXPORT CONTROL
STATE INSTITUTION CONTACT DETAILS WEBSITE
Republic of Albania State Export Contol Authority
Adress: Rr. “Skënderbej”, Pall, 4 Kati V, Tiranë, Albania.Tel/Fax: +35542416096Email: info_akshe@mod. gov.al
www.akshe.gov.al
Bosnia and Herzegovina Ministry of Foreign Trade and Economic Relations
Address: Sarajevo, Musala 9 Tel: +387 33 220 546
www.mvteo.gov.ba
Ministry of Defence Address: Sarajevo, Hamdije Kreševljakovića 98Tel: +387 33 286 545
www.mod.gov.ba
Ministry of Foreign Affairs Address: Sarajevo, Musala 2 Tel: +387 33 281 100
www.mfa.gov.ba
Ministry of Security Address: Sarajevo, Trg BiH 2 Tel: +387 33 213 623
www.msb.gov.ba
Republic of Croatia Ministry of Economyi Address: Ulica grada Vukovara 78, 10 000 Zagreb,Tel: +385 1 610 61 11
www.mingo.hr
Republic of Serbia Ministry of Foreign and Internal Trade and Telecommunications
Address: Belgrade, Nemanjina 22-24Tel: (+381 11) 2 642 115;
363 1511Fax: (+381 11) 2642 108;
2642 119E-mail: [email protected]
www.mtt.gov.rs
Ministry of Foreign Affairs Address: Security Policy Sector,Arms Control and Defence Cooperation Section Kneza Miloša 24BelgradeTel: +381 (11) 30 68 936Fax: +381 (11) 30 68 927Mail: [email protected]
www.mfa.gov.rs
Ministry of Defence Address: Material Resources SectorNemanjina 15, BelgradeTel: +381 (11) 2059 029Fax: +381 (11) 3006 221
www.mod.gov.rs
Ministry of Internal Affairs Address: Emergency Management Sector,Department for PreventionUl. Kneza Miloša br. 101BelgradeTel: +381 (11) 3612 913 mob: +381 64 892 4239
www.mup.gov.rs
i The Ministry of Economy issues arms export licences on the basis of a consensus of the members of the Commission, which is composed of the representatives of ministries for foreign affairs, interior, defense and economy.

75
REGIONAL REPORT ON ARMS EXPORTS IN 2011
STATE INSTITUTION CONTACT DETAILS WEBSITE
The formerYugoslav Republic of Macedonia
Ministry of Foreign Affairs E-mail: geleva#mfa.gov.mk Tel: +389 23 124 077Fax: +389 23 115 790
www.mfa.gov.mk
Ministry of Interior E-mail: [email protected]. +389 2 3238595 ;
+389 2 3226012Fax. +389 2 3142788
www.moi.gov.mk
Ministry of Defence E-mail: [email protected]: +389 328 22 55
www.morm.gov.mk

CIP - Каталогизација у публикацијиНародна библиотека Србије, Београд
339.564:623.44(497)”2011”(083.41)
REGIONAL Report on Arms Exports in 2011.- Beograd : SEESAC, 2013 (Beograd : Grafi kcentar). - 75 str. : tabele ; 30 cm
Tiraž 200.
ISBN 978-86-7728-182-3
a) Оружје - Извоз - Балканске државе - 2011- СтатистикаCOBISS.SR-ID 202218508