Embed Size (px)
Citation preview
1
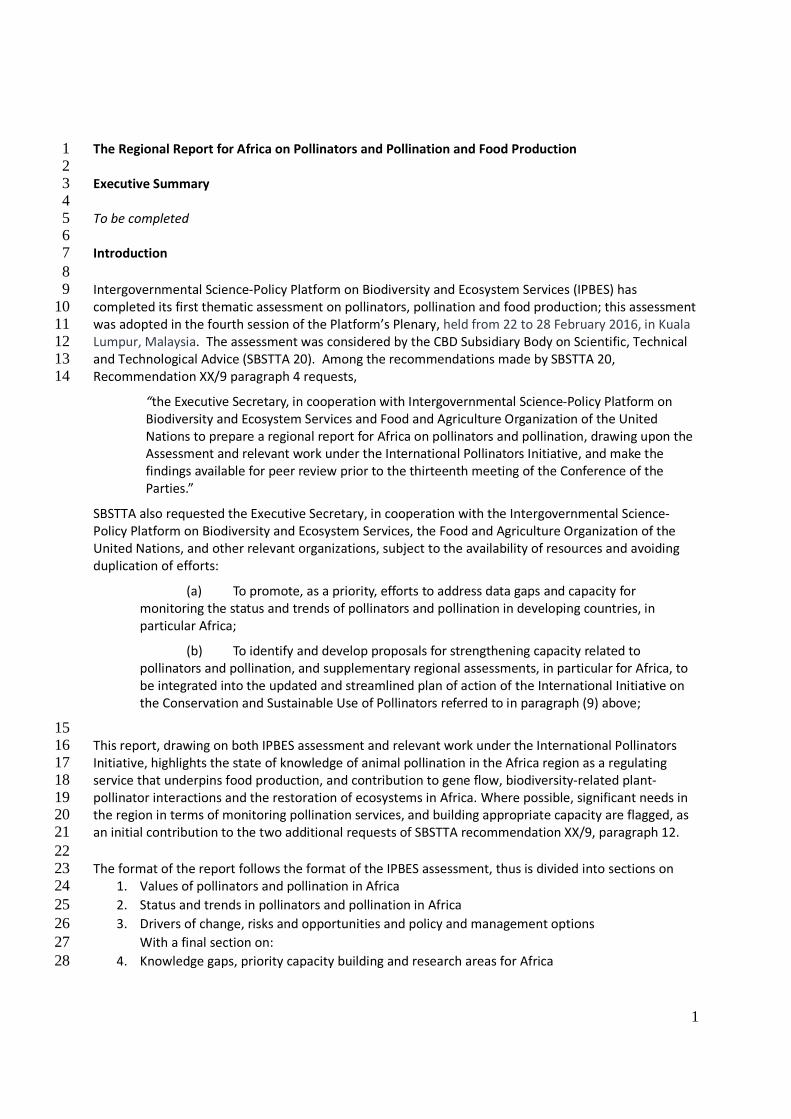
The Regional Report for Africa on Pollinators and Pollination and Food Production 1 2 Executive Summary 3 4 To be completed 5 6 Introduction 7 8 Intergovernmental Science-Policy Platform on Biodiversity and Ecosystem Services (IPBES) has 9 completed its first thematic assessment on pollinators, pollination and food production; this assessment 10 was adopted in the fourth session of the Platform’s Plenary, held from 22 to 28 February 2016, in Kuala 11 Lumpur, Malaysia. The assessment was considered by the CBD Subsidiary Body on Scientific, Technical 12 and Technological Advice (SBSTTA 20). Among the recommendations made by SBSTTA 20, 13 Recommendation XX/9 paragraph 4 requests, 14
“the Executive Secretary, in cooperation with Intergovernmental Science-Policy Platform on
Biodiversity and Ecosystem Services and Food and Agriculture Organization of the United
Nations to prepare a regional report for Africa on pollinators and pollination, drawing upon the
Assessment and relevant work under the International Pollinators Initiative, and make the
findings available for peer review prior to the thirteenth meeting of the Conference of the
Parties.”
SBSTTA also requested the Executive Secretary, in cooperation with the Intergovernmental Science-
Policy Platform on Biodiversity and Ecosystem Services, the Food and Agriculture Organization of the
United Nations, and other relevant organizations, subject to the availability of resources and avoiding
duplication of efforts:
(a) To promote, as a priority, efforts to address data gaps and capacity for
monitoring the status and trends of pollinators and pollination in developing countries, in
particular Africa;
(b) To identify and develop proposals for strengthening capacity related to
pollinators and pollination, and supplementary regional assessments, in particular for Africa, to
be integrated into the updated and streamlined plan of action of the International Initiative on
the Conservation and Sustainable Use of Pollinators referred to in paragraph (9) above;
15 This report, drawing on both IPBES assessment and relevant work under the International Pollinators 16 Initiative, highlights the state of knowledge of animal pollination in the Africa region as a regulating 17 service that underpins food production, and contribution to gene flow, biodiversity-related plant-18 pollinator interactions and the restoration of ecosystems in Africa. Where possible, significant needs in 19 the region in terms of monitoring pollination services, and building appropriate capacity are flagged, as 20 an initial contribution to the two additional requests of SBSTTA recommendation XX/9, paragraph 12. 21 22 The format of the report follows the format of the IPBES assessment, thus is divided into sections on 23
1. Values of pollinators and pollination in Africa 24 2. Status and trends in pollinators and pollination in Africa 25 3. Drivers of change, risks and opportunities and policy and management options 26
With a final section on: 27 4. Knowledge gaps, priority capacity building and research areas for Africa 28
2
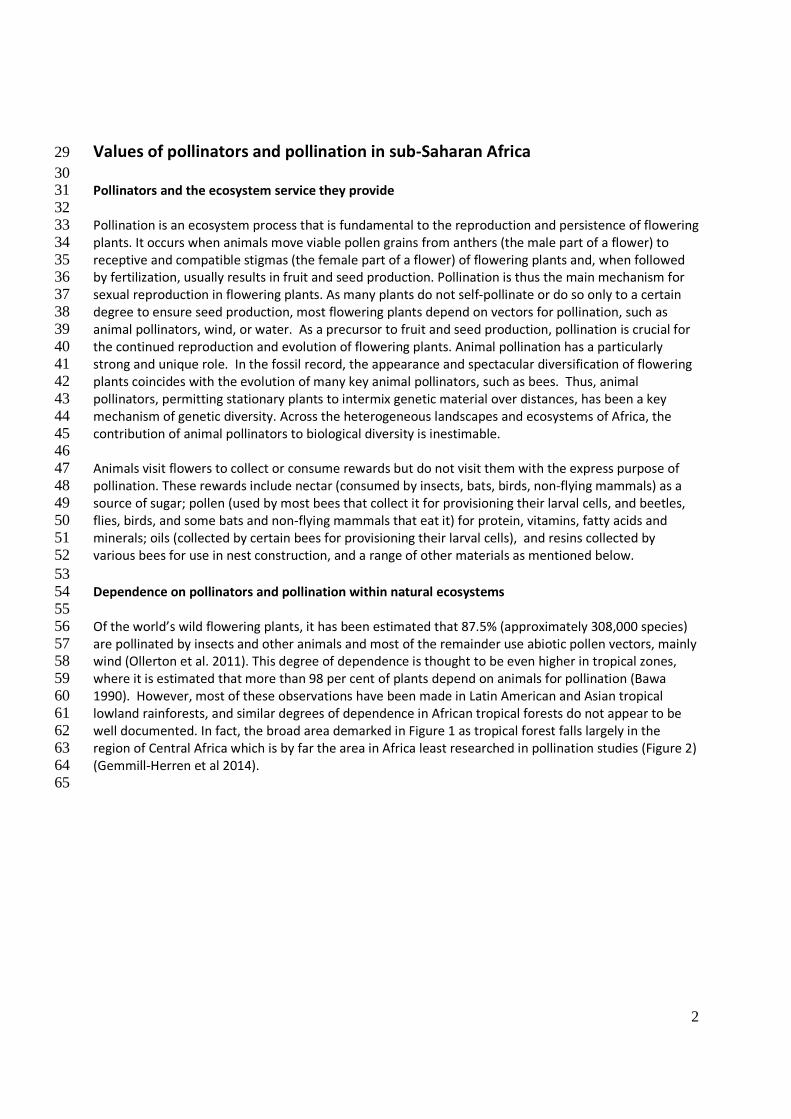
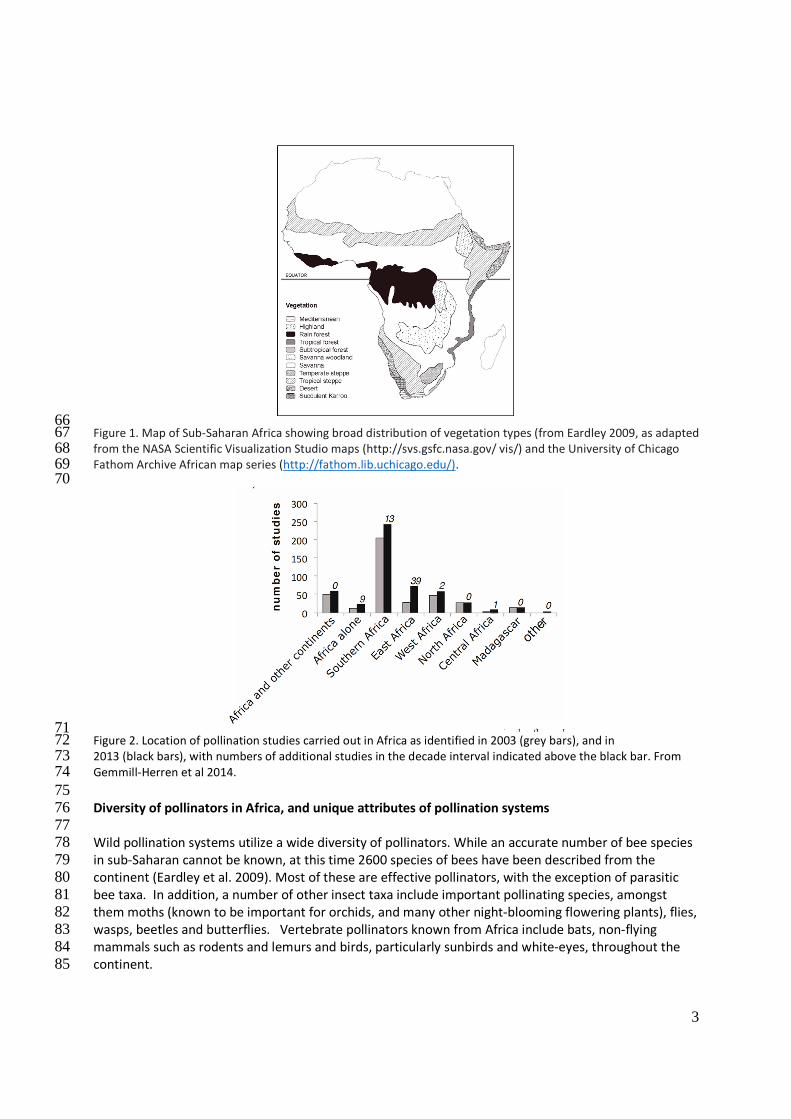
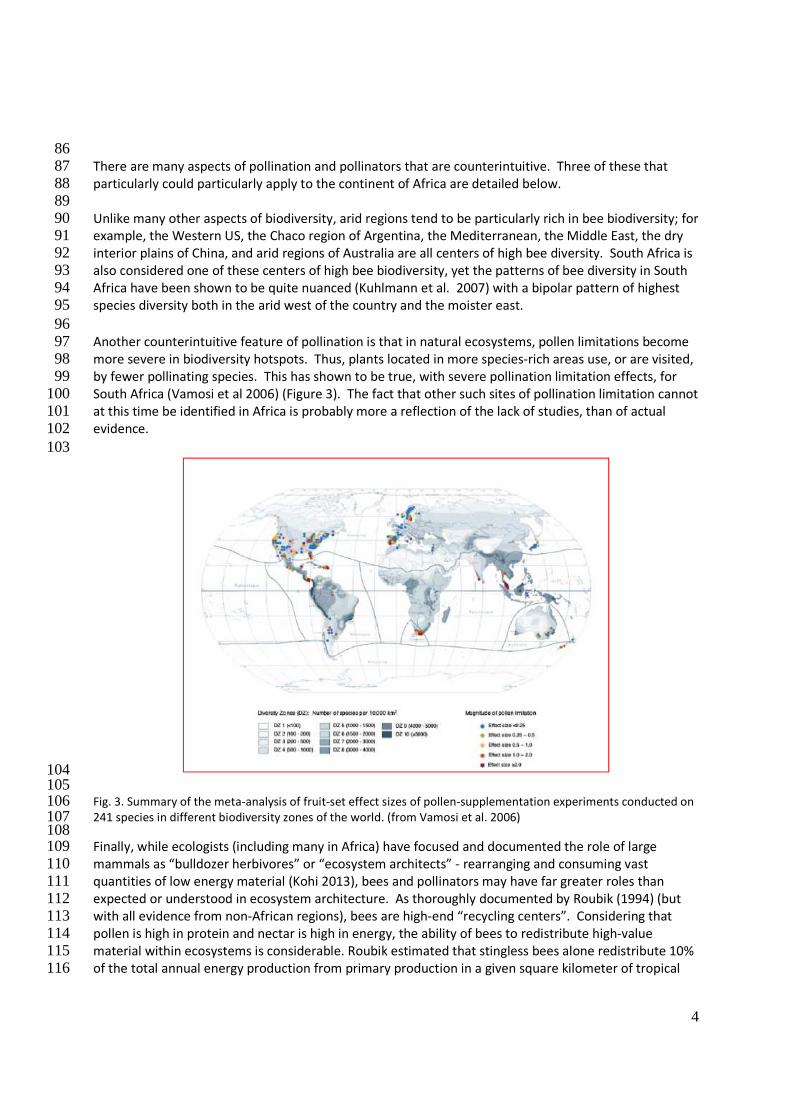
Values of pollinators and pollination in sub-Saharan Africa 29 30 Pollinators and the ecosystem service they provide 31 32 Pollination is an ecosystem process that is fundamental to the reproduction and persistence of flowering 33 plants. It occurs when animals move viable pollen grains from anthers (the male part of a flower) to 34 receptive and compatible stigmas (the female part of a flower) of flowering plants and, when followed 35 by fertilization, usually results in fruit and seed production. Pollination is thus the main mechanism for 36 sexual reproduction in flowering plants. As many plants do not self-pollinate or do so only to a certain 37 degree to ensure seed production, most flowering plants depend on vectors for pollination, such as 38 animal pollinators, wind, or water. As a precursor to fruit and seed production, pollination is crucial for 39 the continued reproduction and evolution of flowering plants. Animal pollination has a particularly 40 strong and unique role. In the fossil record, the appearance and spectacular diversification of flowering 41 plants coincides with the evolution of many key animal pollinators, such as bees. Thus, animal 42 pollinators, permitting stationary plants to intermix genetic material over distances, has been a key 43 mechanism of genetic diversity. Across the heterogeneous landscapes and ecosystems of Africa, the 44 contribution of animal pollinators to biological diversity is inestimable. 45 46 Animals visit flowers to collect or consume rewards but do not visit them with the express purpose of 47 pollination. These rewards include nectar (consumed by insects, bats, birds, non-flying mammals) as a 48 source of sugar; pollen (used by most bees that collect it for provisioning their larval cells, and beetles, 49 flies, birds, and some bats and non-flying mammals that eat it) for protein, vitamins, fatty acids and 50 minerals; oils (collected by certain bees for provisioning their larval cells), and resins collected by 51 various bees for use in nest construction, and a range of other materials as mentioned below. 52 53 Dependence on pollinators and pollination within natural ecosystems 54 55 Of the world’s wild flowering plants, it has been estimated that 87.5% (approximately 308,000 species) 56 are pollinated by insects and other animals and most of the remainder use abiotic pollen vectors, mainly 57 wind (Ollerton et al. 2011). This degree of dependence is thought to be even higher in tropical zones, 58 where it is estimated that more than 98 per cent of plants depend on animals for pollination (Bawa 59 1990). However, most of these observations have been made in Latin American and Asian tropical 60 lowland rainforests, and similar degrees of dependence in African tropical forests do not appear to be 61 well documented. In fact, the broad area demarked in Figure 1 as tropical forest falls largely in the 62 region of Central Africa which is by far the area in Africa least researched in pollination studies (Figure 2) 63 (Gemmill-Herren et al 2014). 64 65
3
66 Figure 1. Map of Sub-Saharan Africa showing broad distribution of vegetation types (from Eardley 2009, as adapted 67 from the NASA Scientific Visualization Studio maps (http://svs.gsfc.nasa.gov/ vis/) and the University of Chicago 68 Fathom Archive African map series (http://fathom.lib.uchicago.edu/). 69
70
71 Figure 2. Location of pollination studies carried out in Africa as identified in 2003 (grey bars), and in 72 2013 (black bars), with numbers of additional studies in the decade interval indicated above the black bar. From 73 Gemmill-Herren et al 2014. 74 75 Diversity of pollinators in Africa, and unique attributes of pollination systems 76 77 Wild pollination systems utilize a wide diversity of pollinators. While an accurate number of bee species 78 in sub-Saharan cannot be known, at this time 2600 species of bees have been described from the 79 continent (Eardley et al. 2009). Most of these are effective pollinators, with the exception of parasitic 80 bee taxa. In addition, a number of other insect taxa include important pollinating species, amongst 81 them moths (known to be important for orchids, and many other night-blooming flowering plants), flies, 82 wasps, beetles and butterflies. Vertebrate pollinators known from Africa include bats, non-flying 83 mammals such as rodents and lemurs and birds, particularly sunbirds and white-eyes, throughout the 84 continent. 85
4
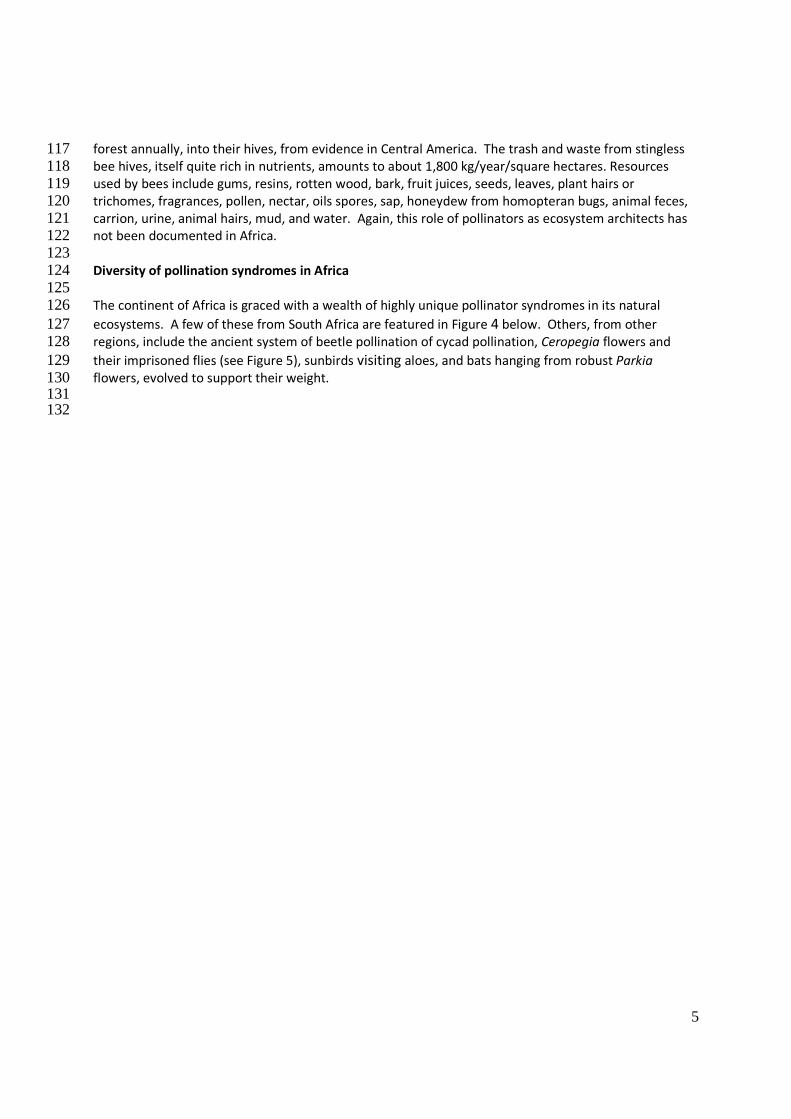
86 There are many aspects of pollination and pollinators that are counterintuitive. Three of these that 87 particularly could particularly apply to the continent of Africa are detailed below. 88 89 Unlike many other aspects of biodiversity, arid regions tend to be particularly rich in bee biodiversity; for 90 example, the Western US, the Chaco region of Argentina, the Mediterranean, the Middle East, the dry 91 interior plains of China, and arid regions of Australia are all centers of high bee diversity. South Africa is 92 also considered one of these centers of high bee biodiversity, yet the patterns of bee diversity in South 93 Africa have been shown to be quite nuanced (Kuhlmann et al. 2007) with a bipolar pattern of highest 94 species diversity both in the arid west of the country and the moister east. 95 96 Another counterintuitive feature of pollination is that in natural ecosystems, pollen limitations become 97 more severe in biodiversity hotspots. Thus, plants located in more species-rich areas use, or are visited, 98 by fewer pollinating species. This has shown to be true, with severe pollination limitation effects, for 99 South Africa (Vamosi et al 2006) (Figure 3). The fact that other such sites of pollination limitation cannot 100 at this time be identified in Africa is probably more a reflection of the lack of studies, than of actual 101 evidence. 102 103
104 105 Fig. 3. Summary of the meta-analysis of fruit-set effect sizes of pollen-supplementation experiments conducted on 106 241 species in different biodiversity zones of the world. (from Vamosi et al. 2006) 107
108 Finally, while ecologists (including many in Africa) have focused and documented the role of large 109 mammals as “bulldozer herbivores” or “ecosystem architects” - rearranging and consuming vast 110 quantities of low energy material (Kohi 2013), bees and pollinators may have far greater roles than 111 expected or understood in ecosystem architecture. As thoroughly documented by Roubik (1994) (but 112 with all evidence from non-African regions), bees are high-end “recycling centers”. Considering that 113 pollen is high in protein and nectar is high in energy, the ability of bees to redistribute high-value 114 material within ecosystems is considerable. Roubik estimated that stingless bees alone redistribute 10% 115 of the total annual energy production from primary production in a given square kilometer of tropical 116
5
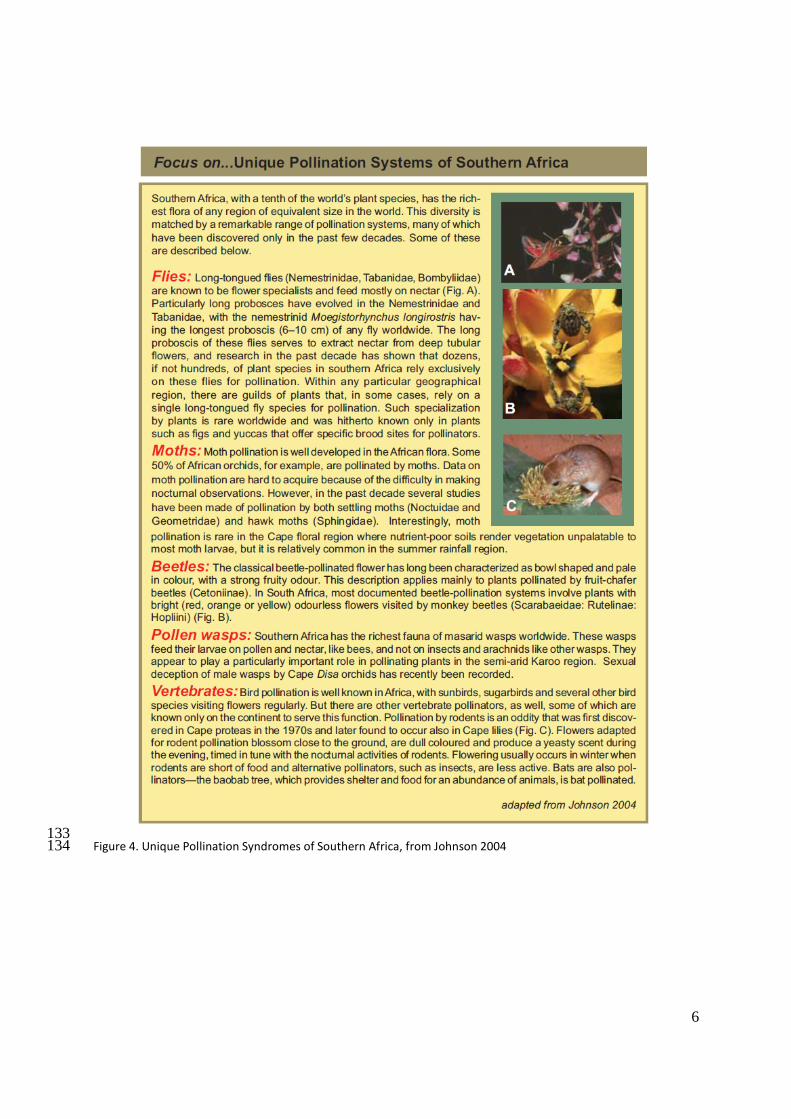
forest annually, into their hives, from evidence in Central America. The trash and waste from stingless 117 bee hives, itself quite rich in nutrients, amounts to about 1,800 kg/year/square hectares. Resources 118 used by bees include gums, resins, rotten wood, bark, fruit juices, seeds, leaves, plant hairs or 119 trichomes, fragrances, pollen, nectar, oils spores, sap, honeydew from homopteran bugs, animal feces, 120 carrion, urine, animal hairs, mud, and water. Again, this role of pollinators as ecosystem architects has 121 not been documented in Africa. 122 123 Diversity of pollination syndromes in Africa 124 125 The continent of Africa is graced with a wealth of highly unique pollinator syndromes in its natural 126 ecosystems. A few of these from South Africa are featured in Figure 4 below. Others, from other 127 regions, include the ancient system of beetle pollination of cycad pollination, Ceropegia flowers and 128 their imprisoned flies (see Figure 5), sunbirds visiting aloes, and bats hanging from robust Parkia 129 flowers, evolved to support their weight. 130 131 132
6
133 Figure 4. Unique Pollination Syndromes of Southern Africa, from Johnson 2004 134
7
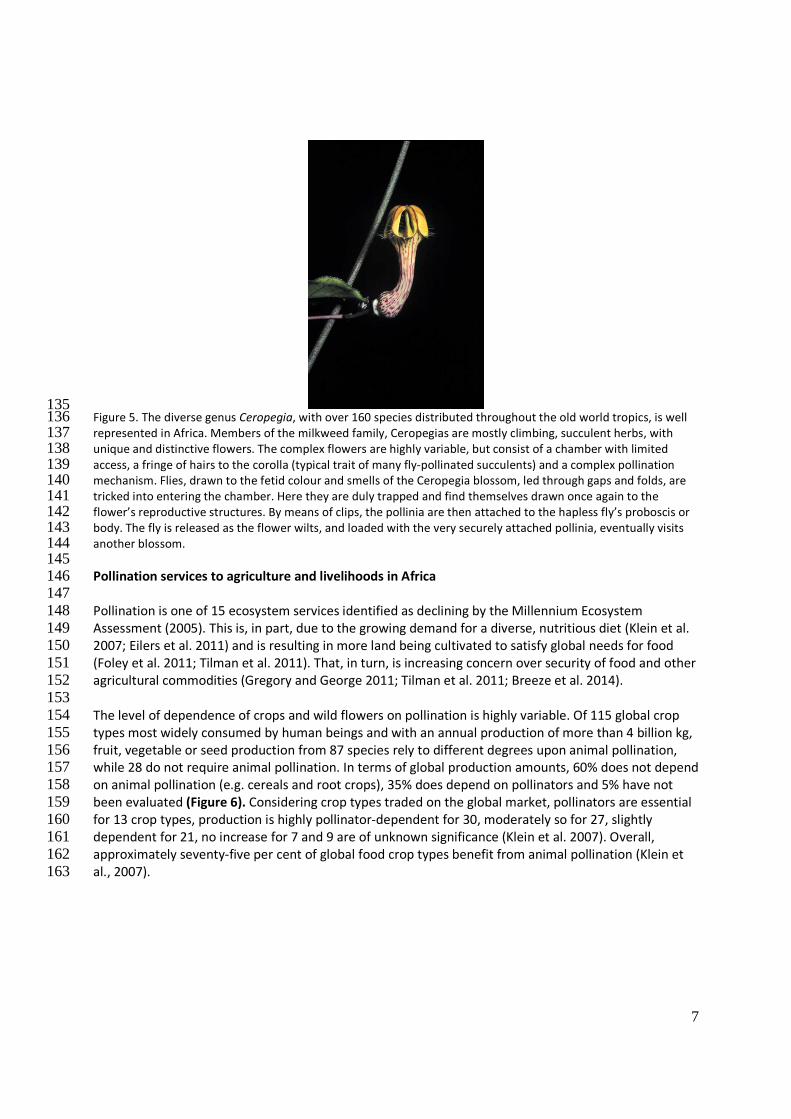
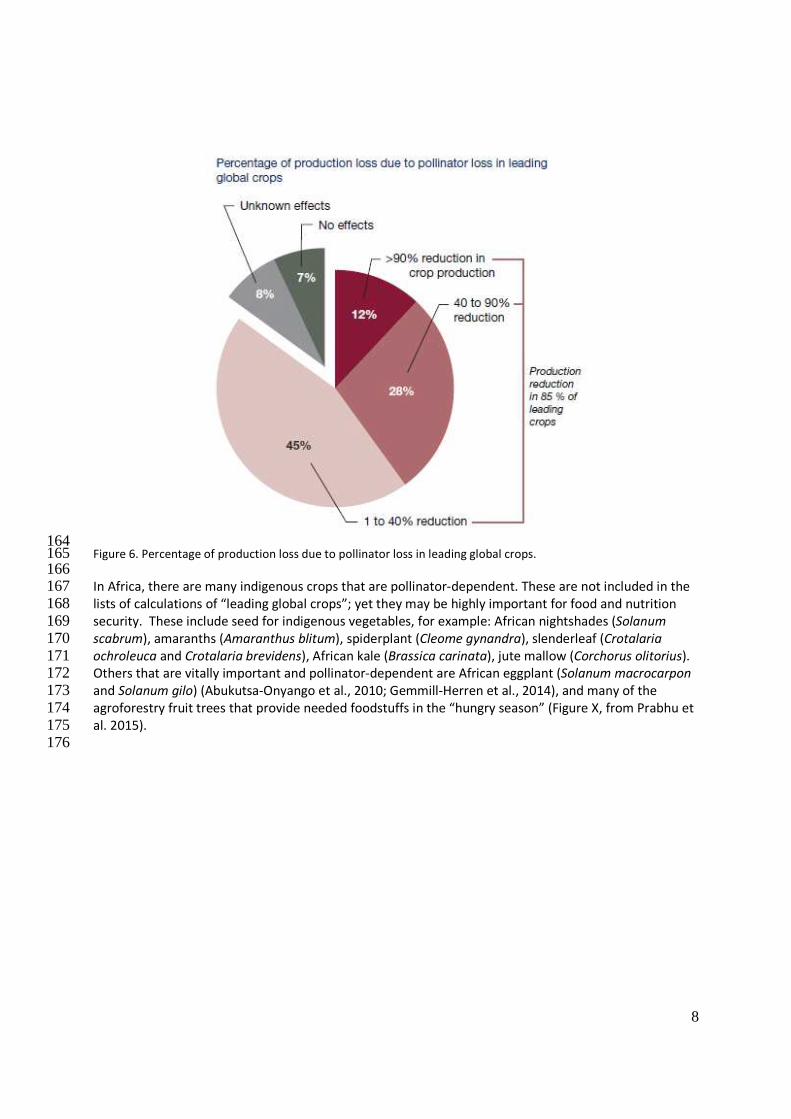
135 Figure 5. The diverse genus Ceropegia, with over 160 species distributed throughout the old world tropics, is well 136 represented in Africa. Members of the milkweed family, Ceropegias are mostly climbing, succulent herbs, with 137 unique and distinctive flowers. The complex flowers are highly variable, but consist of a chamber with limited 138 access, a fringe of hairs to the corolla (typical trait of many fly-pollinated succulents) and a complex pollination 139 mechanism. Flies, drawn to the fetid colour and smells of the Ceropegia blossom, led through gaps and folds, are 140 tricked into entering the chamber. Here they are duly trapped and find themselves drawn once again to the 141 flower’s reproductive structures. By means of clips, the pollinia are then attached to the hapless fly’s proboscis or 142 body. The fly is released as the flower wilts, and loaded with the very securely attached pollinia, eventually visits 143 another blossom. 144 145 Pollination services to agriculture and livelihoods in Africa 146 147 Pollination is one of 15 ecosystem services identified as declining by the Millennium Ecosystem 148 Assessment (2005). This is, in part, due to the growing demand for a diverse, nutritious diet (Klein et al. 149 2007; Eilers et al. 2011) and is resulting in more land being cultivated to satisfy global needs for food 150 (Foley et al. 2011; Tilman et al. 2011). That, in turn, is increasing concern over security of food and other 151 agricultural commodities (Gregory and George 2011; Tilman et al. 2011; Breeze et al. 2014). 152 153 The level of dependence of crops and wild flowers on pollination is highly variable. Of 115 global crop 154 types most widely consumed by human beings and with an annual production of more than 4 billion kg, 155 fruit, vegetable or seed production from 87 species rely to different degrees upon animal pollination, 156 while 28 do not require animal pollination. In terms of global production amounts, 60% does not depend 157 on animal pollination (e.g. cereals and root crops), 35% does depend on pollinators and 5% have not 158 been evaluated (Figure 6). Considering crop types traded on the global market, pollinators are essential 159 for 13 crop types, production is highly pollinator-dependent for 30, moderately so for 27, slightly 160 dependent for 21, no increase for 7 and 9 are of unknown significance (Klein et al. 2007). Overall, 161 approximately seventy-five per cent of global food crop types benefit from animal pollination (Klein et 162 al., 2007). 163
8
164 Figure 6. Percentage of production loss due to pollinator loss in leading global crops. 165
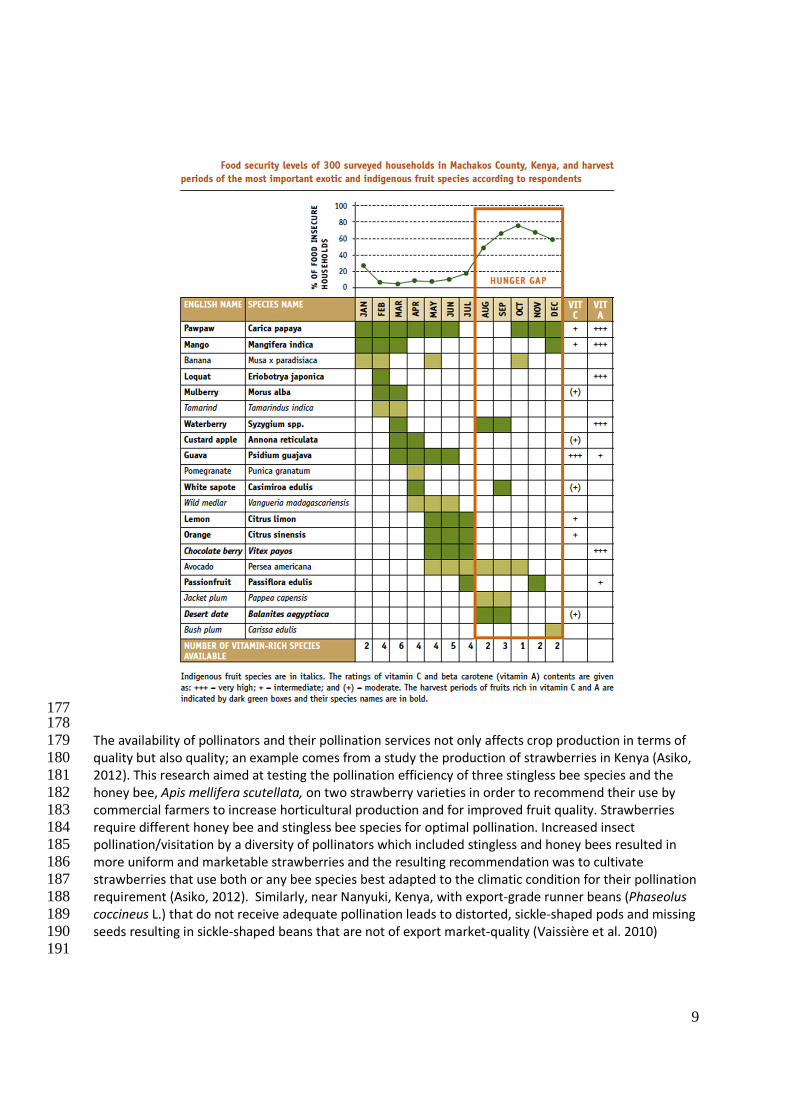
166 In Africa, there are many indigenous crops that are pollinator-dependent. These are not included in the 167 lists of calculations of “leading global crops”; yet they may be highly important for food and nutrition 168 security. These include seed for indigenous vegetables, for example: African nightshades (Solanum 169 scabrum), amaranths (Amaranthus blitum), spiderplant (Cleome gynandra), slenderleaf (Crotalaria 170 ochroleuca and Crotalaria brevidens), African kale (Brassica carinata), jute mallow (Corchorus olitorius). 171 Others that are vitally important and pollinator-dependent are African eggplant (Solanum macrocarpon 172 and Solanum gilo) (Abukutsa-Onyango et al., 2010; Gemmill-Herren et al., 2014), and many of the 173 agroforestry fruit trees that provide needed foodstuffs in the “hungry season” (Figure X, from Prabhu et 174 al. 2015). 175 176
9
177 178 The availability of pollinators and their pollination services not only affects crop production in terms of 179 quality but also quality; an example comes from a study the production of strawberries in Kenya (Asiko, 180 2012). This research aimed at testing the pollination efficiency of three stingless bee species and the 181 honey bee, Apis mellifera scutellata, on two strawberry varieties in order to recommend their use by 182 commercial farmers to increase horticultural production and for improved fruit quality. Strawberries 183 require different honey bee and stingless bee species for optimal pollination. Increased insect 184 pollination/visitation by a diversity of pollinators which included stingless and honey bees resulted in 185 more uniform and marketable strawberries and the resulting recommendation was to cultivate 186 strawberries that use both or any bee species best adapted to the climatic condition for their pollination 187 requirement (Asiko, 2012). Similarly, near Nanyuki, Kenya, with export-grade runner beans (Phaseolus 188 coccineus L.) that do not receive adequate pollination leads to distorted, sickle-shaped pods and missing 189 seeds resulting in sickle-shaped beans that are not of export market-quality (Vaissière et al. 2010) 190 191
10
Additionally, insect pollination, specifically Hypotrigona gribodoi (stingless bee) pollination, improves 192 green pepper (Capsicum annum) producing the heaviest fruits with the highest seed numbers (Kiatoco 193 et al., 2014); this study concluded that H. gribodoi is an efficient pollinator of green pepper in the 194 tropical region of East Africa. Insect pollination can also affect ripening speed for capsicums (chili 195 peppers) (Bruijn and Ravestijn, 1990); farmers are able to secure higher, off season, prices for their crop 196 through increased pollination services to the target crop. 197 198 Diversity of crop pollinators in Africa 199 200 Honey bees, Apis mellifera L., native to Africa and Eurasia (Michener 1974; Butz-Huryn 1997), have been 201 moved by people around the globe (Moritz et al. 2005) and are the most prevalent managed pollinators 202 and the dominant visitor to more than half of the world’s animal-pollinated crops (Klein et al., 2007; 203 Kleijn et al., 2015). It is well known that managed pollinators suffer from a large number of serious 204 problems, such as diseases, parasites and environmental stresses. 205 206 In a wide-ranging meta-analysis published in Science in 2013, the pollination of more than 40 crops in 207 600 fields across every populated continent was studied through a contribution of 46 scientists 208 (Garibaldi et al. 2013). It was found that wild pollinators were twice as effective as honeybees in 209 producing seeds and fruit on crops including oilseed rape, coffee, onions, almonds, tomatoes and 210 strawberries. Furthermore, bringing in managed honeybee hives did not replace wild pollination when 211 that was lost, but only supplemented the pollination that took place. The meta-analysis included only 212 one study in Kenya and two in South Africa; the least among all continents. Certainly the continent of 213 Africa merits more such studies to confirm the findings. 214
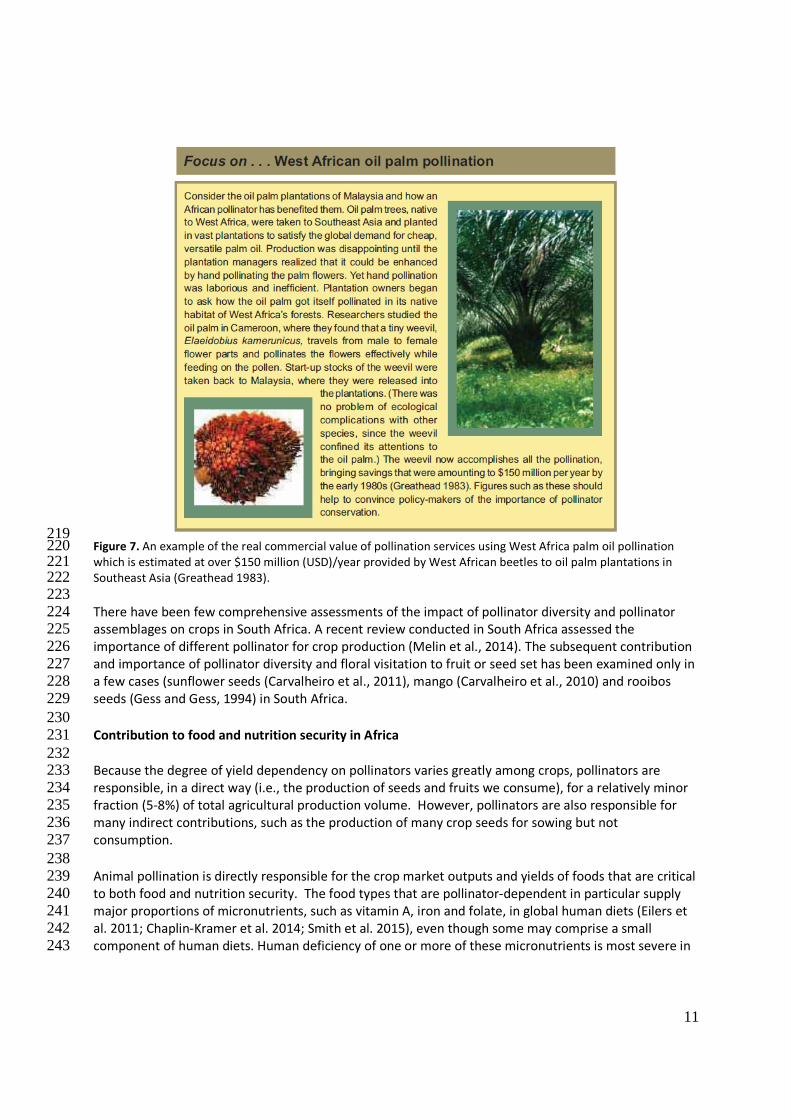
One wild pollinator originating in West Africa has made a major economic contribution to the world, the 215 oil palm weevil (Elaeidobius kamerunicus). This is a West African species that was introduced into 216 Malaysia, also contribute to the pollination of numerous leading global food crops (Greathead 1983). 217 218
11
219 Figure 7. An example of the real commercial value of pollination services using West Africa palm oil pollination 220 which is estimated at over $150 million (USD)/year provided by West African beetles to oil palm plantations in 221 Southeast Asia (Greathead 1983). 222 223 There have been few comprehensive assessments of the impact of pollinator diversity and pollinator 224 assemblages on crops in South Africa. A recent review conducted in South Africa assessed the 225 importance of different pollinator for crop production (Melin et al., 2014). The subsequent contribution 226 and importance of pollinator diversity and floral visitation to fruit or seed set has been examined only in 227 a few cases (sunflower seeds (Carvalheiro et al., 2011), mango (Carvalheiro et al., 2010) and rooibos 228 seeds (Gess and Gess, 1994) in South Africa. 229
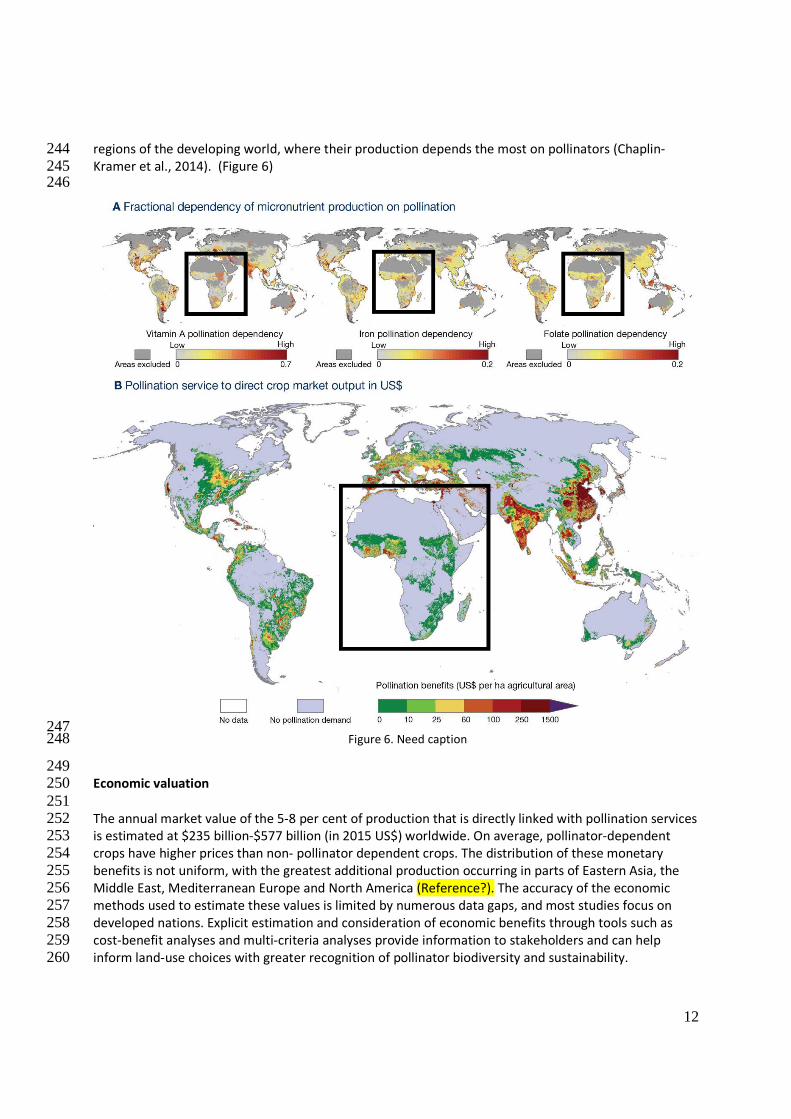
230 Contribution to food and nutrition security in Africa 231 232 Because the degree of yield dependency on pollinators varies greatly among crops, pollinators are 233 responsible, in a direct way (i.e., the production of seeds and fruits we consume), for a relatively minor 234 fraction (5-8%) of total agricultural production volume. However, pollinators are also responsible for 235 many indirect contributions, such as the production of many crop seeds for sowing but not 236 consumption. 237 238 Animal pollination is directly responsible for the crop market outputs and yields of foods that are critical 239 to both food and nutrition security. The food types that are pollinator-dependent in particular supply 240 major proportions of micronutrients, such as vitamin A, iron and folate, in global human diets (Eilers et 241 al. 2011; Chaplin-Kramer et al. 2014; Smith et al. 2015), even though some may comprise a small 242 component of human diets. Human deficiency of one or more of these micronutrients is most severe in 243
12
regions of the developing world, where their production depends the most on pollinators (Chaplin-244 Kramer et al., 2014). (Figure 6) 245 246
247 Figure 6. Need caption 248
249 Economic valuation 250 251 The annual market value of the 5-8 per cent of production that is directly linked with pollination services 252 is estimated at $235 billion-$577 billion (in 2015 US$) worldwide. On average, pollinator-dependent 253 crops have higher prices than non- pollinator dependent crops. The distribution of these monetary 254 benefits is not uniform, with the greatest additional production occurring in parts of Eastern Asia, the 255 Middle East, Mediterranean Europe and North America (Reference?). The accuracy of the economic 256 methods used to estimate these values is limited by numerous data gaps, and most studies focus on 257 developed nations. Explicit estimation and consideration of economic benefits through tools such as 258 cost-benefit analyses and multi-criteria analyses provide information to stakeholders and can help 259 inform land-use choices with greater recognition of pollinator biodiversity and sustainability. 260
13
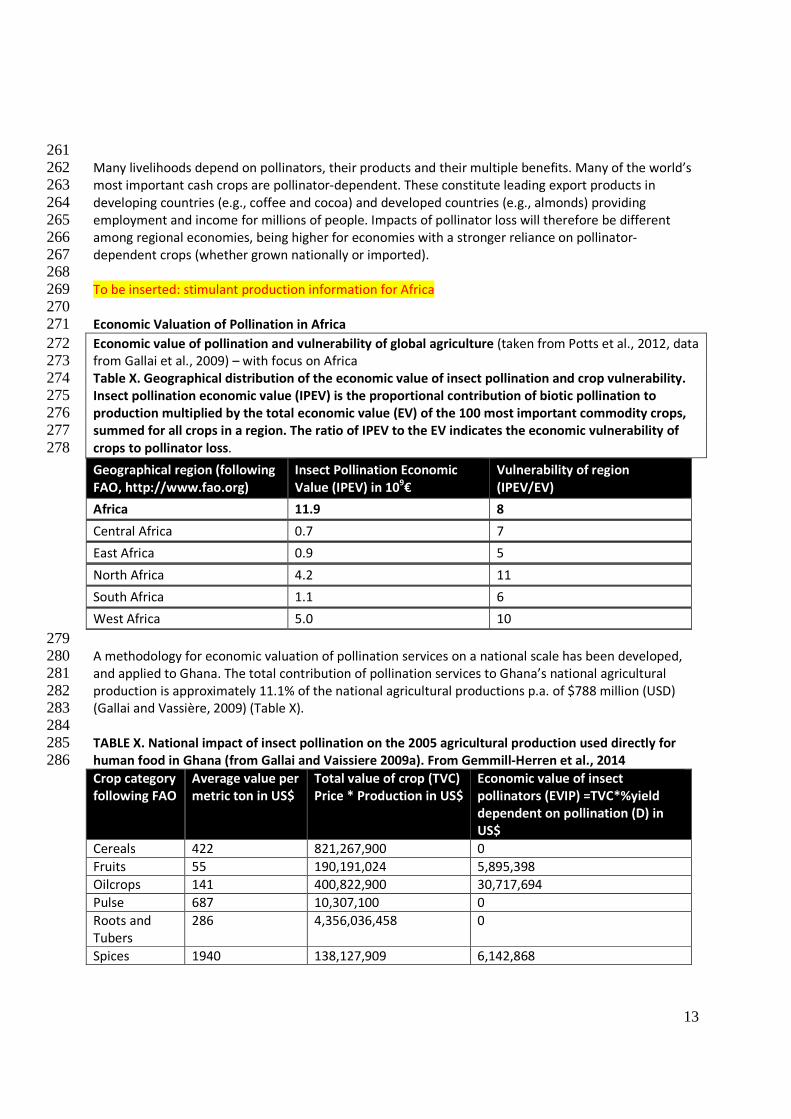
261 Many livelihoods depend on pollinators, their products and their multiple benefits. Many of the world’s 262 most important cash crops are pollinator-dependent. These constitute leading export products in 263 developing countries (e.g., coffee and cocoa) and developed countries (e.g., almonds) providing 264 employment and income for millions of people. Impacts of pollinator loss will therefore be different 265 among regional economies, being higher for economies with a stronger reliance on pollinator-266 dependent crops (whether grown nationally or imported). 267 268 To be inserted: stimulant production information for Africa 269 270 Economic Valuation of Pollination in Africa 271 Economic value of pollination and vulnerability of global agriculture (taken from Potts et al., 2012, data 272 from Gallai et al., 2009) – with focus on Africa 273 Table X. Geographical distribution of the economic value of insect pollination and crop vulnerability. 274 Insect pollination economic value (IPEV) is the proportional contribution of biotic pollination to 275 production multiplied by the total economic value (EV) of the 100 most important commodity crops, 276 summed for all crops in a region. The ratio of IPEV to the EV indicates the economic vulnerability of 277 crops to pollinator loss. 278
Geographical region (following
FAO, http://www.fao.org)
Insect Pollination Economic
Value (IPEV) in 109€
Vulnerability of region
(IPEV/EV)
Africa 11.9 8
Central Africa 0.7 7
East Africa 0.9 5
North Africa 4.2 11
South Africa 1.1 6
West Africa 5.0 10
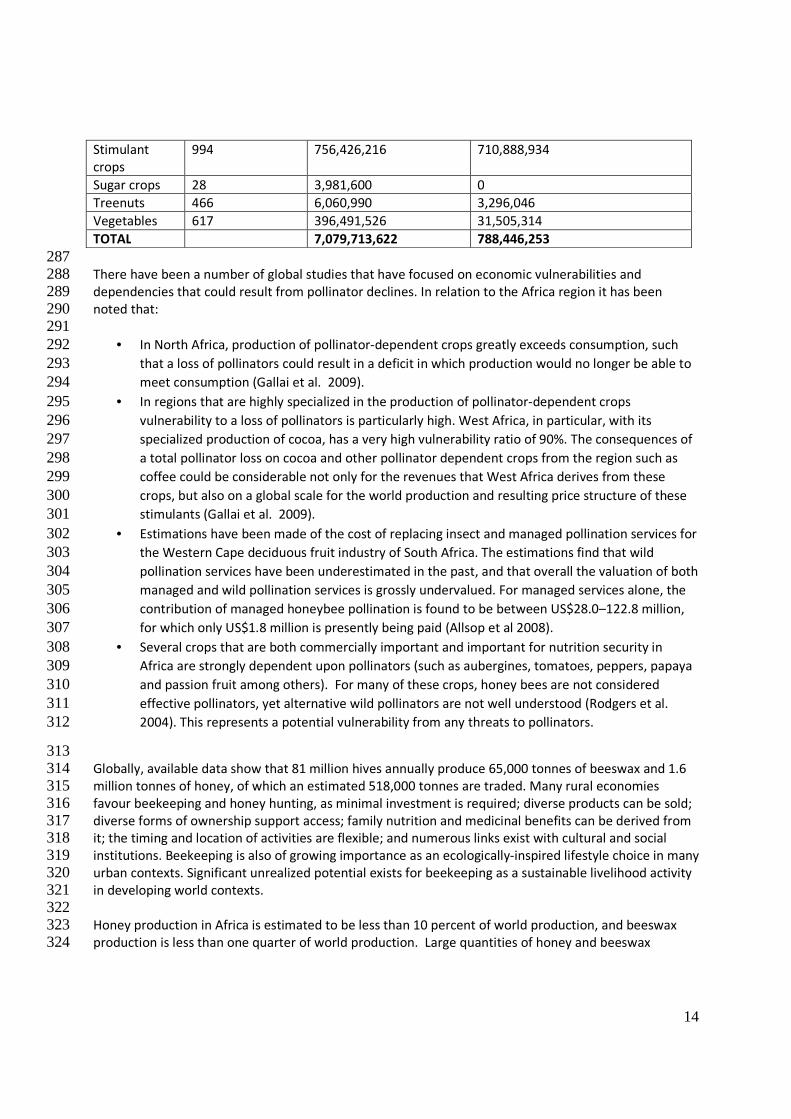
279 A methodology for economic valuation of pollination services on a national scale has been developed, 280 and applied to Ghana. The total contribution of pollination services to Ghana’s national agricultural 281 production is approximately 11.1% of the national agricultural productions p.a. of $788 million (USD) 282 (Gallai and Vassière, 2009) (Table X). 283 284 TABLE X. National impact of insect pollination on the 2005 agricultural production used directly for 285 human food in Ghana (from Gallai and Vaissiere 2009a). From Gemmill-Herren et al., 2014 286 Crop category
following FAO
Average value per
metric ton in US$
Total value of crop (TVC)
Price * Production in US$
Economic value of insect
pollinators (EVIP) =TVC*%yield
dependent on pollination (D) in
US$
Cereals 422 821,267,900 0
Fruits 55 190,191,024 5,895,398
Oilcrops 141 400,822,900 30,717,694
Pulse 687 10,307,100 0
Roots and
Tubers
286 4,356,036,458 0
Spices 1940 138,127,909 6,142,868
14
Stimulant
crops
994 756,426,216 710,888,934
Sugar crops 28 3,981,600 0
Treenuts 466 6,060,990 3,296,046
Vegetables 617 396,491,526 31,505,314
TOTAL 7,079,713,622 788,446,253
287 There have been a number of global studies that have focused on economic vulnerabilities and 288 dependencies that could result from pollinator declines. In relation to the Africa region it has been 289 noted that: 290 291
• In North Africa, production of pollinator-dependent crops greatly exceeds consumption, such 292 that a loss of pollinators could result in a deficit in which production would no longer be able to 293 meet consumption (Gallai et al. 2009). 294
• In regions that are highly specialized in the production of pollinator-dependent crops 295 vulnerability to a loss of pollinators is particularly high. West Africa, in particular, with its 296 specialized production of cocoa, has a very high vulnerability ratio of 90%. The consequences of 297 a total pollinator loss on cocoa and other pollinator dependent crops from the region such as 298 coffee could be considerable not only for the revenues that West Africa derives from these 299 crops, but also on a global scale for the world production and resulting price structure of these 300 stimulants (Gallai et al. 2009). 301
• Estimations have been made of the cost of replacing insect and managed pollination services for 302 the Western Cape deciduous fruit industry of South Africa. The estimations find that wild 303 pollination services have been underestimated in the past, and that overall the valuation of both 304 managed and wild pollination services is grossly undervalued. For managed services alone, the 305 contribution of managed honeybee pollination is found to be between US$28.0–122.8 million, 306 for which only US$1.8 million is presently being paid (Allsop et al 2008). 307
• Several crops that are both commercially important and important for nutrition security in 308 Africa are strongly dependent upon pollinators (such as aubergines, tomatoes, peppers, papaya 309 and passion fruit among others). For many of these crops, honey bees are not considered 310 effective pollinators, yet alternative wild pollinators are not well understood (Rodgers et al. 311 2004). This represents a potential vulnerability from any threats to pollinators. 312
313 Globally, available data show that 81 million hives annually produce 65,000 tonnes of beeswax and 1.6 314 million tonnes of honey, of which an estimated 518,000 tonnes are traded. Many rural economies 315 favour beekeeping and honey hunting, as minimal investment is required; diverse products can be sold; 316 diverse forms of ownership support access; family nutrition and medicinal benefits can be derived from 317 it; the timing and location of activities are flexible; and numerous links exist with cultural and social 318 institutions. Beekeeping is also of growing importance as an ecologically-inspired lifestyle choice in many 319 urban contexts. Significant unrealized potential exists for beekeeping as a sustainable livelihood activity 320 in developing world contexts. 321 322 Honey production in Africa is estimated to be less than 10 percent of world production, and beeswax 323 production is less than one quarter of world production. Large quantities of honey and beeswax 324
15
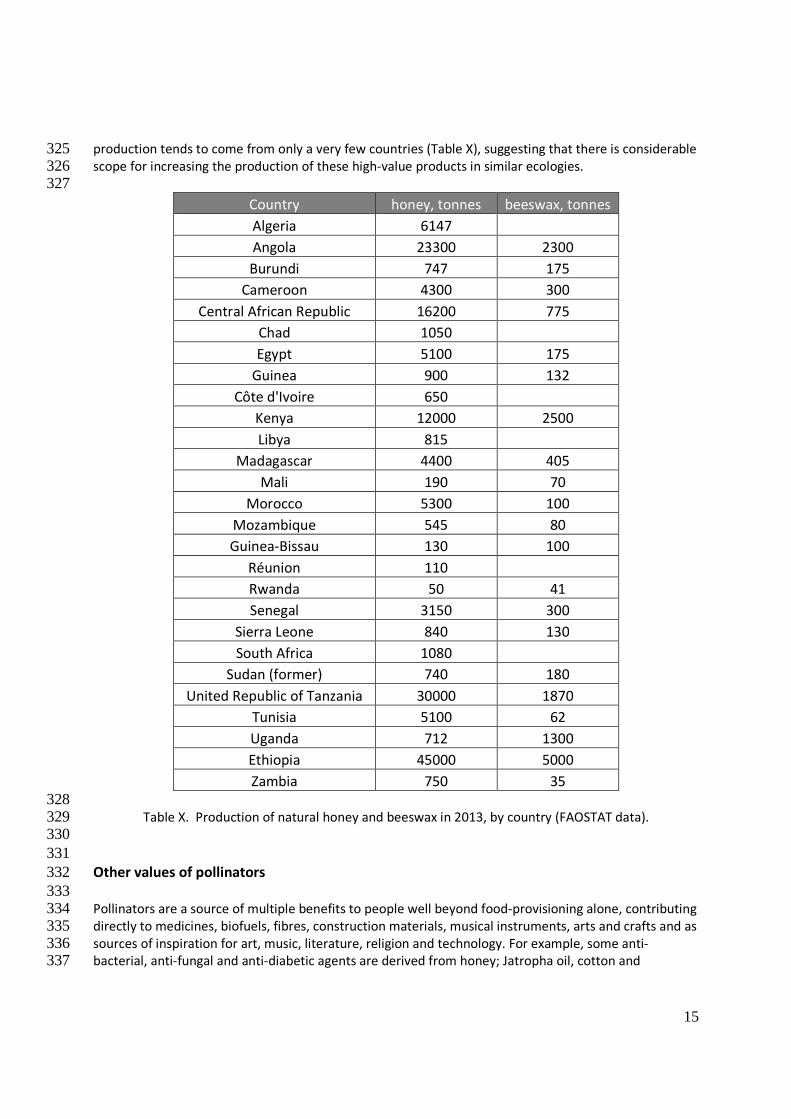
production tends to come from only a very few countries (Table X), suggesting that there is considerable 325 scope for increasing the production of these high-value products in similar ecologies. 326 327
Country honey, tonnes beeswax, tonnes
Algeria 6147
Angola 23300 2300
Burundi 747 175
Cameroon 4300 300
Central African Republic 16200 775
Chad 1050
Egypt 5100 175
Guinea 900 132
Côte d'Ivoire 650
Kenya 12000 2500
Libya 815
Madagascar 4400 405
Mali 190 70
Morocco 5300 100
Mozambique 545 80
Guinea-Bissau 130 100
Réunion 110
Rwanda 50 41
Senegal 3150 300
Sierra Leone 840 130
South Africa 1080
Sudan (former) 740 180
United Republic of Tanzania 30000 1870
Tunisia 5100 62
Uganda 712 1300
Ethiopia 45000 5000
Zambia 750 35
328 Table X. Production of natural honey and beeswax in 2013, by country (FAOSTAT data). 329
330 331 Other values of pollinators 332 333 Pollinators are a source of multiple benefits to people well beyond food-provisioning alone, contributing 334 directly to medicines, biofuels, fibres, construction materials, musical instruments, arts and crafts and as 335 sources of inspiration for art, music, literature, religion and technology. For example, some anti-336 bacterial, anti-fungal and anti-diabetic agents are derived from honey; Jatropha oil, cotton and 337
16
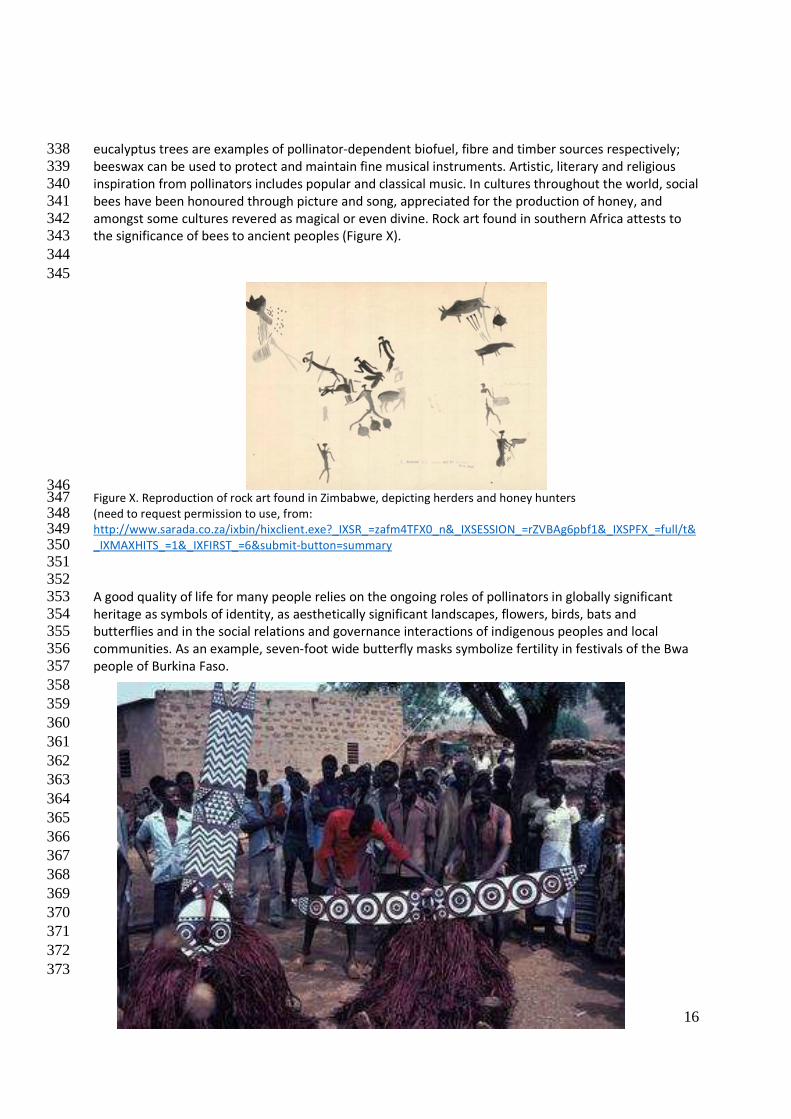
eucalyptus trees are examples of pollinator-dependent biofuel, fibre and timber sources respectively; 338 beeswax can be used to protect and maintain fine musical instruments. Artistic, literary and religious 339 inspiration from pollinators includes popular and classical music. In cultures throughout the world, social 340 bees have been honoured through picture and song, appreciated for the production of honey, and 341 amongst some cultures revered as magical or even divine. Rock art found in southern Africa attests to 342 the significance of bees to ancient peoples (Figure X). 343 344 345
346 Figure X. Reproduction of rock art found in Zimbabwe, depicting herders and honey hunters 347 (need to request permission to use, from: 348 http://www.sarada.co.za/ixbin/hixclient.exe?_IXSR_=zafm4TFX0_n&_IXSESSION_=rZVBAg6pbf1&_IXSPFX_=full/t&349 _IXMAXHITS_=1&_IXFIRST_=6&submit-button=summary 350 351 352 A good quality of life for many people relies on the ongoing roles of pollinators in globally significant 353 heritage as symbols of identity, as aesthetically significant landscapes, flowers, birds, bats and 354 butterflies and in the social relations and governance interactions of indigenous peoples and local 355 communities. As an example, seven-foot wide butterfly masks symbolize fertility in festivals of the Bwa 356 people of Burkina Faso. 357 358 359 360 361 362 363 364 365 366 367 368 369 370 371 372 373
17
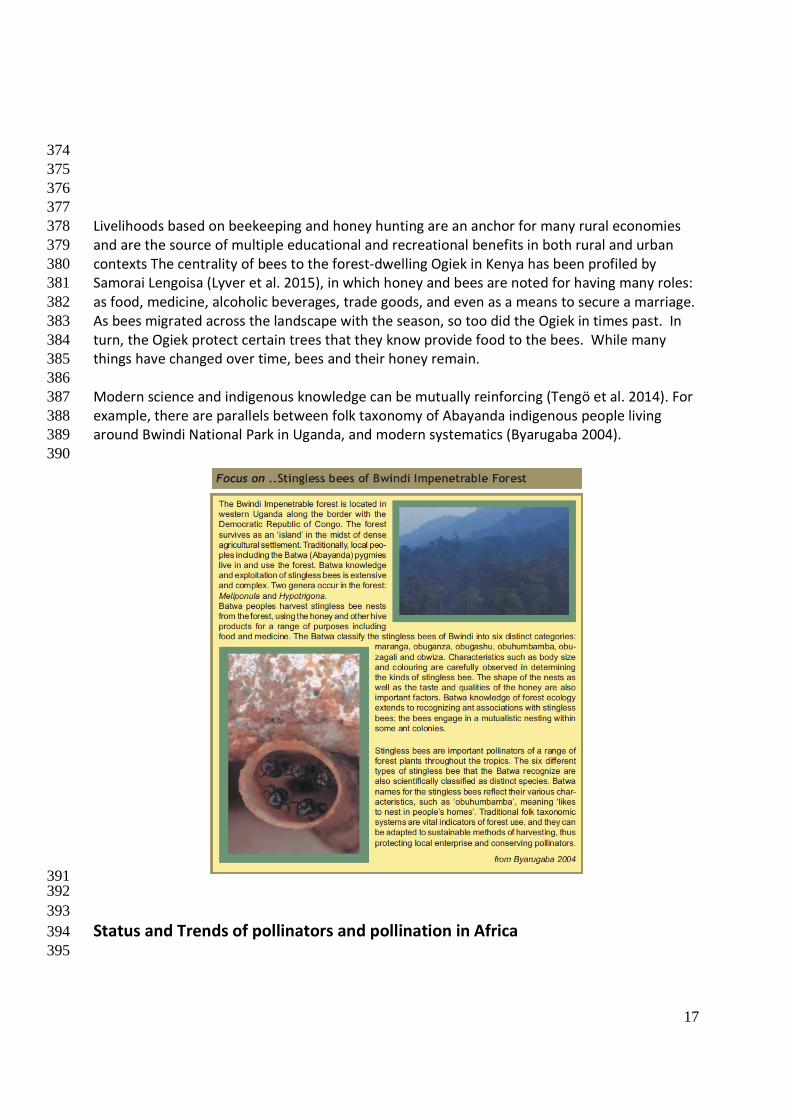
374 375 376 377 Livelihoods based on beekeeping and honey hunting are an anchor for many rural economies 378 and are the source of multiple educational and recreational benefits in both rural and urban 379 contexts The centrality of bees to the forest-dwelling Ogiek in Kenya has been profiled by 380 Samorai Lengoisa (Lyver et al. 2015), in which honey and bees are noted for having many roles: 381 as food, medicine, alcoholic beverages, trade goods, and even as a means to secure a marriage. 382 As bees migrated across the landscape with the season, so too did the Ogiek in times past. In 383 turn, the Ogiek protect certain trees that they know provide food to the bees. While many 384 things have changed over time, bees and their honey remain. 385 386 Modern science and indigenous knowledge can be mutually reinforcing (Tengö et al. 2014). For 387 example, there are parallels between folk taxonomy of Abayanda indigenous people living 388 around Bwindi National Park in Uganda, and modern systematics (Byarugaba 2004). 389 390
391 392 393 Status and Trends of pollinators and pollination in Africa 394 395
18
Concern about pollinator decline is relatively recent (Kevan, 1999; Raw, 2001; Spira, 2001; Committee 396 on the Status of Pollinators in North America, 2007; Williams, 1982), but there is a growing perception 397 among both scientists and the general public that at least some populations and species are declining in 398 at least some areas. Much of this concern comes from well-documented declines in managed honey 399 bee (A. mellifera) populations in North America and Europe, as well as more recent reports of declines 400 and even local or global extinctions of some native bees, such as bumble bees (Bombus species) 401 (Bommarco et al., 2012; Bartomeus et al., 2013; Williams et al., 2009). The fact that almost half the 402 studies on pollinator decline comes from only five countries (Australia, Brazil, Germany, Spain and the 403 USA), with only 4% of the data from the continent of Africa (Archer et al., 2014), highlights the bias in 404 information and the lack of data for some regions. To date, there is no comprehensive assessment of 405 the status and trends of pollinators and pollination services in Africa (Gemmill-Herren et al., 2014; Melin 406 et al., 2014). We use the following information on global trends to pull out the relevant, if scarce data 407 and trends in the African region. 408 409 Trends in Wild Pollinators – known evidence for Africa 410 411
The current status of almost all wild pollinator populations is unclear and difficult to assess due to the 412 lack of data. At best, global patterns can be estimated while acknowledging the large gaps in data. 413 414 For example, two recent papers address the conservation status of vertebrate pollinators and the 415 consequences of their loss. Despite data gaps, Aslan et al. (2013) estimated the threat posed by 416 vertebrate extinctions to the global biodiversity of vertebrate-pollinated plants and further identified 417 Africa, Asia, the Caribbean, and global oceanic islands as geographic regions at particular risk of 418 disruption of pollination (and dispersal). Globally, evidence would suggest that pollinator populations 419 (diversity and abundance) can be maintained over long periods of time if habitat that provides nesting 420 sites and food resources are conserved. General trends across studies indicate that the challenges 421 posed by habitat loss or alteration, introduction of diseases, alien competitors and invasive plant 422 species, and increasing pesticide use, are resulting in substantial shifts and often declines in pollinator 423 populations that have prompted concern for their future. One important trend that can be extrapolated 424 from comparative surveys between disturbed and undisturbed sites (e.g., Chacoff and Aizen, 2006; 425 Quintero et al. 2010) is that massive habitat disturbance could not only lead to impoverished pollinator 426 faunas, but also to a spatial homogenization of bee communities (decreased beta diversity) (Carvalheiro 427 et al., 2013). Below are a few examples of trends of wild pollinator taxa (wasps, moths, and bird 428 respectively) in the African region. 429
Nectar plants and sources can also affect the status of pollinator groups such as moths and birds in 430 Africa. Moth species are important pollinators and there are not many studies of their population 431 dynamics outside of economically important pest species. Some moths have closely coevolved 432 relationships with their nectar plants, with a close correspondence between proboscis length and 433 corolla size (Nilsson, 1998). In Kenya however, adult hawkmoths are routinely polyphagous and 434 opportunistic, regardless of their proboscis length (Martins and Johnson, 2013). The abundance of birds 435 can also be affected by nectar plants and sources. Bird populations have been monitored in two large 436 citizen science projects in South Africa, the first Southern African Bird Atlas Project (SABAP1: 1987–437 1991) and the second Southern African Bird Atlas Project (SABAP2: 2007-present). A recent comparison 438 of these two data sets finds that the families Pycnonotidae and Ploceidae, which include nectar as a 439 small component of their diet, have increased in abundance in 66% and 61% of geographical grid cells 440
19
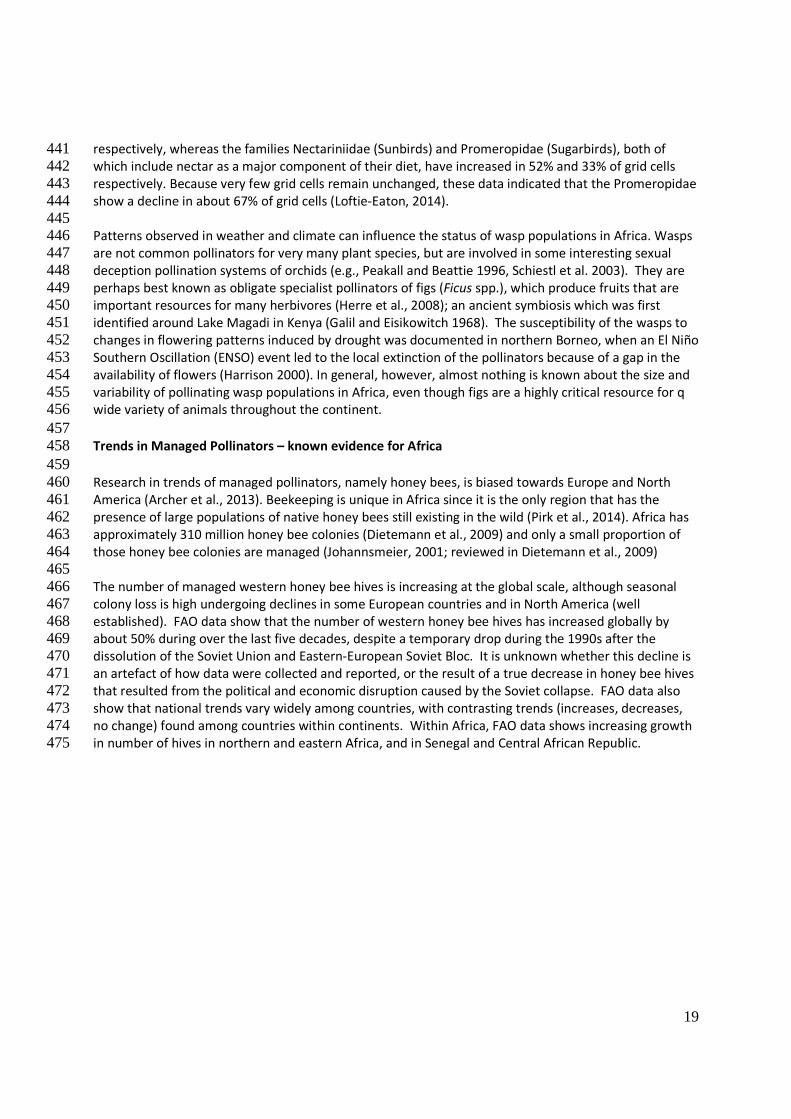
respectively, whereas the families Nectariniidae (Sunbirds) and Promeropidae (Sugarbirds), both of 441 which include nectar as a major component of their diet, have increased in 52% and 33% of grid cells 442 respectively. Because very few grid cells remain unchanged, these data indicated that the Promeropidae 443 show a decline in about 67% of grid cells (Loftie-Eaton, 2014). 444 445 Patterns observed in weather and climate can influence the status of wasp populations in Africa. Wasps 446 are not common pollinators for very many plant species, but are involved in some interesting sexual 447 deception pollination systems of orchids (e.g., Peakall and Beattie 1996, Schiestl et al. 2003). They are 448 perhaps best known as obligate specialist pollinators of figs (Ficus spp.), which produce fruits that are 449 important resources for many herbivores (Herre et al., 2008); an ancient symbiosis which was first 450 identified around Lake Magadi in Kenya (Galil and Eisikowitch 1968). The susceptibility of the wasps to 451 changes in flowering patterns induced by drought was documented in northern Borneo, when an El Niño 452 Southern Oscillation (ENSO) event led to the local extinction of the pollinators because of a gap in the 453 availability of flowers (Harrison 2000). In general, however, almost nothing is known about the size and 454 variability of pollinating wasp populations in Africa, even though figs are a highly critical resource for q 455 wide variety of animals throughout the continent. 456 457 Trends in Managed Pollinators – known evidence for Africa 458 459 Research in trends of managed pollinators, namely honey bees, is biased towards Europe and North 460 America (Archer et al., 2013). Beekeeping is unique in Africa since it is the only region that has the 461 presence of large populations of native honey bees still existing in the wild (Pirk et al., 2014). Africa has 462 approximately 310 million honey bee colonies (Dietemann et al., 2009) and only a small proportion of 463 those honey bee colonies are managed (Johannsmeier, 2001; reviewed in Dietemann et al., 2009) 464 465 The number of managed western honey bee hives is increasing at the global scale, although seasonal 466 colony loss is high undergoing declines in some European countries and in North America (well 467 established). FAO data show that the number of western honey bee hives has increased globally by 468 about 50% during over the last five decades, despite a temporary drop during the 1990s after the 469 dissolution of the Soviet Union and Eastern-European Soviet Bloc. It is unknown whether this decline is 470 an artefact of how data were collected and reported, or the result of a true decrease in honey bee hives 471 that resulted from the political and economic disruption caused by the Soviet collapse. FAO data also 472 show that national trends vary widely among countries, with contrasting trends (increases, decreases, 473 no change) found among countries within continents. Within Africa, FAO data shows increasing growth 474 in number of hives in northern and eastern Africa, and in Senegal and Central African Republic. 475
20
476 477 478 Figure X. Honey bee colony densities and world map showing the annual growth rate (%/yr) in the number of 479 honey bee colonies and honey production for countries reporting those data to FAO between 1961 and 2012 480 (FAOSTAT 2013). Data from the countries that were part of the former Soviet Union, the former Yugoslavia, or the 481 former Czechoslovakia have been combined. 482 483 However, it should be noted that there are inherent difficulties in determining trends in the number of 484 honey bee colonies for biological and sociological reasons, and these trends are often conflated with 485 rates of colony mortality. Specifically, it is difficult to determine the number of honey bee colonies in a 486 geographic locality because including the African region for five reasons: 1) unlike other livestock, a 487 honey bee colony can be divided by a beekeeper into two or more parts during the active season to 488 multiply colony numbers and, conversely, colonies can be united into one in periods of flower dearth or 489 cold temperatures; 2) an entire honey bee colony may depart (abscond) or be acquired as a passing 490 swarm; 3) beekeeping is a labor-intensive activity and colonies are often not registered; 4) there are 491 unknown numbers of wild honey bees in Africa; and 5) there is probably variation across nations, and 492 even across years within a country, in how data on colony numbers are collected. These factors 493 compound to hamper reports on colony numbers (the total number of colonies at any one point in time) 494 and annual rates of colony mortality (the proportion of colonies that die in one year). 495 496 Indeed, rates of colony mortality have recently been reported to be much higher than the usual rate of 497 ca. 10%, and up to 30% or more since the winter of 2006-to-2007 in some parts of the temperate 498 Northern Hemisphere (Oldroyd 2007), and may be equally high in South Africa (Pirk et al. 2014). 499 500 Honey bees in South Africa 501 502 In South Africa there are two subspecies of honey bees, the Cape honey bee, Apis mellifera capensis, 503 and the African or Savannah bee, Apis mellifera scutellata (Hepburn and Radloff, 1998). Both of these 504 honey bee species are managed and appear to be healthy despite presence of pests (e.g. Varroa mites) 505
21
and diseases (e.g. American foulbrood) (Pirk et al., 2014). Although, the data on the number of honey 506 bee colonies in South Africa is outdated, with the last census conducted in 1975 and not systematically 507 conducted. Recently, Pirk et al. (2014) quantified honey bee colony loss in South Africa by conducting a 508 beekeeper survey to assess the extent and the potential causes of colony losses in the country. Their 509 study, based on 4-8% of the total population of beekeepers in South Africa, found colony losses 510 (reported losses over two consecutive years, 2009–2010 and 2010–2011, of 29.6% and 46.2%, 511 respectively) were higher than those considered acceptable in Europe or North America. The high rate 512 of colony loss is not alarming to local/national beekeepers in South Africa since loss can be compensated 513 by catching and rearing wild swarms rather than building colonies by replacing imported queens or 514 breeding queens (Hepburn and Radloff, 1998; Johannsmeier, 2001; Dietemann et al., 2009). A major 515 factor of colony loss for Apis mellifera scutellata is attributed to the Apis mellifera capensis, a worker 516 social parasite; this problem is unique to South Africa. Subsequently, migratory beekeeping practices 517 facilitates the spread of parasites and the loss of colonies as migratory beekeepers experienced more 518 colony loss, on average, than the stationary beekeepers. 519 520 Honey bees in Kenya 521 522 Honey bee health variable throughout the continent. A nationwide survey was carried across Kenya in 523 2010 to evaluate the numbers and sizes of honey bee colonies, presence of parasites (Varroa mites and 524 Nosema microsporidia) and viruses, to identify and quantify pesticide contaminants in hives, and to 525 assay for levels of hygienic behavior (Muli et al. 2014). It was found that while Varroa infestation 526 dramatically reduces honey bee colony survival in the US and Europe, in Kenya Varroa presence alone 527 does not appear to impact colony size. Nosema apis was found at only three sites along the coast and 528 one interior site. Only a small number of pesticides at low concentrations were found. The study 529 suggests that parasites and viruses appear to the recently introduced into Kenya, but are not yet 530 impacting bee populations. 531 532 Bumble bees and solitary bees 533 534 Bumble bees are not native to the sub-Saharan Africa, but as they are used as managed pollinators in 535 intensive horticultural production in other parts of the world, experiences in the movement of 536 bumblebees may inform the question of importing bumblebees. The movement of bees and the 537 intentional introduction of bees for the purposes of crop pollination can result in unanticipated 538 outcomes, as has been the experience with bumble bees (Dafni et al. 2010). At least four species of 539 Bombus have been introduced to new countries to enhance crop production. For example, B. hortorum, 540 B. terrestris, B. subterraneus, and B. ruderatus were introduced from the UK to New Zealand. Bombus 541 terrestris has been also directly introduced from Europe to Israel, Chile, Asia, Central America, Northern 542 Africa, and secondarily introduced from Israel to Chile, and from New Zealand to Japan and Tasmania. 543 Bombus ruderatus, in turn, was introduced from the UK to New Zealand, and secondarily from New 544 Zealand to Chile. Both B. terrestris and B. ruderatus spread secondarily from Chile to Argentina 545 (Montalva et al. 2011). 546
22
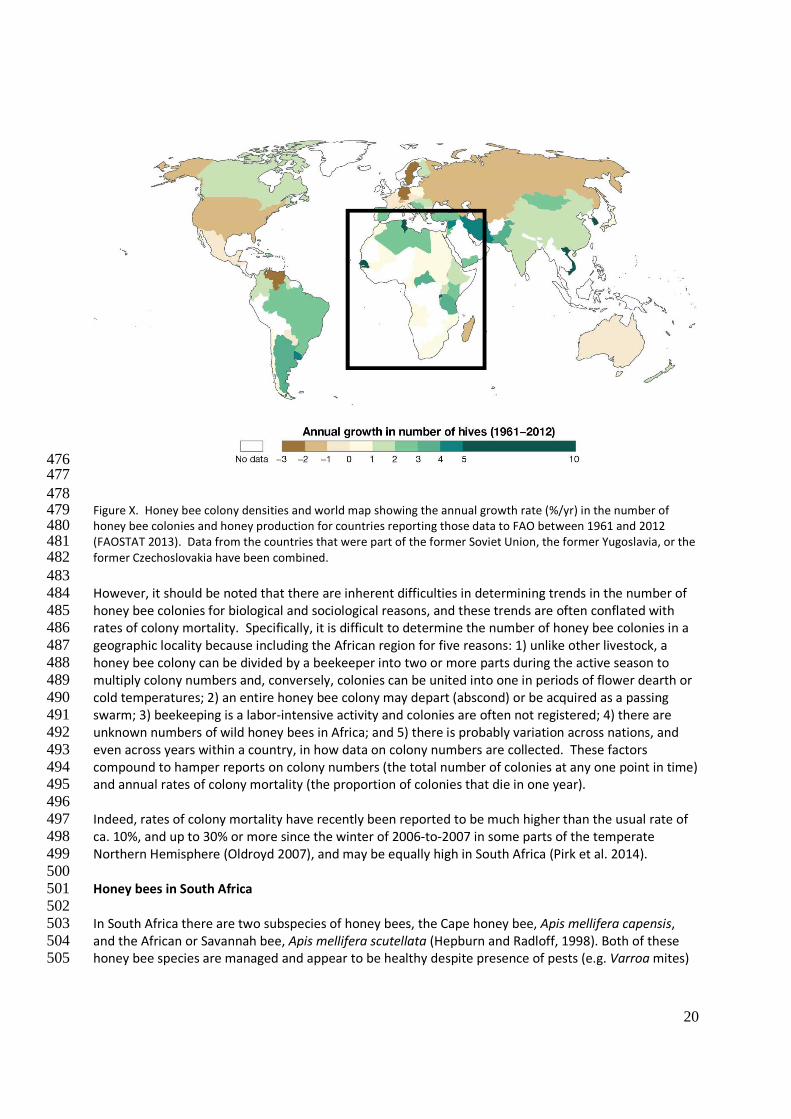
547 Figure X. Global introductions of European bumble bees, Bombus spp. summarizes the main routes of 548 invasion of Bombus species in the world. There is a clear primary source of invasion originating in 549 Europe. A secondary source of invasion started in New Zealand. A conspicuous non-intentional spread 550 has occurred from Chile to Argentina, with a subsequent spreading in the Argentinean territory, a 551 process that is currently ongoing (Morales et al. 2013). 552 553 Conversely, aside from the honey bee, Megachile concinna Smith 1879 and M. derelictula Cockerell 554 1937 are leafcutter bees that were introduced to North America (including the Caribbean) most likely 555 from Africa (Frankie et al. 1998, Gibbs and Sheffield 2009). Megachile concinna are known to pollinate 556 alfalfa in the United States (Raw 2004) and M. derelictula was introduced to the Caribbean. There is a 557 dearth of knowledge in understanding the implications of movement of bee taxa from one continent or 558 region to another. 559 560 Trends in stingless bee keeping and wild honey bee colonies 561 562 Stingless bees, in the tribe Meliponini, are one of the groups of social bees that live in colonies, 563 constructing hives that include production and storage of honey (Roubik, 1989). Stingless bees are 564 widely distributed in the tropics and sub-tropics and have been widely managed/exploited in central and 565 south America and Africa. 566 567 Knowledge of the rewards contained within stingless bee hives appears to be fairly ancient. In addition, 568 many hunter-gatherer peoples, including the Hadzabe of Tanzania (Peterson, 2013; Marlowe et al., 569
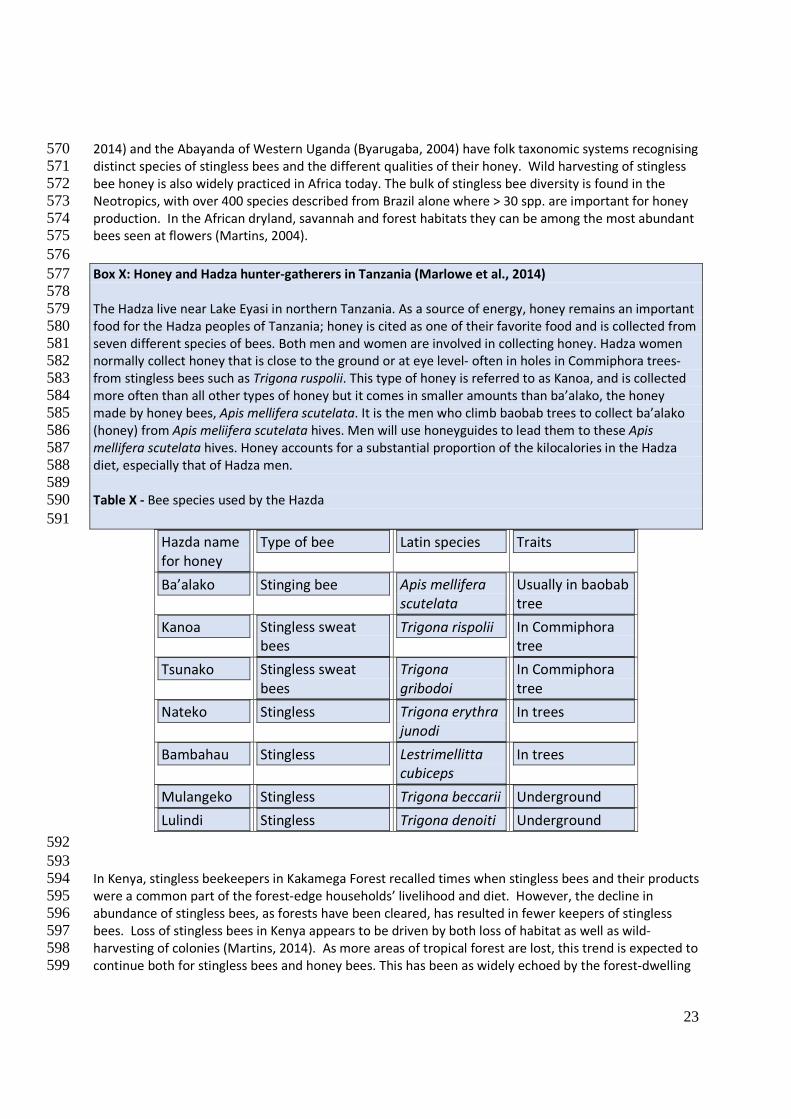
23
2014) and the Abayanda of Western Uganda (Byarugaba, 2004) have folk taxonomic systems recognising 570 distinct species of stingless bees and the different qualities of their honey. Wild harvesting of stingless 571 bee honey is also widely practiced in Africa today. The bulk of stingless bee diversity is found in the 572 Neotropics, with over 400 species described from Brazil alone where > 30 spp. are important for honey 573 production. In the African dryland, savannah and forest habitats they can be among the most abundant 574 bees seen at flowers (Martins, 2004). 575 576 Box X: Honey and Hadza hunter-gatherers in Tanzania (Marlowe et al., 2014) 577 578 The Hadza live near Lake Eyasi in northern Tanzania. As a source of energy, honey remains an important 579 food for the Hadza peoples of Tanzania; honey is cited as one of their favorite food and is collected from 580 seven different species of bees. Both men and women are involved in collecting honey. Hadza women 581 normally collect honey that is close to the ground or at eye level- often in holes in Commiphora trees- 582 from stingless bees such as Trigona ruspolii. This type of honey is referred to as Kanoa, and is collected 583 more often than all other types of honey but it comes in smaller amounts than ba’alako, the honey 584 made by honey bees, Apis mellifera scutelata. It is the men who climb baobab trees to collect ba’alako 585 (honey) from Apis meliifera scutelata hives. Men will use honeyguides to lead them to these Apis 586 mellifera scutelata hives. Honey accounts for a substantial proportion of the kilocalories in the Hadza 587 diet, especially that of Hadza men. 588 589 Table X - Bee species used by the Hazda 590 591
Hazda name
for honey
Type of bee Latin species Traits
Ba’alako Stinging bee Apis mellifera
scutelata
Usually in baobab
tree
Kanoa Stingless sweat
bees
Trigona rispolii In Commiphora
tree
Tsunako Stingless sweat
bees
Trigona
gribodoi
In Commiphora
tree
Nateko Stingless Trigona erythra
junodi
In trees
Bambahau Stingless Lestrimellitta
cubiceps
In trees
Mulangeko Stingless Trigona beccarii Underground
Lulindi Stingless Trigona denoiti Underground
592 593 In Kenya, stingless beekeepers in Kakamega Forest recalled times when stingless bees and their products 594 were a common part of the forest-edge households’ livelihood and diet. However, the decline in 595 abundance of stingless bees, as forests have been cleared, has resulted in fewer keepers of stingless 596 bees. Loss of stingless bees in Kenya appears to be driven by both loss of habitat as well as wild-597 harvesting of colonies (Martins, 2014). As more areas of tropical forest are lost, this trend is expected to 598 continue both for stingless bees and honey bees. This has been as widely echoed by the forest-dwelling 599
24
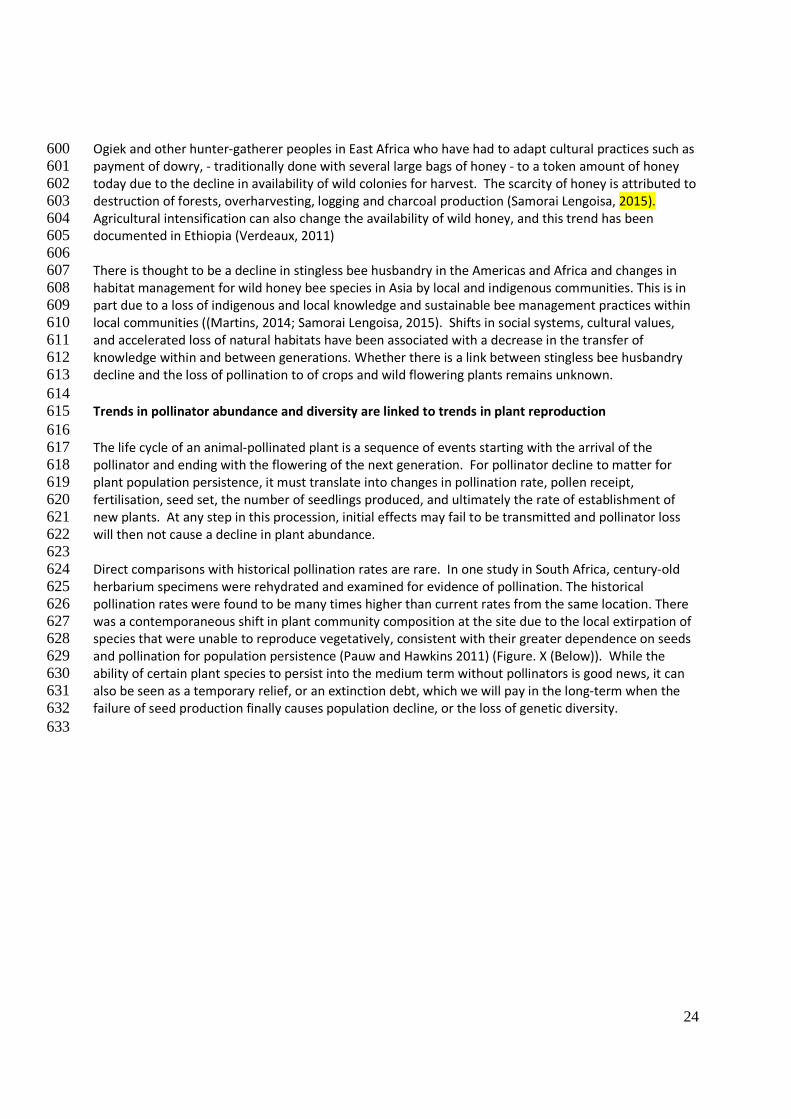
Ogiek and other hunter-gatherer peoples in East Africa who have had to adapt cultural practices such as 600 payment of dowry, - traditionally done with several large bags of honey - to a token amount of honey 601 today due to the decline in availability of wild colonies for harvest. The scarcity of honey is attributed to 602 destruction of forests, overharvesting, logging and charcoal production (Samorai Lengoisa, 2015). 603 Agricultural intensification can also change the availability of wild honey, and this trend has been 604 documented in Ethiopia (Verdeaux, 2011) 605 606 There is thought to be a decline in stingless bee husbandry in the Americas and Africa and changes in 607 habitat management for wild honey bee species in Asia by local and indigenous communities. This is in 608 part due to a loss of indigenous and local knowledge and sustainable bee management practices within 609 local communities ((Martins, 2014; Samorai Lengoisa, 2015). Shifts in social systems, cultural values, 610 and accelerated loss of natural habitats have been associated with a decrease in the transfer of 611 knowledge within and between generations. Whether there is a link between stingless bee husbandry 612 decline and the loss of pollination to of crops and wild flowering plants remains unknown. 613 614 Trends in pollinator abundance and diversity are linked to trends in plant reproduction 615 616 The life cycle of an animal-pollinated plant is a sequence of events starting with the arrival of the 617 pollinator and ending with the flowering of the next generation. For pollinator decline to matter for 618 plant population persistence, it must translate into changes in pollination rate, pollen receipt, 619 fertilisation, seed set, the number of seedlings produced, and ultimately the rate of establishment of 620 new plants. At any step in this procession, initial effects may fail to be transmitted and pollinator loss 621 will then not cause a decline in plant abundance. 622 623 Direct comparisons with historical pollination rates are rare. In one study in South Africa, century-old 624 herbarium specimens were rehydrated and examined for evidence of pollination. The historical 625 pollination rates were found to be many times higher than current rates from the same location. There 626 was a contemporaneous shift in plant community composition at the site due to the local extirpation of 627 species that were unable to reproduce vegetatively, consistent with their greater dependence on seeds 628 and pollination for population persistence (Pauw and Hawkins 2011) (Figure. X (Below)). While the 629 ability of certain plant species to persist into the medium term without pollinators is good news, it can 630 also be seen as a temporary relief, or an extinction debt, which we will pay in the long-term when the 631 failure of seed production finally causes population decline, or the loss of genetic diversity. 632 633
25
634 635 Figure. X. (a) Reconstruction of historical pollination rates from herbarium specimens of Pterygodium catholicum 636 collected on Signal Hill, South Africa. Pressed herbarium specimens contain a record of past pollinator activity in 637 the form of pollinarium removal rates. Sample sizes are above bars. (b) Following the human-caused loss of the 638 pollinator, an oil-collecting bee, the orchid assemblages shifted in favour of greater representation by clonally 639 reproducing species in urban areas, while no such shift occurred in rural areas where the pollinator still occurs. 640 Persistence of 1 indicates that the number of pre- and post-1950 herbarium records is equal. Figure reproduced 641 from Pauw and Hawkins (2011), with permission from John Wiley and Sons. 642 643 In most cases, however, historical base-line data are lacking and researchers use space-for-time 644 substitution, i.e. they compare human-altered areas with natural areas, assuming that the human-645 altered areas historically resembled the natural areas (Aizen and Feinsinger 1994, Murren 2002, Steffan-646 Dewenter et al. 2002, Pauw 2007). In these studies, it is important to account as far as possible for 647 “natural” spatial variation. 648 649 Trends in demand for pollinators 650
26
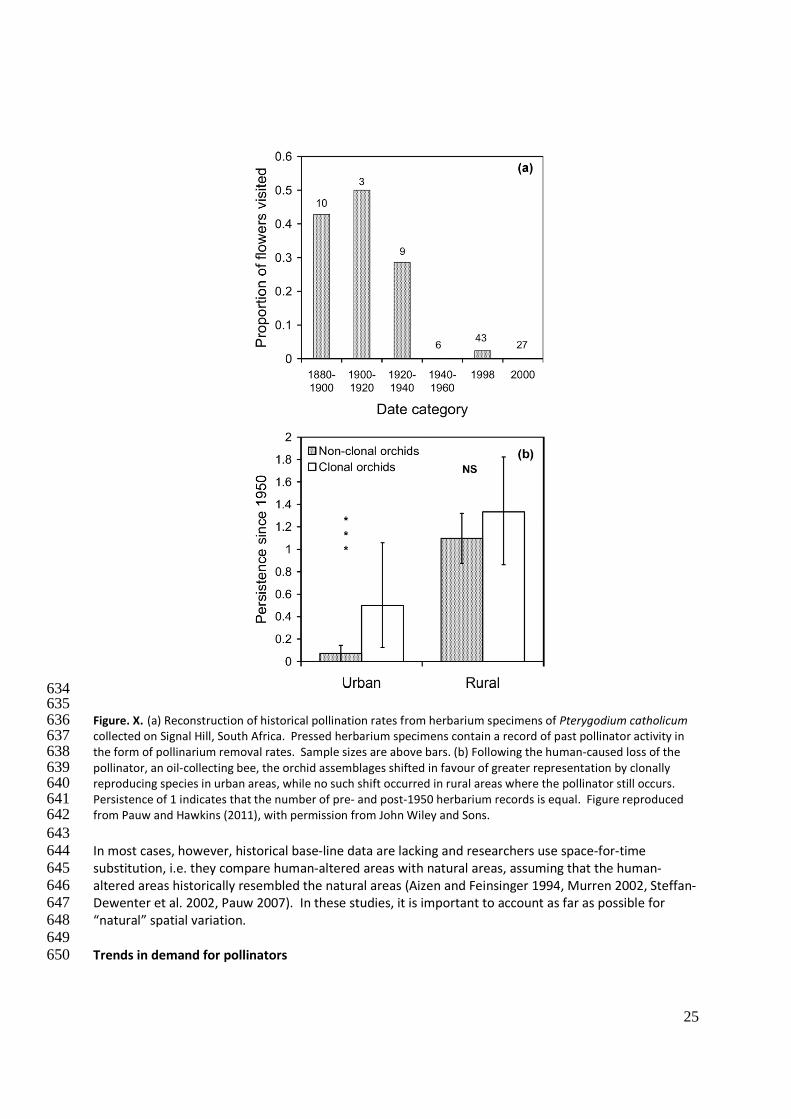
651 Global agriculture is becoming increasingly pollinator-dependent and the proportion volume of 652 agricultural production dependent on pollinators has increased by >300 % during the last five decades 653 (Aizen et al. 2008; Aizen and Harder 2009). This increase in pollinator-dependency of agriculture has 654 been steeper in developing countries in Africa, Asia and Latin America than, with some exceptions (e.g., 655 Canada), in developed countries in North America, Europe, Australia and New Zealand. In 2006, 656 pollinator-dependent crops comprised 33% of developing country and 35% of developed country 657 cropped land area (Aizen et al. 2008). This areal expansion has been basically concentrated in the 658 developing world, where the cultivation of pollination-dependent crops is proceeding at a faster pace 659 than the cultivation of nondependent crops (Aizen et al., 2008, 2009). 660 661
662
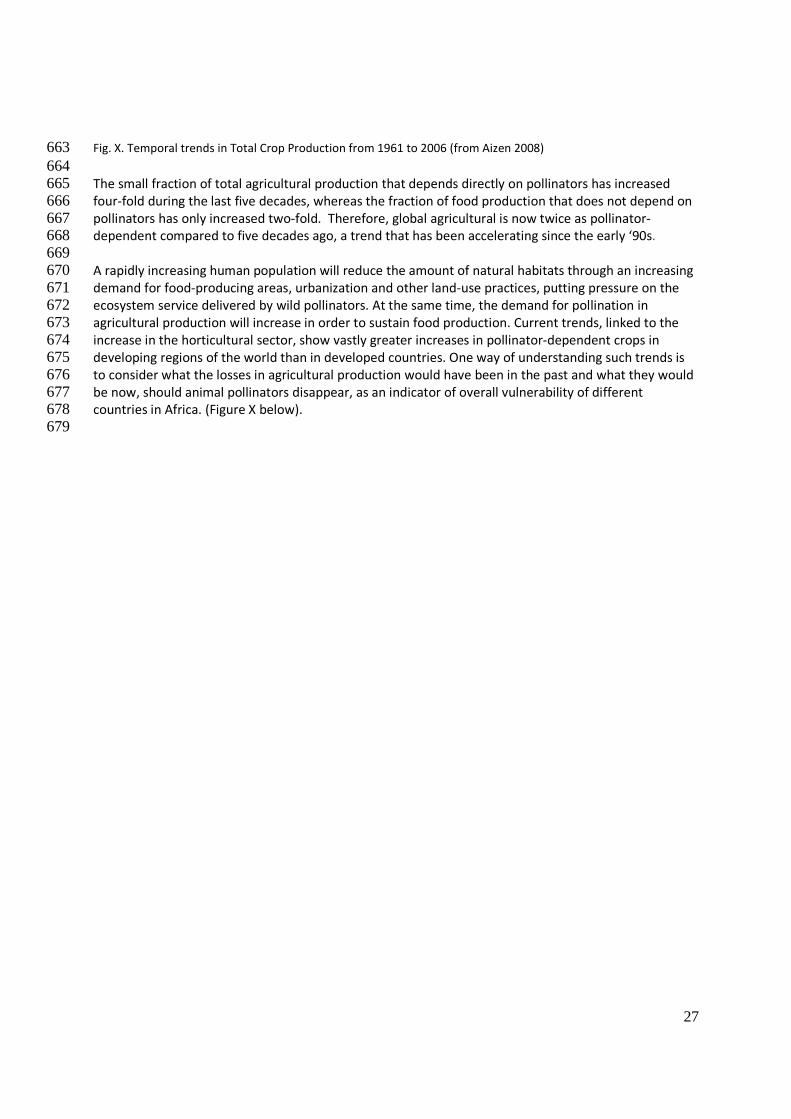
27
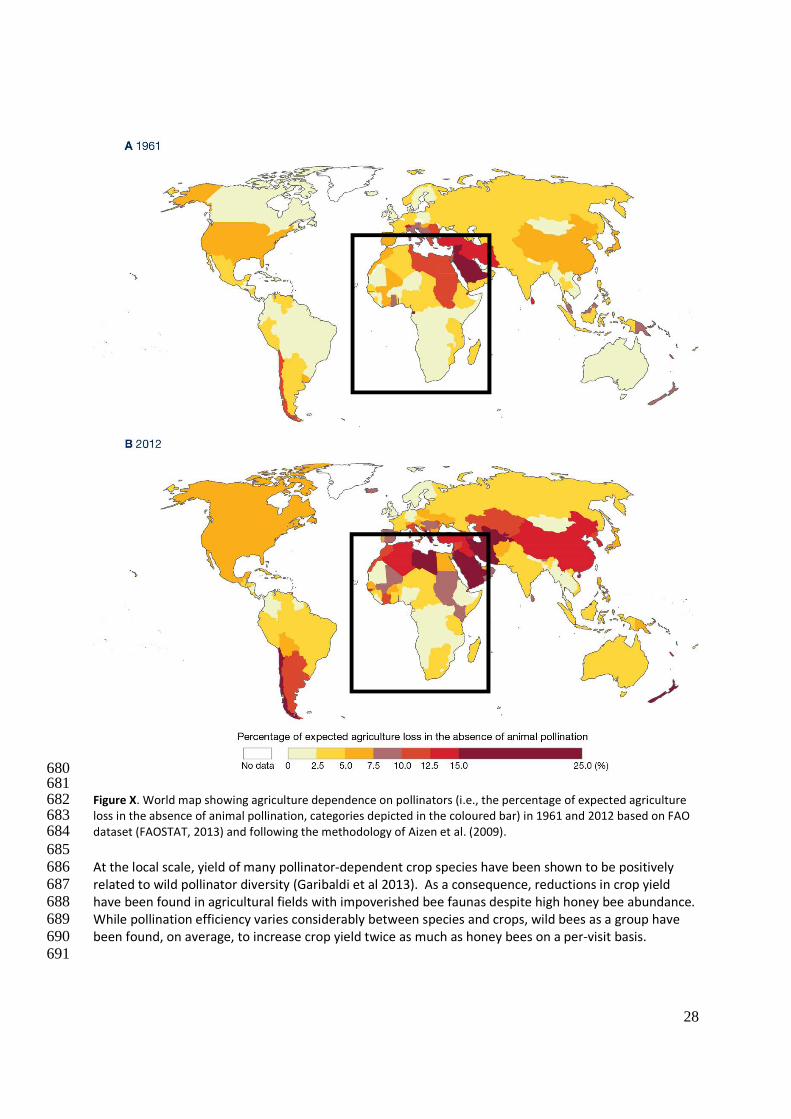
Fig. X. Temporal trends in Total Crop Production from 1961 to 2006 (from Aizen 2008) 663 664 The small fraction of total agricultural production that depends directly on pollinators has increased 665 four-fold during the last five decades, whereas the fraction of food production that does not depend on 666 pollinators has only increased two-fold. Therefore, global agricultural is now twice as pollinator-667 dependent compared to five decades ago, a trend that has been accelerating since the early ‘90s. 668 669 A rapidly increasing human population will reduce the amount of natural habitats through an increasing 670 demand for food-producing areas, urbanization and other land-use practices, putting pressure on the 671 ecosystem service delivered by wild pollinators. At the same time, the demand for pollination in 672 agricultural production will increase in order to sustain food production. Current trends, linked to the 673 increase in the horticultural sector, show vastly greater increases in pollinator-dependent crops in 674 developing regions of the world than in developed countries. One way of understanding such trends is 675 to consider what the losses in agricultural production would have been in the past and what they would 676 be now, should animal pollinators disappear, as an indicator of overall vulnerability of different 677 countries in Africa. (Figure X below). 678 679
28
680 681 Figure X. World map showing agriculture dependence on pollinators (i.e., the percentage of expected agriculture 682 loss in the absence of animal pollination, categories depicted in the coloured bar) in 1961 and 2012 based on FAO 683 dataset (FAOSTAT, 2013) and following the methodology of Aizen et al. (2009). 684 685 At the local scale, yield of many pollinator-dependent crop species have been shown to be positively 686 related to wild pollinator diversity (Garibaldi et al 2013). As a consequence, reductions in crop yield 687 have been found in agricultural fields with impoverished bee faunas despite high honey bee abundance. 688 While pollination efficiency varies considerably between species and crops, wild bees as a group have 689 been found, on average, to increase crop yield twice as much as honey bees on a per-visit basis. 690 691
29
Trends in supply of pollinators for agriculture- wild pollinators 692 693 A global analyses of FAO data did not show slowing in yield growth of pollinator-dependent crops 694 relative to pollinator-independent crops over the last five decades (1961-2007), although the trend in 695 declines of some native bees may change this situation. Globally, yield growth and stability are, between 696 1961-2008, negatively associated with the increasing dependency of crops on biotic pollination. Despite 697 no sign of deceleration in average yield growth among pollinator-dependent crops over time, FAO data 698 revealed that yield growth, and yield stability are all negatively related to increasing crop pollinator-699 dependency. Cultivation of pollinator-dependent crops largely accounts for the 30% expansion of the 700 global cultivated area occurring during the last fifty years. FAO data revealed that crops that largely 701 depend on pollinators have experienced the fastest global expansion in cultivated area. However, these 702 crops exhibited the slowest average growth in yield and highest inter-annual yield variability. To 703 express this in simple terms, the more a crop is dependent on pollination, the more likely it is to (a) be 704 increasing in the land area over which it is produced; (b) to have slow yield growth; thus increases in 705 production are largely due to increases in land area over which it is produced and (c) have less stable 706 yields on average than non-pollinator dependent crops. While none of these facts prove causality, it has 707 been hypothesized that a chain of events could be occurring in which the areas of wild or semi-wild 708 habitat that often promote wild pollinator populations may be increasingly being cleared for cultivation, 709 leading to slow yield growth and instability of yields in pollinator-dependent crops. 710 711 Trends in supply of pollinators for agriculture- managed pollinators 712 713 In many parts of Africa bees are still kept in simple boxes, straw skeps, hollow logs, walls of houses, bark 714 tubes and clay pots, and entire honey combs are cut from these hives. However, there have now been 715 many decades during which training in apiculture has been provided throughout the continent, using 716 hive systems that allow for greater management of the colony. It has been documented that trends 717 toward greater use of managed honeybee colonies for crop pollination (e.g. apples in South Africa, 718 Johannsmeier 2001) has been a major practice in increasing levels of pollination service to agricultural 719 production. 720 721 Status and Trends in Crop pollination deficits (Global and within the African region) 722 723 A recent worldwide meta-analysis including data for 41 crops grown in 600 cultivated fields distributed 724 across all continents, except Antarctica, reveals that diverse assemblages of wild bees seem to be 725 important to reduce pollination deficits and sustain high yields of many pollinator-dependent crops 726 (Garibaldi et al., 2013). Specifically, this study found that flower visitation by wild bees increases crop 727 fruit and seed set, on average, twice as much as visitation by the domesticated honey bee, Apis 728 mellifera, on a per-visit basis. Furthermore, declining pollination provided by wild bees might not be 729 substituted by stocking fields with more honey bee hives, although honey bees can add to the 730 pollination provided by wild bees (Garibaldi et al., 2013). Whereas complementary pollinating activity 731 between wild bees and honey bees can explain this overall additive effect, diverse pollinator 732 assemblages ensure the inclusion of one or more species of efficient pollinators. For instance, yield of 733 marketable French bean production in the Mt Kenya region was found to be positively correlated with 734 the abundance of carpenter bees (Xylocopa spp.), despite high abundance of honey bees (Masiga et al., 735 2014). 736 737
30
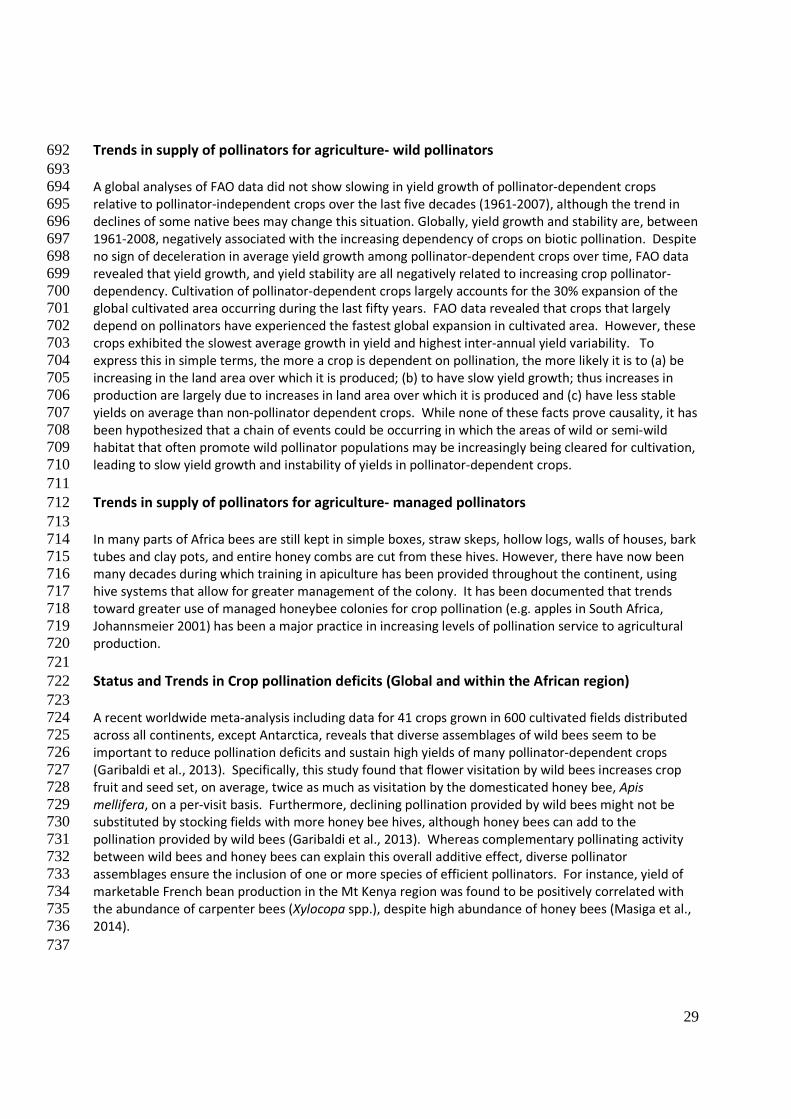
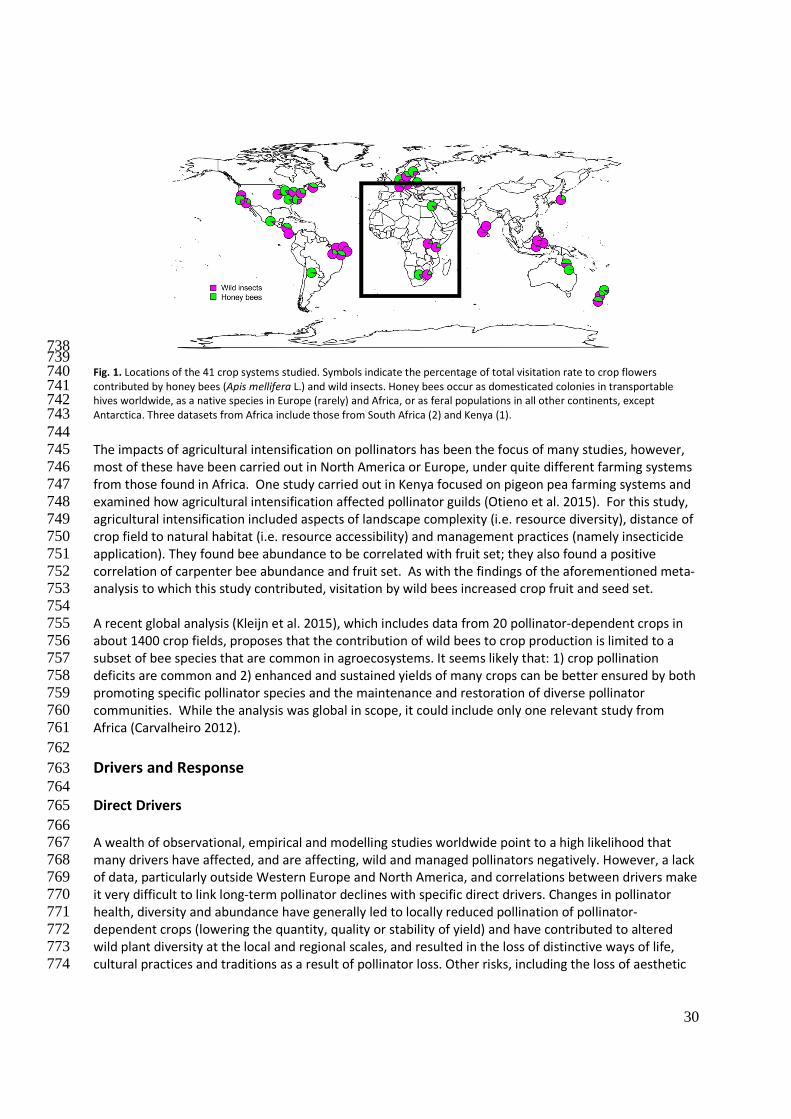
738 739 Fig. 1. Locations of the 41 crop systems studied. Symbols indicate the percentage of total visitation rate to crop flowers 740 contributed by honey bees (Apis mellifera L.) and wild insects. Honey bees occur as domesticated colonies in transportable 741 hives worldwide, as a native species in Europe (rarely) and Africa, or as feral populations in all other continents, except 742 Antarctica. Three datasets from Africa include those from South Africa (2) and Kenya (1). 743 744 The impacts of agricultural intensification on pollinators has been the focus of many studies, however, 745 most of these have been carried out in North America or Europe, under quite different farming systems 746 from those found in Africa. One study carried out in Kenya focused on pigeon pea farming systems and 747 examined how agricultural intensification affected pollinator guilds (Otieno et al. 2015). For this study, 748 agricultural intensification included aspects of landscape complexity (i.e. resource diversity), distance of 749 crop field to natural habitat (i.e. resource accessibility) and management practices (namely insecticide 750 application). They found bee abundance to be correlated with fruit set; they also found a positive 751 correlation of carpenter bee abundance and fruit set. As with the findings of the aforementioned meta-752 analysis to which this study contributed, visitation by wild bees increased crop fruit and seed set. 753 754 A recent global analysis (Kleijn et al. 2015), which includes data from 20 pollinator-dependent crops in 755 about 1400 crop fields, proposes that the contribution of wild bees to crop production is limited to a 756 subset of bee species that are common in agroecosystems. It seems likely that: 1) crop pollination 757 deficits are common and 2) enhanced and sustained yields of many crops can be better ensured by both 758 promoting specific pollinator species and the maintenance and restoration of diverse pollinator 759 communities. While the analysis was global in scope, it could include only one relevant study from 760 Africa (Carvalheiro 2012). 761 762 Drivers and Response 763 764 Direct Drivers 765 766 A wealth of observational, empirical and modelling studies worldwide point to a high likelihood that 767 many drivers have affected, and are affecting, wild and managed pollinators negatively. However, a lack 768 of data, particularly outside Western Europe and North America, and correlations between drivers make 769 it very difficult to link long-term pollinator declines with specific direct drivers. Changes in pollinator 770 health, diversity and abundance have generally led to locally reduced pollination of pollinator-771 dependent crops (lowering the quantity, quality or stability of yield) and have contributed to altered 772 wild plant diversity at the local and regional scales, and resulted in the loss of distinctive ways of life, 773 cultural practices and traditions as a result of pollinator loss. Other risks, including the loss of aesthetic 774
31
value or wellbeing associated with pollinators and the loss of long-term resilience in food production 775 systems, could develop in the longer term. The relative importance of each driver varies between 776 pollinator species according to their biology and geographic location. Drivers can also combine or 777 interact in their effects, complicating any ranking of drivers by risk of harm. 778 779 Land use change 780 781 Since 1961, croplands have been expanding at the global scale and on most continents including Africa, 782 with concomitant global reductions in forest and grasslands (http://faostat.fao.org/; a global annual 783 average of 0.2% increase of croplands, accompanied by a reduction of 0.16% of forest land per year). 784 This pattern was also revealed in modelled reconstructions of land cover using historical land use data 785 for the last 300 years (Hansen et al., 2013; Hooke and Martín-Duque, 2012; Klein Goldewijk and 786 Ramankutty, 2004; Ramankutty and Foley, 1999). By 2030, most optimistic scenarios predict a net forest 787 loss associated with a 10% increase in the area of agricultural land, mainly in the developing world 788 (Haines-Young, 2009). Urban areas are also predicted to expand as a consequence of 66% (vs. 54% 789 today) of the increasing global human population expected to be living in urban areas by 2050 (UN, 790 2014). Although forecasts suggest global increases, they are expected to be larger in developing 791 countries, mainly in Asia and Africa (UN, 2014). For example, in East Africa between 1960 and 2000, the 792 population in urban areas of Kenya grew from 7 to 30% of the total population (Tiffen, 2003). 793 794 Outside of the African region (i.e. Europe and North America), research on the effect of habitat loss and 795 degradation on pollinators and pollination is scant. Below we report on the few studies that have 796 examined these aspects within the African region. 797 798 Habitat fragmentation 799 Habitat fragmentation can affect plant reproductive success negatively. In the renosterveld shrublands 800 in South Africa, pollinator diversity and reproductive success (i.e. fruit and seed set) of perennial plant 801 species were measured in three different habitat sizes: small, medium and large (Donaldson et al., 802 2002). Although they found that pollinator species (bees, flies and butterflies) were not affected by 803 varying habitat fragment sizes, they did find habitat fragment size did affect the abundance of particular 804 bee and monkey beetle species. A more recent review and meta-analysis of 53 studies and 89 wild plant 805 species showed a large and negative effect of fragmentation on pollination and on plant sexual 806 reproduction (Aguilar et al., 2006). This meta-analysis included wild plant species Berkheya armata, 807 Brunsvigia radulosa, Cyanella lutea, Gerbera aurantiaca, Gladiolus liliaceus, Ornithogalum thyrsoides, 808 Oxyanthus pyriformis, Pterygodium catholicum, Trachyandra birsuta, found in shrublands, temperate 809 forests and grasslands of South Africa. 810 811 Habitat isolation and connectivity 812 Habitat isolation and connectivity can also affect the delivery of crop pollination, measured as the 813 relationship between fruit set and/or crop visitation rates of different pollinators and distance to 814 resource-rich habitats. Synthesis of data across several pollinator taxa, pollinated crops and wild plant 815 species from different biomes showed that pollinator diversity and abundance, and flower visitation, 816 decrease with increasing distance from resource-rich locations (Garibaldi et al., 2011; Klein et al., 2007; 817 Ricketts et al., 2008). Ricketts et al. (2008) synthesized results from 23 studies representing 16 crops on 818 five continents, including Africa, found exponential declines in pollinator richness and native visitation 819 rate with increasing distance from resource-rich areas. This correlation was more negative for visitation 820 rate than for pollination richness. Visitation rates dropped more steeply in tropical than in temperate 821
32
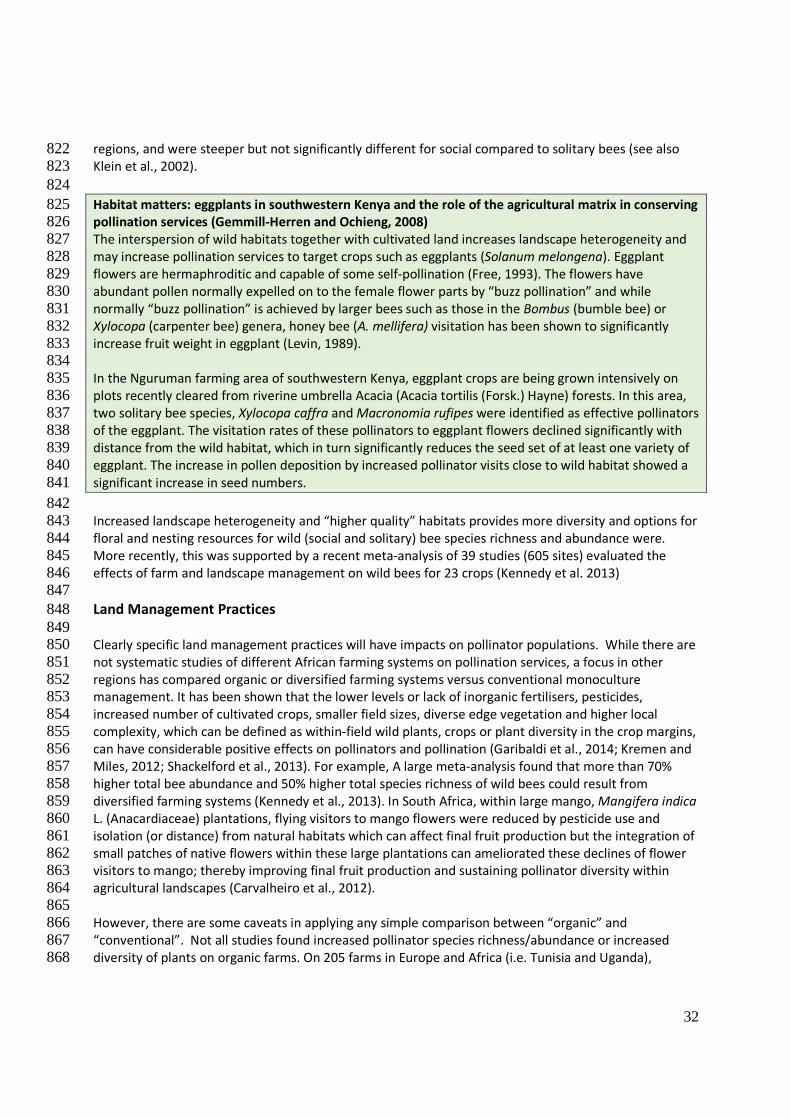
regions, and were steeper but not significantly different for social compared to solitary bees (see also 822 Klein et al., 2002). 823 824 Habitat matters: eggplants in southwestern Kenya and the role of the agricultural matrix in conserving 825 pollination services (Gemmill-Herren and Ochieng, 2008) 826 The interspersion of wild habitats together with cultivated land increases landscape heterogeneity and 827 may increase pollination services to target crops such as eggplants (Solanum melongena). Eggplant 828 flowers are hermaphroditic and capable of some self-pollination (Free, 1993). The flowers have 829 abundant pollen normally expelled on to the female flower parts by “buzz pollination” and while 830 normally “buzz pollination” is achieved by larger bees such as those in the Bombus (bumble bee) or 831 Xylocopa (carpenter bee) genera, honey bee (A. mellifera) visitation has been shown to significantly 832 increase fruit weight in eggplant (Levin, 1989). 833 834 In the Nguruman farming area of southwestern Kenya, eggplant crops are being grown intensively on 835 plots recently cleared from riverine umbrella Acacia (Acacia tortilis (Forsk.) Hayne) forests. In this area, 836 two solitary bee species, Xylocopa caffra and Macronomia rufipes were identified as effective pollinators 837 of the eggplant. The visitation rates of these pollinators to eggplant flowers declined significantly with 838 distance from the wild habitat, which in turn significantly reduces the seed set of at least one variety of 839 eggplant. The increase in pollen deposition by increased pollinator visits close to wild habitat showed a 840 significant increase in seed numbers. 841 842 Increased landscape heterogeneity and “higher quality” habitats provides more diversity and options for 843 floral and nesting resources for wild (social and solitary) bee species richness and abundance were. 844 More recently, this was supported by a recent meta-analysis of 39 studies (605 sites) evaluated the 845 effects of farm and landscape management on wild bees for 23 crops (Kennedy et al. 2013) 846 847 Land Management Practices 848 849 Clearly specific land management practices will have impacts on pollinator populations. While there are 850 not systematic studies of different African farming systems on pollination services, a focus in other 851 regions has compared organic or diversified farming systems versus conventional monoculture 852 management. It has been shown that the lower levels or lack of inorganic fertilisers, pesticides, 853 increased number of cultivated crops, smaller field sizes, diverse edge vegetation and higher local 854 complexity, which can be defined as within-field wild plants, crops or plant diversity in the crop margins, 855 can have considerable positive effects on pollinators and pollination (Garibaldi et al., 2014; Kremen and 856 Miles, 2012; Shackelford et al., 2013). For example, A large meta-analysis found that more than 70% 857 higher total bee abundance and 50% higher total species richness of wild bees could result from 858 diversified farming systems (Kennedy et al., 2013). In South Africa, within large mango, Mangifera indica 859 L. (Anacardiaceae) plantations, flying visitors to mango flowers were reduced by pesticide use and 860 isolation (or distance) from natural habitats which can affect final fruit production but the integration of 861 small patches of native flowers within these large plantations can ameliorated these declines of flower 862 visitors to mango; thereby improving final fruit production and sustaining pollinator diversity within 863 agricultural landscapes (Carvalheiro et al., 2012). 864 865 However, there are some caveats in applying any simple comparison between “organic” and 866 “conventional”. Not all studies found increased pollinator species richness/abundance or increased 867 diversity of plants on organic farms. On 205 farms in Europe and Africa (i.e. Tunisia and Uganda), 868
33
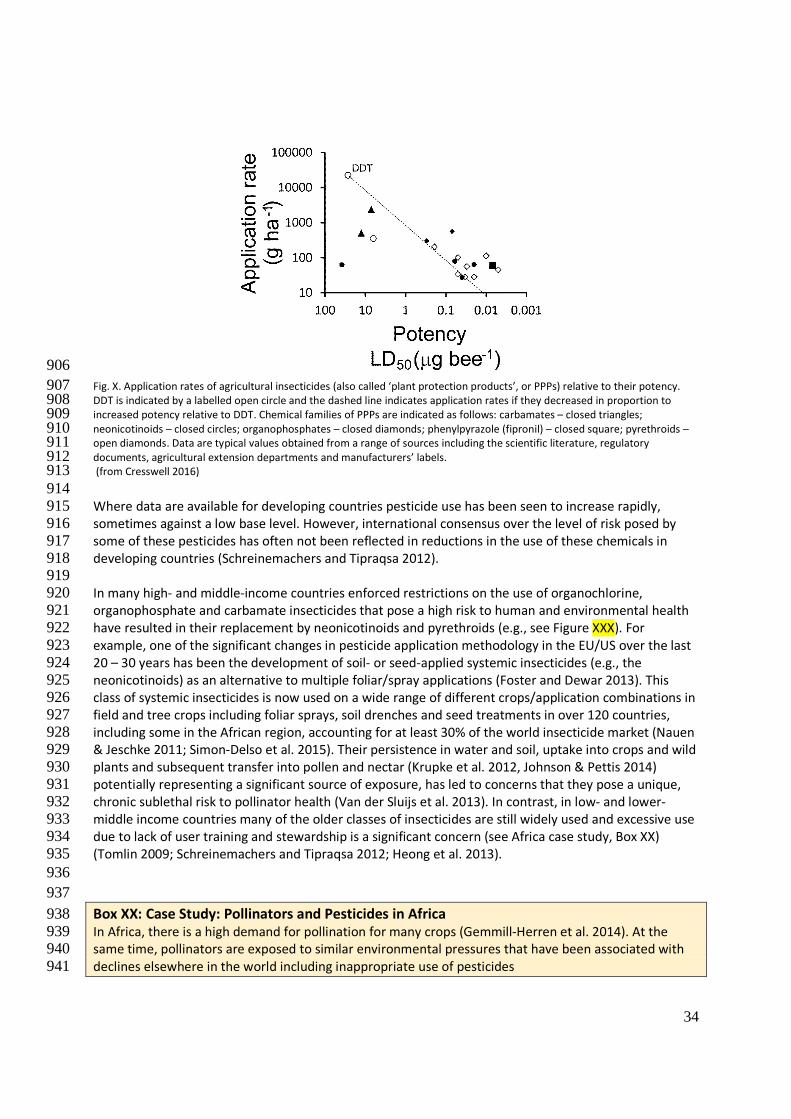
Schneider et al. (2014) found that at farm scale, the diversity of bees was affected by the presence of 869 non-productive land cover types rather than by the farming system (organic or not). On a regional scale, 870 organic farming was beneficial to both species richness of plants and bees, but differences were not 871 significant if tested separately within each of the 12 regions; meaning organic farm benefits with respect 872 to species richness seen at the field level decrease when observed or scaled up to greater spatial 873 levels/scales. Moreover, management type (organic vs. conventional) does not always match with plant 874 or crop diversity. Conventional farms can be as diverse as organic ones (e.g., in Sweden – Andersson et 875 al., 2005), while there are very large organic monocultures too. 876 877 The comparisons merit greater examination within Africa. Some of the studies mentioned above 878 compared high-input systems with traditional land-use systems, the latter including classically low-input 879 low-output livestock systems, arable and permanent crop systems, and mixed systems, that persist 880 mainly in upland and remote areas of Europe (Plieninger et al., 2006). Most of these traditionally 881 managed landscapes have disappeared in Europe today due to intensification or land abandonment 882 (Stoate et al., 2001); however, they certainly still occur with frequency in Africa. 883 884 The creation or maintenance of more diverse agricultural landscapes may result in more diverse 885 pollinator communities and enhanced crop and wild plant pollination. Local diversification and 886 tempering the intensity of land management will support pollinators and pollination; “ecologically 887 intensifying” some traditional farming systems in Africa may sustain current levels of diversification 888 while increasing yields. 889 890 Agricultural Pesticides 891 892 Globally, pesticide use on agricultural land varies according to the regional or local pest and disease 893 pressures (FAOSTAT 2014) as well as factors such as the purchasing capacity and cultural practices of the 894 farmers (Schreinemachers and Tipraqsa 2012; Heong et al. 2013; Heong et al. 2014). In many countries 895 for which data are available (e.g., in the USA, Brazil and Europe) the total tonnage of pesticides used in 896 agriculture is stable or increasing over time since the 1990s (OECD 2013; FAOSTAT 2014). For many 897 other countries (e.g., in Africa and Asia) data are incomplete or absent. Some variations in pesticide use 898 are driven by changing agricultural practices, for example, herbicide application in the USA has increased 899 and insecticide tonnage decreased, both associated with the increase in cultivation of genetically 900 modified crops and with changes in efficacy (USDA 2014). However, even as globally pesticide tonnage 901 has decreased, the toxicity of pesticide molecules on the market have markedly increased (Fig x). 902 Relative to their potency, modern insecticides are applied at higher rates than DDT, which properly 903 should cause alarm and prompt careful management (Cresswell 2016). 904 905
34
906 Fig. X. Application rates of agricultural insecticides (also called ‘plant protection products’, or PPPs) relative to their potency. 907 DDT is indicated by a labelled open circle and the dashed line indicates application rates if they decreased in proportion to 908 increased potency relative to DDT. Chemical families of PPPs are indicated as follows: carbamates – closed triangles; 909 neonicotinoids – closed circles; organophosphates – closed diamonds; phenylpyrazole (fipronil) – closed square; pyrethroids – 910 open diamonds. Data are typical values obtained from a range of sources including the scientific literature, regulatory 911 documents, agricultural extension departments and manufacturers’ labels. 912 (from Cresswell 2016) 913 914 Where data are available for developing countries pesticide use has been seen to increase rapidly, 915 sometimes against a low base level. However, international consensus over the level of risk posed by 916 some of these pesticides has often not been reflected in reductions in the use of these chemicals in 917 developing countries (Schreinemachers and Tipraqsa 2012). 918 919 In many high- and middle-income countries enforced restrictions on the use of organochlorine, 920 organophosphate and carbamate insecticides that pose a high risk to human and environmental health 921 have resulted in their replacement by neonicotinoids and pyrethroids (e.g., see Figure XXX). For 922 example, one of the significant changes in pesticide application methodology in the EU/US over the last 923 20 – 30 years has been the development of soil- or seed-applied systemic insecticides (e.g., the 924 neonicotinoids) as an alternative to multiple foliar/spray applications (Foster and Dewar 2013). This 925 class of systemic insecticides is now used on a wide range of different crops/application combinations in 926 field and tree crops including foliar sprays, soil drenches and seed treatments in over 120 countries, 927 including some in the African region, accounting for at least 30% of the world insecticide market (Nauen 928 & Jeschke 2011; Simon-Delso et al. 2015). Their persistence in water and soil, uptake into crops and wild 929 plants and subsequent transfer into pollen and nectar (Krupke et al. 2012, Johnson & Pettis 2014) 930 potentially representing a significant source of exposure, has led to concerns that they pose a unique, 931 chronic sublethal risk to pollinator health (Van der Sluijs et al. 2013). In contrast, in low- and lower-932 middle income countries many of the older classes of insecticides are still widely used and excessive use 933 due to lack of user training and stewardship is a significant concern (see Africa case study, Box XX) 934 (Tomlin 2009; Schreinemachers and Tipraqsa 2012; Heong et al. 2013). 935 936 937 Box XX: Case Study: Pollinators and Pesticides in Africa 938 In Africa, there is a high demand for pollination for many crops (Gemmill-Herren et al. 2014). At the 939 same time, pollinators are exposed to similar environmental pressures that have been associated with 940 declines elsewhere in the world including inappropriate use of pesticides 941
35
942 Data on the pattern and amount of pesticide use in Africa are also very difficult to obtain and almost 943 impossible to estimate for any single African country due to a lack of detailed lists of pesticide 944 production and imports into these countries (Youm et al. 1990). The environmental impact of pesticides 945 on pollinators has been reported by local farmers through the observation of the abundance of bees 946 that populate their hives or through fluctuations in honey production. Efforts to evaluate pesticide 947 impacts on pollinators are needed throughout the African continent, as existing studies are limited and 948 geographically widely spread, and some of these raise great concerns. 949 950 For example, traditional beekeepers in Burkina Faso have noted that their hives situated near cotton 951 fields treated with pesticides had lower numbers of adult bees and were less productive than those 952 which were kept farther away (Gomgnimbou et al. 2010). Similarly, Otieno et al. (2011) found pesticide 953 use was negatively related to pollinator abundance in fields in Eastern Kenya. However, another study 954 (Muli et al. 2014) suggested impacts may not be severe in all cases; relatively low levels of residues of up 955 to four pesticides were detected in 14 out of 15 honey bee hives sampled across Kenya. In South Africa, 956 pesticide use and isolation from natural habitat were associated with declines in flying pollinators and in 957 mango production (Carvalheiro et al. 2012), although this effect was not consistent between years 958 (Carvalheiro et al. 2010). There is a clear need for more studies of impacts of pesticides on pollinators 959 and pollination given the economic importance of insect-pollinated crops throughout the African 960 continent (Archer et al. 2014; Steward et al. 2014) and indeed across many developing countries. 961 962 Potential impacts of pesticides on pollinators 963
The use of insecticides is of particular concern due to their potential for effects on non-target insect 964 pollinators due to their inherent toxicity (UNEP 2010; EASAC 2015). Although there is also evidence that 965 some pesticide co-formulants such as adjuvants (used to enhance application and uptake of the 966 pesticide) or synergists may also show toxicity at high doses (Donovan and Elliott 2001; Ciarlo et al. 967 2012; Zhu et al. 2014; Mullin et al. 2015). Insecticides vary widely in their mode of action from molecules 968 interacting with nerve receptors to those affecting energy metabolism and development (e.g. insect 969 growth regulators). Novel pesticides and modes of action are continually sought to address rapid 970 development of resistance in target pests (Ohta and Ozoe 2014). There are very limited data available 971 globally on actual usage of insecticides (as opposed to sales data) by farmers on crops attractive to 972 pollinators from which to base a global assessment of potential risk. However, data from Kenya, Brazil 973 and the Netherlands demonstrate the differences among countries in the availability of pesticides that 974 are inherently toxic to bees (Figure XXX; (van der Valk et al. 2013). 975
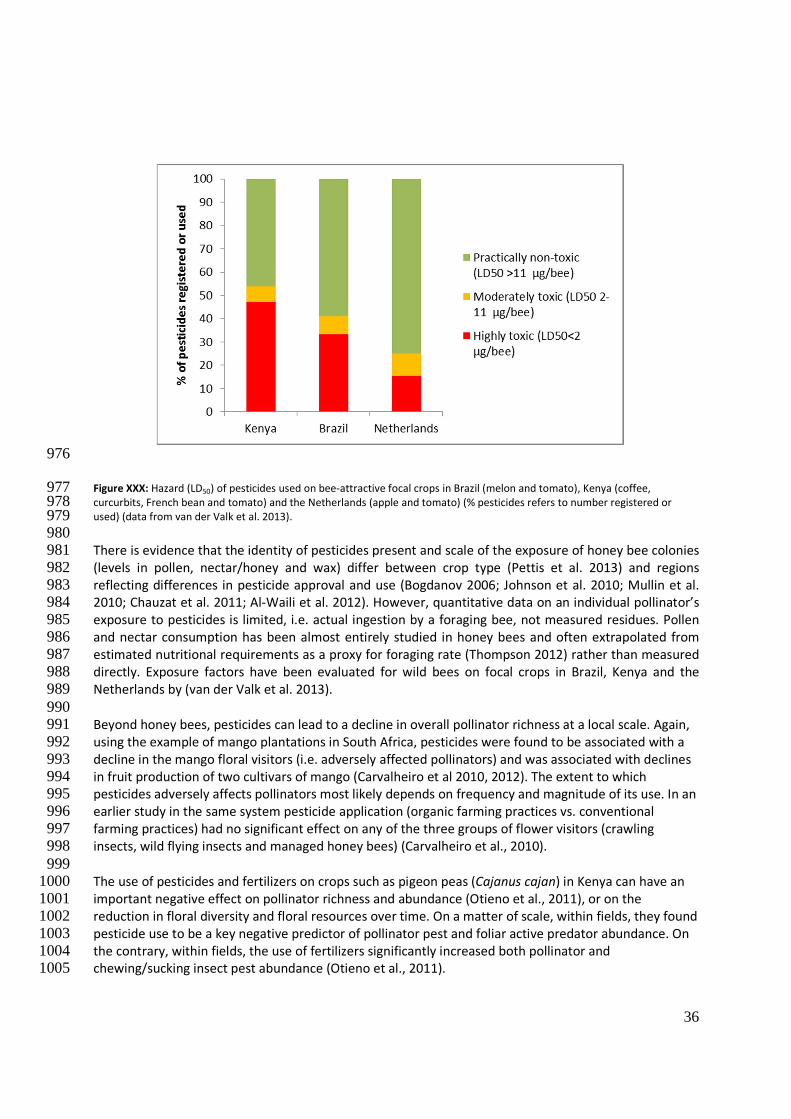
36
976
Figure XXX: Hazard (LD50) of pesticides used on bee-attractive focal crops in Brazil (melon and tomato), Kenya (coffee, 977 curcurbits, French bean and tomato) and the Netherlands (apple and tomato) (% pesticides refers to number registered or 978 used) (data from van der Valk et al. 2013). 979 980 There is evidence that the identity of pesticides present and scale of the exposure of honey bee colonies 981 (levels in pollen, nectar/honey and wax) differ between crop type (Pettis et al. 2013) and regions 982 reflecting differences in pesticide approval and use (Bogdanov 2006; Johnson et al. 2010; Mullin et al. 983 2010; Chauzat et al. 2011; Al-Waili et al. 2012). However, quantitative data on an individual pollinator’s 984 exposure to pesticides is limited, i.e. actual ingestion by a foraging bee, not measured residues. Pollen 985 and nectar consumption has been almost entirely studied in honey bees and often extrapolated from 986 estimated nutritional requirements as a proxy for foraging rate (Thompson 2012) rather than measured 987 directly. Exposure factors have been evaluated for wild bees on focal crops in Brazil, Kenya and the 988 Netherlands by (van der Valk et al. 2013). 989 990 Beyond honey bees, pesticides can lead to a decline in overall pollinator richness at a local scale. Again, 991 using the example of mango plantations in South Africa, pesticides were found to be associated with a 992 decline in the mango floral visitors (i.e. adversely affected pollinators) and was associated with declines 993 in fruit production of two cultivars of mango (Carvalheiro et al 2010, 2012). The extent to which 994 pesticides adversely affects pollinators most likely depends on frequency and magnitude of its use. In an 995 earlier study in the same system pesticide application (organic farming practices vs. conventional 996 farming practices) had no significant effect on any of the three groups of flower visitors (crawling 997 insects, wild flying insects and managed honey bees) (Carvalheiro et al., 2010). 998 999 The use of pesticides and fertilizers on crops such as pigeon peas (Cajanus cajan) in Kenya can have an 1000 important negative effect on pollinator richness and abundance (Otieno et al., 2011), or on the 1001 reduction in floral diversity and floral resources over time. On a matter of scale, within fields, they found 1002 pesticide use to be a key negative predictor of pollinator pest and foliar active predator abundance. On 1003 the contrary, within fields, the use of fertilizers significantly increased both pollinator and 1004 chewing/sucking insect pest abundance (Otieno et al., 2011). 1005
37
1006 Other than a handful of studies on this topic, there has been very little focus or research conducted on 1007 the effect of insecticides or pesticides on pollinators in Africa (Rodger et al., 2004). 1008 1009 Chemical Use: Fertilisers 1010 1011 Globally, agricultural management is increasingly using high levels of inorganic fertiliser in place of 1012 organic manures (e.g. Richards, 2001; Figure 2.2.4). Global demand for fertilizer is expected to show a 1013 successive growth of 1.8 percent per year and to reach 200 million tonnes by the end of 2018 (FAO, 1014 2014). Intensive fertiliser application per field can result in decreased diversity and cover of the less 1015 competitive wild plant species (Kleijn et al., 2009; Kovács-Hostyánszki et al., 2011). 1016
1017 1018
1019 1020 1021 1022 1023 1024 1025 1026 1027 1028 1029 1030 1031 Figure XXX. Total fertiliser consumption worldwide and separately at the different continents during the last half century. Data 1032 are shown in Million tonnes (FAO, 2014). 1033 1034 Tilling 1035 1036 Other management practices such as tilling can also influence pollinators and pollination services but 1037 have been studied to an even lesser extent in Africa. Tillage systems have a great influence on topsoil 1038 organic matter content, and other soil properties, which influence erosion and water quality. A global 1039 literature review found in many cases increased soil carbon sequestration with no-till compared to 1040 conventional tillage (Palm et al., 2014). Moreover, in a large assessment on no-till practices, a global 1041 meta-analysis across 48 crops and 63 countries examining 610 studies showed that overall no-till 1042 reduces yields, yet when no-till is combined with the other two conservation agriculture principles of 1043 residue retention and crop rotation, its negative impacts are minimized, and moreover it significantly 1044 increases rain-fed crop productivity in dry climates (Pittelkow et al., 2015). Meeting the future global 1045 food demand is a major challenge and the results of the meta-analysis suggest that no-tillage in addition 1046 to other management practices/conservation agriculture principles can result in agronomic benefits in 1047 water-limited and/or water-stressed regions and countries; this is especially important for sub-Saharan 1048 Africa as millions of hectares in its dry climates have been identified as “suitable for sustainable 1049 intensification efforts” (Pittelkow et al., 2015; ICARDA, 2014)1. 1050
1International Center for Research in the Dry Areas (ICARDA) Geoinformatics Unit. http://gu.icarda.org/en/ (2014).
38
1051 The strong links between no-till and conventional tillage systems on pollinators and pollination services 1052 in Africa have not been documented. Tillage is sometimes harmful to ground-dwelling insects including 1053 pollinators (Julier and Roulston, 2009); some of these wild ground-dwelling pollinators (solitary bees), 1054 overwinter in the topsoil such as Peponapis pruinosa (Purvis and Fadl, 2002; Kim et al. 2006). Schuler et 1055 al. (2005) examined wild pollinator populations in squash and pumpkin sites and found that the density 1056 of squash bee density was related to tillage practices and on farms were they did not till (no-tillage) the 1057 density of squash bees were three times higher than those recorded on tilled farms. This study was 1058 conducted in the United States but the implications of tilling practices on ground-dwelling insects in the 1059 African region could be similar. 1060 1061 Other direct drivers 1062 Fire can have significant, negative impact on plant reproductive success and is associated with 1063 statistically significant lower fruit set (McKechnie and Sargent, 2013). In the Cape Floristic Region of 1064 South Africa, nectar-feeding bird abundance and species richness was found to decrease in post-fire 1065 vegetation, and floral arrays within burnt vegetation received no visits by nectar-feeding birds (Geerts et 1066 al., 2012). Some studies, however, have shown that fire-dependent communities have indirectly and 1067 positively impacted pollinators by altering plant density and distribution (Van Nuland et al., 2013, 1068 Charnley and Hummel, 2011). Moreover, fires in Mediterranean climates are necessary for seed 1069 dispersal and germination (Pausas and Vallejo, 1999). 1070 1071 Pests of both managed and wild bees 1072 1073 Honey bee pests are numerous and include many invertebrates and some vertebrates (Morse et al., 1074 1990). Birds can be problematic; "bee eaters" (Merops sp.) are pests in managed apiaries in the Old 1075 World (Fry, 2001; Kastberger and Sharma, 2000). Several hornets are major pests around the world 1076 (Oldroyd and Wongsiri, 2009), and Vespa velutina has recently spread to Europe from Southeast Asia 1077 (Villemant et al., 2011). Another pest that has recently expanded its host range is the small hive beetle, 1078 Aethina tumida, moving from Africa to the USA, Australia, Portugal and Italy in the past 20 years (Hood, 1079 2004; Neumann and Elzen, 2004; Mutinelli, 2014). The small hive beetle has the potential to damage 1080 bees beyond the genus Apis and may threaten bumble bees (Hoffmann et al., 2008) as well as stingless 1081 bees (Greco et al., 2010). Of the known pest, the parasitic mites are most problematic, as they switch 1082 host and spread worldwide (Morse et al., 1990, Oldroyd and Wongsiri, 2009). 1083 1084 The checkered beetle (Trichodes apiarius) is commonly found in Europe and North Africa parasitizing 1085 both Megachile and Osmia bee species (Krunić et al., 2005), while Trichodes ornatus is common in North 1086 America (Fairey et al., 1984, Bosch and Kemp, 2001). According to Eves at al. (1980) this beetle can 1087 cause losses up to 89%, but on average around 30% in managed colonies. Methods of control are usually 1088 mechanical, like sorting the cocoons (Fairey et al., 1984) or eliminating the beetles using aromatic 1089 attractant bait traps (Wu and Smart, 2014). 1090 1091 Varroa destructor in South Africa: Lessons learned 1092 Insect pollinators suffer from a broad range of parasites, with honey bee-specific ectoparasite Varroa 1093 destructor mites attacking and transmitting viruses among honey bees (Apis mellifera) being a notable 1094 example. Worldwide, most managed European honey bee colonies are infected by Varroa destructor – 1095 with a few exceptions: Australia, Fiji and Reunion island and possibly some central African countries such 1096 as the Democratic Republic of Congo) (Ellis and Munn, 2005; Potts et al., 2010). 1097
39
1098 Varroa destructor was first found on European honey bees in 1958 (Mikawa 1986) and since then the 1099 transport and uncontrolled movement of honey bees has led to its spread in Europe, North Africa, South 1100 America and to the USA (De Jong et al 1984; Needham 1988; Matheson 1995). Varroa were discovered 1101 in South Africa in October 1997 and has spread throughout South Africa since and is now found in 1102 almost all commercial and wild honey bee populations (Allsopp, 2006). 1103 1104 When the mite was detected/discovered in South Africa, the majority of beekeepers did not use 1105 chemical varroacides to combat Varroa destructor. Presently, long-term monitoring of both wild and 1106 commercial honey bee populations indicate a relative tolerance of African bees to the Varroa mite; 1107 making Varroa a mere incidental pest. 1108 1109 Varroa destructor is concluded not to be a serious threat to honey bees and beekeeping in Africa, and in 1110 part due to the management decisions regarding the use of chemical varroacides (pesticides) which 1111 could hinder the development of natural mite tolerance in Africa. Of the major regions in the world, only 1112 Australia and central Africa are at present free of the Varroa mite. 1113 1114 (Source: Allsopp, M. 2006. Analysis of Varroa destructor infestation of southern African honey bee populations. 1115 MSc thesis. University of Pretoria. Pp. 302) 1116 1117 Indirect Drivers 1118
Indirect drivers (demographic, socio-economic, institutional, and technological) are producing 1119 environmental pressures (direct drivers) that alter pollinator biodiversity and pollination. The growth in 1120 the global human population, economic wealth, globalized trade and commerce and technological 1121 developments (e.g. increased transport efficacy), has transformed the climate, land cover and 1122 management intensity, ecosystem nutrient balance, and biogeographical distribution of species. This has 1123 had and continues to have consequences for pollinators and pollination worldwide. International trade 1124 is an underlying driver of climate land-use change, species invasions and biodiversity loss. The global 1125 expansion of industrialised agriculture driven by increased or changing consumption in the developed 1126 and emerging economies will continue to drive ecosystem changes in the developing world that are 1127 expected to affect pollinators and pollination. The area of land devoted to growing pollinator-dependent 1128 crops has increased globally in response to market demands from a growing and increasingly wealthy 1129 population, albeit with regional variations. For example, all of the West African countries together 1130 produce approximately 56 per cent of world’s stimulant crops (i.e. coffee, cocoa, tea etc.) and are 1131 vulnerable to pollinator loss; the economies of these countries and the livelihoods of the farmers and 1132 people connected to these commodities could be strongly affected by a loss in pollinator services (Gallai 1133 et al., 2009; Power 2010). 1134
Multiple pressures that individually impact the health, diversity and abundance of many pollinators 1135 across levels of biological organisation (from gene to biome scales), can combine in their effects and 1136 thereby increase the overall pressure on pollinators. This variety of threats (often anthropogenic) to 1137 pollinators and pollination poses a potential risk to food security, human health and ecosystem function. 1138 The actual magnitude of interactions between these different pressures varies with location and among 1139 pollinator species, according to their biological attributes. Nonetheless it is likely that changes in 1140 pollinator biodiversity and pollination are being exacerbated by both the individual and combined 1141 effects of multiple pressures. 1142 1143
40
Conclusions 1144 1145 Land use is currently the main driver of land cover change, leading to changes in land cover composition 1146 and configuration. It is well established that habitat loss and degradation, as well as loss of connectivity, 1147 reduction in patch sizes, and fragmentation negatively affect pollinator diversity, abundance and 1148 richness. These changes can negatively affect community stability, pollination networks and the survival 1149 and evolutionary potential of pollinator and plant species. Finally, these changes also result in a 1150 reduction of plant fruit set, which is of critical importance for food security, ecosystem services and 1151 human welfare in wild and agricultural environments. 1152 1153 Land management alters most ecosystems, having considerable impact on pollinator communities, and 1154 crop and wild plant pollination. Large-scale, chemically-intensive agricultural systems that simplify the 1155 agroecosystem through specialization on one or several crops are among the most serious threats to 1156 natural and managed ecosystems. Agricultural management practices such as increased fertiliser use, 1157 intensive tillage systems, heavy use of pesticides, high grazing/mowing intensity or badly-timed 1158 management actions decrease pollinator diversity dramatically, while influencing and reducing the 1159 effectiveness of ecological functions and services, like pollination. 1160 1161 Finally, large monoculture systems reduce both foraging and nesting resources for pollinators by 1162 removing flowering weeds and native plants and reducing crop diversity, and decreasing availability of 1163 undisturbed soil patches, hollow stems, shrubs, trees and dead wood that are needed for nesting sites. 1164 While certain mass-flowering crops provide large amounts of foraging resources (i.e. nectar and/or 1165 pollen) for some pollinators, these pulsed resources provide only temporary benefits that cannot sustain 1166 most pollinators throughout their life cycle. 1167 1168 Responses 1169 1170 Creating a more diversified agricultural landscape based on principles from sustainable agriculture, 1171 agroecology and organic farming management (i.e. intercropping, polyculture, crop rotations, cover-1172 cropping, fallowing, agroforestry, insectary strips and hedgerows), has the potential to maintain rich 1173 pollinator communities, promote connectivity, and increase pollination of crops and wild plants, as well 1174 as improve livelihoods for smallholder farmers that make up the majority of the farming community and 1175 provide an estimated 50 – 70% of the world’s food (Altieri et al., 2012; Herrero et al., 2010). However, 1176 concerns have been raised as to whether such techniques can be equally productive. Existing evidence 1177 suggests that organic farming methods are on average 10 – 25% less productive than conventional 1178 farming methods (established; Badgley et al., 2007; de Ponti et al., 2012; Seufert et al., 2012; Ponisio et 1179 al., 2015), although these yield gaps are reduced to 5 – 9% in organic farming that takes full advantage 1180 of diversification practices (intercropping and crop rotations) (Ponisio et al., 2015). Although organic 1181 farming suffers relatively small yield gaps, these yield gaps are balanced by enhancements that they 1182 provide to multiple aspects of sustainability (Kremen and Miles, 2012). A meta-analysis by Crowder and 1183 Reganold (2015) showed first, that organic systems with price premiums were significantly more 1184 profitable (22–35%) and had higher benefit/cost ratios (20–24%) than conventional agriculture, and 1185 second, that price premiums were far higher than necessary to establish equal profitability with 1186 conventional systems. Given their multiple sustainability benefits, these results suggest that organic 1187 farming systems could contribute a larger share in feeding the world at a lower price premium. A major 1188 gap in our understanding is how to reduce yield gaps in these more sustainable systems. Research, 1189 extension and infrastructure investment in sustainable agriculture, agroecology and organic farming 1190
41
management methods has been orders of magnitude less than in conventional scale agriculture (Ponisio 1191 et al., 2015; Carlisle and Miles, 2013), suggesting that increased investment in these techniques could 1192 lead to greater yields and profits, and to broader adoption (Parmentier, 2014). The lack of sustainability 1193 of monoculture systems that are highly dependent on chemical inputs, however, indicates the urgent 1194 priority for improving the productivity of more sustainable systems that will also promote pollinators. 1195 1196 Specifically, diversified farming systems are beneficial for biodiversity and ecosystem services, including 1197 pollinators and crop pollination. Provision of different crops and crop varieties not only benefits 1198 pollinators but also increases crop genetic diversity, potentially enhancing pollination. Maintenance of 1199 diverse wild plant communities within the crop fields and orchards provides a high variety of foraging 1200 resources before and after the crop flowering period that supports wild and managed bee health, and 1201 increases wild pollinator diversity and abundance on these fields with positive effects on crop 1202 pollination. Within-field diversification and application of less intensive management practices, will be 1203 more effective if wild flower patches and a diverse landscape structure is available nearby or around the 1204 managed sites. Furthermore, the conservation of pollinator habitat can enhance overall biodiversity and 1205 other ecosystem services such as biological pest control, soil and water quality protection (Kremen et 1206 al., 2012; Kremen and Miles 2012), and these secondary benefits should be incorporated into decision 1207 making (Wratten et al., 2012). 1208 1209 Knowledge systems 1210 1211 Diverse knowledge systems, including science and indigenous and local knowledge, contribute to 1212 understanding pollinators and pollination, their economic, environmental and socio-cultural values and 1213 their management globally. Scientific knowledge provides extensive and multidimensional 1214 understanding of pollinators and pollination, resulting in detailed information on their diversity, 1215 functions and steps needed to protect pollinators and the values they produce. In indigenous and local 1216 knowledge systems, pollination processes are often understood, celebrated and managed holistically in 1217 terms of maintaining values through fostering fertility, fecundity, spirituality and a diversity of farms, 1218 gardens and other habitats. The combined use of economic, socio-cultural and holistic valuation of 1219 pollinator gains and losses, using multiple knowledge systems, brings different perspectives from 1220 different stakeholder groups, providing more information for the management of and decision-making 1221 about pollinators and pollination. 1222 1223 The African Pollinator Initiative (2007) noted: “Traditional knowledge could offer guidance to the study, 1224 conservation and monitoring of pollinators. The local communities will also need to be involved in 1225 training and conservation. A farmer in Kitui District, a semi-arid part of Kenya, noticed flowers of pigeon 1226 peas dropping off without pod formation. The solution was to smear a few plants in the field with 1227 honey. This shows the perception of pollination and attracting pollinators in traditional knowledge. By 1228 their practices of favoring heterogeneity in land-use as well as in their gardens, by tending to the 1229 conservation of nesting trees and flowering resources, by distinguishing the presence of a great range of 1230 wild bees and observing their habitat and food preferences, many indigenous peoples and local 1231 communities are contributing to maintaining an abundance and, even more importantly, a wide 1232 diversity in insect, bird and bat pollinators.” 1233 1234 Amongst important forms of traditional knowledge in Africa of importance to pollination management is 1235 the understanding of uncultivated plants. While agronomists may look at these plants as weeds, to 1236 many local communities the wild plants in farm landscapes may have particular meanings for men and 1237 women; for example, they may indicate soil fertility, or may have utility as botanical pesticides or 1238
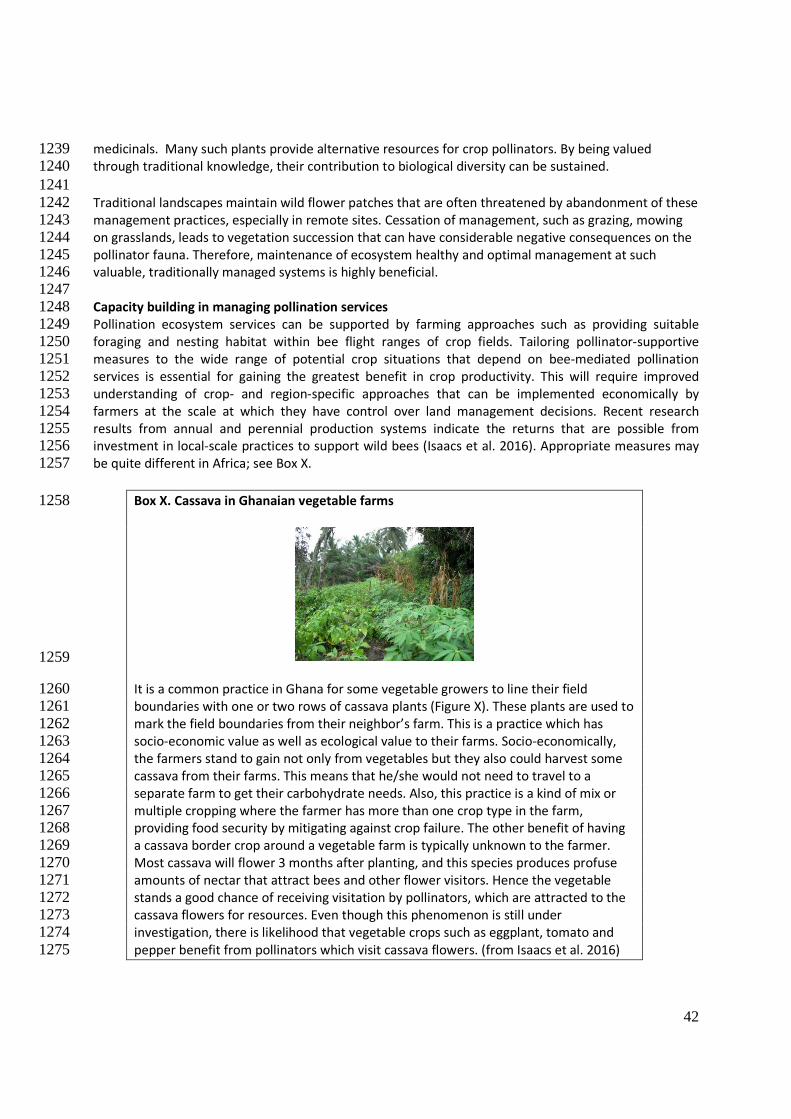
42
medicinals. Many such plants provide alternative resources for crop pollinators. By being valued 1239 through traditional knowledge, their contribution to biological diversity can be sustained. 1240 1241 Traditional landscapes maintain wild flower patches that are often threatened by abandonment of these 1242 management practices, especially in remote sites. Cessation of management, such as grazing, mowing 1243 on grasslands, leads to vegetation succession that can have considerable negative consequences on the 1244 pollinator fauna. Therefore, maintenance of ecosystem healthy and optimal management at such 1245 valuable, traditionally managed systems is highly beneficial. 1246 1247 Capacity building in managing pollination services 1248 Pollination ecosystem services can be supported by farming approaches such as providing suitable 1249 foraging and nesting habitat within bee flight ranges of crop fields. Tailoring pollinator-supportive 1250 measures to the wide range of potential crop situations that depend on bee-mediated pollination 1251 services is essential for gaining the greatest benefit in crop productivity. This will require improved 1252 understanding of crop- and region-specific approaches that can be implemented economically by 1253 farmers at the scale at which they have control over land management decisions. Recent research 1254 results from annual and perennial production systems indicate the returns that are possible from 1255 investment in local-scale practices to support wild bees (Isaacs et al. 2016). Appropriate measures may 1256 be quite different in Africa; see Box X. 1257
Box X. Cassava in Ghanaian vegetable farms 1258
1259
It is a common practice in Ghana for some vegetable growers to line their field 1260 boundaries with one or two rows of cassava plants (Figure X). These plants are used to 1261 mark the field boundaries from their neighbor’s farm. This is a practice which has 1262 socio-economic value as well as ecological value to their farms. Socio-economically, 1263 the farmers stand to gain not only from vegetables but they also could harvest some 1264 cassava from their farms. This means that he/she would not need to travel to a 1265 separate farm to get their carbohydrate needs. Also, this practice is a kind of mix or 1266 multiple cropping where the farmer has more than one crop type in the farm, 1267 providing food security by mitigating against crop failure. The other benefit of having 1268 a cassava border crop around a vegetable farm is typically unknown to the farmer. 1269 Most cassava will flower 3 months after planting, and this species produces profuse 1270 amounts of nectar that attract bees and other flower visitors. Hence the vegetable 1271 stands a good chance of receiving visitation by pollinators, which are attracted to the 1272 cassava flowers for resources. Even though this phenomenon is still under 1273 investigation, there is likelihood that vegetable crops such as eggplant, tomato and 1274 pepper benefit from pollinators which visit cassava flowers. (from Isaacs et al. 2016) 1275
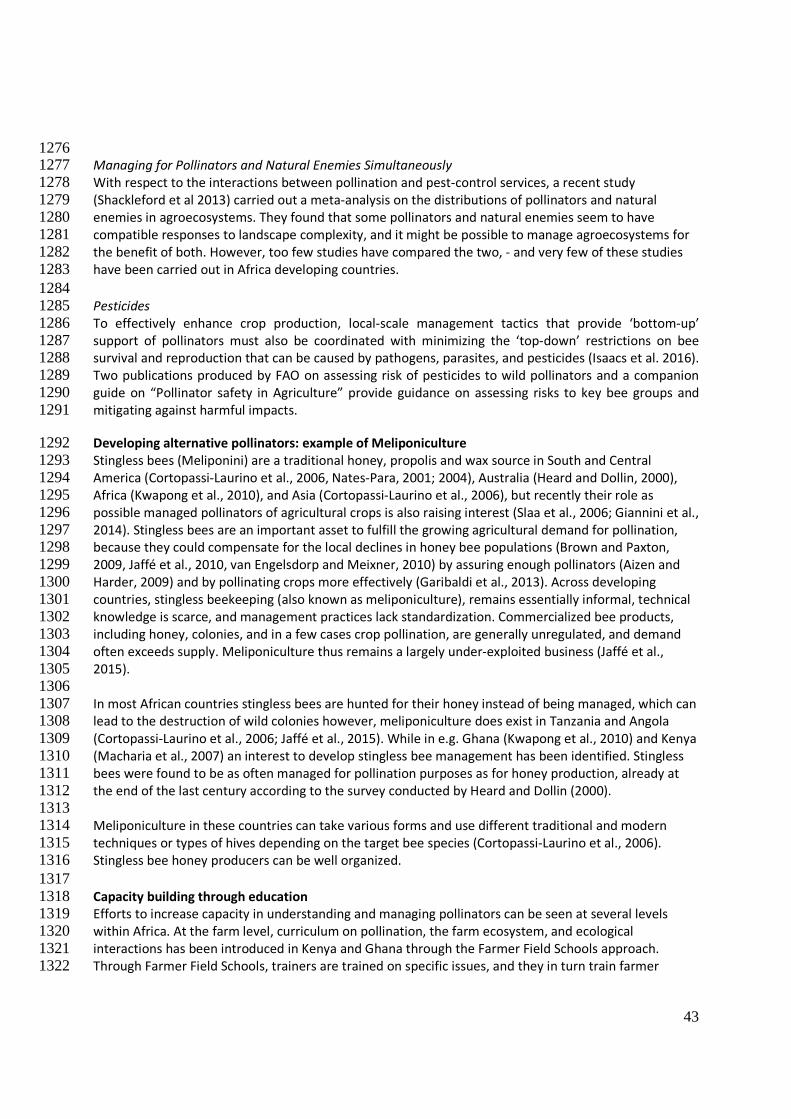
43
1276 Managing for Pollinators and Natural Enemies Simultaneously 1277 With respect to the interactions between pollination and pest-control services, a recent study 1278 (Shackleford et al 2013) carried out a meta-analysis on the distributions of pollinators and natural 1279 enemies in agroecosystems. They found that some pollinators and natural enemies seem to have 1280 compatible responses to landscape complexity, and it might be possible to manage agroecosystems for 1281 the benefit of both. However, too few studies have compared the two, - and very few of these studies 1282 have been carried out in Africa developing countries. 1283 1284 Pesticides 1285 To effectively enhance crop production, local-scale management tactics that provide ‘bottom-up’ 1286 support of pollinators must also be coordinated with minimizing the ‘top-down’ restrictions on bee 1287 survival and reproduction that can be caused by pathogens, parasites, and pesticides (Isaacs et al. 2016). 1288 Two publications produced by FAO on assessing risk of pesticides to wild pollinators and a companion 1289 guide on “Pollinator safety in Agriculture” provide guidance on assessing risks to key bee groups and 1290 mitigating against harmful impacts. 1291
Developing alternative pollinators: example of Meliponiculture 1292 Stingless bees (Meliponini) are a traditional honey, propolis and wax source in South and Central 1293 America (Cortopassi-Laurino et al., 2006, Nates-Para, 2001; 2004), Australia (Heard and Dollin, 2000), 1294 Africa (Kwapong et al., 2010), and Asia (Cortopassi-Laurino et al., 2006), but recently their role as 1295 possible managed pollinators of agricultural crops is also raising interest (Slaa et al., 2006; Giannini et al., 1296 2014). Stingless bees are an important asset to fulfill the growing agricultural demand for pollination, 1297 because they could compensate for the local declines in honey bee populations (Brown and Paxton, 1298 2009, Jaffé et al., 2010, van Engelsdorp and Meixner, 2010) by assuring enough pollinators (Aizen and 1299 Harder, 2009) and by pollinating crops more effectively (Garibaldi et al., 2013). Across developing 1300 countries, stingless beekeeping (also known as meliponiculture), remains essentially informal, technical 1301 knowledge is scarce, and management practices lack standardization. Commercialized bee products, 1302 including honey, colonies, and in a few cases crop pollination, are generally unregulated, and demand 1303 often exceeds supply. Meliponiculture thus remains a largely under-exploited business (Jaffé et al., 1304 2015). 1305 1306 In most African countries stingless bees are hunted for their honey instead of being managed, which can 1307 lead to the destruction of wild colonies however, meliponiculture does exist in Tanzania and Angola 1308 (Cortopassi-Laurino et al., 2006; Jaffé et al., 2015). While in e.g. Ghana (Kwapong et al., 2010) and Kenya 1309 (Macharia et al., 2007) an interest to develop stingless bee management has been identified. Stingless 1310 bees were found to be as often managed for pollination purposes as for honey production, already at 1311 the end of the last century according to the survey conducted by Heard and Dollin (2000). 1312 1313 Meliponiculture in these countries can take various forms and use different traditional and modern 1314 techniques or types of hives depending on the target bee species (Cortopassi-Laurino et al., 2006). 1315 Stingless bee honey producers can be well organized. 1316 1317 Capacity building through education 1318 Efforts to increase capacity in understanding and managing pollinators can be seen at several levels 1319 within Africa. At the farm level, curriculum on pollination, the farm ecosystem, and ecological 1320 interactions has been introduced in Kenya and Ghana through the Farmer Field Schools approach. 1321 Through Farmer Field Schools, trainers are trained on specific issues, and they in turn train farmer 1322
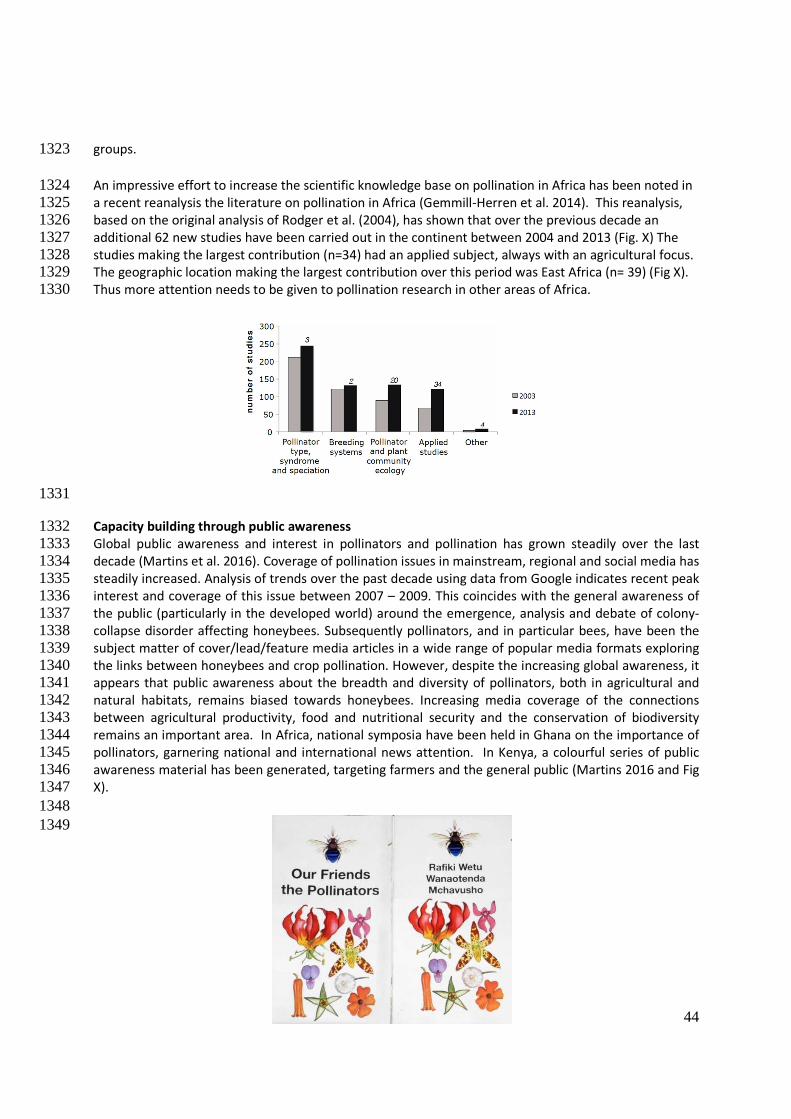
44
groups. 1323
An impressive effort to increase the scientific knowledge base on pollination in Africa has been noted in 1324 a recent reanalysis the literature on pollination in Africa (Gemmill-Herren et al. 2014). This reanalysis, 1325 based on the original analysis of Rodger et al. (2004), has shown that over the previous decade an 1326 additional 62 new studies have been carried out in the continent between 2004 and 2013 (Fig. X) The 1327 studies making the largest contribution (n=34) had an applied subject, always with an agricultural focus. 1328 The geographic location making the largest contribution over this period was East Africa (n= 39) (Fig X). 1329 Thus more attention needs to be given to pollination research in other areas of Africa. 1330
1331
Capacity building through public awareness 1332 Global public awareness and interest in pollinators and pollination has grown steadily over the last 1333 decade (Martins et al. 2016). Coverage of pollination issues in mainstream, regional and social media has 1334 steadily increased. Analysis of trends over the past decade using data from Google indicates recent peak 1335 interest and coverage of this issue between 2007 – 2009. This coincides with the general awareness of 1336 the public (particularly in the developed world) around the emergence, analysis and debate of colony-1337 collapse disorder affecting honeybees. Subsequently pollinators, and in particular bees, have been the 1338 subject matter of cover/lead/feature media articles in a wide range of popular media formats exploring 1339 the links between honeybees and crop pollination. However, despite the increasing global awareness, it 1340 appears that public awareness about the breadth and diversity of pollinators, both in agricultural and 1341 natural habitats, remains biased towards honeybees. Increasing media coverage of the connections 1342 between agricultural productivity, food and nutritional security and the conservation of biodiversity 1343 remains an important area. In Africa, national symposia have been held in Ghana on the importance of 1344 pollinators, garnering national and international news attention. In Kenya, a colourful series of public 1345 awareness material has been generated, targeting farmers and the general public (Martins 2016 and Fig 1346 X). 1347 1348 1349
45
1350 Figure X. Cover of book recently developed and distributed digitally and through 1351 social media by Nature Kenya, with > 3000 downloads in the first few months of 1352
publication; content from the book has been accessed through mobile platforms by 1353 150,000 farmers 1354
1355 Policy measures to support pollinator-friendly farming 1356 Environmentally friendly management methods, such as organic farming, diversified farming systems, 1357 polyculture farming, crop rotations, and conservation practices within agricultural management 1358 prescribed under policy instruments such as agri-environment schemes, are based on such practices. 1359 Also integrated pest management (IPM), which combines biological and cultural control with informed 1360 use of chemicals as part of a system approach to provide targeted and efficient pest management 1361 solutions, could have beneficial effects on pollinators by improving habitat and minimizing the use of 1362 insecticides applied (Gentz et al., 2010). Each of these farming systems needs to be supporting by 1363 enabling policy environments; for example, in some countries such as the Philippines, Farmer Field 1364 School training on IPM has become institutionalized and is a part of national and provincial budgets. 1365 1366 Knowledge gaps, priority capacity building and research areas for Africa 1367 1368 In the section, gaps in knowledge and critical areas for capacity building in pollination and pollinators is 1369 flagged, based on the summary of the information presented above. 1370 1371 Fundamental biology: In a continent often considered to be the cradle of evolution for many taxa, 1372 including humans, a greater understanding of the contribution of animal pollinators to the evolution of 1373 biological diversity in the continent would be a valuable contribution to fundamental biology. The high 1374 dependence, in the tropics, of plant communities on pollination has not been studied in the tropical 1375 forest zone of Africa. The patterns of high bee diversity in arid regions, found in many parts of the 1376 world, has not been documented in Africa. The vulnerability presented to sustaining biodiversity, by 1377 possible high pollination deficits in biodiversity hotspots, has only been documented in South Africa. 1378 The role of pollinators as ecosystem architects and “high-end recyclers” as critical to ecosystem health 1379 merits as much attention is given to the low-end recyclers such as elephants. 1380 1381 Taxonomy of pollinators: A wealth of studies over the last decade, including cases from Africa, point to 1382 the critical importance of wild pollinators. Yet, Africa has a dearth of taxonomists trained to identify 1383 wild pollinator taxa, including bees, moths, wasps, flies and other insects. For this purpose, the 1384 taxonomic capacity to identify pollinators, at least to morphospecies, needs strengthening because 1385 pollinator may only visit certain crops types, and not all flower visitors are pollinators. 1386 1387 Crop pollination critical to food security in Africa: Additional to the comprehensive lists of leading 1388 globally traded crops that have dependence on pollinators, in Africa, there are many indigenous and 1389 agroforestry crops that are both pollinator-dependent and essential for food security on local levels. 1390 Few have been the focus of pollination studies. Marula, for example, is an important agroforestry crop 1391 harvested from wild trees in southern Africa but not all communities understand that they must 1392 conserve male trees even though they do not bear fruit. Additionally, as the world’s attention turns 1393 increasingly to reducing food waste, understanding and addressing the role of insufficient pollination 1394 leading to sub-marketable fruits and vegetables provides a key area of intervention that merits more 1395 study and capacity building. 1396 1397
46
Alternative pollinators: The model of managing stingless bees for pollination, as well elaborated in Latin 1398 America, has proved inspirational to a number of groups within Africa over the last decade. However, 1399 little in the way of scientific studies on ecology and management of alternative pollinators has as yet 1400 been carried out. 1401 1402 Crop pollination ecology: Although pollinator diversity has been flagged as a key input to crop 1403 productivity in other regions, there have been few comprehensive assessments of the impact of 1404 pollinator diversity and pollinator assemblages on crops in Africa, nor on how to manage and sustain 1405 such diversity. Determining the lifecycles of wild pollinators (generation time, number of generations in 1406 a year, timing of reproduction) and assessing how they interact with crops during growing seasons, e.g., 1407 pollinator availability during off-season cultivation through irrigation and alternative food plants for 1408 pollinators when crops are not in flower. Development of pollinator management strategies including 1409 inventories of wild pollinators requires detailed understanding of their phenology, life history and 1410 distribution in relation to crop growing patterns. 1411 1412 Economic valuation of crop pollination: As noted above, the accuracy of the economic methods used 1413 to estimate economic values of pollination is limited by numerous data gaps, and most studies focus on 1414 developed nations. Explicit estimation and consideration of economic benefits through tools such as 1415 cost-benefit analyses and multi-criteria analyses provide information to stakeholders and can help 1416 inform land-use choices with greater recognition of pollinator biodiversity and sustainability. 1417 1418 Honey and beeswax production within Africa: There have been high expectations for “rivers of honey” 1419 that should flow from the Acacia-studded landscapes of Africa, yet levels of production have been 1420 relatively low. Large quantities of honey and beeswax production tends to come from only a very few 1421 countries, suggesting that there is considerable scope for increasing the production of these high-value 1422 products in similar ecologies. An enhanced understanding of honey flows across African landscapes 1423 could benefit from a better understanding of traditional knowledge amongst communities such as Ogiek 1424 in Kenya, who followed bee migrations across time and space. 1425 1426 Threats to honey bee hive health in Africa: Different assessments of honey bee hive health from South 1427 Africa as opposed to Kenya highlight how patchy the understanding of this is in Africa. The fact that 1428 many colonies in Africa originate from swarm trapping provides some compelling differences from other 1429 regions, with implications for higher genetic diversity, meriting greater study. 1430 1431 Pollinators and climate change: Climate change is expected to lead to fluctuating and frequently 1432 reducing, crop yields in Africa, as El-Niño-like events increase as is predicted in most climate models 1433 Diversification and cultivating drought tolerant annual fruits and vegetables is one of the options that 1434 have been proposed for farmers adapting to climate change. But little is known about how pollinators 1435 may adapt their life history strategies when growing seasons are either shorter, or lengthened with 1436 irrigation, and research addressing this is needed. In wild ecosystems, groups such as fig wasps which 1437 are a highly critical resource for wide variety of animals throughout the continent have been shown in 1438 other regions of the world to be vulnerable to local extinctions due to climate change events. Yet 1439 almost nothing is known about the size and variability of pollinating wasp populations in Africa, or other 1440 taxa which may be susceptible to climate change impacts. 1441 1442 Recognition and appreciation of local and traditional knowledge: An important basis for such research 1443 on pollination in Africa is the recognition that considerable local knowledge already exists. Interventions 1444 to sustain ecosystem services are likely to be highly site-specific and will need to be developed through a 1445
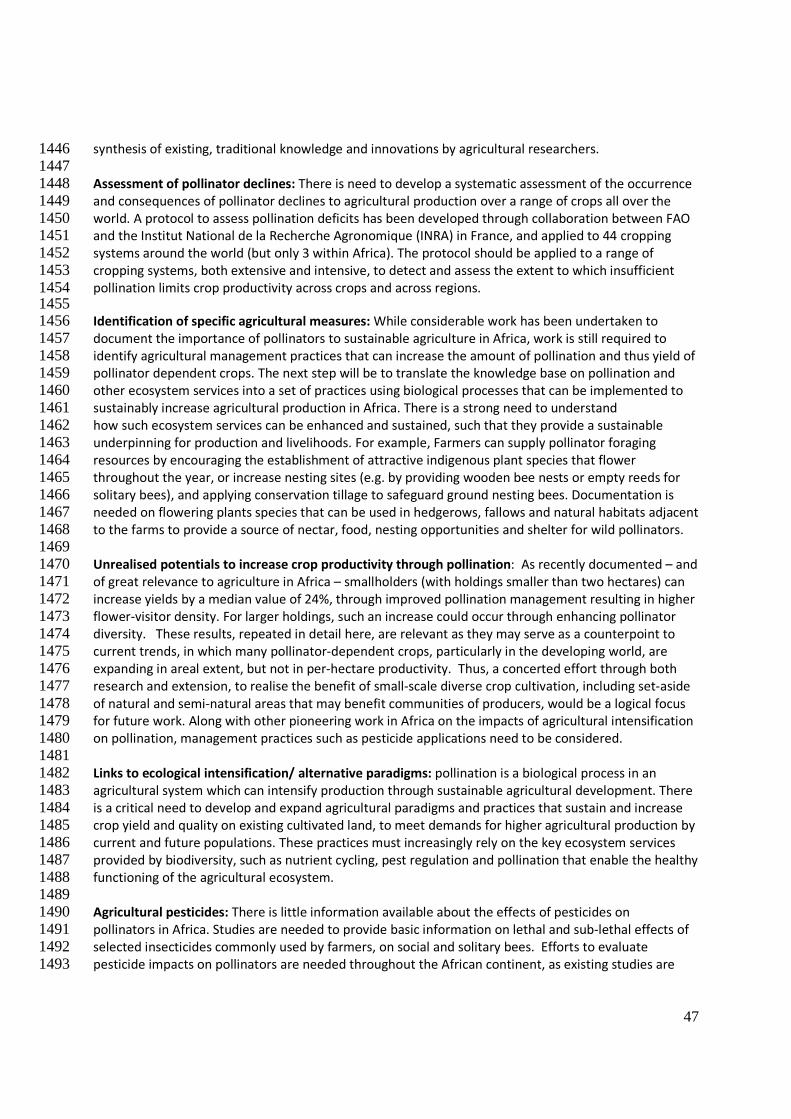
47
synthesis of existing, traditional knowledge and innovations by agricultural researchers. 1446 1447 Assessment of pollinator declines: There is need to develop a systematic assessment of the occurrence 1448 and consequences of pollinator declines to agricultural production over a range of crops all over the 1449 world. A protocol to assess pollination deficits has been developed through collaboration between FAO 1450 and the Institut National de la Recherche Agronomique (INRA) in France, and applied to 44 cropping 1451 systems around the world (but only 3 within Africa). The protocol should be applied to a range of 1452 cropping systems, both extensive and intensive, to detect and assess the extent to which insufficient 1453 pollination limits crop productivity across crops and across regions. 1454 1455 Identification of specific agricultural measures: While considerable work has been undertaken to 1456 document the importance of pollinators to sustainable agriculture in Africa, work is still required to 1457 identify agricultural management practices that can increase the amount of pollination and thus yield of 1458 pollinator dependent crops. The next step will be to translate the knowledge base on pollination and 1459 other ecosystem services into a set of practices using biological processes that can be implemented to 1460 sustainably increase agricultural production in Africa. There is a strong need to understand 1461 how such ecosystem services can be enhanced and sustained, such that they provide a sustainable 1462 underpinning for production and livelihoods. For example, Farmers can supply pollinator foraging 1463 resources by encouraging the establishment of attractive indigenous plant species that flower 1464 throughout the year, or increase nesting sites (e.g. by providing wooden bee nests or empty reeds for 1465 solitary bees), and applying conservation tillage to safeguard ground nesting bees. Documentation is 1466 needed on flowering plants species that can be used in hedgerows, fallows and natural habitats adjacent 1467 to the farms to provide a source of nectar, food, nesting opportunities and shelter for wild pollinators. 1468 1469 Unrealised potentials to increase crop productivity through pollination: As recently documented – and 1470 of great relevance to agriculture in Africa – smallholders (with holdings smaller than two hectares) can 1471 increase yields by a median value of 24%, through improved pollination management resulting in higher 1472 flower-visitor density. For larger holdings, such an increase could occur through enhancing pollinator 1473 diversity. These results, repeated in detail here, are relevant as they may serve as a counterpoint to 1474 current trends, in which many pollinator-dependent crops, particularly in the developing world, are 1475 expanding in areal extent, but not in per-hectare productivity. Thus, a concerted effort through both 1476 research and extension, to realise the benefit of small-scale diverse crop cultivation, including set-aside 1477 of natural and semi-natural areas that may benefit communities of producers, would be a logical focus 1478 for future work. Along with other pioneering work in Africa on the impacts of agricultural intensification 1479 on pollination, management practices such as pesticide applications need to be considered. 1480 1481 Links to ecological intensification/ alternative paradigms: pollination is a biological process in an 1482 agricultural system which can intensify production through sustainable agricultural development. There 1483 is a critical need to develop and expand agricultural paradigms and practices that sustain and increase 1484 crop yield and quality on existing cultivated land, to meet demands for higher agricultural production by 1485 current and future populations. These practices must increasingly rely on the key ecosystem services 1486 provided by biodiversity, such as nutrient cycling, pest regulation and pollination that enable the healthy 1487 functioning of the agricultural ecosystem. 1488 1489 Agricultural pesticides: There is little information available about the effects of pesticides on 1490 pollinators in Africa. Studies are needed to provide basic information on lethal and sub-lethal effects of 1491 selected insecticides commonly used by farmers, on social and solitary bees. Efforts to evaluate 1492 pesticide impacts on pollinators are needed throughout the African continent, as existing studies are 1493
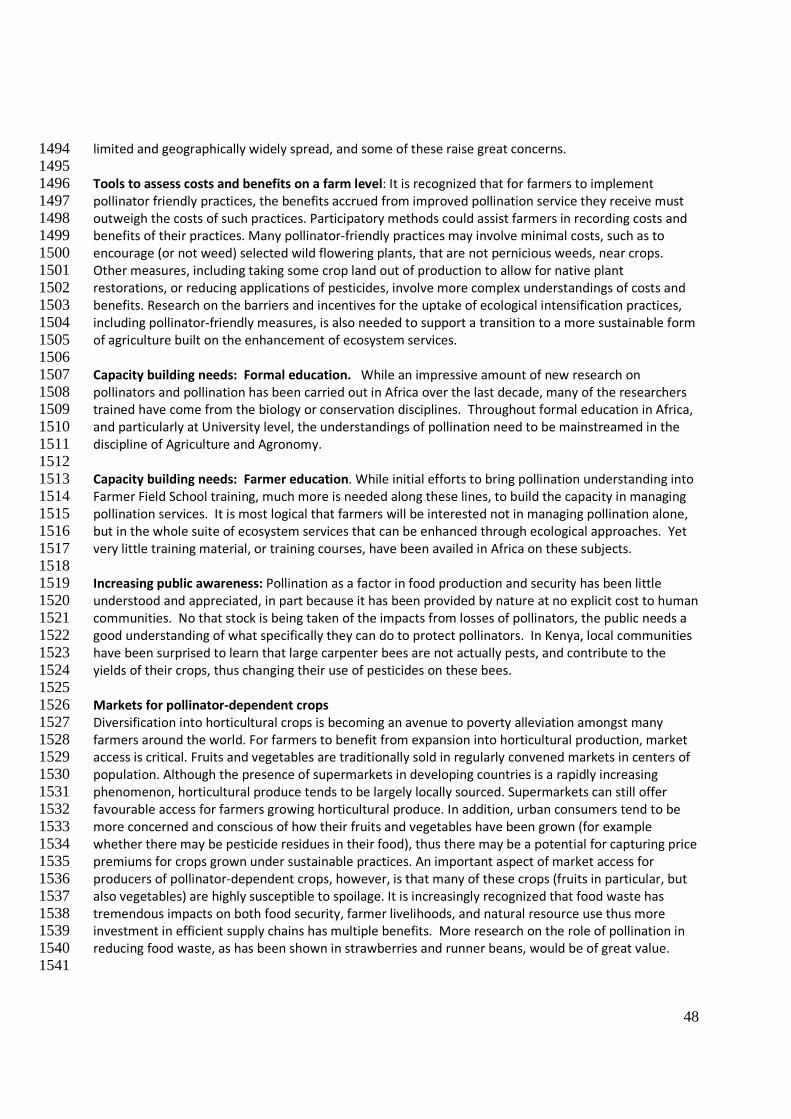
48
limited and geographically widely spread, and some of these raise great concerns. 1494 1495 Tools to assess costs and benefits on a farm level: It is recognized that for farmers to implement 1496 pollinator friendly practices, the benefits accrued from improved pollination service they receive must 1497 outweigh the costs of such practices. Participatory methods could assist farmers in recording costs and 1498 benefits of their practices. Many pollinator-friendly practices may involve minimal costs, such as to 1499 encourage (or not weed) selected wild flowering plants, that are not pernicious weeds, near crops. 1500 Other measures, including taking some crop land out of production to allow for native plant 1501 restorations, or reducing applications of pesticides, involve more complex understandings of costs and 1502 benefits. Research on the barriers and incentives for the uptake of ecological intensification practices, 1503 including pollinator-friendly measures, is also needed to support a transition to a more sustainable form 1504 of agriculture built on the enhancement of ecosystem services. 1505 1506 Capacity building needs: Formal education. While an impressive amount of new research on 1507 pollinators and pollination has been carried out in Africa over the last decade, many of the researchers 1508 trained have come from the biology or conservation disciplines. Throughout formal education in Africa, 1509 and particularly at University level, the understandings of pollination need to be mainstreamed in the 1510 discipline of Agriculture and Agronomy. 1511 1512 Capacity building needs: Farmer education. While initial efforts to bring pollination understanding into 1513 Farmer Field School training, much more is needed along these lines, to build the capacity in managing 1514 pollination services. It is most logical that farmers will be interested not in managing pollination alone, 1515 but in the whole suite of ecosystem services that can be enhanced through ecological approaches. Yet 1516 very little training material, or training courses, have been availed in Africa on these subjects. 1517 1518 Increasing public awareness: Pollination as a factor in food production and security has been little 1519 understood and appreciated, in part because it has been provided by nature at no explicit cost to human 1520 communities. No that stock is being taken of the impacts from losses of pollinators, the public needs a 1521 good understanding of what specifically they can do to protect pollinators. In Kenya, local communities 1522 have been surprised to learn that large carpenter bees are not actually pests, and contribute to the 1523 yields of their crops, thus changing their use of pesticides on these bees. 1524 1525 Markets for pollinator-dependent crops 1526 Diversification into horticultural crops is becoming an avenue to poverty alleviation amongst many 1527 farmers around the world. For farmers to benefit from expansion into horticultural production, market 1528 access is critical. Fruits and vegetables are traditionally sold in regularly convened markets in centers of 1529 population. Although the presence of supermarkets in developing countries is a rapidly increasing 1530 phenomenon, horticultural produce tends to be largely locally sourced. Supermarkets can still offer 1531 favourable access for farmers growing horticultural produce. In addition, urban consumers tend to be 1532 more concerned and conscious of how their fruits and vegetables have been grown (for example 1533 whether there may be pesticide residues in their food), thus there may be a potential for capturing price 1534 premiums for crops grown under sustainable practices. An important aspect of market access for 1535 producers of pollinator-dependent crops, however, is that many of these crops (fruits in particular, but 1536 also vegetables) are highly susceptible to spoilage. It is increasingly recognized that food waste has 1537 tremendous impacts on both food security, farmer livelihoods, and natural resource use thus more 1538 investment in efficient supply chains has multiple benefits. More research on the role of pollination in 1539 reducing food waste, as has been shown in strawberries and runner beans, would be of great value. 1540 1541
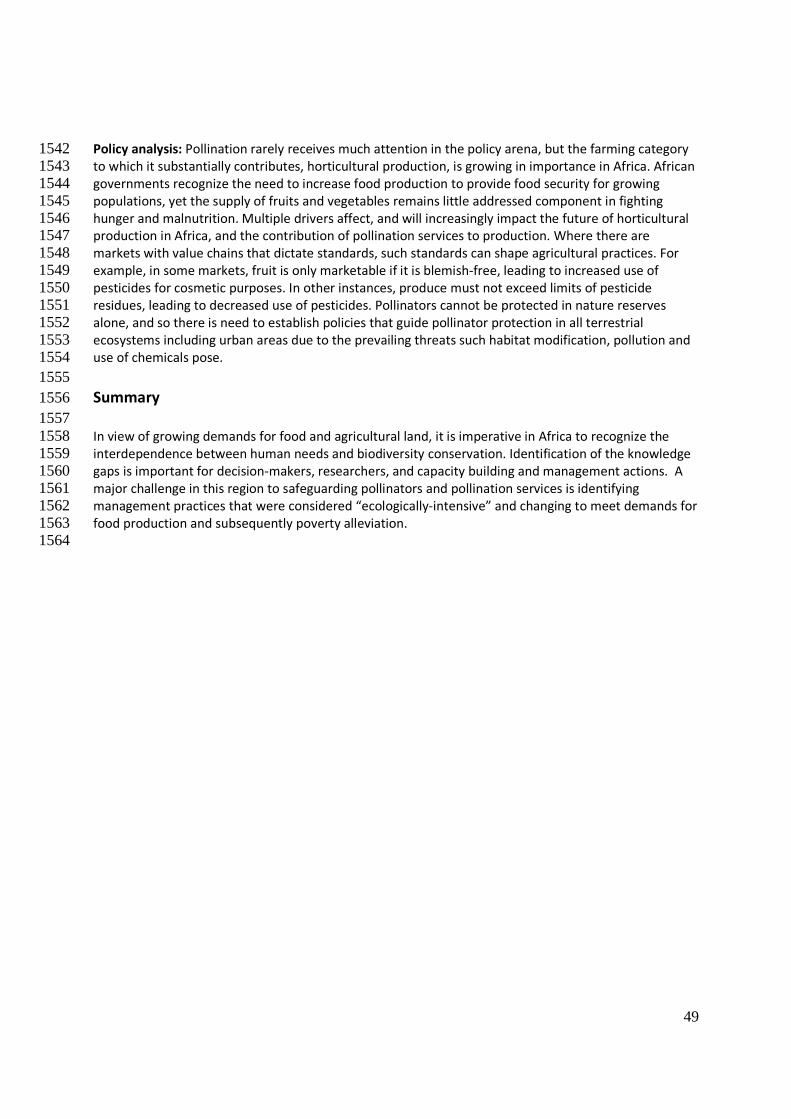
49
Policy analysis: Pollination rarely receives much attention in the policy arena, but the farming category 1542 to which it substantially contributes, horticultural production, is growing in importance in Africa. African 1543 governments recognize the need to increase food production to provide food security for growing 1544 populations, yet the supply of fruits and vegetables remains little addressed component in fighting 1545 hunger and malnutrition. Multiple drivers affect, and will increasingly impact the future of horticultural 1546 production in Africa, and the contribution of pollination services to production. Where there are 1547 markets with value chains that dictate standards, such standards can shape agricultural practices. For 1548 example, in some markets, fruit is only marketable if it is blemish-free, leading to increased use of 1549 pesticides for cosmetic purposes. In other instances, produce must not exceed limits of pesticide 1550 residues, leading to decreased use of pesticides. Pollinators cannot be protected in nature reserves 1551 alone, and so there is need to establish policies that guide pollinator protection in all terrestrial 1552 ecosystems including urban areas due to the prevailing threats such habitat modification, pollution and 1553 use of chemicals pose. 1554 1555 Summary 1556 1557 In view of growing demands for food and agricultural land, it is imperative in Africa to recognize the 1558 interdependence between human needs and biodiversity conservation. Identification of the knowledge 1559 gaps is important for decision-makers, researchers, and capacity building and management actions. A 1560 major challenge in this region to safeguarding pollinators and pollination services is identifying 1561 management practices that were considered “ecologically-intensive” and changing to meet demands for 1562 food production and subsequently poverty alleviation. 1563 1564