Embed Size (px)
Citation preview
March 9, 2015
Regio
nal
SEC
TO
R R
ESEA
RC
H |
SEE PAGE 23 FOR IMPORTANT DISCLOSURES AND ANALYST CERTIFICATIONS
Regional Materials
Gems, Picks & Shovels
Material Headlines Clean air in China by 2020? Thermal coal consumption fell in
2014 – the first YoY decrease in 10 years. Targets for thermal power and coal point to low growth and some declines ahead – good for the air quality but not for coal companies (IHS, MKE).
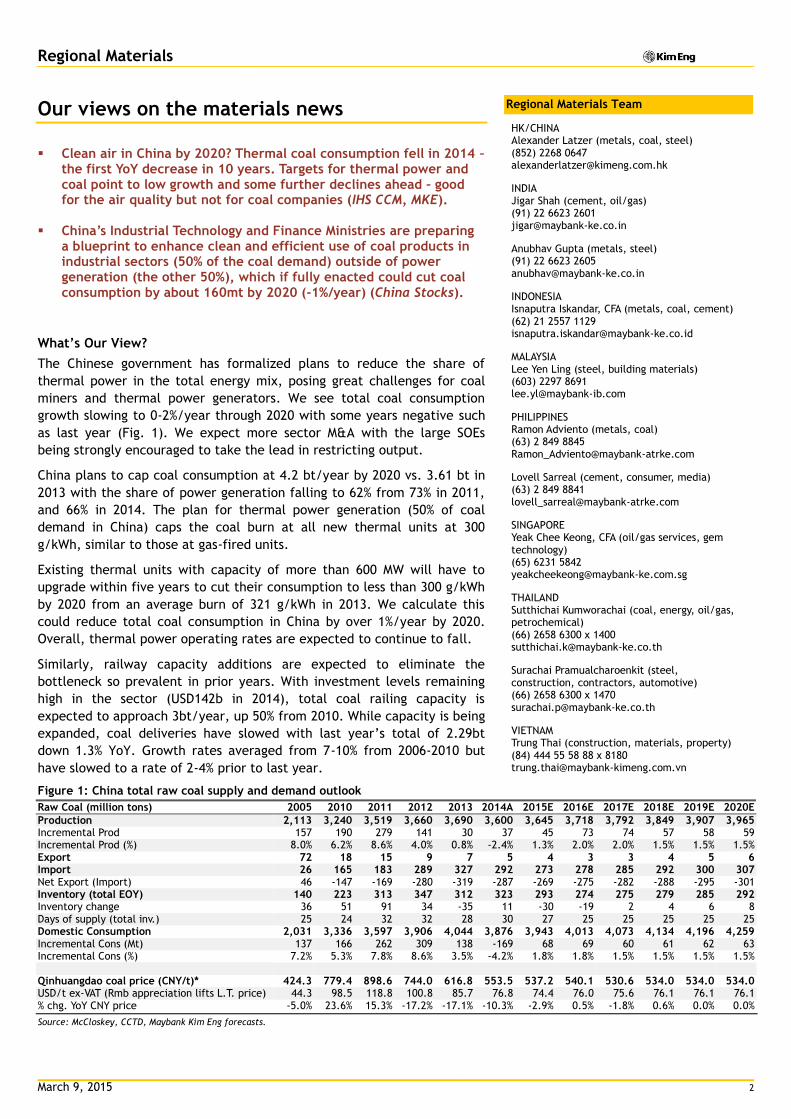
China’s weak steel demand and rising exports pose a threat to
regional steel producers (Japan Iron & Steel Federation) – but
the upside is weak iron ore prices/costs. China’s exports of
finished steel in Jan 2015 reached 10.29mt, a new all-time
high, up 1.2% from Dec and 52% YoY. New capacity in higher-
value markets is exceeding demand growth.
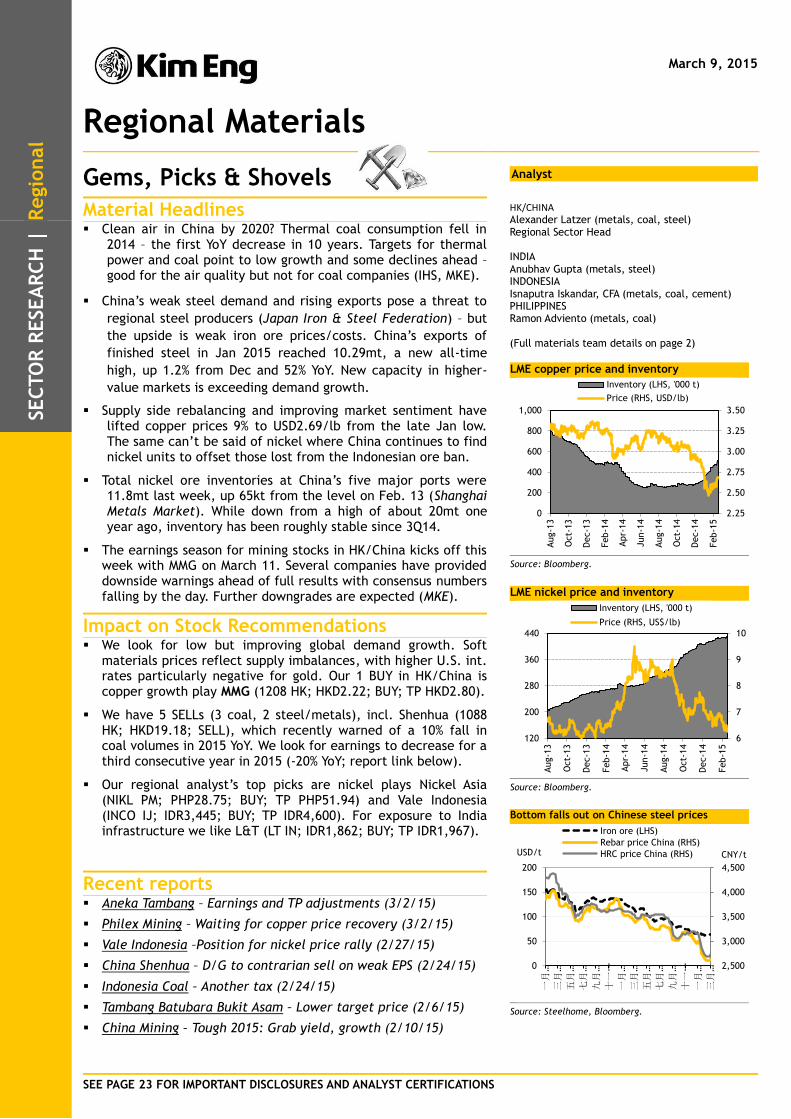
Supply side rebalancing and improving market sentiment have lifted copper prices 9% to USD2.69/lb from the late Jan low. The same can’t be said of nickel where China continues to find nickel units to offset those lost from the Indonesian ore ban.
Total nickel ore inventories at China’s five major ports were 11.8mt last week, up 65kt from the level on Feb. 13 (Shanghai Metals Market). While down from a high of about 20mt one year ago, inventory has been roughly stable since 3Q14.
The earnings season for mining stocks in HK/China kicks off this week with MMG on March 11. Several companies have provided downside warnings ahead of full results with consensus numbers falling by the day. Further downgrades are expected (MKE).
Impact on Stock Recommendations
We look for low but improving global demand growth. Soft materials prices reflect supply imbalances, with higher U.S. int. rates particularly negative for gold. Our 1 BUY in HK/China is copper growth play MMG (1208 HK; HKD2.22; BUY; TP HKD2.80).
We have 5 SELLs (3 coal, 2 steel/metals), incl. Shenhua (1088 HK; HKD19.18; SELL), which recently warned of a 10% fall in coal volumes in 2015 YoY. We look for earnings to decrease for a third consecutive year in 2015 (-20% YoY; report link below).
Our regional analyst’s top picks are nickel plays Nickel Asia (NIKL PM; PHP28.75; BUY; TP PHP51.94) and Vale Indonesia (INCO IJ; IDR3,445; BUY; TP IDR4,600). For exposure to India infrastructure we like L&T (LT IN; IDR1,862; BUY; TP IDR1,967).
Recent reports Aneka Tambang – Earnings and TP adjustments (3/2/15)
Philex Mining – Waiting for copper price recovery (3/2/15)
Vale Indonesia –Position for nickel price rally (2/27/15)
China Shenhua – D/G to contrarian sell on weak EPS (2/24/15)
Indonesia Coal – Another tax (2/24/15)
Tambang Batubara Bukit Asam – Lower target price (2/6/15)
China Mining – Tough 2015: Grab yield, growth (2/10/15)
Analyst
HK/CHINA Alexander Latzer (metals, coal, steel) Regional Sector Head INDIA Anubhav Gupta (metals, steel) INDONESIA Isnaputra Iskandar, CFA (metals, coal, cement) PHILIPPINES Ramon Adviento (metals, coal) (Full materials team details on page 2)
LME copper price and inventory
Source: Bloomberg.
LME nickel price and inventory
Source: Bloomberg.
Bottom falls out on Chinese steel prices
Source: Steelhome, Bloomberg.
2.25
2.50
2.75
3.00
3.25
3.50
0
200
400
600
800
1,000
Aug-1
3
Oct-
13
Dec-1
3
Feb-1
4
Apr-
14
Jun-1
4
Aug-1
4
Oct-
14
Dec-1
4
Feb-1
5
Inventory (LHS, '000 t)
Price (RHS, USD/lb)
6
7
8
9
10
120
200
280
360
440
Aug-1
3
Oct-
13
Dec-1
3
Feb-1
4
Apr-
14
Jun-1
4
Aug-1
4
Oct-
14
Dec-1
4
Feb-1
5
Inventory (LHS, '000 t)
Price (RHS, US$/lb)
2,500
3,000
3,500
4,000
4,500
0
50
100
150
200
一月
…
三月
…
五月
…
七月
…
九月
…
十一
…
一月
…
三月
…
五月
…
七月
…
九月
…
十一
…
一月
…
三月
…
Iron ore (LHS)
Rebar price China (RHS)
HRC price China (RHS)USD/t CNY/t
March 9, 2015 2
Regional Materials
Our views on the materials news
Clean air in China by 2020? Thermal coal consumption fell in 2014 –
the first YoY decrease in 10 years. Targets for thermal power and coal point to low growth and some further declines ahead – good for the air quality but not for coal companies (IHS CCM, MKE).
China’s Industrial Technology and Finance Ministries are preparing a blueprint to enhance clean and efficient use of coal products in industrial sectors (50% of the coal demand) outside of power generation (the other 50%), which if fully enacted could cut coal consumption by about 160mt by 2020 (-1%/year) (China Stocks).
What’s Our View?
The Chinese government has formalized plans to reduce the share of
thermal power in the total energy mix, posing great challenges for coal
miners and thermal power generators. We see total coal consumption
growth slowing to 0-2%/year through 2020 with some years negative such
as last year (Fig. 1). We expect more sector M&A with the large SOEs
being strongly encouraged to take the lead in restricting output.
China plans to cap coal consumption at 4.2 bt/year by 2020 vs. 3.61 bt in
2013 with the share of power generation falling to 62% from 73% in 2011,
and 66% in 2014. The plan for thermal power generation (50% of coal
demand in China) caps the coal burn at all new thermal units at 300
g/kWh, similar to those at gas-fired units.
Existing thermal units with capacity of more than 600 MW will have to
upgrade within five years to cut their consumption to less than 300 g/kWh
by 2020 from an average burn of 321 g/kWh in 2013. We calculate this
could reduce total coal consumption in China by over 1%/year by 2020.
Overall, thermal power operating rates are expected to continue to fall.
Similarly, railway capacity additions are expected to eliminate the
bottleneck so prevalent in prior years. With investment levels remaining
high in the sector (USD142b in 2014), total coal railing capacity is
expected to approach 3bt/year, up 50% from 2010. While capacity is being
expanded, coal deliveries have slowed with last year’s total of 2.29bt
down 1.3% YoY. Growth rates averaged from 7-10% from 2006-2010 but
have slowed to a rate of 2-4% prior to last year.
Figure 1: China total raw coal supply and demand outlook
Raw Coal (million tons) 2005 2010 2011 2012 2013 2014A 2015E 2016E 2017E 2018E 2019E 2020E
Production 2,113 3,240 3,519 3,660 3,690 3,600 3,645 3,718 3,792 3,849 3,907 3,965 Incremental Prod 157 190 279 141 30 37 45 73 74 57 58 59 Incremental Prod (%) 8.0% 6.2% 8.6% 4.0% 0.8% -2.4% 1.3% 2.0% 2.0% 1.5% 1.5% 1.5% Export 72 18 15 9 7 5 4 3 3 4 5 6 Import 26 165 183 289 327 292 273 278 285 292 300 307 Net Export (Import) 46 -147 -169 -280 -319 -287 -269 -275 -282 -288 -295 -301 Inventory (total EOY) 140 223 313 347 312 323 293 274 275 279 285 292 Inventory change 36 51 91 34 -35 11 -30 -19 2 4 6 8 Days of supply (total inv.) 25 24 32 32 28 30 27 25 25 25 25 25 Domestic Consumption 2,031 3,336 3,597 3,906 4,044 3,876 3,943 4,013 4,073 4,134 4,196 4,259 Incremental Cons (Mt) 137 166 262 309 138 -169 68 69 60 61 62 63 Incremental Cons (%) 7.2% 5.3% 7.8% 8.6% 3.5% -4.2% 1.8% 1.8% 1.5% 1.5% 1.5% 1.5%
Qinhuangdao coal price (CNY/t)* 424.3 779.4 898.6 744.0 616.8 553.5 537.2 540.1 530.6 534.0 534.0 534.0 USD/t ex-VAT (Rmb appreciation lifts L.T. price) 44.3 98.5 118.8 100.8 85.7 76.8 74.4 76.0 75.6 76.1 76.1 76.1 % chg. YoY CNY price -5.0% 23.6% 15.3% -17.2% -17.1% -10.3% -2.9% 0.5% -1.8% 0.6% 0.0% 0.0%
Source: McCloskey, CCTD, Maybank Kim Eng forecasts.
Regional Materials Team
HK/CHINA Alexander Latzer (metals, coal, steel) (852) 2268 0647 [email protected]
INDIA Jigar Shah (cement, oil/gas) (91) 22 6623 2601 [email protected]
Anubhav Gupta (metals, steel) (91) 22 6623 2605 [email protected]
INDONESIA Isnaputra Iskandar, CFA (metals, coal, cement) (62) 21 2557 1129 [email protected]
MALAYSIA Lee Yen Ling (steel, building materials) (603) 2297 8691 [email protected]
PHILIPPINES Ramon Adviento (metals, coal) (63) 2 849 8845 [email protected]
Lovell Sarreal (cement, consumer, media) (63) 2 849 8841 [email protected]
SINGAPORE Yeak Chee Keong, CFA (oil/gas services, gem technology) (65) 6231 5842 [email protected]
THAILAND Sutthichai Kumworachai (coal, energy, oil/gas, petrochemical) (66) 2658 6300 x 1400 [email protected]
Surachai Pramualcharoenkit (steel, construction, contractors, automotive) (66) 2658 6300 x 1470 [email protected]
VIETNAM Trung Thai (construction, materials, property) (84) 444 55 58 88 x 8180 [email protected]
March 9, 2015 3
Regional Materials
China is also rolling out a carbon trading system, which should be fully
functional and active nationwide by 2020. Carbon trading started in 2011
under pilot programmes in Shenzhen, Beijing, Shanghai, Tianjin,
Guangdong, Hubei and Chongqing. The country is seeking to reduce its CO2
emissions by 40-45% by 2020 vs 2005 levels with carbon trading being seen
as an important driver when trading matures in 2020.
China’s steel demand is decreasing and its exports increasing, posing
a continuous threat to the export market share of regional steel
producers (Japan Iron & Steel Federation). China’s exports of
finished steel in Jan. 2015 reached 10.29mt, up 1.2% from
December and an increase of 52% YoY to a new all-time high.
What’s Our View?
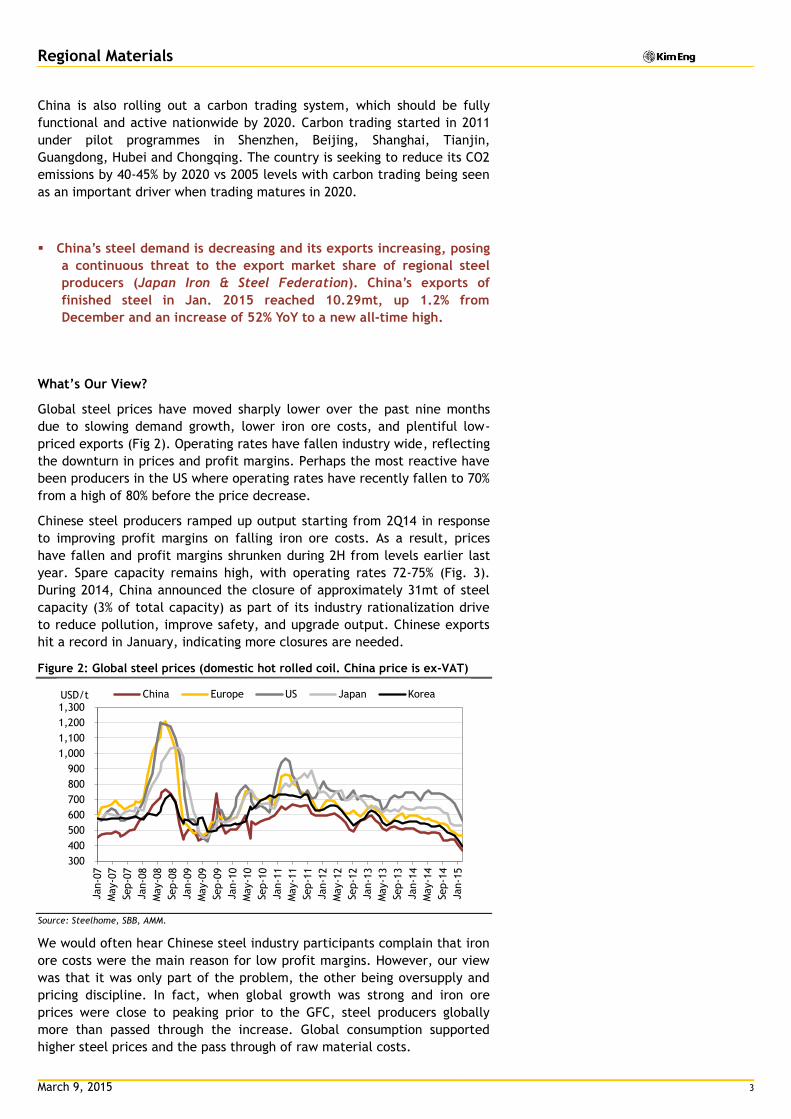
Global steel prices have moved sharply lower over the past nine months
due to slowing demand growth, lower iron ore costs, and plentiful low-
priced exports (Fig 2). Operating rates have fallen industry wide, reflecting
the downturn in prices and profit margins. Perhaps the most reactive have
been producers in the US where operating rates have recently fallen to 70%
from a high of 80% before the price decrease.
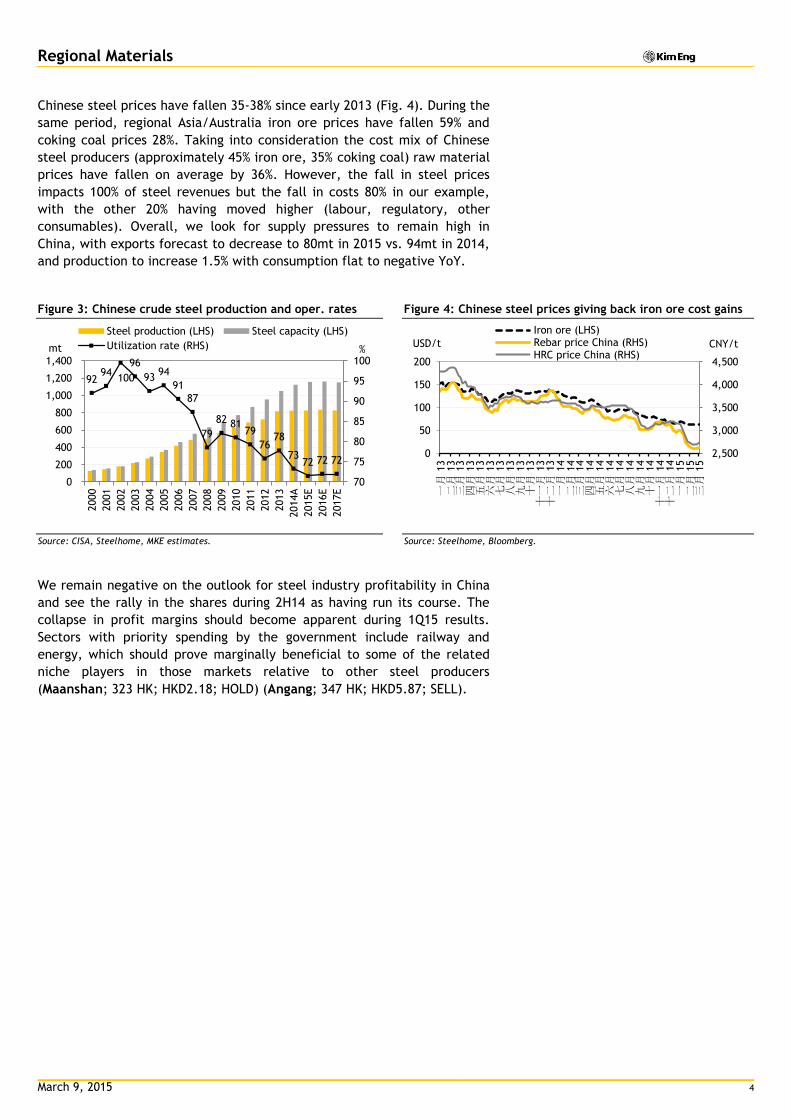
Chinese steel producers ramped up output starting from 2Q14 in response
to improving profit margins on falling iron ore costs. As a result, prices
have fallen and profit margins shrunken during 2H from levels earlier last
year. Spare capacity remains high, with operating rates 72-75% (Fig. 3).
During 2014, China announced the closure of approximately 31mt of steel
capacity (3% of total capacity) as part of its industry rationalization drive
to reduce pollution, improve safety, and upgrade output. Chinese exports
hit a record in January, indicating more closures are needed.
Figure 2: Global steel prices (domestic hot rolled coil. China price is ex-VAT)
Source: Steelhome, SBB, AMM.
We would often hear Chinese steel industry participants complain that iron
ore costs were the main reason for low profit margins. However, our view
was that it was only part of the problem, the other being oversupply and
pricing discipline. In fact, when global growth was strong and iron ore
prices were close to peaking prior to the GFC, steel producers globally
more than passed through the increase. Global consumption supported
higher steel prices and the pass through of raw material costs.
300
400
500
600
700
800
900
1,000
1,100
1,200
1,300USD/t China Europe US Japan Korea
March 9, 2015 4
Regional Materials
Chinese steel prices have fallen 35-38% since early 2013 (Fig. 4). During the
same period, regional Asia/Australia iron ore prices have fallen 59% and
coking coal prices 28%. Taking into consideration the cost mix of Chinese
steel producers (approximately 45% iron ore, 35% coking coal) raw material
prices have fallen on average by 36%. However, the fall in steel prices
impacts 100% of steel revenues but the fall in costs 80% in our example,
with the other 20% having moved higher (labour, regulatory, other
consumables). Overall, we look for supply pressures to remain high in
China, with exports forecast to decrease to 80mt in 2015 vs. 94mt in 2014,
and production to increase 1.5% with consumption flat to negative YoY.
Figure 3: Chinese crude steel production and oper. rates Figure 4: Chinese steel prices giving back iron ore cost gains
Source: CISA, Steelhome, MKE estimates. Source: Steelhome, Bloomberg.
We remain negative on the outlook for steel industry profitability in China
and see the rally in the shares during 2H14 as having run its course. The
collapse in profit margins should become apparent during 1Q15 results.
Sectors with priority spending by the government include railway and
energy, which should prove marginally beneficial to some of the related
niche players in those markets relative to other steel producers
(Maanshan; 323 HK; HKD2.18; HOLD) (Angang; 347 HK; HKD5.87; SELL).
92 94
100
96
93 94
91
87
79
82 81 79
76 78
73 72 72 72
70
75
80
85
90
95
100
0
200
400
600
800
1,000
1,200
1,400
2000
2001
2002
2003
2004
2005
2006
2007
2008
2009
2010
2011
2012
2013
2014A
2015E
2016E
2017E
% mt
Steel production (LHS) Steel capacity (LHS)
Utilization rate (RHS)
2,500
3,000
3,500
4,000
4,500
0
50
100
150
200
一月
13
二月
13
三月
13
四月
13
五月
13
六月
13
七月
13
八月
13
九月
13
十月
13
十一
月 1
3
十二
月 1
3
一月
14
二月
14
三月
14
四月
14
五月
14
六月
14
七月
14
八月
14
九月
14
十月
14
十一
月 1
4
十二
月 1
4
一月
15
二月
15
三月
15
Iron ore (LHS)Rebar price China (RHS)HRC price China (RHS)
USD/t CNY/t
March 9, 2015 5
Regional Materials
Supply side rebalancing and improving market sentiment have lifted copper prices by 9% to USD2.69/lb from the late Jan low. The same can’t be said of nickel where China continues to find nickel units to offset those lost from the Indonesian ore ban.
What’s Our View?
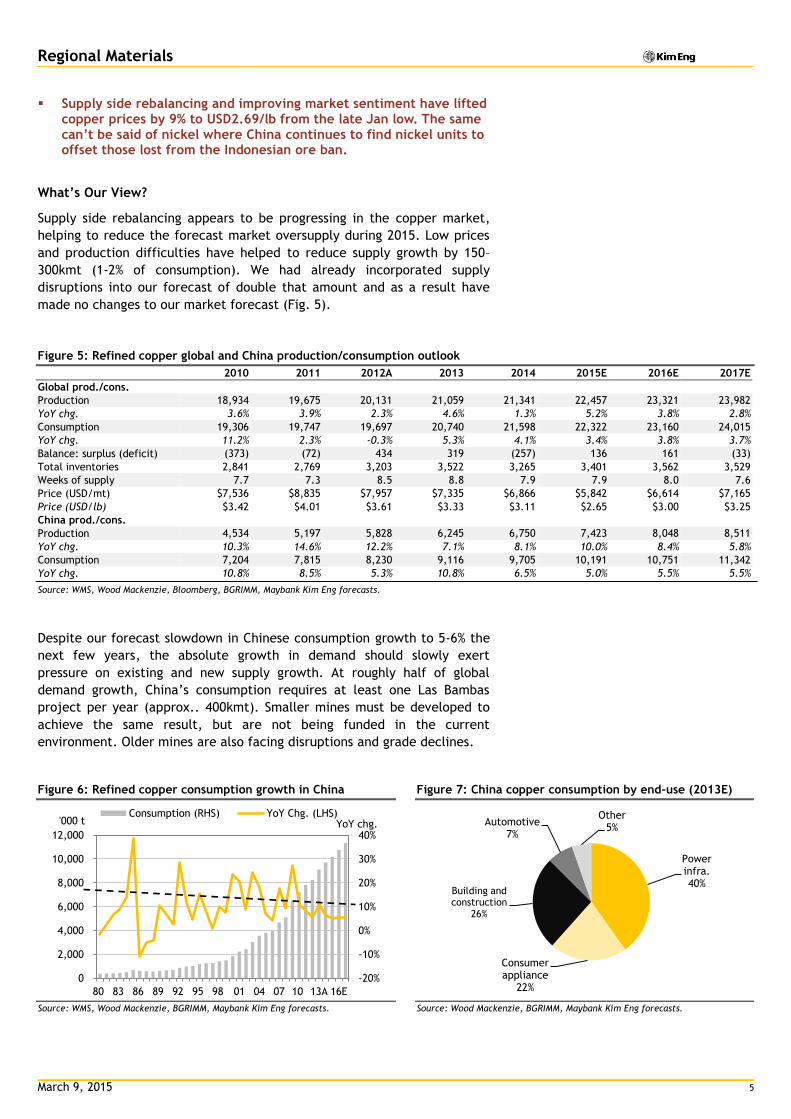
Supply side rebalancing appears to be progressing in the copper market,
helping to reduce the forecast market oversupply during 2015. Low prices
and production difficulties have helped to reduce supply growth by 150–
300kmt (1-2% of consumption). We had already incorporated supply
disruptions into our forecast of double that amount and as a result have
made no changes to our market forecast (Fig. 5).
Figure 5: Refined copper global and China production/consumption outlook
2010 2011 2012A 2013 2014 2015E 2016E 2017E
Global prod./cons.
Production 18,934 19,675 20,131 21,059 21,341 22,457 23,321 23,982
YoY chg. 3.6% 3.9% 2.3% 4.6% 1.3% 5.2% 3.8% 2.8%
Consumption 19,306 19,747 19,697 20,740 21,598 22,322 23,160 24,015
YoY chg. 11.2% 2.3% -0.3% 5.3% 4.1% 3.4% 3.8% 3.7%
Balance: surplus (deficit) (373) (72) 434 319 (257) 136 161 (33)
Total inventories 2,841 2,769 3,203 3,522 3,265 3,401 3,562 3,529
Weeks of supply 7.7 7.3 8.5 8.8 7.9 7.9 8.0 7.6
Price (USD/mt) $7,536 $8,835 $7,957 $7,335 $6,866 $5,842 $6,614 $7,165
Price (USD/lb) $3.42 $4.01 $3.61 $3.33 $3.11 $2.65 $3.00 $3.25
China prod./cons. Production 4,534 5,197 5,828 6,245 6,750 7,423 8,048 8,511
YoY chg. 10.3% 14.6% 12.2% 7.1% 8.1% 10.0% 8.4% 5.8%
Consumption 7,204 7,815 8,230 9,116 9,705 10,191 10,751 11,342
YoY chg. 10.8% 8.5% 5.3% 10.8% 6.5% 5.0% 5.5% 5.5%
Source: WMS, Wood Mackenzie, Bloomberg, BGRIMM, Maybank Kim Eng forecasts.
Despite our forecast slowdown in Chinese consumption growth to 5-6% the
next few years, the absolute growth in demand should slowly exert
pressure on existing and new supply growth. At roughly half of global
demand growth, China’s consumption requires at least one Las Bambas
project per year (approx.. 400kmt). Smaller mines must be developed to
achieve the same result, but are not being funded in the current
environment. Older mines are also facing disruptions and grade declines.
Figure 6: Refined copper consumption growth in China Figure 7: China copper consumption by end-use (2013E)
Source: WMS, Wood Mackenzie, BGRIMM, Maybank Kim Eng forecasts. Source: Wood Mackenzie, BGRIMM, Maybank Kim Eng forecasts.
0
2,000
4,000
6,000
8,000
10,000
12,000
-20%
-10%
0%
10%
20%
30%
40%
80 83 86 89 92 95 98 01 04 07 10 13A 16E
'000 t YoY chg. Consumption (RHS) YoY Chg. (LHS)
Power infra. 40%
Consumer appliance
22%
Building and construction
26%
Automotive 7%
Other 5%
March 9, 2015 6
Regional Materials
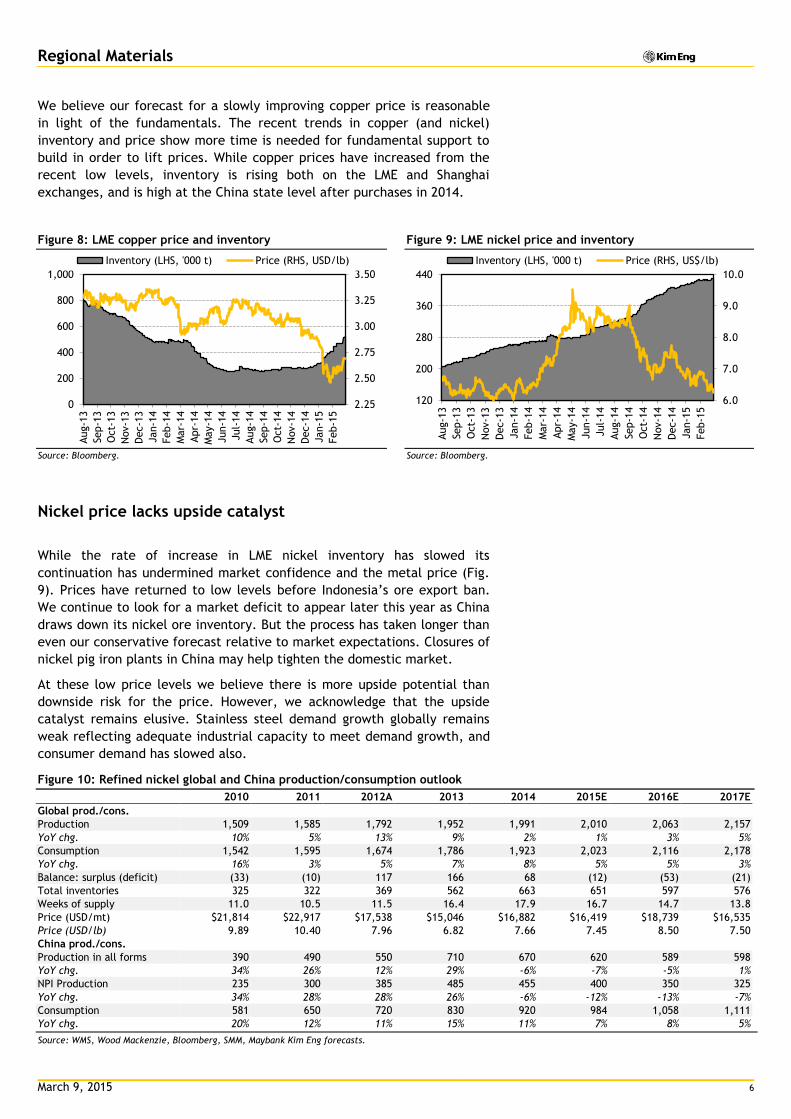
We believe our forecast for a slowly improving copper price is reasonable
in light of the fundamentals. The recent trends in copper (and nickel)
inventory and price show more time is needed for fundamental support to
build in order to lift prices. While copper prices have increased from the
recent low levels, inventory is rising both on the LME and Shanghai
exchanges, and is high at the China state level after purchases in 2014.
Figure 8: LME copper price and inventory Figure 9: LME nickel price and inventory
Source: Bloomberg. Source: Bloomberg.
Nickel price lacks upside catalyst
While the rate of increase in LME nickel inventory has slowed its
continuation has undermined market confidence and the metal price (Fig.
9). Prices have returned to low levels before Indonesia’s ore export ban.
We continue to look for a market deficit to appear later this year as China
draws down its nickel ore inventory. But the process has taken longer than
even our conservative forecast relative to market expectations. Closures of
nickel pig iron plants in China may help tighten the domestic market.
At these low price levels we believe there is more upside potential than
downside risk for the price. However, we acknowledge that the upside
catalyst remains elusive. Stainless steel demand growth globally remains
weak reflecting adequate industrial capacity to meet demand growth, and
consumer demand has slowed also.
Figure 10: Refined nickel global and China production/consumption outlook
2010 2011 2012A 2013 2014 2015E 2016E 2017E
Global prod./cons.
Production 1,509 1,585 1,792 1,952 1,991 2,010 2,063 2,157
YoY chg. 10% 5% 13% 9% 2% 1% 3% 5%
Consumption 1,542 1,595 1,674 1,786 1,923 2,023 2,116 2,178
YoY chg. 16% 3% 5% 7% 8% 5% 5% 3%
Balance: surplus (deficit) (33) (10) 117 166 68 (12) (53) (21)
Total inventories 325 322 369 562 663 651 597 576
Weeks of supply 11.0 10.5 11.5 16.4 17.9 16.7 14.7 13.8
Price (USD/mt) $21,814 $22,917 $17,538 $15,046 $16,882 $16,419 $18,739 $16,535
Price (USD/lb) 9.89 10.40 7.96 6.82 7.66 7.45 8.50 7.50
China prod./cons.
Production in all forms 390 490 550 710 670 620 589 598
YoY chg. 34% 26% 12% 29% -6% -7% -5% 1%
NPI Production 235 300 385 485 455 400 350 325
YoY chg. 34% 28% 28% 26% -6% -12% -13% -7%
Consumption 581 650 720 830 920 984 1,058 1,111
YoY chg. 20% 12% 11% 15% 11% 7% 8% 5%
Source: WMS, Wood Mackenzie, Bloomberg, SMM, Maybank Kim Eng forecasts.
2.25
2.50
2.75
3.00
3.25
3.50
0
200
400
600
800
1,000
Aug-1
3
Sep-1
3
Oct-
13
Nov-1
3
Dec-1
3
Jan-1
4
Feb-1
4
Mar-
14
Apr-
14
May-1
4
Jun-1
4
Jul-
14
Aug-1
4
Sep-1
4
Oct-
14
Nov-1
4
Dec-1
4
Jan-1
5
Feb-1
5
Inventory (LHS, '000 t) Price (RHS, USD/lb)
6.0
7.0
8.0
9.0
10.0
120
200
280
360
440
Aug-1
3
Sep-1
3
Oct-
13
Nov-1
3
Dec-1
3
Jan-1
4
Feb-1
4
Mar-
14
Apr-
14
May-1
4
Jun-1
4
Jul-
14
Aug-1
4
Sep-1
4
Oct-
14
Nov-1
4
Dec-1
4
Jan-1
5
Feb-1
5
Inventory (LHS, '000 t) Price (RHS, US$/lb)
March 9, 2015 7
Regional Materials
The key problem for nickel is that its major end-user, stainless steel
producers in China, have advanced metallurgical controls to the extent
that they can use a variety of non-pure nickel feed material to blend with
pure nickel to make the product. Copper is different in that its major uses
remain oriented towards the pure form of the material.
The availability of other nickel ores from the Philippines, ferro-nickel from
Asia, and nickel concentrate from Australia, have made up for the loss of
supply from the Indonesian nickel ore ban. A ban on the export of raw ores
from the Philippines would provide such a catalyst but thus far the
measure has not gained broad support making it unlikely to be
implemented anytime soon.
China’s push to close highly polluting obsolete capacity has reached into
the nickel pig iron market. Northeast China's Linyi city in Shandong
province shut nine nickel pig iron plants over February 26 to March 4 due
to environmental concerns, China Metallurgical Standardization Research
Institute reported recently. Shandong accounts for around 20% of China's
ferronickel production. This could be positive if it reduces domestic NPI
supply more than demand causing a need for additional nickel units.
Otherwise, it would simply be a closure of surplus obsolete capacity
without moving the market into deficit.
Earnings season for mining stocks in HK/China kicks off this week
with MMG on March 11. Several companies have provided downside
warnings ahead of full results with consensus numbers falling by the
day. Further downgrades are expected (MKE).
What’s Our View?
The low materials prices and structural changes underway in China are so
significant that we have been expecting to see a heavy impact on the
results of the materials companies. This factor and overly optimistic
consensus earnings forecasts have largely driven the negative bias to our
investment recommendations.
Further, the quality of earnings remains low. For example, we note that
very few Chinese companies have taken asset write-downs, despite
overseas acquisitions made at higher price levels. Unlike western
companies, Chinese corporates tend not to make timely adjustments to
book valuations preferring to await it out (Yanzhou Coal; 1171 HK; SELL;
Jiangxi Copper; 358 HK; HOLD; Zijin; 2899 HK; Not Rated).
Accounting changes have also led to longer asset lives that has reduced
non-cash charges for fixed assets and flattered net profit (steel
companies). Further, local governments have been providing subsidies on
power and taxes to help support struggling companies in coal and steel.
Asset sales at inflated valuations to state owned parent groups have also
boosted cash flow and reported net profit (Chalco; 2600 HK; SELL).
Most recently, Shenhua provided very weak 2015 business targets over CNY
that we believe are not fully incorporated into consensus estimates. These
included a 15% fall in revenues vs 11% in COGS YoY, and a 16% increase in
SG&A plus net finance costs.
Shenhua’s coal production and sales volumes were weak in Jan., down 4%
and 44% YoY, respectively. Coal sales have been weak after lengthy price
March 9, 2015 8
Regional Materials
negotiations between coal miners and power producers in light of above-
normal inventory levels and seasonally slowing demand.
Just this week, Shenhua rolled out a new policy enabling it to offer pricing
discounts of CNY27-37/t ($4.40-6.03/t) to users in eastern and southern
China for cargoes sourced from small producers and delivered to unloading
ports. The cuts are a reaction to Shenhua losing market share in the past
two months, when the company met the government’s request to stabilize
prices and offered no discounts in eastern and southern China.
High levels of investment among coal companies into the coal/chemicals
segment also raises questions about the expected long-run returns given
low energy prices, high capital and operating costs, and resource scarcity
(water). The CO2 emissions from the sector are also very high and seem
misaligned with the environmental targets that the Chinese government is
aggressively pursuing. Within our coverage China Coal continues to
allocate high levels of capex into coal/chemicals (1898 HK; SELL).
Metals price forecasts and rankings 2015-17
We see 2015 as a transition year that will be tough for higher cost mining
companies, particularly those in over-supplied sectors. Our recovery
outlook for 2016 is predicated on slowing supply and improving demand
growth. Our view of nickel is that the ore shortage is a two-year
phenomenon until the Chinese rebuild supply lines, hence the price
underperformance in 2017E. During 2017, we look for supply side cuts to
lift the prices for copper, iron ore, and zinc from low levels.
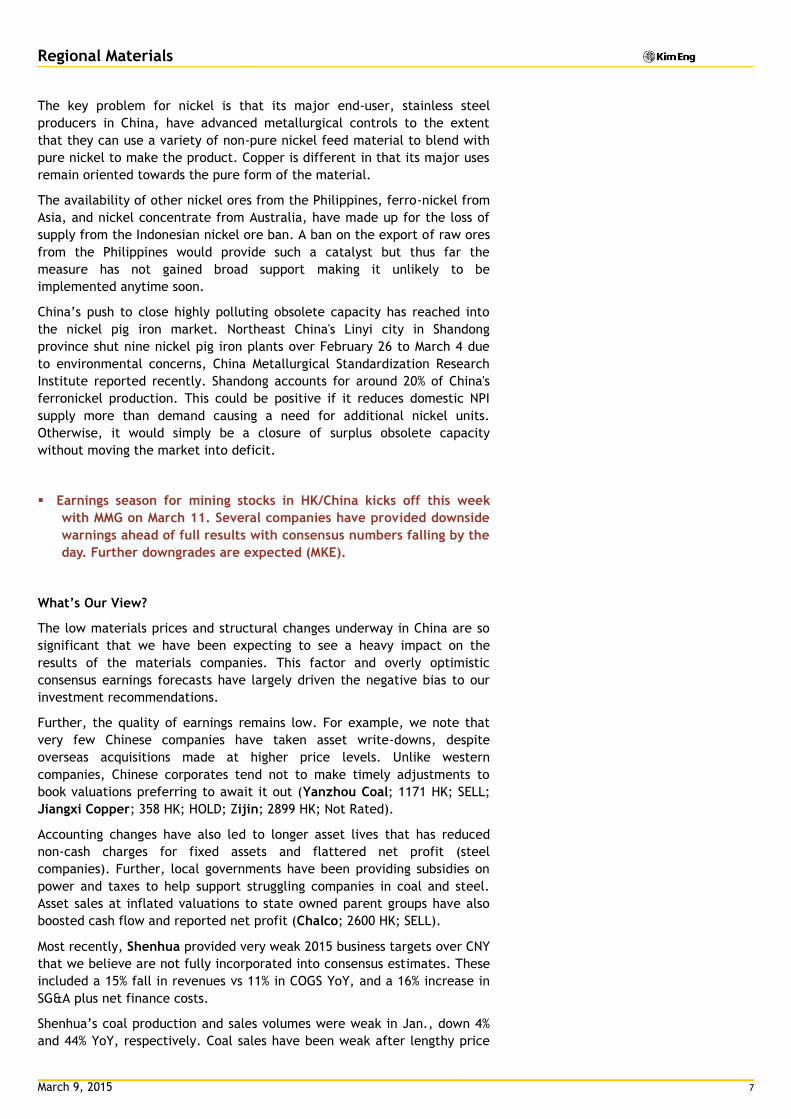
Figure 11: Metals price forecasts
(USD/lb., gold USD/oz.) 2013
2014A 2015E 2016E 2017E L-term
Aluminum 0.84 0.85 0.86 0.88 0.90 0.95 YoY chg. -9% 1% 2% 8% 2% 0% Copper 3.33 3.11 2.65 3.00 3.25 2.85 YoY chg. -8% -6% -15% 13% 8% -12% Nickel 6.82 7.66 7.45 8.50 7.50 7.00 YoY chg. -14% 12% -3% 14% -12% -7% Lead 0.97 0.95 0.88 0.93 0.95 0.88 YoY chg. 4% -2% -7% 6% 2% -7% Zinc 0.87 0.98 0.97 1.08 1.15 1.10 YoY chg. -2% 13% -1% 11% 6% -4% Gold 1,412 1,267 1,100 1,050 1,050 1,000 YoY chg. -15% -10% -13% -5% 0% -5% Source: Bloomberg, Maybank Kim Eng forecasts.
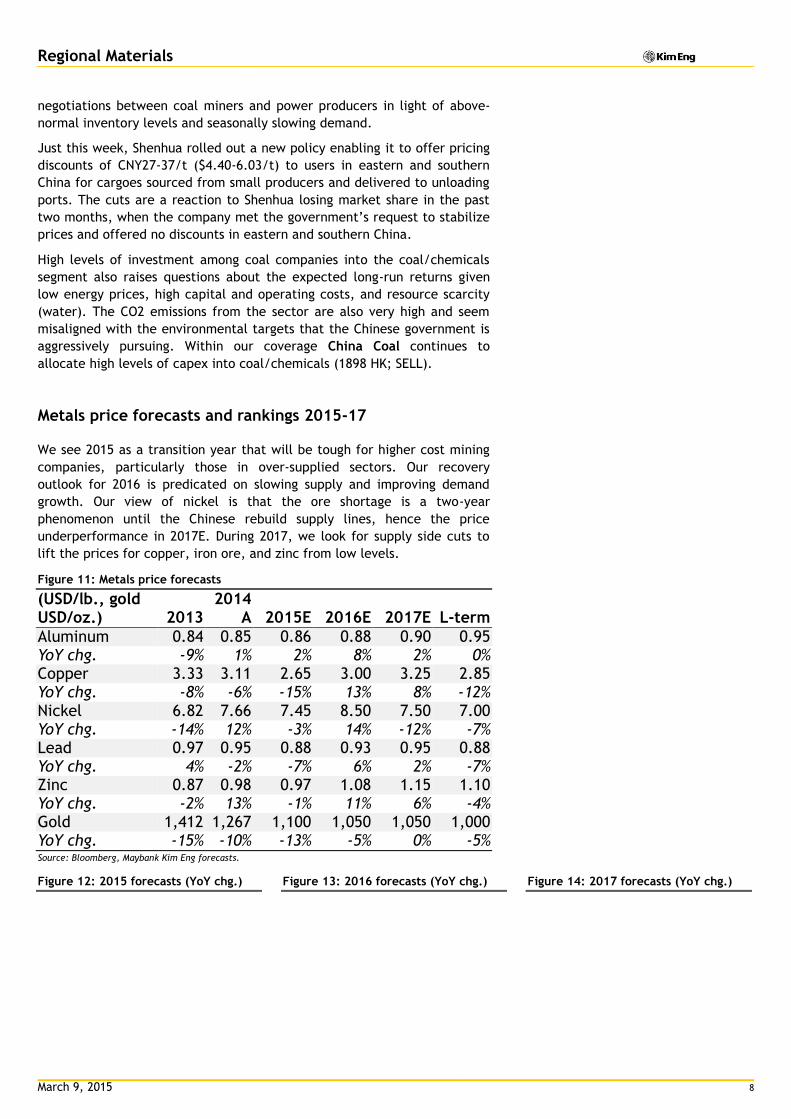
Figure 12: 2015 forecasts (YoY chg.) Figure 13: 2016 forecasts (YoY chg.) Figure 14: 2017 forecasts (YoY chg.)
March 9, 2015 9
Regional Materials
Source: Maybank Kim Eng forecasts. Source: Maybank Kim Eng forecasts. Source: Maybank Kim Eng forecasts.
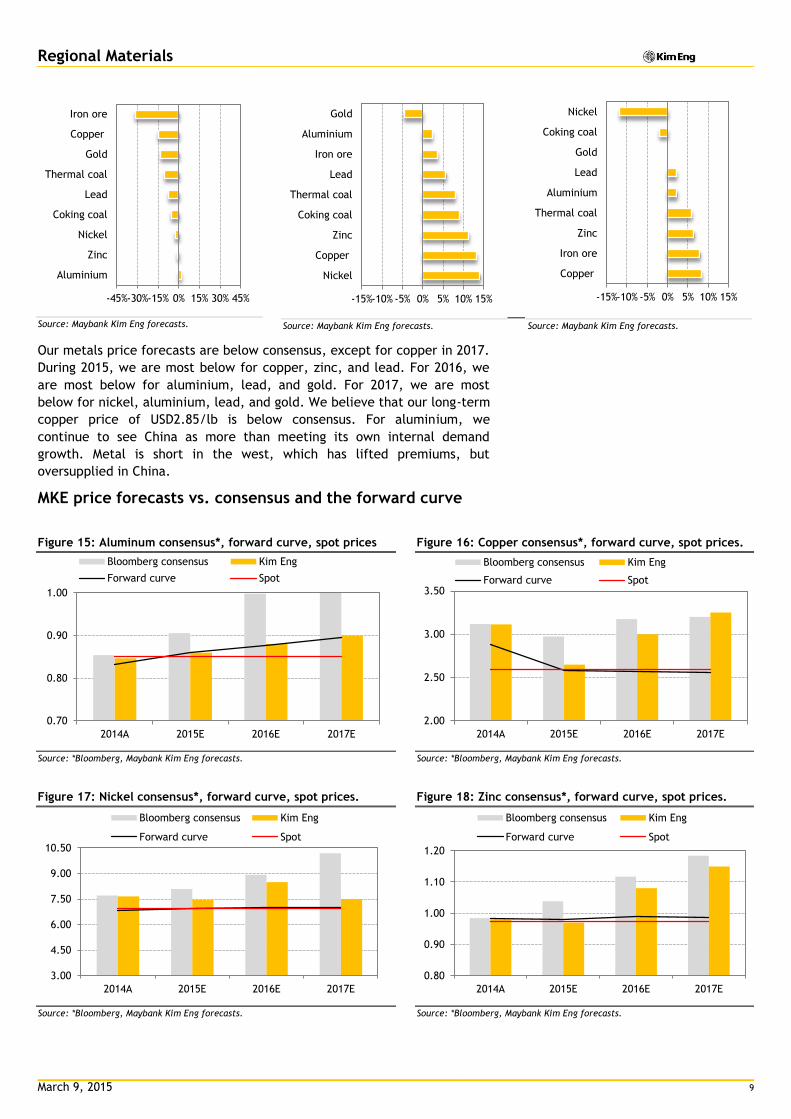
Our metals price forecasts are below consensus, except for copper in 2017.
During 2015, we are most below for copper, zinc, and lead. For 2016, we
are most below for aluminium, lead, and gold. For 2017, we are most
below for nickel, aluminium, lead, and gold. We believe that our long-term
copper price of USD2.85/lb is below consensus. For aluminium, we
continue to see China as more than meeting its own internal demand
growth. Metal is short in the west, which has lifted premiums, but
oversupplied in China.
MKE price forecasts vs. consensus and the forward curve
Figure 15: Aluminum consensus*, forward curve, spot prices Figure 16: Copper consensus*, forward curve, spot prices.
Source: *Bloomberg, Maybank Kim Eng forecasts. Source: *Bloomberg, Maybank Kim Eng forecasts.
Figure 17: Nickel consensus*, forward curve, spot prices. Figure 18: Zinc consensus*, forward curve, spot prices.
Source: *Bloomberg, Maybank Kim Eng forecasts. Source: *Bloomberg, Maybank Kim Eng forecasts.
-45%-30%-15% 0% 15% 30% 45%
Aluminium
Zinc
Nickel
Coking coal
Lead
Thermal coal
Gold
Copper
Iron ore
-15%-10% -5% 0% 5% 10% 15%
Nickel
Copper
Zinc
Coking coal
Thermal coal
Lead
Iron ore
Aluminium
Gold
-15%-10% -5% 0% 5% 10% 15%
Copper
Iron ore
Zinc
Thermal coal
Aluminium
Lead
Gold
Coking coal
Nickel
0.70
0.80
0.90
1.00
2014A 2015E 2016E 2017E
Bloomberg consensus Kim Eng
Forward curve Spot
2.00
2.50
3.00
3.50
2014A 2015E 2016E 2017E
Bloomberg consensus Kim Eng
Forward curve Spot
3.00
4.50
6.00
7.50
9.00
10.50
2014A 2015E 2016E 2017E
Bloomberg consensus Kim Eng
Forward curve Spot
0.80
0.90
1.00
1.10
1.20
2014A 2015E 2016E 2017E
Bloomberg consensus Kim Eng
Forward curve Spot
March 9, 2015 10
Regional Materials
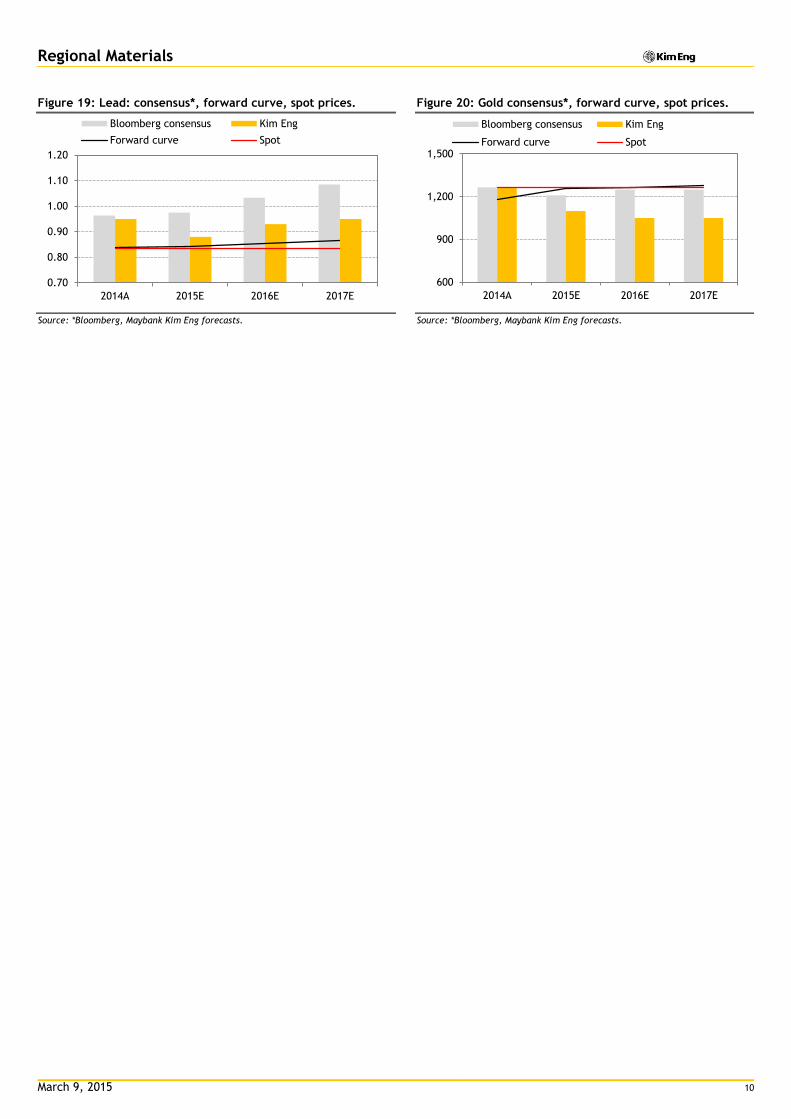
Figure 19: Lead: consensus*, forward curve, spot prices. Figure 20: Gold consensus*, forward curve, spot prices.
Source: *Bloomberg, Maybank Kim Eng forecasts. Source: *Bloomberg, Maybank Kim Eng forecasts.
0.70
0.80
0.90
1.00
1.10
1.20
2014A 2015E 2016E 2017E
Bloomberg consensus Kim Eng
Forward curve Spot
600
900
1,200
1,500
2014A 2015E 2016E 2017E
Bloomberg consensus Kim Eng
Forward curve Spot
March 9, 2015 11
Regional Materials
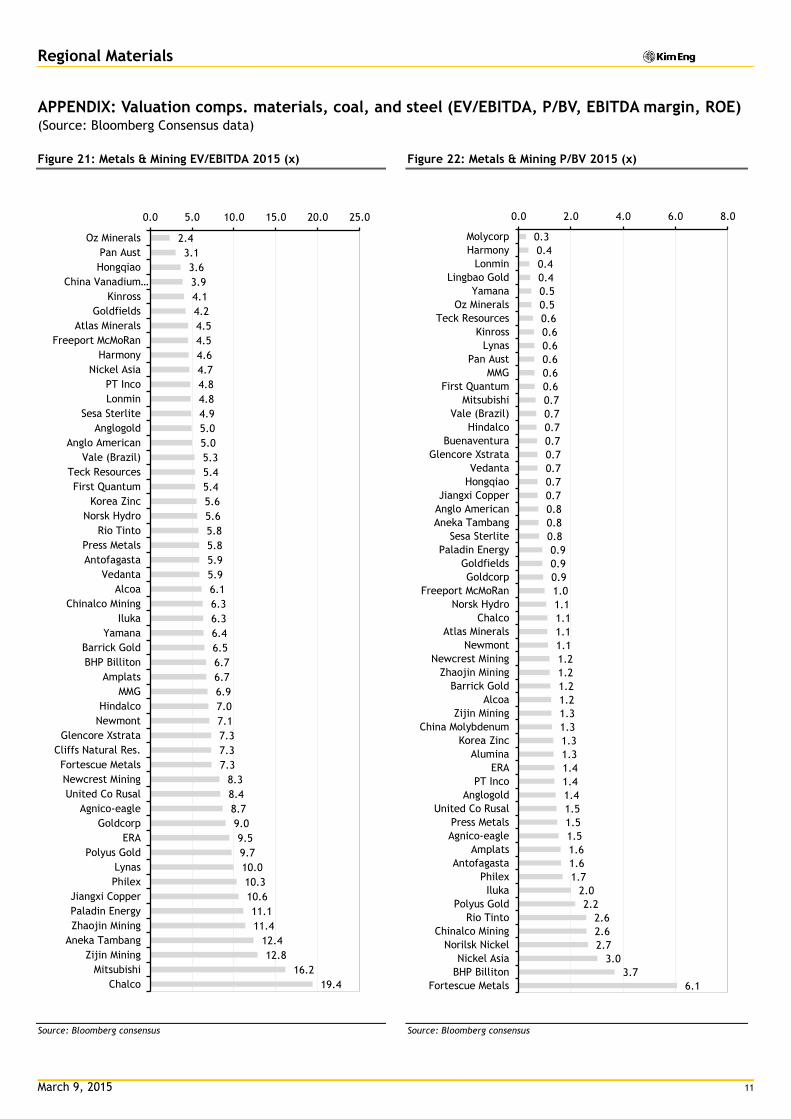
APPENDIX: Valuation comps. materials, coal, and steel (EV/EBITDA, P/BV, EBITDA margin, ROE) (Source: Bloomberg Consensus data)
Figure 21: Metals & Mining EV/EBITDA 2015 (x) Figure 22: Metals & Mining P/BV 2015 (x)
Source: Bloomberg consensus Source: Bloomberg consensus
2.4
3.1
3.6
3.9
4.1
4.2
4.5
4.5
4.6
4.7
4.8
4.8
4.9
5.0
5.0
5.3
5.4
5.4
5.6
5.6
5.8
5.8
5.9
5.9
6.1
6.3
6.3
6.4
6.5
6.7
6.7
6.9
7.0
7.1
7.3
7.3
7.3
8.3
8.4
8.7
9.0
9.5
9.7
10.0
10.3
10.6
11.1
11.4
12.4
12.8
16.2
19.4
0.0 5.0 10.0 15.0 20.0 25.0
Oz Minerals
Pan Aust
Hongqiao
China Vanadium…
Kinross
Goldfields
Atlas Minerals
Freeport McMoRan
Harmony
Nickel Asia
PT Inco
Lonmin
Sesa Sterlite
Anglogold
Anglo American
Vale (Brazil)
Teck Resources
First Quantum
Korea Zinc
Norsk Hydro
Rio Tinto
Press Metals
Antofagasta
Vedanta
Alcoa
Chinalco Mining
Iluka
Yamana
Barrick Gold
BHP Billiton
Amplats
MMG
Hindalco
Newmont
Glencore Xstrata
Cliffs Natural Res.
Fortescue Metals
Newcrest Mining
United Co Rusal
Agnico-eagle
Goldcorp
ERA
Polyus Gold
Lynas
Philex
Jiangxi Copper
Paladin Energy
Zhaojin Mining
Aneka Tambang
Zijin Mining
Mitsubishi
Chalco
0.3
0.4
0.4
0.4
0.5
0.5
0.6
0.6
0.6
0.6
0.6
0.6
0.7
0.7
0.7
0.7
0.7
0.7
0.7
0.7
0.8
0.8
0.8
0.9
0.9
0.9
1.0
1.1
1.1
1.1
1.1
1.2
1.2
1.2
1.2
1.3
1.3
1.3
1.3
1.4
1.4
1.4
1.5
1.5
1.5
1.6
1.6
1.7
2.0
2.2
2.6
2.6
2.7
3.0
3.7
6.1
0.0 2.0 4.0 6.0 8.0
Molycorp
Harmony
Lonmin
Lingbao Gold
Yamana
Oz Minerals
Teck Resources
Kinross
Lynas
Pan Aust
MMG
First Quantum
Mitsubishi
Vale (Brazil)
Hindalco
Buenaventura
Glencore Xstrata
Vedanta
Hongqiao
Jiangxi Copper
Anglo American
Aneka Tambang
Sesa Sterlite
Paladin Energy
Goldfields
Goldcorp
Freeport McMoRan
Norsk Hydro
Chalco
Atlas Minerals
Newmont
Newcrest Mining
Zhaojin Mining
Barrick Gold
Alcoa
Zijin Mining
China Molybdenum
Korea Zinc
Alumina
ERA
PT Inco
Anglogold
United Co Rusal
Press Metals
Agnico-eagle
Amplats
Antofagasta
Philex
Iluka
Polyus Gold
Rio Tinto
Chinalco Mining
Norilsk Nickel
Nickel Asia
BHP Billiton
Fortescue Metals
March 9, 2015 12
Regional Materials
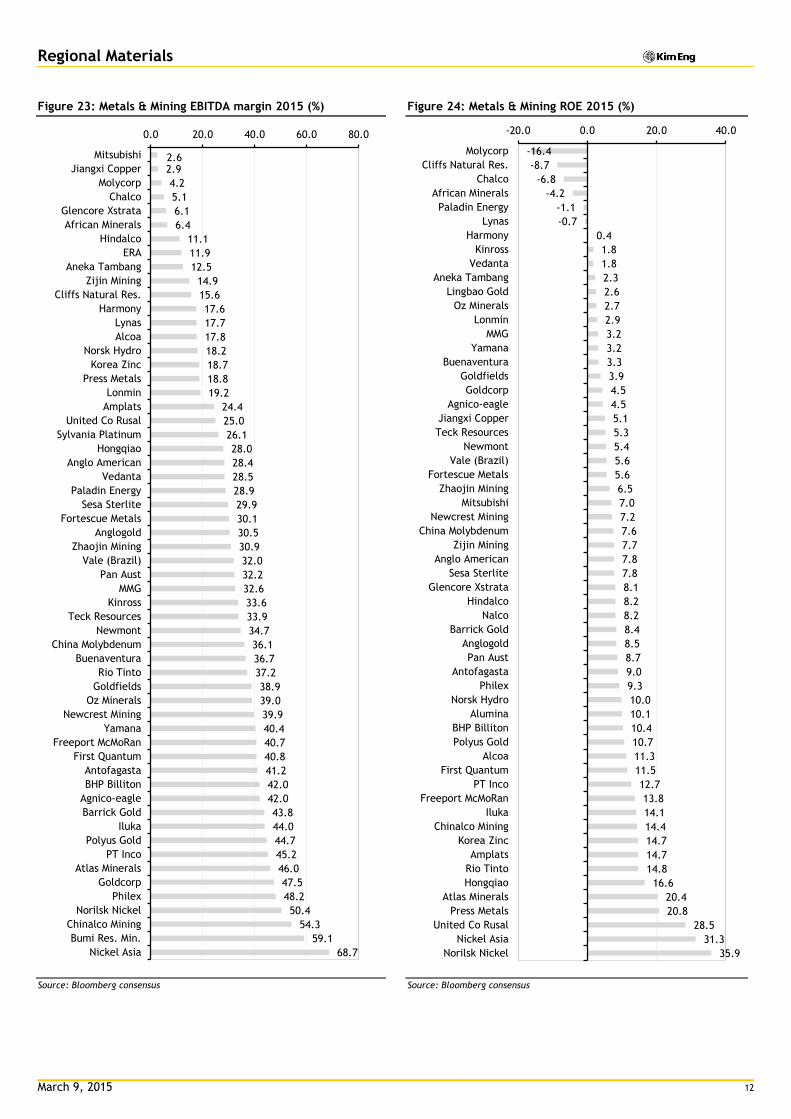
Figure 23: Metals & Mining EBITDA margin 2015 (%) Figure 24: Metals & Mining ROE 2015 (%)
Source: Bloomberg consensus Source: Bloomberg consensus
2.6 2.9
4.2
5.1
6.1
6.4
11.1
11.9
12.5
14.9
15.6
17.6
17.7
17.8
18.2
18.7
18.8
19.2
24.4
25.0
26.1
28.0
28.4
28.5
28.9
29.9
30.1
30.5
30.9
32.0
32.2
32.6
33.6
33.9
34.7
36.1
36.7
37.2
38.9
39.0
39.9
40.4
40.7
40.8
41.2
42.0
42.0
43.8
44.0
44.7
45.2
46.0
47.5
48.2
50.4
54.3
59.1
68.7
0.0 20.0 40.0 60.0 80.0
Mitsubishi
Jiangxi Copper
Molycorp
Chalco
Glencore Xstrata
African Minerals
Hindalco
ERA
Aneka Tambang
Zijin Mining
Cliffs Natural Res.
Harmony
Lynas
Alcoa
Norsk Hydro
Korea Zinc
Press Metals
Lonmin
Amplats
United Co Rusal
Sylvania Platinum
Hongqiao
Anglo American
Vedanta
Paladin Energy
Sesa Sterlite
Fortescue Metals
Anglogold
Zhaojin Mining
Vale (Brazil)
Pan Aust
MMG
Kinross
Teck Resources
Newmont
China Molybdenum
Buenaventura
Rio Tinto
Goldfields
Oz Minerals
Newcrest Mining
Yamana
Freeport McMoRan
First Quantum
Antofagasta
BHP Billiton
Agnico-eagle
Barrick Gold
Iluka
Polyus Gold
PT Inco
Atlas Minerals
Goldcorp
Philex
Norilsk Nickel
Chinalco Mining
Bumi Res. Min.
Nickel Asia
-16.4
-8.7
-6.8
-4.2
-1.1
-0.7
0.4
1.8
1.8
2.3
2.6
2.7
2.9
3.2
3.2
3.3
3.9
4.5
4.5
5.1
5.3
5.4
5.6
5.6
6.5
7.0
7.2
7.6
7.7
7.8
7.8
8.1
8.2
8.2
8.4
8.5
8.7
9.0
9.3
10.0
10.1
10.4
10.7
11.3
11.5
12.7
13.8
14.1
14.4
14.7
14.7
14.8
16.6
20.4
20.8
28.5
31.3
35.9
-20.0 0.0 20.0 40.0
Molycorp
Cliffs Natural Res.
Chalco
African Minerals
Paladin Energy
Lynas
Harmony
Kinross
Vedanta
Aneka Tambang
Lingbao Gold
Oz Minerals
Lonmin
MMG
Yamana
Buenaventura
Goldfields
Goldcorp
Agnico-eagle
Jiangxi Copper
Teck Resources
Newmont
Vale (Brazil)
Fortescue Metals
Zhaojin Mining
Mitsubishi
Newcrest Mining
China Molybdenum
Zijin Mining
Anglo American
Sesa Sterlite
Glencore Xstrata
Hindalco
Nalco
Barrick Gold
Anglogold
Pan Aust
Antofagasta
Philex
Norsk Hydro
Alumina
BHP Billiton
Polyus Gold
Alcoa
First Quantum
PT Inco
Freeport McMoRan
Iluka
Chinalco Mining
Korea Zinc
Amplats
Rio Tinto
Hongqiao
Atlas Minerals
Press Metals
United Co Rusal
Nickel Asia
Norilsk Nickel
March 9, 2015 13
Regional Materials
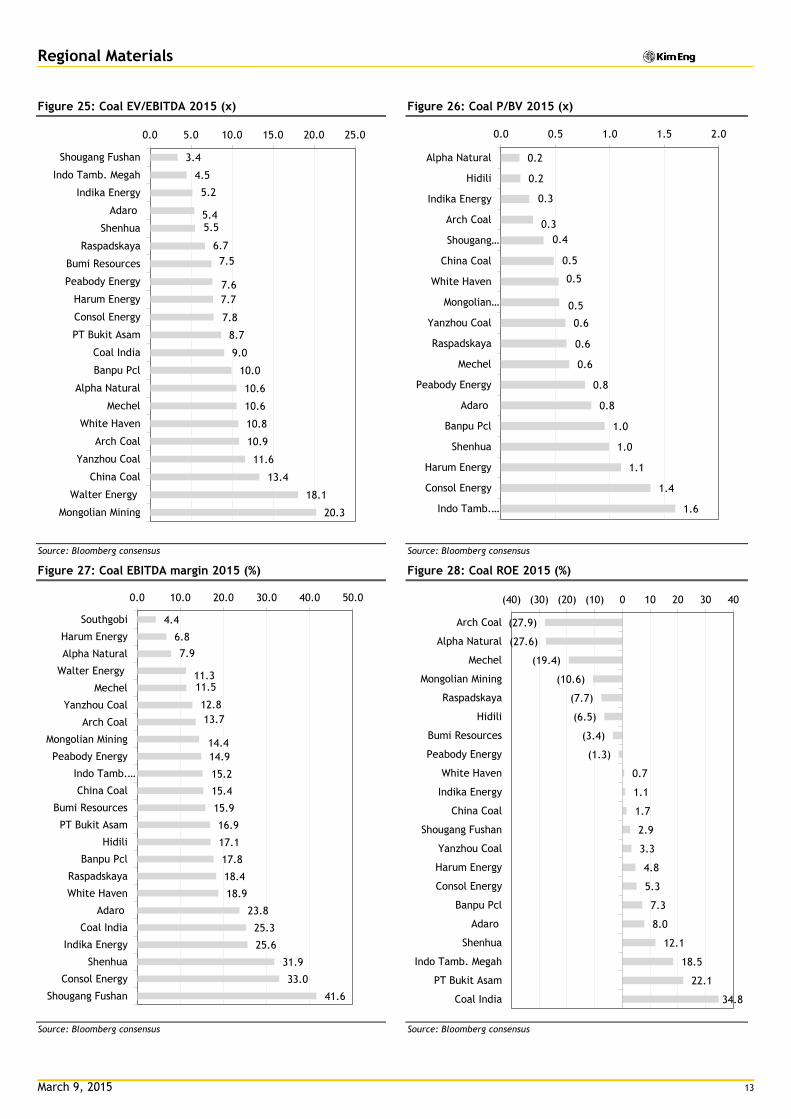
Figure 25: Coal EV/EBITDA 2015 (x) Figure 26: Coal P/BV 2015 (x)
Source: Bloomberg consensus Source: Bloomberg consensus
Figure 27: Coal EBITDA margin 2015 (%) Figure 28: Coal ROE 2015 (%)
Source: Bloomberg consensus
Source: Bloomberg consensus
3.4
4.5
5.2
5.4 5.5
6.7
7.5
7.6
7.7
7.8
8.7
9.0
10.0
10.6
10.6
10.8
10.9
11.6
13.4
18.1
20.3
0.0 5.0 10.0 15.0 20.0 25.0
Shougang Fushan
Indo Tamb. Megah
Indika Energy
Adaro
Shenhua
Raspadskaya
Bumi Resources
Peabody Energy
Harum Energy
Consol Energy
PT Bukit Asam
Coal India
Banpu Pcl
Alpha Natural
Mechel
White Haven
Arch Coal
Yanzhou Coal
China Coal
Walter Energy
Mongolian Mining
0.2
0.2
0.3
0.3
0.4
0.5
0.5
0.5
0.6
0.6
0.6
0.8
0.8
1.0
1.0
1.1
1.4
1.6
0.0 0.5 1.0 1.5 2.0
Alpha Natural
Hidili
Indika Energy
Arch Coal
Shougang…
China Coal
White Haven
Mongolian…
Yanzhou Coal
Raspadskaya
Mechel
Peabody Energy
Adaro
Banpu Pcl
Shenhua
Harum Energy
Consol Energy
Indo Tamb.…
4.4
6.8
7.9
11.3 11.5
12.8
13.7
14.4
14.9
15.2
15.4
15.9
16.9
17.1
17.8
18.4
18.9
23.8
25.3
25.6
31.9
33.0
41.6
0.0 10.0 20.0 30.0 40.0 50.0
Southgobi
Harum Energy
Alpha Natural
Walter Energy
Mechel
Yanzhou Coal
Arch Coal
Mongolian Mining
Peabody Energy
Indo Tamb.…
China Coal
Bumi Resources
PT Bukit Asam
Hidili
Banpu Pcl
Raspadskaya
White Haven
Adaro
Coal India
Indika Energy
Shenhua
Consol Energy
Shougang Fushan
(27.9)
(27.6)
(19.4)
(10.6)
(7.7)
(6.5)
(3.4)
(1.3)
0.7
1.1
1.7
2.9
3.3
4.8
5.3
7.3
8.0
12.1
18.5
22.1
34.8
(40) (30) (20) (10) 0 10 20 30 40
Arch Coal
Alpha Natural
Mechel
Mongolian Mining
Raspadskaya
Hidili
Bumi Resources
Peabody Energy
White Haven
Indika Energy
China Coal
Shougang Fushan
Yanzhou Coal
Harum Energy
Consol Energy
Banpu Pcl
Adaro
Shenhua
Indo Tamb. Megah
PT Bukit Asam
Coal India
March 9, 2015 14
Regional Materials
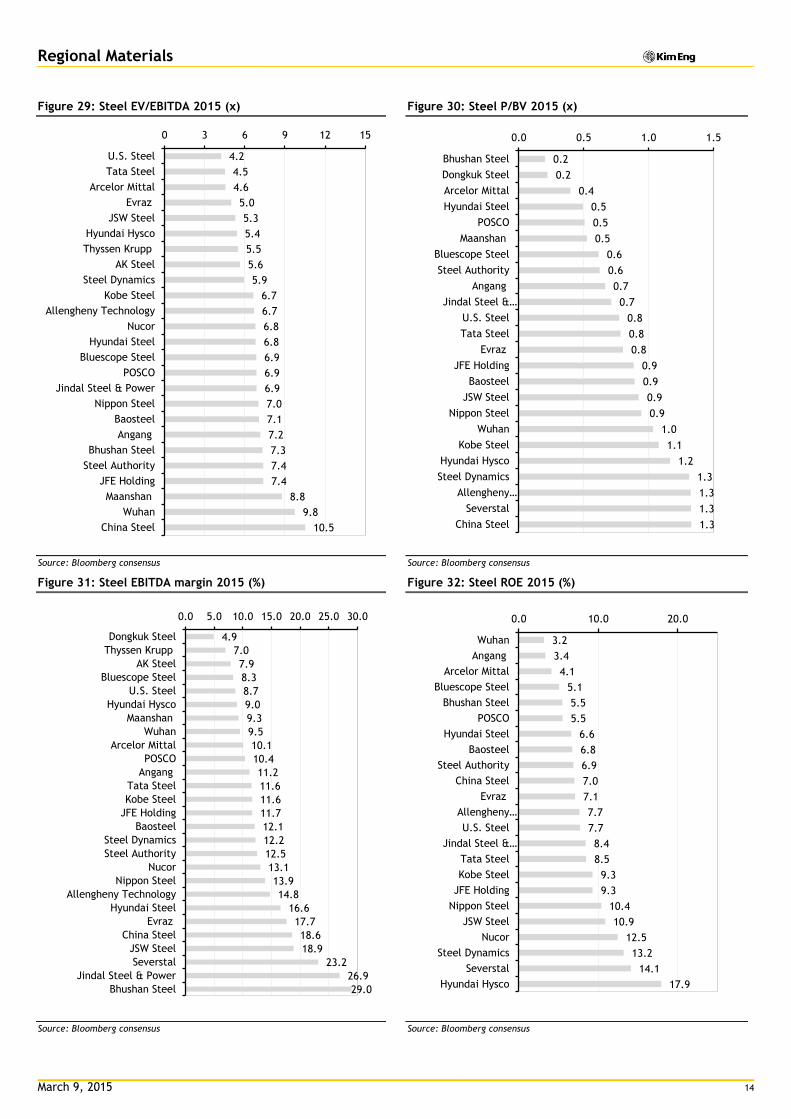
Figure 29: Steel EV/EBITDA 2015 (x) Figure 30: Steel P/BV 2015 (x)
Source: Bloomberg consensus Source: Bloomberg consensus
Figure 31: Steel EBITDA margin 2015 (%) Figure 32: Steel ROE 2015 (%)
Source: Bloomberg consensus Source: Bloomberg consensus
4.2
4.5
4.6
5.0
5.3
5.4
5.5
5.6
5.9
6.7
6.7
6.8
6.8
6.9
6.9
6.9
7.0
7.1
7.2
7.3
7.4
7.4
8.8
9.8
10.5
0 3 6 9 12 15
U.S. Steel
Tata Steel
Arcelor Mittal
Evraz
JSW Steel
Hyundai Hysco
Thyssen Krupp
AK Steel
Steel Dynamics
Kobe Steel
Allengheny Technology
Nucor
Hyundai Steel
Bluescope Steel
POSCO
Jindal Steel & Power
Nippon Steel
Baosteel
Angang
Bhushan Steel
Steel Authority
JFE Holding
Maanshan
Wuhan
China Steel
0.2
0.2
0.4
0.5
0.5
0.5
0.6
0.6
0.7
0.7
0.8
0.8
0.8
0.9
0.9
0.9
0.9
1.0
1.1
1.2
1.3
1.3
1.3
1.3
0.0 0.5 1.0 1.5
Bhushan Steel
Dongkuk Steel
Arcelor Mittal
Hyundai Steel
POSCO
Maanshan
Bluescope Steel
Steel Authority
Angang
Jindal Steel &…
U.S. Steel
Tata Steel
Evraz
JFE Holding
Baosteel
JSW Steel
Nippon Steel
Wuhan
Kobe Steel
Hyundai Hysco
Steel Dynamics
Allengheny…
Severstal
China Steel
4.9
7.0
7.9
8.3
8.7
9.0
9.3
9.5
10.1
10.4
11.2
11.6
11.6
11.7
12.1
12.2
12.5
13.1
13.9
14.8
16.6
17.7
18.6
18.9
23.2
26.9
29.0
0.0 5.0 10.0 15.0 20.0 25.0 30.0
Dongkuk Steel
Thyssen Krupp
AK Steel
Bluescope Steel
U.S. Steel
Hyundai Hysco
Maanshan
Wuhan
Arcelor Mittal
POSCO
Angang
Tata Steel
Kobe Steel
JFE Holding
Baosteel
Steel Dynamics
Steel Authority
Nucor
Nippon Steel
Allengheny Technology
Hyundai Steel
Evraz
China Steel
JSW Steel
Severstal
Jindal Steel & Power
Bhushan Steel
3.2
3.4
4.1
5.1
5.5
5.5
6.6
6.8
6.9
7.0
7.1
7.7
7.7
8.4
8.5
9.3
9.3
10.4
10.9
12.5
13.2
14.1
17.9
0.0 10.0 20.0
Wuhan
Angang
Arcelor Mittal
Bluescope Steel
Bhushan Steel
POSCO
Hyundai Steel
Baosteel
Steel Authority
China Steel
Evraz
Allengheny…
U.S. Steel
Jindal Steel &…
Tata Steel
Kobe Steel
JFE Holding
Nippon Steel
JSW Steel
Nucor
Steel Dynamics
Severstal
Hyundai Hysco
March 9, 2015 15
Regional Materials
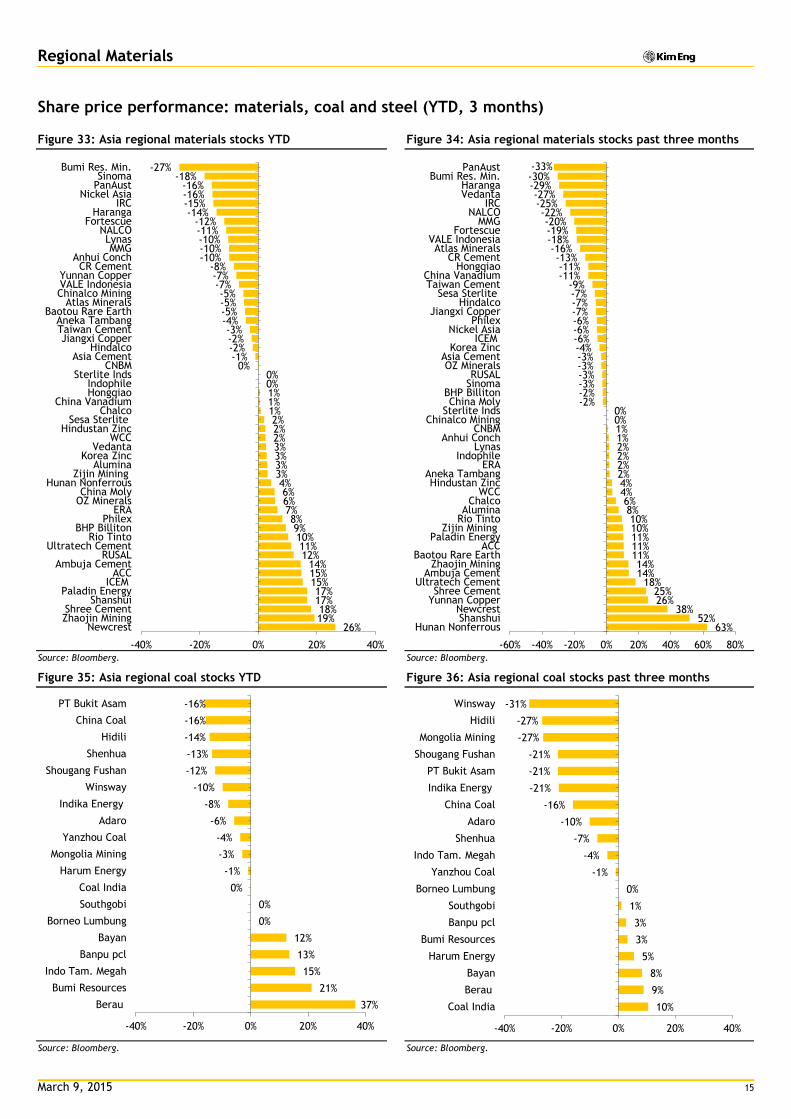
Share price performance: materials, coal and steel (YTD, 3 months)
Figure 33: Asia regional materials stocks YTD Figure 34: Asia regional materials stocks past three months
Source: Bloomberg. Source: Bloomberg.
Figure 35: Asia regional coal stocks YTD Figure 36: Asia regional coal stocks past three months
Source: Bloomberg. Source: Bloomberg.
-27% -18%
-16% -16% -15% -14%
-12% -11% -10% -10% -10%
-8% -7% -7% -5% -5% -5% -4% -3% -2% -2% -1%
0% 0% 0% 1% 1% 1% 2% 2% 2% 3% 3% 3% 3% 4% 6% 6% 7% 8% 9% 10% 11% 12%
14% 15% 15% 17% 17% 18% 19%
26%
-40% -20% 0% 20% 40%
Bumi Res. Min.Sinoma
PanAustNickel Asia
IRCHaranga
FortescueNALCOLynasMMG
Anhui ConchCR Cement
Yunnan CopperVALE IndonesiaChinalco Mining
Atlas MineralsBaotou Rare Earth
Aneka TambangTaiwan CementJiangxi Copper
HindalcoAsia Cement
CNBMSterlite Inds
IndophileHongqiao
China VanadiumChalco
Sesa SterliteHindustan Zinc
WCCVedanta
Korea ZincAlumina
Zijin MiningHunan Nonferrous
China MolyOZ Minerals
ERAPhilex
BHP BillitonRio Tinto
Ultratech CementRUSAL
Ambuja CementACC
ICEMPaladin Energy
ShanshuiShree CementZhaojin Mining
Newcrest
-33% -30% -29% -27% -25% -22% -20% -19% -18% -16% -13% -11% -11%
-9% -7% -7% -7% -6% -6% -6% -4% -3% -3% -3% -3% -2% -2%
0% 0% 1% 1% 2% 2% 2% 2% 4% 4% 6% 8% 10% 10% 11% 11% 11% 14% 14%
18% 25% 26%
38% 52%
63%
-60% -40% -20% 0% 20% 40% 60% 80%
PanAustBumi Res. Min.
HarangaVedanta
IRCNALCO
MMGFortescue
VALE IndonesiaAtlas Minerals
CR CementHongqiao
China VanadiumTaiwan Cement
Sesa SterliteHindalco
Jiangxi CopperPhilex
Nickel AsiaICEM
Korea ZincAsia CementOZ Minerals
RUSALSinoma
BHP BillitonChina Moly
Sterlite IndsChinalco Mining
CNBMAnhui Conch
LynasIndophile
ERAAneka TambangHindustan Zinc
WCCChalco
AluminaRio Tinto
Zijin MiningPaladin Energy
ACCBaotou Rare Earth
Zhaojin MiningAmbuja Cement
Ultratech CementShree Cement
Yunnan CopperNewcrestShanshui
Hunan Nonferrous
-16%
-16%
-14%
-13%
-12%
-10%
-8%
-6%
-4%
-3%
-1%
0%
0%
0%
12%
13%
15%
21%
37%
-40% -20% 0% 20% 40%
PT Bukit Asam
China Coal
Hidili
Shenhua
Shougang Fushan
Winsway
Indika Energy
Adaro
Yanzhou Coal
Mongolia Mining
Harum Energy
Coal India
Southgobi
Borneo Lumbung
Bayan
Banpu pcl
Indo Tam. Megah
Bumi Resources
Berau
-31%
-27%
-27%
-21%
-21%
-21%
-16%
-10%
-7%
-4%
-1%
0%
1%
3%
3%
5%
8%
9%
10%
-40% -20% 0% 20% 40%
Winsway
Hidili
Mongolia Mining
Shougang Fushan
PT Bukit Asam
Indika Energy
China Coal
Adaro
Shenhua
Indo Tam. Megah
Yanzhou Coal
Borneo Lumbung
Southgobi
Banpu pcl
Bumi Resources
Harum Energy
Bayan
Berau
Coal India
March 9, 2015 16
Regional Materials
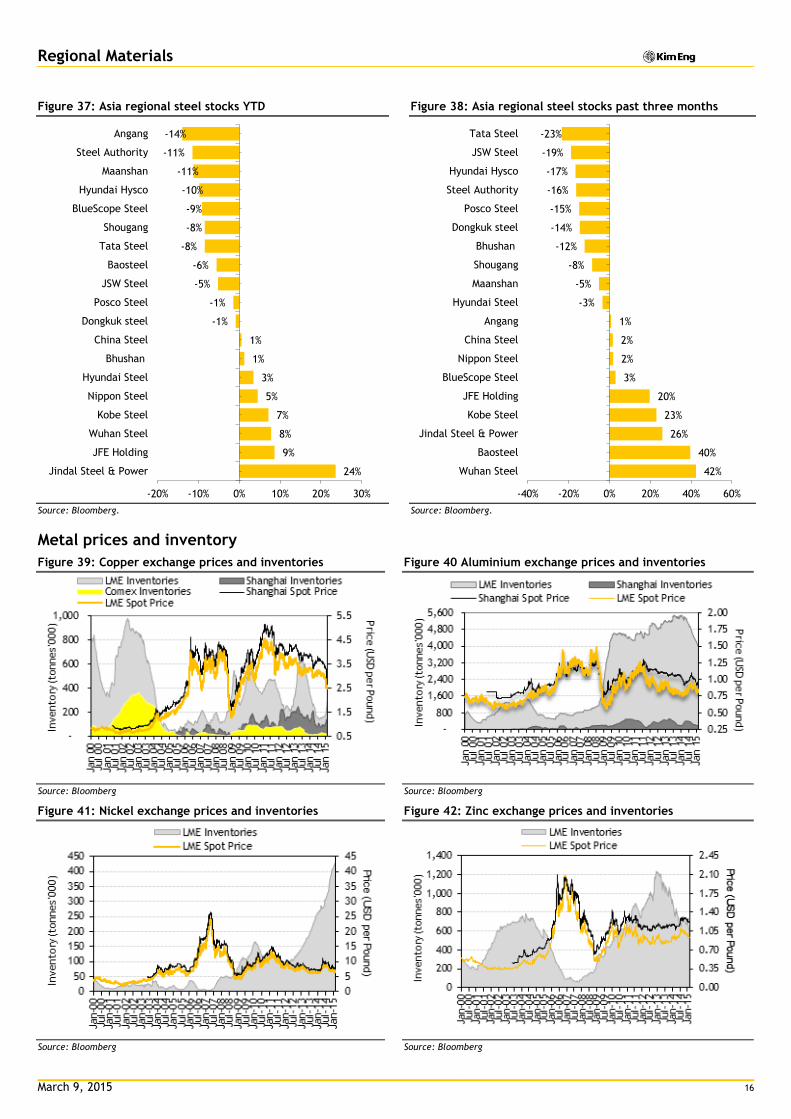
Figure 37: Asia regional steel stocks YTD Figure 38: Asia regional steel stocks past three months
Source: Bloomberg. Source: Bloomberg.
Metal prices and inventory
Figure 39: Copper exchange prices and inventories Figure 40 Aluminium exchange prices and inventories
Source: Bloomberg Source: Bloomberg
Figure 41: Nickel exchange prices and inventories Figure 42: Zinc exchange prices and inventories
Source: Bloomberg Source: Bloomberg
-14%
-11%
-11%
-10%
-9%
-8%
-8%
-6%
-5%
-1%
-1%
1%
1%
3%
5%
7%
8%
9%
24%
-20% -10% 0% 10% 20% 30%
Angang
Steel Authority
Maanshan
Hyundai Hysco
BlueScope Steel
Shougang
Tata Steel
Baosteel
JSW Steel
Posco Steel
Dongkuk steel
China Steel
Bhushan
Hyundai Steel
Nippon Steel
Kobe Steel
Wuhan Steel
JFE Holding
Jindal Steel & Power
-23%
-19%
-17%
-16%
-15%
-14%
-12%
-8%
-5%
-3%
1%
2%
2%
3%
20%
23%
26%
40%
42%
-40% -20% 0% 20% 40% 60%
Tata Steel
JSW Steel
Hyundai Hysco
Steel Authority
Posco Steel
Dongkuk steel
Bhushan
Shougang
Maanshan
Hyundai Steel
Angang
China Steel
Nippon Steel
BlueScope Steel
JFE Holding
Kobe Steel
Jindal Steel & Power
Baosteel
Wuhan Steel
March 9, 2015 17
Regional Materials
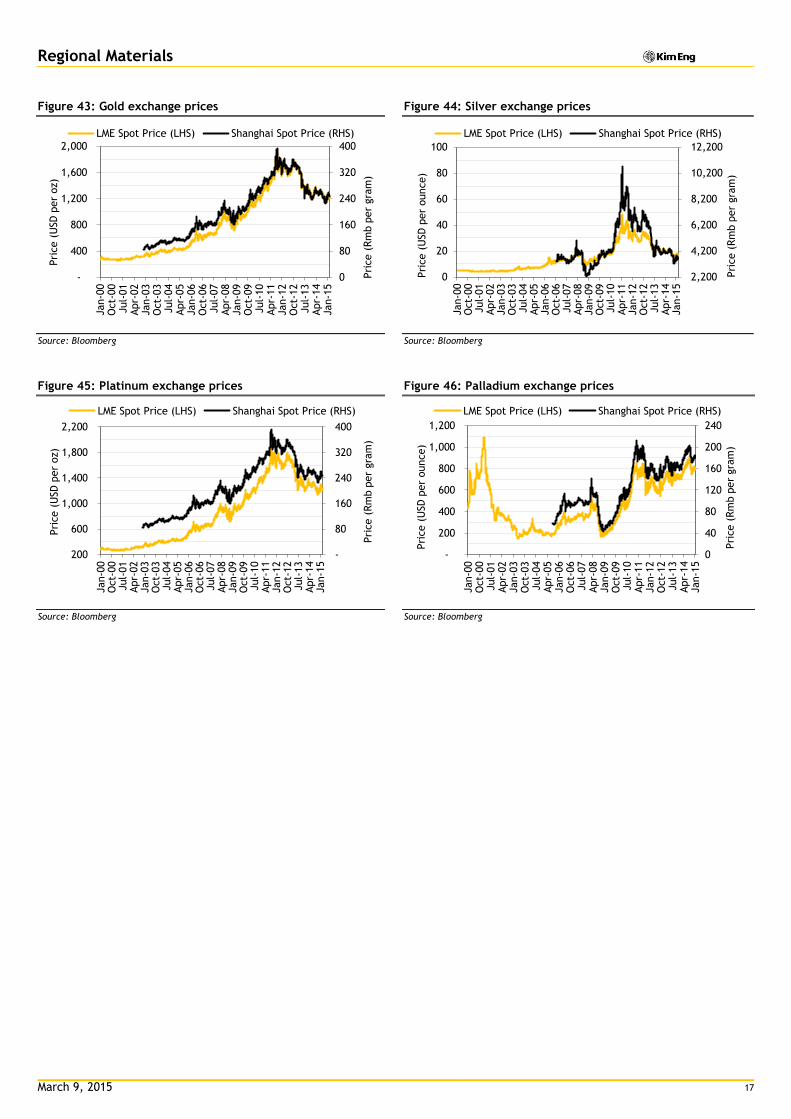
Figure 43: Gold exchange prices Figure 44: Silver exchange prices
Source: Bloomberg Source: Bloomberg
Figure 45: Platinum exchange prices Figure 46: Palladium exchange prices
Source: Bloomberg Source: Bloomberg
0
80
160
240
320
400
-
400
800
1,200
1,600
2,000
Jan-0
0O
ct-
00
Jul-
01
Apr-
02
Jan-0
3O
ct-
03
Jul-
04
Apr-
05
Jan-0
6O
ct-
06
Jul-
07
Apr-
08
Jan-0
9O
ct-
09
Jul-
10
Apr-
11
Jan-1
2O
ct-
12
Jul-
13
Apr-
14
Jan-1
5
Pri
ce (
Rm
b p
er
gra
m)
Pri
ce (
USD
per
oz)
LME Spot Price (LHS) Shanghai Spot Price (RHS)
2,200
4,200
6,200
8,200
10,200
12,200
0
20
40
60
80
100
Jan-0
0O
ct-
00
Jul-
01
Apr-
02
Jan-0
3O
ct-
03
Jul-
04
Apr-
05
Jan-0
6O
ct-
06
Jul-
07
Apr-
08
Jan-0
9O
ct-
09
Jul-
10
Apr-
11
Jan-1
2O
ct-
12
Jul-
13
Apr-
14
Jan-1
5
Pri
ce (
Rm
b p
er
gra
m)
Pri
ce (
USD
per
ounce)
LME Spot Price (LHS) Shanghai Spot Price (RHS)
-
80
160
240
320
400
200
600
1,000
1,400
1,800
2,200
Jan-0
0O
ct-
00
Jul-
01
Apr-
02
Jan-0
3O
ct-
03
Jul-
04
Apr-
05
Jan-0
6O
ct-
06
Jul-
07
Apr-
08
Jan-0
9O
ct-
09
Jul-
10
Apr-
11
Jan-1
2O
ct-
12
Jul-
13
Apr-
14
Jan-1
5
Pri
ce (
Rm
b p
er
gra
m)
Pri
ce (
USD
per
oz)
LME Spot Price (LHS) Shanghai Spot Price (RHS)
0
40
80
120
160
200
240
-
200
400
600
800
1,000
1,200
Jan-0
0O
ct-
00
Jul-
01
Apr-
02
Jan-0
3O
ct-
03
Jul-
04
Apr-
05
Jan-0
6O
ct-
06
Jul-
07
Apr-
08
Jan-0
9O
ct-
09
Jul-
10
Apr-
11
Jan-1
2O
ct-
12
Jul-
13
Apr-
14
Jan-1
5
Pri
ce (
Rm
b p
er
gra
m)
Pri
ce (
USD
per
ounce)
LME Spot Price (LHS) Shanghai Spot Price (RHS)
March 9, 2015 18
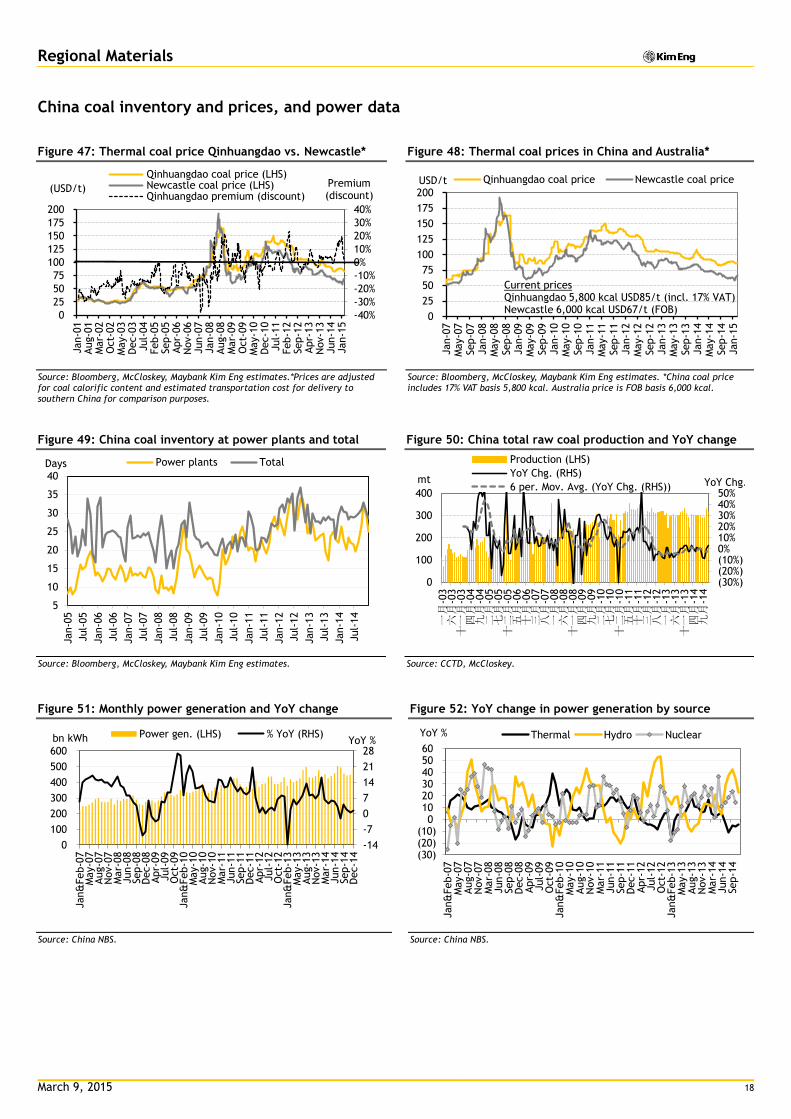
Regional Materials
China coal inventory and prices, and power data
Figure 47: Thermal coal price Qinhuangdao vs. Newcastle* Figure 48: Thermal coal prices in China and Australia*
Source: Bloomberg, McCloskey, Maybank Kim Eng estimates.*Prices are adjusted for coal calorific content and estimated transportation cost for delivery to southern China for comparison purposes.
Source: Bloomberg, McCloskey, Maybank Kim Eng estimates. *China coal price includes 17% VAT basis 5,800 kcal. Australia price is FOB basis 6,000 kcal.
Figure 49: China coal inventory at power plants and total Figure 50: China total raw coal production and YoY change
Source: Bloomberg, McCloskey, Maybank Kim Eng estimates. Source: CCTD, McCloskey.
Figure 51: Monthly power generation and YoY change Figure 52: YoY change in power generation by source
Source: China NBS. Source: China NBS.
-40%
-30%
-20%
-10%
0%
10%
20%
30%
40%
0
25
50
75
100
125
150
175
200
Jan-0
1Aug-0
1M
ar-
02
Oct-
02
May-0
3D
ec-0
3Jul-
04
Feb-0
5Sep-0
5Apr-
06
Nov-0
6Jun-0
7Jan-0
8Aug-0
8M
ar-
09
Oct-
09
May-1
0D
ec-1
0Jul-
11
Feb-1
2Sep-1
2Apr-
13
Nov-1
3Jun-1
4Jan-1
5
Premium (discount)
(USD/t)
Qinhuangdao coal price (LHS)Newcastle coal price (LHS)Qinhuangdao premium (discount)
0
25
50
75
100
125
150
175
200
Jan-0
7M
ay-0
7Sep-0
7Jan-0
8M
ay-0
8Sep-0
8Jan-0
9M
ay-0
9Sep-0
9Jan-1
0M
ay-1
0Sep-1
0Jan-1
1M
ay-1
1Sep-1
1Jan-1
2M
ay-1
2Sep-1
2Jan-1
3M
ay-1
3Sep-1
3Jan-1
4M
ay-1
4Sep-1
4Jan-1
5
USD/t Qinhuangdao coal price Newcastle coal price
Current prices Qinhuangdao 5,800 kcal USD85/t (incl. 17% VAT) Newcastle 6,000 kcal USD67/t (FOB)
5
10
15
20
25
30
35
40
Jan-0
5
Jul-
05
Jan-0
6
Jul-
06
Jan-0
7
Jul-
07
Jan-0
8
Jul-
08
Jan-0
9
Jul-
09
Jan-1
0
Jul-
10
Jan-1
1
Jul-
11
Jan-1
2
Jul-
12
Jan-1
3
Jul-
13
Jan-1
4
Jul-
14
Power plants TotalDays
(30%)(20%)(10%)0%10%20%30%40%50%
0
100
200
300
400
一月
-03
六月
-03
十一
月-0
3
四月
-04
九月
-04
二月
-05
七月
-05
十二
月-0
5
五月
-06
十月
-06
三月
-07
八月
-07
一月
-08
六月
-08
十一
月-0
8
四月
-09
九月
-09
二月
-10
七月
-10
十二
月-1
0
五月
-11
十月
-11
三月
-12
八月
-12
一月
-13
六月
-13
十一
月-1
3
四月
-14
九月
-14
mt
Production (LHS)
YoY Chg. (RHS)
6 per. Mov. Avg. (YoY Chg. (RHS)) YoY Chg.
-14
-7
0
7
14
21
28
0
100
200
300
400
500
600
Jan&
Feb-0
7M
ay-0
7Aug-0
7N
ov-0
7M
ar-
08
Jun-0
8Sep-0
8D
ec-0
8Apr-
09
Jul-
09
Oct-
09
Jan&
Feb-1
0M
ay-1
0Aug-1
0N
ov-1
0M
ar-
11
Jun-1
1Sep-1
1D
ec-1
1Apr-
12
Jul-
12
Oct-
12
Jan&
Feb-1
3M
ay-1
3Aug-1
3N
ov-1
3M
ar-
14
Jun-1
4Sep-1
4D
ec-1
4
YoY % bn kWh Power gen. (LHS) % YoY (RHS)
(30)(20)(10)
0102030405060
Jan&
Feb-0
7M
ay-0
7Aug-0
7N
ov-0
7M
ar-
08
Jun-0
8Sep-0
8D
ec-0
8Apr-
09
Jul-
09
Oct-
09
Jan&
Feb-1
0M
ay-1
0Aug-1
0N
ov-1
0M
ar-
11
Jun-1
1Sep-1
1D
ec-1
1Apr-
12
Jul-
12
Oct-
12
Jan&
Feb-1
3M
ay-1
3Aug-1
3N
ov-1
3M
ar-
14
Jun-1
4Sep-1
4YoY % Thermal Hydro Nuclear
March 9, 2015 19
Regional Materials
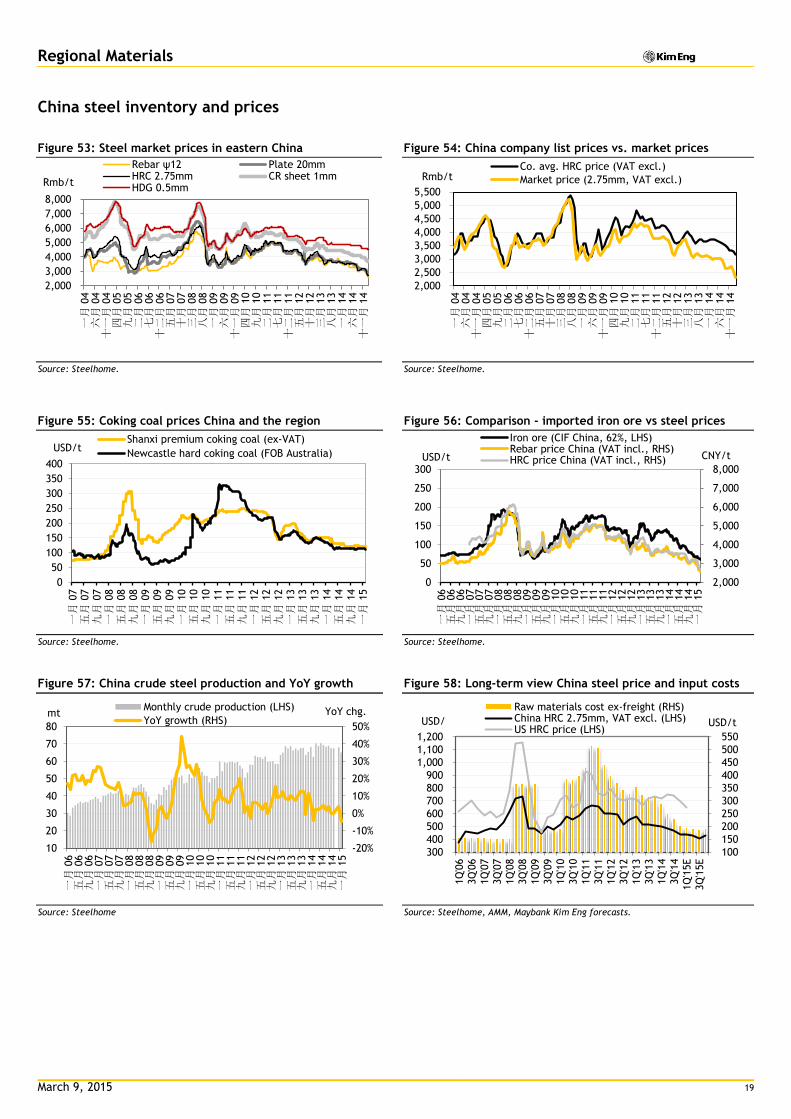
China steel inventory and prices
Figure 53: Steel market prices in eastern China Figure 54: China company list prices vs. market prices
Source: Steelhome. Source: Steelhome.
Figure 55: Coking coal prices China and the region Figure 56: Comparison - imported iron ore vs steel prices
Source: Steelhome. Source: Steelhome.
Figure 57: China crude steel production and YoY growth Figure 58: Long-term view China steel price and input costs
Source: Steelhome Source: Steelhome, AMM, Maybank Kim Eng forecasts.
2,000
3,000
4,000
5,000
6,000
7,000
8,000
一月
04
六月
04
十一月
04
四月
05
九月
05
二月
06
七月
06
十二月
06
五月
07
十月
07
三月
08
八月
08
一月
09
六月
09
十一月
09
四月
10
九月
10
二月
11
七月
11
十二月
11
五月
12
十月
12
三月
13
八月
13
一月
14
六月
14
十一月
14
Rebar ψ12 Plate 20mmHRC 2.75mm CR sheet 1mmHDG 0.5mm
Rmb/t
2,000
2,500
3,000
3,500
4,000
4,500
5,000
5,500
一月
04
六月
04
十一月
04
四月
05
九月
05
二月
06
七月
06
十二月
06
五月
07
十月
07
三月
08
八月
08
一月
09
六月
09
十一月
09
四月
10
九月
10
二月
11
七月
11
十二月
11
五月
12
十月
12
三月
13
八月
13
一月
14
六月
14
十一月
14
Co. avg. HRC price (VAT excl.)
Market price (2.75mm, VAT excl.)Rmb/t
0
50
100
150
200
250
300
350
400
一月
07
五月
07
九月
07
一月
08
五月
08
九月
08
一月
09
五月
09
九月
09
一月
10
五月
10
九月
10
一月
11
五月
11
九月
11
一月
12
五月
12
九月
12
一月
13
五月
13
九月
13
一月
14
五月
14
九月
14
一月
15
Shanxi premium coking coal (ex-VAT)
Newcastle hard coking coal (FOB Australia)USD/t
2,000
3,000
4,000
5,000
6,000
7,000
8,000
0
50
100
150
200
250
300
一月
06
五月
06
九月
06
一月
07
五月
07
九月
07
一月
08
五月
08
九月
08
一月
09
五月
09
九月
09
一月
10
五月
10
九月
10
一月
11
五月
11
九月
11
一月
12
五月
12
九月
12
一月
13
五月
13
九月
13
一月
14
五月
14
九月
14
一月
15
Iron ore (CIF China, 62%, LHS)Rebar price China (VAT incl., RHS)HRC price China (VAT incl., RHS)USD/t CNY/t
-20%
-10%
0%
10%
20%
30%
40%
50%
10
20
30
40
50
60
70
80
一月
06
五月
06
九月
06
一月
07
五月
07
九月
07
一月
08
五月
08
九月
08
一月
09
五月
09
九月
09
一月
10
五月
10
九月
10
一月
11
五月
11
九月
11
一月
12
五月
12
九月
12
一月
13
五月
13
九月
13
一月
14
五月
14
九月
14
一月
15
Monthly crude production (LHS)
YoY growth (RHS)YoY chg. mt
100
150
200
250
300
350
400
450
500
550
300
400
500
600
700
800
900
1,000
1,100
1,200
1Q
'06
3Q
'06
1Q
'07
3Q
'07
1Q
'08
3Q
'08
1Q
'09
3Q
'09
1Q
'10
3Q
'10
1Q
'11
3Q
'11
1Q
'12
3Q
'12
1Q
'13
3Q
'13
1Q
'14
3Q
'14
1Q
'15E
3Q
'15E
Raw materials cost ex-freight (RHS)China HRC 2.75mm, VAT excl. (LHS)US HRC price (LHS)
USD/ USD/t
March 9, 2015 20
Regional Materials
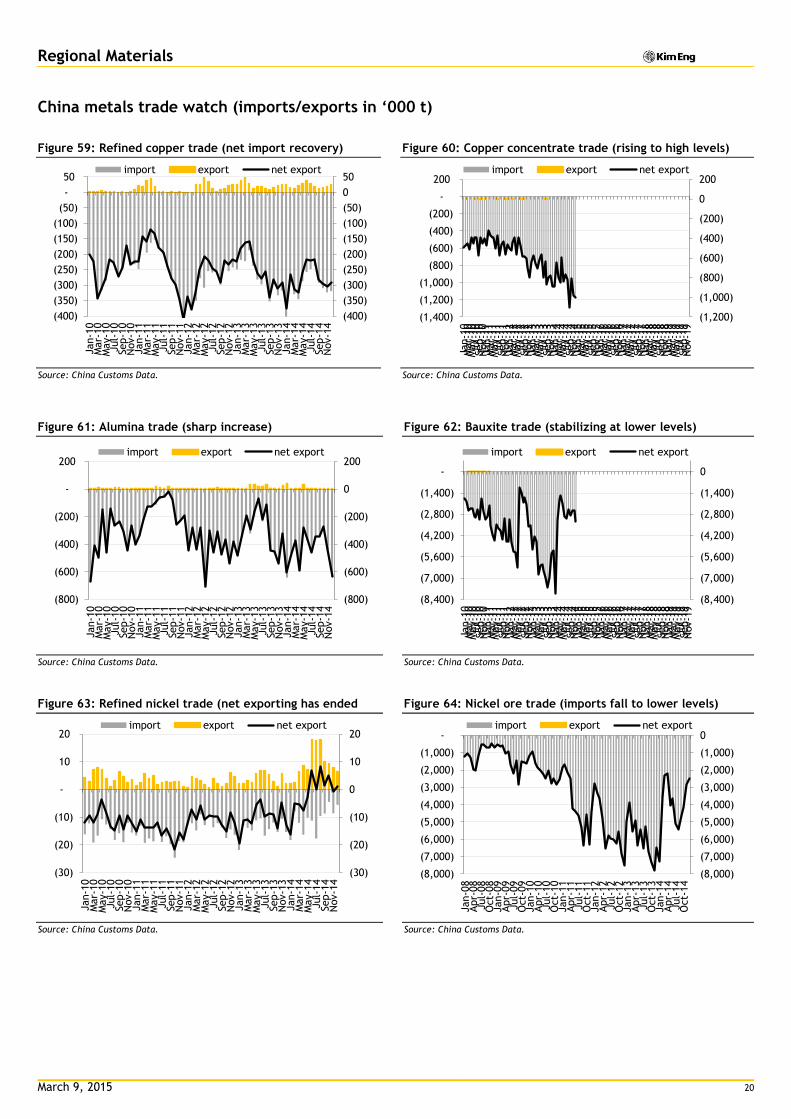
China metals trade watch (imports/exports in ‘000 t)
Figure 59: Refined copper trade (net import recovery) Figure 60: Copper concentrate trade (rising to high levels)
Source: China Customs Data. Source: China Customs Data.
Figure 61: Alumina trade (sharp increase) Figure 62: Bauxite trade (stabilizing at lower levels)
Source: China Customs Data. Source: China Customs Data.
Figure 63: Refined nickel trade (net exporting has ended Figure 64: Nickel ore trade (imports fall to lower levels)
Source: China Customs Data. Source: China Customs Data.
(400)
(350)
(300)
(250)
(200)
(150)
(100)
(50)
0
50
(400)
(350)
(300)
(250)
(200)
(150)
(100)
(50)
-
50
Jan-1
0M
ar-
10
May-1
0Jul-
10
Sep-1
0N
ov-1
0Jan-1
1M
ar-
11
May-1
1Jul-
11
Sep-1
1N
ov-1
1Jan-1
2M
ar-
12
May-1
2Jul-
12
Sep-1
2N
ov-1
2Jan-1
3M
ar-
13
May-1
3Jul-
13
Sep-1
3N
ov-1
3Jan-1
4M
ar-
14
May-1
4Jul-
14
Sep-1
4N
ov-1
4
import export net export
(1,200)
(1,000)
(800)
(600)
(400)
(200)
0
200
(1,400)
(1,200)
(1,000)
(800)
(600)
(400)
(200)
-
200
Jan-1
0M
ar-
10
May-1
0Jul-
10
Sep-1
0N
ov-1
0Jan-1
1M
ar-
11
May-1
1Jul-
11
Sep-1
1N
ov-1
1Jan-1
2M
ar-
12
May-1
2Jul-
12
Sep-1
2N
ov-1
2Jan-1
3M
ar-
13
May-1
3Jul-
13
Sep-1
3N
ov-1
3Jan-1
4M
ar-
14
May-1
4Jul-
14
Sep-1
4N
ov-1
4Jan-1
5M
ar-
15
May-1
5Jul-
15
Sep-1
5N
ov-1
5Jan-1
6M
ar-
16
May-1
6Jul-
16
Sep-1
6N
ov-1
6Jan-1
7M
ar-
17
May-1
7Jul-
17
Sep-1
7N
ov-1
7Jan-1
8M
ar-
18
May-1
8Jul-
18
Sep-1
8N
ov-1
8Jan-1
9M
ar-
19
May-1
9Jul-
19
Sep-1
9N
ov-1
9
import export net export
(800)
(600)
(400)
(200)
0
200
(800)
(600)
(400)
(200)
-
200
Jan-1
0M
ar-
10
May-1
0Jul-
10
Sep-1
0N
ov-1
0Jan-1
1M
ar-
11
May-1
1Jul-
11
Sep-1
1N
ov-1
1Jan-1
2M
ar-
12
May-1
2Jul-
12
Sep-1
2N
ov-1
2Jan-1
3M
ar-
13
May-1
3Jul-
13
Sep-1
3N
ov-1
3Jan-1
4M
ar-
14
May-1
4Jul-
14
Sep-1
4N
ov-1
4
import export net export
(8,400)
(7,000)
(5,600)
(4,200)
(2,800)
(1,400)
0
(8,400)
(7,000)
(5,600)
(4,200)
(2,800)
(1,400)
-Jan-1
0M
ar-
10
May-1
0Jul-
10
Sep-1
0N
ov-1
0Jan-1
1M
ar-
11
May-1
1Jul-
11
Sep-1
1N
ov-1
1Jan-1
2M
ar-
12
May-1
2Jul-
12
Sep-1
2N
ov-1
2Jan-1
3M
ar-
13
May-1
3Jul-
13
Sep-1
3N
ov-1
3Jan-1
4M
ar-
14
May-1
4Jul-
14
Sep-1
4N
ov-1
4Jan-1
5M
ar-
15
May-1
5Jul-
15
Sep-1
5N
ov-1
5Jan-1
6M
ar-
16
May-1
6Jul-
16
Sep-1
6N
ov-1
6Jan-1
7M
ar-
17
May-1
7Jul-
17
Sep-1
7N
ov-1
7Jan-1
8M
ar-
18
May-1
8Jul-
18
Sep-1
8N
ov-1
8Jan-1
9M
ar-
19
May-1
9Jul-
19
Sep-1
9N
ov-1
9
import export net export
(30)
(20)
(10)
0
10
20
(30)
(20)
(10)
-
10
20
Jan-1
0M
ar-
10
May-1
0Jul-
10
Sep-1
0N
ov-1
0Jan-1
1M
ar-
11
May-1
1Jul-
11
Sep-1
1N
ov-1
1Jan-1
2M
ar-
12
May-1
2Jul-
12
Sep-1
2N
ov-1
2Jan-1
3M
ar-
13
May-1
3Jul-
13
Sep-1
3N
ov-1
3Jan-1
4M
ar-
14
May-1
4Jul-
14
Sep-1
4N
ov-1
4
import export net export
(8,000)
(7,000)
(6,000)
(5,000)
(4,000)
(3,000)
(2,000)
(1,000)
0
(8,000)
(7,000)
(6,000)
(5,000)
(4,000)
(3,000)
(2,000)
(1,000)
-
Jan-0
8Apr-
08
Jul-
08
Oct-
08
Jan-0
9Apr-
09
Jul-
09
Oct-
09
Jan-1
0Apr-
10
Jul-
10
Oct-
10
Jan-1
1Apr-
11
Jul-
11
Oct-
11
Jan-1
2Apr-
12
Jul-
12
Oct-
12
Jan-1
3Apr-
13
Jul-
13
Oct-
13
Jan-1
4Apr-
14
Jul-
14
Oct-
14
import export net export
March 9, 2015 21
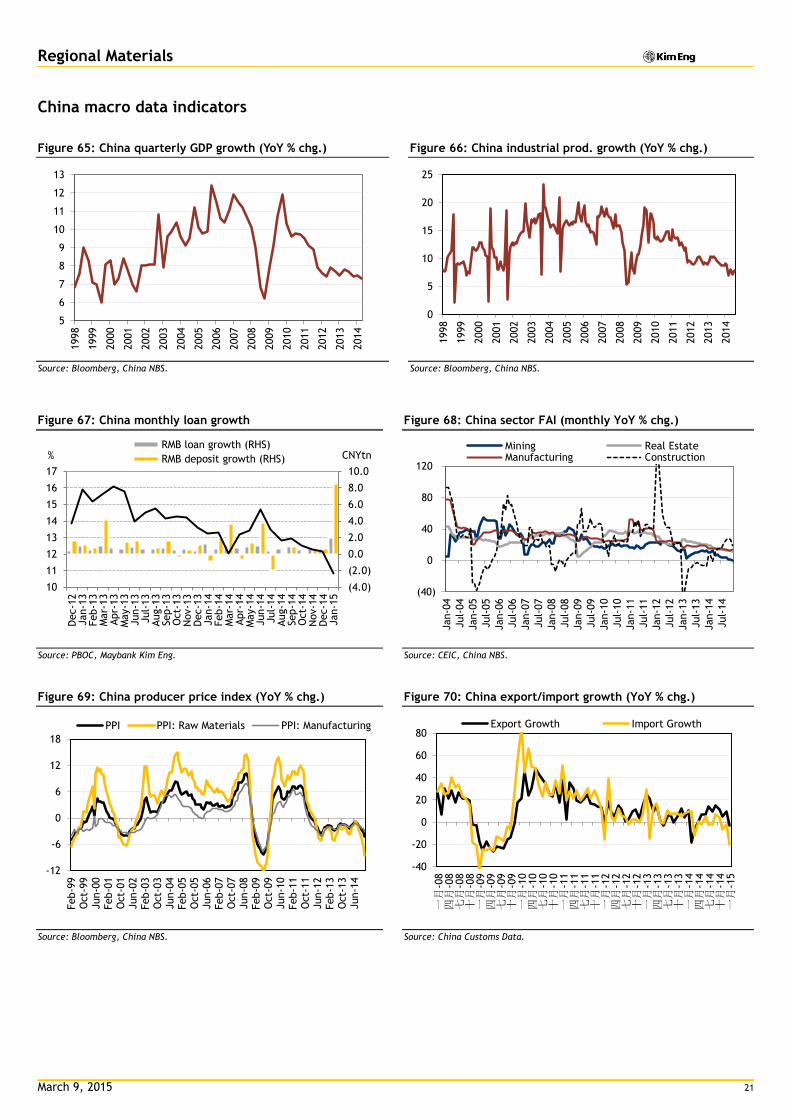
Regional Materials
China macro data indicators
Figure 65: China quarterly GDP growth (YoY % chg.) Figure 66: China industrial prod. growth (YoY % chg.)
Source: Bloomberg, China NBS. Source: Bloomberg, China NBS.
Figure 67: China monthly loan growth Figure 68: China sector FAI (monthly YoY % chg.)
Source: PBOC, Maybank Kim Eng. Source: CEIC, China NBS.
Figure 69: China producer price index (YoY % chg.) Figure 70: China export/import growth (YoY % chg.)
Source: Bloomberg, China NBS. Source: China Customs Data.
5
6
7
8
9
10
11
12
13
1998
1999
2000
2001
2002
2003
2004
2005
2006
2007
2008
2009
2010
2011
2012
2013
2014
0
5
10
15
20
25
1998
1999
2000
2001
2002
2003
2004
2005
2006
2007
2008
2009
2010
2011
2012
2013
2014
(4.0)
(2.0)
0.0
2.0
4.0
6.0
8.0
10.0
10
11
12
13
14
15
16
17
Dec-1
2Jan-1
3Feb-1
3M
ar-
13
Apr-
13
May-1
3Jun-1
3Jul-
13
Aug-1
3Sep-1
3O
ct-
13
Nov-1
3D
ec-1
3Jan-1
4Feb-1
4M
ar-
14
Apr-
14
May-1
4Jun-1
4Jul-
14
Aug-1
4Sep-1
4O
ct-
14
Nov-1
4D
ec-1
4Jan-1
5
CNYtn % RMB loan growth (RHS)
RMB deposit growth (RHS)
(40)
0
40
80
120
Jan-0
4
Jul-
04
Jan-0
5
Jul-
05
Jan-0
6
Jul-
06
Jan-0
7
Jul-
07
Jan-0
8
Jul-
08
Jan-0
9
Jul-
09
Jan-1
0
Jul-
10
Jan-1
1
Jul-
11
Jan-1
2
Jul-
12
Jan-1
3
Jul-
13
Jan-1
4
Jul-
14
Mining Real EstateManufacturing Construction
-12
-6
0
6
12
18
Feb-9
9O
ct-
99
Jun-0
0Feb-0
1O
ct-
01
Jun-0
2Feb-0
3O
ct-
03
Jun-0
4Feb-0
5O
ct-
05
Jun-0
6Feb-0
7O
ct-
07
Jun-0
8Feb-0
9O
ct-
09
Jun-1
0Feb-1
1O
ct-
11
Jun-1
2Feb-1
3O
ct-
13
Jun-1
4
PPI PPI: Raw Materials PPI: Manufacturing
-40
-20
0
20
40
60
80
一月
-08
四月
-08
七月
-08
十月
-08
一月
-09
四月
-09
七月
-09
十月
-09
一月
-10
四月
-10
七月
-10
十月
-10
一月
-11
四月
-11
七月
-11
十月
-11
一月
-12
四月
-12
七月
-12
十月
-12
一月
-13
四月
-13
七月
-13
十月
-13
一月
-14
四月
-14
七月
-14
十月
-14
一月
-15
Export Growth Import Growth
March 9, 2015 22
Regional Materials
Research Offices
REGIONAL
WONG Chew Hann, CA
Regional Head of Institutional Research
(603) 2297 8686 [email protected]
ONG Seng Yeow
Regional Head of Retail Research
(65) 6432 1453
Alexander GARTHOFF
Institutional Product Manager
(852) 2268 0638
ECONOMICS
Suhaimi ILIAS
Chief Economist
Singapore | Malaysia
(603) 2297 8682
Luz LORENZO
Philippines
(63) 2 849 8836
Tim LEELAHAPHAN
Thailand
(66) 2658 6300 ext 1420
JUNIMAN
Chief Economist, BII
Indonesia
(62) 21 29228888 ext 29682
STRATEGY
Sadiq Currimbhoy
Global Strategist
(65) 6231 5836 [email protected]
Willie Chan
Hong Kong / Regional
(852) 2268 0631 [email protected]
MALAYSIA
WONG Chew Hann, CA Head of Research (603) 2297 8686 [email protected] • Strategy • Construction & Infrastructure
Desmond CH’NG, ACA (603) 2297 8680 [email protected] • Banking & Finance
LIAW Thong Jung (603) 2297 8688 [email protected] • Oil & Gas - Regional • Shipping
ONG Chee Ting, CA (603) 2297 8678 [email protected] • Plantations - Regional
Mohshin AZIZ (603) 2297 8692 [email protected] • Aviation - Regional • Petrochem
YIN Shao Yang, CPA (603) 2297 8916 [email protected] • Gaming – Regional • Media
TAN Chi Wei, CFA (603) 2297 8690 [email protected] • Power • Telcos
WONG Wei Sum, CFA (603) 2297 8679 [email protected] • Property & REITs
LEE Yen Ling (603) 2297 8691 [email protected] • Building Materials • Glove Producers
CHAI Li Shin, CFA (603) 2297 8684 [email protected] • Plantation • Construction & Infrastructure
Ivan YAP (603) 2297 8612 [email protected] • Automotive
Kevin WONG (603) 2082 6824 [email protected] • REITs
LEE Cheng Hooi Regional Chartist (603) 2297 8694 [email protected]
Tee Sze Chiah Head of Retail Research
(603) 2297 6858 [email protected]
HONG KONG / CHINA
Howard WONG Head of Research (852) 2268 0648 [email protected] • Oil & Gas - Regional
Alexander LATZER (852) 2268 0647 [email protected] • Metals & Mining – Regional
Benjamin HO (852) 2268 0632 [email protected] • Consumer & Auto
Jacqueline KO, CFA (852) 2268 0633 [email protected] • Consumer Staples & Durables
Ka Leong LO, CFA (852) 2268 0630 [email protected] • Consumer Discretionary & Auto
Karen KWAN (852) 2268 0640 [email protected] • Property & REITs
Mitchell KIM (852) 2268 0634 [email protected] • Internet & Telcos
Osbert TANG, CFA (86) 21 5096 8370 [email protected] • Transport & Industrials
Ricky WK NG, CFA (852) 2268 0689 [email protected] • Utilities & Renewable Energy
Steven ST CHAN (852) 2268 0645 [email protected] • Banking & Financials - Regional
Warren LAU (852) 2268 0644 [email protected] • Technology – Regional
INDIA
Jigar SHAH Head of Research
(91) 22 6632 2632
• Oil & Gas • Automobile • Cement
Anubhav GUPTA
(91) 22 6623 2605
• Metal & Mining • Capital Goods • Property
Urmil SHAH
(91) 22 6623 2606 [email protected]
• Technology • Media
Vishal MODI
(91) 22 6623 2607 [email protected]
• Banking & Financials
Abhijeet Kundu
(91) 22 6623 2628 [email protected]
• Consumer
SINGAPORE
NG Wee Siang Head of Research (65) 6231 5838 [email protected] • Banking & Finance
Gregory YAP (65) 6231 5848 [email protected] • SMID Caps – Regional • Technology & Manufacturing • Telcos
YEAK Chee Keong, CFA (65) 6231 5842 [email protected] • Offshore & Marine
Derrick HENG, CFA (65) 6231 5843 [email protected] • Transport (Land, Shipping & Aviation)
WEI Bin (65) 6231 5844 [email protected] • Commodity • Logistics • S-chips
John CHEONG (65) 6231 5845 [email protected] • Small & Mid Caps • Healthcare
TRUONG Thanh Hang (65) 6231 5847 [email protected] • Small & Mid Caps
INDONESIA
Wilianto IE Head of Research (62) 21 2557 1125 [email protected] • Strategy
Rahmi MARINA (62) 21 2557 1128 [email protected] • Banking & Finance
Aurellia SETIABUDI (62) 21 2953 0785 [email protected] • Property
Isnaputra ISKANDAR (62) 21 2557 1129 [email protected] • Metals & Mining • Cement
Pandu ANUGRAH (62) 21 2557 1137 [email protected] • Infra • Construction • Transport• Telcos
Janni ASMAN (62) 21 2953 0784 [email protected] • Cigarette • Healthcare • Retail
Adhi Tasmin (62) 21 2557 1209 [email protected] • Plantations
PHILIPPINES
Luz LORENZO Head of Research (63) 2 849 8836 [email protected] • Strategy • Utilities • Conglomerates • Telcos
Lovell SARREAL (63) 2 849 8841 [email protected] • Consumer • Media • Cement
Rommel RODRIGO (63) 2 849 8839 [email protected] • Conglomerates • Property • Gaming • Ports/ Logistics
Katherine TAN (63) 2 849 8843 [email protected] • Banks • Construction
Ramon ADVIENTO (63) 2 849 8845 [email protected] • Mining
Michael Bengson (63) 2 849 8840 [email protected] • Conglomerates
Jaclyn Jimenez (63) 2 849 8842 [email protected] • Consumer
Arabelle Maghirang (63) 2 849 8838 [email protected] • Banks
THAILAND
Maria LAPIZ Head of Institutional Research Dir (66) 2257 0250 | (66) 2658 6300 ext 1399 [email protected] • Consumer • Materials • Ind.Estates
Jesada TECHAHUSDIN, CFA (66) 2658 6300 ext 1394 [email protected] • Financial Services
Kittisorn PRUITIPAT, CFA, FRM (66) 2658 6300 ext 1395 [email protected] • Real Estate • Telcos
Sittichai DUANGRATTANACHAYA (66) 2658 6300 ext 1393 [email protected] • Services Sector • Transport
Sukit UDOMSIRIKUL Head of Retail Research (66) 2658 6300 ext 5090 [email protected]
Mayuree CHOWVIKRAN (66) 2658 6300 ext 1440 [email protected] • Strategy
Padon VANNARAT (66) 2658 6300 ext 1450 [email protected] • Strategy
Surachai PRAMUALCHAROENKIT (66) 2658 6300 ext 1470 [email protected] • Auto • Conmat • Contractor • Steel
Suttatip PEERASUB (66) 2658 6300 ext 1430 [email protected] • Media • Commerce
Sutthichai KUMWORACHAI (66) 2658 6300 ext 1400 [email protected] • Energy • Petrochem
Termporn TANTIVIVAT (66) 2658 6300 ext 1520
[email protected] • Property
Jaroonpan WATTANAWONG (66) 2658 6300 ext 1404 [email protected] • Transportation • Small cap
Chatchai JINDARAT (66) 2658 6300 ext 1401 [email protected] • Electronics
VIETNAM
LE Hong Lien, ACCA Head of Institutional Research (84) 8 44 555 888 x 8181 [email protected] • Strategy • Consumer • Diversified • Utilities
THAI Quang Trung, CFA, Deputy Manager, Institutional Research (84) 8 44 555 888 x 8180 [email protected] • Real Estate • Construction • Materials
Le Nguyen Nhat Chuyen (84) 8 44 555 888 x 8082 [email protected] • Oil & Gas NGUYEN Thi Ngan Tuyen, Head of Retail Research (84) 8 44 555 888 x 8081 [email protected] • Food & Beverage • Oil&Gas • Banking
TRINH Thi Ngoc Diep (84) 4 44 555 888 x 8208 [email protected] • Technology • Utilities • Construction
TRUONG Quang Binh (84) 4 44 555 888 x 8087 [email protected] • Rubber plantation • Tyres and Tubes • Oil&Gas
PHAM Nhat Bich (84) 8 44 555 888 x 8083 [email protected] • Consumer • Manufacturing • Fishery
NGUYEN Thi Sony Tra Mi (84) 8 44 555 888 x 8084 [email protected] • Port operation • Pharmaceutical • Food & Beverage
March 9, 2015 23
Regional Materials
APPENDIX I: TERMS FOR PROVISION OF REPORT, DISCLAIMERS AND DISCLOSURES
DISCLAIMERS
This research report is prepared for general circulation and for information purposes only and under no circumstances should it be considered or intended as an offer to sell or a solicitation of an offer to buy the securities referred to herein. Investors should note that values of such securities, if any, may fluctuate and that each security’s price or value may rise or fall. Opinions or recommendations contained herein are in form of technical ratings and fundamental ratings. Technical ratings may differ from fundamental ratings as technical valuations apply different methodologies and are purely based on price and volume-related information extracted from the relevant jurisdiction’s stock exchange in the equity analysis. Accordingly, investors’ returns may be less than the original sum invested. Past performance is not necessarily a guide to future performance. This report is not intended to provide personal investment advice and does not take into account the specific investment objectives, the financial situation and the particular needs of persons who may receive or read this report. Investors should therefore seek financial, legal and other advice regarding the appropriateness of investing in any securities or the investment strategies discussed or recommended in this report.
The information contained herein has been obtained from sources believed to be reliable but such sources have not been independently verified by Maybank Investment Bank Berhad, its subsidiary and affiliates (collectively, “MKE”) and consequently no representation is made as to the accuracy or completeness of this report by MKE and it should not be relied upon as such. Accordingly, MKE and its officers, directors, associates, connected parties and/or employees (collectively, “Representatives”) shall not be liable for any direct, indirect or consequential losses or damages that may arise from the use or reliance of this report. Any information, opinions or recommendations contained herein are subject to change at any time, without prior notice.
This report may contain forward looking statements which are often but not always identified by the use of words such as “anticipate”, “believe”, “estimate”, “intend”, “plan”, “expect”, “forecast”, “predict” and “project” and statements that an event or result “may”, “will”, “can”, “should”, “could” or “might” occur or be achieved and other similar expressions. Such forward looking statements are based on assumptions made and information currently available to us and are subject to certain risks and uncertainties that could cause the actual results to differ materially from those expressed in any forward looking statements. Readers are cautioned not to place undue relevance on these forward-looking statements. MKE expressly disclaims any obligation to update or revise any such forward looking statements to reflect new information, events or circumstances after the date of this publication or to reflect the occurrence of unanticipated events.
MKE and its officers, directors and employees, including persons involved in the preparation or issuance of this report, may, to the extent permitted by law, from time to time participate or invest in financing transactions with the issuer(s) of the securities mentioned in this report, perform services for or solicit business from such issuers, and/or have a position or holding, or other material interest, or effect transactions, in such securities or options thereon, or other investments related thereto. In addition, it may make markets in the securities mentioned in the material presented in this report. MKE may, to the extent permitted by law, act upon or use the information presented herein, or the research or analysis on which they are based, before the material is published. One or more directors, officers and/or employees of MKE may be a director of the issuers of the securities mentioned in this report.
This report is prepared for the use of MKE’s clients and may not be reproduced, altered in any way, transmitted to, copied or distributed to any other party in whole or in part in any form or manner without the prior express written consent of MKE and MKE and its Representatives accepts no liability whatsoever for the actions of third parties in this respect.
This report is not directed to or intended for distribution to or use by any person or entity who is a citizen or resident of or located in any locality, state, country or other jurisdiction where such distribution, publication, availability or use would be contrary to law or regulation. This report is for distribution only under such circumstances as may be permitted by applicable law. The securities described herein may not be eligible for sale in all jurisdictions or to certain categories of investors. Without prejudice to the foregoing, the reader is to note that additional disclaimers, warnings or qualifications may apply based on geographical location of the person or entity receiving this report.
Malaysia
Opinions or recommendations contained herein are in the form of technical ratings and fundamental ratings. Technical ratings may differ from fundamental ratings as technical valuations apply different methodologies and are purely based on price and volume-related information extracted from Bursa Malaysia Securities Berhad in the equity analysis.
Singapore
This report has been produced as of the date hereof and the information herein may be subject to change. Maybank Kim Eng Research Pte. Ltd. (“Maybank KERPL”) in Singapore has no obligation to update such information for any recipient. For distribution in Singapore, recipients of this report are to contact Maybank KERPL in Singapore in respect of any matters arising from, or in connection with, this report. If the recipient of this report is not an accredited investor, expert investor or institutional investor (as defined under Section 4A of the Singapore Securities and Futures Act), Maybank KERPL shall be legally liable for the contents of this report, with such liability being limited to the extent (if any) as permitted by law.
Thailand
The disclosure of the survey result of the Thai Institute of Directors Association (“IOD”) regarding corporate governance is made pursuant to the policy of the Office of the Securities and Exchange Commission. The survey of the IOD is based on the information of a company listed on the Stock Exchange of Thailand and the market for Alternative Investment disclosed to the public and able to be accessed by a general public investor. The result, therefore, is from the perspective of a third party. It is not an evaluation of operation and is not based on inside information. The survey result is as of the date appearing in the Corporate Governance Report of Thai Listed Companies. As a result, the survey may be changed after that date. Maybank Kim Eng Securities (Thailand) Public Company Limited (“MBKET”) does not confirm nor certify the accuracy of such survey result.
Except as specifically permitted, no part of this presentation may be reproduced or distributed in any manner without the prior written permission of MBKET. MBKET accepts no liability whatsoever for the actions of third parties in this respect.
US
This research report prepared by MKE is distributed in the United States (“US”) to Major US Institutional Investors (as defined in Rule 15a-6 under the Securities Exchange Act of 1934, as amended) only by Maybank Kim Eng Securities USA Inc (“Maybank KESUSA”), a broker-dealer registered in the US (registered under Section 15 of the Securities Exchange Act of 1934, as amended). All responsibility for the distribution of this report by Maybank KESUSA in the US shall be borne by Maybank KESUSA. All resulting transactions by a US person or entity should be effected through a registered broker-dealer in the US. This report is not directed at you if MKE is prohibited or restricted by any legislation or regulation in any jurisdiction from making it available to you. You should satisfy yourself before reading it that Maybank KESUSA is permitted to provide research material concerning investments to you under relevant legislation and regulations.
UK
This document is being distributed by Maybank Kim Eng Securities (London) Ltd (“Maybank KESL”) which is authorized and regulated, by the Financial Services Authority and is for Informational Purposes only. This document is not intended for distribution to anyone defined as a Retail Client under the Financial Services and Markets Act 2000 within the UK. Any inclusion of a third party link is for the recipients convenience only, and that the firm does not take any responsibility for its comments or accuracy, and that access to such links is at the individuals own risk. Nothing in this report should be considered as constituting legal, accounting or tax advice, and that for accurate guidance recipients should consult with their own independent tax advisers.
March 9, 2015 24
Regional Materials
Disclosure of Interest
Malaysia: MKE and its Representatives may from time to time have positions or be materially interested in the securities referred to herein and may further act as market maker or may have assumed an underwriting commitment or deal with such securities and may also perform or seek to perform investment banking services, advisory and other services for or relating to those companies.
Singapore: As of 09 March 2015, Maybank KERPL and the covering analyst do not have any interest in any companies recommended in this research report.
Thailand: MBKET may have a business relationship with or may possibly be an issuer of derivative warrants on the securities /companies mentioned in the research report. Therefore, Investors should exercise their own judgment before making any investment decisions. MBKET, its associates, directors, connected parties and/or employees may from time to time have interests and/or underwriting commitments in the securities mentioned in this report.
Hong Kong: KESHK may have financial interests in relation to an issuer or a new listing applicant referred to as defined by the requirements under Paragraph 16.5(a) of the Hong Kong Code of Conduct for Persons Licensed by or Registered with the Securities and Futures Commission.
As of 09 March 2015, KESHK and the authoring analyst do not have any interest in any companies recommended in this research report.
MKE may have, within the last three years, served as manager or co-manager of a public offering of securities for, or currently may make a primary market in issues of, any or all of the entities mentioned in this report or may be providing, or have provided within the previous 12 months, significant advice or investment services in relation to the investment concerned or a related investment and may receive compensation for the services provided from the companies covered in this report.
OTHERS
Analyst Certification of Independence
The views expressed in this research report accurately reflect the analyst’s personal views about any and all of the subject securities or issuers; and no part of the research analyst’s compensation was, is or will be, directly or indirectly, related to the specific recommendations or views expressed in the report.
Reminder
Structured securities are complex instruments, typically involve a high degree of risk and are intended for sale only to sophisticated investors who are capable of understanding and assuming the risks involved. The market value of any structured security may be affected by changes in economic, financial and political factors (including, but not limited to, spot and forward interest and exchange rates), time to maturity, market conditions and volatility and the credit quality of any issuer or reference issuer. Any investor interested in purchasing a structured product should conduct its own analysis of the product and consult with its own professional advisers as to the risks involved in making such a purchase.
No part of this material may be copied, photocopied or duplicated in any form by any means or redistributed without the prior consent of MKE.
Definition of Ratings
Maybank Kim Eng Research uses the following rating system
BUY Return is expected to be above 10% in the next 12 months (excluding dividends)
HOLD Return is expected to be between - 10% to +10% in the next 12 months (excluding dividends)
SELL Return is expected to be below -10% in the next 12 months (excluding dividends)
Applicability of Ratings
The respective analyst maintains a coverage universe of stocks, the list of which may be adjusted according to needs. Investment ratings are only applicable to the stocks which form part of the coverage universe. Reports on companies which are not part of the coverage do not carry investment ratings as we do not actively follow developments in these companies.
DISCLOSURES
Legal Entities Disclosures
Malaysia: This report is issued and distributed in Malaysia by Maybank Investment Bank Berhad (15938-H) which is a Participating Organization of Bursa Malaysia Berhad and a holder of Capital Markets and Services License issued by the Securities Commission in Malaysia. Singapore: This material is issued and distributed in Singapore by Maybank KERPL (Co. Reg No 197201256N) which is regulated by the Monetary Authority of Singapore. Indonesia: PT Kim Eng Securities (“PTKES”) (Reg. No. KEP-251/PM/1992) is a member of the Indonesia Stock Exchange and is regulated by the BAPEPAM LK. Thailand: MBKET (Reg. No.0107545000314) is a member of the Stock Exchange of Thailand and is regulated by the Ministry of Finance and the Securities and Exchange Commission. Philippines: Maybank ATRKES (Reg. No.01-2004-00019) is a member of the Philippines Stock Exchange and is regulated by the Securities and Exchange Commission. Vietnam: Maybank Kim Eng Securities JSC (License Number: 71/UBCK-GP) is licensed under the State Securities Commission of Vietnam.Hong Kong: KESHK (Central Entity No AAD284) is regulated by the Securities and Futures Commission. India: Kim Eng Securities India Private Limited (“KESI”) is a participant of the National Stock Exchange of India Limited (Reg No: INF/INB 231452435) and the Bombay Stock Exchange (Reg. No. INF/INB 011452431) and is regulated by Securities and Exchange Board of India. KESI is also registered with SEBI as Category 1 Merchant Banker (Reg. No. INM 000011708) US: Maybank KESUSA is a member of/ and is authorized and regulated by the FINRA – Broker ID 27861. UK: Maybank KESL (Reg No 2377538) is authorized and regulated by the Financial Services Authority.
March 9, 2015 25
Regional Materials
Malaysia Maybank Investment Bank Berhad
(A Participating Organisation of
Bursa Malaysia Securities Berhad)
33rd Floor, Menara Maybank,
100 Jalan Tun Perak,
50050 Kuala Lumpur
Tel: (603) 2059 1888;
Fax: (603) 2078 4194
Singapore Maybank Kim Eng Securities Pte Ltd
Maybank Kim Eng Research Pte Ltd
50 North Canal Road
Singapore 059304
Tel: (65) 6336 9090
London Maybank Kim Eng Securities
(London) Ltd
5th Floor, Aldermary House
10-15 Queen Street
London EC4N 1TX, UK
Tel: (44) 20 7332 0221
Fax: (44) 20 7332 0302
New York Maybank Kim Eng Securities USA
Inc
777 Third Avenue, 21st Floor
New York, NY 10017, U.S.A.
Tel: (212) 688 8886
Fax: (212) 688 3500
Stockbroking Business:
Level 8, Tower C, Dataran Maybank,
No.1, Jalan Maarof
59000 Kuala Lumpur
Tel: (603) 2297 8888
Fax: (603) 2282 5136
Hong Kong Kim Eng Securities (HK) Ltd
Level 30,
Three Pacific Place,
1 Queen’s Road East,
Hong Kong
Tel: (852) 2268 0800
Fax: (852) 2877 0104
Indonesia PT Maybank Kim Eng Securities
Plaza Bapindo
Citibank Tower 17th Floor
Jl Jend. Sudirman Kav. 54-55
Jakarta 12190, Indonesia
Tel: (62) 21 2557 1188
Fax: (62) 21 2557 1189
India Kim Eng Securities India Pvt Ltd
2nd Floor, The International 16,
Maharishi Karve Road,
Churchgate Station,
Mumbai City - 400 020, India
Tel: (91) 22 6623 2600
Fax: (91) 22 6623 2604
Philippines Maybank ATR Kim Eng Securities Inc.
17/F, Tower One & Exchange Plaza
Ayala Triangle, Ayala Avenue
Makati City, Philippines 1200
Tel: (63) 2 849 8888
Fax: (63) 2 848 5738
Thailand Maybank Kim Eng Securities
(Thailand) Public Company Limited
999/9 The Offices at Central World,
20th - 21st Floor,
Rama 1 Road Pathumwan,
Bangkok 10330, Thailand
Tel: (66) 2 658 6817 (sales)
Tel: (66) 2 658 6801 (research)
Vietnam Maybank Kim Eng Securities Limited
4A-15+16 Floor Vincom Center Dong
Khoi, 72 Le Thanh Ton St. District 1
Ho Chi Minh City, Vietnam
Tel : (84) 844 555 888
Fax : (84) 8 38 271 030
Saudi Arabia In association with
Anfaal Capital
Villa 47, Tujjar Jeddah
Prince Mohammed bin Abdulaziz
Street P.O. Box 126575
Jeddah 21352
Tel: (966) 2 6068686
Fax: (966) 26068787
South Asia Sales Trading Kevin Foy
Regional Head Sales Trading
Tel: (65) 6336-5157
US Toll Free: 1-866-406-7447
North Asia Sales Trading Alex Tsun
Tel: (852) 2268 0228
US Toll Free: 1 877 837 7635
Malaysia Rommel Jacob [email protected] Tel: (603) 2717 5152
Thailand Tanasak Krishnasreni [email protected] Tel: (66)2 658 6820
Indonesia Harianto Liong [email protected] Tel: (62) 21 2557 1177
London Simon Lovekin [email protected] Tel: (44)-207-626-2828
New York Andrew Dacey [email protected] Tel: (212) 688 2956
India Manish Modi [email protected] Tel: (91)-22-6623-2601
Vietnam Tien Nguyen [email protected]
Tel: (84) 44 555 888 x8079
Philippines Keith Roy [email protected] Tel: (63) 2 848-5288
www.maybank-ke.com | www.maybank-keresearch.com