Embed Size (px)
Citation preview
Regional Health Status Indicators
Western Massachusetts
Deval L. Patrick, Governor Timothy P. Murray, Lieutenant Governor
Judyann Bigby, MD, Secretary of Health and Human Services John Auerbach, Commissioner, Department of Public Health
Jerry O’Keefe, Associate Commissioner Health Information, Statistics, Research, and Evaluation Bureau
Bruce Cohen, Director Division of Research and Epidemiology
Massachusetts Department of Public Health
June 2007
2
ACKNOWLEDGEMENTS
This report was prepared by Isabel Caceres, MS, Malena Orejuela-Hood, MPH, and James West, PhD of the Division of Research and Epidemiology and by Lauren Wooley, MPH, of the Health Survey Program, Center for Health Information, Statistics, Research, and Evaluation. Special thanks go to Bruce Cohen, PhD, Director of the Division or Research and Epidemiology, and to all of the DPH Bureaus who have contributed to this report.
To obtain additional copies of this report, contact:
Massachusetts Department of Public Health Health Information, Statistics, Research and Evaluation Bureau
250 Washington Street, 6th Floor Boston, MA 02108
This and other Department of Public Health publications can be downloaded
from the following website:
http://www.mass.gov/dph/resep
To obtain more information on the health of Massachusetts and other Department of Public Health data:
Register for the Department’s free, Internet-based public health information service,
MassCHIP, via the website at:
http://masschip.state.ma.us
Or call 888-MAS-CHIP (toll free in MA) or 617-624-5629
3
TABLE OF CONTENTS
NOTE TO READERS.................................................................................................... 15 INTRODUCTION........................................................................................................... 17
Goals for holding Regional Dialogues ....................................................................... 19 Goals of New DPH Leadership ................................................................................. 19 Timetable .................................................................................................................. 20
SOCIODEMOGRAPHIC INDICATORS ........................................................................ 21 Executive Office of health and Human Services Regions ......................................... 23 Massachusetts Counties & EOHHS Region.............................................................. 23 Comments about the Limitations of this presentation................................................ 24 2005 Population in Communities, Western Region: 2005 ......................................... 24 Race and Ethnic Breakdown of Population, Western Region and Massachusetts: 2005 .......................................................................................................................... 25 Race and Ethnic Breakdown of Population, Western Region and Massachusetts: 2005 ....................................................................................................................................................................25 Population by Age Group, Western Region and Massachusetts: 2005..................... 26 Population by Age Group, Western Region and Massachusetts: 2005..................... 26 Population by Age Group, Western Region and Massachusetts: 2005..................... 27 Language Spoken at Home, Western Region and Massachusetts: 2000 ................. 27 Language Spoken at Home, Largest Cities, Western Region and Massachusetts: 2000 .......................................................................................................................... 28 Language Spoken at Home, Western Region and Massachusetts: 2000 ................. 28 Highest and Lowest per Capita Income by Communities, Berkshires: 2000 ............. 29 Spanish Spoken at Home, Western Region: 2000 .................................................... 29 Socio-Demographic Indicators Western Region and Massachusetts: 2000.............. 30 Socio-Demographic Indicators Largest Cities, Western Region and Massachusetts 30 Highest and Lowest per Capita Income by Communities, Western Region: 2000 .... 31
HEALTH CARE ACCESS............................................................................................. 33
Adults who Have No Health Insurance by EOHHS Region, Massachusetts: 2005 ... 35 Adults who Have No Health Insurance by Race and Ethnicity, Western Region and Massachusetts: 2005 ................................................................................................ 35 Health Insurance Access, Western Region and Massachusetts: 2005 ..................... 36 Summary Indicators for Health Insurance by EOHHS Regions, Massachusetts: 2005 .......................................................................................................................... 36
BIRTH INDICATORS.................................................................................................... 37
Infant Mortality Rate (IMR) Western Region and Massachusetts: 1990-2005........... 39 Infant Mortality Rate by EOHHS Region and Massachusetts: 2002-2005 .......................39 Infant Mortality Rates by Race/Ethnicity, Western Region and Massachusetts: 2002-2005 ....................................................................................................................................................................40 Highest Infant Mortality Rates Among the 30 Largest Communities, Massachusetts: 2005 .......................................................................................................................... 40
4
Infant Mortality Rate (IMR) Springfield: 1990-2005......................................................................41 Highest Infant Mortality Rate Among the 30 Largest Communities, Massachusetts 2003-2005 ................................................................................................................. 41 Infant Mortality Rates by Race/Ethnicity, Largest Cities in Western Region and Massachusetts: 2002-2005 .....................................................................................................................42 Low Birthweight, Western Region and Massachusetts: 1990-2005 .......................... 42 Low Birthweight by EOHHS Region, Massachusetts: 2005 ...................................... 43 Low Birthweight by Race and Ethnicity, Western Region and Massachusetts: 2005 43 Percent of Mothers Breastfeeding Western Region, Massachusetts: 1990-2005 ..... 44 Breastfeeding by EOHHS Region, Massachusetts: 2005.......................................... 44 Breastfeeding by EOHHS Region Largest Cities in Western Region, Massachusetts: 2005 .......................................................................................................................... 45 Breastfeeding by EOHHS Region Largest Cities in Western Region, Massachusetts: 2005 .......................................................................................................................... 45 Breastfeeding by Race and Ethnicity, Western Region and Massachusetts: 2005 ... 46 Teen Birth Rates, Western Region and Massachusetts: 1990-2005......................... 46 Teen Birth Rates by EOHHS Region, Massachusetts: 2005..................................... 47 Teen Birth Rates by EOHHS Region, Massachusetts: 2005..................................... 47 Teen Birth Rates by City/Town, Western Region: 2005 ............................................ 48 Teen Birth Rates by Race/Ethnicity, Western Region and Massachusetts: 2005 ..... 48 Teen Birth Rates by Race/Ethnicity, Berkshires and Massachusetts: 2005 .............. 49 Adequate Prenatal Care Western Region, Massachusetts: 1990-2005 .................... 49 Adequate Prenatal Care by EOHHS Regions, Massachusetts: 2005 ....................... 50 Public Source of Payment for Prenatal Care, Western Region and Massachusetts: 1990- 2005 ................................................................................................................ 50 Public Source of Payment for Prenatal Care, Western and Massachusetts: 2005.... 51 Infants Delivered by C-Section, Western Region and Massachusetts: 1990-2005 ... 51 Infants Delivered by C-Section by EOHHS Regions, Massachusetts: 2005.............. 52 Infants Delivered by C-Section by EOHHS Regions, Massachusetts: 2005.............. 52 Summary of Birth Indicators by EOHHS Regions, Massachusetts: 2005.................. 53 Summary of Birth Indicators by Community, in Western Region, Massachusetts: 2005 .......................................................................................................................... 53 Summary of Birth Indicators by EOHHS Regions ..................................................... 54 Summary of Birth Indicators by EOHHS Regions ..................................................... 54
LEADING CAUSES OF DEATH................................................................................... 55
Leading Causes of Death, Western Region and Massachusetts: 2005 .................... 57 Leading Causes of Death, Berkshires and Massachusetts: 2005 ............................. 57
CHRONIC DISEASE OUTCOMES AND OVERWEIGHT/OBESITY ............................ 59
Thresholds for Defining Overweight and Obesity ...................................................... 61 Adults who are Overweight by EOHHS Region, Massachusetts: 1995 & 2005......... 61 Adults who are Obese by EOHHS Region, Massachusetts: 1995 & 2005 ................ 62 Adults who are Obese by EOHHS Region, Massachusetts : 2005 ........................... 62 Adult Obesity by Race and Ethnicity, Western Region and Massachusetts: 2005 .... 63
5
Adults who Participate in Regular Physical Activity by EOHHS Region, Massachusetts: 2005 ................................................................................................ 63 Adults who have 5+ Servings of Fruit or Vegetables by EOHHS Region, Massachusetts: 2005 ................................................................................................ 64 Adults who had their Cholesterol Checked in Past 5 Years by EOHHS Region, Massachusetts: 2005 ................................................................................................ 64 Adults who were Told by Health Care Provider that they had High Cholesterol, by EOHHS Region, Massachusetts: 2005 ..................................................................... 65 Adults who were Told by a Health Care Provider they have High Blood Pressure, by EOHHS Region, Massachusetts: 2005 ..................................................................... 65 Adults who take Medicine for High Blood Pressure, by EOHHS Region, Massachusetts : 2005 ............................................................................................... 66 Hypertension Hospital Discharges by EOHHS Region, Massachusetts: 2003-3005. 66 Hypertension Hospital Discharge Rates by Race/Ethnicity, Western Region, Massachusetts: 2003-2005 ....................................................................................... 67 Heart Disease Mortality Rates by EOHHS Region, Massachusetts: 2003-2005 ....... 67 Heart Disease Death Rates by Race/Ethnicity, Western Region and Massachusetts : 2003-2005 ................................................................................................................. 68 Diabetes Hospital Discharge Rates by EOHHS Region, Massachusetts: 2003-200568 Diabetes Hospital Discharge Rates by EOHHS and Berkshires, and Pittsfield Massachusetts: 2003-2005 ....................................................................................... 69 Diabetes Hospital Discharge Rates Largest Cities, Western Region: 2003-2005 ..... 69 Diabetes Hospital Discharge Rates by Race/Ethnicity, Western Region, Massachusetts: 2003-2005 ..................................................................................... 70 Diabetes Hospital Discharge Rates by Race/Ethnicity, Berkshires, Pittsfield, & Massachusetts: 2003-2005 ....................................................................................... 70 Diabetes Mortality Rates by EOHHS Region, Massachusetts: 2003-2005................ 71 Diabetes Death Rates by Race/Ethnicity, Western Region and Massachusetts : 2003- 2005 .......................................................................................................................... 71 Summary Indicators for Overweight/Obesity, by EOHHS Regions, Massachusetts : 2005 .......................................................................................................................... 72 Summary Indicators for Chronic Disease Outcomes for Overweight/Obesity by EOHHS Regions ....................................................................................................... 72 Summary Indicators for Chronic Disease Outcomes for Overweight/Obesity, Communities in Western Region: 2003-2005............................................................ 73 Summary Indicators for Chronic Disease Outcomes for Overweight/Obesity For Berkshires, Western Region, Massachusetts 2003-2005.......................................... 73
CANCER....................................................................................................................... 75
Adults Ages 50+ who have had a Sigmoidoscopy or Colonoscopy in Past 5 Years by EOHHS Regions, Massachusetts: 2005.................................................................... 77 Incidence Rates for Invasive Colorectal Cancer by EOHHS Region, Massachusetts: 1990-2003 ................................................................................................................. 77 Incidence Rates for Early Stage Colorectal Cancer, Males, by EOHHS Region, Massachusetts: 1999-2003 ....................................................................................... 78
6
Incidence Rates for Early Stage Colorectal Cancer, Females, by EOHHS Region, Massachusetts: 1999-2003 ....................................................................................... 78 Colorectal Cancer Mortality Rates by EOHHS Region, Massachusetts: 2005 .......... 79 Men Ages 50+ who had a Prostate-Specific Antigen Test in the Past 2 years by EOHHS Region, Massachusetts: 2004 ..................................................................... 79 Men Ages 50+ who had a Digital Rectal Exam in the Past Two Years by EOHHS Region, Massachusetts: 2004 ................................................................................... 80 Adults Ages 50+ who had a Blood Stool Test in the Past Two Years by EOHHS Region, Massachusetts: 2005 ................................................................................... 80 Incidence Rates for Invasive Prostate Cancer by EOHHS Region, Massachusetts: 1999- 2003 ................................................................................................................ 81 Incidence Rates for Early Stage Prostate Cancer by EOHHS Region, Massachusetts: 1999-2003 ................................................................................................................. 81 Prostate Cancer Mortality Rates by EOHHS Region, Massachusetts: 2005............. 82 Women Ages 40+ who had a Clinical Breast Exam in the Past Two Years by EOHHS Region, Massachusetts: 2004 ................................................................................... 82 Women who had a Clinical Breast Exam in the Past Two Years by Race and Ethnicity, Western Region and Massachusetts : 2004 .............................................. 83 Women Ages 40+ who have had a Mammography in Past 2 Years by EOHHS Region, Massachusetts: 2005 ................................................................................... 83 Incidence Rates for Invasive Female Breast Cancer by EOHHS Region, Massachusetts: 1999-2003 ....................................................................................... 84 Incidence Rates for Early Stage Female Breast Cancer by EOHHS Region, Massachusetts : 1999-2003 ...................................................................................... 84 Female Breast Cancer Mortality Rates by EOHHS Region, Massachusetts : 2005 .. 85 Adults who Currently Smoke by EOHHS Regions and Massachusetts: 2005........... 85 Adults who Currently Smoke by EOHHS Regions and Berkshires, Massachusetts: 2005 .......................................................................................................................... 86 Current Smoker by Race and Ethnicity, Western Region and Massachusetts: 2005 86 Percent of Mothers Smoking During Pregnancy for Largest Communities, Western Region: 2005............................................................................................................. 87 Smoking During Pregnancy, Western Region and Massachusetts: 1990-2005 ........ 87 Smoking During Pregnancy by Race and Ethnicity, Berkshires, Western Region and Massachusetts: 2005 ............................................................................................... 88 Incidence Rates for Early Stage Lung Cancer, Males, by EOHHS Region, Massachusetts : 1999-2003 ...................................................................................... 88 Incidence Rates for Early Stage Lung Cancer, Females, by EOHHS Region, Massachusetts: 1999-2003 ....................................................................................... 89 Lung Cancer Mortality Rates by EOHHS Region, Massachusetts : 2005 ................. 89 Incidence Rates for Invasive Lung Cancer by EOHHS Region, Massachusetts: 1999-2003 .......................................................................................................................... 90 Summary Indicators for Cancer Screening by EOHHS Regions, Massachusetts: 2005 .......................................................................................................................... 90 Summary Cancer Indicators (Early Stage) by EOHHS Regions, Massachusetts: 1999- 2003 ................................................................................................................ 91
7
Summary Cancer Indicators (Late Stage) by EOHHS Regions, Massachusetts: 1999- 2003 .......................................................................................................................... 91 Summary Invasive Cancer Incidence Rates by EOHHS Regions, Massachusetts: 1999 - 2003 ............................................................................................................... 92 Summary Invasive Cancer Incidence Rates, Communities In Western Region: 1999 - 2003 .......................................................................................................................... 92 Summary Invasive Cancer Incidence Rates, Western Region, Massachusetts: 1999 - 2003 ....................................................................................................................................................................93 Summary Cancer Mortality Indicators by EOHHS Regions, Massachusetts: 2005 ... 93 Summary Cancer Mortality Rates, Communities in the Western Region .................. 94 Summary Cancer Mortality Rates, Berkshires, Western Region, Massachusetts: 1999 - 2003 .....................................................................................................................................................94
SUBSTANCE ABUSE .................................................................................................. 95 Alcohol Use in Past Month, Persons Aged 12 to 20 Years, by EOHHS Region, Massachusetts : 2002-2004 ...................................................................................... 97 Binge Drinking in Past Month, Persons Aged 12 to 20 Years, by EOHHS Region, Massachusetts : 2002-2004 ...................................................................................... 97 Any Illicit Drug Use in Past Month, Persons Aged 12+ Years, by EOHHS Region, Massachusetts: 2002-2004 ....................................................................................... 98 Any Illicit Drug Use Other Than Marijuana use in Past Month, Persons Aged 12+ Years, by EOHHS Region, Massachusetts: 2002-2004 ............................................ 98 Alcohol Dependence or Abuse in Past Year, Persons Aged 12+ Years, by EOHHS Region, Massachusetts : 2002-2004......................................................................... 99 Dependence or Abuse of Any Illicit Drug or Alcohol in Past Year, Persons Aged 12+ Years by EOHHS Region, Massachusetts : 2002-2004 ........................................... 99 Adults who Binge Drink, by EOHHS Region, Massachusetts : 2005....................... 100 Adults who Used Illicit Drugs in Past Month by EOHHS Region, Massachusetts : 2005 ........................................................................................................................ 100 Substance Abuse Treatment Program Admissions by EOHHS Region, Massachusetts : 2005 ............................................................................................ 101 Substance Abuse Treatment Program Admissions, Alcohol Primary Substance, by Largest Cities, Western Region : 2005.................................................................... 101 Substance Abuse Treatment Program Admissions, Alcohol Primary Substance, by EOHHS Region, Massachusetts : 2005 .................................................................. 102 Substance Abuse Treatment Program Admissions, Alcohol Primary Substance, by Race and Ethnicity, Berkshires and Massachusetts : 2005..................................... 102 Substance Abuse Treatment Program Admissions, Cocaine Primary Substance, by EOHHS Region, Massachusetts : 2005 .................................................................. 103 Substance Abuse Treatment Program Admissions, Heroin Primary Substance, by EOHHS Region, Massachusetts : 2005 .................................................................. 103 Substance Abuse Treatment Program Admissions, Heroin Primary Substance, by EOHHS Region and Berkshires, Massachusetts : 2005 ........................................................104 Opioid-related Emergency Visit Rates by EOHHS Region, Massachusetts : 2003-2005 ........................................................................................................................ 104
8
Opioid-related Emergency Visit Rates by Largest Cities in Western Region, Massachusetts : 2003-2005 .................................................................................... 105 Opioid-related Emergency Visit Rates by Race and Ethnicity Western Region, Massachusetts : 2003-2005 .................................................................................... 105 Massachusetts City and Town FY03-05, Total Number of Opioid Overdose Related Deaths..................................................................................................................... 106 Massachusetts City and Town FY03-05, Total Number of Opioid Overdose Related Deaths..................................................................................................................... 106 Opioid-Related Fatal Overdoses by EOHHS Region, Massachusetts : 2003-2005 107 Opioid-Related Fatal Overdoses by Race/Ethnicity, Western Region and Massachusetts : 2003-2005 .................................................................................... 107 Massachusetts City and Town FY03-05, Total Number of Poly-Drug Overdose related Deaths..................................................................................................................... 108 Massachusetts City and Town FY03-05, Total Number of Poly-Drug Overdose related Deaths..................................................................................................................... 108 Summary Substance Abuse Indicators Percentages by EOHHS Regions.............. 109 Summary Substance Abuse Indicators by EOHHS Region, Massachusetts: 2005. 109 Summary Substance Abuse Indicators Communities in the Western Region:2005 110 Summary Substance Abuse Indicators Berkshires, Western Region, and Massachusetts: 2005 .............................................................................................. 110 Summary Opioid Indicators by EOHHS Regions, Massachusetts: 2003-2005........ 111 Summary Opioid Indicators, Communities in Western Region, Massachusetts: 2003-2005 ........................................................................................................................ 111
INJURY, VIOLENCE AND OCCUPATIONAL HEALTH............................................. 113
Causes of Injury Deaths, Western Region and Massachusetts: 2005..................... 115 Injury-Related Hospital Discharge Rates by EOHHS Region, Massachusetts: 2003-2005 ........................................................................................................................ 115 Injury-Related Hospital Discharge Rates by Race and Ethnicity, Western Region and Massachusetts: 2003-2005 ..................................................................................... 116 Emergency Department Visit Rates for Injuries and Poisonings by EOHHS Region, Massachusetts : 2003-2005 .................................................................................... 116 Emergency Department Visit Rates for Injuries & Poisonings by Race/Ethnicity, Western Region and Massachusetts : 2003-2005................................................... 117 Hospital Discharge Rates for Traumatic Brain Injuries by EOHHS Region, Massachusetts : 2003-2005 .................................................................................... 117 Hospital Discharge Rates for Traumatic Brain Injury by Race/Ethnicity, Western Region and Massachusetts : 2003-2005................................................................. 118 Emergency Department Visit Rates for Traumatic Brain Injury, by EOHHS Region, Massachusetts : 2003-2005 .................................................................................... 118 Emergency Department Visit Rates for Traumatic Brain Injury by Race/Ethnicity, Western Region and Massachusetts : 2003-2005................................................... 119 Injury Death Rates by EOHHS Region, Massachusetts: 2003-2005....................... 119 Injury Death Rates by Race/Ethnicity, Western Region and Massachusetts: 2003-2005 ........................................................................................................................ 120 Homicide Rates by EOHHS Region, Massachusetts : 2003-2005 .......................... 120
9
Homicide Rates by Race and Ethnicity, Western Region and Massachusetts: 2003-2005 ........................................................................................................................ 121 Hospital Discharge Rates for Self-Inflicted Injury, by EOHHS Region, Massachusetts : 2003-2005 .................................................................................... 121 Hospital Discharge Rates for Self-Inflicted Injury, by EOHHS Region, Massachusetts : 2003-2005 .................................................................................................................122 Hospital Discharge Rates for Self-Inflicted Injuries by Race/Ethnicity, Western Region and Massachusetts: 2003-2005 .............................................................................. 122 Suicide by EOHHS Region, Massachusetts: 2003-2005......................................... 123 Suicide Rates by Race and Ethnicity, Western Region and Massachusetts: 2003-2005 ........................................................................................................................ 123 Hospital Discharge Rates for Motor Vehicle-Related Injuries by EOHHS Region and Massachusetts : 2003-2005 .................................................................................... 124 Hospital Discharge Rates for Motor Vehicle-Related Injuries by EOHHS Region, Berkshires, and Pittsfield, Massachusetts : 2003-2005........................................... 124 Hospital Discharge Rates for Motor Vehicle-Related Injuries by Largest Cities in Western Region, Massachusetts : 2003-2005......................................................... 125 Hospital Discharge Rates for Motor Vehicle-Related Injuries by Race/Ethnicity, Western Region and Massachusetts: 2003-2005.................................................... 125 Motor Vehicle-Related Mortality Rates by EOHHS Region, Massachusetts : 2003-2005 ........................................................................................................................ 126 Hospital Discharge Rates for Motor Vehicle-Related Injuries by Race/Ethnicity, Western Region, Berkshires and Massachusetts: 2003-2005................................. 126 Emergency Department Visit Rates for Firearm Injuries, by EOHHS Region, Massachusetts: 2003-2005 ..................................................................................... 127 Emergency Department Visit Rates for Firearm Injuries, Largest Cities in Western Region, Massachusetts: 2003-2005........................................................................ 127 Emergency Department Visit Rates for Firearm Injuries by Race/Ethnicity, Western Region and Massachusetts: 2003-2005.................................................................. 128 Firearm Death Rates by EOHHS Region, Massachusetts: 2003-2005 ................... 128 Firearm Death Rates by Race/Ethnicity, Western Region and Massachusetts: 2003-2005 ........................................................................................................................ 129 Hospital Discharge Rates for Fall-Related Injuries, by EOHHS Region, Massachusetts : 2003-2005 .................................................................................... 129 Hospital Discharge Rates for Fall-Related Injuries by Race/Ethnicity, Western Region and Massachusetts : 2005 ...................................................................................... 130 Emergency Department Visit Rates for Fall-Related Injuries, by EOHHS Region, Massachusetts : 2003-2005 .................................................................................... 130 Emergency Department Visit Rates for Fall-Related Injuries by Race/Ethnicity, Western Region and Massachusetts : 2003-2005................................................... 131 Fall-Related Injury Death Rates by EOHHS Region, Massachusetts : 2003-2005.. 131 Fall-Related Injury Death Rates by Race/Ethnicity, Western Region and Massachusetts : 2003-2005 .................................................................................... 132 Fall-related Injury Death Rates, Persons 65+ years, by EOHHS Region, Massachusetts : 2003-2005 .................................................................................... 132
10
Hospital Discharge Rates for Assaults, by EOHHS Region, Massachusetts: 2003-2005 ........................................................................................................................ 133 Hospital Discharge Rates for Assaults by Race/Ethnicity, Western Region and Massachusetts: 2003-2005 ..................................................................................... 133 Work-related Injuries, Emergency Department Visits per 100 Full Time Equivalents, Massachusetts Counties: 2004-2005 ...................................................................... 134 Work-related Injuries among Teens, Emergency Department Visits per 100 Full Time Equivalents, Massachusetts Counties: 2004-2005.................................................. 134 Work-related Burn Injuries, Emergency Department Visits per 10,000 Full Time Equivalents, Massachusetts Counties: 2004-2005.................................................. 135 Work-related Amputations, Emergency Department Visits per 10,000 Full Time Equivalents, Massachusetts: 2004-2005................................................................. 135 Work-related Injuries, Hospitalizations per 10,000 Full Time Equivalents, Massachusetts Counties: 2004-2005 ...................................................................... 136 Number and Rate of Fatal Occupational Injuries by year, Massachusetts: 1991- 2005 ........................................................................................................................ 136 Summary Injury/Violence Hospitalization Indicators by EOHHS Regions, Massachusetts : 2003-2005 .................................................................................... 137 Summary Injury/Violence Hospitalization Indicators, Communities in Western Region: 2003-2005 ............................................................................................................... 137 Summary Injury/Violence Hospitalization Indicators Berkshires, Western Region and Massachusetts : 2003-2005 .................................................................................... 138 Summary Injury/Violence Emergency Department Indicators by Communities in Western Region: 2003-2005 ................................................................................... 138 Summary Injury/Violence Emergency Department Indicators Communities in Western Region: 2003-2005.................................................................................................. 139 Summary Injury/Violence Emergency Department Indicators Berkshires, Western Region and Massachusetts : 2003-2005................................................................. 139 Summary Injury/Violence Mortality Rates by EOHHS Regions, Massachusetts : 2003-2005 ........................................................................................................................ 140 Summary Injury/Violence Mortality Indicators Communities in Western Region: 2003-2005 ........................................................................................................................ 140 Summary Injury/Violence Mortality Indicators Berkshires, Western Region and Massachusetts : 2003-2005 .................................................................................... 141
HIV/AIDS..................................................................................................................... 143
Persons Living with HIV, by EOHHS Region, Massachusetts: 2005....................... 145 HIV Incidence, by EOHHS Region, Massachusetts: 2005 ...................................... 145 AIDS Incidence, by EOHHS Region, Massachusetts: 2005 .................................... 146 Persons Living with AIDS, by EOHHS Region, Massachusetts : 2005 ................... 146 HIV/AIDS Death Rates, by EOHHS Region, Massachusetts : 2003-2005 .............. 147 HIV/AIDS Death Rates by Largest Communities Western Region: 2003 - 2005..... 147 HIV/AIDS Death Rates by Race and Ethnicity, Western Region and Massachusetts: 2003 - 2005 ............................................................................................................. 148 Summary HIV/AIDS Indicators by EOHHS Regions ............................................... 148 Summary HIV/AIDS Indicators Communities in Western Region............................ 149
11
Summary HIV/AIDS Indicators Communities in Western Region............................ 149 INFECTIOUS DISEASES ........................................................................................... 151
Chlamydia Incidence, Western Region and Massachusetts : 1989-2005................ 153 Chlamydia Incidence by EOHHS Region, Massachusetts: 2005 ............................ 153 Chlamydia Incidence Rate by Emergency Preparation Region, 2006..................... 154 Gonorrhea Incidence by EOHHS Region, Massachusetts : 2005 ........................... 154 Syphilis Incidence, Western Region and Massachusetts : 1989-2005 .................... 155 Syphilis Incidence, by EOHHS Region, Massachusetts : 2005 ............................... 155 Tuberculosis Incidence, by EOHHS Region, Massachusetts : 2004 ....................... 156 Tuberculosis Incidence, by EOHHS Region, Massachusetts : 2006 ....................... 156 Confirmed Tuberculosis Cases by Race/Ethnicity and EOHHS Region, Massachusetts: 2006 .............................................................................................. 157 Percent Confirmed Tuberculosis Cases by EOHHS Region, Massachusetts : 2006157 Percent of Confirmed Tuberculosis Cases by Race/Ethnicity and EOHHS Region, Massachusetts : 2006 ............................................................................................. 158 Tuberculosis Cases by EOHHS Region, Massachusetts : 1993-2006 .................... 158 Percent of Confirmed Tuberculosis Cases by Race/Ethnicity and EOHHS Region, Massachusetts : 2006 ............................................................................................. 159 Hepatitis C Average Incidence Rates, by EOHHS Region, Massachusetts: 1992- 2006 ........................................................................................................................ 159 Massachusetts Hepatitis C Infection Average per Year, by Town, 1992-2006........ 160 Hepatitis C Incidence Rates, by EOHHS Region, Massachusetts : 2006................ 160 Massachusetts Hepatitis C Infection Average per Year, by Town, 2006................. 161 Lyme Disease Incidence by EOHHS Region and Massachusetts: 2004................. 161 Massachusetts Lyme Disease Case Rates, by Town, 2005.................................... 162 Pneumonia and Influenza Hospital Discharges by EOHHS Region, Massachusetts: 2005 ........................................................................................................................ 162 Summary Infectious Disease Indicators, by EOHHS Regions................................. 163 Summary Infectious Disease Indicators Communities in Western Region .............. 163 Summary Infectious Disease Indicators Communities in Western Region .............. 164
ASTHMA..................................................................................................................... 165
Asthma Hospital Discharges by EOHHS Region, Massachusetts: 2005................. 167 Asthma Emergency Department Visits, by EOHHS Region, Massachusetts: 2005 167 Emergency Department Visit Rates for Asthma by Race/Ethnicity, Western Region and Massachusetts: 2005 ....................................................................................... 168 Adults who Currently have Asthma by EOHHS Region, Massachusetts: 2005....... 168 Asthma ER Visits, Children Ages 0-4, by EOHHS Region, Massachusetts : 2005 . 169 Asthma ER Visits, Children Ages 5-9, by EOHHS Region, Massachusetts : 2005 . 169 Asthma ER Visits, Children Ages 10-14, by EOHHS Region, Massachusetts : 2005 ........................................................................................................................ 170 Asthma ER Visits, Children Ages 0-14, by EOHHS Region, Massachusetts : 2005 170 Asthma ER Visits, Children Ages 0-14, by EOHHS Region, Massachusetts : 2005 171 Asthma ER Visits, Children Ages 0-14, Largest Cities, Western Region: 2005....... 171
12
Asthma Emergency Department Visit Rates, Children ages 0-14, Western Region and Massachusetts : 2005 ...................................................................................... 172 Asthma Emergency Department Visit Rates, Children ages 0-14, Berkshires and Massachusetts : 2005 .............................................................................................................................173 Pediatric Asthma Prevalence by EOHHS Region, Massachusetts : 2005-2006...... 173 Pediatric (Ages <5) Asthma ER Visit Rates by Community, Massachusetts : 2005-2006 ........................................................................................................................ 174 Pediatric (Ages <5) Asthma ER Visit Rates by Community, Western Region, Massachusetts : 2005-2006 .................................................................................... 174 Pediatric (Ages <5) Asthma Hospitalization Rates by Community, Western Region, Massachusetts : 2005-2006 .................................................................................................................175 Summary Asthma Indicators, by EOHHS Regions, Massachusetts : 2005............. 175 Summary Asthma Indicators, Communities in Western Region : 2005 ................... 176 Summary Asthma Indicators, Communities in Western Region : 2005 ................... 176 Summary Asthma Indicators, by EOHHS Regions, Massachusetts : 2005............. 177
OTHER HEALTH INDICATORS................................................................................. 179 Total Cases of Elevated Blood Lead Levels (>=15 µG/DL), by EOHHS Region, Massachusetts: 2005 .............................................................................................. 181 Lead Poisoning Prevalence Rates (BLL≥ 25 µG/DL), Children 9-48 Months, by EOHHS Region, Massachusetts: 2006 ................................................................................. 181 Adults who Report Experiencing Intimate Partner Violence by Gender and EOHHS Region, Massachusetts: 2005 ................................................................................. 182 Adults who Report Having a Disability by EOHHS Region, Massachusetts : 2005 . 182 Adults who Report Having a Disability and needing help with activities, by EOHHS Region, Massachusetts : 2005 ................................................................................ 183 Adults with Fair or Poor Health, by EOHHS Region, Massachusetts : 2005 ........... 183 Adults who Reported Fair or Poor Health by Race and Ethnicity, Western Region and Massachusetts : 2005 ............................................................................................. 184 Adults who Reported Fair or Poor Health by Race and Ethnicity, Western Region and Massachusetts : 1999-2005 .................................................................................................................184 Adults who Visited a Dentist in Past Year, by EOHHS Region, Massachusetts : 2004 ........................................................................................................................ 185 Adults who have lost 6 or More Teeth to Decay or Disease, by EOHHS Region, Massachusetts : 2004 ............................................................................................. 185 Adults with Poor Mental Health for 15+ Days in Past Month, by EOHHS Region, Massachusetts : 2005 ............................................................................................. 186 Summary Other Health Indicators, by EOHHS Regions.......................................... 186 Summary Other Health Indicators, by EOHHS Regions.......................................... 187 Refugee Arrivals Western Region, Massachusetts: 2002-2006 .............................. 187 Refugee Health Concern Western Region, Massachusetts: 2002-2006 ................. 188 Summary Refugees by EOHHS Regions, Massachusetts : 2002-2006 .................. 188 Premature Mortality Rate (PMR) ............................................................................. 189 Premature Mortality Rates (PMR) by Region, Massachusetts : 2005 ..................... 189 PMR –Western Region by City/Town, Massachusetts : 2005 ................................. 190 Median Household Income and PMR by EOHHS Region, Massachusetts: 2005 ... 190
13
Premature Mortality Rate (PMR) by EOHHS Regions: 2005................................... 191
SUMMARY.................................................................................................................. 193 Summary – Berkshires ............................................................................................ 195 Summary – Berkshires (Continued) ........................................................................ 195 Selected Health Disparities by Race/Ethnicity, Berkshires...................................... 196 Summary – Western Region ................................................................................... 196 Summary – Western Region (Continued)................................................................ 197 Selected Health Disparities by Race/Ethnicity, Western Region........................................197
APPENDIX.................................................................................................................. 199 Regions and Towns ................................................................................................ 201 Data Sources .......................................................................................................... 207

14
15
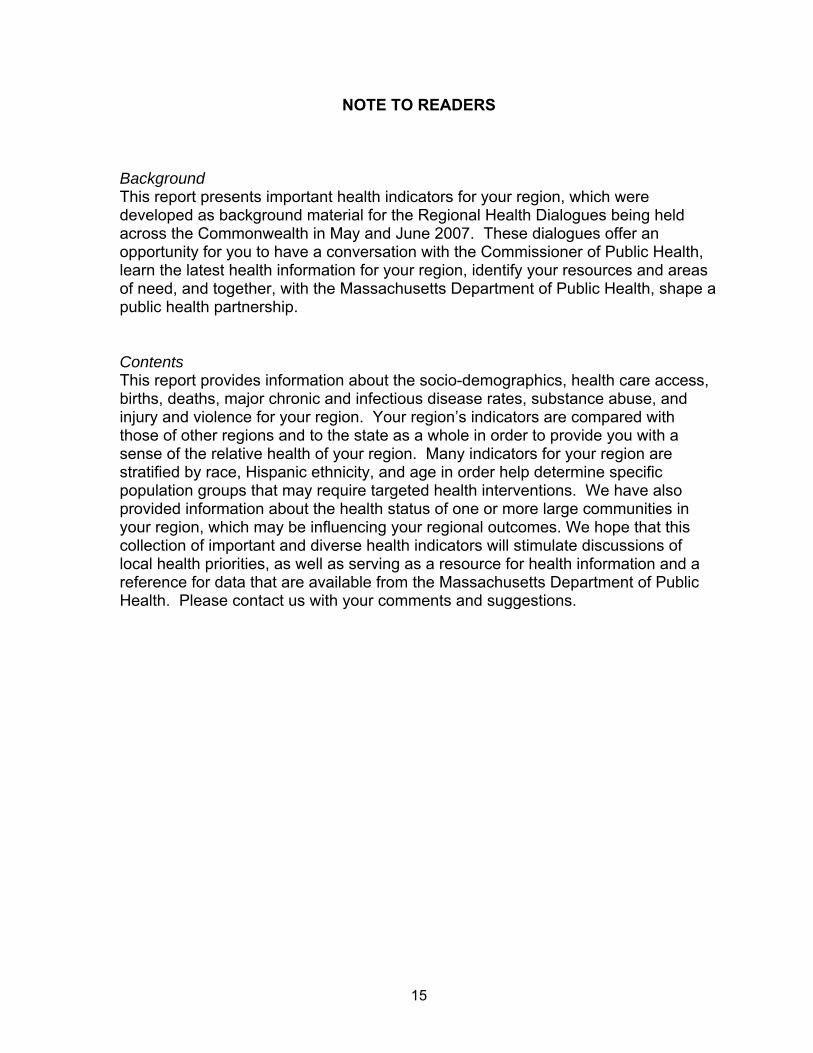
NOTE TO READERS
Background This report presents important health indicators for your region, which were developed as background material for the Regional Health Dialogues being held across the Commonwealth in May and June 2007. These dialogues offer an opportunity for you to have a conversation with the Commissioner of Public Health, learn the latest health information for your region, identify your resources and areas of need, and together, with the Massachusetts Department of Public Health, shape a public health partnership. Contents This report provides information about the socio-demographics, health care access, births, deaths, major chronic and infectious disease rates, substance abuse, and injury and violence for your region. Your region’s indicators are compared with those of other regions and to the state as a whole in order to provide you with a sense of the relative health of your region. Many indicators for your region are stratified by race, Hispanic ethnicity, and age in order help determine specific population groups that may require targeted health interventions. We have also provided information about the health status of one or more large communities in your region, which may be influencing your regional outcomes. We hope that this collection of important and diverse health indicators will stimulate discussions of local health priorities, as well as serving as a resource for health information and a reference for data that are available from the Massachusetts Department of Public Health. Please contact us with your comments and suggestions.

16

17
INTRODUCTION

18
19
Goals for holding Regional Dialogues
• Introduce new DPH leadership
• Present latest health data on your particular region
• Talk with residents and providers about data and identify areas of need
• Gather feedback to inform process of setting DPH priorities
Goals of New DPH leadership
• Use data and community input to set new priorities & reshape the Department
• Rely on science and evidence-based process to guide the work
• Strengthen ties with and support for local health and local agencies
• Increase resources to and visibility of public health in Massachusetts
20
Timetable
• Hold 8 regional dialogues with comprehensive data review and identification of key health concerns (by July)
• Identify short list of top priorities by end of August
• Hold second round of community dialogues to discuss action plans/results by end of calendar year
21
SOCIODEMOGRAPHIC INDICATORS

22
23
1
WesternRegion Central
Region
SoutheastRegion
Metro WestRegion
NortheastRegion
BostonRegion
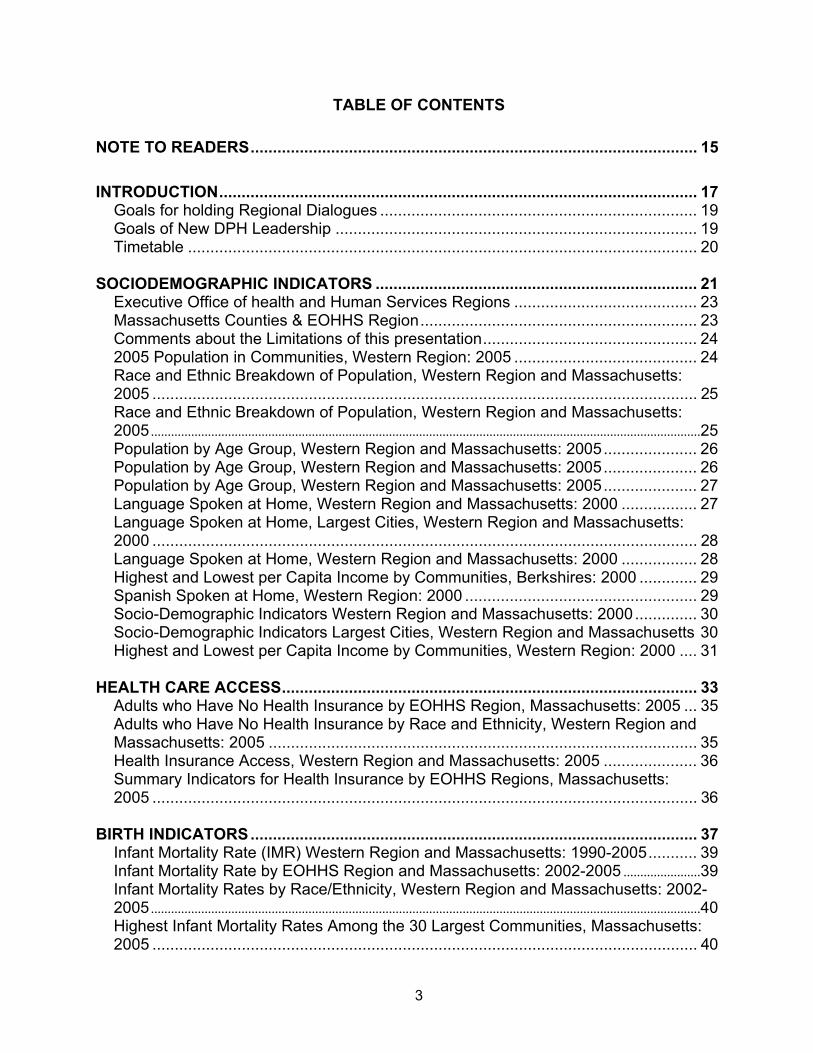
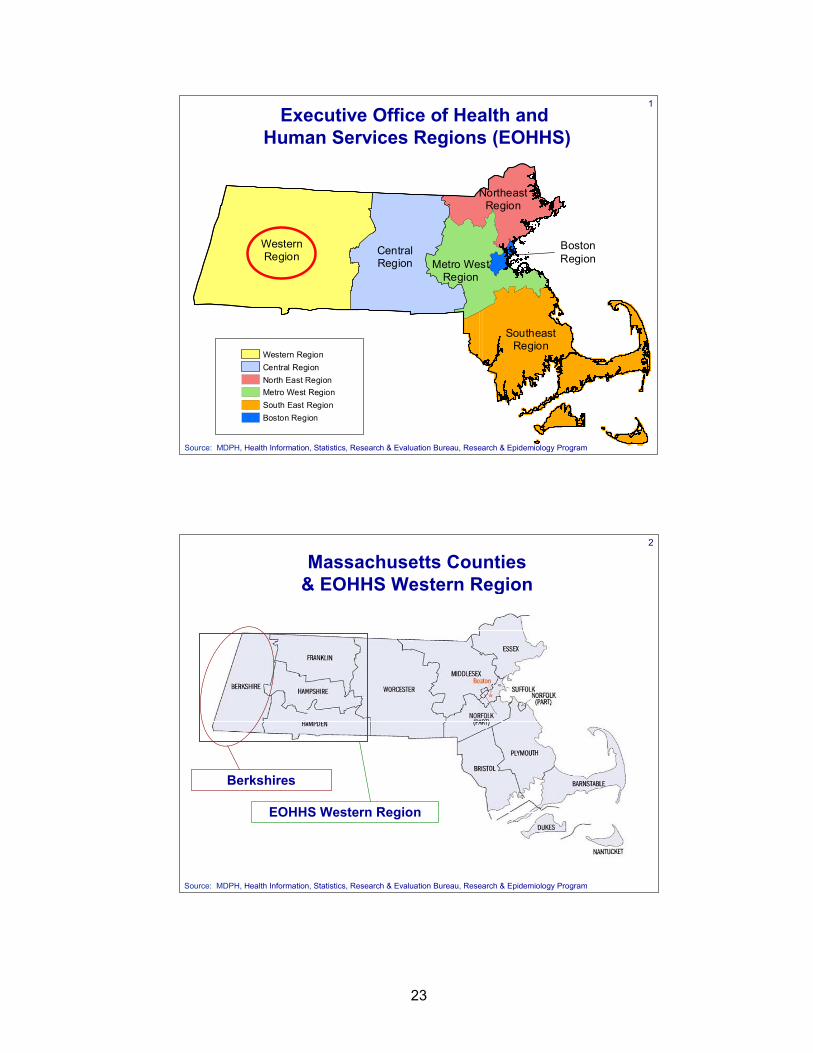
Executive Office of Healthand Human Services Regions
Western RegionCentral RegionNorth East RegionMetro West RegionSouth East RegionBoston Region
Source: MDPH, Health Information, Statistics, Research & Evaluation Bureau, Research & Epidemiology Program
Executive Office of Health and Human Services Regions (EOHHS)
2
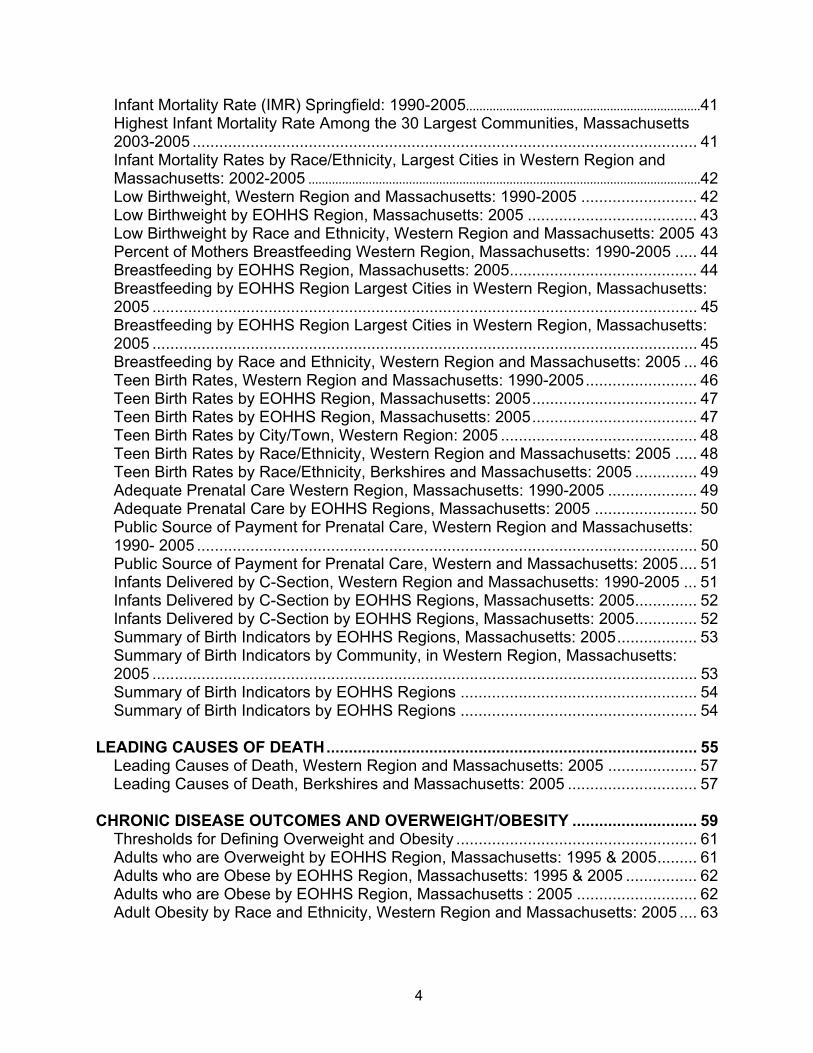
Source: MDPH, Health Information, Statistics, Research & Evaluation Bureau, Research & Epidemiology Program
Massachusetts Counties& EOHHS Western Region
EOHHS Western Region
Berkshires
24
3
A few comments about the limitations of this presentation
• A regional analysis has its drawbacks
• Variability within a region – urban vs. rural/suburban (i.e. Berkshires vs. the rest of the region)
• Variability by sub-population – race matters, poverty matters
• Our data don’t reflect all the important health indicators
4
OTIS
LEE
WAREBECKET
PETERSHAM
SAVOY
MONSON
COLRAIN
PERU
SHEFFIELD
BLANDFORD
CONWAY
ORANGE
ASHFIELD
SANDISFIELD
CHESTER
ROWE
WARWICK
GRANVILLE
HEATH
HAWLEY
WINDSOR
TOLLAND
ROYALSTON
GILL
WENDELL
GRANBY
PELHAM
ADAMS
LENOX
HADLEY
FLORIDA
WASHINGTON
MONTAGUE
CHESHIRE
SOUTHWICK
MONTEREY
LEYDEN
WHATELYGOSHEN
HAMPDEN
ERVING
PLAINFIELD
BUCKLAND
CUMMINGTON
MONROE
NEW SALEM
HANCOCK
WILLIAMSTOWN
DEERFIELD
NORTHFIELD
DALTON
NEW MARLBOROUGH
LEVERETT
GREAT BARRINGTON
HINSDALE
WORTHINGTONCHESTERFIELD
HUNTINGTON
SHUTESBURY
RUSSELL
SHELBURNE
PHILLIPSTON
CHARLEMONT
SOUTHAMPTON
MIDDLEFIELD
HATFIELD
LANESBOROUGH
WESTHAMPTON
RICHMOND WILLIAMSBURG
EGREMONT
STOCKBRIDGE
TYRINGHAM
BERNARDSTON
ALFORD
SUNDERLAND
MOUNT WASHINGTON
MONTGOMERY
CLARKSBURG
NEW ASHFORD
WEST STOCKBRIDGE
!.ATHOL
!.WESTFIELD
!.PALMER
!.PITTSFIELD
!.LUDLOW
!.AGAWAM
!.SPRINGFIELD
!.HOLYOKE
!.CHICOPEE
!.BELCHERTOWN
!.AMHERST
!.NORTHAMPTON
!.WILBRAHAM
!.GREENFIELD
!.NORTH ADAMS
!.SOUTH HADLEY!.
EASTHAMPTON
!.WEST SPRINGFIELD
!.LONGMEADOW
!.EAST LONGMEADOW
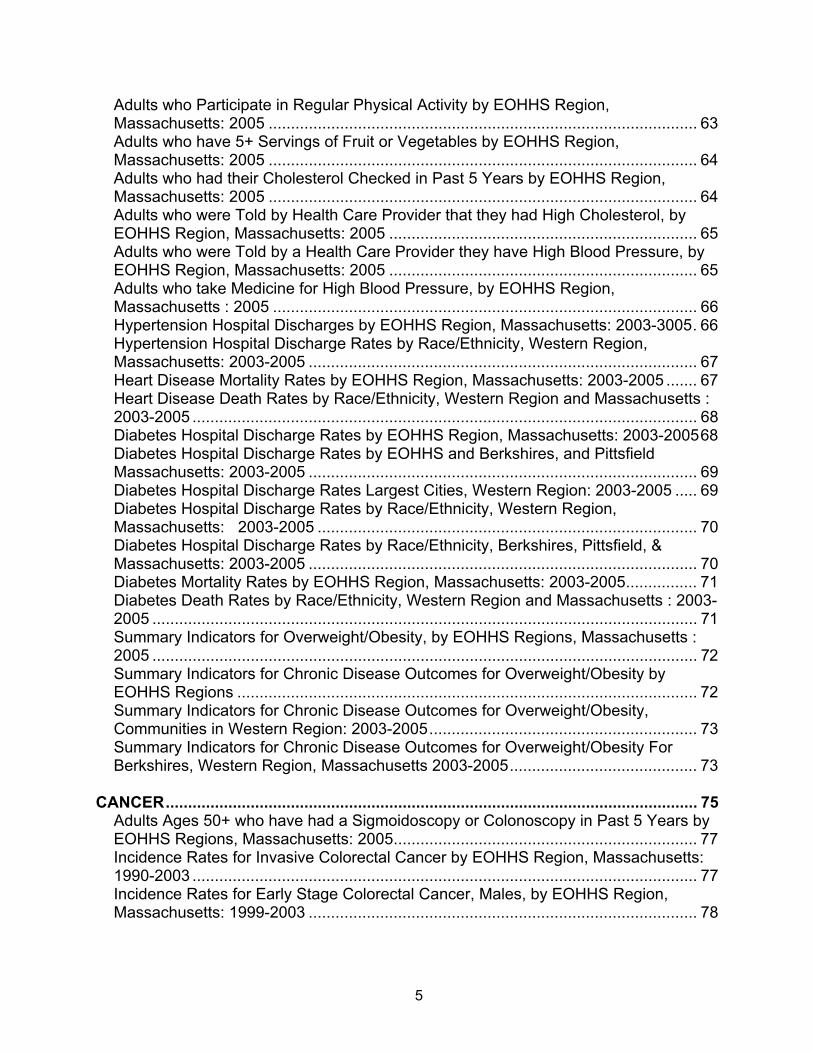
!.Cities with at least 10,000 Population
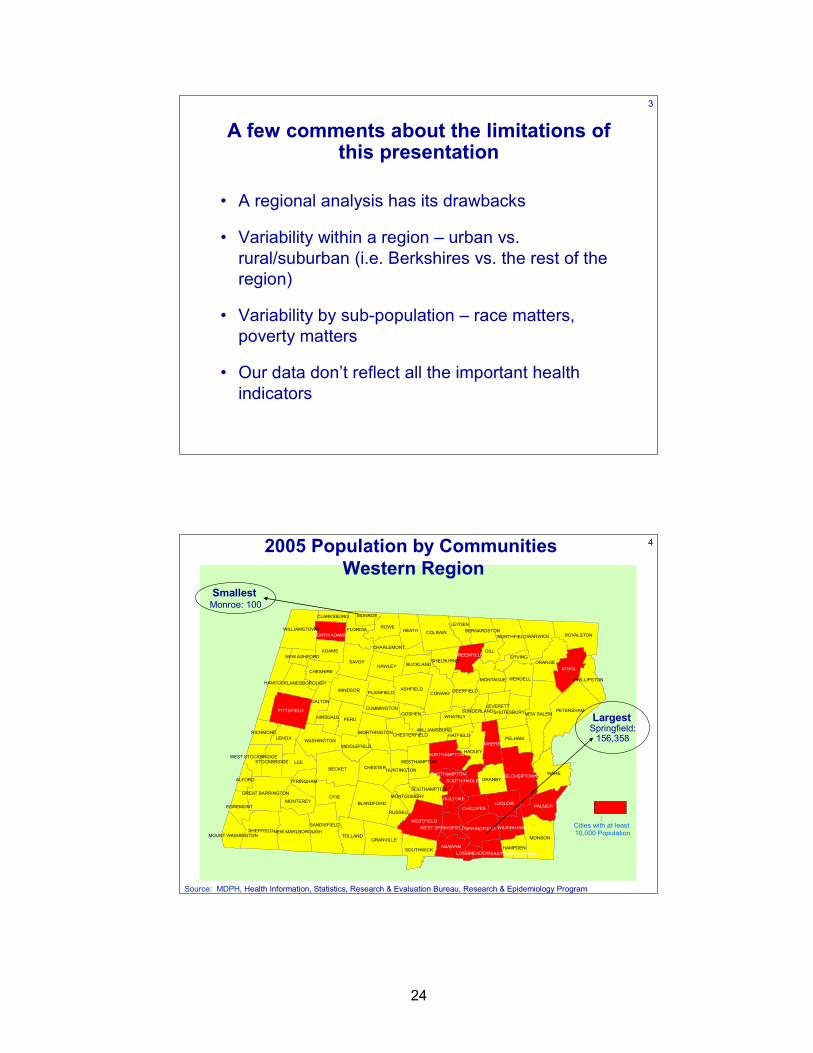
2005 Population by Communities Western Region
LargestSpringfield:
156,358
SmallestMonroe: 100
Source: MDPH, Health Information, Statistics, Research & Evaluation Bureau, Research & Epidemiology Program
25
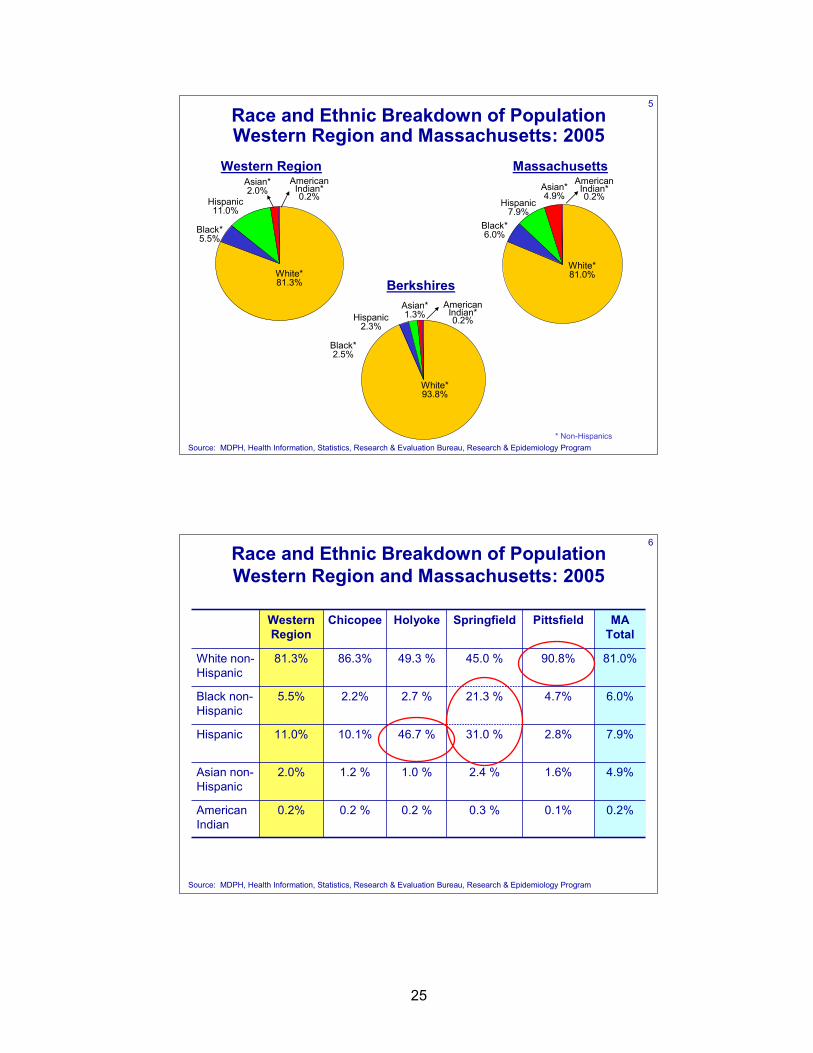
5Race and Ethnic Breakdown of PopulationWestern Region and Massachusetts: 2005
Western Region Massachusetts
White* 81.3%
Black* 5.5%
Hispanic 11.0%
Asian* 2.0%
* Non-Hispanics
White* 81.0%
Black* 6.0%
Hispanic 7.9%
Asian* 4.9%
Source: MDPH, Health Information, Statistics, Research & Evaluation Bureau, Research & Epidemiology Program
American Indian* 0.2%
American Indian* 0.2%
Berkshires
White* 93.8%
Black* 2.5%
Hispanic 2.3%
Asian* 1.3%
American Indian* 0.2%
6Race and Ethnic Breakdown of PopulationWestern Region and Massachusetts: 2005
0.3 %
2.4 %
31.0 %
21.3 %
45.0 %
Springfield
0.1%
1.6%
2.8%
4.7%
90.8%
Pittsfield
0.2%0.2 %0.2 %0.2%American Indian
4.9%1.0 %1.2 %2.0%Asian non-Hispanic
7.9%46.7 %10.1%11.0%Hispanic
6.0%2.7 %2.2%5.5%Black non-Hispanic
81.0%49.3 %86.3%81.3%White non-Hispanic
MA Total
HolyokeChicopeeWestern Region
Source: MDPH, Health Information, Statistics, Research & Evaluation Bureau, Research & Epidemiology Program
26
7
Western Region Massachusetts
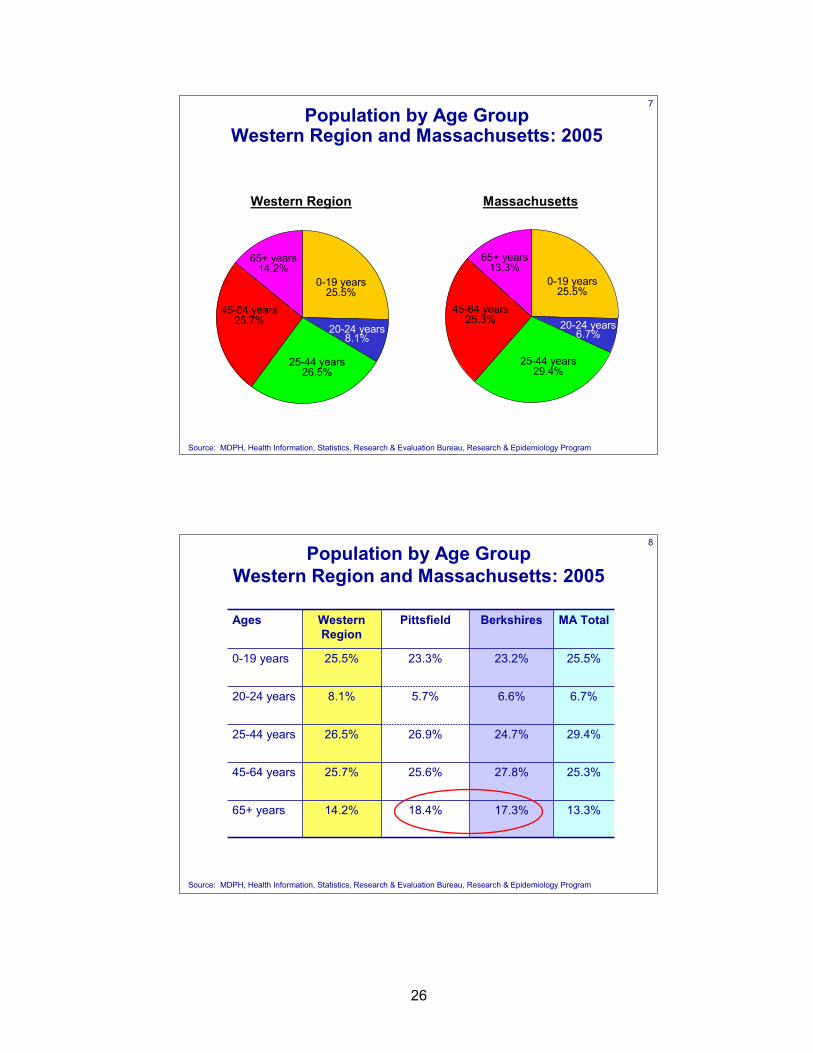
0-19 years 25.5%
Source: MDPH, Health Information, Statistics, Research & Evaluation Bureau, Research & Epidemiology Program
Population by Age Group Western Region and Massachusetts: 2005
20-24 years 8.1%
25-44 years 26.5%
45-64 years 25.7%
65+ years 14.2%
0-19 years 25.5%
20-24 years 6.7%
25-44 years 29.4%
45-64 years 25.3%
65+ years 13.3%
8Population by Age Group
Western Region and Massachusetts: 2005
18.4%
25.6%
26.9%
5.7%
23.3%
Pittsfield
17.3%
27.8%
24.7%
6.6%
23.2%
Berkshires
13.3%14.2%65+ years
25.3%25.7%45-64 years
29.4%26.5%25-44 years
6.7%8.1%20-24 years
25.5%25.5%0-19 years
MA TotalWestern Region
Ages
Source: MDPH, Health Information, Statistics, Research & Evaluation Bureau, Research & Epidemiology Program
27
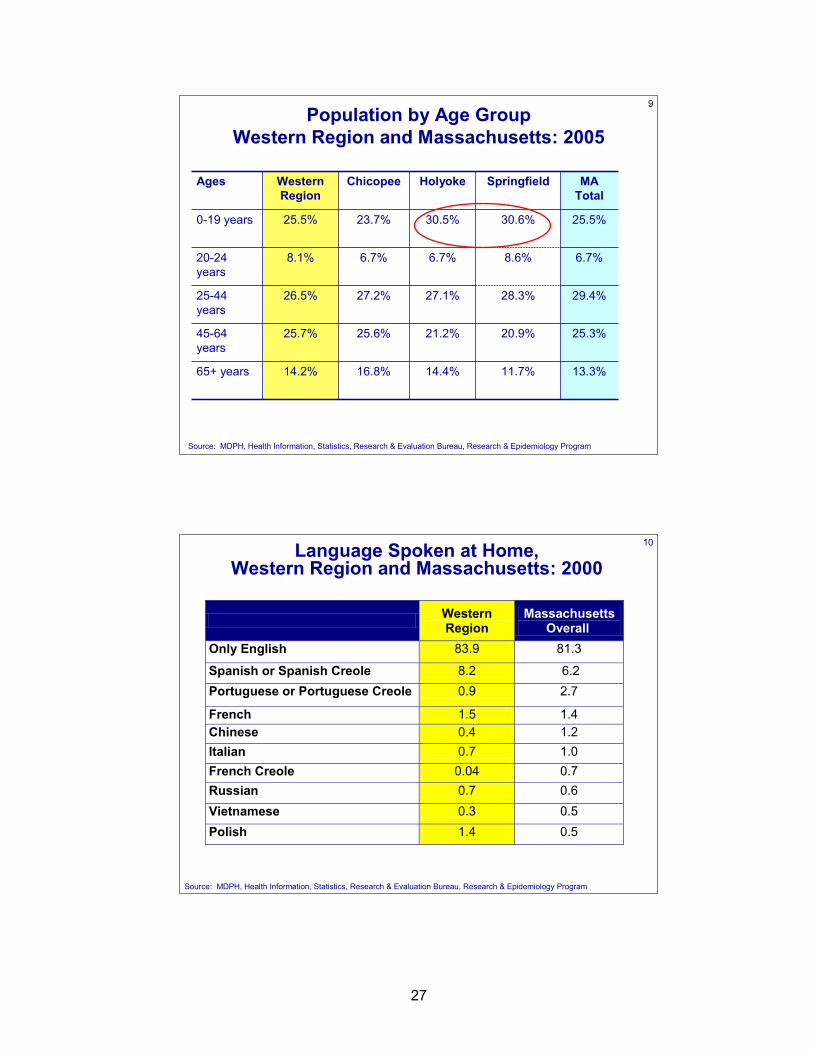
9Population by Age Group
Western Region and Massachusetts: 2005
11.7%
20.9%
28.3%
8.6%
30.6%
Springfield
13.3%14.4%16.8%14.2%65+ years
25.3%21.2%25.6%25.7%45-64 years
29.4%27.1%27.2%26.5%25-44 years
6.7%6.7%6.7%8.1%20-24 years
25.5%30.5%23.7%25.5%0-19 years
MA Total
HolyokeChicopeeWestern Region
Ages
Source: MDPH, Health Information, Statistics, Research & Evaluation Bureau, Research & Epidemiology Program
10Language Spoken at Home,Western Region and Massachusetts: 2000
Western Region
Massachusetts Overall
Only English 83.9 81.3
Spanish or Spanish Creole 8.2 6.2 Portuguese or Portuguese Creole 0.9 2.7
French 1.5 1.4 Chinese 0.4 1.2 Italian 0.7 1.0 French Creole 0.04 0.7 Russian 0.7 0.6 Vietnamese 0.3 0.5 Polish 1.4 0.5
Source: MDPH, Health Information, Statistics, Research & Evaluation Bureau, Research & Epidemiology Program
28
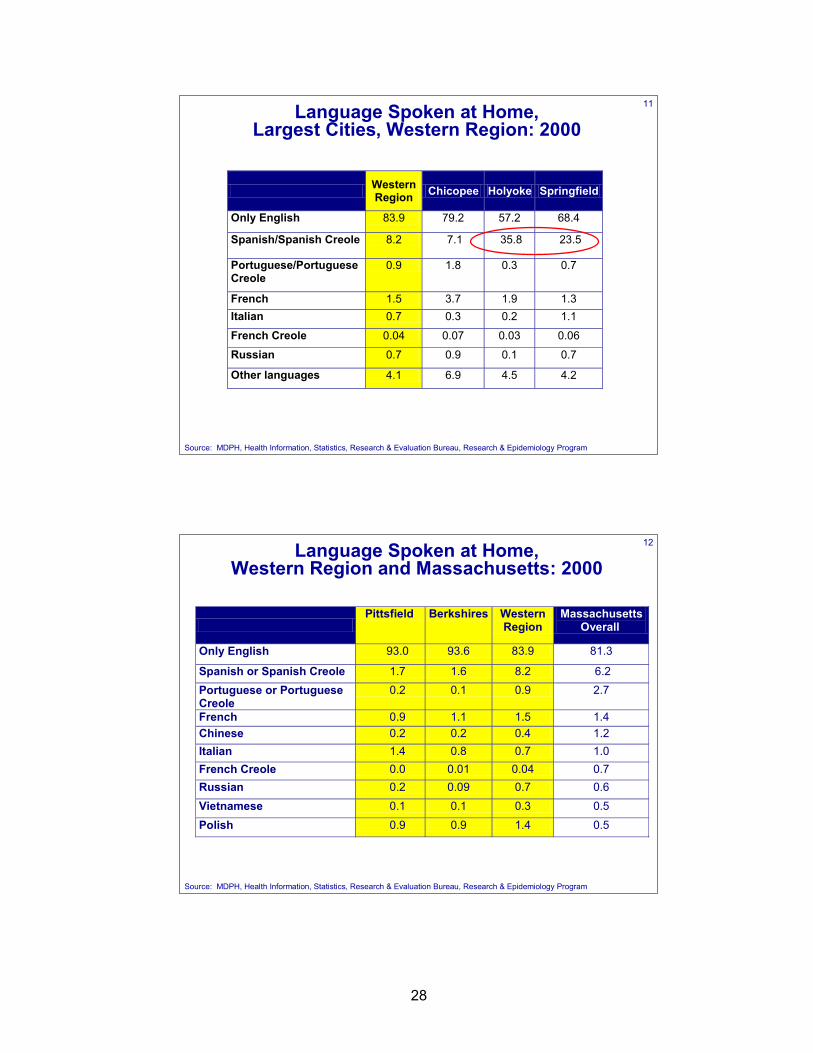
11Language Spoken at Home,Largest Cities, Western Region: 2000
Western Region Chicopee Holyoke Springfield
Only English 83.9 79.2 57.2 68.4
Spanish/Spanish Creole 8.2 7.1 35.8 23.5
Portuguese/Portuguese Creole
0.9 1.8 0.3 0.7
French 1.5 3.7 1.9 1.3 Italian 0.7 0.3 0.2 1.1
French Creole 0.04 0.07 0.03 0.06
Russian 0.7 0.9 0.1 0.7
Other languages 4.1 6.9 4.5 4.2
Source: MDPH, Health Information, Statistics, Research & Evaluation Bureau, Research & Epidemiology Program
12Language Spoken at Home,Western Region and Massachusetts: 2000
Pittsfield Berkshires Western
Region Massachusetts
Overall
Only English 93.0 93.6 83.9 81.3
Spanish or Spanish Creole 1.7 1.6 8.2 6.2 Portuguese or Portuguese Creole
0.2 0.1 0.9 2.7
French 0.9 1.1 1.5 1.4 Chinese 0.2 0.2 0.4 1.2 Italian 1.4 0.8 0.7 1.0 French Creole 0.0 0.01 0.04 0.7 Russian 0.2 0.09 0.7 0.6 Vietnamese 0.1 0.1 0.3 0.5 Polish 0.9 0.9 1.4 0.5
Source: MDPH, Health Information, Statistics, Research & Evaluation Bureau, Research & Epidemiology Program
29
13
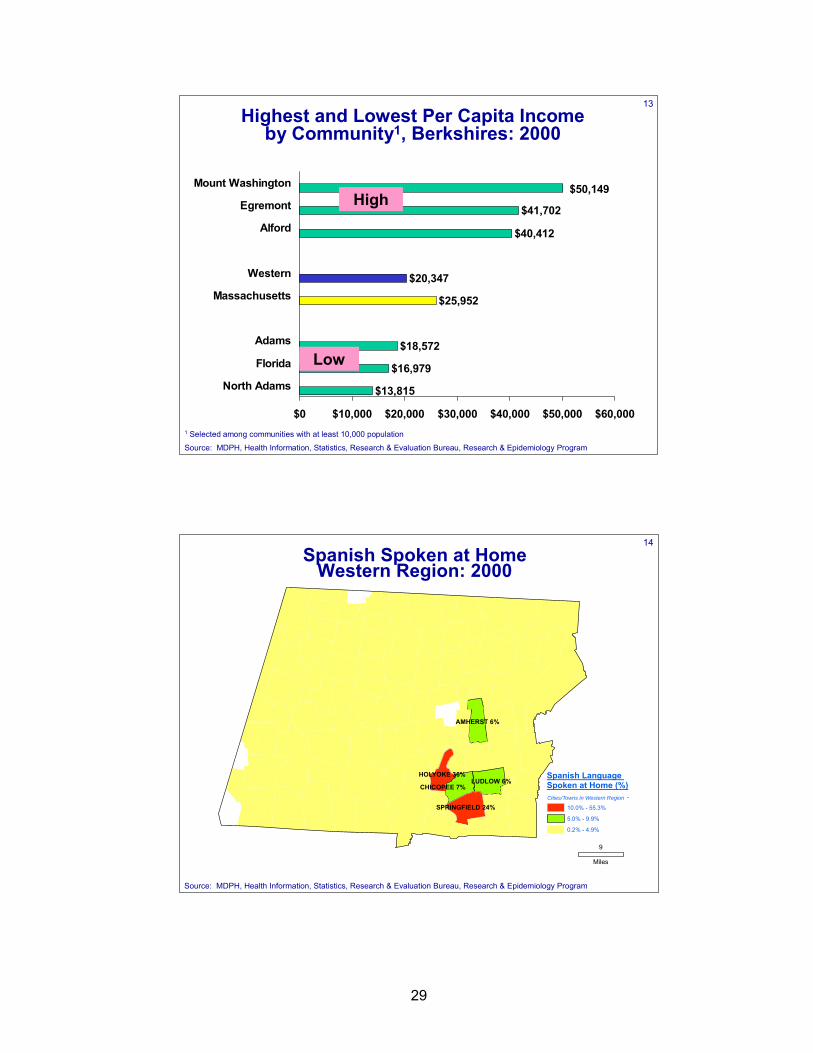
$13,815
$16,979
$18,572
$25,952
$20,347
$40,412
$41,702
$50,149
$0 $10,000 $20,000 $30,000 $40,000 $50,000 $60,000
North Adams
Florida
Adams
Massachusetts
Western
Alford
Egremont
Mount Washington
Highest and Lowest Per Capita Income by Community1, Berkshires: 2000
High
Low
1 Selected among communities with at least 10,000 population
Source: MDPH, Health Information, Statistics, Research & Evaluation Bureau, Research & Epidemiology Program
14
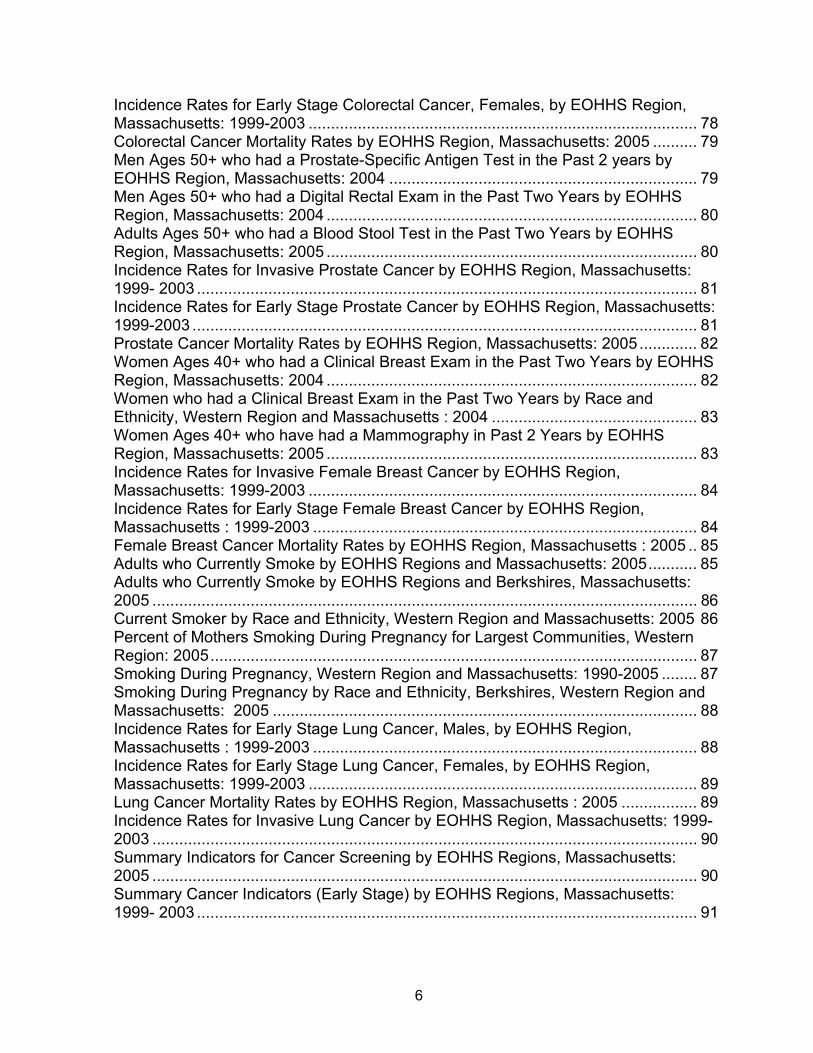
SPRINGFIELD 24%
HOLYOKE 36%LUDLOW 6%
AMHERST 6%
CHICOPEE 7%Spanish Language Spoken at Home (%)Cities/Towns in Western Region
10.0% - 55.3%
5.0% - 9.9%
0.2% - 4.9%
Western Region
9
Miles
Spanish Spoken at HomeWestern Region: 2000
Source: MDPH, Health Information, Statistics, Research & Evaluation Bureau, Research & Epidemiology Program
30
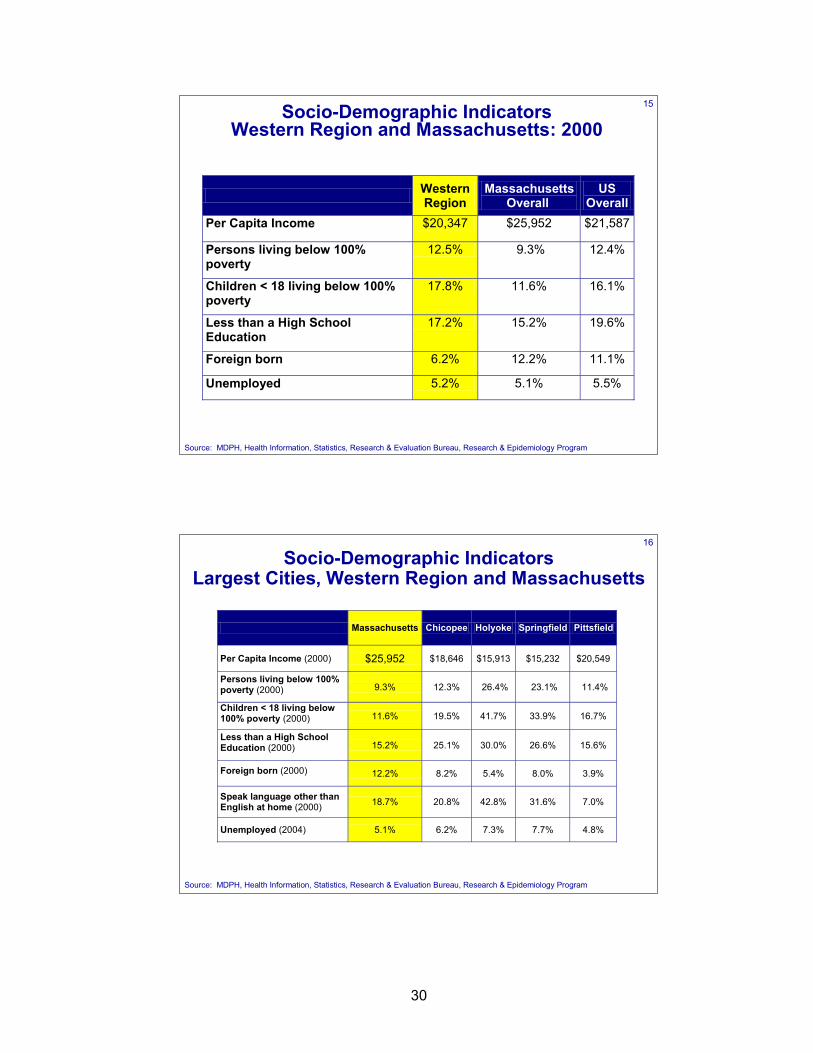
15Socio-Demographic IndicatorsWestern Region and Massachusetts: 2000
Western Region
Massachusetts Overall
US Overall
Per Capita Income $20,347 $25,952 $21,587
Persons living below 100% poverty
12.5% 9.3% 12.4%
Children < 18 living below 100% poverty
17.8% 11.6% 16.1%
Less than a High School Education
17.2% 15.2% 19.6%
Foreign born 6.2% 12.2% 11.1%
Unemployed 5.2% 5.1% 5.5%
Source: MDPH, Health Information, Statistics, Research & Evaluation Bureau, Research & Epidemiology Program
16
Socio-Demographic IndicatorsLargest Cities, Western Region and Massachusetts
Massachusetts Chicopee Holyoke Springfield Pittsfield
Per Capita Income (2000) $25,952 $18,646 $15,913 $15,232 $20,549
Persons living below 100% poverty (2000)
9.3% 12.3% 26.4% 23.1% 11.4%
Children < 18 living below 100% poverty (2000)
11.6% 19.5% 41.7% 33.9% 16.7%
Less than a High School Education (2000)
15.2% 25.1% 30.0% 26.6% 15.6%
Foreign born (2000)
12.2% 8.2% 5.4% 8.0% 3.9%
Speak language other than English at home (2000) 18.7% 20.8% 42.8% 31.6% 7.0%
Unemployed (2004) 5.1% 6.2% 7.3% 7.7% 4.8%
Source: MDPH, Health Information, Statistics, Research & Evaluation Bureau, Research & Epidemiology Program
31
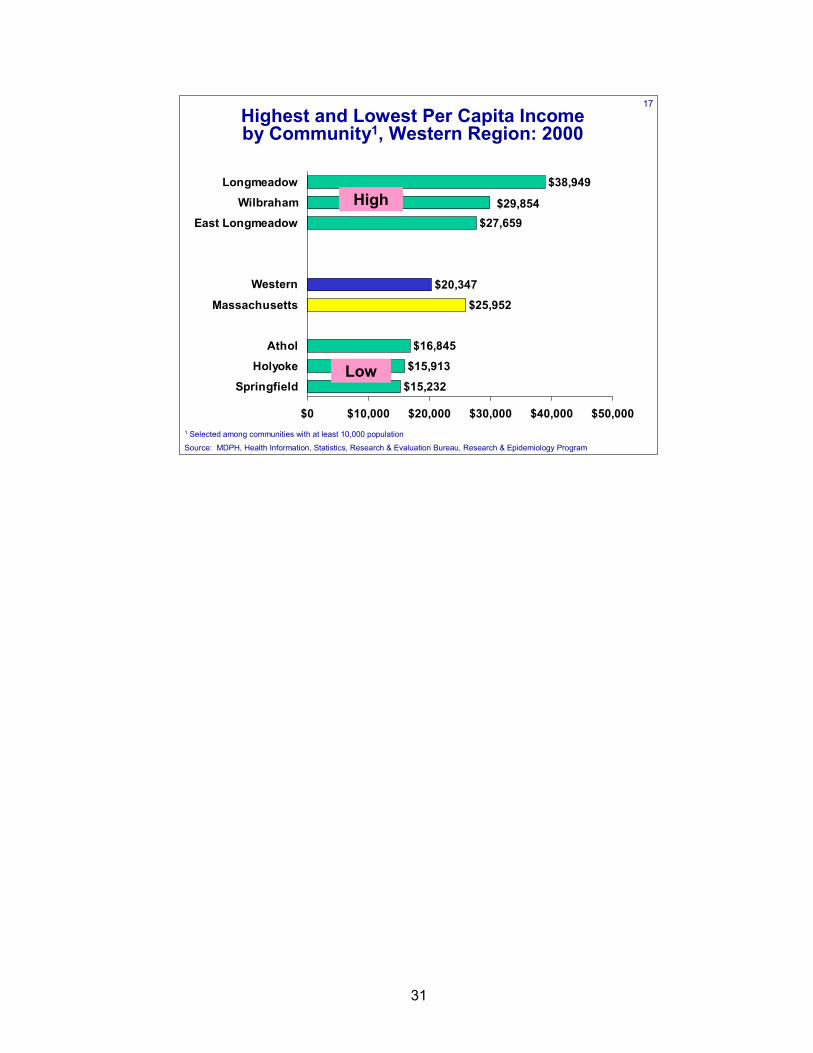
17
$15,232
$15,913
$16,845
$25,952
$20,347
$27,659
$38,949
$29,854
$0 $10,000 $20,000 $30,000 $40,000 $50,000
Springfield
Holyoke
Athol
Massachusetts
Western
East Longmeadow
Wilbraham
Longmeadow
Highest and Lowest Per Capita Income by Community1, Western Region: 2000
High
Low
1 Selected among communities with at least 10,000 population
Source: MDPH, Health Information, Statistics, Research & Evaluation Bureau, Research & Epidemiology Program

32
33
HEALTH CARE ACCESS

34
35
18
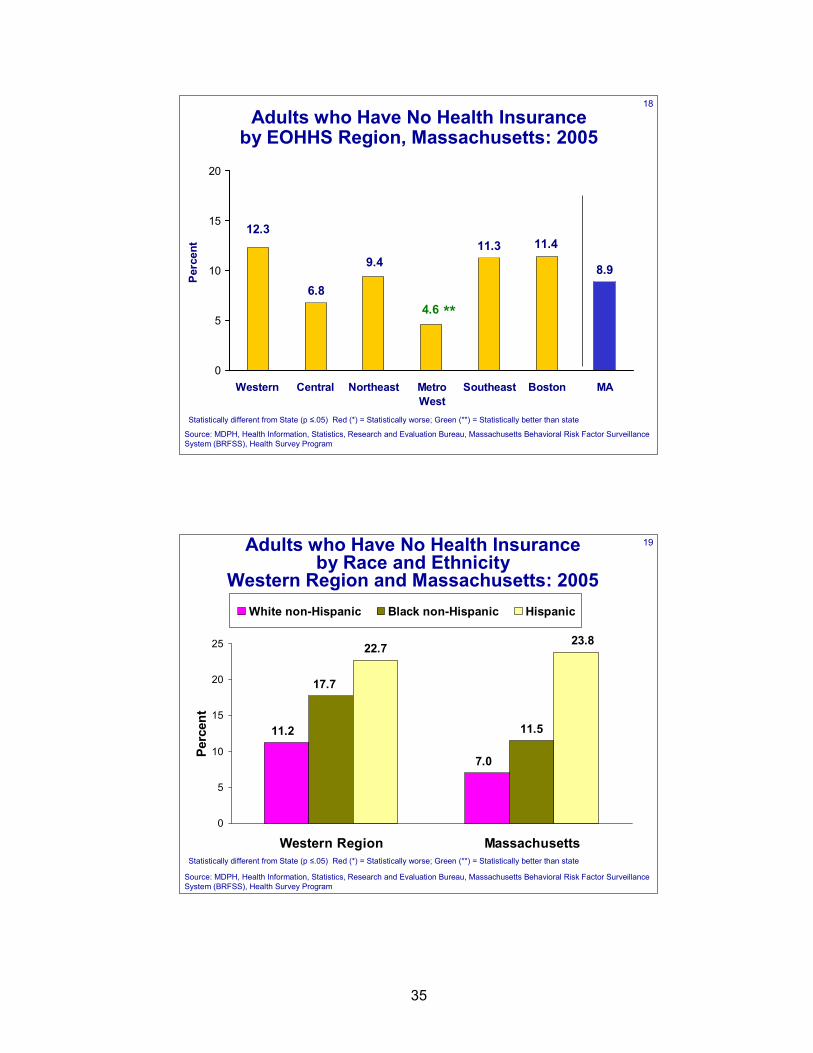
Adults who Have No Health Insurance by EOHHS Region, Massachusetts: 2005
11.3 11.4
6.8
12.3
9.4
4.6
8.9
0
5
10
15
20
Western Central Northeast MetroWest
Southeast Boston MA
Perc
ent
**
Statistically different from State (p ≤.05) Red (*) = Statistically worse; Green (**) = Statistically better than state
Source: MDPH, Health Information, Statistics, Research and Evaluation Bureau, Massachusetts Behavioral Risk Factor Surveillance System (BRFSS), Health Survey Program
19Adults who Have No Health Insurance by Race and Ethnicity
Western Region and Massachusetts: 2005
11.5
7.0
11.2
17.7
22.7 23.8
0
5
10
15
20
25
Western Region Massachusetts
Perc
ent
White non-Hispanic Black non-Hispanic Hispanic
Statistically different from State (p ≤.05) Red (*) = Statistically worse; Green (**) = Statistically better than state
Source: MDPH, Health Information, Statistics, Research and Evaluation Bureau, Massachusetts Behavioral Risk Factor Surveillance System (BRFSS), Health Survey Program
36
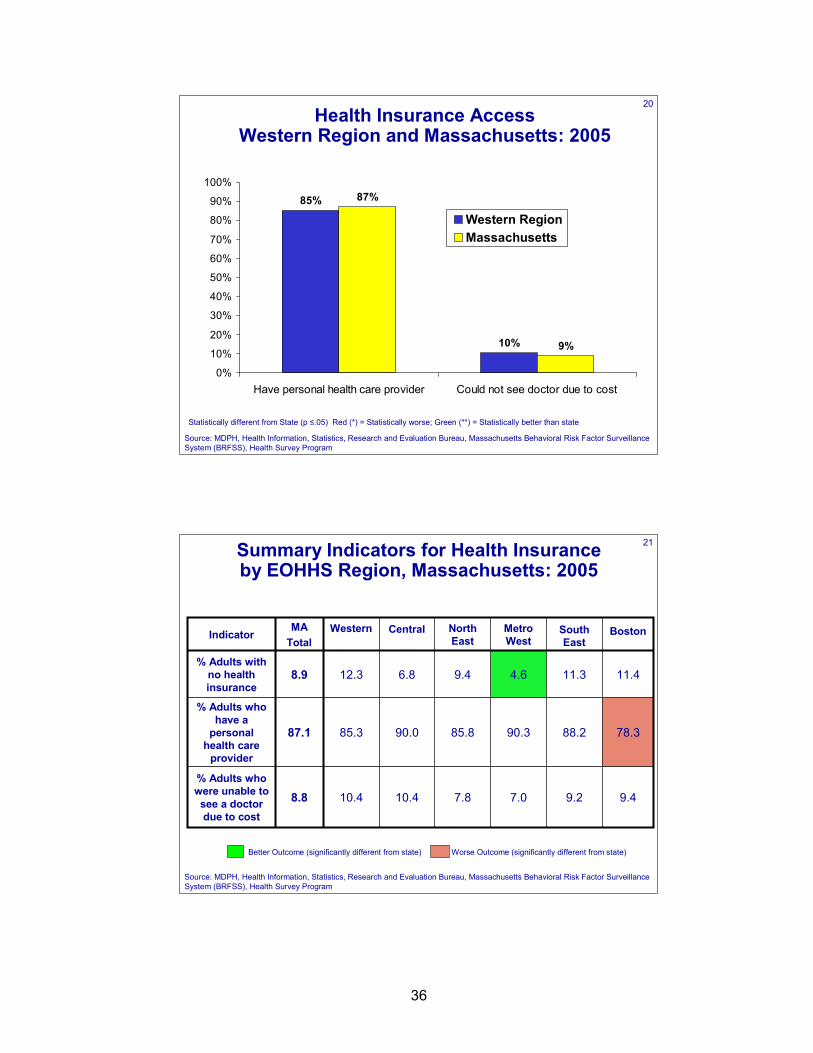
20Health Insurance Access
Western Region and Massachusetts: 2005
85%
10%
87%
9%
0%
10%
20%
30%
40%
50%
60%
70%
80%
90%
100%
Have personal health care provider Could not see doctor due to cost
Western RegionMassachusetts
Statistically different from State (p ≤.05) Red (*) = Statistically worse; Green (**) = Statistically better than state
Source: MDPH, Health Information, Statistics, Research and Evaluation Bureau, Massachusetts Behavioral Risk Factor Surveillance System (BRFSS), Health Survey Program
21
10.4
85.3
12.3
Western
9.2
88.2
11.3
South East
9.47.07.810.48.8% Adults who were unable to see a doctor due to cost
78.390.385.890.087.1
% Adults who have a
personal health care
provider
11.44.69.46.88.9% Adults with
no health insurance
BostonMetro West
North East
CentralMATotal
Indicator
Summary Indicators for Health Insurance by EOHHS Region, Massachusetts: 2005
Better Outcome (significantly different from state) Worse Outcome (significantly different from state)
Source: MDPH, Health Information, Statistics, Research and Evaluation Bureau, Massachusetts Behavioral Risk Factor Surveillance System (BRFSS), Health Survey Program
37
BIRTH INDICATORS

38
39
22
5.1
7.0
6.6 5.7
0
1
2
3
4
5
6
7
8
9
10
1990 1991 1992 1993 1994 1995 1996 1997 1998 1999 2000 2001 2002 2003 2004 2005
Year
IMR
(# d
eath
s/1,
000
live
birt
hs)
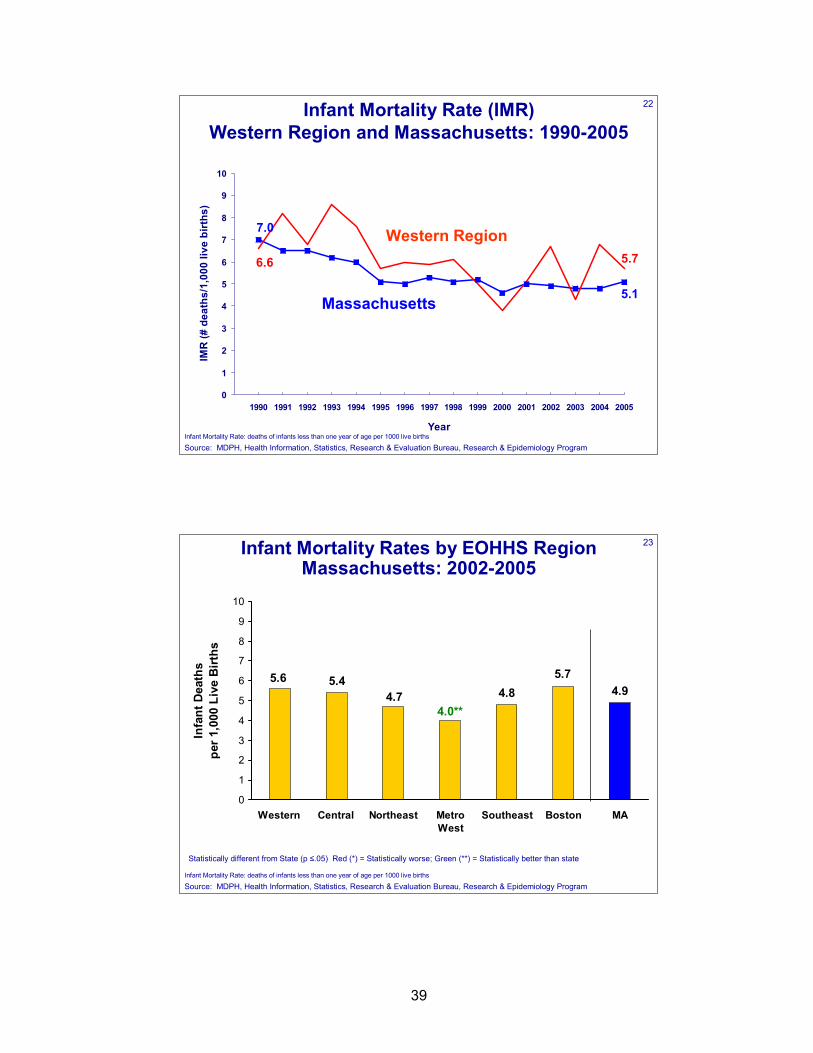
Infant Mortality Rate (IMR) Western Region and Massachusetts: 1990-2005
Massachusetts
Western Region
Source: MDPH, Health Information, Statistics, Research & Evaluation Bureau, Research & Epidemiology ProgramInfant Mortality Rate: deaths of infants less than one year of age per 1000 live births
23Infant Mortality Rates by EOHHS Region Massachusetts: 2002-2005
4.8 4.94.0**
4.75.6 5.4 5.7
0
1
2
3
4
5
6
7
8
9
10
Western Central Northeast MetroWest
Southeast Boston MA
Infa
nt D
eath
s pe
r 1,0
00 L
ive
Birt
hs
Source: MDPH, Health Information, Statistics, Research & Evaluation Bureau, Research & Epidemiology ProgramInfant Mortality Rate: deaths of infants less than one year of age per 1000 live births
Statistically different from State (p ≤.05) Red (*) = Statistically worse; Green (**) = Statistically better than state
40
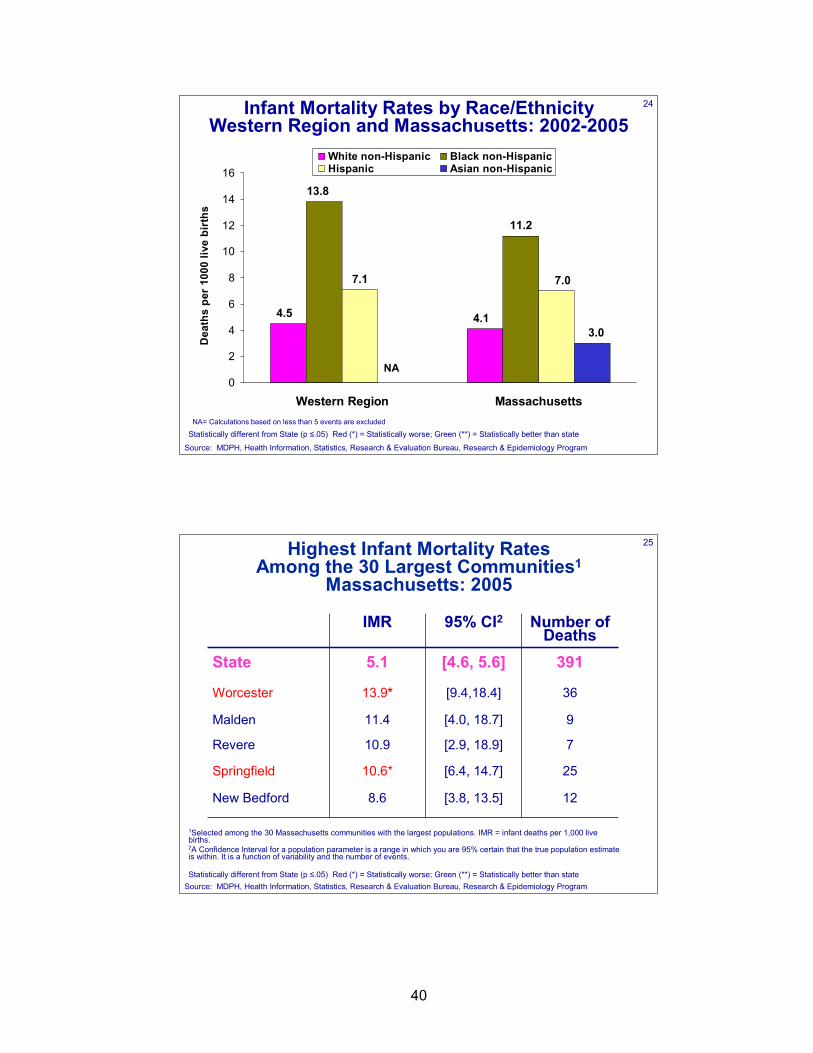
24Infant Mortality Rates by Race/Ethnicity Western Region and Massachusetts: 2002-2005
NA= Calculations based on less than 5 events are excluded
Source: MDPH, Health Information, Statistics, Research & Evaluation Bureau, Research & Epidemiology Program
11.2
4.14.5
13.8
7.1 7.0
3.0
0
2
4
6
8
10
12
14
16
Western Region Massachusetts
Dea
ths
per
1000
live
bir
ths
White non-Hispanic Black non-HispanicHispanic Asian non-Hispanic
NA
Statistically different from State (p ≤.05) Red (*) = Statistically worse; Green (**) = Statistically better than state
25Highest Infant Mortality RatesAmong the 30 Largest Communities1
Massachusetts: 2005
1Selected among the 30 Massachusetts communities with the largest populations. IMR = infant deaths per 1,000 live births. 2A Confidence Interval for a population parameter is a range in which you are 95% certain that the true population estimate is within. It is a function of variability and the number of events.
391[4.6, 5.6]5.1State
12[3.8, 13.5]8.6New Bedford
25[6.4, 14.7]10.6*Springfield
7[2.9, 18.9]10.9Revere
9[4.0, 18.7]11.4Malden
36[9.4,18.4]13.9*Worcester
Number of Deaths
95% CI2IMR
Source: MDPH, Health Information, Statistics, Research & Evaluation Bureau, Research & Epidemiology ProgramStatistically different from State (p ≤.05) Red (*) = Statistically worse; Green (**) = Statistically better than state
41
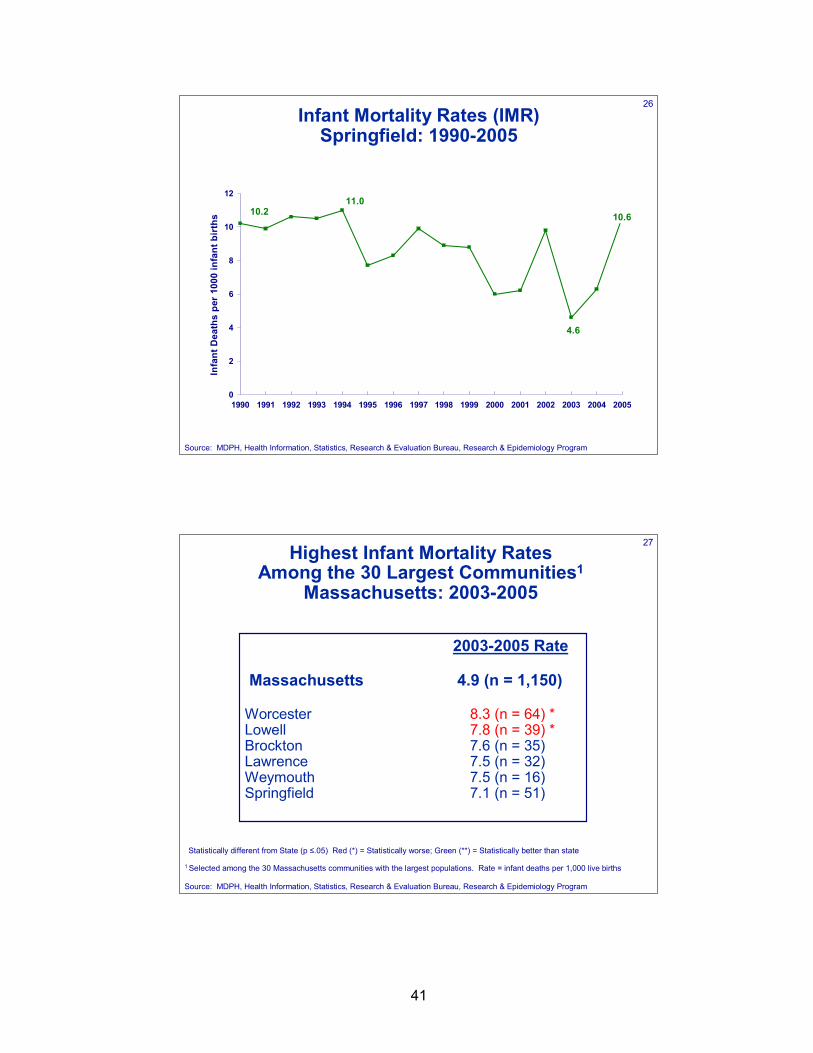
26Infant Mortality Rates (IMR)
Springfield: 1990-2005
11.0
4.6
10.610.2
0
2
4
6
8
10
12
1990 1991 1992 1993 1994 1995 1996 1997 1998 1999 2000 2001 2002 2003 2004 2005
Infa
nt D
eath
s pe
r 10
00 in
fant
bir
ths
Source: MDPH, Health Information, Statistics, Research & Evaluation Bureau, Research & Epidemiology Program
27
2003-2005 Rate
Massachusetts 4.9 (n = 1,150)
Worcester 8.3 (n = 64) *Lowell 7.8 (n = 39) *Brockton 7.6 (n = 35)Lawrence 7.5 (n = 32)Weymouth 7.5 (n = 16)Springfield 7.1 (n = 51)
Highest Infant Mortality Rates Among the 30 Largest Communities1
Massachusetts: 2003-2005
1 Selected among the 30 Massachusetts communities with the largest populations. Rate = infant deaths per 1,000 live births
Source: MDPH, Health Information, Statistics, Research & Evaluation Bureau, Research & Epidemiology Program
Statistically different from State (p ≤.05) Red (*) = Statistically worse; Green (**) = Statistically better than state
42
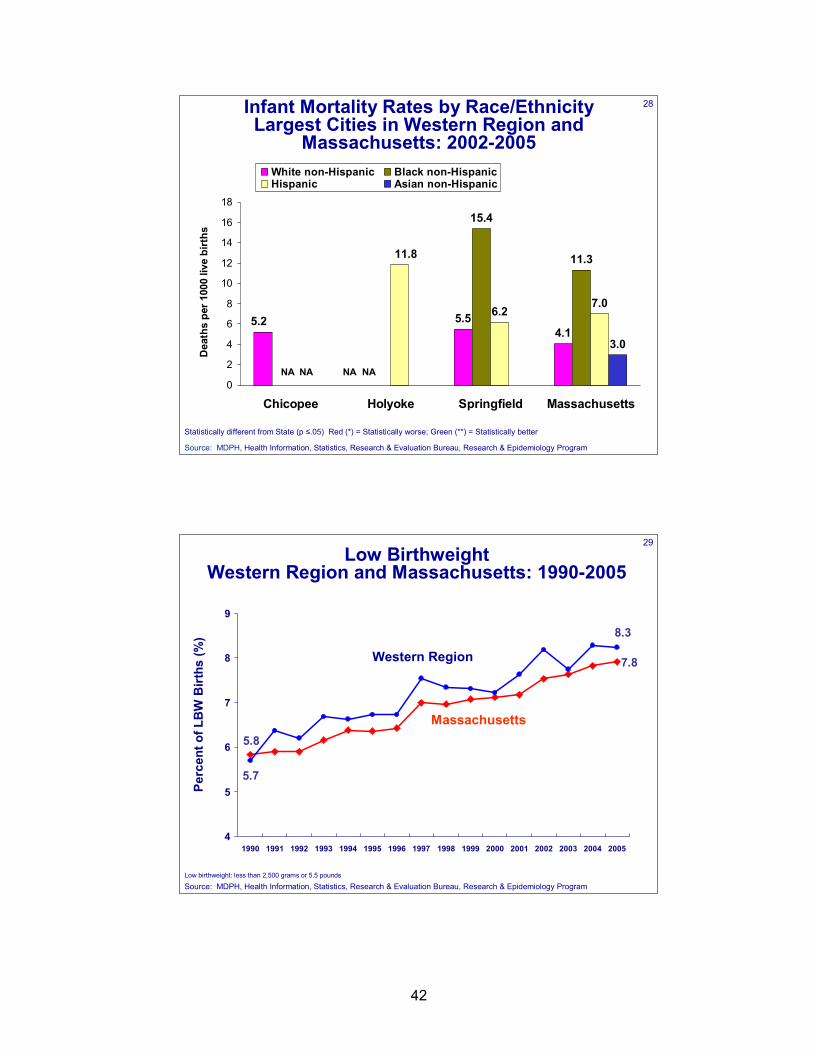
28Infant Mortality Rates by Race/EthnicityLargest Cities in Western Region and
Massachusetts: 2002-2005
Source: MDPH, Health Information, Statistics, Research & Evaluation Bureau, Research & Epidemiology Program
5.54.1
15.4
11.3
6.27.0
3.0
5.2
11.8
0
2
4
6
8
10
12
14
16
18
Chicopee Holyoke Springfield Massachusetts
Dea
ths
per 1
000
live
birt
hs
White non-Hispanic Black non-HispanicHispanic Asian non-Hispanic
NA NA NA NA
Statistically different from State (p ≤.05) Red (*) = Statistically worse; Green (**) = Statistically better
29
7.8
5.8
8.3
5.7
4
5
6
7
8
9
1990 1991 1992 1993 1994 1995 1996 1997 1998 1999 2000 2001 2002 2003 2004 2005
Perc
ent o
f LB
W B
irths
(%)
Low Birthweight Western Region and Massachusetts: 1990-2005
Western Region
Massachusetts
Source: MDPH, Health Information, Statistics, Research & Evaluation Bureau, Research & Epidemiology ProgramLow birthweight: less than 2,500 grams or 5.5 pounds
43
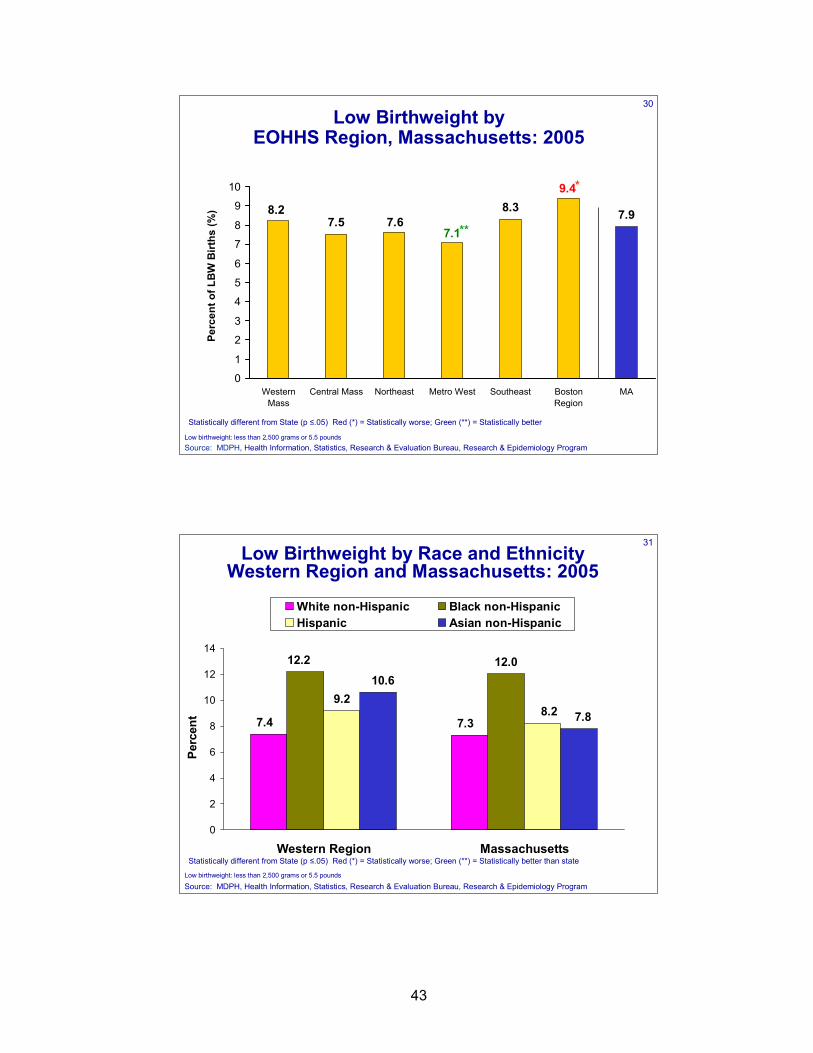
30
Low Birthweight byEOHHS Region, Massachusetts: 2005
8.3 7.97.1
7.68.2
7.5
9.4
0
1
2
3
4
5
6
7
8
9
10
WesternMass
Central Mass Northeast Metro West Southeast BostonRegion
MA
Perc
ent o
f LB
W B
irths
(%)
Source: MDPH, Health Information, Statistics, Research & Evaluation Bureau, Research & Epidemiology Program
**
*
Low birthweight: less than 2,500 grams or 5.5 pounds
Statistically different from State (p ≤.05) Red (*) = Statistically worse; Green (**) = Statistically better
31Low Birthweight by Race and Ethnicity
Western Region and Massachusetts: 2005
12.0
7.37.4
12.2
9.28.2 7.8
10.6
0
2
4
6
8
10
12
14
Western Region Massachusetts
Perc
ent
White non-Hispanic Black non-HispanicHispanic Asian non-Hispanic
Source: MDPH, Health Information, Statistics, Research & Evaluation Bureau, Research & Epidemiology ProgramLow birthweight: less than 2,500 grams or 5.5 pounds
Statistically different from State (p ≤.05) Red (*) = Statistically worse; Green (**) = Statistically better than state
44
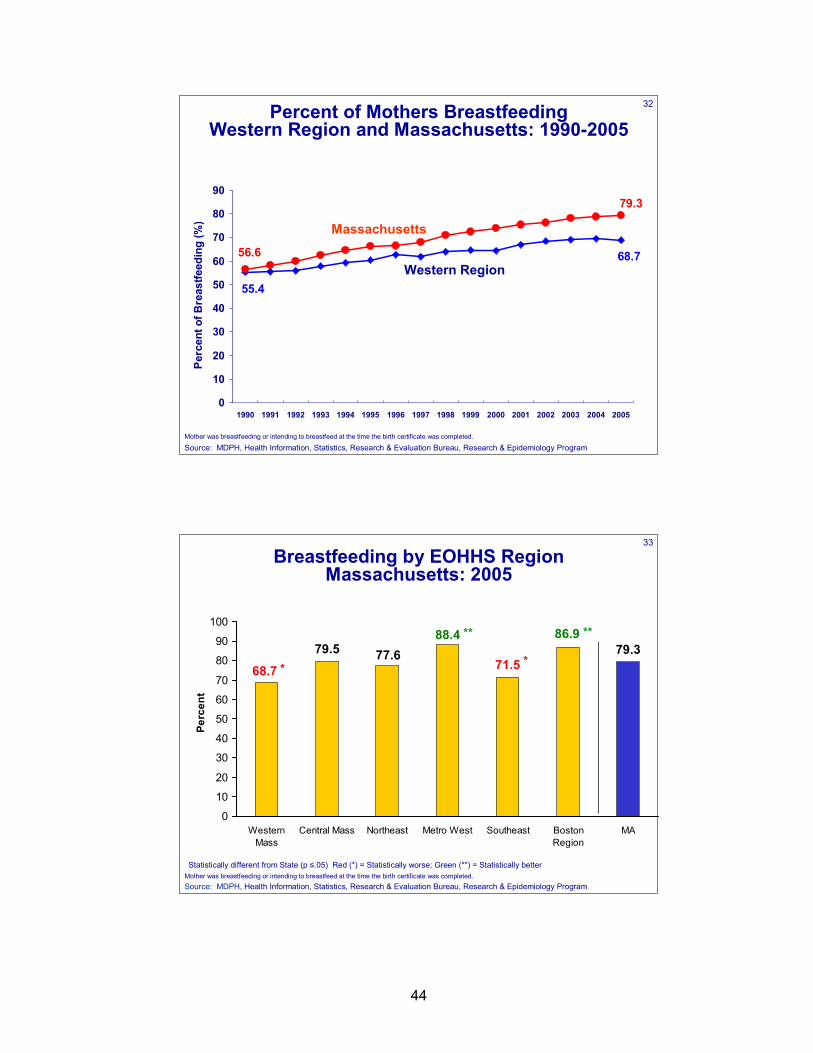
32
68.7
55.4
79.3
56.6
0
10
20
30
40
50
60
70
80
90
1990 1991 1992 1993 1994 1995 1996 1997 1998 1999 2000 2001 2002 2003 2004 2005
Perc
ent o
f Bre
astfe
edin
g (%
)
Percent of Mothers Breastfeeding Western Region and Massachusetts: 1990-2005
Massachusetts
Western Region
Source: MDPH, Health Information, Statistics, Research & Evaluation Bureau, Research & Epidemiology ProgramMother was breastfeeding or intending to breastfeed at the time the birth certificate was completed.
33
Breastfeeding by EOHHS Region Massachusetts: 2005
79.371.5
88.477.6
68.779.5
86.9
0
10
20
30
40
50
60
70
80
90
100
WesternMass
Central Mass Northeast Metro West Southeast BostonRegion
MA
Perc
ent
Source: MDPH, Health Information, Statistics, Research & Evaluation Bureau, Research & Epidemiology Program
*
**
*
**
Mother was breastfeeding or intending to breastfeed at the time the birth certificate was completed.Statistically different from State (p ≤.05) Red (*) = Statistically worse; Green (**) = Statistically better
45
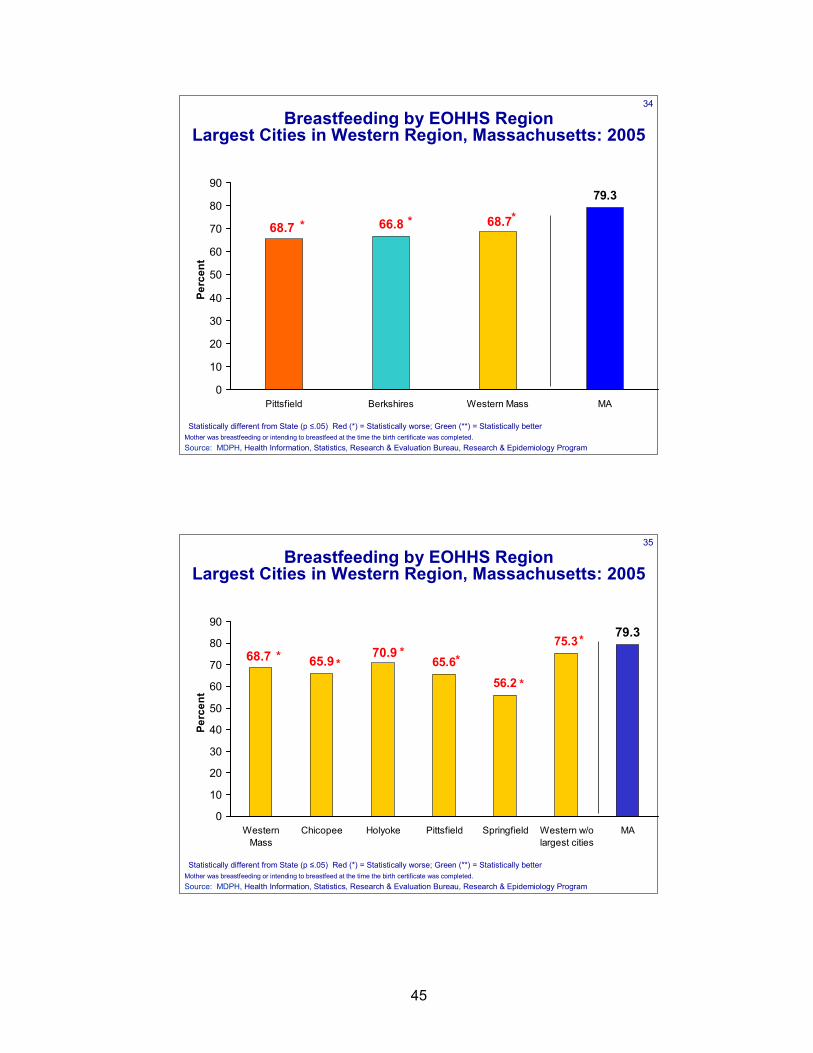
34
Breastfeeding by EOHHS Region Largest Cities in Western Region, Massachusetts: 2005
79.3
68.768.7 66.8
0
10
20
30
40
50
60
70
80
90
Pittsfield Berkshires Western Mass MA
Perc
ent
Source: MDPH, Health Information, Statistics, Research & Evaluation Bureau, Research & Epidemiology Program
*
Mother was breastfeeding or intending to breastfeed at the time the birth certificate was completed.Statistically different from State (p ≤.05) Red (*) = Statistically worse; Green (**) = Statistically better
**
35
Breastfeeding by EOHHS Region Largest Cities in Western Region, Massachusetts: 2005
79.3
56.265.6
70.968.7 65.975.3
0
10
20
30
40
50
60
70
80
90
WesternMass
Chicopee Holyoke Pittsfield Springfield Western w/olargest cities
MA
Perc
ent
Source: MDPH, Health Information, Statistics, Research & Evaluation Bureau, Research & Epidemiology Program
*
*
Mother was breastfeeding or intending to breastfeed at the time the birth certificate was completed.Statistically different from State (p ≤.05) Red (*) = Statistically worse; Green (**) = Statistically better
***
*
46
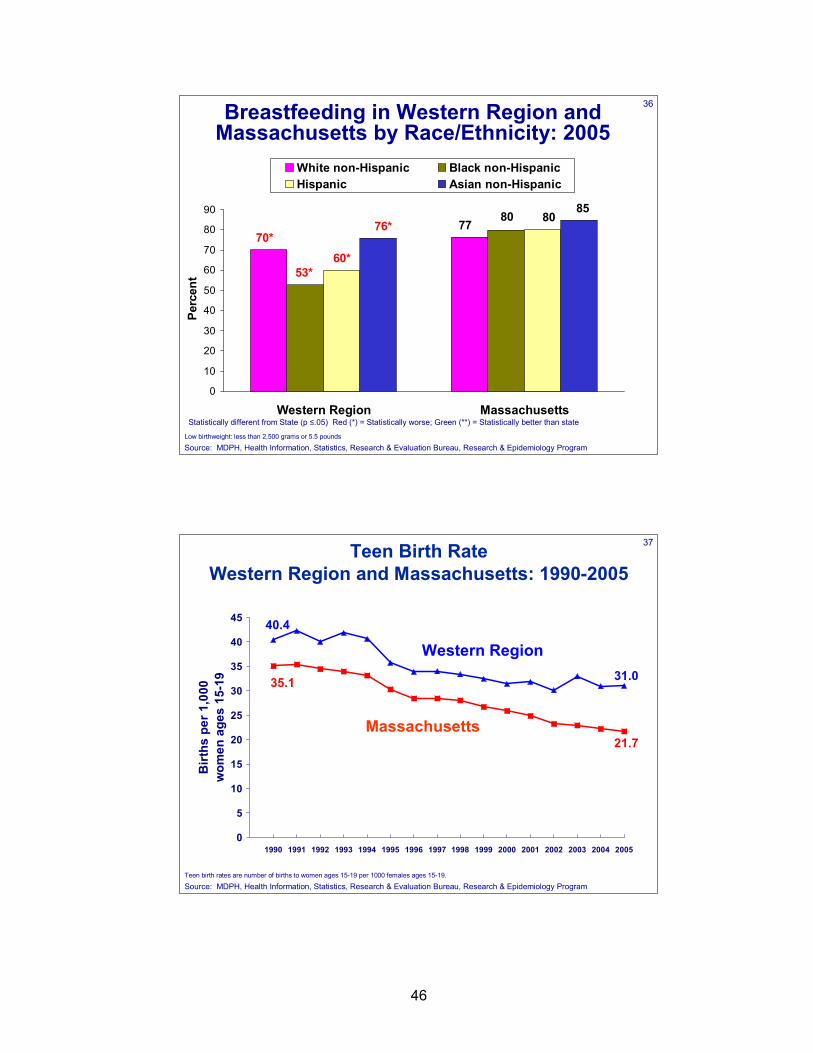
36Breastfeeding in Western Region and Massachusetts by Race/Ethnicity: 2005
7770*
80
53*60*
8085
76*
0
10
20
30
40
50
60
70
80
90
Western Region Massachusetts
Perc
ent
White non-Hispanic Black non-HispanicHispanic Asian non-Hispanic
Source: MDPH, Health Information, Statistics, Research & Evaluation Bureau, Research & Epidemiology ProgramLow birthweight: less than 2,500 grams or 5.5 pounds
Statistically different from State (p ≤.05) Red (*) = Statistically worse; Green (**) = Statistically better than state
37
21.7
35.1
40.4
31.0
0
5
10
15
20
25
30
35
40
45
1990 1991 1992 1993 1994 1995 1996 1997 1998 1999 2000 2001 2002 2003 2004 2005
Birt
hs p
er 1
,000
w
omen
age
s 15
-19
Teen Birth RateWestern Region and Massachusetts: 1990-2005
Massachusetts
Western Region
Source: MDPH, Health Information, Statistics, Research & Evaluation Bureau, Research & Epidemiology ProgramTeen birth rates are number of births to women ages 15-19 per 1000 females ages 15-19.
47
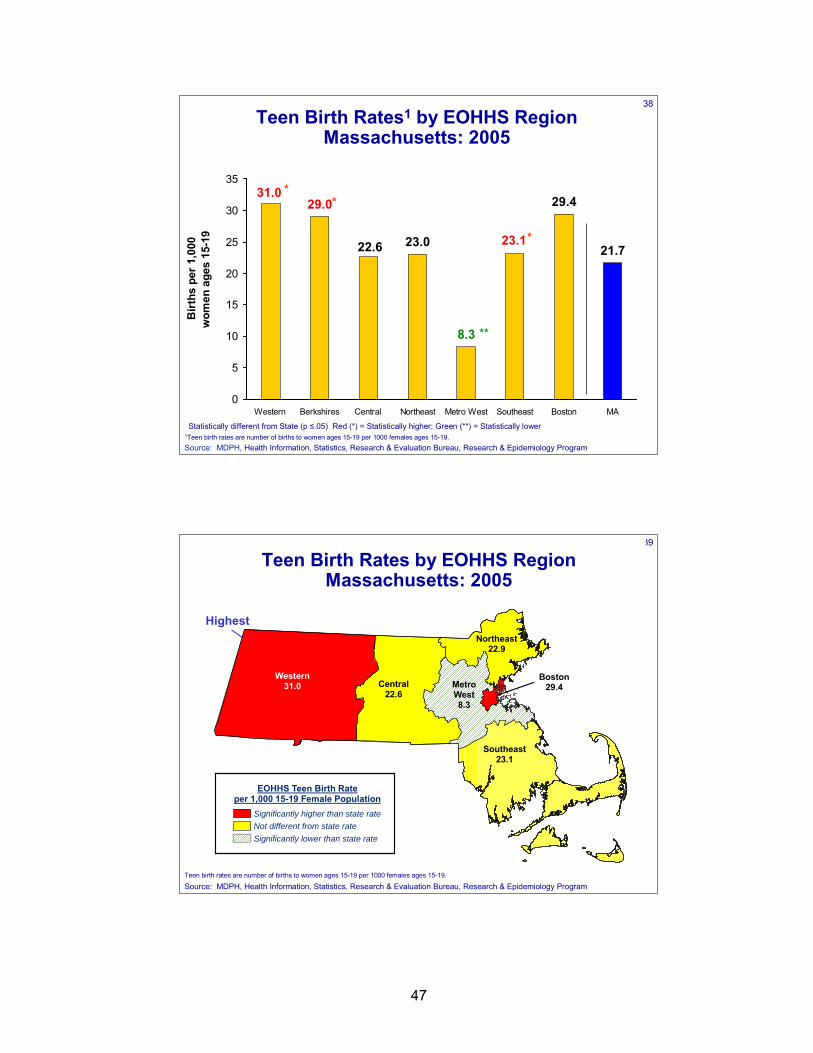
38
Teen Birth Rates1 by EOHHS Region Massachusetts: 2005
21.7
8.3
29.4
23.022.6
31.029.0
23.1
0
5
10
15
20
25
30
35
Western Berkshires Central Northeast Metro West Southeast Boston MA
Birt
hs p
er 1
,000
w
omen
age
s 15
-19
Source: MDPH, Health Information, Statistics, Research & Evaluation Bureau, Research & Epidemiology Program
*
**
*
1Teen birth rates are number of births to women ages 15-19 per 1000 females ages 15-19.Statistically different from State (p ≤.05) Red (*) = Statistically higher; Green (**) = Statistically lower
*
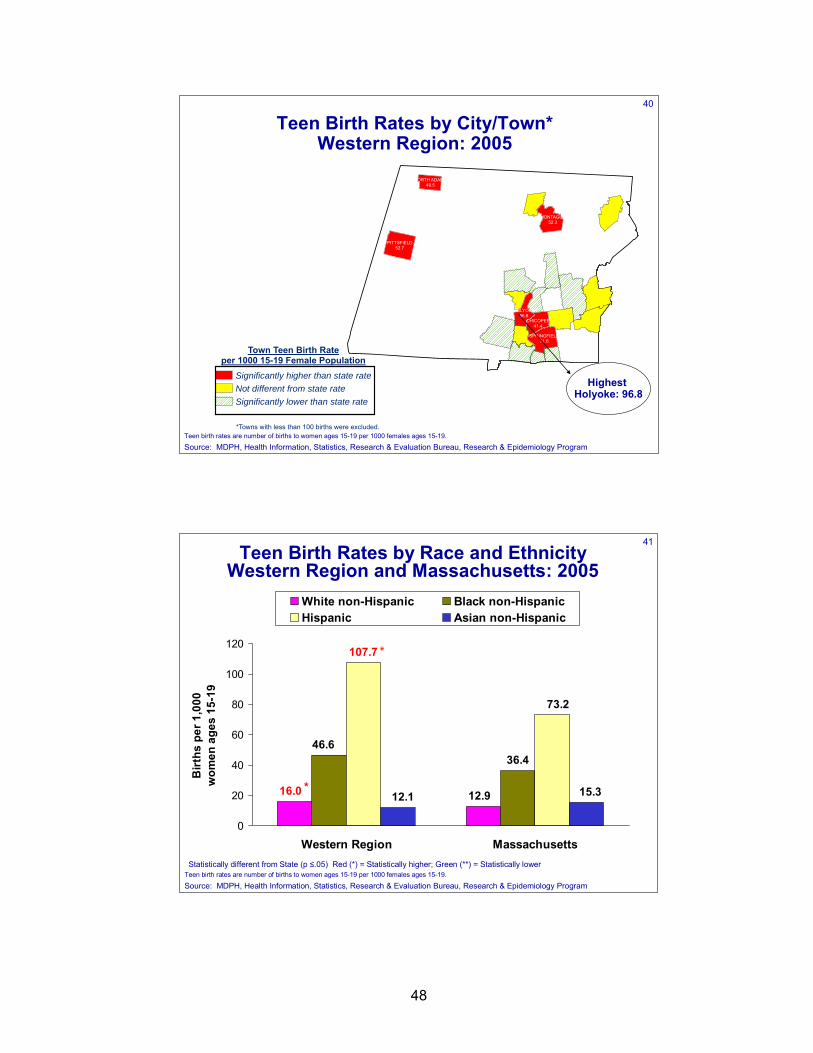
39
Highest
Central22.6
Southeast23.1
Northeast22.9
Western31.0
Boston29.4Metro
West8.3
Teen Birth Rates by Executive Office of Health and Human Service(EOHHS) Regions, Massachusetts Births 2005
EOHHS Teen Birth Rateper 1,000 15-19 Female Population
Significantly higher than state rateNot different from state rateSignificantly lower than state rate
Source: MDPH, Health Information, Statistics, Research & Evaluation Bureau, Research & Epidemiology Program
Teen Birth Rates by EOHHS Region Massachusetts: 2005
Teen birth rates are number of births to women ages 15-19 per 1000 females ages 15-19.
48
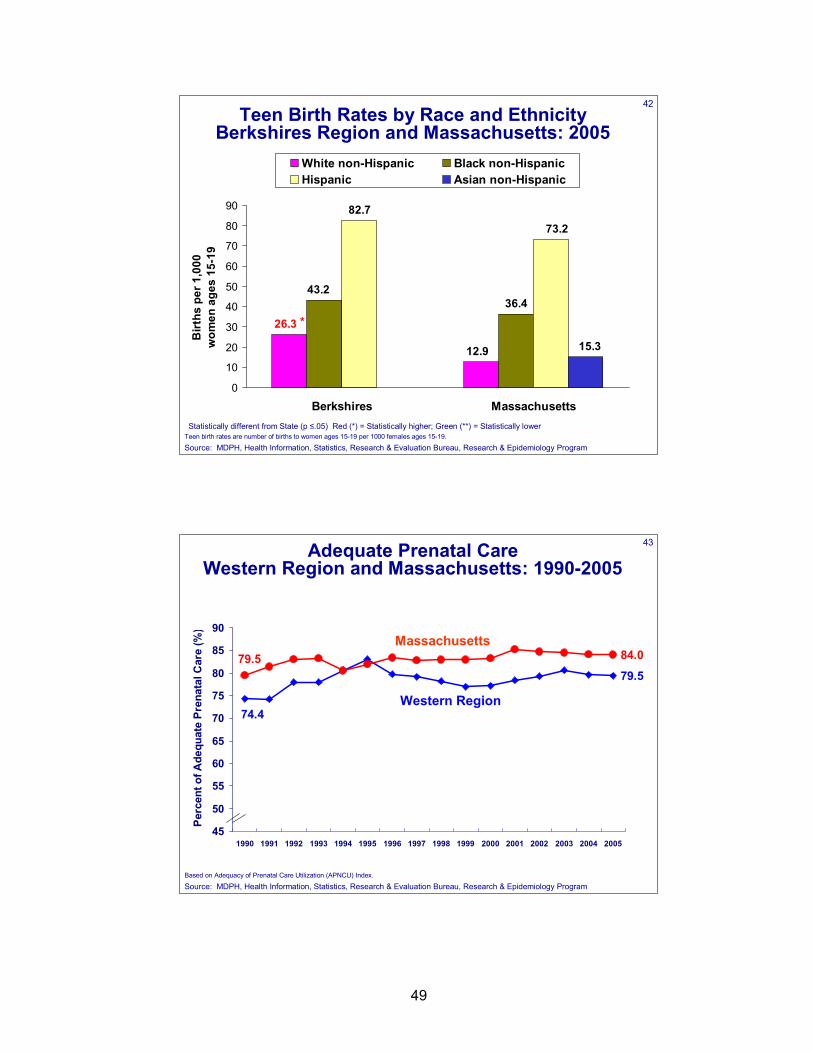
40
PITTSFIELD52.7
MONTAGUE52.3
SPRINGFIELD71.6
HOLYOKE96.8
CHICOPEE41.4
NORTH ADAMS49.5
Teen Birth Rates by Towns*West Region Births 2005
Town Teen Birth Rateper 1000 15-19 Female Population
Significantly higher than state rateNot different from state rateSignificantly lower than state rate
*Towns with less than 100 births were excluded.
Source: MDPH, Health Information, Statistics, Research & Evaluation Bureau, Research & Epidemiology Program
Teen Birth Rates by City/Town* Western Region: 2005
Teen birth rates are number of births to women ages 15-19 per 1000 females ages 15-19.
Highest Holyoke: 96.8
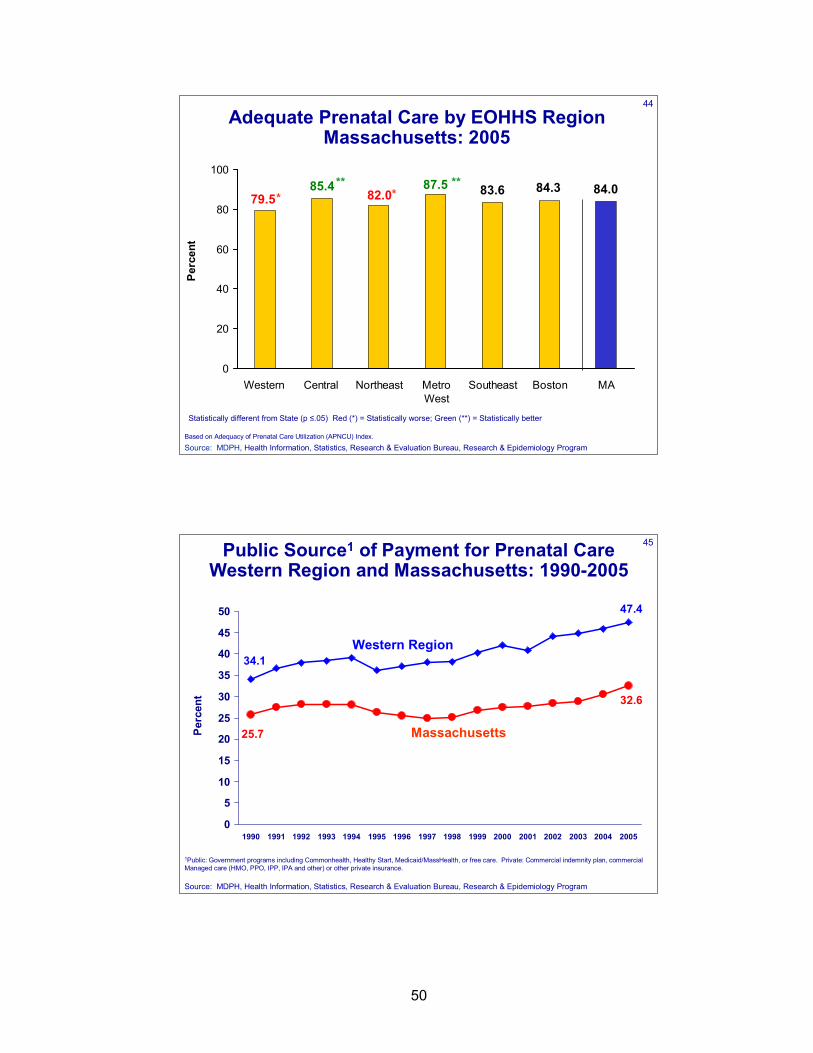
41Teen Birth Rates by Race and Ethnicity
Western Region and Massachusetts: 2005
36.4
12.916.0
46.6
107.7
73.2
15.312.1
0
20
40
60
80
100
120
Western Region Massachusetts
Birt
hs p
er 1
,000
w
omen
age
s 15
-19
White non-Hispanic Black non-HispanicHispanic Asian non-Hispanic
Source: MDPH, Health Information, Statistics, Research & Evaluation Bureau, Research & Epidemiology Program
*
*
Teen birth rates are number of births to women ages 15-19 per 1000 females ages 15-19.Statistically different from State (p ≤.05) Red (*) = Statistically higher; Green (**) = Statistically lower
49
42Teen Birth Rates by Race and Ethnicity
Berkshires Region and Massachusetts: 2005
36.4
12.9
26.3
43.2
82.773.2
15.3
0
10
20
30
40
50
60
70
80
90
Berkshires Massachusetts
Birt
hs p
er 1
,000
w
omen
age
s 15
-19
White non-Hispanic Black non-HispanicHispanic Asian non-Hispanic
Source: MDPH, Health Information, Statistics, Research & Evaluation Bureau, Research & Epidemiology Program
*
Teen birth rates are number of births to women ages 15-19 per 1000 females ages 15-19.Statistically different from State (p ≤.05) Red (*) = Statistically higher; Green (**) = Statistically lower
43
79.5
74.4
84.079.5
45
50
55
60
65
70
75
80
85
90
1990 1991 1992 1993 1994 1995 1996 1997 1998 1999 2000 2001 2002 2003 2004 2005
Perc
ent o
f Ade
quat
e Pr
enat
al C
are
(%)
Adequate Prenatal Care Western Region and Massachusetts: 1990-2005
Massachusetts
Western Region
Source: MDPH, Health Information, Statistics, Research & Evaluation Bureau, Research & Epidemiology ProgramBased on Adequacy of Prenatal Care Utilization (APNCU) Index.
50
44
Adequate Prenatal Care by EOHHS Region Massachusetts: 2005
83.6 84.087.582.079.5
85.4 84.3
0
20
40
60
80
100
Western Central Northeast MetroWest
Southeast Boston MA
Perc
ent
Source: MDPH, Health Information, Statistics, Research & Evaluation Bureau, Research & Epidemiology Program
***
***
Based on Adequacy of Prenatal Care Utilization (APNCU) Index.
Statistically different from State (p ≤.05) Red (*) = Statistically worse; Green (**) = Statistically better
45
47.4
34.1
32.6
25.7
0
5
10
15
20
25
30
35
40
45
50
1990 1991 1992 1993 1994 1995 1996 1997 1998 1999 2000 2001 2002 2003 2004 2005
Perc
ent
Public Source1 of Payment for Prenatal CareWestern Region and Massachusetts: 1990-2005
Western Region
Massachusetts
Source: MDPH, Health Information, Statistics, Research & Evaluation Bureau, Research & Epidemiology Program
1Public: Government programs including Commonhealth, Healthy Start, Medicaid/MassHealth, or free care. Private: Commercial indemnity plan, commercial Managed care (HMO, PPO, IPP, IPA and other) or other private insurance.
51
46
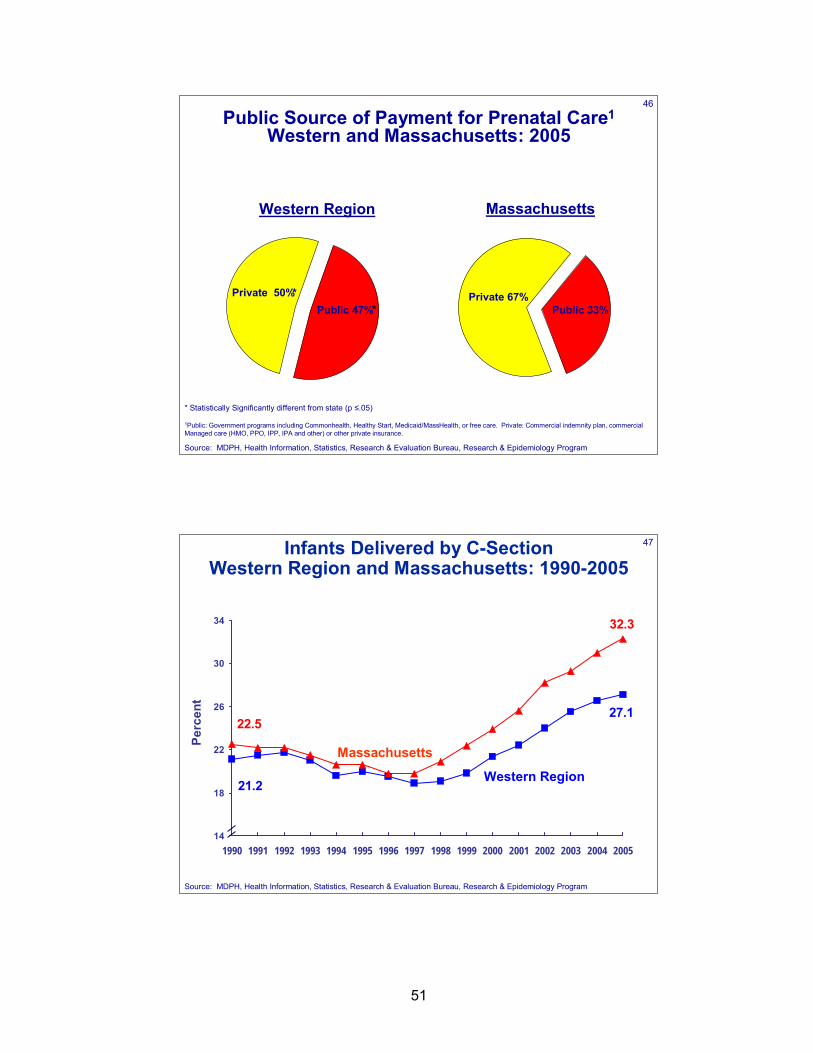
Public Source of Payment for Prenatal Care1
Western and Massachusetts: 2005
Private 50%Public 47%
Western Region Massachusetts
Public 33%Private 67%
Source: MDPH, Health Information, Statistics, Research & Evaluation Bureau, Research & Epidemiology Program
**
* Statistically Significantly different from state (p ≤.05)
1Public: Government programs including Commonhealth, Healthy Start, Medicaid/MassHealth, or free care. Private: Commercial indemnity plan, commercial Managed care (HMO, PPO, IPP, IPA and other) or other private insurance.
47
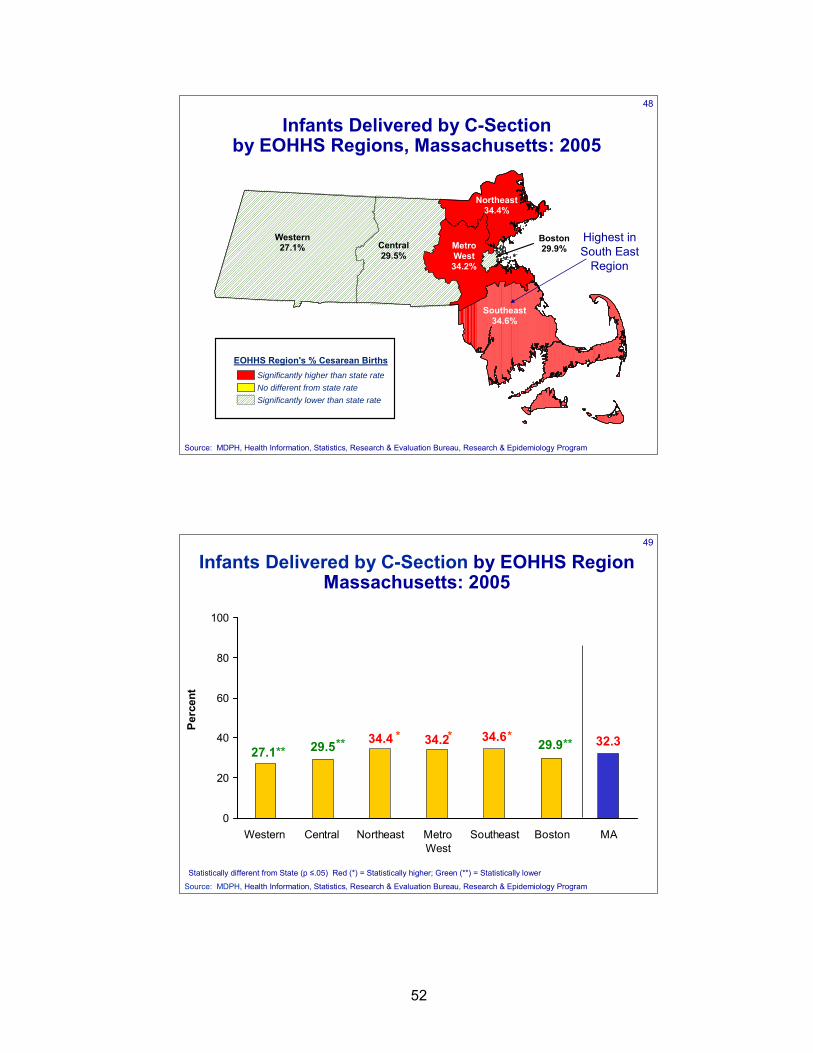
27.1
21.2
32.3
22.5
14
18
22
26
30
34
1990 1991 1992 1993 1994 1995 1996 1997 1998 1999 2000 2001 2002 2003 2004 2005
Perc
ent
Infants Delivered by C-Section Western Region and Massachusetts: 1990-2005
Massachusetts
Source: MDPH, Health Information, Statistics, Research & Evaluation Bureau, Research & Epidemiology Program
Western Region
52
48
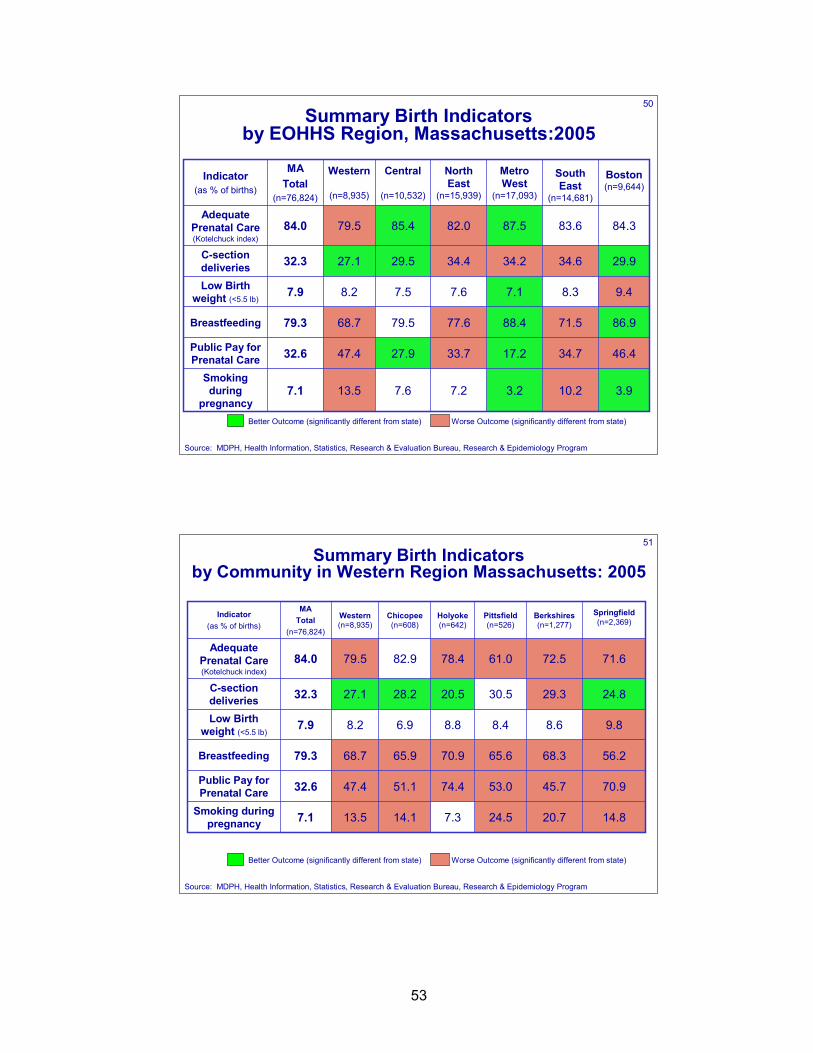
Central29.5%
Southeast34.6%
Northeast34.4%
Western27.1%
Boston29.9%Metro
West34.2%
Percentage of Cesarean Births by Executive Office of Health and Human Service(EOHHS) Regions, Massachusetts Births 2005
EOHHS Region's % Cesarean BirthsSignificantly higher than state rateNo different from state rateSignificantly lower than state rate
Highest in South East
Region
Source: MDPH, Health Information, Statistics, Research & Evaluation Bureau, Research & Epidemiology Program
Infants Delivered by C-Section by EOHHS Regions, Massachusetts: 2005
49
Infants Delivered by C-Section by EOHHS Region Massachusetts: 2005
34.6 32.334.234.427.1 29.5 29.9
0
20
40
60
80
100
Western Central Northeast MetroWest
Southeast Boston MA
Perc
ent
Source: MDPH, Health Information, Statistics, Research & Evaluation Bureau, Research & Epidemiology Program
***** * ***
Statistically different from State (p ≤.05) Red (*) = Statistically higher; Green (**) = Statistically lower
53
50
13.5
47.4
68.7
8.2
27.1
79.5
Western
(n=8,935)
10.2
34.7
71.5
8.3
34.6
83.6
South East
(n=14,681)
3.93.27.27.67.1Smoking during
pregnancy
46.417.233.727.932.6Public Pay for Prenatal Care
86.988.477.679.579.3Breastfeeding
9.47.17.67.57.9Low Birth weight (<5.5 lb)
29.934.234.429.532.3C-section deliveries
84.387.582.085.484.0Adequate
Prenatal Care (Kotelchuck index)
Boston (n=9,644)
Metro West
(n=17,093)
North East
(n=15,939)
Central
(n=10,532)
MATotal
(n=76,824)
Indicator (as % of births)
Summary Birth Indicators by EOHHS Region, Massachusetts:2005
Source: MDPH, Health Information, Statistics, Research & Evaluation Bureau, Research & Epidemiology Program
Better Outcome (significantly different from state) Worse Outcome (significantly different from state)
51
20.7
45.7
68.3
8.6
29.3
72.5
Berkshires(n=1,277)
13.5
47.4
68.7
8.2
27.1
79.5
Western(n=8,935)
14.8
70.9
56.2
9.8
24.8
71.6
Springfield (n=2,369)
24.57.314.17.1Smoking during pregnancy
53.074.451.132.6Public Pay for Prenatal Care
65.670.965.979.3Breastfeeding
8.48.86.97.9Low Birth weight (<5.5 lb)
30.520.528.232.3C-section deliveries
61.078.482.984.0Adequate
Prenatal Care (Kotelchuck index)
Pittsfield (n=526)
Holyoke (n=642)
Chicopee (n=608)
MATotal
(n=76,824)
Indicator (as % of births)
Summary Birth Indicators by Community in Western Region Massachusetts: 2005
Source: MDPH, Health Information, Statistics, Research & Evaluation Bureau, Research & Epidemiology Program
Better Outcome (significantly different from state) Worse Outcome (significantly different from state)
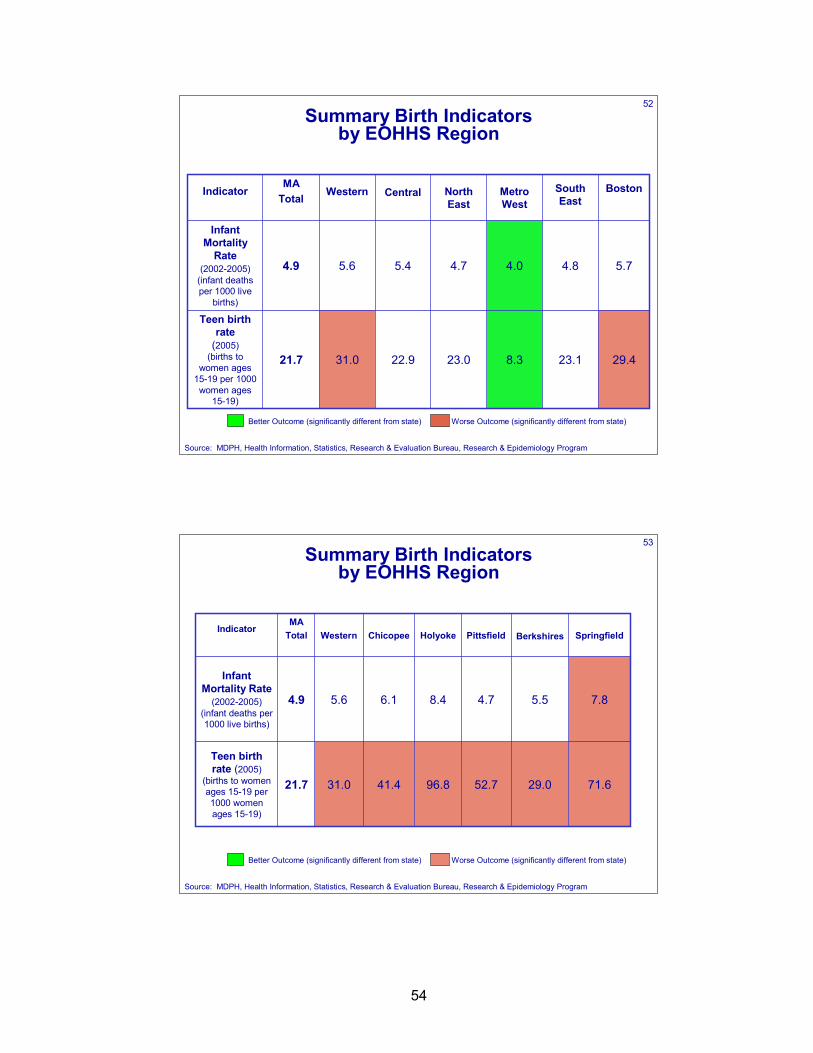
54
52Summary Birth Indicators
by EOHHS Region
Source: MDPH, Health Information, Statistics, Research & Evaluation Bureau, Research & Epidemiology Program
Better Outcome (significantly different from state) Worse Outcome (significantly different from state)
31.0
5.6
Western
23.1
4.8
South East
29.48.323.022.921.7
Teen birth rate
(2005)(births to
women ages 15-19 per 1000 women ages
15-19)
5.74.04.75.44.9
Infant Mortality
Rate (2002-2005)
(infant deaths per 1000 live
births)
BostonMetro West
North East
CentralMA
Total Indicator
53Summary Birth Indicators
by EOHHS Region
Source: MDPH, Health Information, Statistics, Research & Evaluation Bureau, Research & Epidemiology Program
Better Outcome (significantly different from state) Worse Outcome (significantly different from state)
29.0
5.5
Berkshires
31.0
5.6
Western
71.6
7.8
Springfield
52.796.841.421.7
Teen birth rate (2005)
(births to women ages 15-19 per 1000 women ages 15-19)
4.78.46.14.9
Infant Mortality Rate
(2002-2005)(infant deaths per 1000 live births)
PittsfieldHolyokeChicopeeMA
Total Indicator
55
LEADING CAUSES OF DEATH

56
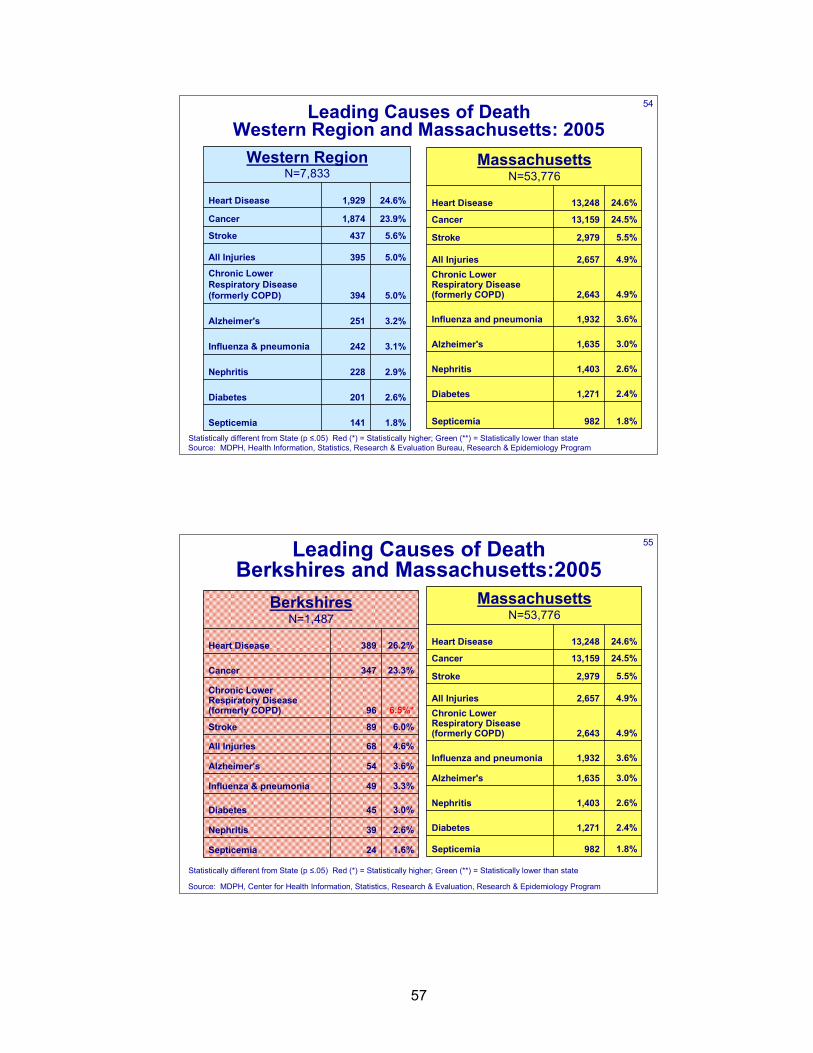
57
54Leading Causes of DeathWestern Region and Massachusetts: 2005
Source: MDPH, Health Information, Statistics, Research & Evaluation Bureau, Research & Epidemiology Program
MassachusettsN=53,776
1.8%982 Septicemia
2.4%1,271 Diabetes
2.6%1,403 Nephritis
3.0%1,635 Alzheimer's
3.6%1,932 Influenza and pneumonia
4.9%2,643
Chronic Lower Respiratory Disease (formerly COPD)
4.9%2,657All Injuries
5.5%2,979 Stroke
24.5%13,159 Cancer
24.6%13,248 Heart Disease
5.0%394
Chronic Lower Respiratory Disease (formerly COPD)
Western RegionN=7,833
1.8%141Septicemia
2.6%201Diabetes
2.9%228Nephritis
3.1%242Influenza & pneumonia
3.2%251Alzheimer's
5.0%395All Injuries
5.6%437Stroke
23.9%1,874Cancer
24.6%1,929Heart Disease
Statistically different from State (p ≤.05) Red (*) = Statistically higher; Green (**) = Statistically lower than state
55Leading Causes of DeathBerkshires and Massachusetts:2005
Source: MDPH, Center for Health Information, Statistics, Research & Evaluation, Research & Epidemiology Program
BerkshiresN=1,487
1.6%24 Septicemia
2.6%39 Nephritis
3.0%45 Diabetes
3.3%49 Influenza & pneumonia
3.6%54 Alzheimer's
4.6%68 All Injuries
6.0%89Stroke
6.5%*96
Chronic Lower Respiratory Disease (formerly COPD)
23.3%347 Cancer
26.2%389 Heart Disease
Statistically different from State (p ≤.05) Red (*) = Statistically higher; Green (**) = Statistically lower than state
MassachusettsN=53,776
1.8%982 Septicemia
2.4%1,271 Diabetes
2.6%1,403 Nephritis
3.0%1,635 Alzheimer's
3.6%1,932 Influenza and pneumonia
4.9%2,643
Chronic Lower Respiratory Disease (formerly COPD)
4.9%2,657All Injuries
5.5%2,979 Stroke
24.5%13,159 Cancer
24.6%13,248 Heart Disease

58
59
CHRONIC DISEASE OUTCOMES AND OVERWEIGHT/OBESITY

60
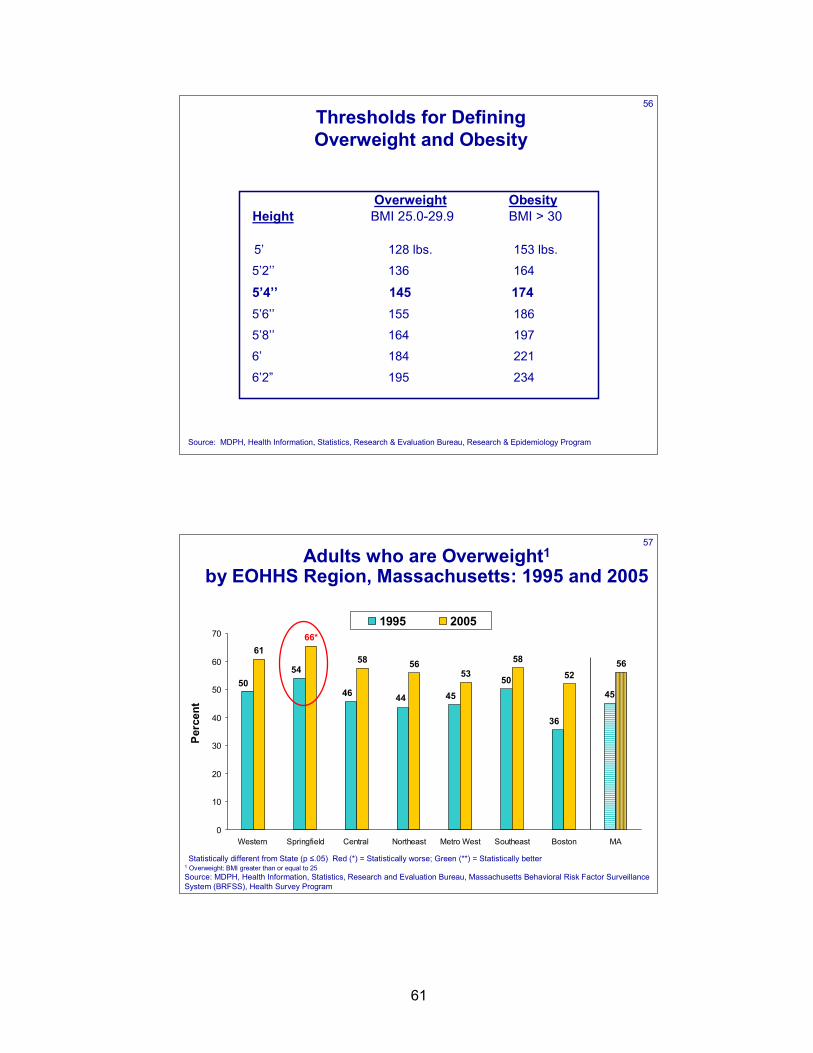
61
56
Overweight ObesityHeight BMI 25.0-29.9 BMI > 30
5’ 128 lbs. 153 lbs.
5’2’’ 136 164
5’4’’ 145 1745’6’’ 155 186
5’8’’ 164 197
6’ 184 221
6’2” 195 234
Source: MDPH, Health Information, Statistics, Research & Evaluation Bureau, Research & Epidemiology Program
Thresholds for DefiningOverweight and Obesity
57
Adults who are Overweight1
by EOHHS Region, Massachusetts: 1995 and 2005
5045
6158 56
5358
5256
5054
46 44 45
36
66*
0
10
20
30
40
50
60
70
Western Springfield Central Northeast Metro West Southeast Boston MA
Perc
ent
1995 2005
Source: MDPH, Health Information, Statistics, Research and Evaluation Bureau, Massachusetts Behavioral Risk Factor Surveillance System (BRFSS), Health Survey Program
1 Overweight: BMI greater than or equal to 25Statistically different from State (p ≤.05) Red (*) = Statistically worse; Green (**) = Statistically better
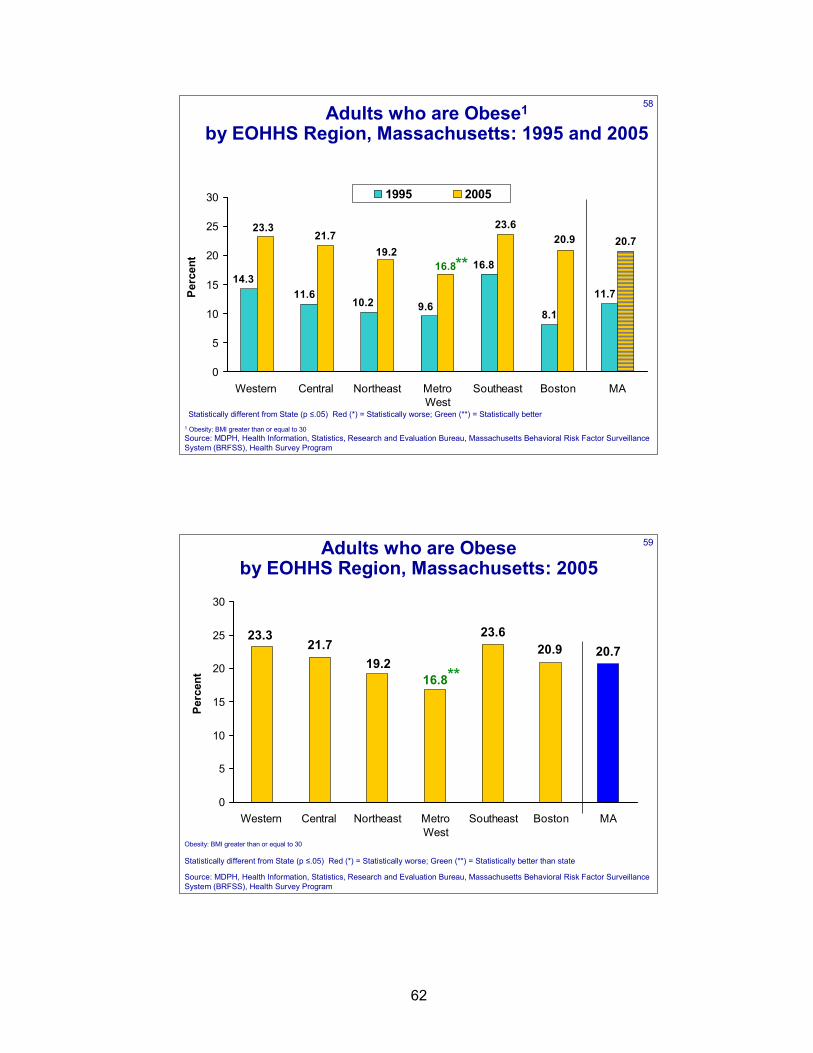
62
58Adults who are Obese1
by EOHHS Region, Massachusetts: 1995 and 2005
23.6
11.7
8.1
16.8
9.610.211.6
14.3
20.7
16.819.2
23.321.7 20.9
0
5
10
15
20
25
30
Western Central Northeast MetroWest
Southeast Boston MA
Perc
ent
1995 2005
**
1 Obesity: BMI greater than or equal to 30Source: MDPH, Health Information, Statistics, Research and Evaluation Bureau, Massachusetts Behavioral Risk Factor Surveillance System (BRFSS), Health Survey Program
Statistically different from State (p ≤.05) Red (*) = Statistically worse; Green (**) = Statistically better
59Adults who are Obese by EOHHS Region, Massachusetts: 2005
23.620.7
16.819.2
23.321.7 20.9
0
5
10
15
20
25
30
Western Central Northeast MetroWest
Southeast Boston MA
Perc
ent **
Obesity: BMI greater than or equal to 30
Statistically different from State (p ≤.05) Red (*) = Statistically worse; Green (**) = Statistically better than state
Source: MDPH, Health Information, Statistics, Research and Evaluation Bureau, Massachusetts Behavioral Risk Factor Surveillance System (BRFSS), Health Survey Program
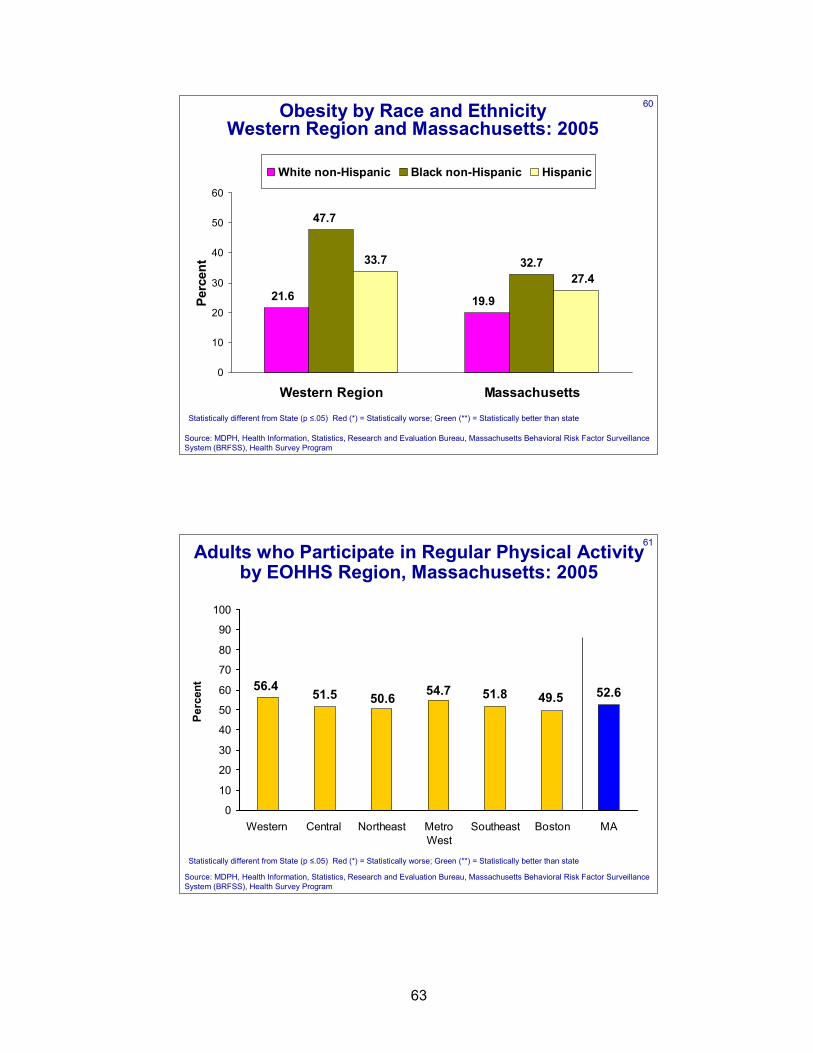
63
60Obesity by Race and Ethnicity Western Region and Massachusetts: 2005
32.7
19.921.6
47.7
33.727.4
0
10
20
30
40
50
60
Western Region Massachusetts
Perc
ent
White non-Hispanic Black non-Hispanic Hispanic
Statistically different from State (p ≤.05) Red (*) = Statistically worse; Green (**) = Statistically better than state
Source: MDPH, Health Information, Statistics, Research and Evaluation Bureau, Massachusetts Behavioral Risk Factor Surveillance System (BRFSS), Health Survey Program
61Adults who Participate in Regular Physical Activity by EOHHS Region, Massachusetts: 2005
51.8 52.654.750.656.4 51.5 49.5
0
10
20
30
40
50
60
70
80
90
100
Western Central Northeast MetroWest
Southeast Boston MA
Perc
ent
Statistically different from State (p ≤.05) Red (*) = Statistically worse; Green (**) = Statistically better than state
Source: MDPH, Health Information, Statistics, Research and Evaluation Bureau, Massachusetts Behavioral Risk Factor Surveillance System (BRFSS), Health Survey Program
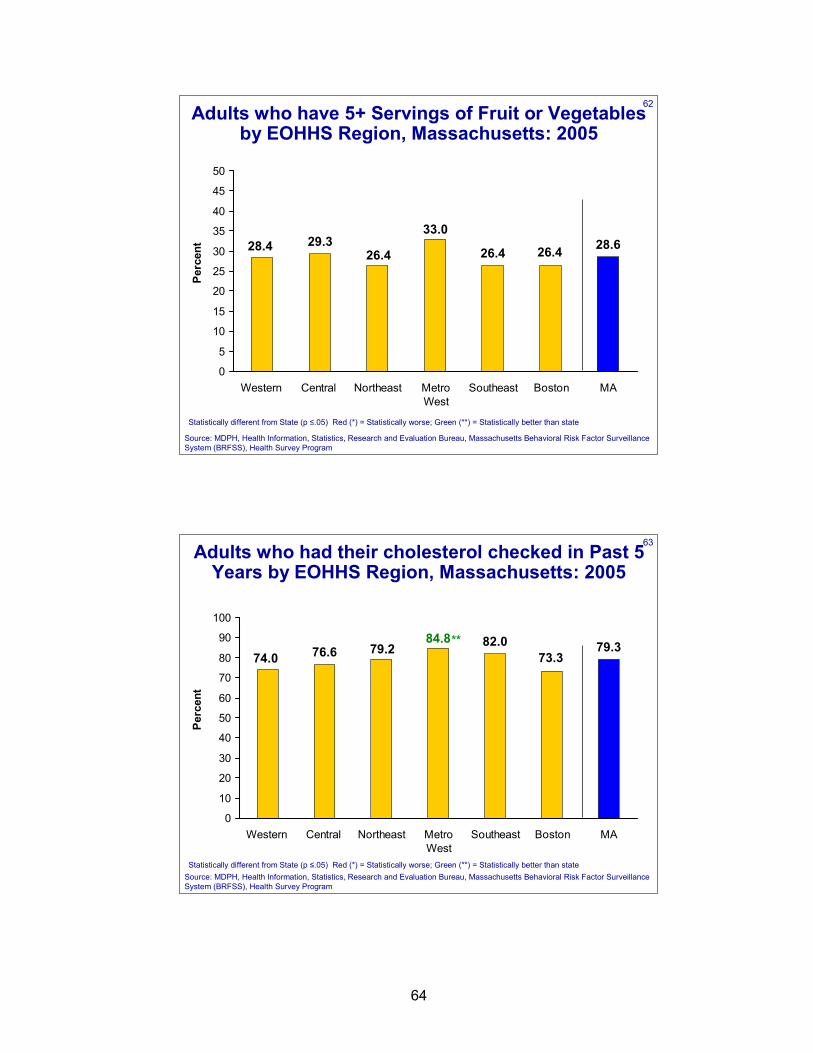
64
62Adults who have 5+ Servings of Fruit or Vegetables by EOHHS Region, Massachusetts: 2005
26.4 28.633.0
26.428.4 29.3
26.4
0
5
10
15
20
25
30
35
40
45
50
Western Central Northeast MetroWest
Southeast Boston MA
Perc
ent
Statistically different from State (p ≤.05) Red (*) = Statistically worse; Green (**) = Statistically better than state
Source: MDPH, Health Information, Statistics, Research and Evaluation Bureau, Massachusetts Behavioral Risk Factor Surveillance System (BRFSS), Health Survey Program
63Adults who had their cholesterol checked in Past 5 Years by EOHHS Region, Massachusetts: 2005
82.0 79.384.879.2
74.0 76.6 73.3
0
10
20
30
40
50
60
70
80
90
100
Western Central Northeast MetroWest
Southeast Boston MA
Perc
ent
**
Statistically different from State (p ≤.05) Red (*) = Statistically worse; Green (**) = Statistically better than stateSource: MDPH, Health Information, Statistics, Research and Evaluation Bureau, Massachusetts Behavioral Risk Factor Surveillance System (BRFSS), Health Survey Program
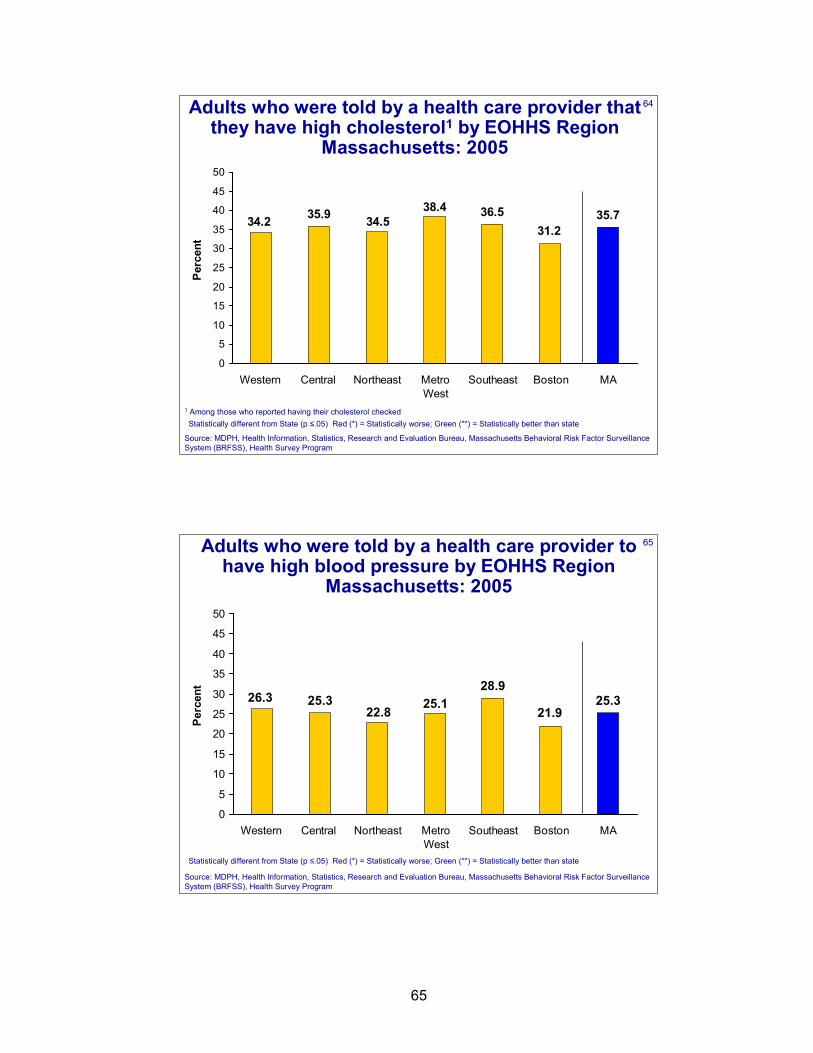
65
64Adults who were told by a health care provider that they have high cholesterol1 by EOHHS Region
Massachusetts: 2005
36.5 35.738.434.534.2 35.9
31.2
0
5
10
15
20
25
30
35
40
45
50
Western Central Northeast MetroWest
Southeast Boston MA
Perc
ent
1 Among those who reported having their cholesterol checkedStatistically different from State (p ≤.05) Red (*) = Statistically worse; Green (**) = Statistically better than state
Source: MDPH, Health Information, Statistics, Research and Evaluation Bureau, Massachusetts Behavioral Risk Factor Surveillance System (BRFSS), Health Survey Program
65Adults who were told by a health care provider to have high blood pressure by EOHHS Region
Massachusetts: 2005
28.925.325.122.8
26.3 25.321.9
0
5
10
15
20
25
30
35
40
45
50
Western Central Northeast MetroWest
Southeast Boston MA
Perc
ent
Statistically different from State (p ≤.05) Red (*) = Statistically worse; Green (**) = Statistically better than state
Source: MDPH, Health Information, Statistics, Research and Evaluation Bureau, Massachusetts Behavioral Risk Factor Surveillance System (BRFSS), Health Survey Program
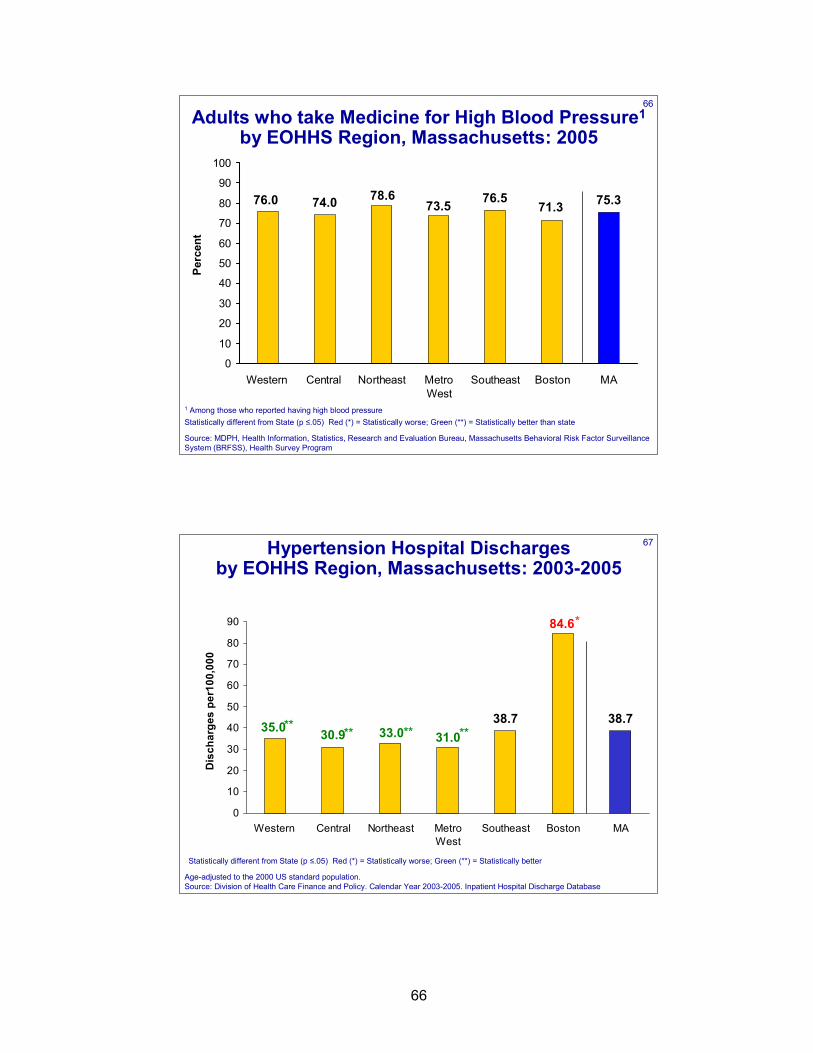
66
66
Adults who take Medicine for High Blood Pressure1
by EOHHS Region, Massachusetts: 2005
76.5 75.373.578.676.0 74.0 71.3
0
10
20
30
40
50
60
70
80
90
100
Western Central Northeast MetroWest
Southeast Boston MA
Perc
ent
1 Among those who reported having high blood pressureStatistically different from State (p ≤.05) Red (*) = Statistically worse; Green (**) = Statistically better than state
Source: MDPH, Health Information, Statistics, Research and Evaluation Bureau, Massachusetts Behavioral Risk Factor Surveillance System (BRFSS), Health Survey Program
67Hypertension Hospital Discharges by EOHHS Region, Massachusetts: 2003-2005
38.738.731.033.035.0 30.9
84.6
0
10
20
30
40
50
60
70
80
90
Western Central Northeast MetroWest
Southeast Boston MA
Dis
char
ges
per1
00,0
00
Age-adjusted to the 2000 US standard population. Source: Division of Health Care Finance and Policy. Calendar Year 2003-2005. Inpatient Hospital Discharge Database
*
** ** ****
Statistically different from State (p ≤.05) Red (*) = Statistically worse; Green (**) = Statistically better
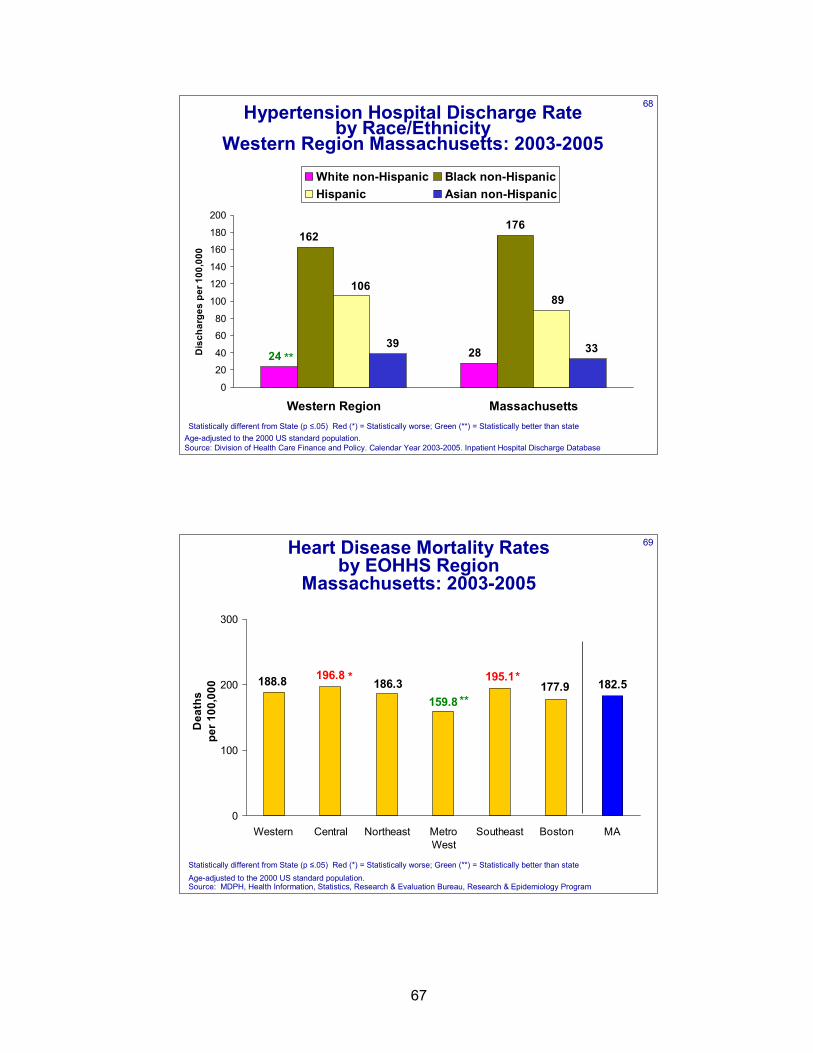
67
68Hypertension Hospital Discharge Rate by Race/Ethnicity
Western Region Massachusetts: 2003-2005
176
2824
162
10689
3339
0
20
40
60
80
100
120
140
160
180
200
Western Region Massachusetts
Dis
char
ges
per 1
00,0
00
White non-Hispanic Black non-HispanicHispanic Asian non-Hispanic
Age-adjusted to the 2000 US standard population. Source: Division of Health Care Finance and Policy. Calendar Year 2003-2005. Inpatient Hospital Discharge Database
**
Statistically different from State (p ≤.05) Red (*) = Statistically worse; Green (**) = Statistically better than state
69Heart Disease Mortality Ratesby EOHHS Region
Massachusetts: 2003-2005
182.5195.1
159.8186.3188.8 196.8
177.9
0
100
200
300
Western Central Northeast MetroWest
Southeast Boston MA
Dea
ths
per 1
00,0
00
Age-adjusted to the 2000 US standard population. Source: MDPH, Health Information, Statistics, Research & Evaluation Bureau, Research & Epidemiology Program
*
**
*
Statistically different from State (p ≤.05) Red (*) = Statistically worse; Green (**) = Statistically better than state
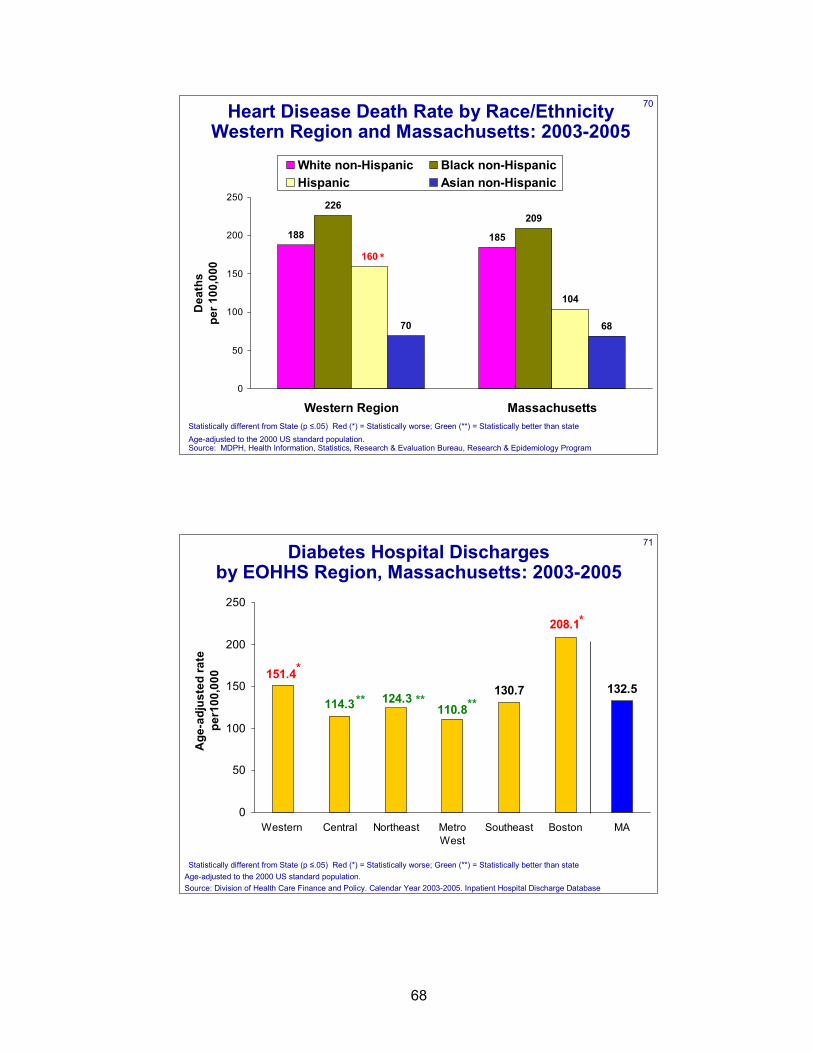
68
70Heart Disease Death Rate by Race/EthnicityWestern Region and Massachusetts: 2003-2005
188 185
226209
104
70 68
160
0
50
100
150
200
250
Western Region Massachusetts
Dea
ths
per 1
00,0
00
White non-Hispanic Black non-HispanicHispanic Asian non-Hispanic
Age-adjusted to the 2000 US standard population. Source: MDPH, Health Information, Statistics, Research & Evaluation Bureau, Research & Epidemiology Program
*
Statistically different from State (p ≤.05) Red (*) = Statistically worse; Green (**) = Statistically better than state
71Diabetes Hospital Discharges by EOHHS Region, Massachusetts: 2003-2005
130.7 132.5110.8
124.3
151.4
114.3
208.1
0
50
100
150
200
250
Western Central Northeast MetroWest
Southeast Boston MA
Age
-adj
uste
d ra
tepe
r100
,000
Age-adjusted to the 2000 US standard population.Source: Division of Health Care Finance and Policy. Calendar Year 2003-2005. Inpatient Hospital Discharge Database
*
** ** **
*
Statistically different from State (p ≤.05) Red (*) = Statistically worse; Green (**) = Statistically better than state
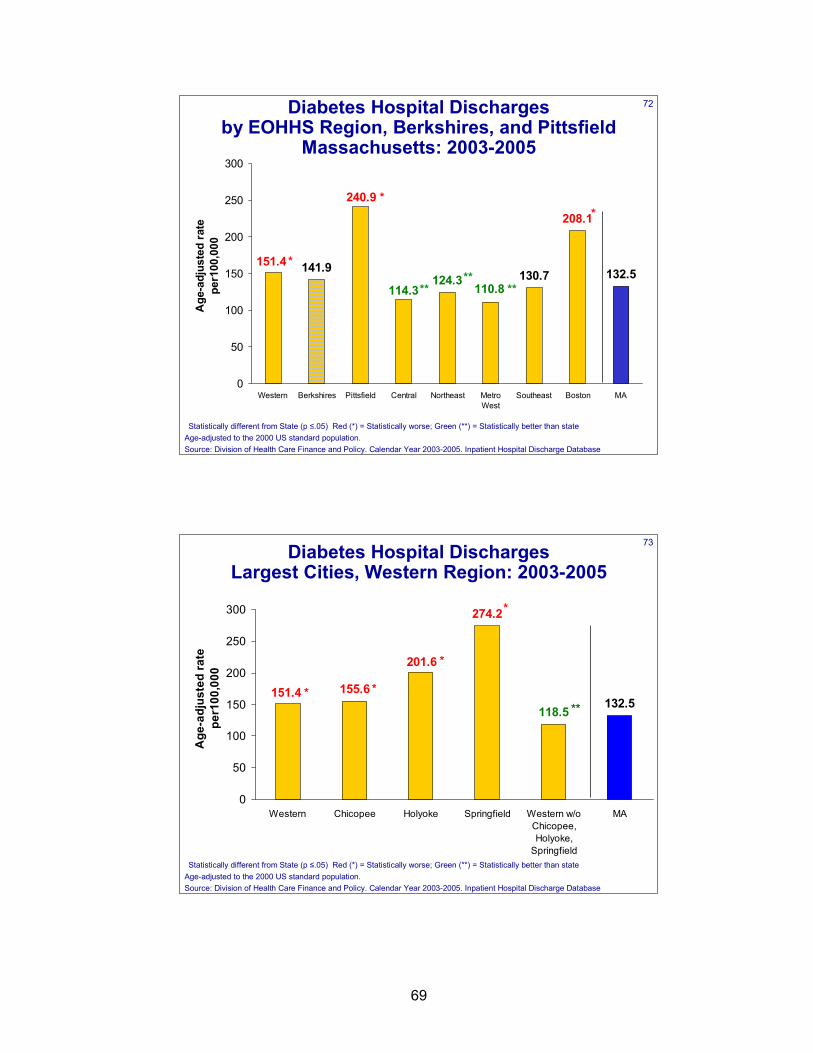
69
72Diabetes Hospital Discharges by EOHHS Region, Berkshires, and Pittsfield
Massachusetts: 2003-2005
132.5
208.1
124.3 130.7114.3
240.9
151.4 141.9
110.8
0
50
100
150
200
250
300
Western Berkshires Pittsfield Central Northeast MetroWest
Southeast Boston MA
Age
-adj
uste
d ra
tepe
r100
,000
Age-adjusted to the 2000 US standard population.Source: Division of Health Care Finance and Policy. Calendar Year 2003-2005. Inpatient Hospital Discharge Database
*
****
**
*
Statistically different from State (p ≤.05) Red (*) = Statistically worse; Green (**) = Statistically better than state
*
73Diabetes Hospital Discharges Largest Cities, Western Region: 2003-2005
118.5
274.2
201.6
151.4 155.6132.5
0
50
100
150
200
250
300
Western Chicopee Holyoke Springfield Western w/oChicopee,Holyoke,
Springfield
MA
Age
-adj
uste
d ra
tepe
r100
,000
Age-adjusted to the 2000 US standard population.Source: Division of Health Care Finance and Policy. Calendar Year 2003-2005. Inpatient Hospital Discharge Database
*
Statistically different from State (p ≤.05) Red (*) = Statistically worse; Green (**) = Statistically better than state
***
*
*
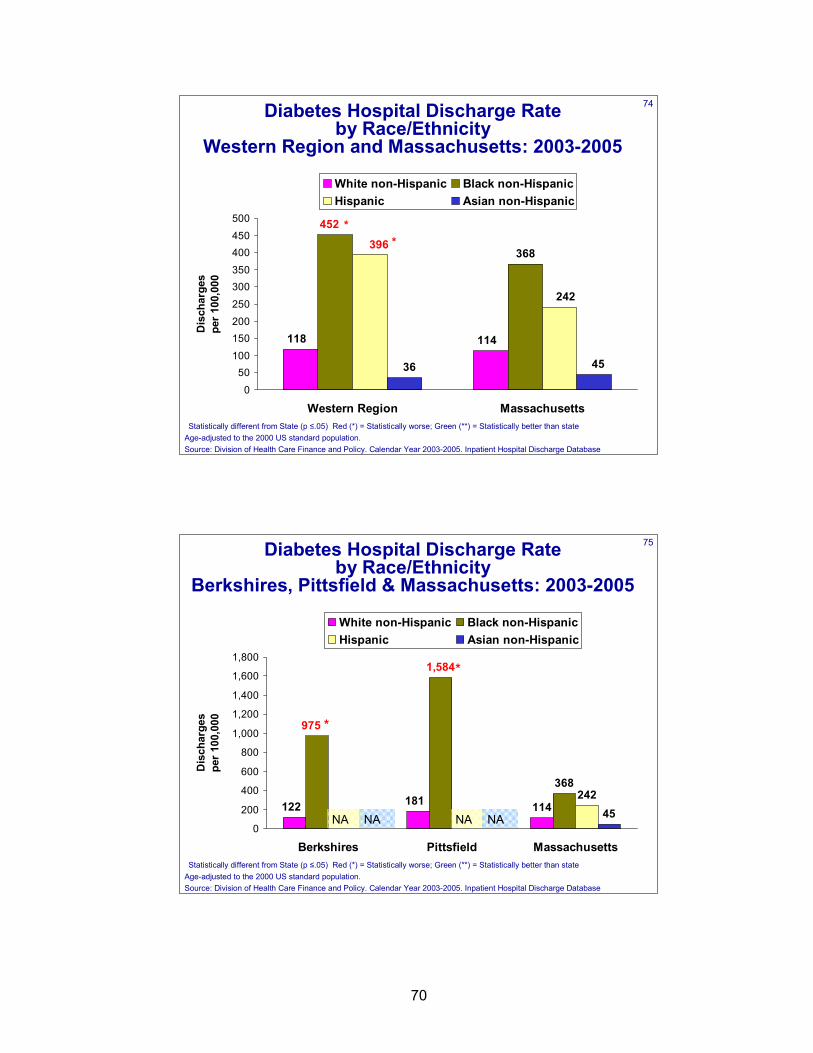
70
74Diabetes Hospital Discharge Rate by Race/Ethnicity
Western Region and Massachusetts: 2003-2005
368
114118
452
396
242
4536
0
50100150200250
300350400450500
Western Region Massachusetts
Dis
char
ges
per 1
00,0
00
White non-Hispanic Black non-HispanicHispanic Asian non-Hispanic
Age-adjusted to the 2000 US standard population.Source: Division of Health Care Finance and Policy. Calendar Year 2003-2005. Inpatient Hospital Discharge Database
**
Statistically different from State (p ≤.05) Red (*) = Statistically worse; Green (**) = Statistically better than state
75Diabetes Hospital Discharge Rate by Race/Ethnicity
Berkshires, Pittsfield & Massachusetts: 2003-2005
114
368242
45181122
1,584
975
0
200
400
600
800
1,000
1,200
1,400
1,600
1,800
Berkshires Pittsfield Massachusetts
Dis
char
ges
per 1
00,0
00
White non-Hispanic Black non-HispanicHispanic Asian non-Hispanic
Age-adjusted to the 2000 US standard population.Source: Division of Health Care Finance and Policy. Calendar Year 2003-2005. Inpatient Hospital Discharge Database
*
Statistically different from State (p ≤.05) Red (*) = Statistically worse; Green (**) = Statistically better than state
*
NA NA NA NA
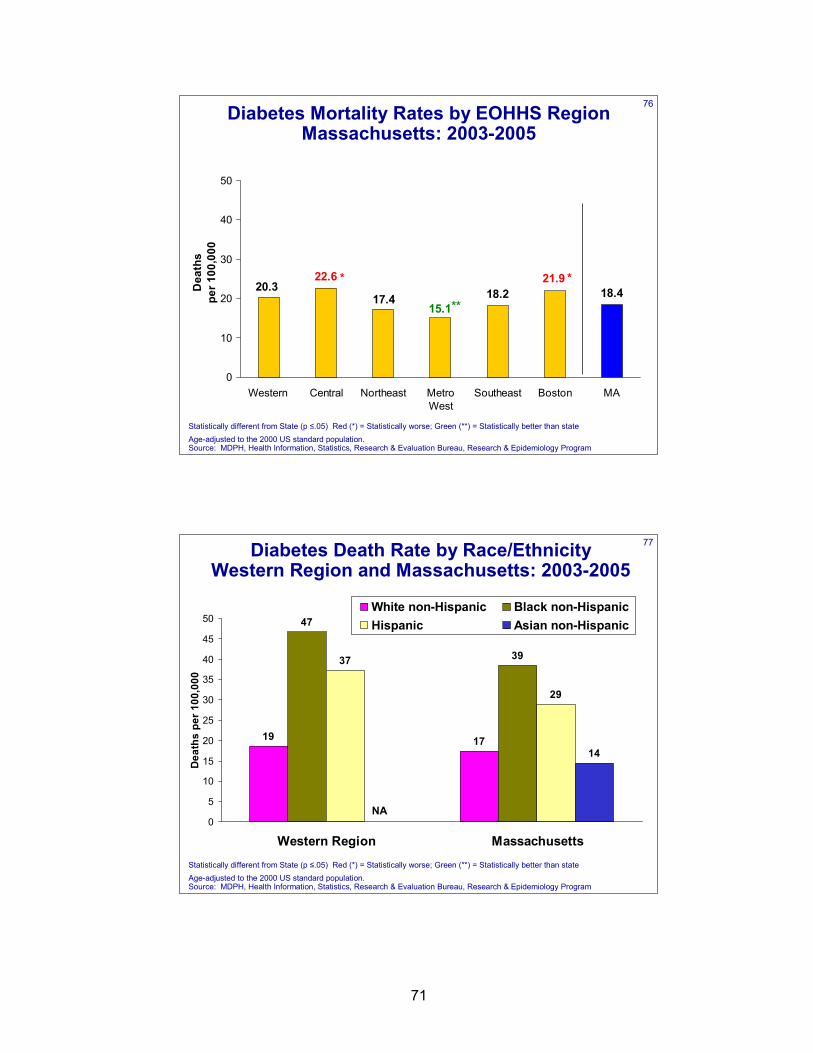
71
76Diabetes Mortality Rates by EOHHS Region Massachusetts: 2003-2005
18.2 18.415.1
17.420.3
22.6 21.9
0
10
20
30
40
50
Western Central Northeast MetroWest
Southeast Boston MA
Dea
ths
per 1
00,0
00
Age-adjusted to the 2000 US standard population. Source: MDPH, Health Information, Statistics, Research & Evaluation Bureau, Research & Epidemiology Program
*
**
*
Statistically different from State (p ≤.05) Red (*) = Statistically worse; Green (**) = Statistically better than state
77Diabetes Death Rate by Race/EthnicityWestern Region and Massachusetts: 2003-2005
19 17
47
3937
29
14
0
5
10
15
20
25
30
35
40
45
50
Western Region Massachusetts
Dea
ths
per 1
00,0
00
White non-Hispanic Black non-HispanicHispanic Asian non-Hispanic
NA
Age-adjusted to the 2000 US standard population. Source: MDPH, Health Information, Statistics, Research & Evaluation Bureau, Research & Epidemiology Program
Statistically different from State (p ≤.05) Red (*) = Statistically worse; Green (**) = Statistically better than state
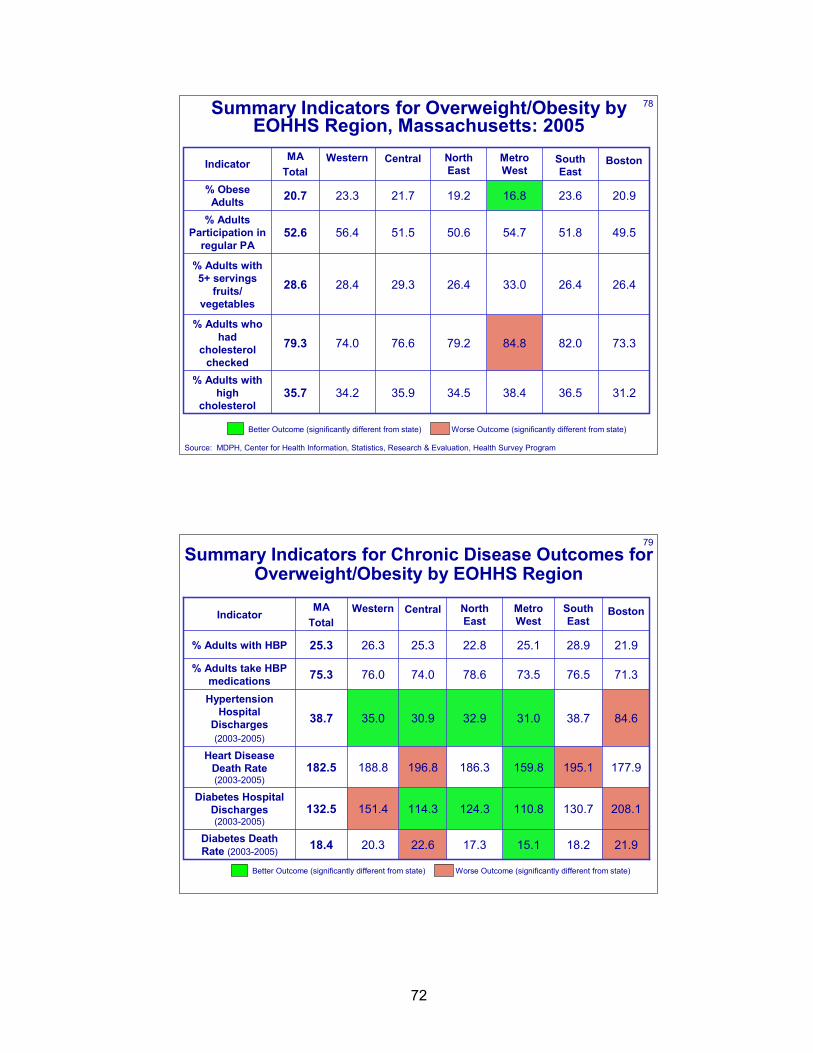
72
78
34.2
74.0
28.4
56.4
23.3
Western
36.5
82.0
26.4
51.8
23.6
South East
31.238.434.535.935.7% Adults with
high cholesterol
73.384.879.276.679.3% Adults who
had cholesterol
checked
26.433.026.429.328.6% Adults with 5+ servings
fruits/ vegetables
49.554.750.651.552.6% Adults
Participation in regular PA
20.916.819.221.720.7% Obese Adults
BostonMetro West
North East
CentralMATotal
Indicator
Summary Indicators for Overweight/Obesity by EOHHS Region, Massachusetts: 2005
Better Outcome (significantly different from state) Worse Outcome (significantly different from state)
Source: MDPH, Center for Health Information, Statistics, Research & Evaluation, Health Survey Program
79
208.1130.7110.8124.3114.3151.4132.5Diabetes Hospital
Discharges (2003-2005)
20.3
188.8
35.0
76.0
26.3
Western
18.2
195.1
38.7
76.5
28.9
South East
21.915.117.322.618.4Diabetes Death Rate (2003-2005)
177.9159.8186.3196.8182.5Heart Disease
Death Rate (2003-2005)
84.631.032.930.938.7Hypertension
Hospital Discharges(2003-2005)
71.373.578.674.075.3% Adults take HBP medications
21.925.122.825.325.3% Adults with HBP
BostonMetro West
North East
CentralMATotal
Indicator
Summary Indicators for Chronic Disease Outcomes for Overweight/Obesity by EOHHS Region
Better Outcome (significantly different from state) Worse Outcome (significantly different from state)
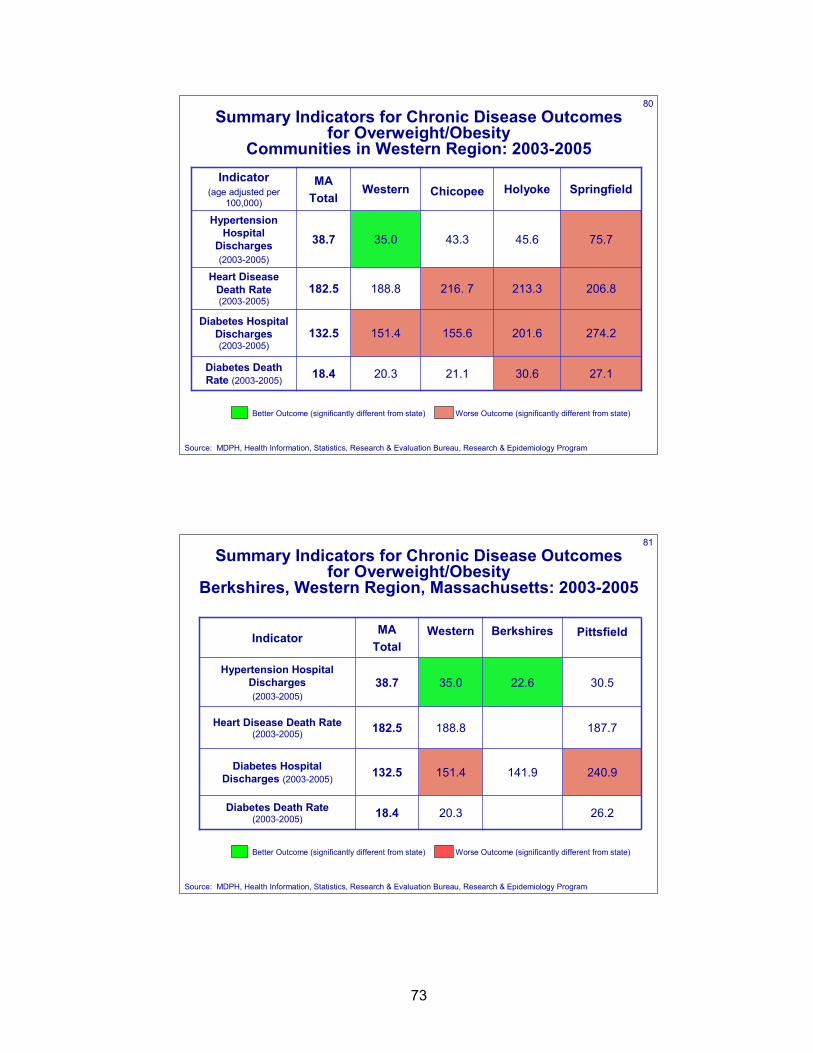
73
80
21.1
155.6
216. 7
43.3
Chicopee
20.3
151.4
188.8
35.0
Western
18.4
132.5
182.5
38.7
MATotal
274.2201.6Diabetes Hospital
Discharges (2003-2005)
27.130.6Diabetes Death Rate (2003-2005)
206.8213.3Heart Disease
Death Rate (2003-2005)
75.745.6Hypertension
Hospital Discharges(2003-2005)
SpringfieldHolyokeIndicator
(age adjusted per 100,000)
Summary Indicators for Chronic Disease Outcomes for Overweight/Obesity
Communities in Western Region: 2003-2005
Source: MDPH, Health Information, Statistics, Research & Evaluation Bureau, Research & Epidemiology Program
Better Outcome (significantly different from state) Worse Outcome (significantly different from state)
81
26.2
240.9
187.7
30.5
Pittsfield
141.9
22.6
Berkshires
151.4132.5Diabetes Hospital Discharges (2003-2005)
20.3
188.8
35.0
Western
18.4Diabetes Death Rate (2003-2005)
182.5Heart Disease Death Rate (2003-2005)
38.7Hypertension Hospital
Discharges(2003-2005)
MATotal
Indicator
Summary Indicators for Chronic Disease Outcomes for Overweight/Obesity
Berkshires, Western Region, Massachusetts: 2003-2005
Source: MDPH, Health Information, Statistics, Research & Evaluation Bureau, Research & Epidemiology Program
Better Outcome (significantly different from state) Worse Outcome (significantly different from state)

74

75
CANCER

76
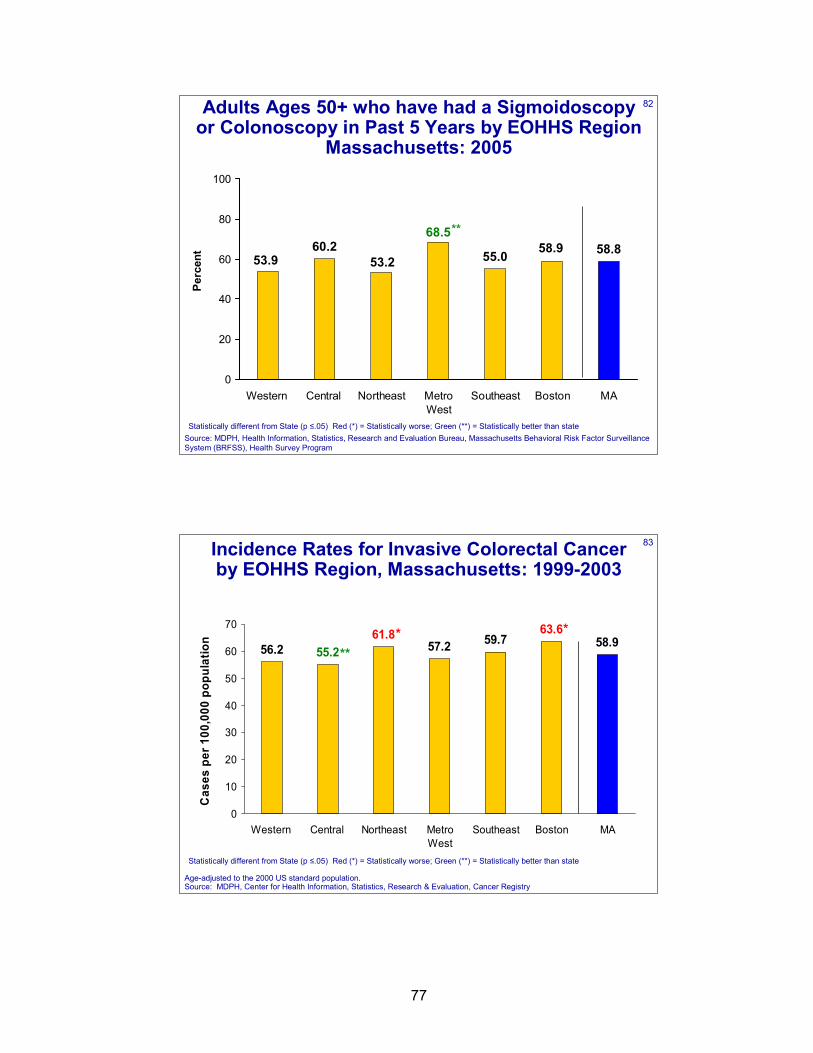
77
82Adults Ages 50+ who have had a Sigmoidoscopy or Colonoscopy in Past 5 Years by EOHHS Region
Massachusetts: 2005
55.0 58.868.5
53.253.960.2 58.9
0
20
40
60
80
100
Western Central Northeast MetroWest
Southeast Boston MA
Perc
ent
**
Statistically different from State (p ≤.05) Red (*) = Statistically worse; Green (**) = Statistically better than stateSource: MDPH, Health Information, Statistics, Research and Evaluation Bureau, Massachusetts Behavioral Risk Factor Surveillance System (BRFSS), Health Survey Program
83Incidence Rates for Invasive Colorectal Cancer by EOHHS Region, Massachusetts: 1999-2003
56.2 58.961.855.2 57.2
63.659.7
0
10
20
30
40
50
60
70
Western Central Northeast MetroWest
Southeast Boston MA
Cas
es p
er 1
00,0
00 p
opul
atio
n
Age-adjusted to the 2000 US standard population. Source: MDPH, Center for Health Information, Statistics, Research & Evaluation, Cancer Registry
**
*
Statistically different from State (p ≤.05) Red (*) = Statistically worse; Green (**) = Statistically better than state
*
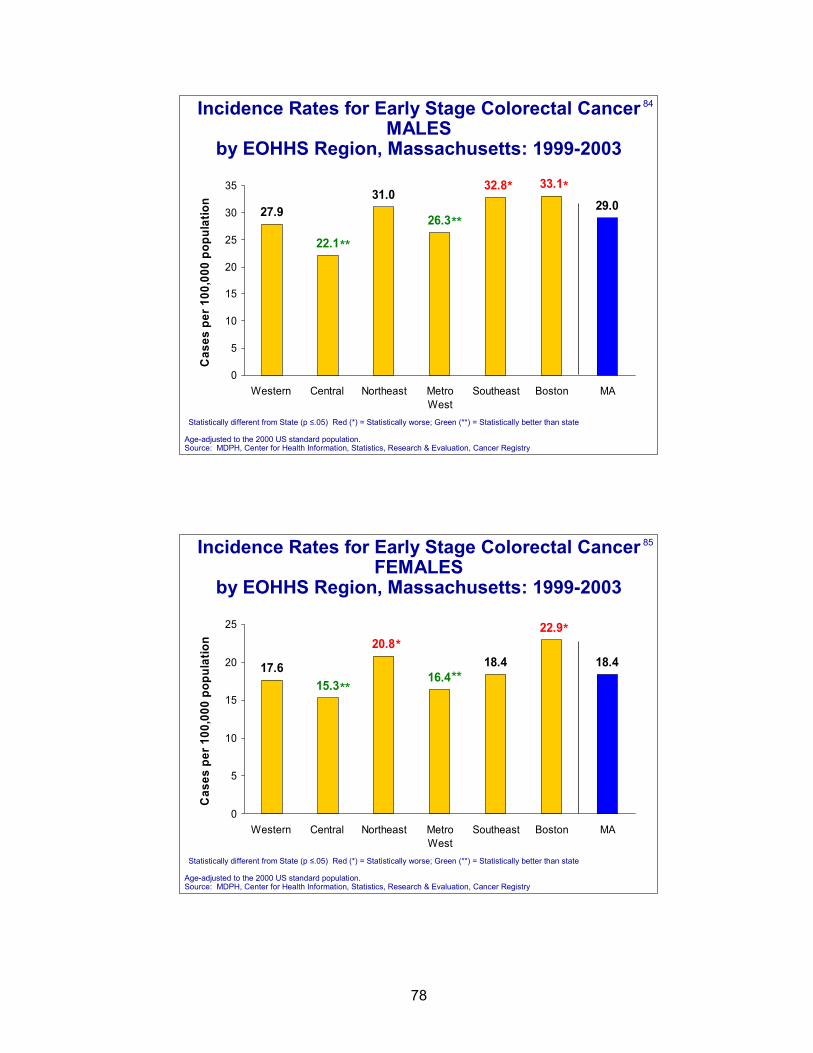
78
84Incidence Rates for Early Stage Colorectal Cancer MALES
by EOHHS Region, Massachusetts: 1999-2003
27.931.0
29.0
22.1
26.3
33.132.8
0
5
10
15
20
25
30
35
Western Central Northeast MetroWest
Southeast Boston MA
Cas
es p
er 1
00,0
00 p
opul
atio
n
Age-adjusted to the 2000 US standard population. Source: MDPH, Center for Health Information, Statistics, Research & Evaluation, Cancer Registry
**
**
* *
Statistically different from State (p ≤.05) Red (*) = Statistically worse; Green (**) = Statistically better than state
85Incidence Rates for Early Stage Colorectal Cancer FEMALES
by EOHHS Region, Massachusetts: 1999-2003
17.6 18.4 18.4
15.3 16.4
22.920.8
0
5
10
15
20
25
Western Central Northeast MetroWest
Southeast Boston MA
Cas
es p
er 1
00,0
00 p
opul
atio
n
****
**
Age-adjusted to the 2000 US standard population. Source: MDPH, Center for Health Information, Statistics, Research & Evaluation, Cancer Registry
Statistically different from State (p ≤.05) Red (*) = Statistically worse; Green (**) = Statistically better than state
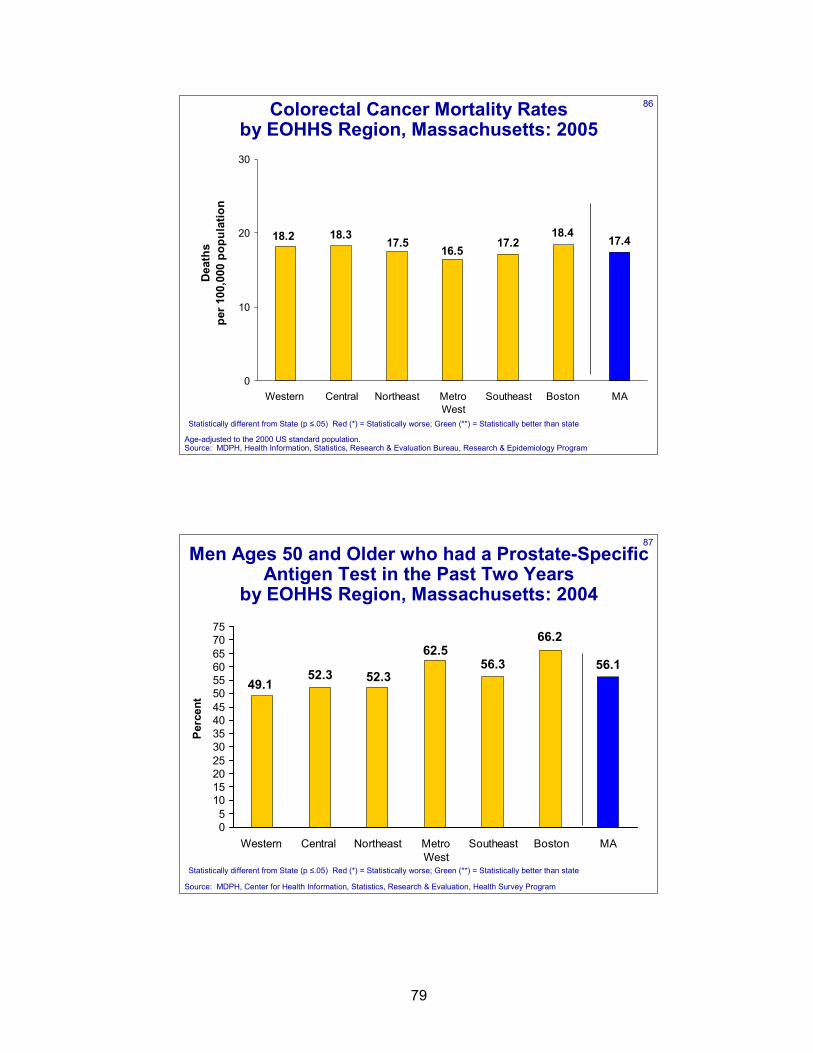
79
86Colorectal Cancer Mortality Rates by EOHHS Region, Massachusetts: 2005
17.2 17.416.5
17.518.2 18.3 18.4
0
10
20
30
Western Central Northeast MetroWest
Southeast Boston MA
Dea
ths
per 1
00,0
00 p
opul
atio
n
Age-adjusted to the 2000 US standard population. Source: MDPH, Health Information, Statistics, Research & Evaluation Bureau, Research & Epidemiology Program
Statistically different from State (p ≤.05) Red (*) = Statistically worse; Green (**) = Statistically better than state
87Men Ages 50 and Older who had a Prostate-Specific
Antigen Test in the Past Two Years by EOHHS Region, Massachusetts: 2004
56.3 56.162.5
52.349.152.3
66.2
05
1015202530354045505560657075
Western Central Northeast MetroWest
Southeast Boston MA
Perc
ent
Source: MDPH, Center for Health Information, Statistics, Research & Evaluation, Health Survey Program
Statistically different from State (p ≤.05) Red (*) = Statistically worse; Green (**) = Statistically better than state
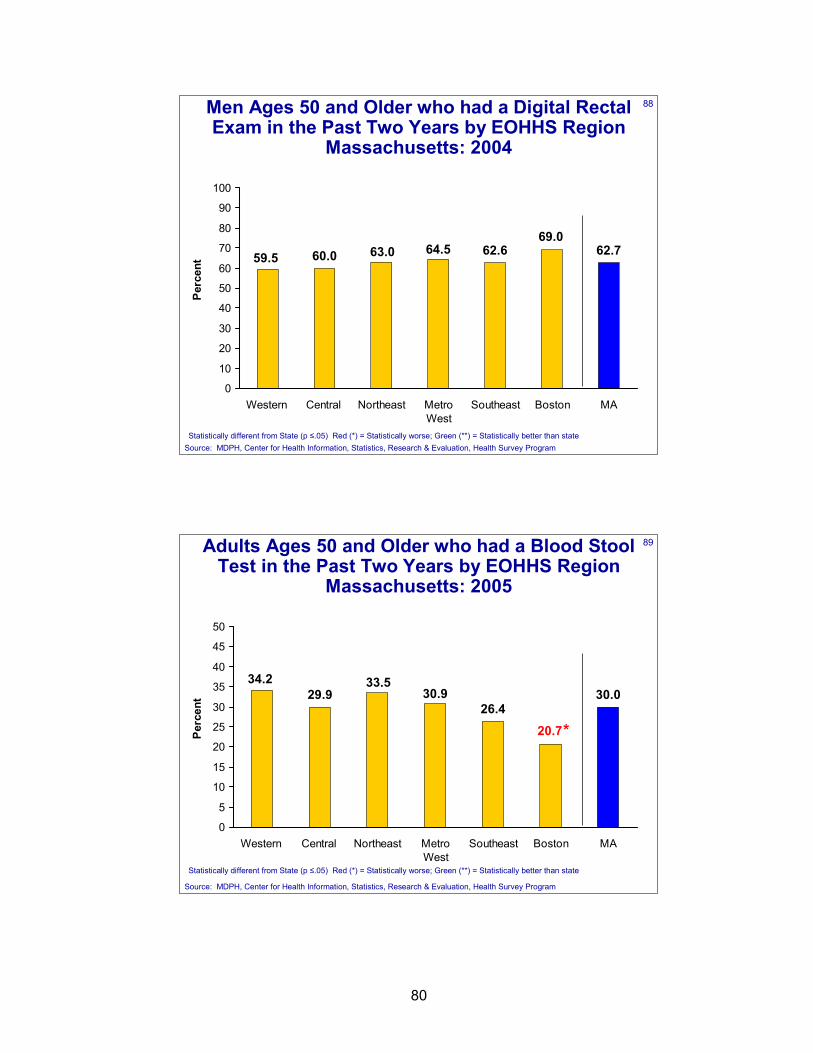
80
88Men Ages 50 and Older who had a Digital Rectal Exam in the Past Two Years by EOHHS Region
Massachusetts: 2004
62.6 62.764.563.059.5 60.069.0
0
10
20
30
40
50
60
70
80
90
100
Western Central Northeast MetroWest
Southeast Boston MA
Perc
ent
Statistically different from State (p ≤.05) Red (*) = Statistically worse; Green (**) = Statistically better than stateSource: MDPH, Center for Health Information, Statistics, Research & Evaluation, Health Survey Program
89Adults Ages 50 and Older who had a Blood Stool Test in the Past Two Years by EOHHS Region
Massachusetts: 2005
26.430.030.9
33.534.229.9
20.7
0
5
10
15
20
25
30
35
40
45
50
Western Central Northeast MetroWest
Southeast Boston MA
Perc
ent
*
Statistically different from State (p ≤.05) Red (*) = Statistically worse; Green (**) = Statistically better than state
Source: MDPH, Center for Health Information, Statistics, Research & Evaluation, Health Survey Program
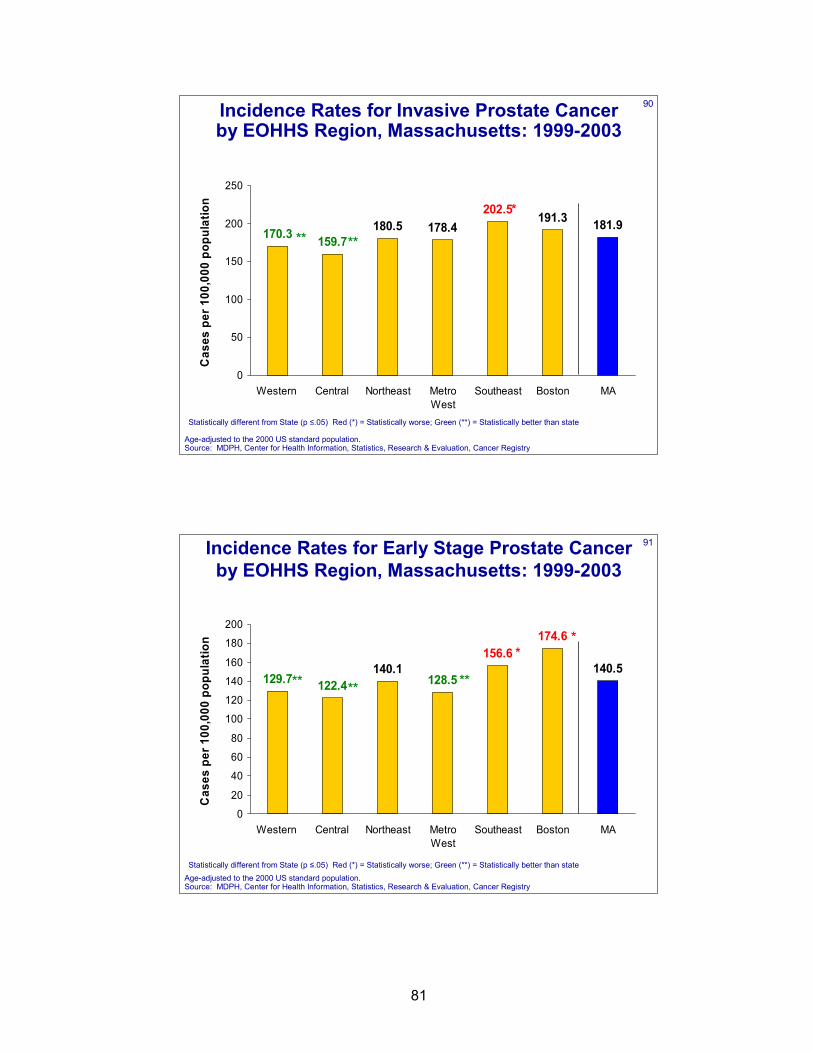
81
90Incidence Rates for Invasive Prostate Cancer by EOHHS Region, Massachusetts: 1999-2003
180.5 181.9170.3 159.7
178.4191.3202.5
0
50
100
150
200
250
Western Central Northeast MetroWest
Southeast Boston MA
Cas
es p
er 1
00,0
00 p
opul
atio
n
Age-adjusted to the 2000 US standard population. Source: MDPH, Center for Health Information, Statistics, Research & Evaluation, Cancer Registry
**
*
Statistically different from State (p ≤.05) Red (*) = Statistically worse; Green (**) = Statistically better than state
**
91Incidence Rates for Early Stage Prostate Cancer by EOHHS Region, Massachusetts: 1999-2003
140.1 140.5129.7 122.4 128.5
174.6156.6
0
20
40
60
80
100
120
140
160
180
200
Western Central Northeast MetroWest
Southeast Boston MA
Cas
es p
er 1
00,0
00 p
opul
atio
n
** ** **
**
Age-adjusted to the 2000 US standard population. Source: MDPH, Center for Health Information, Statistics, Research & Evaluation, Cancer Registry
Statistically different from State (p ≤.05) Red (*) = Statistically worse; Green (**) = Statistically better than state
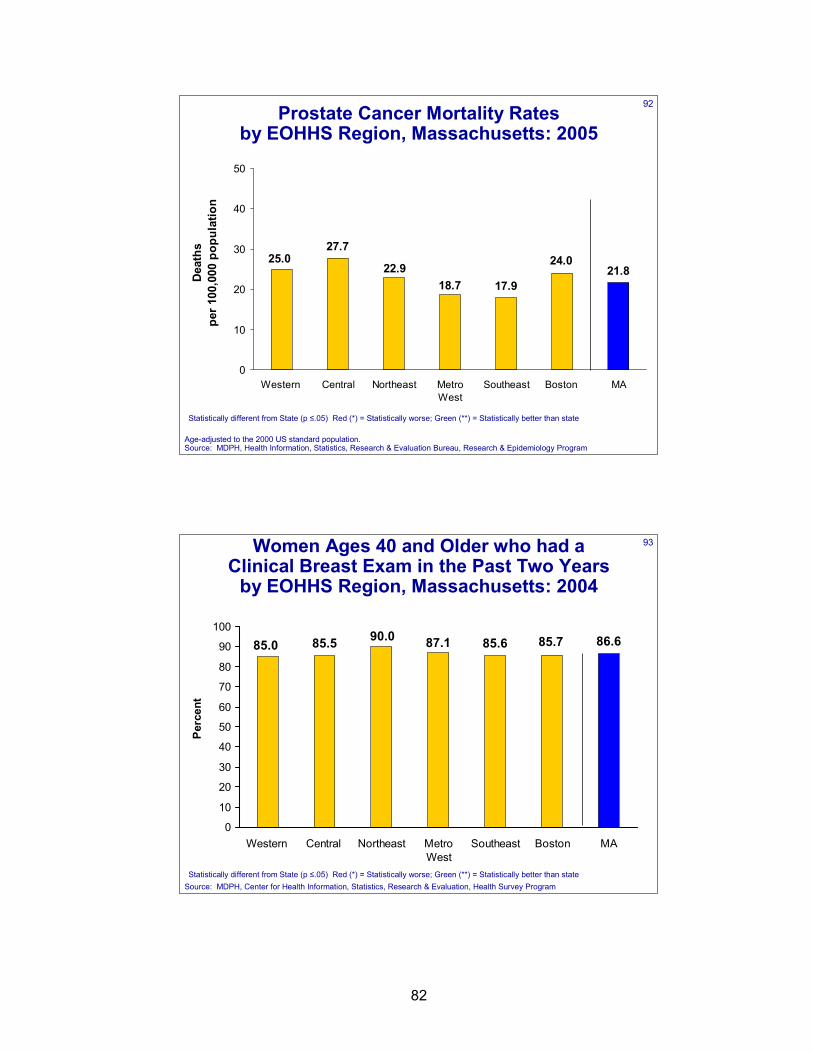
82
92Prostate Cancer Mortality Rates by EOHHS Region, Massachusetts: 2005
17.921.8
18.722.9
25.027.7
24.0
0
10
20
30
40
50
Western Central Northeast MetroWest
Southeast Boston MA
Dea
ths
per 1
00,0
00 p
opul
atio
n
Age-adjusted to the 2000 US standard population. Source: MDPH, Health Information, Statistics, Research & Evaluation Bureau, Research & Epidemiology Program
Statistically different from State (p ≤.05) Red (*) = Statistically worse; Green (**) = Statistically better than state
93Women Ages 40 and Older who had a Clinical Breast Exam in the Past Two Years
by EOHHS Region, Massachusetts: 2004
85.6 86.687.190.085.0 85.5 85.7
0
10
20
30
40
50
60
70
80
90
100
Western Central Northeast MetroWest
Southeast Boston MA
Perc
ent
Statistically different from State (p ≤.05) Red (*) = Statistically worse; Green (**) = Statistically better than stateSource: MDPH, Center for Health Information, Statistics, Research & Evaluation, Health Survey Program
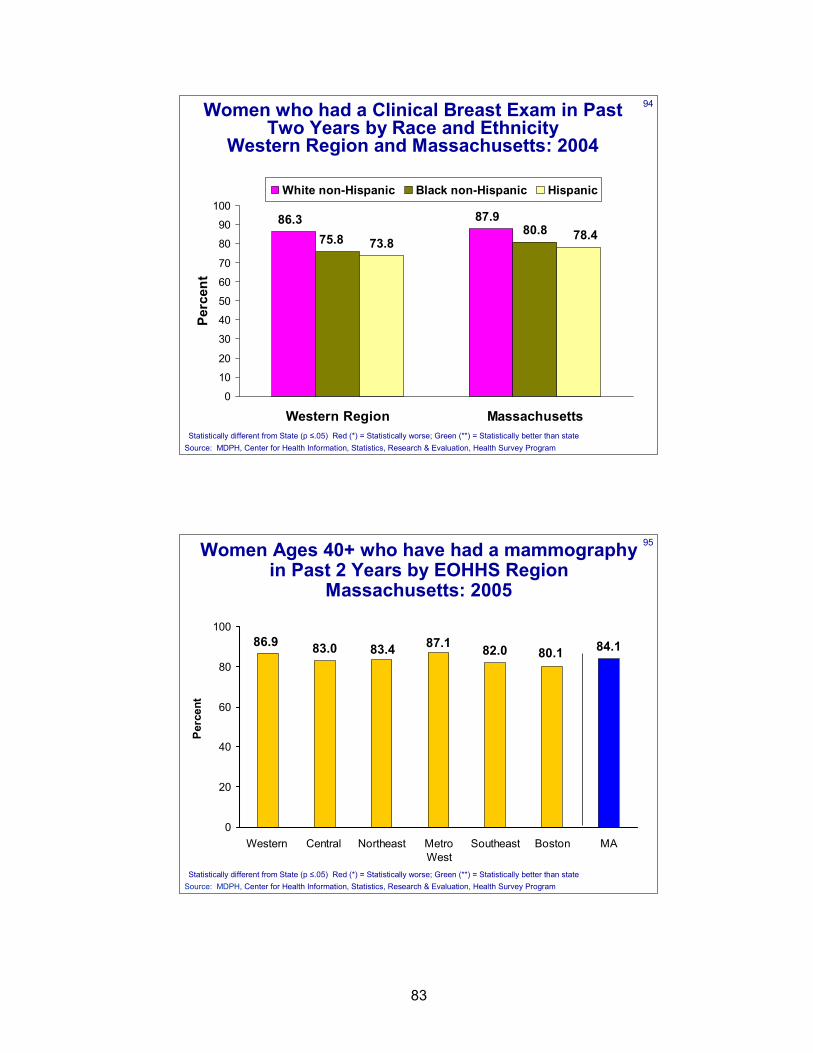
83
94Women who had a Clinical Breast Exam in Past Two Years by Race and Ethnicity
Western Region and Massachusetts: 2004
80.887.986.3
75.8 73.8 78.4
0
10
20
30
40
50
60
70
80
90
100
Western Region Massachusetts
Perc
ent
White non-Hispanic Black non-Hispanic Hispanic
Statistically different from State (p ≤.05) Red (*) = Statistically worse; Green (**) = Statistically better than stateSource: MDPH, Center for Health Information, Statistics, Research & Evaluation, Health Survey Program
95Women Ages 40+ who have had a mammography in Past 2 Years by EOHHS Region
Massachusetts: 2005
82.0 84.187.183.486.9 83.0 80.1
0
20
40
60
80
100
Western Central Northeast MetroWest
Southeast Boston MA
Perc
ent
Source: MDPH, Center for Health Information, Statistics, Research & Evaluation, Health Survey ProgramStatistically different from State (p ≤.05) Red (*) = Statistically worse; Green (**) = Statistically better than state
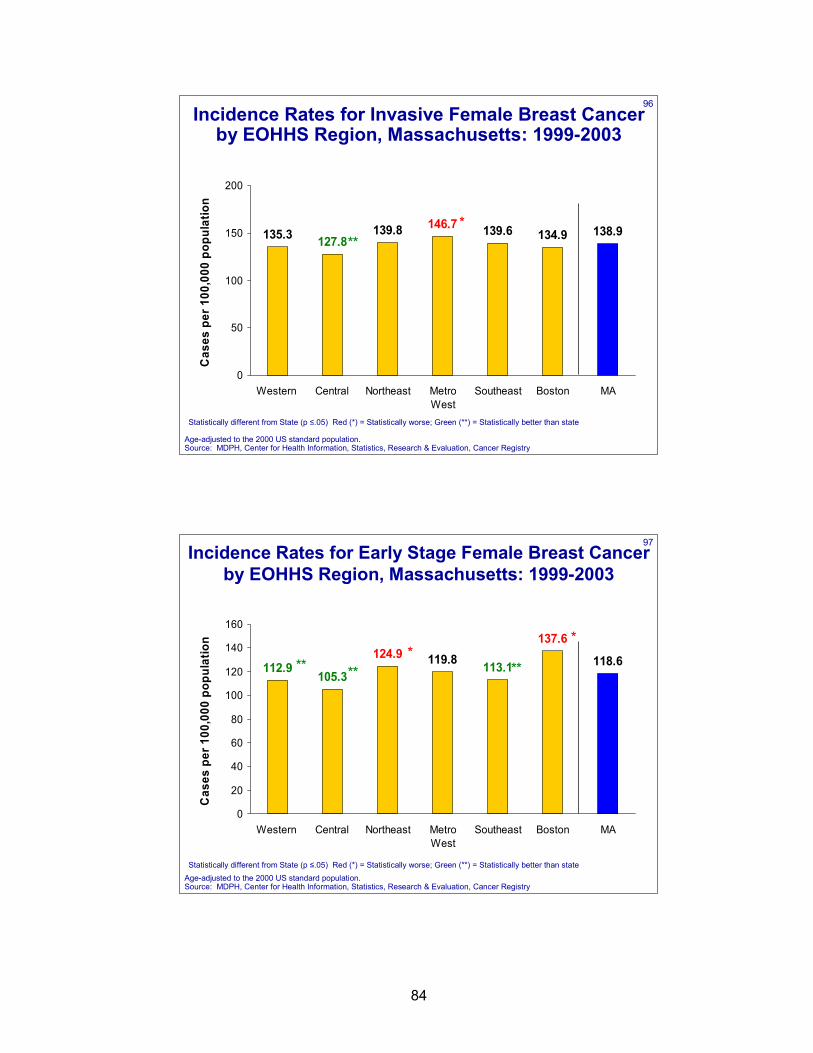
84
96Incidence Rates for Invasive Female Breast Cancer
by EOHHS Region, Massachusetts: 1999-2003
139.8 138.9135.3 127.8146.7
134.9139.6
0
50
100
150
200
Western Central Northeast MetroWest
Southeast Boston MA
Cas
es p
er 1
00,0
00 p
opul
atio
n
Age-adjusted to the 2000 US standard population. Source: MDPH, Center for Health Information, Statistics, Research & Evaluation, Cancer Registry
***
Statistically different from State (p ≤.05) Red (*) = Statistically worse; Green (**) = Statistically better than state
97Incidence Rates for Early Stage Female Breast Cancer
by EOHHS Region, Massachusetts: 1999-2003
119.8 118.6105.3
113.1112.9124.9
137.6
0
20
40
60
80
100
120
140
160
Western Central Northeast MetroWest
Southeast Boston MA
Cas
es p
er 1
00,0
00 p
opul
atio
n
Age-adjusted to the 2000 US standard population. Source: MDPH, Center for Health Information, Statistics, Research & Evaluation, Cancer Registry
** ***
**
*
Statistically different from State (p ≤.05) Red (*) = Statistically worse; Green (**) = Statistically better than state
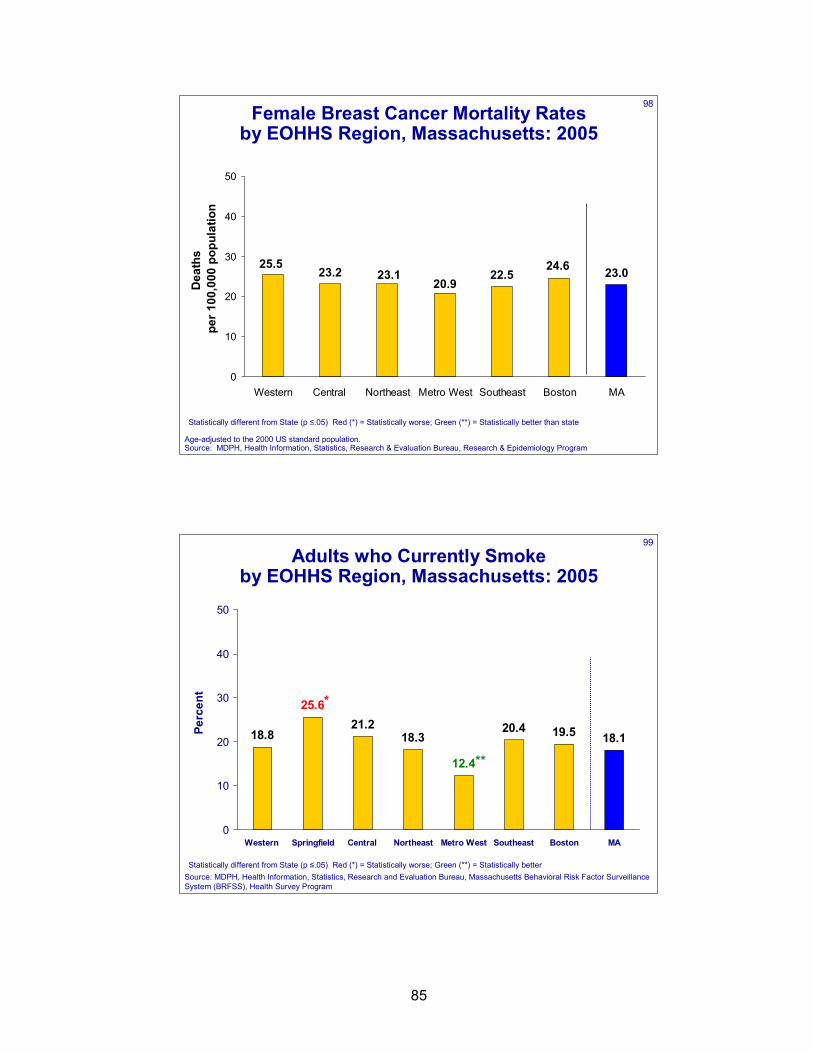
85
98Female Breast Cancer Mortality Rates by EOHHS Region, Massachusetts: 2005
22.5 23.020.9
23.125.5
23.2 24.6
0
10
20
30
40
50
Western Central Northeast Metro West Southeast Boston MA
Dea
ths
per
100
,000
pop
ulat
ion
Age-adjusted to the 2000 US standard population. Source: MDPH, Health Information, Statistics, Research & Evaluation Bureau, Research & Epidemiology Program
Statistically different from State (p ≤.05) Red (*) = Statistically worse; Green (**) = Statistically better than state
99
Adults who Currently Smoke by EOHHS Region, Massachusetts: 2005
18.119.520.421.218.8
25.6
12.4
18.3
0
10
20
30
40
50
Western Springfield Central Northeast Metro West Southeast Boston MA
Perc
ent
**
Statistically different from State (p ≤.05) Red (*) = Statistically worse; Green (**) = Statistically betterSource: MDPH, Health Information, Statistics, Research and Evaluation Bureau, Massachusetts Behavioral Risk Factor Surveillance System (BRFSS), Health Survey Program
*
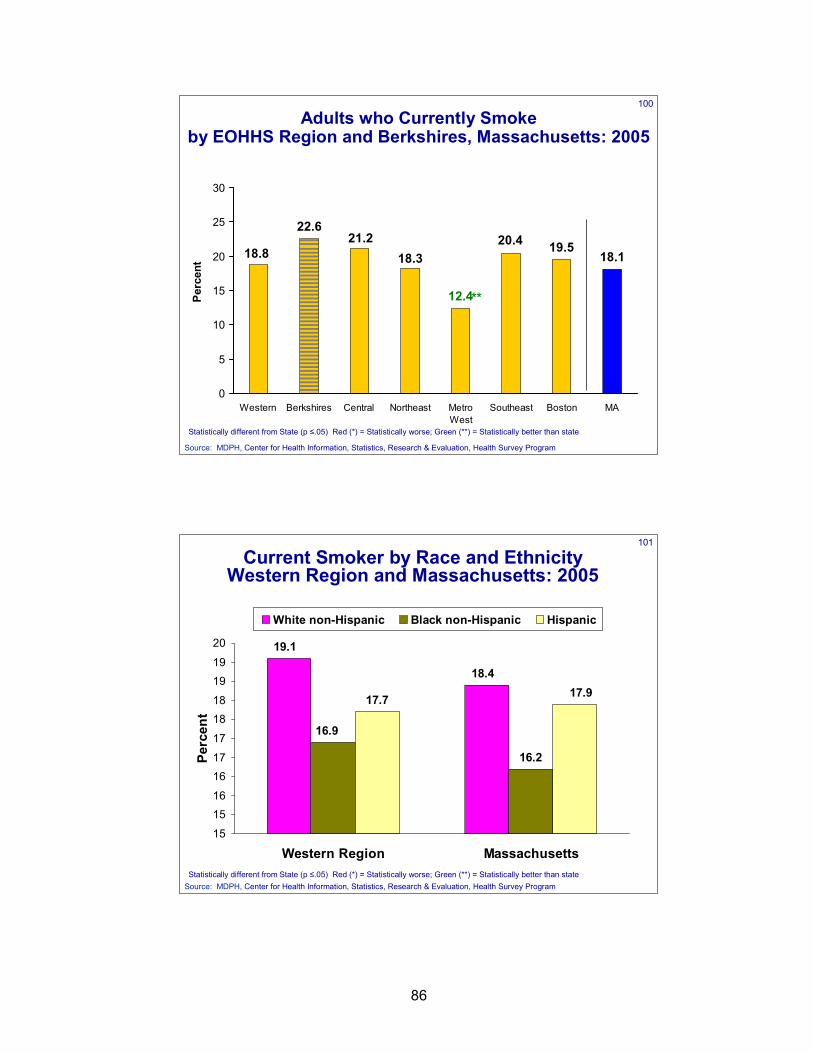
86
100
Adults who Currently Smoke by EOHHS Region and Berkshires, Massachusetts: 2005
18.1
12.4
19.518.3
21.218.8
22.620.4
0
5
10
15
20
25
30
Western Berkshires Central Northeast MetroWest
Southeast Boston MA
Perc
ent
Source: MDPH, Center for Health Information, Statistics, Research & Evaluation, Health Survey Program
**
Statistically different from State (p ≤.05) Red (*) = Statistically worse; Green (**) = Statistically better than state
101
Current Smoker by Race and Ethnicity Western Region and Massachusetts: 2005
16.2
18.4
19.1
16.9
17.7 17.9
15
1516
1617
17
1818
1919
20
Western Region Massachusetts
Perc
ent
White non-Hispanic Black non-Hispanic Hispanic
Statistically different from State (p ≤.05) Red (*) = Statistically worse; Green (**) = Statistically better than stateSource: MDPH, Center for Health Information, Statistics, Research & Evaluation, Health Survey Program
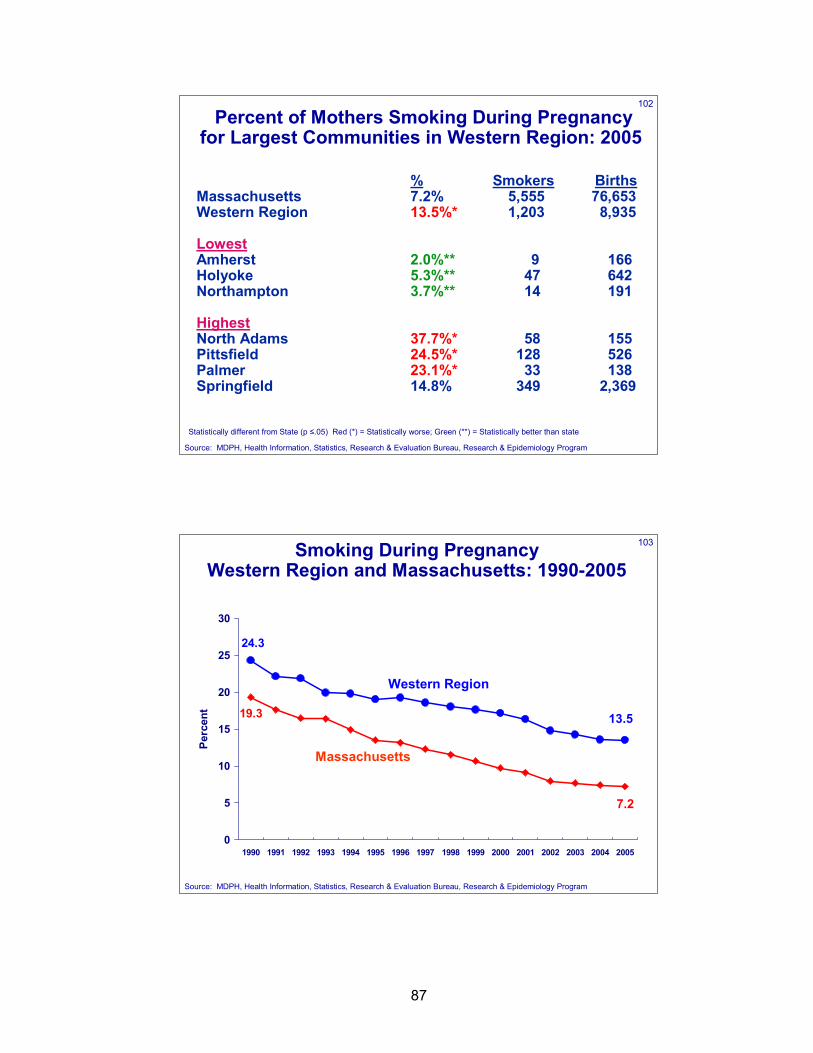
87
102
Percent of Mothers Smoking During Pregnancy for Largest Communities in Western Region: 2005
% Smokers BirthsMassachusetts 7.2% 5,555 76,653Western Region 13.5%* 1,203 8,935
LowestAmherst 2.0%** 9 166Holyoke 5.3%** 47 642Northampton 3.7%** 14 191
HighestNorth Adams 37.7%* 58 155Pittsfield 24.5%* 128 526Palmer 23.1%* 33 138Springfield 14.8% 349 2,369
Source: MDPH, Health Information, Statistics, Research & Evaluation Bureau, Research & Epidemiology Program
Statistically different from State (p ≤.05) Red (*) = Statistically worse; Green (**) = Statistically better than state
103
7.2
19.3 13.5
24.3
0
5
10
15
20
25
30
1990 1991 1992 1993 1994 1995 1996 1997 1998 1999 2000 2001 2002 2003 2004 2005
Perc
ent
Smoking During PregnancyWestern Region and Massachusetts: 1990-2005
Massachusetts
Western Region
Source: MDPH, Health Information, Statistics, Research & Evaluation Bureau, Research & Epidemiology Program
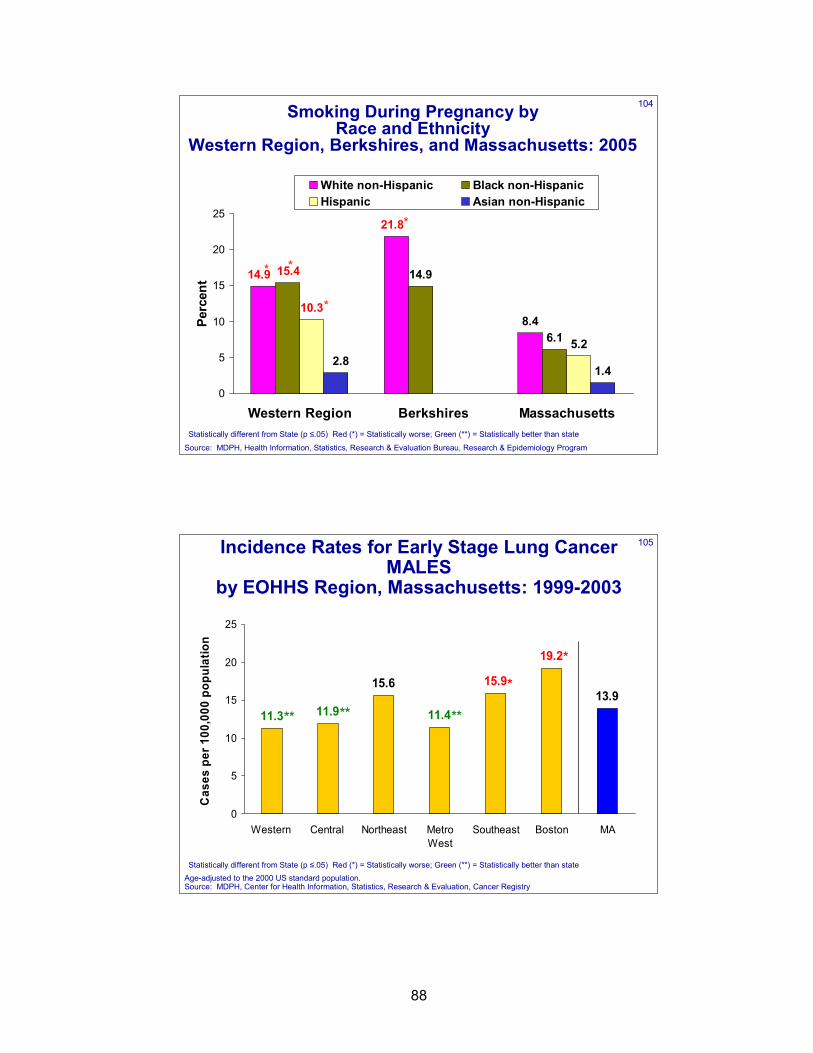
88
104Smoking During Pregnancy by Race and Ethnicity
Western Region, Berkshires, and Massachusetts: 2005
8.4
14.9
6.1 5.2
1.4
21.8
14.9 15.4
10.3
2.8
0
5
10
15
20
25
Western Region Berkshires Massachusetts
Perc
ent
White non-Hispanic Black non-HispanicHispanic Asian non-Hispanic
Source: MDPH, Health Information, Statistics, Research & Evaluation Bureau, Research & Epidemiology Program
* *
*
Statistically different from State (p ≤.05) Red (*) = Statistically worse; Green (**) = Statistically better than state
*
105Incidence Rates for Early Stage Lung Cancer
MALESby EOHHS Region, Massachusetts: 1999-2003
13.915.9
19.2
15.6
11.3 11.9 11.4
0
5
10
15
20
25
Western Central Northeast MetroWest
Southeast Boston MA
Cas
es p
er 1
00,0
00 p
opul
atio
n
Age-adjusted to the 2000 US standard population. Source: MDPH, Center for Health Information, Statistics, Research & Evaluation, Cancer Registry
**
*
*
** **
Statistically different from State (p ≤.05) Red (*) = Statistically worse; Green (**) = Statistically better than state
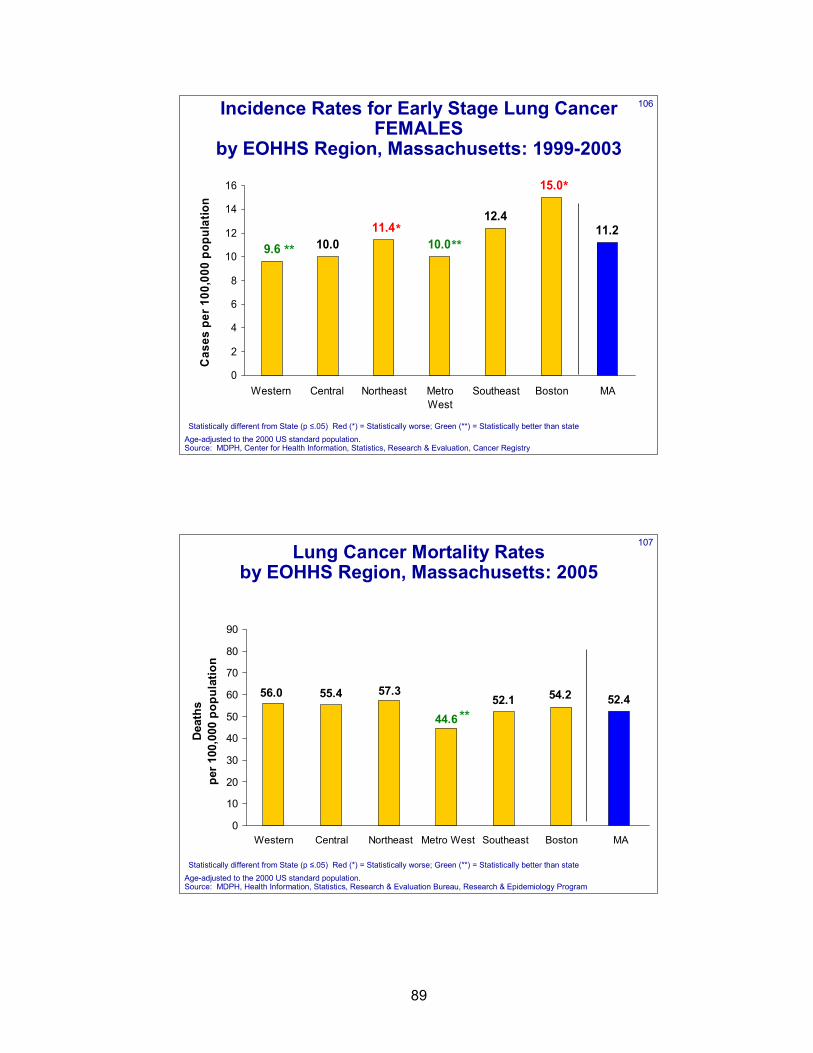
89
106Incidence Rates for Early Stage Lung Cancer FEMALES
by EOHHS Region, Massachusetts: 1999-2003
10.0
12.411.2
15.0
11.49.6 10.0
0
2
4
6
8
10
12
14
16
Western Central Northeast MetroWest
Southeast Boston MA
Cas
es p
er 1
00,0
00 p
opul
atio
n
Age-adjusted to the 2000 US standard population. Source: MDPH, Center for Health Information, Statistics, Research & Evaluation, Cancer Registry
**
*
***
Statistically different from State (p ≤.05) Red (*) = Statistically worse; Green (**) = Statistically better than state
107Lung Cancer Mortality Ratesby EOHHS Region, Massachusetts: 2005
52.1 52.444.6
57.356.0 55.4 54.2
0
10
20
30
40
50
60
70
80
90
Western Central Northeast Metro West Southeast Boston MA
Dea
ths
per 1
00,0
00 p
opul
atio
n
Age-adjusted to the 2000 US standard population. Source: MDPH, Health Information, Statistics, Research & Evaluation Bureau, Research & Epidemiology Program
**
Statistically different from State (p ≤.05) Red (*) = Statistically worse; Green (**) = Statistically better than state
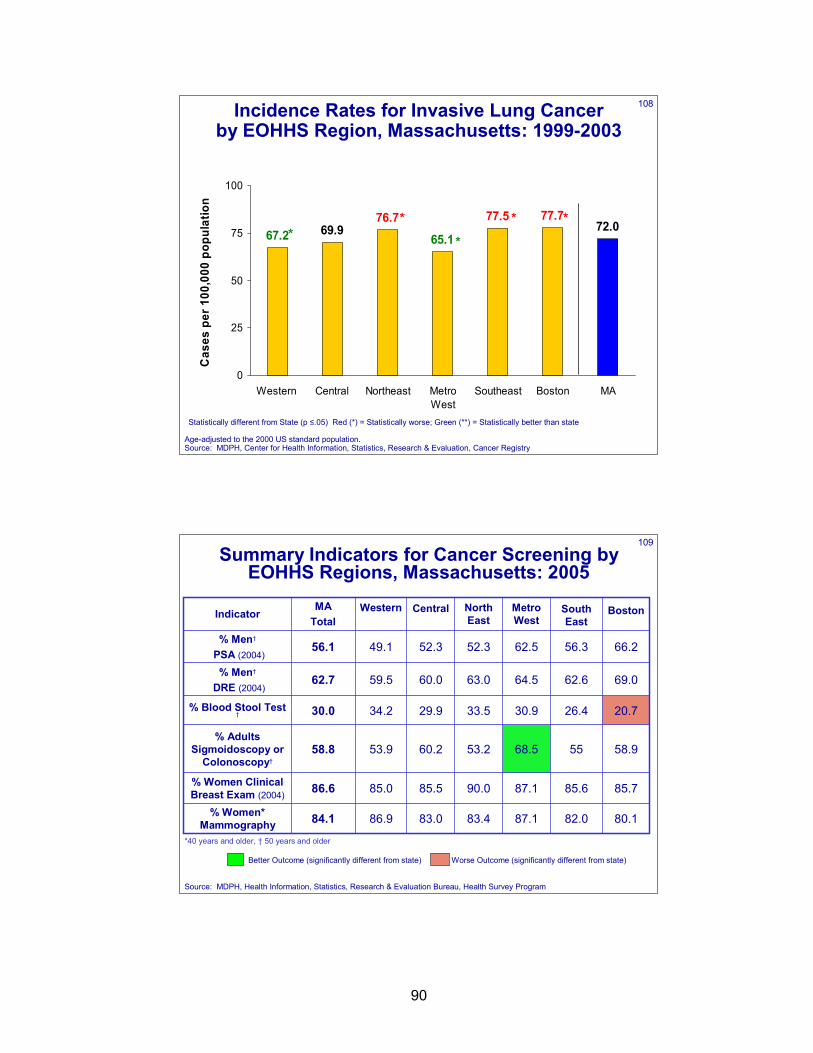
90
108Incidence Rates for Invasive Lung Cancer by EOHHS Region, Massachusetts: 1999-2003
72.076.7
67.2 69.965.1
77.777.5
0
25
50
75
100
Western Central Northeast MetroWest
Southeast Boston MA
Cas
es p
er 1
00,0
00 p
opul
atio
n
Age-adjusted to the 2000 US standard population. Source: MDPH, Center for Health Information, Statistics, Research & Evaluation, Cancer Registry
*
Statistically different from State (p ≤.05) Red (*) = Statistically worse; Green (**) = Statistically better than state
** *
*
109
20.726.430.933.529.934.230.0% Blood Stool Test †
86.9
85.0
53.9
59.5
49.1
Western
82.0
85.6
55
62.6
56.3
South East
80.187.183.483.084.1% Women* Mammography
85.787.190.085.586.6% Women Clinical Breast Exam (2004)
58.968.553.260.258.8% Adults
Sigmoidoscopy or Colonoscopy†
69.064.563.060.062.7% Men†
DRE (2004)
66.262.552.352.356.1% Men†
PSA (2004)
BostonMetro West
North East
CentralMATotal
Indicator
Summary Indicators for Cancer Screening by EOHHS Regions, Massachusetts: 2005
Better Outcome (significantly different from state) Worse Outcome (significantly different from state)
*40 years and older, † 50 years and older
Source: MDPH, Health Information, Statistics, Research & Evaluation Bureau, Health Survey Program
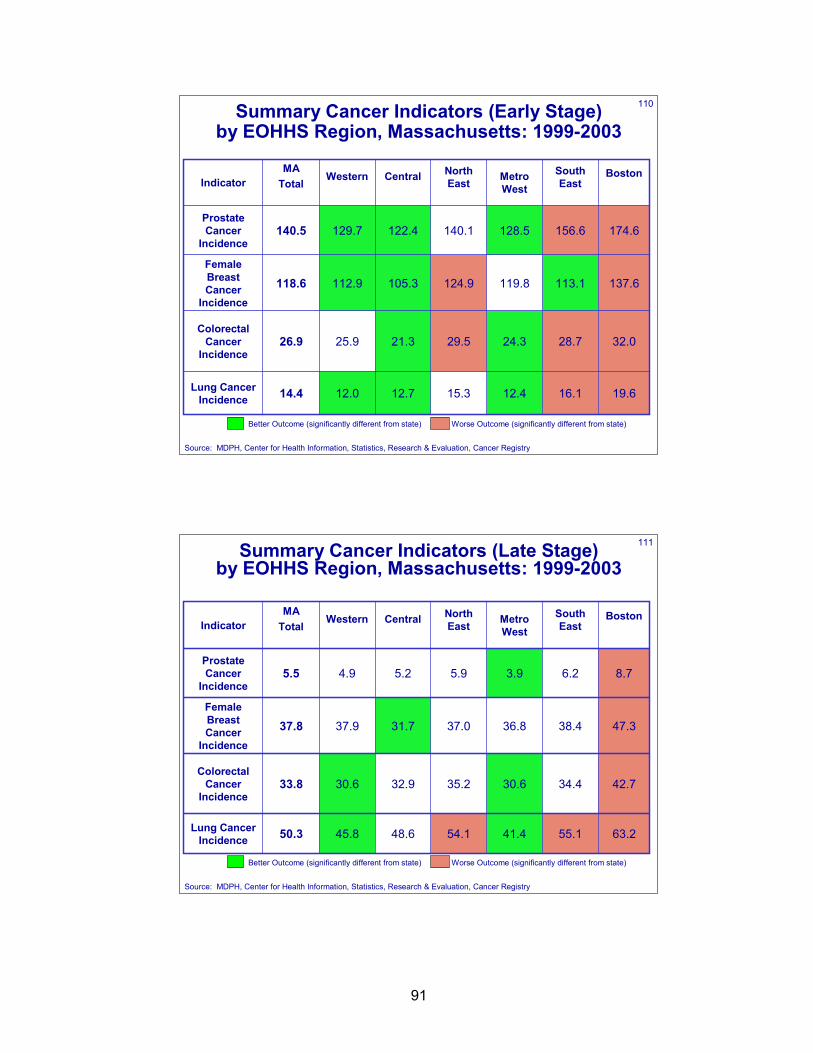
91
110
12.0
25.9
112.9
129.7
Western
16.1
28.7
113.1
156.6
South East
19.612.415.312.714.4Lung Cancer Incidence
32.024.329.521.326.9Colorectal
Cancer Incidence
137.6119.8124.9105.3118.6Female Breast Cancer
Incidence
174.6128.5140.1122.4140.5Prostate Cancer
Incidence
BostonMetro West
North East Central
MATotal Indicator
Summary Cancer Indicators (Early Stage)by EOHHS Region, Massachusetts: 1999-2003
Source: MDPH, Center for Health Information, Statistics, Research & Evaluation, Cancer Registry
Better Outcome (significantly different from state) Worse Outcome (significantly different from state)
111
45.8
30.6
37.9
4.9
Western
55.1
34.4
38.4
6.2
South East
63.241.454.148.650.3Lung Cancer Incidence
42.730.635.232.933.8Colorectal
Cancer Incidence
47.336.837.031.737.8Female Breast Cancer
Incidence
8.73.95.95.25.5Prostate Cancer
Incidence
BostonMetro West
North East Central
MATotal Indicator
Summary Cancer Indicators (Late Stage)by EOHHS Region, Massachusetts: 1999-2003
Source: MDPH, Center for Health Information, Statistics, Research & Evaluation, Cancer Registry
Better Outcome (significantly different from state) Worse Outcome (significantly different from state)
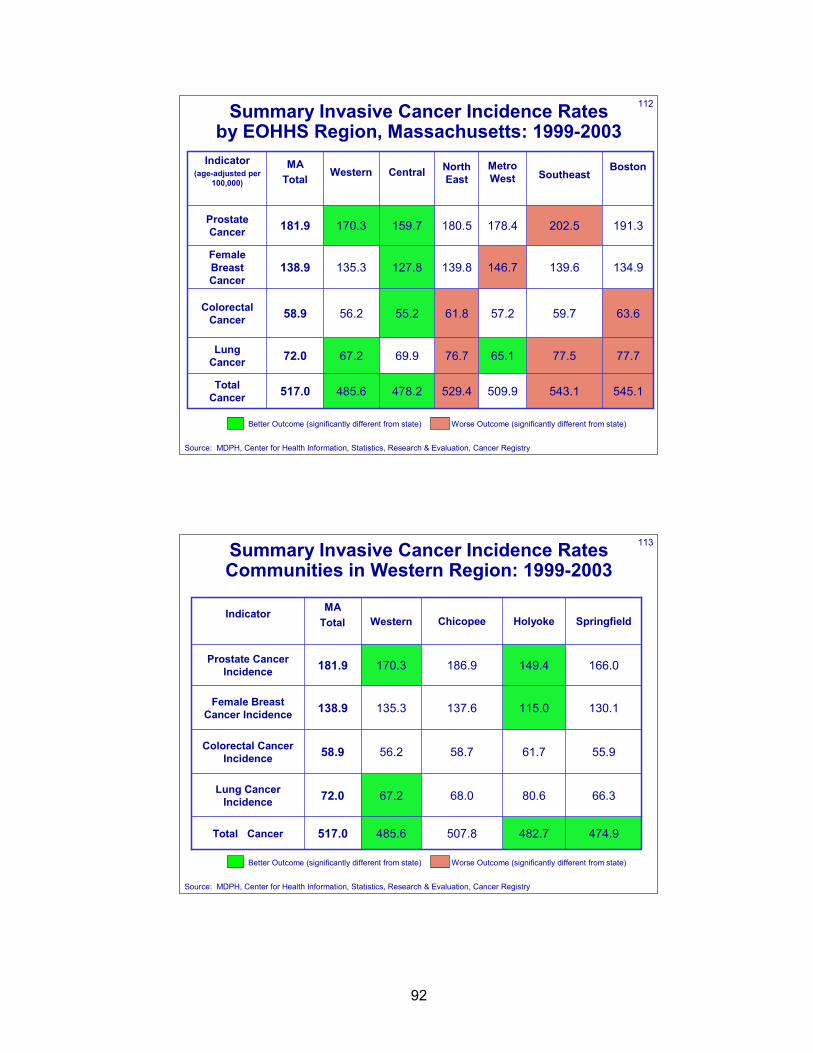
92
112Summary Invasive Cancer Incidence Ratesby EOHHS Region, Massachusetts: 1999-2003
Source: MDPH, Center for Health Information, Statistics, Research & Evaluation, Cancer Registry
Better Outcome (significantly different from state) Worse Outcome (significantly different from state)
77.777.565.176.769.967.272.0Lung Cancer
545.1543.1509.9529.4478.2485.6517.0Total Cancer
56.2
135.3
170.3
Western
59.7
139.6
202.5
Southeast
63.657.261.855.258.9Colorectal Cancer
134.9146.7139.8127.8138.9Female Breast Cancer
191.3178.4180.5159.7181.9Prostate Cancer
BostonMetro West
North East Central
MATotal
Indicator(age-adjusted per
100,000)
113
66.380.668.067.272.0Lung Cancer Incidence
485.6
56.2
135.3
170.3
Western
474.9
55.9
130.1
166.0
Springfield
482.7507.8517.0Total Cancer
61.758.758.9Colorectal Cancer Incidence
115.0137.6138.9Female Breast Cancer Incidence
149.4186.9181.9Prostate Cancer Incidence
HolyokeChicopeeMA
Total Indicator
Summary Invasive Cancer Incidence RatesCommunities in Western Region: 1999-2003
Source: MDPH, Center for Health Information, Statistics, Research & Evaluation, Cancer Registry
Better Outcome (significantly different from state) Worse Outcome (significantly different from state)
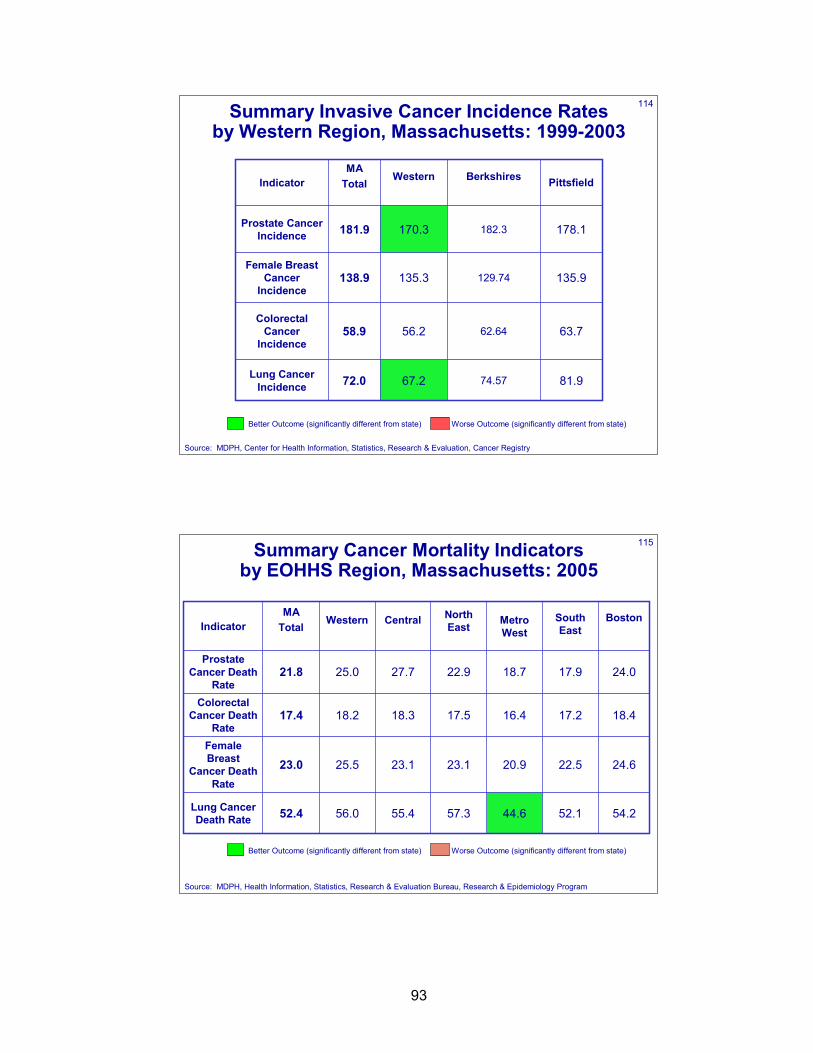
93
114
74.57
62.64
129.74
182.3
Berkshires
67.2
56.2
135.3
170.3
Western
81.972.0Lung Cancer Incidence
63.758.9Colorectal
Cancer Incidence
135.9138.9Female Breast
Cancer Incidence
178.1181.9Prostate Cancer Incidence
PittsfieldMA
Total Indicator
Summary Invasive Cancer Incidence Ratesby Western Region, Massachusetts: 1999-2003
Source: MDPH, Center for Health Information, Statistics, Research & Evaluation, Cancer Registry
Better Outcome (significantly different from state) Worse Outcome (significantly different from state)
115
56.0
25.5
18.2
25.0
Western
52.1
22.5
17.2
17.9
South East
54.244.657.355.452.4Lung Cancer Death Rate
24.620.923.123.123.0Female Breast
Cancer Death Rate
18.416.417.518.317.4Colorectal
Cancer Death Rate
24.018.722.927.721.8Prostate
Cancer Death Rate
BostonMetro West
North East Central
MATotal Indicator
Summary Cancer Mortality Indicators by EOHHS Region, Massachusetts: 2005
Source: MDPH, Health Information, Statistics, Research & Evaluation Bureau, Research & Epidemiology Program
Better Outcome (significantly different from state) Worse Outcome (significantly different from state)
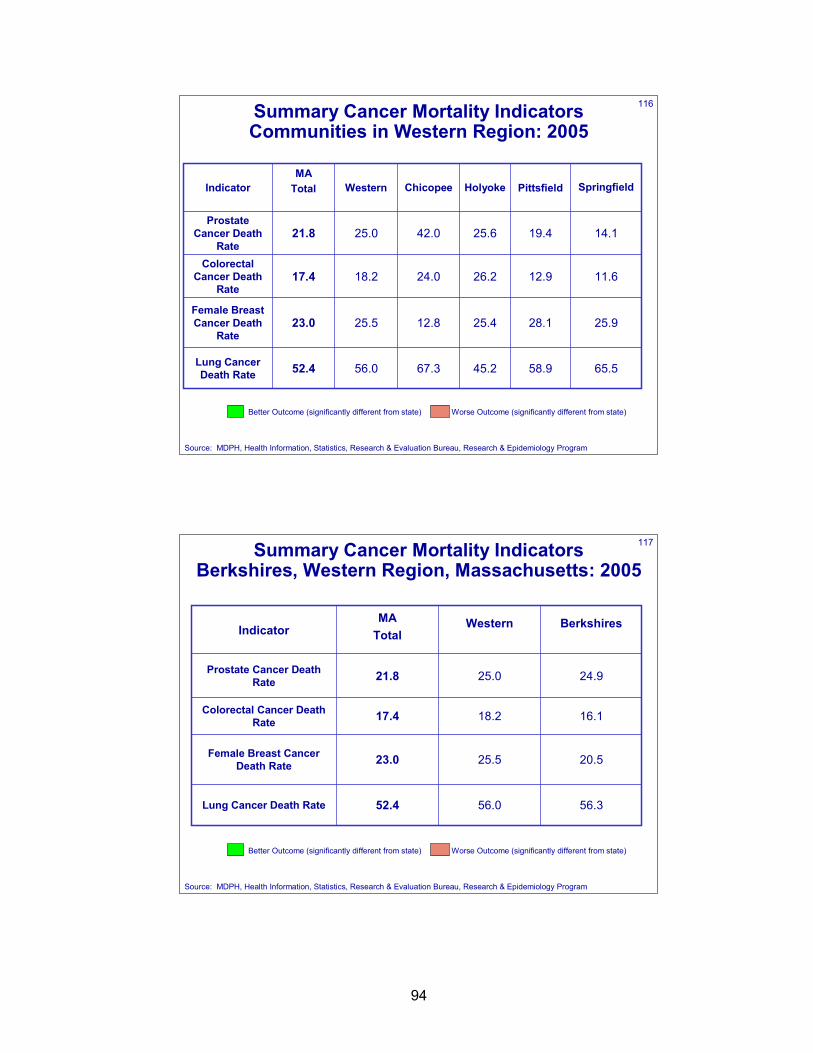
94
116
56.0
25.5
18.2
25.0
Western
58.9
28.1
12.9
19.4
Pittsfield
65.545.267.352.4Lung Cancer Death Rate
25.925.412.823.0Female Breast Cancer Death
Rate
11.626.224.017.4Colorectal
Cancer Death Rate
14.125.642.021.8Prostate
Cancer Death Rate
SpringfieldHolyokeChicopeeMA
Total Indicator
Summary Cancer Mortality Indicators Communities in Western Region: 2005
Source: MDPH, Health Information, Statistics, Research & Evaluation Bureau, Research & Epidemiology Program
Better Outcome (significantly different from state) Worse Outcome (significantly different from state)
117
56.0
25.5
18.2
25.0
Western
56.352.4Lung Cancer Death Rate
20.523.0Female Breast Cancer Death Rate
16.117.4Colorectal Cancer Death Rate
24.921.8Prostate Cancer Death Rate
BerkshiresMATotal Indicator
Summary Cancer Mortality Indicators Berkshires, Western Region, Massachusetts: 2005
Source: MDPH, Health Information, Statistics, Research & Evaluation Bureau, Research & Epidemiology Program
Better Outcome (significantly different from state) Worse Outcome (significantly different from state)

95
SUBSTANCE ABUSE

96
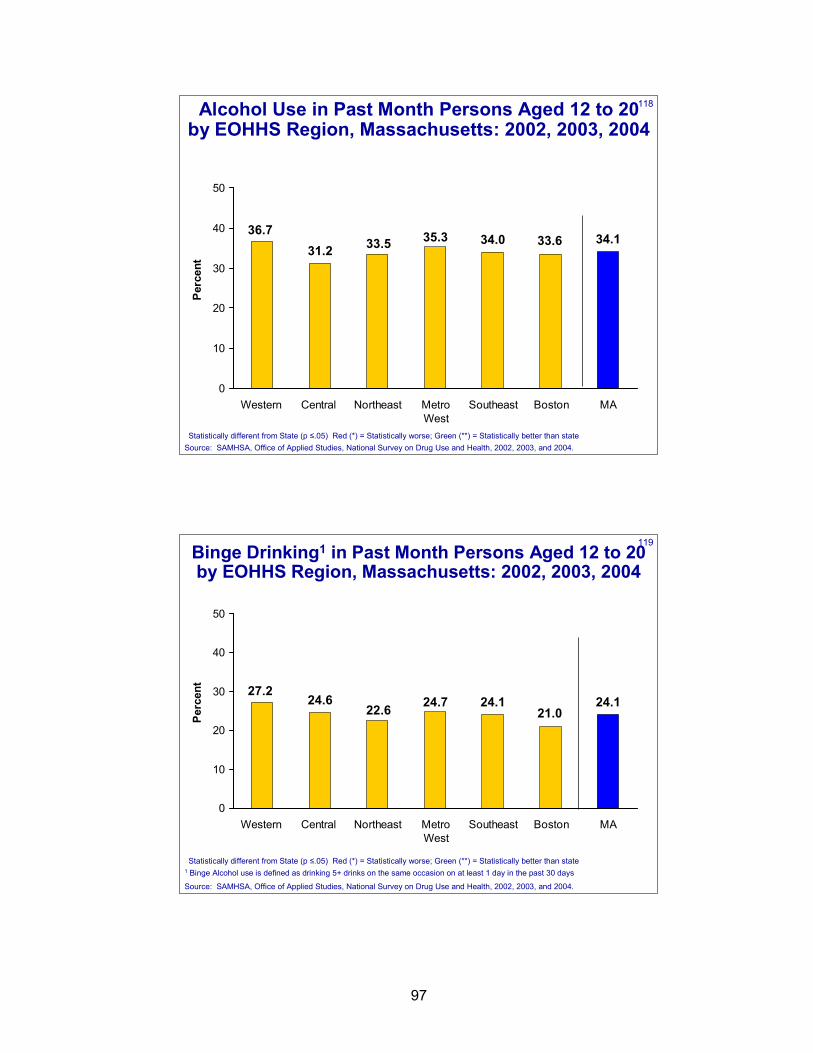
97
118Alcohol Use in Past Month Persons Aged 12 to 20by EOHHS Region, Massachusetts: 2002, 2003, 2004
34.0 34.135.333.536.7
31.233.6
0
10
20
30
40
50
Western Central Northeast MetroWest
Southeast Boston MA
Perc
ent
Source: SAMHSA, Office of Applied Studies, National Survey on Drug Use and Health, 2002, 2003, and 2004.Statistically different from State (p ≤.05) Red (*) = Statistically worse; Green (**) = Statistically better than state
119Binge Drinking1 in Past Month Persons Aged 12 to 20by EOHHS Region, Massachusetts: 2002, 2003, 2004
24.1 24.124.722.627.2
24.621.0
0
10
20
30
40
50
Western Central Northeast MetroWest
Southeast Boston MA
Perc
ent
1 Binge Alcohol use is defined as drinking 5+ drinks on the same occasion on at least 1 day in the past 30 days
Source: SAMHSA, Office of Applied Studies, National Survey on Drug Use and Health, 2002, 2003, and 2004.
Statistically different from State (p ≤.05) Red (*) = Statistically worse; Green (**) = Statistically better than state
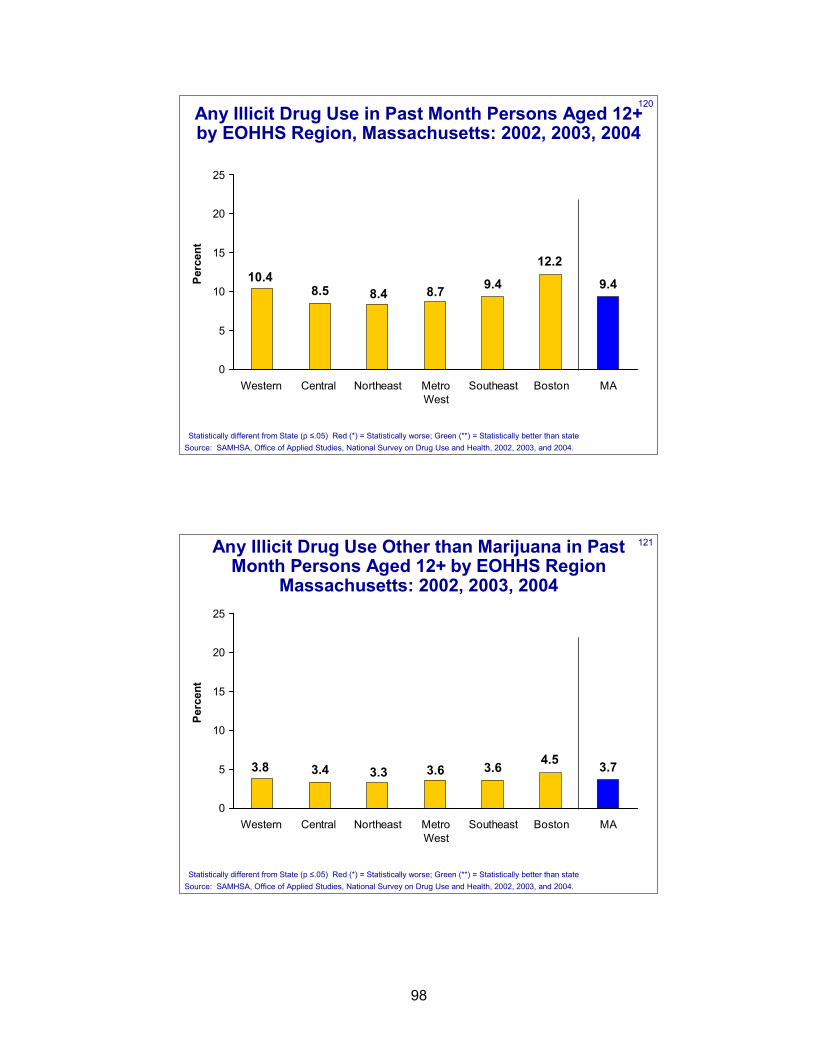
98
120Any Illicit Drug Use in Past Month Persons Aged 12+by EOHHS Region, Massachusetts: 2002, 2003, 2004
9.4 9.48.78.410.4
8.5
12.2
0
5
10
15
20
25
Western Central Northeast MetroWest
Southeast Boston MA
Perc
ent
Source: SAMHSA, Office of Applied Studies, National Survey on Drug Use and Health, 2002, 2003, and 2004.Statistically different from State (p ≤.05) Red (*) = Statistically worse; Green (**) = Statistically better than state
121Any Illicit Drug Use Other than Marijuana in Past Month Persons Aged 12+ by EOHHS Region
Massachusetts: 2002, 2003, 2004
3.6 3.73.63.33.8 3.44.5
0
5
10
15
20
25
Western Central Northeast MetroWest
Southeast Boston MA
Perc
ent
Source: SAMHSA, Office of Applied Studies, National Survey on Drug Use and Health, 2002, 2003, and 2004.Statistically different from State (p ≤.05) Red (*) = Statistically worse; Green (**) = Statistically better than state
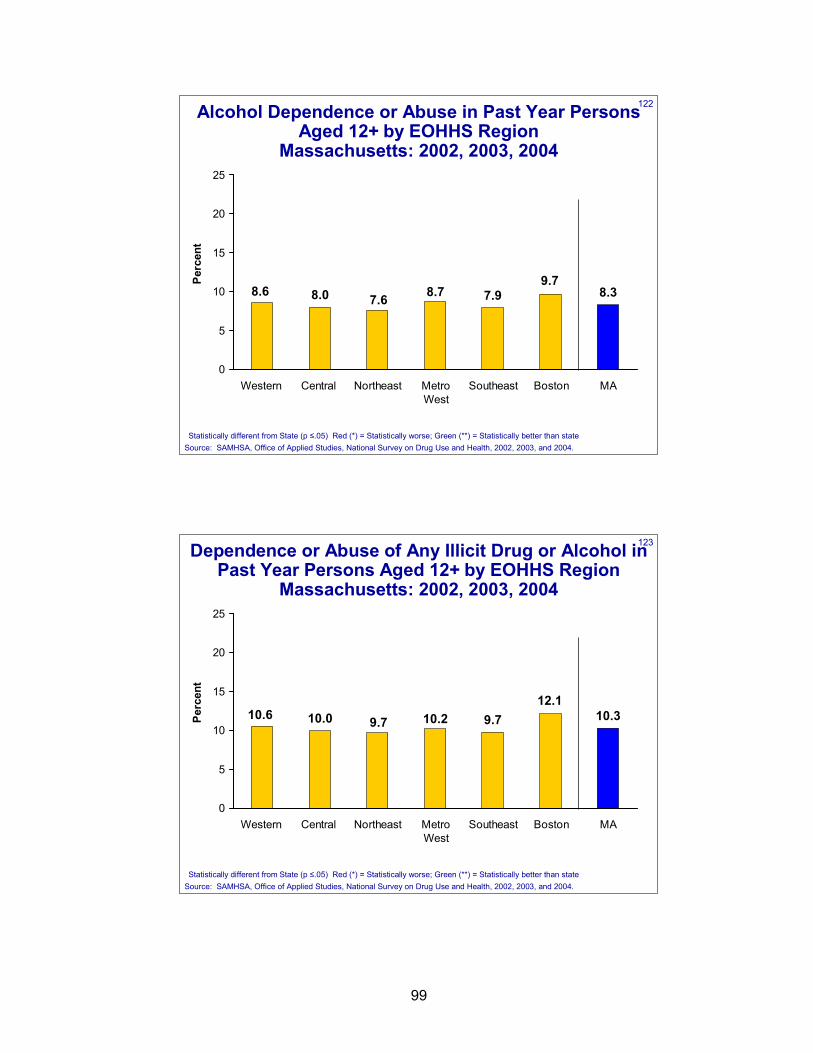
99
122Alcohol Dependence or Abuse in Past Year Persons Aged 12+ by EOHHS Region
Massachusetts: 2002, 2003, 2004
7.9 8.38.77.68.6 8.09.7
0
5
10
15
20
25
Western Central Northeast MetroWest
Southeast Boston MA
Perc
ent
Source: SAMHSA, Office of Applied Studies, National Survey on Drug Use and Health, 2002, 2003, and 2004.Statistically different from State (p ≤.05) Red (*) = Statistically worse; Green (**) = Statistically better than state
123Dependence or Abuse of Any Illicit Drug or Alcohol in Past Year Persons Aged 12+ by EOHHS Region
Massachusetts: 2002, 2003, 2004
9.7 10.310.29.710.6 10.012.1
0
5
10
15
20
25
Western Central Northeast MetroWest
Southeast Boston MA
Perc
ent
Source: SAMHSA, Office of Applied Studies, National Survey on Drug Use and Health, 2002, 2003, and 2004.Statistically different from State (p ≤.05) Red (*) = Statistically worse; Green (**) = Statistically better than state
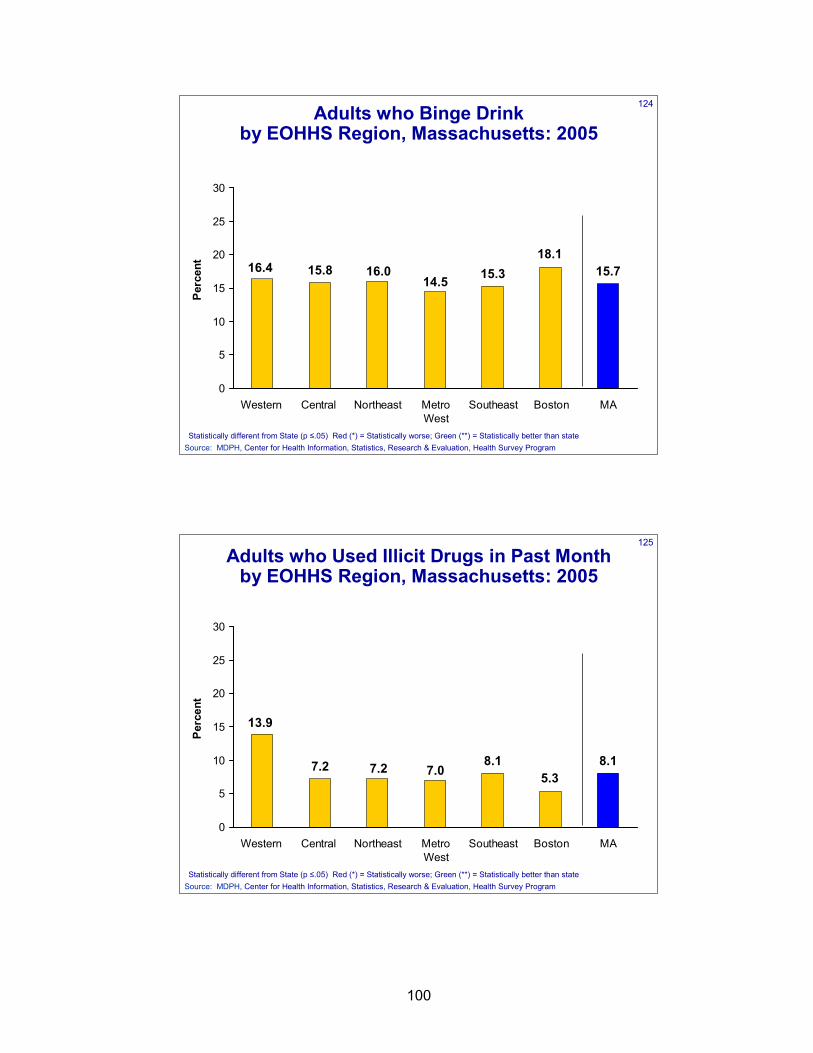
100
124Adults who Binge Drink by EOHHS Region, Massachusetts: 2005
15.3 15.714.5
16.016.4 15.818.1
0
5
10
15
20
25
30
Western Central Northeast MetroWest
Southeast Boston MA
Perc
ent
Source: MDPH, Center for Health Information, Statistics, Research & Evaluation, Health Survey ProgramStatistically different from State (p ≤.05) Red (*) = Statistically worse; Green (**) = Statistically better than state
125
Adults who Used Illicit Drugs in Past Month by EOHHS Region, Massachusetts: 2005
8.1 8.17.07.2
13.9
7.25.3
0
5
10
15
20
25
30
Western Central Northeast MetroWest
Southeast Boston MA
Perc
ent
Source: MDPH, Center for Health Information, Statistics, Research & Evaluation, Health Survey ProgramStatistically different from State (p ≤.05) Red (*) = Statistically worse; Green (**) = Statistically better than state
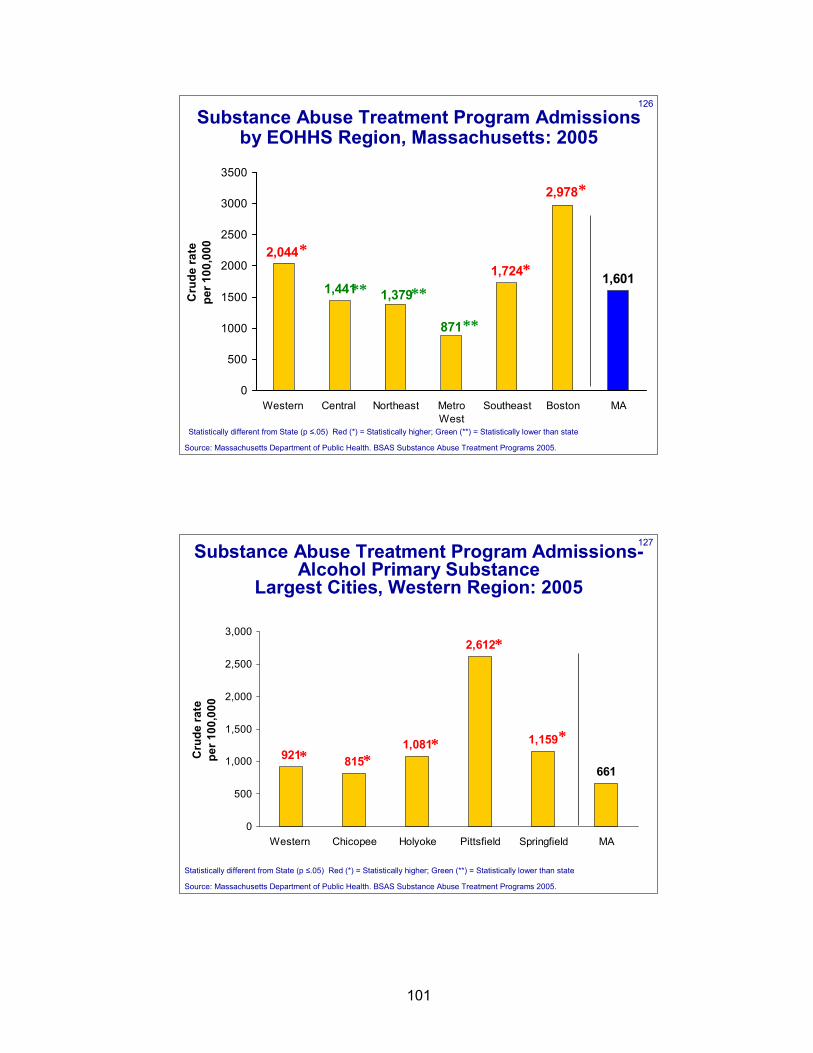
101
126
Substance Abuse Treatment Program Admissions by EOHHS Region, Massachusetts: 2005
1,724 1,601
871
1,379
2,044
1,441
2,978
0
500
1000
1500
2000
2500
3000
3500
Western Central Northeast MetroWest
Southeast Boston MA
Cru
de ra
te
per 1
00,0
00 *
** **
**
*
*
Source: Massachusetts Department of Public Health. BSAS Substance Abuse Treatment Programs 2005.
Statistically different from State (p ≤.05) Red (*) = Statistically higher; Green (**) = Statistically lower than state
127Substance Abuse Treatment Program Admissions-Alcohol Primary Substance
Largest Cities, Western Region: 2005
8151,081
2,612
9211,159
661
0
500
1,000
1,500
2,000
2,500
3,000
Western Chicopee Holyoke Pittsfield Springfield MA
Cru
de ra
te
per 1
00,0
00
Source: Massachusetts Department of Public Health. BSAS Substance Abuse Treatment Programs 2005.
**
*
**
Statistically different from State (p ≤.05) Red (*) = Statistically higher; Green (**) = Statistically lower than state
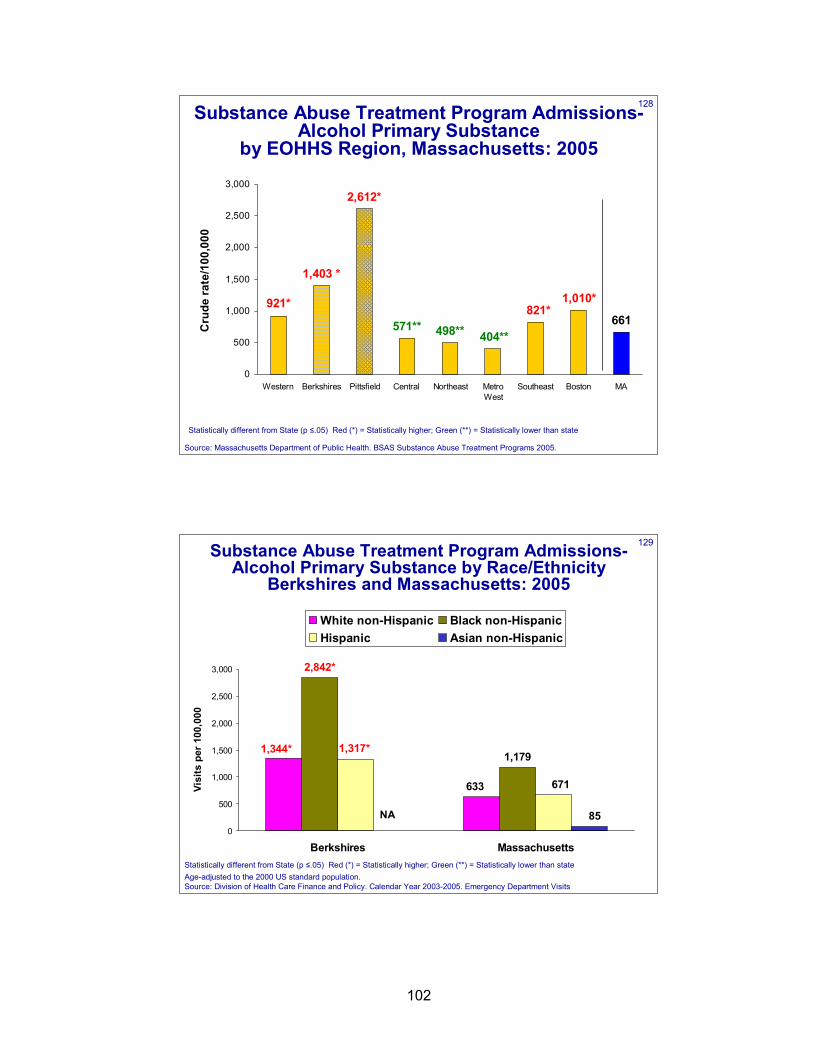
102
128Substance Abuse Treatment Program Admissions-Alcohol Primary Substance
by EOHHS Region, Massachusetts: 2005
661571**
2,612*
1,010*
1,403 *
821*921*
498** 404**
0
500
1,000
1,500
2,000
2,500
3,000
Western Berkshires Pittsfield Central Northeast MetroWest
Southeast Boston MA
Cru
de ra
te/1
00,0
00
Source: Massachusetts Department of Public Health. BSAS Substance Abuse Treatment Programs 2005.
Statistically different from State (p ≤.05) Red (*) = Statistically higher; Green (**) = Statistically lower than state
129Substance Abuse Treatment Program Admissions-Alcohol Primary Substance by Race/Ethnicity
Berkshires and Massachusetts: 2005
1,1791,344*
633
2,842*
1,317*
671
850
500
1,000
1,500
2,000
2,500
3,000
Berkshires Massachusetts
Visi
ts p
er 1
00,0
00
White non-Hispanic Black non-HispanicHispanic Asian non-Hispanic
NA
Age-adjusted to the 2000 US standard population. Source: Division of Health Care Finance and Policy. Calendar Year 2003-2005. Emergency Department Visits
Statistically different from State (p ≤.05) Red (*) = Statistically higher; Green (**) = Statistically lower than state
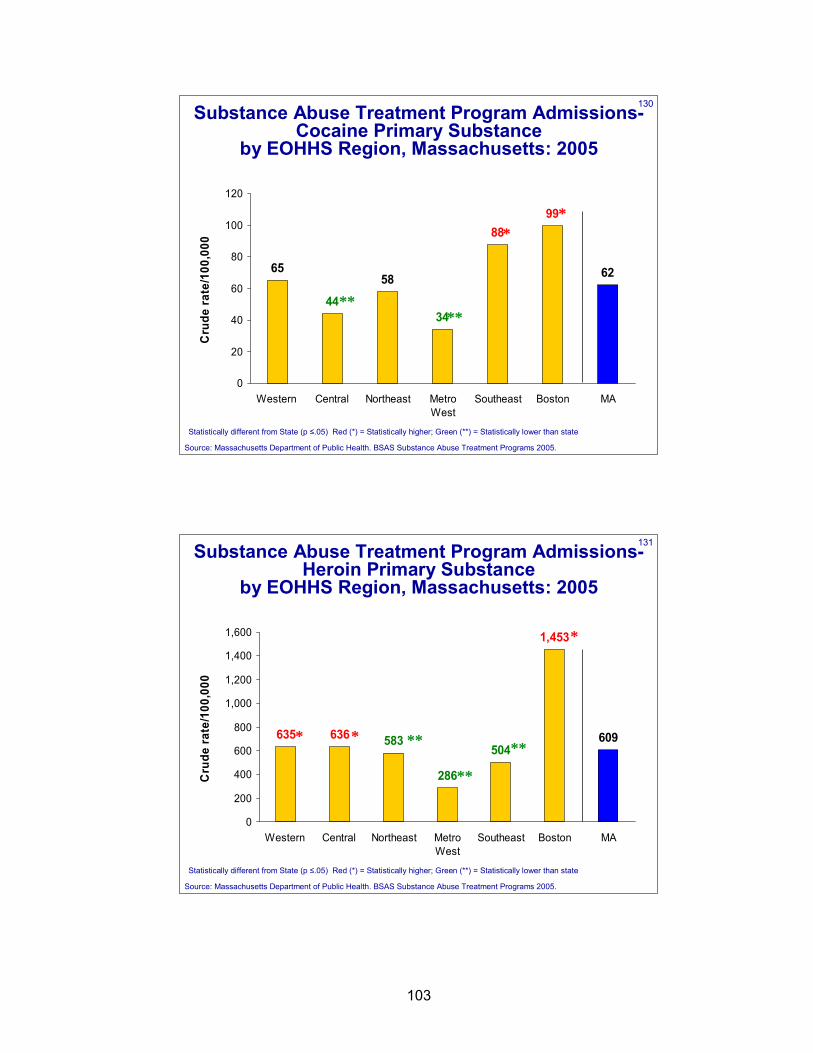
103
130Substance Abuse Treatment Program Admissions-Cocaine Primary Substance
by EOHHS Region, Massachusetts: 2005
6558 62
4434
8899
0
20
40
60
80
100
120
Western Central Northeast MetroWest
Southeast Boston MA
Cru
de ra
te/1
00,0
00
Source: Massachusetts Department of Public Health. BSAS Substance Abuse Treatment Programs 2005.
****
**
Statistically different from State (p ≤.05) Red (*) = Statistically higher; Green (**) = Statistically lower than state
131Substance Abuse Treatment Program Admissions-Heroin Primary Substance
by EOHHS Region, Massachusetts: 2005
609504
583
286
636635
1,453
0
200
400
600
800
1,000
1,200
1,400
1,600
Western Central Northeast MetroWest
Southeast Boston MA
Cru
de ra
te/1
00,0
00
Source: Massachusetts Department of Public Health. BSAS Substance Abuse Treatment Programs 2005.
*
**
**
*
* **
Statistically different from State (p ≤.05) Red (*) = Statistically higher; Green (**) = Statistically lower than state
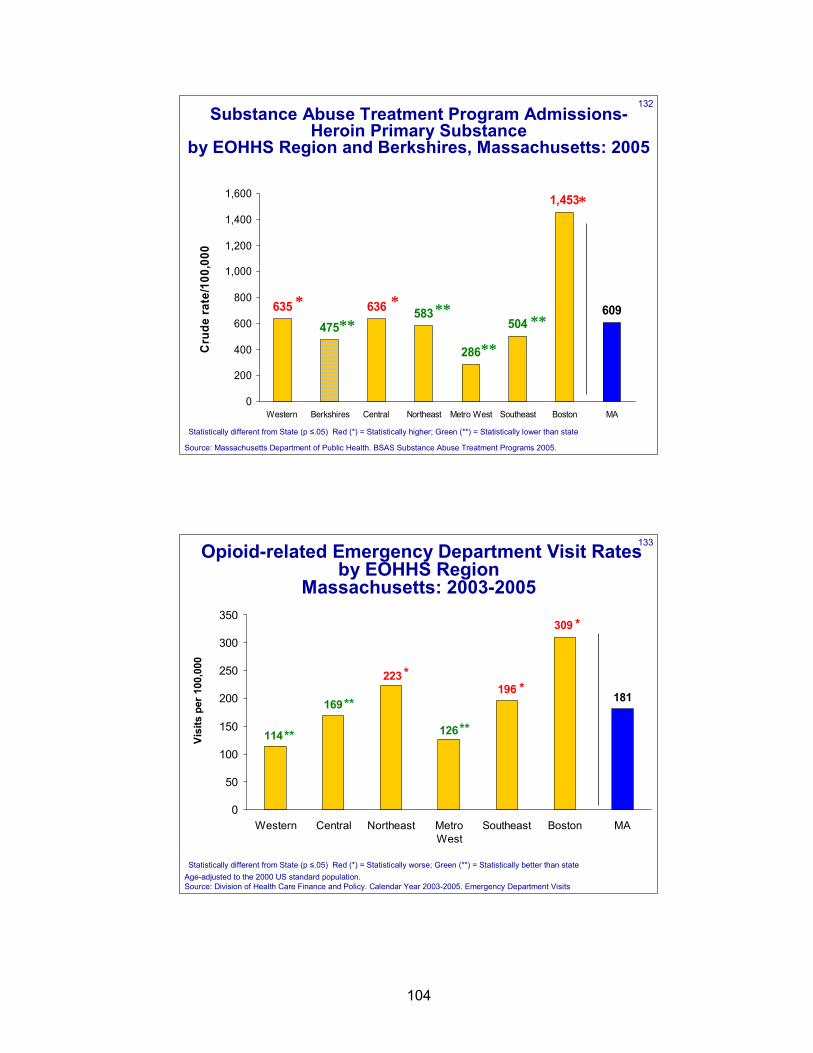
104
132Substance Abuse Treatment Program Admissions-
Heroin Primary Substance by EOHHS Region and Berkshires, Massachusetts: 2005
609
1,453
286
636 583475
635504
0
200
400
600
800
1,000
1,200
1,400
1,600
Western Berkshires Central Northeast Metro West Southeast Boston MA
Cru
de ra
te/1
00,0
00
Source: Massachusetts Department of Public Health. BSAS Substance Abuse Treatment Programs 2005.
*
**
**
*
* **
Statistically different from State (p ≤.05) Red (*) = Statistically higher; Green (**) = Statistically lower than state
**
133Opioid-related Emergency Department Visit Rates by EOHHS Region
Massachusetts: 2003-2005
181196
126
223
114
169
309
0
50
100
150
200
250
300
350
Western Central Northeast MetroWest
Southeast Boston MA
Visi
ts p
er 1
00,0
00
**
**
*
*
*
**
Statistically different from State (p ≤.05) Red (*) = Statistically worse; Green (**) = Statistically better than stateAge-adjusted to the 2000 US standard population. Source: Division of Health Care Finance and Policy. Calendar Year 2003-2005. Emergency Department Visits
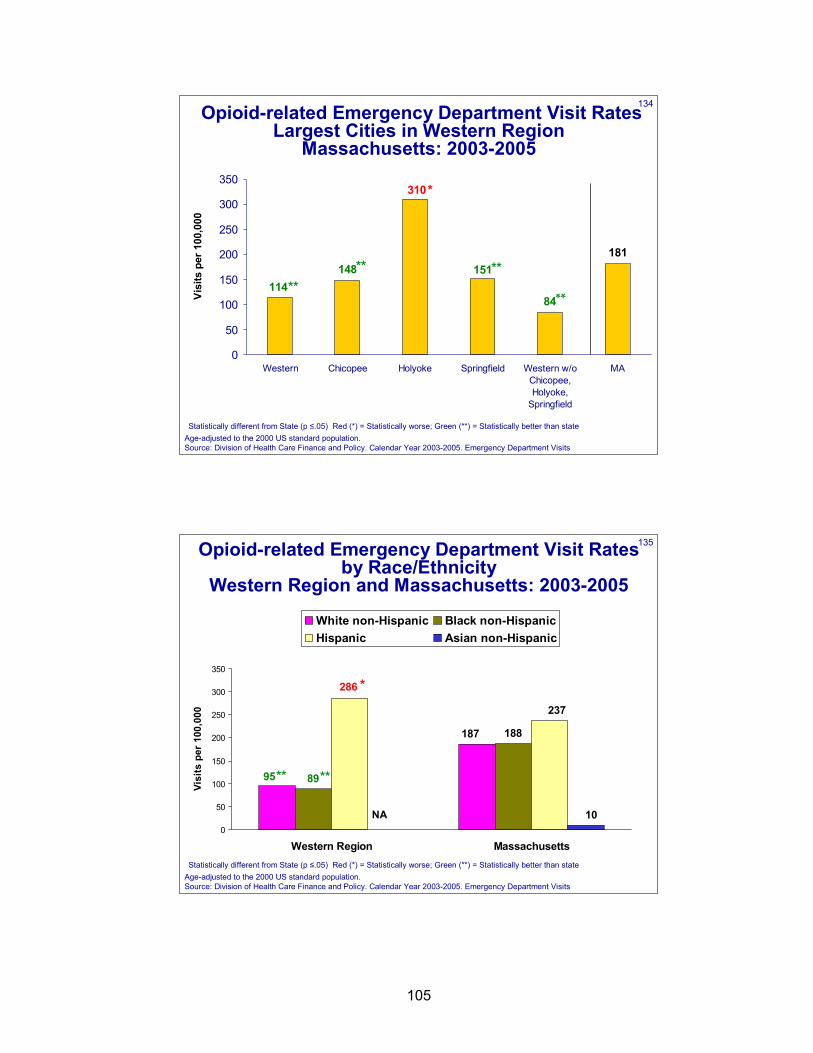
105
134Opioid-related Emergency Department Visit Rates Largest Cities in Western Region
Massachusetts: 2003-2005
84
151
310
114148
181
0
50
100
150
200
250
300
350
Western Chicopee Holyoke Springfield Western w/oChicopee,Holyoke,
Springfield
MA
Visi
ts p
er 1
00,0
00
**
*
**
Statistically different from State (p ≤.05) Red (*) = Statistically worse; Green (**) = Statistically better than stateAge-adjusted to the 2000 US standard population. Source: Division of Health Care Finance and Policy. Calendar Year 2003-2005. Emergency Department Visits
**
**
135Opioid-related Emergency Department Visit Ratesby Race/Ethnicity
Western Region and Massachusetts: 2003-2005
188
95
187
89
286
237
100
50
100
150
200
250
300
350
Western Region Massachusetts
Visi
ts p
er 1
00,0
00
White non-Hispanic Black non-HispanicHispanic Asian non-Hispanic
** **
*
NA
Statistically different from State (p ≤.05) Red (*) = Statistically worse; Green (**) = Statistically better than stateAge-adjusted to the 2000 US standard population. Source: Division of Health Care Finance and Policy. Calendar Year 2003-2005. Emergency Department Visits
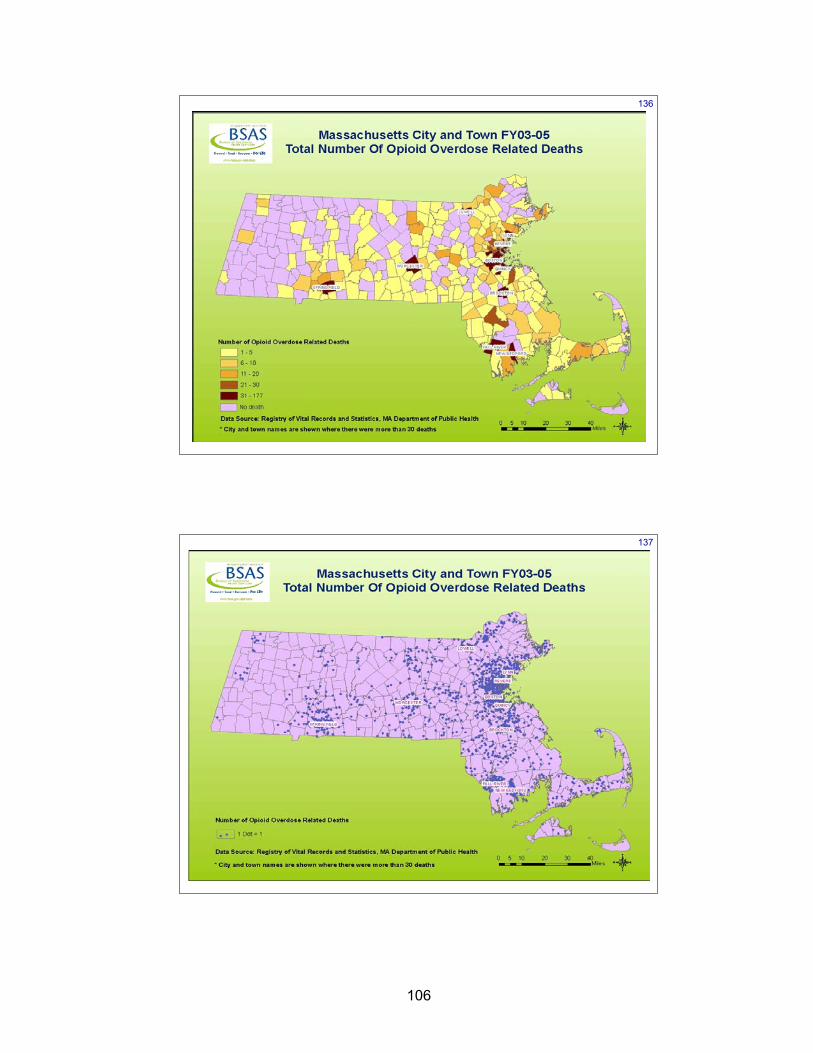
106
136
137
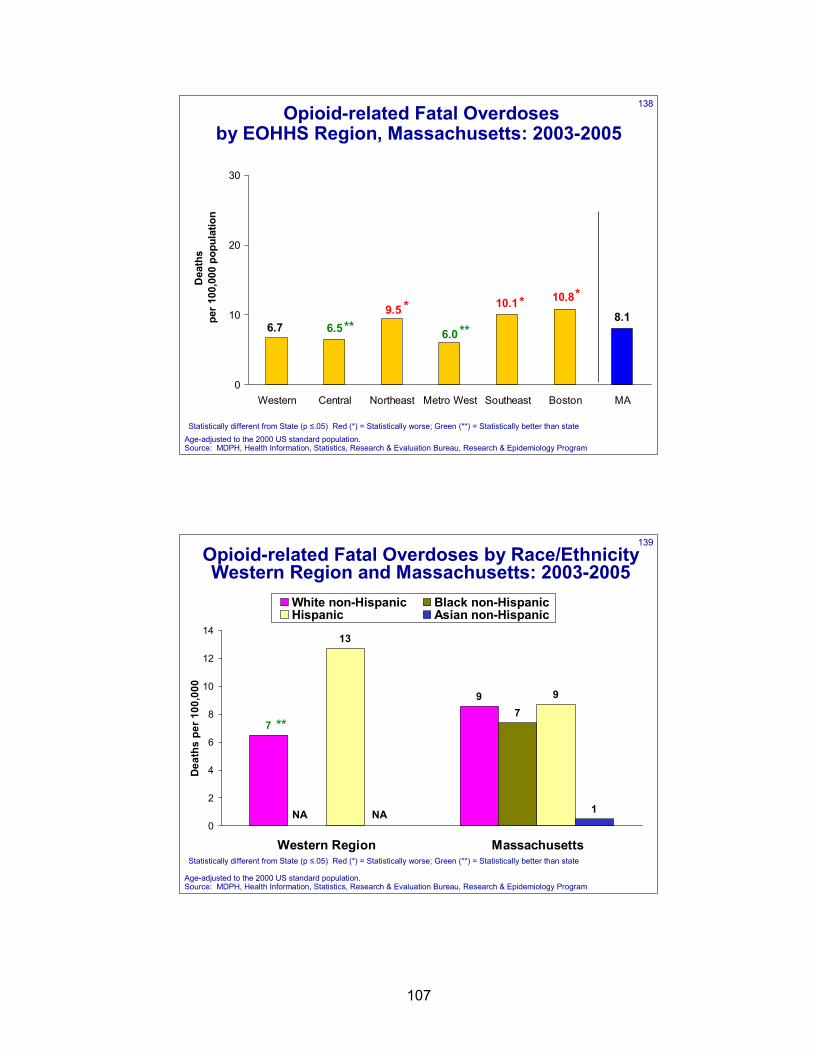
107
138Opioid-related Fatal Overdosesby EOHHS Region, Massachusetts: 2003-2005
8.110.1
6.0
9.56.7 6.5
10.8
0
10
20
30
Western Central Northeast Metro West Southeast Boston MA
Dea
ths
per 1
00,0
00 p
opul
atio
n
** **
* **
Age-adjusted to the 2000 US standard population. Source: MDPH, Health Information, Statistics, Research & Evaluation Bureau, Research & Epidemiology Program
Statistically different from State (p ≤.05) Red (*) = Statistically worse; Green (**) = Statistically better than state
139
97
13
9
1
7
0
2
4
6
8
10
12
14
Western Region Massachusetts
Dea
ths
per 1
00,0
00
White non-Hispanic Black non-HispanicHispanic Asian non-Hispanic
Opioid-related Fatal Overdoses by Race/EthnicityWestern Region and Massachusetts: 2003-2005
Age-adjusted to the 2000 US standard population. Source: MDPH, Health Information, Statistics, Research & Evaluation Bureau, Research & Epidemiology Program
NANA
**
Statistically different from State (p ≤.05) Red (*) = Statistically worse; Green (**) = Statistically better than state
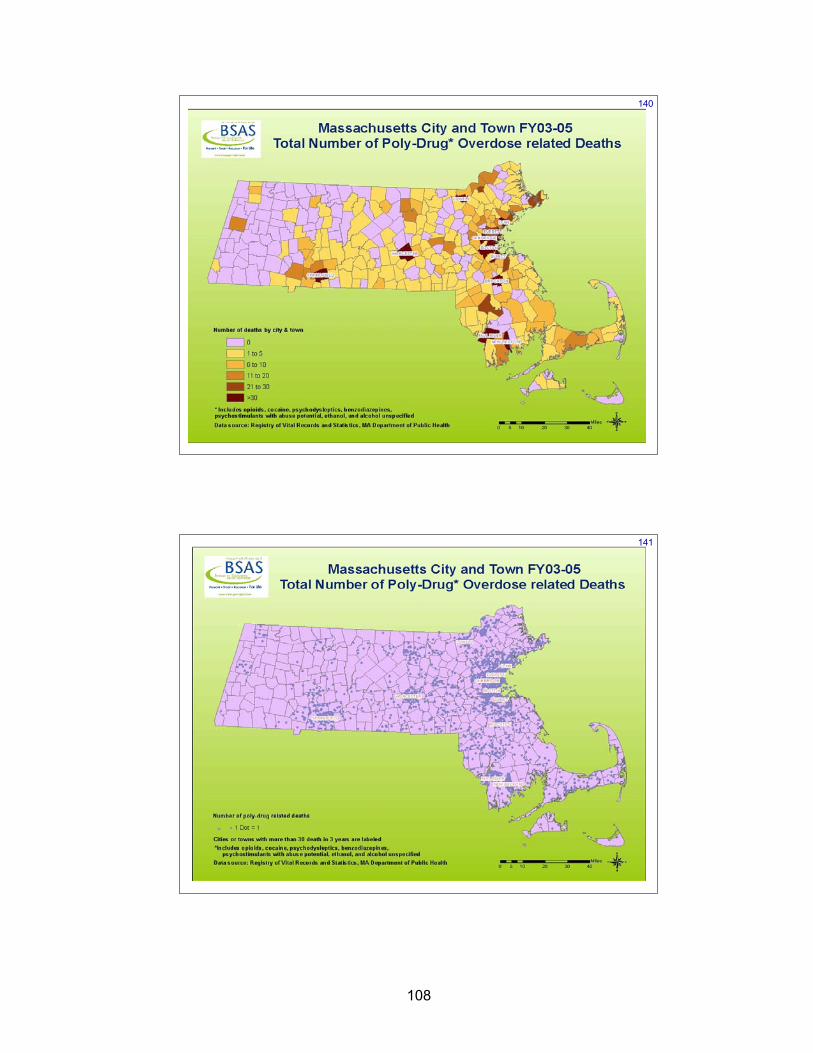
108
140
141
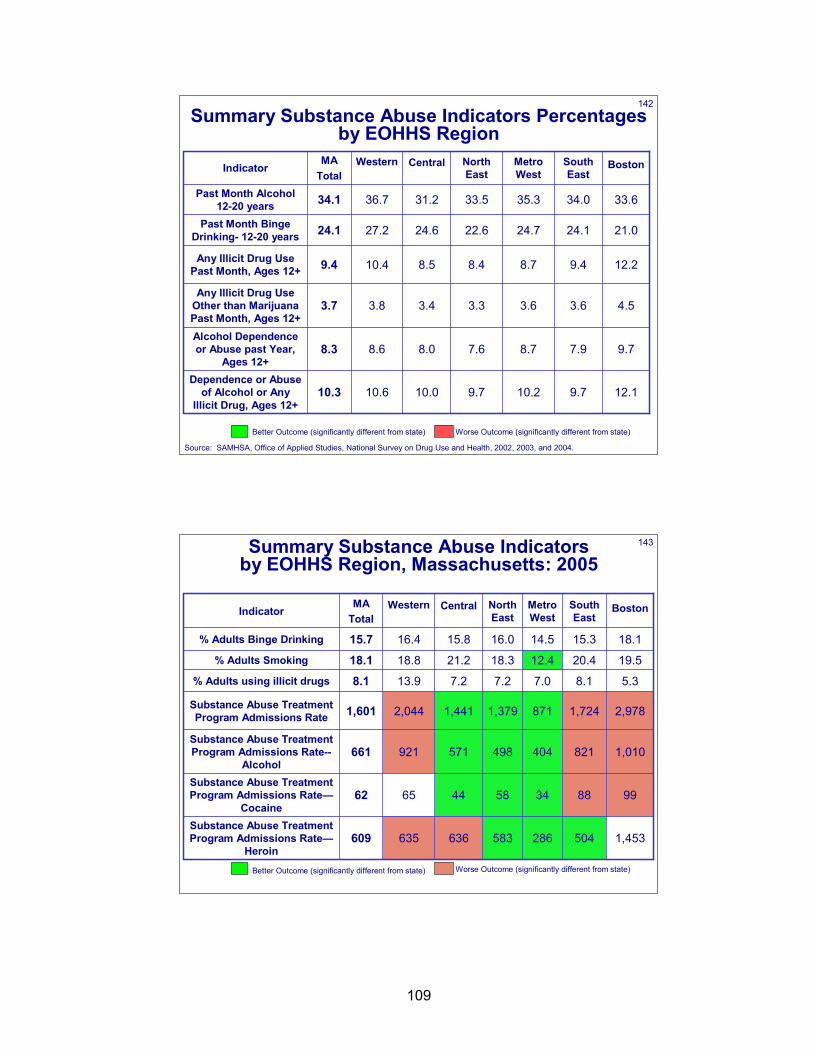
109
142
9.77.98.77.68.08.68.3Alcohol Dependence or Abuse past Year,
Ages 12+
10.6
3.8
10.4
27.2
36.7
Western
9.7
3.6
9.4
24.1
34.0
South East
12.110.29.710.010.3Dependence or Abuse
of Alcohol or Any Illicit Drug, Ages 12+
4.53.63.33.43.7Any Illicit Drug Use
Other than Marijuana Past Month, Ages 12+
12.28.78.48.59.4Any Illicit Drug Use Past Month, Ages 12+
21.024.722.624.624.1Past Month Binge Drinking- 12-20 years
33.635.333.531.234.1Past Month Alcohol 12-20 years
BostonMetro West
North East
CentralMATotal
Indicator
Summary Substance Abuse Indicators Percentages by EOHHS Region
Better Outcome (significantly different from state) Worse Outcome (significantly different from state)
Source: SAMHSA, Office of Applied Studies, National Survey on Drug Use and Health, 2002, 2003, and 2004.
143
99883458446562Substance Abuse Treatment Program Admissions Rate—
Cocaine
1,010821404498571921661Substance Abuse Treatment Program Admissions Rate--
Alcohol
635
2,044
13.9
18.8
16.4
Western
504
1,724
8.1
20.4
15.3
South East
1,453286583636609Substance Abuse Treatment Program Admissions Rate—
Heroin
2,9788711,3791,4411,601Substance Abuse Treatment Program Admissions Rate
5.37.07.27.28.1% Adults using illicit drugs
19.512.418.321.218.1% Adults Smoking
18.114.516.015.815.7% Adults Binge Drinking
BostonMetro West
North East
CentralMATotal
Indicator
Summary Substance Abuse Indicators by EOHHS Region, Massachusetts: 2005
Better Outcome (significantly different from state) Worse Outcome (significantly different from state)
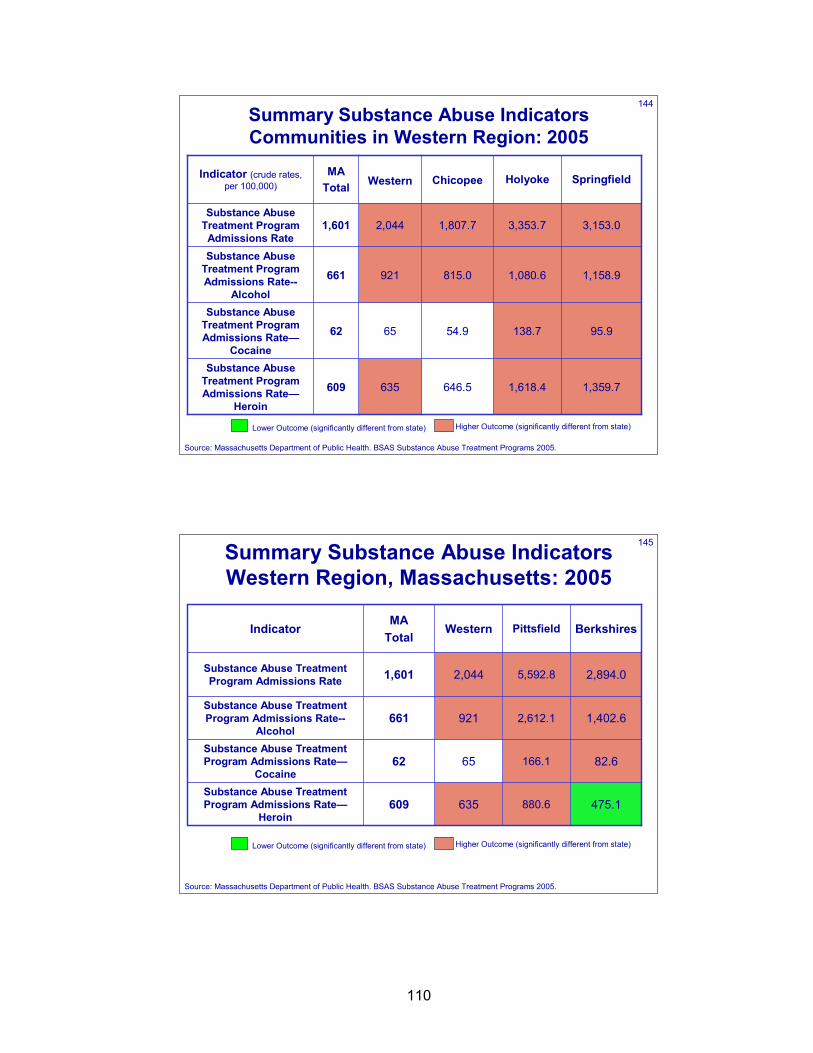
110
144
646.5
54.9
815.0
1,807.7
Chicopee
635
65
921
2,044
Western
1,618.4
138.7
1,080.6
3,353.7
Holyoke
95.962Substance Abuse
Treatment Program Admissions Rate—
Cocaine
1,158.9661Substance Abuse
Treatment Program Admissions Rate--
Alcohol
1,359.7
3,153.0
Springfield
609Substance Abuse
Treatment Program Admissions Rate—
Heroin
1,601Substance Abuse
Treatment Program Admissions Rate
MATotal
Indicator (crude rates, per 100,000)
Summary Substance Abuse Indicators Communities in Western Region: 2005
Source: Massachusetts Department of Public Health. BSAS Substance Abuse Treatment Programs 2005.
Lower Outcome (significantly different from state) Higher Outcome (significantly different from state)
145
880.6
166.1
2,612.1
5,592.8
Pittsfield
82.66562Substance Abuse Treatment Program Admissions Rate—
Cocaine
1,402.6921661Substance Abuse Treatment Program Admissions Rate--
Alcohol
635
2,044
Western
475.1609Substance Abuse Treatment Program Admissions Rate—
Heroin
2,894.01,601Substance Abuse Treatment Program Admissions Rate
BerkshiresMA
Total Indicator
Summary Substance Abuse Indicators Western Region, Massachusetts: 2005
Lower Outcome (significantly different from state) Higher Outcome (significantly different from state)
Source: Massachusetts Department of Public Health. BSAS Substance Abuse Treatment Programs 2005.
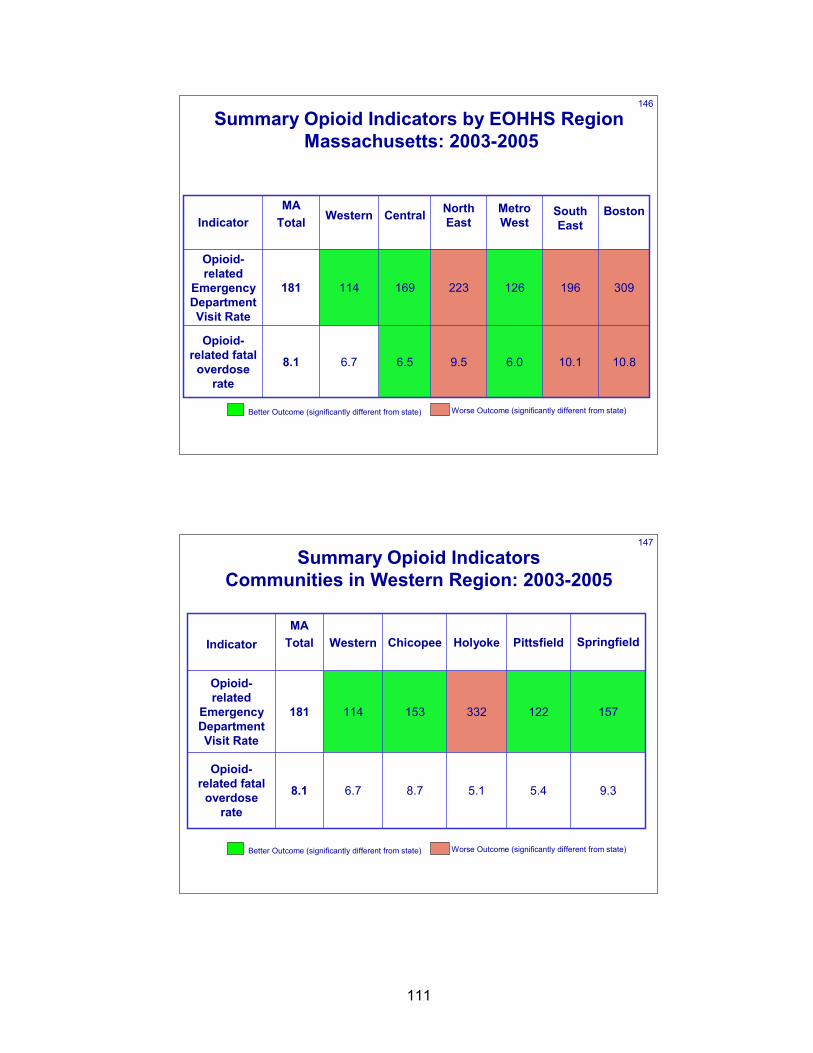
111
146
309196126223169114181
Opioid-related
Emergency Department Visit Rate
6.7
Western
10.1
South East
10.86.09.56.58.1
Opioid-related fatal
overdose rate
BostonMetro West
North East Central
MATotal Indicator
Summary Opioid Indicators by EOHHS RegionMassachusetts: 2003-2005
Better Outcome (significantly different from state) Worse Outcome (significantly different from state)
147
157122332153114181
Opioid-related
Emergency Department Visit Rate
6.7
Western
9.3
Springfield
5.45.18.78.1
Opioid-related fatal
overdose rate
PittsfieldHolyokeChicopeeMA
Total Indicator
Summary Opioid Indicators Communities in Western Region: 2003-2005
Better Outcome (significantly different from state) Worse Outcome (significantly different from state)

112
113
INJURY, VIOLENCE, & OCCUPATIONAL HEALTH

114
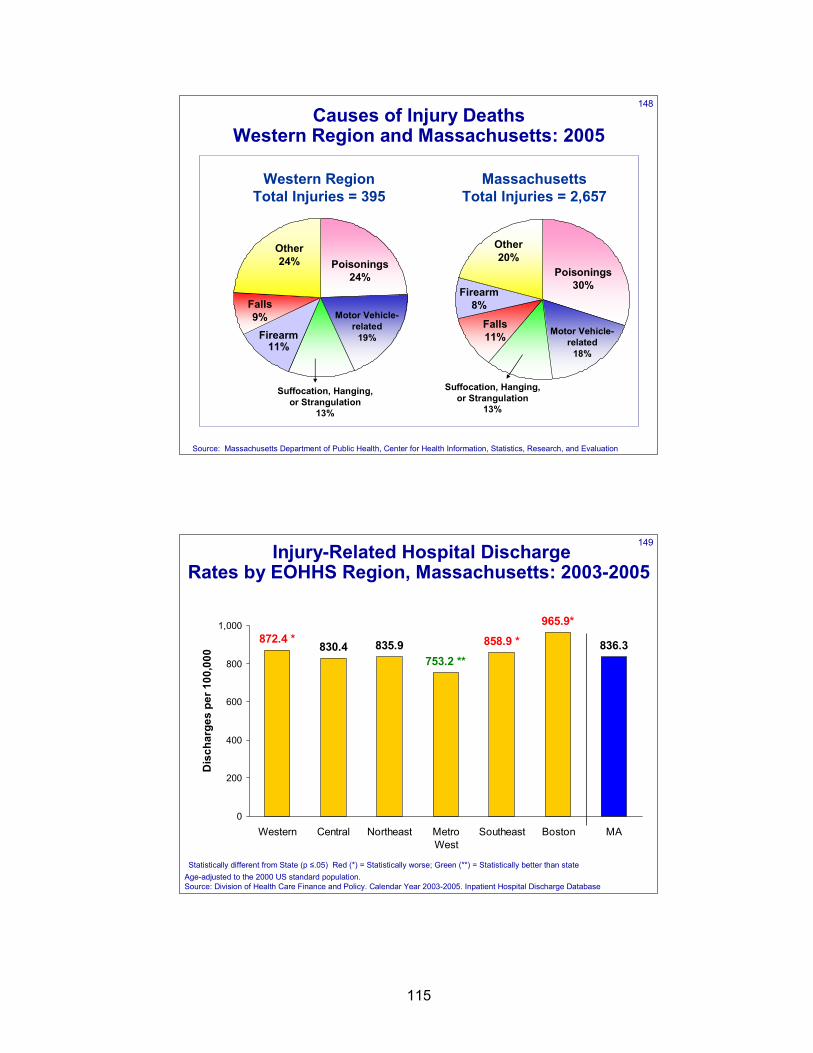
115
148Causes of Injury Deaths
Western Region and Massachusetts: 2005
Western Region Total Injuries = 395
Source: Massachusetts Department of Public Health, Center for Health Information, Statistics, Research, and Evaluation
Massachusetts Total Injuries = 2,657
Poisonings 30%Firearm
8%
Falls 11%
Suffocation, Hanging, or Strangulation
13%
Motor Vehicle-related
18%
Other20%Poisonings
24%
Firearm 11%
Suffocation, Hanging, or Strangulation
13%
Motor Vehicle-related
19%
Falls 9%
Other24%
149Injury-Related Hospital Discharge Rates by EOHHS Region, Massachusetts: 2003-2005
830.4 836.3
965.9*
858.9 *
753.2 **
872.4 * 835.9
0
200
400
600
800
1,000
Western Central Northeast MetroWest
Southeast Boston MA
Dis
char
ges
per 1
00,0
00
Statistically different from State (p ≤.05) Red (*) = Statistically worse; Green (**) = Statistically better than stateAge-adjusted to the 2000 US standard population. Source: Division of Health Care Finance and Policy. Calendar Year 2003-2005. Inpatient Hospital Discharge Database
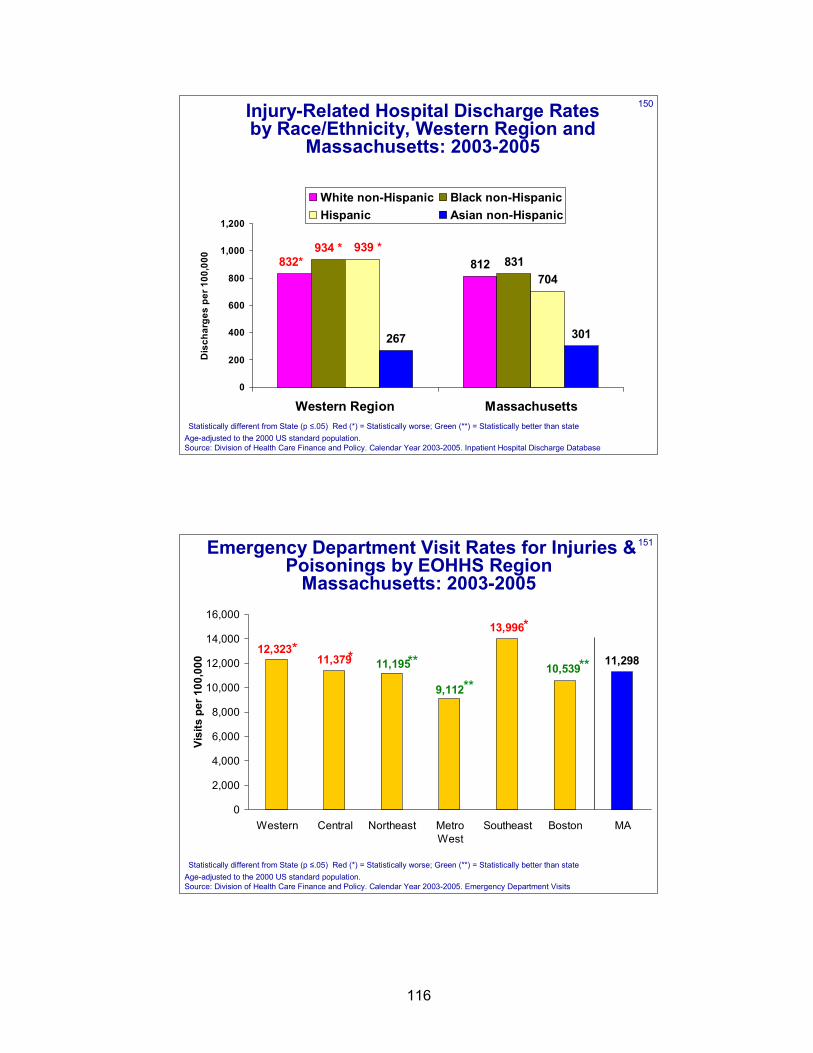
116
150
812 831704
267 301
832*934 * 939 *
0
200
400
600
800
1,000
1,200
Western Region Massachusetts
Dis
char
ges
per 1
00,0
00White non-Hispanic Black non-HispanicHispanic Asian non-Hispanic
Injury-Related Hospital Discharge Rates by Race/Ethnicity, Western Region and
Massachusetts: 2003-2005
Statistically different from State (p ≤.05) Red (*) = Statistically worse; Green (**) = Statistically better than stateAge-adjusted to the 2000 US standard population. Source: Division of Health Care Finance and Policy. Calendar Year 2003-2005. Inpatient Hospital Discharge Database
151Emergency Department Visit Rates for Injuries & Poisonings by EOHHS Region
Massachusetts: 2003-2005
13,996
11,298
9,112
11,19512,323
11,37910,539
0
2,000
4,000
6,000
8,000
10,000
12,000
14,000
16,000
Western Central Northeast MetroWest
Southeast Boston MA
Visi
ts p
er 1
00,0
00 *
**
*
*****
Statistically different from State (p ≤.05) Red (*) = Statistically worse; Green (**) = Statistically better than stateAge-adjusted to the 2000 US standard population. Source: Division of Health Care Finance and Policy. Calendar Year 2003-2005. Emergency Department Visits
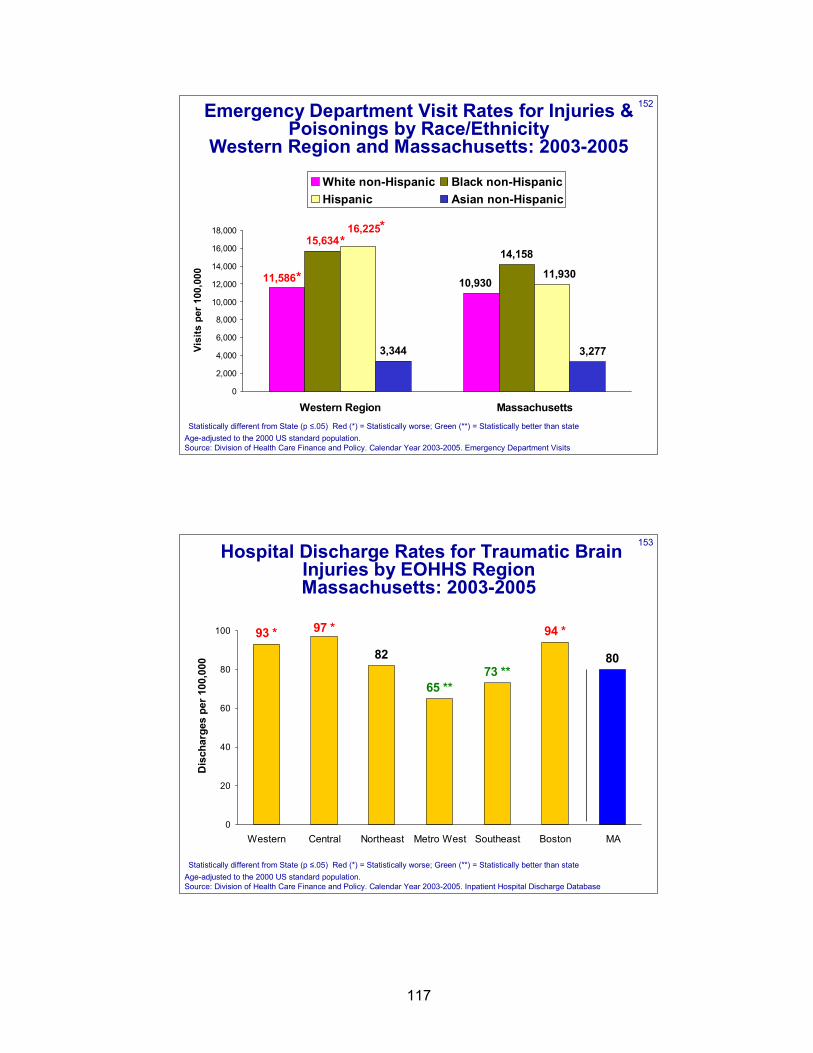
117
152Emergency Department Visit Rates for Injuries & Poisonings by Race/Ethnicity
Western Region and Massachusetts: 2003-2005
14,158
3,344
11,586 10,930
15,63416,225
11,930
3,277
0
2,000
4,000
6,000
8,000
10,000
12,000
14,000
16,000
18,000
Western Region Massachusetts
Visi
ts p
er 1
00,0
00White non-Hispanic Black non-HispanicHispanic Asian non-Hispanic
*
**
Statistically different from State (p ≤.05) Red (*) = Statistically worse; Green (**) = Statistically better than stateAge-adjusted to the 2000 US standard population. Source: Division of Health Care Finance and Policy. Calendar Year 2003-2005. Emergency Department Visits
153Hospital Discharge Rates for Traumatic Brain Injuries by EOHHS Region Massachusetts: 2003-2005
82 80
94 *
73 **65 **
97 *93 *
0
20
40
60
80
100
Western Central Northeast Metro West Southeast Boston MA
Dis
char
ges
per 1
00,0
00
Statistically different from State (p ≤.05) Red (*) = Statistically worse; Green (**) = Statistically better than stateAge-adjusted to the 2000 US standard population. Source: Division of Health Care Finance and Policy. Calendar Year 2003-2005. Inpatient Hospital Discharge Database
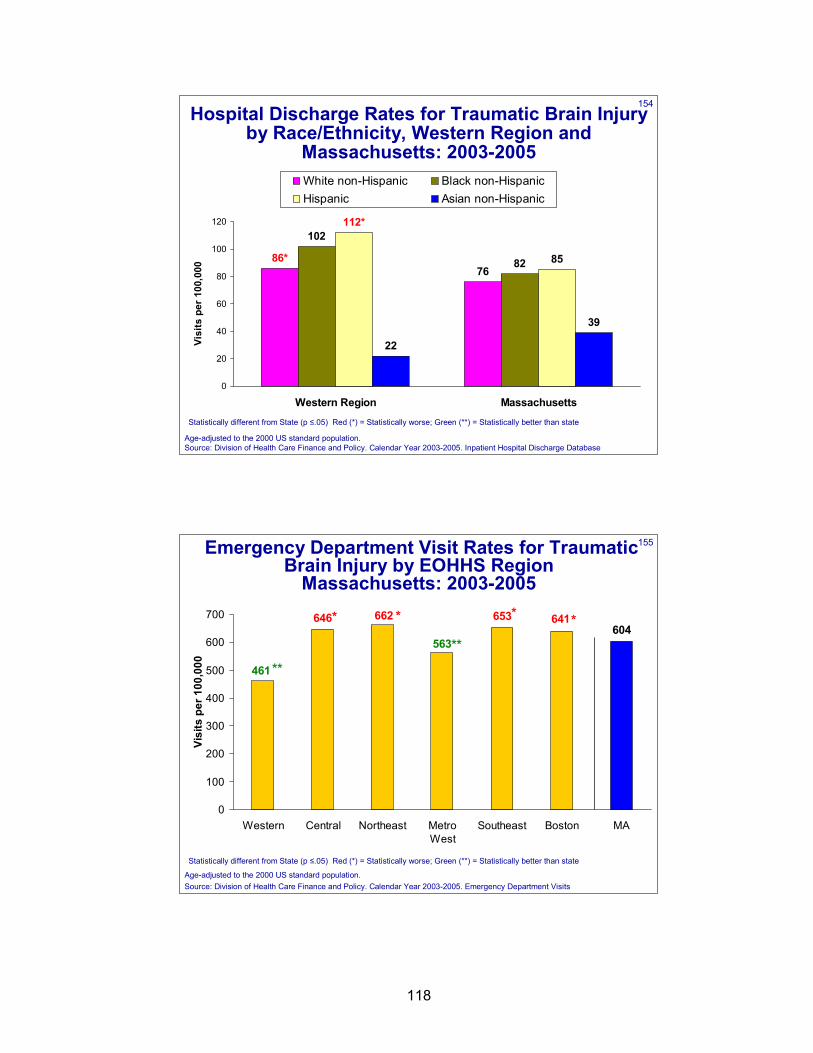
118
154Hospital Discharge Rates for Traumatic Brain Injury
by Race/Ethnicity, Western Region and Massachusetts: 2003-2005
76
102
82 85
22
39
86*
112*
0
20
40
60
80
100
120
Western Region Massachusetts
Visi
ts p
er 1
00,0
00White non-Hispanic Black non-HispanicHispanic Asian non-Hispanic
Statistically different from State (p ≤.05) Red (*) = Statistically worse; Green (**) = Statistically better than state
Age-adjusted to the 2000 US standard population. Source: Division of Health Care Finance and Policy. Calendar Year 2003-2005. Inpatient Hospital Discharge Database
155Emergency Department Visit Rates for Traumatic Brain Injury by EOHHS Region
Massachusetts: 2003-2005653
604563
662
461
646 641
0
100
200
300
400
500
600
700
Western Central Northeast MetroWest
Southeast Boston MA
Visi
ts p
er 1
00,0
00 **
**
**
Age-adjusted to the 2000 US standard population.Source: Division of Health Care Finance and Policy. Calendar Year 2003-2005. Emergency Department Visits
**
Statistically different from State (p ≤.05) Red (*) = Statistically worse; Green (**) = Statistically better than state
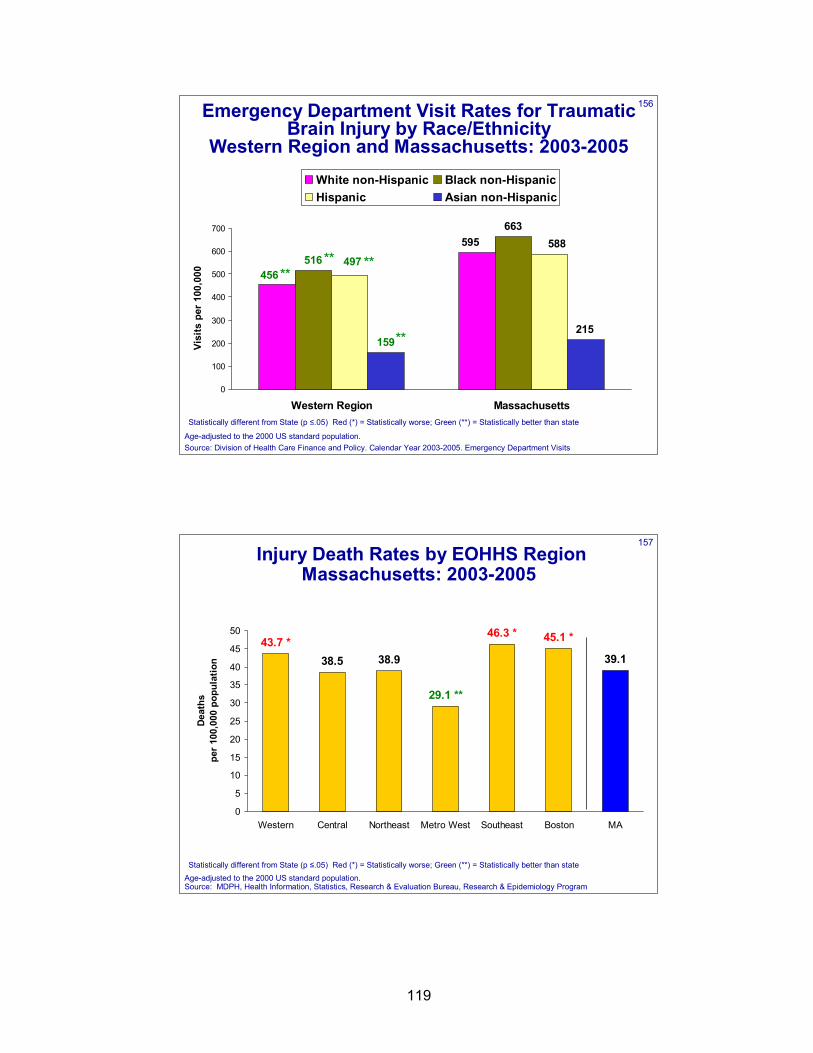
119
156Emergency Department Visit Rates for Traumatic Brain Injury by Race/Ethnicity
Western Region and Massachusetts: 2003-2005
663
456
595516 497
588
159215
0
100
200
300
400
500
600
700
Western Region Massachusetts
Visi
ts p
er 1
00,0
00White non-Hispanic Black non-HispanicHispanic Asian non-Hispanic
**** **
Age-adjusted to the 2000 US standard population.Source: Division of Health Care Finance and Policy. Calendar Year 2003-2005. Emergency Department Visits
**
Statistically different from State (p ≤.05) Red (*) = Statistically worse; Green (**) = Statistically better than state
157Injury Death Rates by EOHHS Region
Massachusetts: 2003-2005
38.5 38.9 39.1
45.1 *46.3 *
29.1 **
43.7 *
0
5
10
15
20
25
30
35
40
45
50
Western Central Northeast Metro West Southeast Boston MA
Deat
hs
per
100,
000
popu
latio
n
Age-adjusted to the 2000 US standard population. Source: MDPH, Health Information, Statistics, Research & Evaluation Bureau, Research & Epidemiology Program
Statistically different from State (p ≤.05) Red (*) = Statistically worse; Green (**) = Statistically better than state
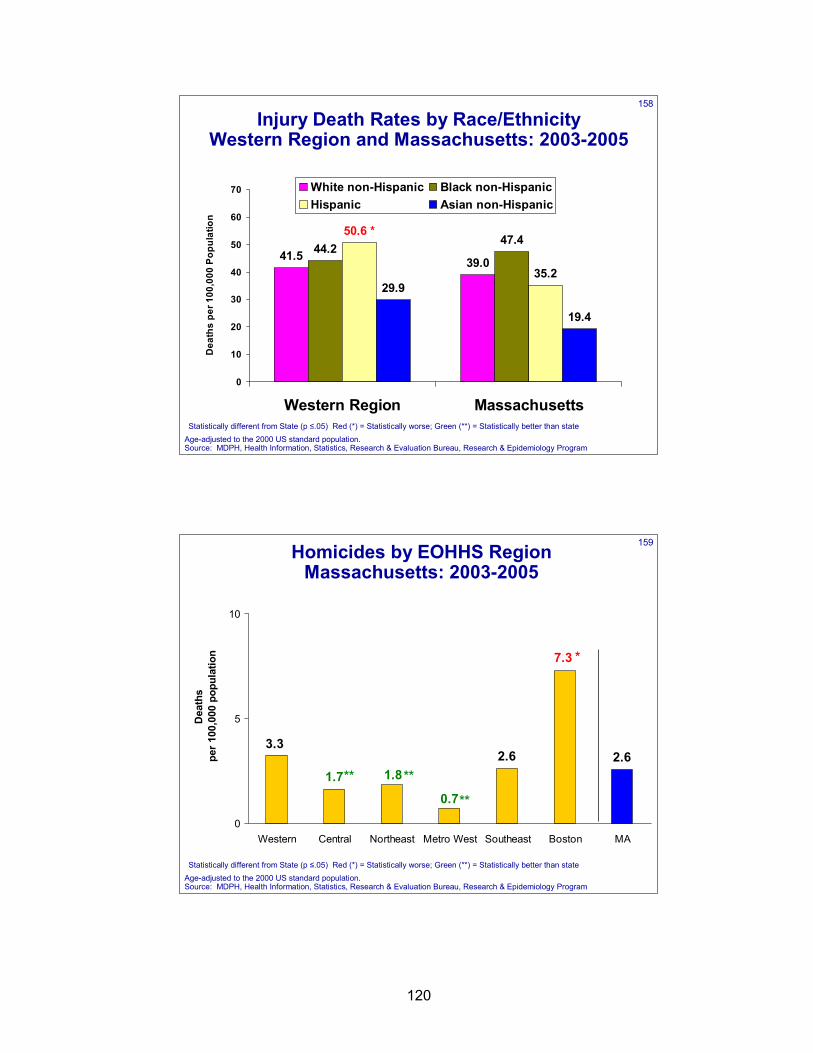
120
158
41.5 39.044.2
47.4
35.229.9
19.4
50.6 *
0
10
20
30
40
50
60
70
Western Region Massachusetts
Dea
ths
per 1
00,0
00 P
opul
atio
n
White non-Hispanic Black non-HispanicHispanic Asian non-Hispanic
Injury Death Rates by Race/EthnicityWestern Region and Massachusetts: 2003-2005
Age-adjusted to the 2000 US standard population. Source: MDPH, Health Information, Statistics, Research & Evaluation Bureau, Research & Epidemiology Program
Statistically different from State (p ≤.05) Red (*) = Statistically worse; Green (**) = Statistically better than state
159Homicides by EOHHS RegionMassachusetts: 2003-2005
2.6 2.6
0.7
1.8
3.3
1.7
7.3
0
5
10
Western Central Northeast Metro West Southeast Boston MA
Dea
ths
per 1
00,0
00 p
opul
atio
n
**
**
*
**
Age-adjusted to the 2000 US standard population. Source: MDPH, Health Information, Statistics, Research & Evaluation Bureau, Research & Epidemiology Program
Statistically different from State (p ≤.05) Red (*) = Statistically worse; Green (**) = Statistically better than state
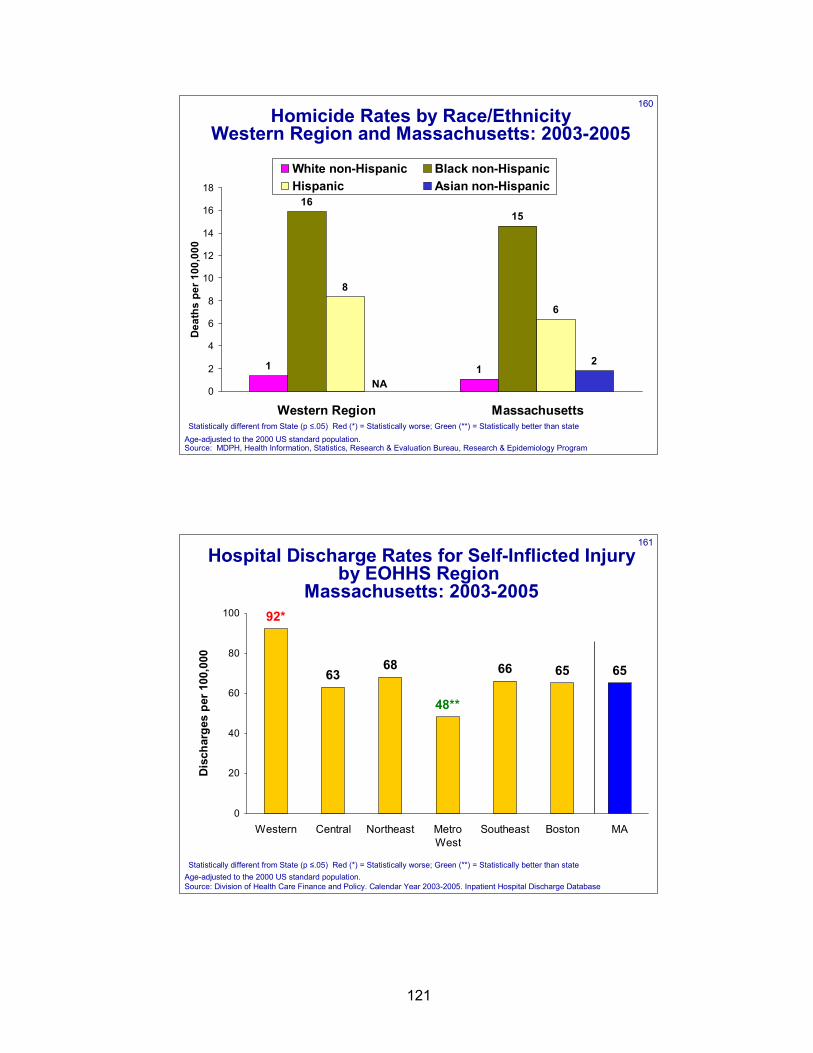
121
160Homicide Rates by Race/Ethnicity
Western Region and Massachusetts: 2003-2005
1 1
1615
8
6
2
0
2
4
6
8
10
12
14
16
18
Western Region Massachusetts
Dea
ths
per 1
00,0
00
White non-Hispanic Black non-HispanicHispanic Asian non-Hispanic
Age-adjusted to the 2000 US standard population. Source: MDPH, Health Information, Statistics, Research & Evaluation Bureau, Research & Epidemiology Program
NA
Statistically different from State (p ≤.05) Red (*) = Statistically worse; Green (**) = Statistically better than state
161
Hospital Discharge Rates for Self-Inflicted Injury by EOHHS Region
Massachusetts: 2003-2005
68 66 65 6563
48**
92*
0
20
40
60
80
100
Western Central Northeast MetroWest
Southeast Boston MA
Dis
char
ges
per 1
00,0
00
Statistically different from State (p ≤.05) Red (*) = Statistically worse; Green (**) = Statistically better than stateAge-adjusted to the 2000 US standard population. Source: Division of Health Care Finance and Policy. Calendar Year 2003-2005. Inpatient Hospital Discharge Database
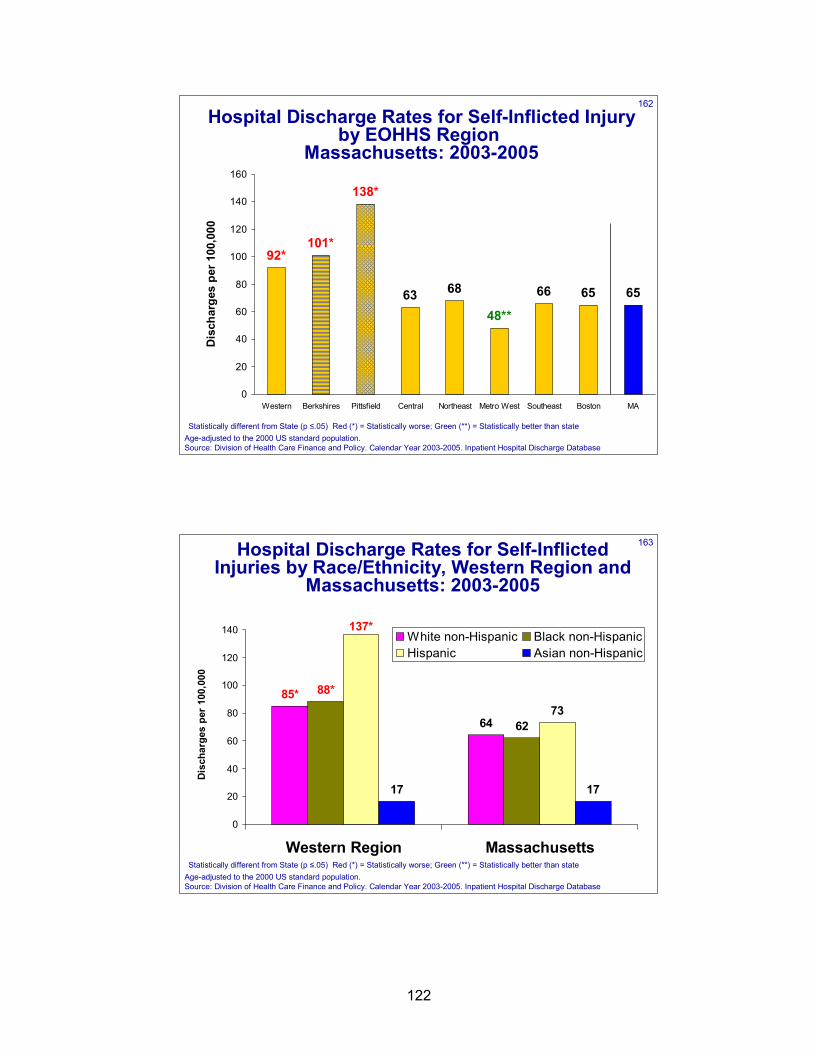
122
162
Hospital Discharge Rates for Self-Inflicted Injury by EOHHS Region
Massachusetts: 2003-2005
68 66 65 65
48**
138*
101*
63
92*
0
20
40
60
80
100
120
140
160
Western Berkshires Pittsfield Central Northeast Metro West Southeast Boston MA
Dis
char
ges
per 1
00,0
00
Statistically different from State (p ≤.05) Red (*) = Statistically worse; Green (**) = Statistically better than stateAge-adjusted to the 2000 US standard population. Source: Division of Health Care Finance and Policy. Calendar Year 2003-2005. Inpatient Hospital Discharge Database
163
64 6273
17 17
85* 88*
137*
0
20
40
60
80
100
120
140
Western Region Massachusetts
Dis
char
ges
per
100,
000
White non-Hispanic Black non-HispanicHispanic Asian non-Hispanic
Hospital Discharge Rates for Self-Inflicted Injuries by Race/Ethnicity, Western Region and
Massachusetts: 2003-2005
Statistically different from State (p ≤.05) Red (*) = Statistically worse; Green (**) = Statistically better than stateAge-adjusted to the 2000 US standard population. Source: Division of Health Care Finance and Policy. Calendar Year 2003-2005. Inpatient Hospital Discharge Database
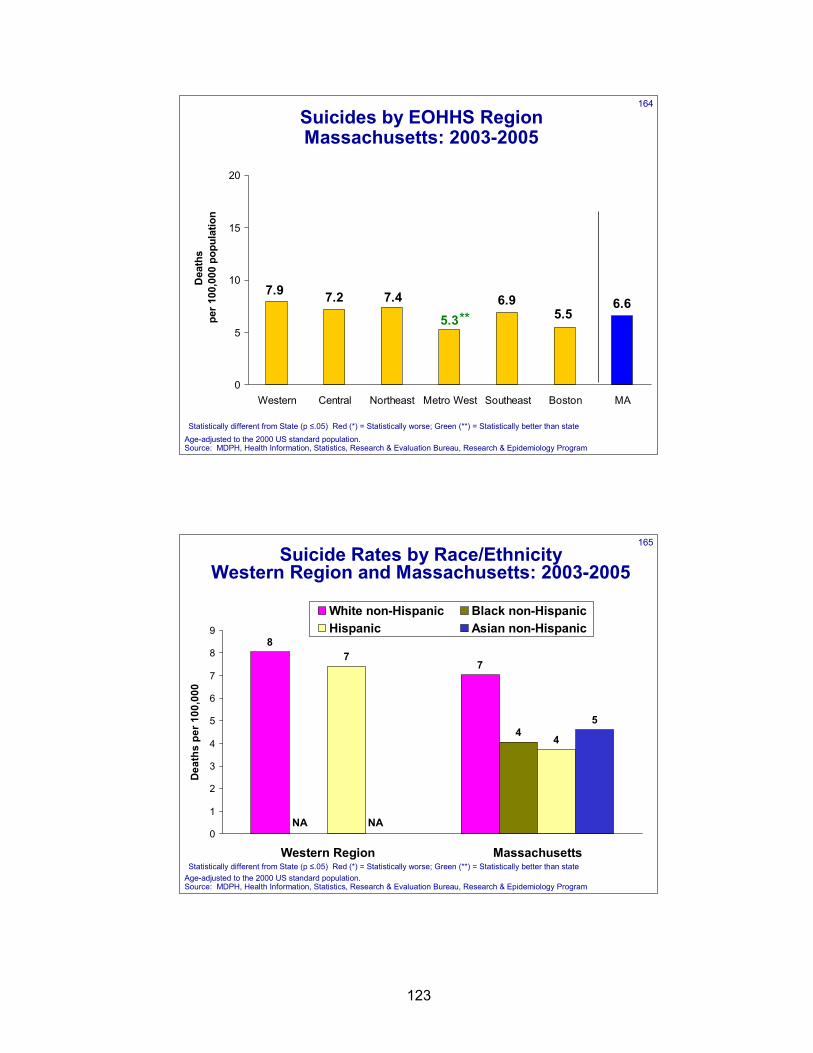
123
164
Suicides by EOHHS RegionMassachusetts: 2003-2005
6.9 6.65.3
7.47.9 7.25.5
0
5
10
15
20
Western Central Northeast Metro West Southeast Boston MA
Dea
ths
per 1
00,0
00 p
opul
atio
n
**
Age-adjusted to the 2000 US standard population. Source: MDPH, Health Information, Statistics, Research & Evaluation Bureau, Research & Epidemiology Program
Statistically different from State (p ≤.05) Red (*) = Statistically worse; Green (**) = Statistically better than state
165Suicide Rates by Race/Ethnicity
Western Region and Massachusetts: 2003-2005
8
7
4
7
4
5
0
1
2
3
4
5
6
7
8
9
Western Region Massachusetts
Dea
ths
per 1
00,0
00
White non-Hispanic Black non-HispanicHispanic Asian non-Hispanic
Age-adjusted to the 2000 US standard population. Source: MDPH, Health Information, Statistics, Research & Evaluation Bureau, Research & Epidemiology Program
NANA
Statistically different from State (p ≤.05) Red (*) = Statistically worse; Green (**) = Statistically better than state
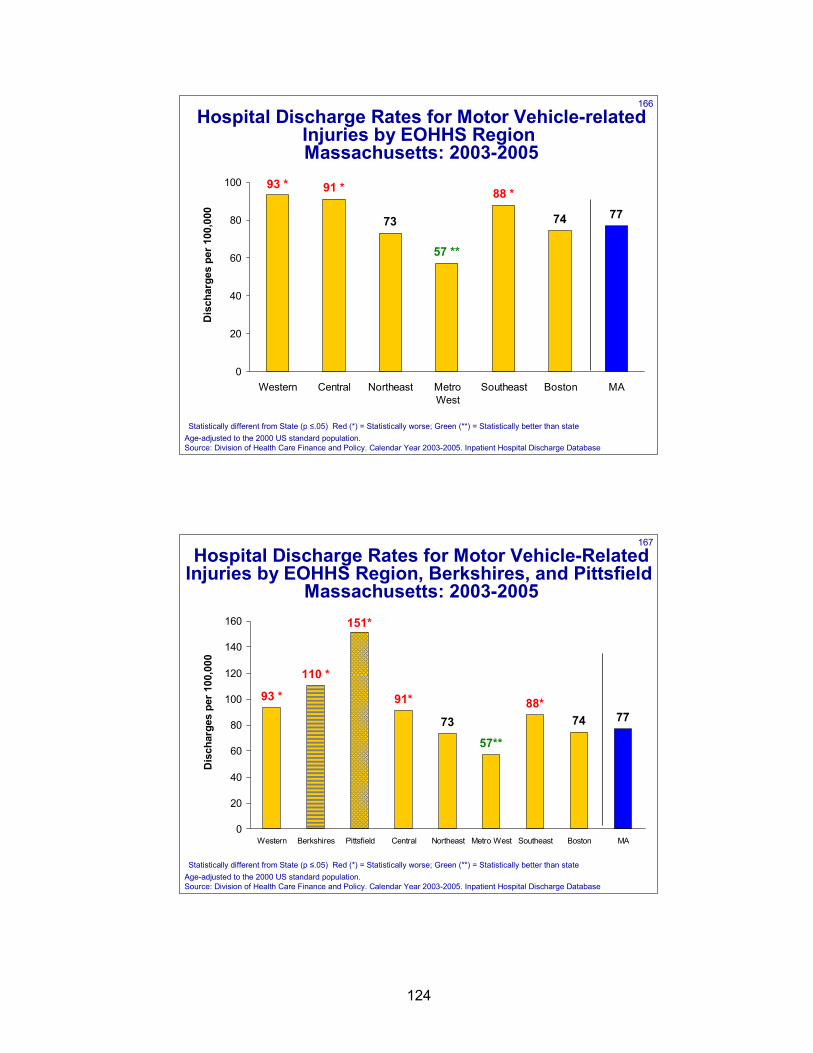
124
166
Hospital Discharge Rates for Motor Vehicle-related Injuries by EOHHS RegionMassachusetts: 2003-2005
73 74 7788 *
57 **
91 *93 *
0
20
40
60
80
100
Western Central Northeast MetroWest
Southeast Boston MA
Dis
char
ges
per 1
00,0
00
Statistically different from State (p ≤.05) Red (*) = Statistically worse; Green (**) = Statistically better than stateAge-adjusted to the 2000 US standard population. Source: Division of Health Care Finance and Policy. Calendar Year 2003-2005. Inpatient Hospital Discharge Database
167
Hospital Discharge Rates for Motor Vehicle-Related Injuries by EOHHS Region, Berkshires, and Pittsfield
Massachusetts: 2003-2005
74 77
57**
88*
151*
73
91*
110 *
93 *
0
20
40
60
80
100
120
140
160
Western Berkshires Pittsfield Central Northeast Metro West Southeast Boston MA
Dis
char
ges
per 1
00,0
00
Statistically different from State (p ≤.05) Red (*) = Statistically worse; Green (**) = Statistically better than stateAge-adjusted to the 2000 US standard population. Source: Division of Health Care Finance and Policy. Calendar Year 2003-2005. Inpatient Hospital Discharge Database
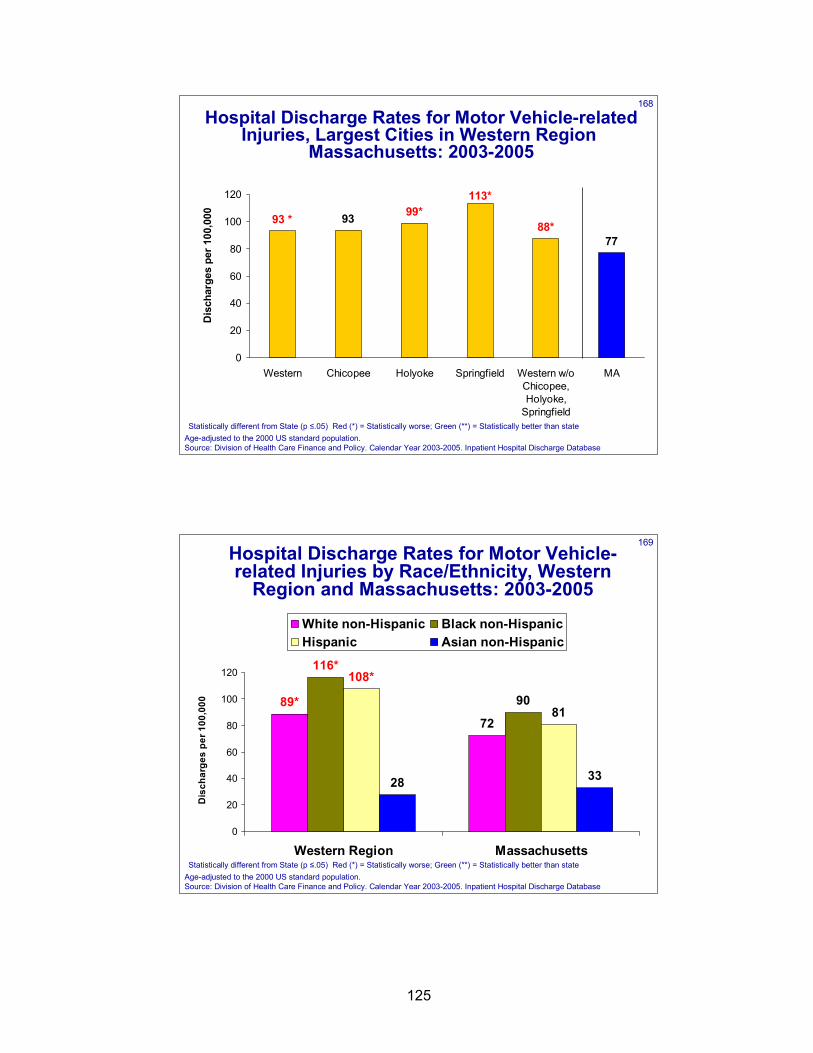
125
168
Hospital Discharge Rates for Motor Vehicle-related Injuries, Largest Cities in Western Region
Massachusetts: 2003-2005
77
99*88*
113*
9393 *
0
20
40
60
80
100
120
Western Chicopee Holyoke Springfield Western w/oChicopee,Holyoke,
Springfield
MA
Dis
char
ges
per 1
00,0
00
Statistically different from State (p ≤.05) Red (*) = Statistically worse; Green (**) = Statistically better than stateAge-adjusted to the 2000 US standard population. Source: Division of Health Care Finance and Policy. Calendar Year 2003-2005. Inpatient Hospital Discharge Database
169
72
9081
28 33
89*
116*108*
0
20
40
60
80
100
120
Western Region Massachusetts
Dis
char
ges
per 1
00,0
00
White non-Hispanic Black non-HispanicHispanic Asian non-Hispanic
Hospital Discharge Rates for Motor Vehicle-related Injuries by Race/Ethnicity, Western
Region and Massachusetts: 2003-2005
Statistically different from State (p ≤.05) Red (*) = Statistically worse; Green (**) = Statistically better than stateAge-adjusted to the 2000 US standard population. Source: Division of Health Care Finance and Policy. Calendar Year 2003-2005. Inpatient Hospital Discharge Database
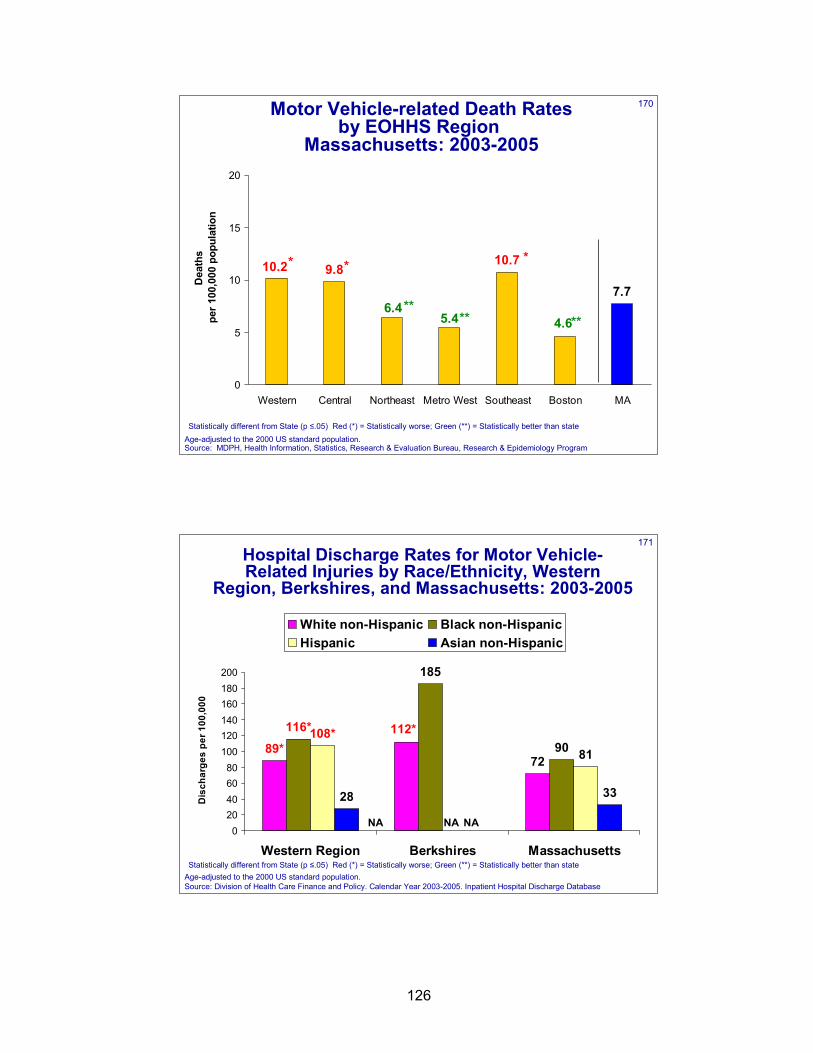
126
170Motor Vehicle-related Death Rates by EOHHS Region
Massachusetts: 2003-2005
10.7
7.7
5.46.4
10.2 9.8
4.6
0
5
10
15
20
Western Central Northeast Metro West Southeast Boston MA
Dea
ths
per 1
00,0
00 p
opul
atio
n
**
Age-adjusted to the 2000 US standard population. Source: MDPH, Health Information, Statistics, Research & Evaluation Bureau, Research & Epidemiology Program
* *
**
*
**
Statistically different from State (p ≤.05) Red (*) = Statistically worse; Green (**) = Statistically better than state
171
72
185
90 81
28 33
112*89*
116*108*
020406080
100120140160180200
Western Region Berkshires Massachusetts
Dis
char
ges
per 1
00,0
00
White non-Hispanic Black non-HispanicHispanic Asian non-Hispanic
Hospital Discharge Rates for Motor Vehicle-Related Injuries by Race/Ethnicity, Western
Region, Berkshires, and Massachusetts: 2003-2005
Statistically different from State (p ≤.05) Red (*) = Statistically worse; Green (**) = Statistically better than stateAge-adjusted to the 2000 US standard population. Source: Division of Health Care Finance and Policy. Calendar Year 2003-2005. Inpatient Hospital Discharge Database
NANA NA
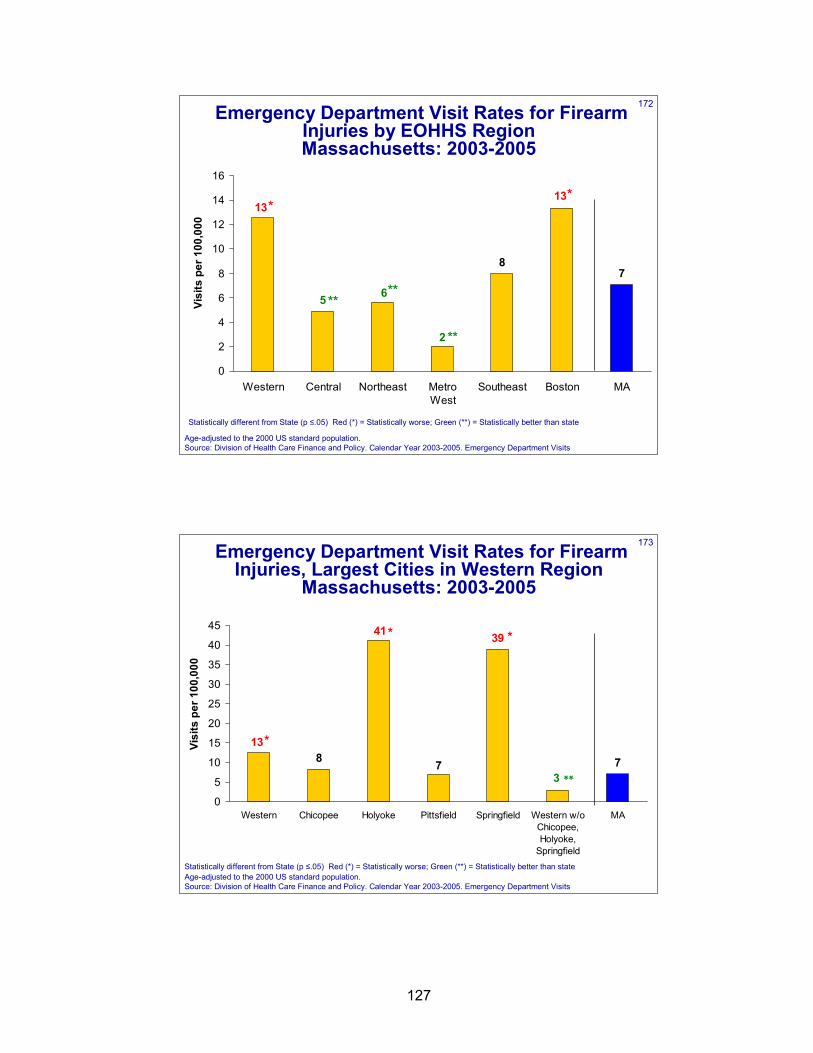
127
172Emergency Department Visit Rates for Firearm Injuries by EOHHS Region Massachusetts: 2003-2005
87
2
6
13
5
13
0
2
4
6
8
10
12
14
16
Western Central Northeast MetroWest
Southeast Boston MA
Visi
ts p
er 1
00,0
00
**
*
**
*
Age-adjusted to the 2000 US standard population.Source: Division of Health Care Finance and Policy. Calendar Year 2003-2005. Emergency Department Visits
**
Statistically different from State (p ≤.05) Red (*) = Statistically worse; Green (**) = Statistically better than state
173
7
39
7
41
138
3
0
5
10
15
20
25
30
35
40
45
Western Chicopee Holyoke Pittsfield Springfield Western w/oChicopee,Holyoke,
Springfield
MA
Visi
ts p
er 1
00,0
00
Emergency Department Visit Rates for Firearm Injuries, Largest Cities in Western Region
Massachusetts: 2003-2005
**
**
Age-adjusted to the 2000 US standard population.Source: Division of Health Care Finance and Policy. Calendar Year 2003-2005. Emergency Department Visits
Statistically different from State (p ≤.05) Red (*) = Statistically worse; Green (**) = Statistically better than state
*
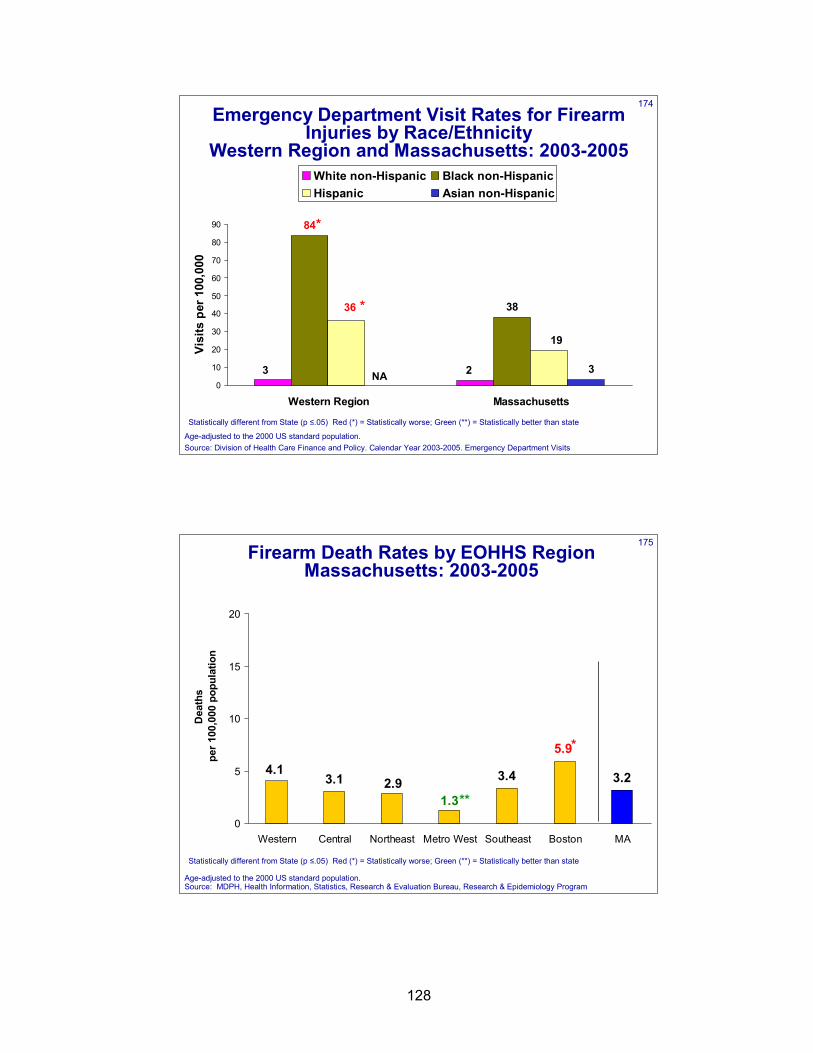
128
174Emergency Department Visit Rates for Firearm
Injuries by Race/EthnicityWestern Region and Massachusetts: 2003-2005
38
3 2
84
36
19
30
10
20
30
40
50
60
70
80
90
Western Region Massachusetts
Visi
ts p
er 1
00,0
00
White non-Hispanic Black non-HispanicHispanic Asian non-Hispanic
*
*
Age-adjusted to the 2000 US standard population.Source: Division of Health Care Finance and Policy. Calendar Year 2003-2005. Emergency Department Visits
NA
Statistically different from State (p ≤.05) Red (*) = Statistically worse; Green (**) = Statistically better than state
175Firearm Death Rates by EOHHS Region
Massachusetts: 2003-2005
3.4 3.2
1.32.9
4.13.1
5.9
0
5
10
15
20
Western Central Northeast Metro West Southeast Boston MA
Dea
ths
per 1
00,0
00 p
opul
atio
n
Age-adjusted to the 2000 US standard population. Source: MDPH, Health Information, Statistics, Research & Evaluation Bureau, Research & Epidemiology Program
*
**
Statistically different from State (p ≤.05) Red (*) = Statistically worse; Green (**) = Statistically better than state
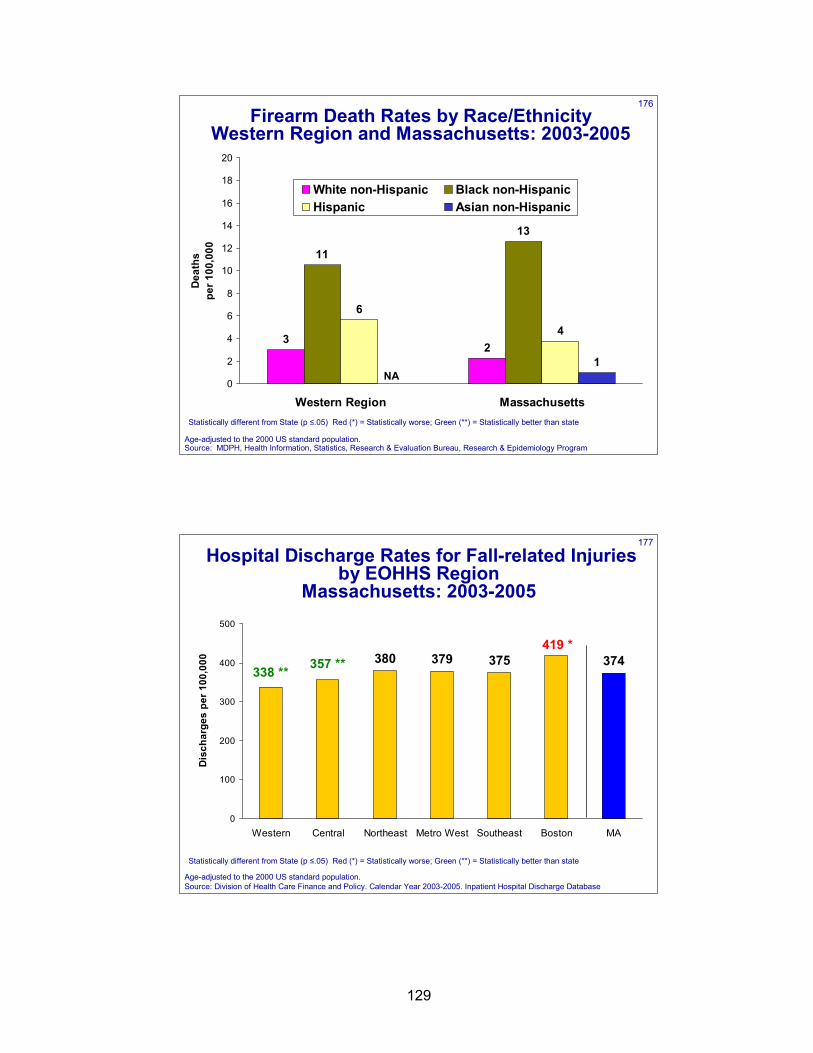
129
176Firearm Death Rates by Race/Ethnicity
Western Region and Massachusetts: 2003-2005
32
11
13
6
4
1
0
2
4
6
8
10
12
14
16
18
20
Western Region Massachusetts
Dea
ths
per 1
00,0
00
White non-Hispanic Black non-HispanicHispanic Asian non-Hispanic
Age-adjusted to the 2000 US standard population. Source: MDPH, Health Information, Statistics, Research & Evaluation Bureau, Research & Epidemiology Program
NA
Statistically different from State (p ≤.05) Red (*) = Statistically worse; Green (**) = Statistically better than state
177
Hospital Discharge Rates for Fall-related Injuries by EOHHS Region
Massachusetts: 2003-2005
380 379 375 374338 ** 357 **
419 *
0
100
200
300
400
500
Western Central Northeast Metro West Southeast Boston MA
Dis
char
ges
per 1
00,0
00
Statistically different from State (p ≤.05) Red (*) = Statistically worse; Green (**) = Statistically better than state
Age-adjusted to the 2000 US standard population. Source: Division of Health Care Finance and Policy. Calendar Year 2003-2005. Inpatient Hospital Discharge Database
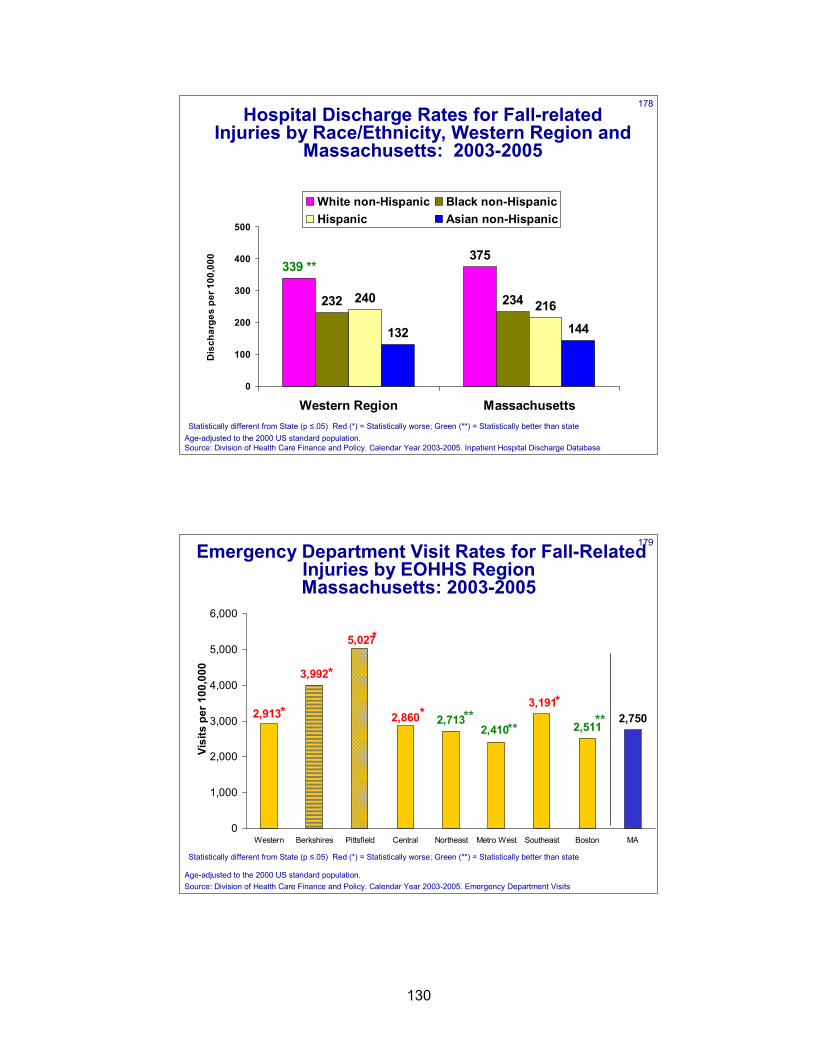
130
178
375
232 234240 216
132 144
339 **
0
100
200
300
400
500
Western Region Massachusetts
Dis
char
ges
per 1
00,0
00White non-Hispanic Black non-HispanicHispanic Asian non-Hispanic
Hospital Discharge Rates for Fall-related Injuries by Race/Ethnicity, Western Region and
Massachusetts: 2003-2005
Statistically different from State (p ≤.05) Red (*) = Statistically worse; Green (**) = Statistically better than stateAge-adjusted to the 2000 US standard population. Source: Division of Health Care Finance and Policy. Calendar Year 2003-2005. Inpatient Hospital Discharge Database
179Emergency Department Visit Rates for Fall-Related Injuries by EOHHS Region Massachusetts: 2003-2005
2,7502,5112,713
3,1912,860
5,027
2,913
3,992
2,410
0
1,000
2,000
3,000
4,000
5,000
6,000
Western Berkshires Pittsfield Central Northeast Metro West Southeast Boston MA
Visi
ts p
er 1
00,0
00
*** ***
Age-adjusted to the 2000 US standard population.Source: Division of Health Care Finance and Policy. Calendar Year 2003-2005. Emergency Department Visits
*
**
Statistically different from State (p ≤.05) Red (*) = Statistically worse; Green (**) = Statistically better than state
*
*
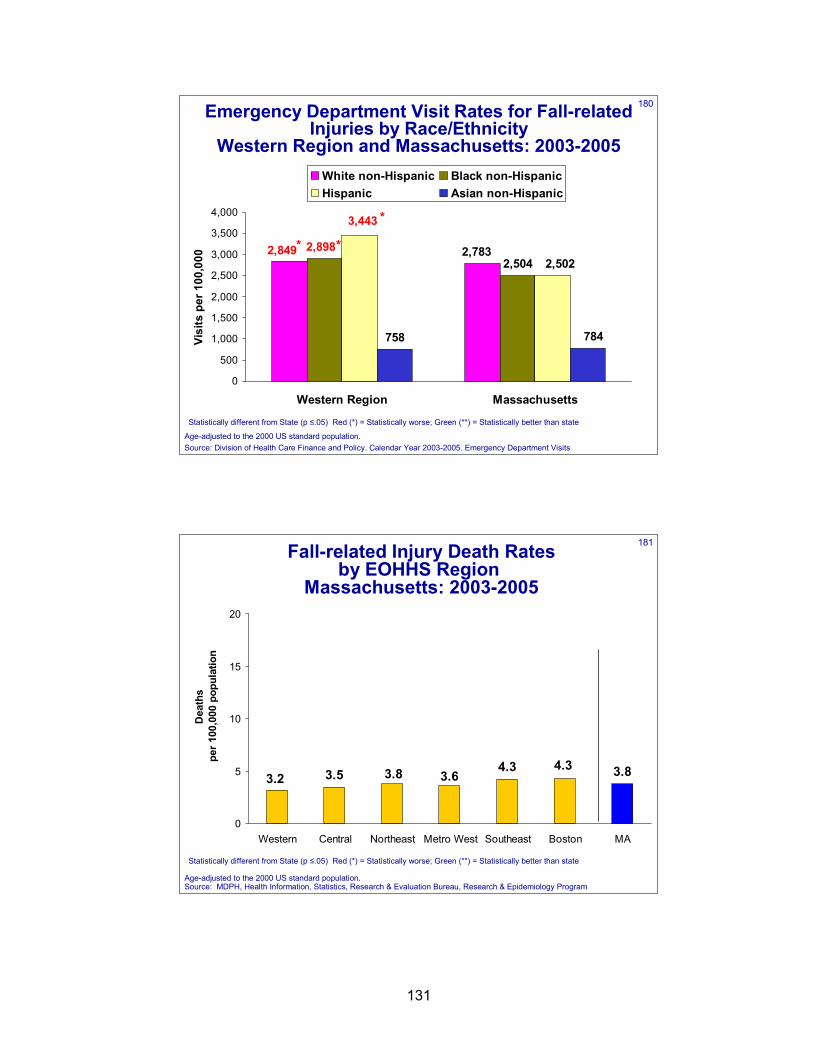
131
180Emergency Department Visit Rates for Fall-related Injuries by Race/Ethnicity
Western Region and Massachusetts: 2003-2005
2,504
758
2,849 2,7832,898
3,443
2,502
784
0
500
1,000
1,500
2,000
2,500
3,000
3,500
4,000
Western Region Massachusetts
Visi
ts p
er 1
00,0
00
White non-Hispanic Black non-HispanicHispanic Asian non-Hispanic
* *
*
Age-adjusted to the 2000 US standard population.Source: Division of Health Care Finance and Policy. Calendar Year 2003-2005. Emergency Department Visits
Statistically different from State (p ≤.05) Red (*) = Statistically worse; Green (**) = Statistically better than state
181Fall-related Injury Death Rates by EOHHS Region
Massachusetts: 2003-2005
4.3 3.83.63.83.2 3.54.3
0
5
10
15
20
Western Central Northeast Metro West Southeast Boston MA
Dea
ths
per 1
00,0
00 p
opul
atio
n
Age-adjusted to the 2000 US standard population. Source: MDPH, Health Information, Statistics, Research & Evaluation Bureau, Research & Epidemiology Program
Statistically different from State (p ≤.05) Red (*) = Statistically worse; Green (**) = Statistically better than state
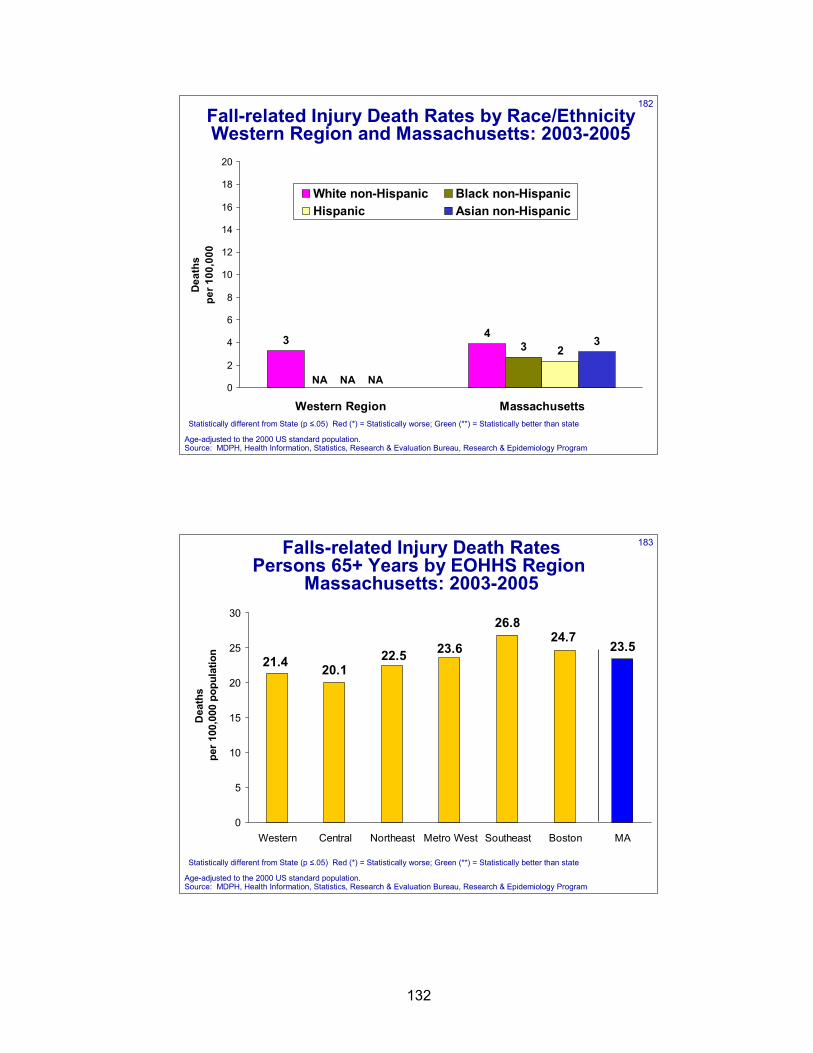
132
182Fall-related Injury Death Rates by Race/EthnicityWestern Region and Massachusetts: 2003-2005
3 43 2
3
0
2
4
6
8
10
12
14
16
18
20
Western Region Massachusetts
Dea
ths
per 1
00,0
00White non-Hispanic Black non-HispanicHispanic Asian non-Hispanic
Age-adjusted to the 2000 US standard population. Source: MDPH, Health Information, Statistics, Research & Evaluation Bureau, Research & Epidemiology Program
NANA NA
Statistically different from State (p ≤.05) Red (*) = Statistically worse; Green (**) = Statistically better than state
183Falls-related Injury Death Rates Persons 65+ Years by EOHHS Region
Massachusetts: 2003-2005
26.8
23.523.622.521.4 20.1
24.7
0
5
10
15
20
25
30
Western Central Northeast Metro West Southeast Boston MA
Dea
ths
per 1
00,0
00 p
opul
atio
n
Age-adjusted to the 2000 US standard population. Source: MDPH, Health Information, Statistics, Research & Evaluation Bureau, Research & Epidemiology Program
Statistically different from State (p ≤.05) Red (*) = Statistically worse; Green (**) = Statistically better than state
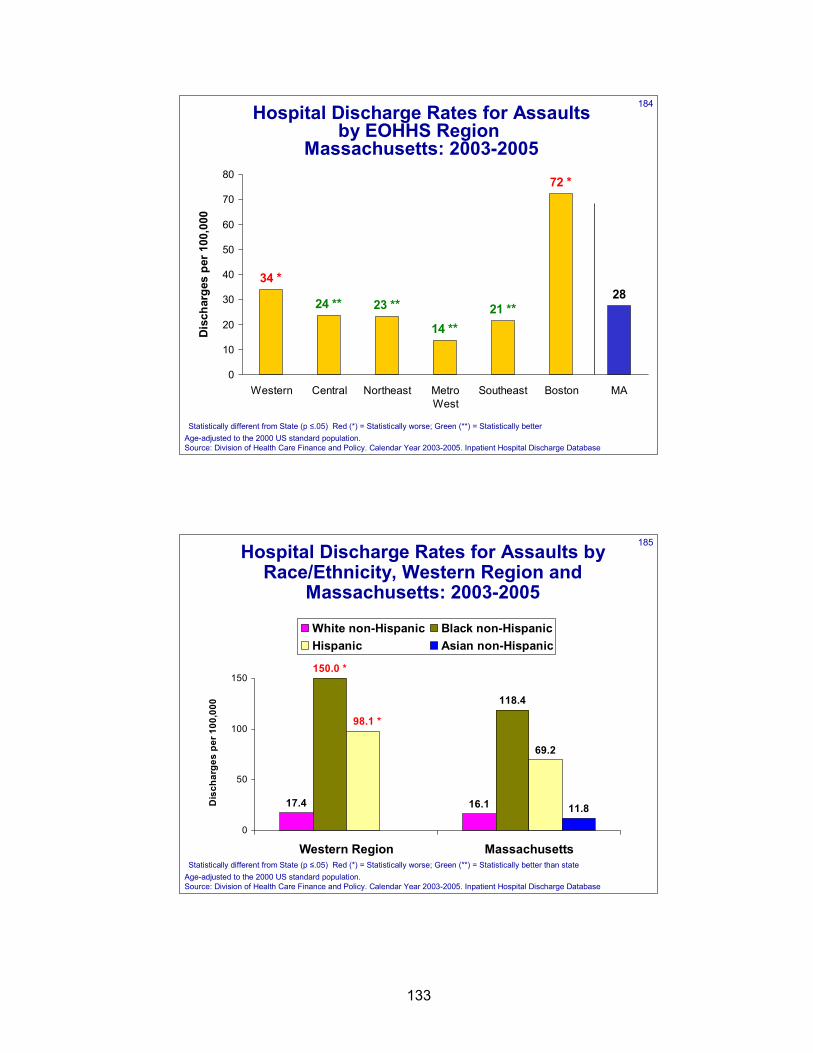
133
184Hospital Discharge Rates for Assaults by EOHHS Region
Massachusetts: 2003-2005
2821 **
14 **
23 **24 **
72 *
34 *
0
10
20
30
40
50
60
70
80
Western Central Northeast MetroWest
Southeast Boston MA
Dis
char
ges
per 1
00,0
00
Statistically different from State (p ≤.05) Red (*) = Statistically worse; Green (**) = Statistically betterAge-adjusted to the 2000 US standard population. Source: Division of Health Care Finance and Policy. Calendar Year 2003-2005. Inpatient Hospital Discharge Database
185
17.4 16.1
118.4
69.2
11.8
150.0 *
98.1 *
0
50
100
150
Western Region Massachusetts
Dis
char
ges
per 1
00,0
00
White non-Hispanic Black non-HispanicHispanic Asian non-Hispanic
Hospital Discharge Rates for Assaults by Race/Ethnicity, Western Region and
Massachusetts: 2003-2005
Statistically different from State (p ≤.05) Red (*) = Statistically worse; Green (**) = Statistically better than stateAge-adjusted to the 2000 US standard population. Source: Division of Health Care Finance and Policy. Calendar Year 2003-2005. Inpatient Hospital Discharge Database
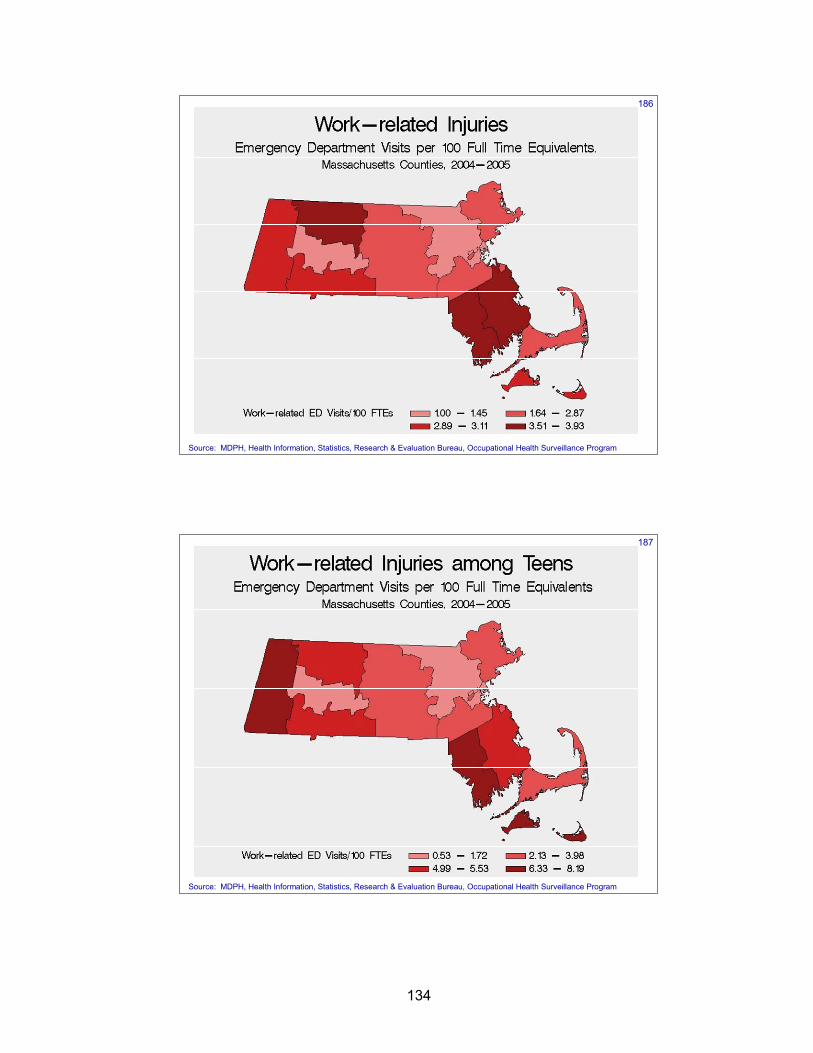
134
186
Source: MDPH, Health Information, Statistics, Research & Evaluation Bureau, Occupational Health Surveillance Program
187
Source: MDPH, Health Information, Statistics, Research & Evaluation Bureau, Occupational Health Surveillance Program
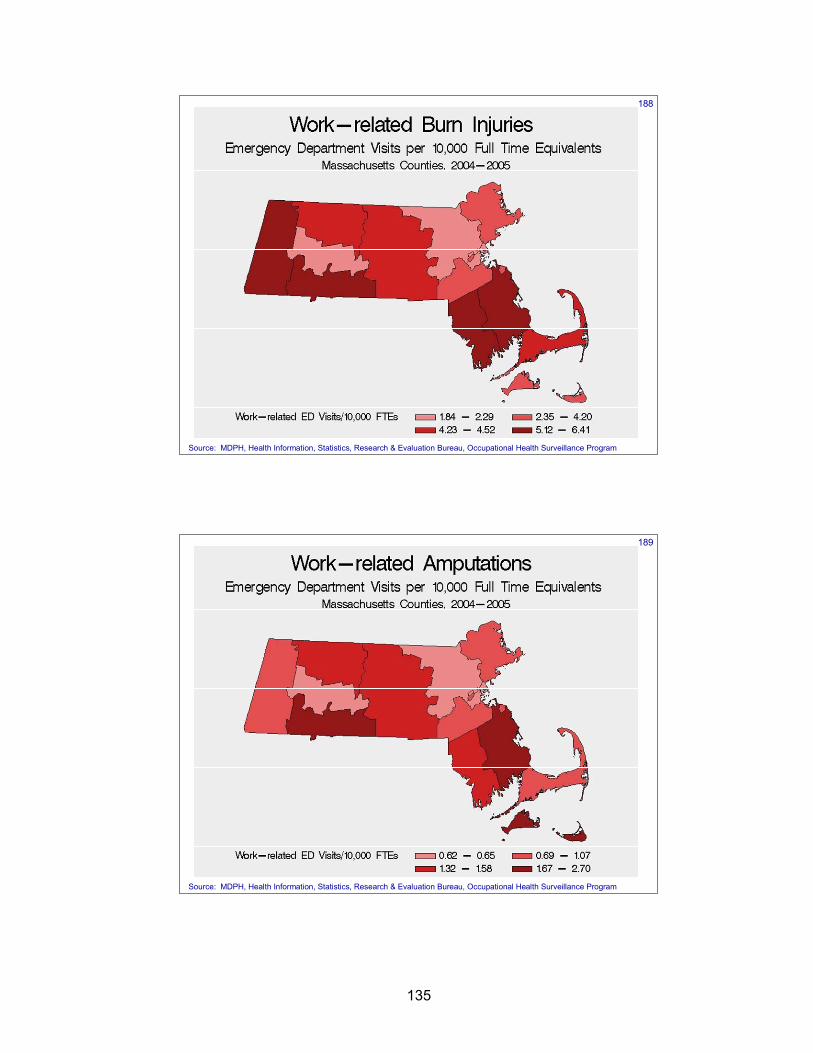
135
188
Source: MDPH, Health Information, Statistics, Research & Evaluation Bureau, Occupational Health Surveillance Program
189
Source: MDPH, Health Information, Statistics, Research & Evaluation Bureau, Occupational Health Surveillance Program
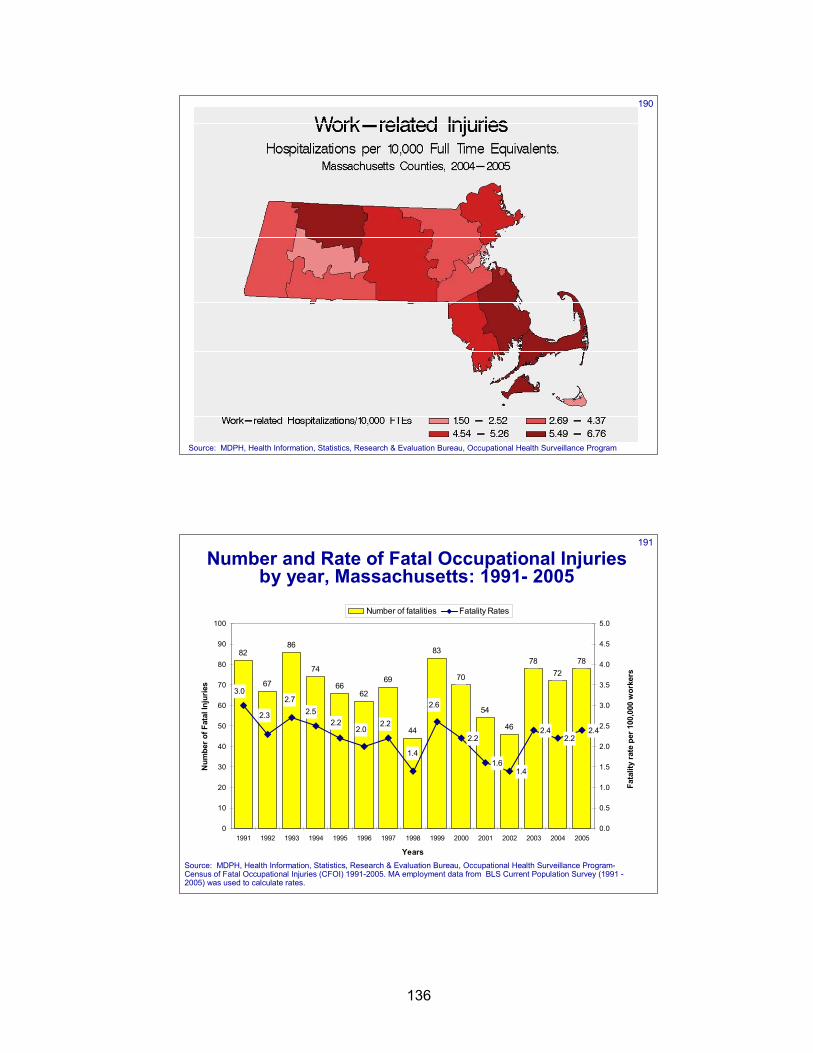
136
190
Source: MDPH, Health Information, Statistics, Research & Evaluation Bureau, Occupational Health Surveillance Program
191
70
54
46
7872
7883
44
69
6266
74
86
67
82
2.2
1.61.4
2.42.2
2.4
3.0
1.4
2.72.5
2.22.0
2.2
2.62.3
0
10
20
30
40
50
60
70
80
90
100
1991 1992 1993 1994 1995 1996 1997 1998 1999 2000 2001 2002 2003 2004 2005
Years
Num
ber o
f Fat
al In
jurie
s
0.0
0.5
1.0
1.5
2.0
2.5
3.0
3.5
4.0
4.5
5.0Fa
talit
y ra
te p
er 1
00,0
00 w
orke
rs
Number of fatalities Fatality Rates
Source: MDPH, Health Information, Statistics, Research & Evaluation Bureau, Occupational Health Surveillance Program-Census of Fatal Occupational Injuries (CFOI) 1991-2005. MA employment data from BLS Current Population Survey (1991 -2005) was used to calculate rates.
Number and Rate of Fatal Occupational Injuries by year, Massachusetts: 1991- 2005
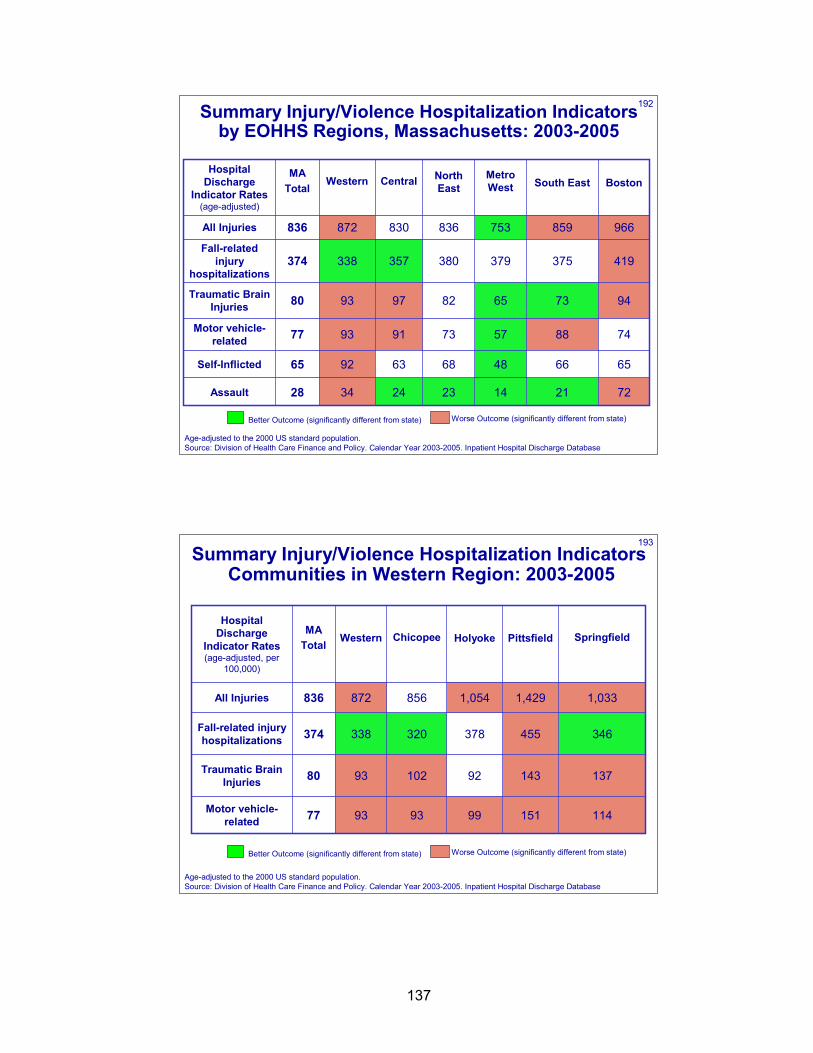
137
192
65664868639265Self-Inflicted
74885773919377Motor vehicle-related
72211423243428Assault
419375379380357338374Fall-related
injury hospitalizations
93
872
Western
73
859
South East
9465829780Traumatic Brain Injuries
966753836830836All Injuries
BostonMetro West
North East Central
MATotal
Hospital Discharge
Indicator Rates (age-adjusted)
Summary Injury/Violence Hospitalization Indicators by EOHHS Regions, Massachusetts: 2003-2005
Better Outcome (significantly different from state) Worse Outcome (significantly different from state)
Age-adjusted to the 2000 US standard population. Source: Division of Health Care Finance and Policy. Calendar Year 2003-2005. Inpatient Hospital Discharge Database
193
11415199939377Motor vehicle-related
346455378320338374Fall-related injury hospitalizations
93
872
Western
137
1,033
Springfield
1439210280Traumatic Brain Injuries
1,4291,054856836All Injuries
PittsfieldHolyokeChicopeeMATotal
Hospital Discharge
Indicator Rates (age-adjusted, per
100,000)
Summary Injury/Violence Hospitalization Indicators Communities in Western Region: 2003-2005
Better Outcome (significantly different from state) Worse Outcome (significantly different from state)
Age-adjusted to the 2000 US standard population. Source: Division of Health Care Finance and Policy. Calendar Year 2003-2005. Inpatient Hospital Discharge Database
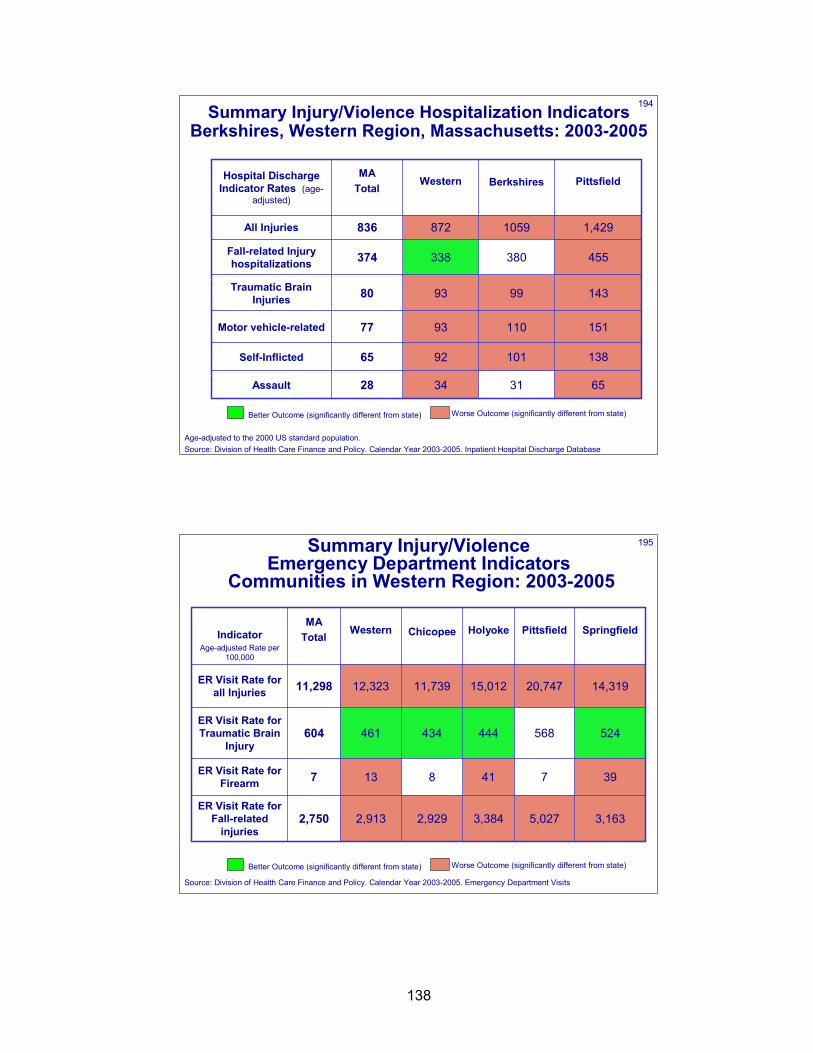
138
194
31
101
110
99
380
1059
Berkshires
1389265Self-Inflicted
1519377Motor vehicle-related
653428Assault
455338374Fall-related Injury hospitalizations
93
872
Western
14380Traumatic Brain Injuries
1,429836All Injuries
PittsfieldMA
Total Hospital Discharge
Indicator Rates (age-adjusted)
Summary Injury/Violence Hospitalization Indicators Berkshires, Western Region, Massachusetts: 2003-2005
Better Outcome (significantly different from state) Worse Outcome (significantly different from state)
Age-adjusted to the 2000 US standard population.Source: Division of Health Care Finance and Policy. Calendar Year 2003-2005. Inpatient Hospital Discharge Database
195
3,1635,0273,3842,9292,9132,750ER Visit Rate for
Fall-related injuries
397418137ER Visit Rate for Firearm
524568444434461604ER Visit Rate for Traumatic Brain
Injury
12,323
Western
14,319
Springfield
20,74715,01211,73911,298ER Visit Rate for all Injuries
PittsfieldHolyokeChicopeeMA
Total Indicator Age-adjusted Rate per
100,000
Summary Injury/Violence Emergency Department Indicators
Communities in Western Region: 2003-2005
Better Outcome (significantly different from state) Worse Outcome (significantly different from state)
Source: Division of Health Care Finance and Policy. Calendar Year 2003-2005. Emergency Department Visits
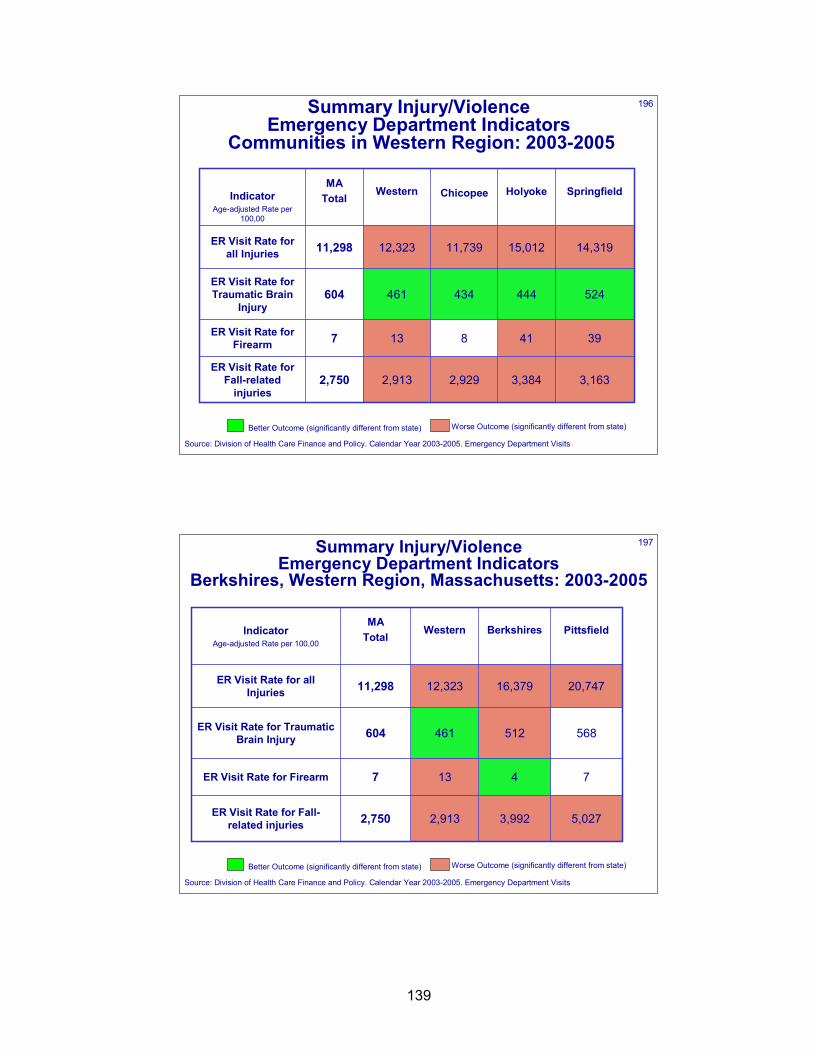
139
196
3,1633,3842,9292,9132,750ER Visit Rate for
Fall-related injuries
39418137ER Visit Rate for Firearm
524444434461604ER Visit Rate for Traumatic Brain
Injury
12,323
Western
14,319
Springfield
15,01211,73911,298ER Visit Rate for all Injuries
HolyokeChicopeeMA
Total Indicator Age-adjusted Rate per
100,00
Summary Injury/Violence Emergency Department Indicators
Communities in Western Region: 2003-2005
Better Outcome (significantly different from state) Worse Outcome (significantly different from state)
Source: Division of Health Care Finance and Policy. Calendar Year 2003-2005. Emergency Department Visits
197
5,027
7
568
20,747
Pittsfield
3,992
4
512
16,379
Berkshires
2,9132,750ER Visit Rate for Fall-related injuries
137ER Visit Rate for Firearm
461604ER Visit Rate for Traumatic Brain Injury
12,323
Western
11,298ER Visit Rate for all Injuries
MATotal Indicator
Age-adjusted Rate per 100,00
Summary Injury/Violence Emergency Department Indicators
Berkshires, Western Region, Massachusetts: 2003-2005
Better Outcome (significantly different from state) Worse Outcome (significantly different from state)
Source: Division of Health Care Finance and Policy. Calendar Year 2003-2005. Emergency Department Visits
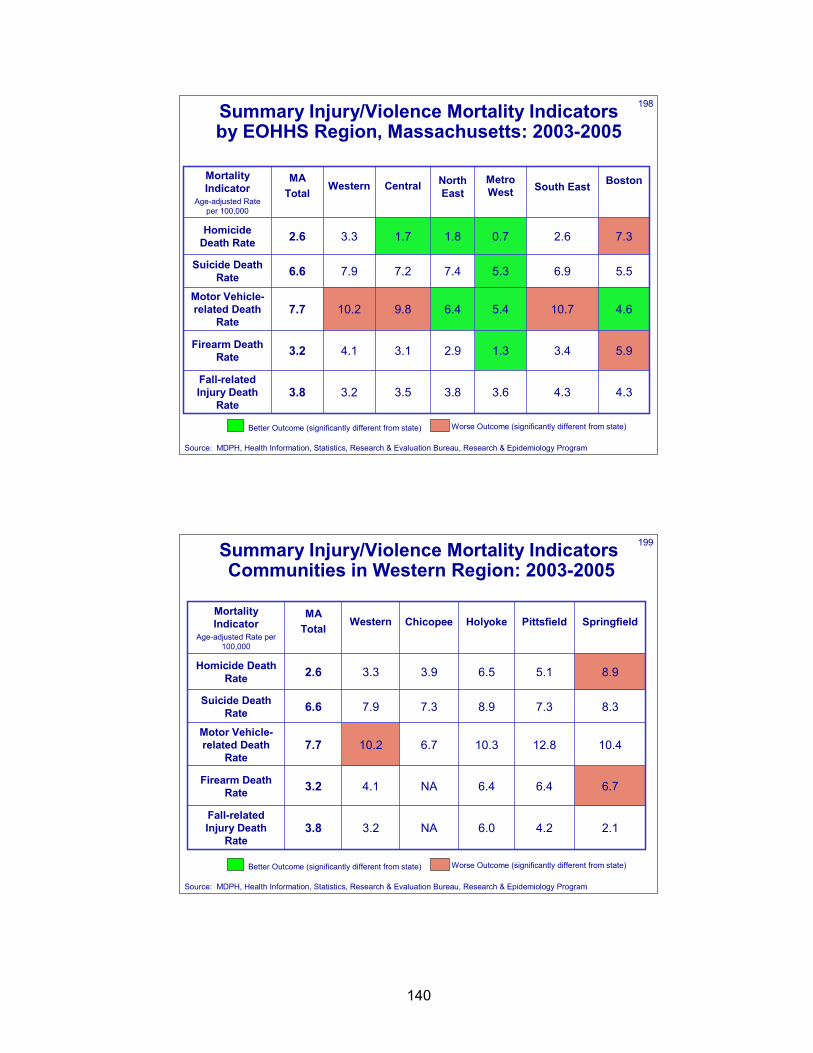
140
198
5.56.95.37.47.27.96.6Suicide Death Rate
4.610.75.46.49.810.27.7Motor Vehicle-related Death
Rate
7.32.60.71.81.73.32.6Homicide Death Rate
5.93.41.32.93.14.13.2Firearm Death Rate
3.2
Western
4.3
South East
4.33.63.83.53.8Fall-related Injury Death
Rate
BostonMetro West
North East Central
MATotal
Mortality Indicator
Age-adjusted Rate per 100,000
Summary Injury/Violence Mortality Indicators by EOHHS Region, Massachusetts: 2003-2005
Source: MDPH, Health Information, Statistics, Research & Evaluation Bureau, Research & Epidemiology Program
Better Outcome (significantly different from state) Worse Outcome (significantly different from state)
199
8.37.38.97.37.96.6Suicide Death Rate
10.412.810.36.710.27.7Motor Vehicle-related Death
Rate
8.95.16.53.93.32.6Homicide Death Rate
6.76.46.4NA4.13.2Firearm Death Rate
3.2
Western
2.1
Springfield
4.26.0NA3.8Fall-related Injury Death
Rate
PittsfieldHolyokeChicopeeMA
Total Mortality Indicator
Age-adjusted Rate per 100,000
Summary Injury/Violence Mortality Indicators Communities in Western Region: 2003-2005
Source: MDPH, Health Information, Statistics, Research & Evaluation Bureau, Research & Epidemiology Program
Better Outcome (significantly different from state) Worse Outcome (significantly different from state)
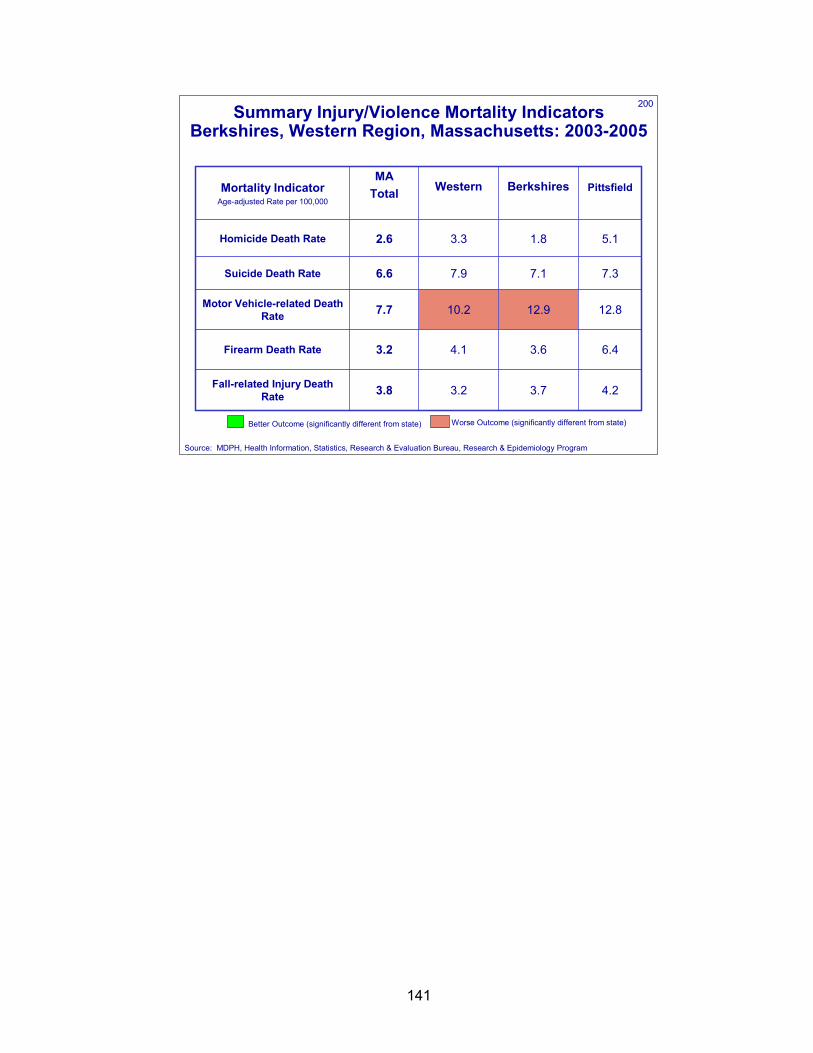
141
200
3.7
3.6
12.9
7.1
1.8
Berkshires
7.37.96.6Suicide Death Rate
12.810.27.7Motor Vehicle-related Death Rate
5.13.32.6Homicide Death Rate
6.44.13.2Firearm Death Rate
3.2
Western
4.23.8Fall-related Injury Death Rate
PittsfieldMA
Total Mortality IndicatorAge-adjusted Rate per 100,000
Summary Injury/Violence Mortality Indicators Berkshires, Western Region, Massachusetts: 2003-2005
Source: MDPH, Health Information, Statistics, Research & Evaluation Bureau, Research & Epidemiology Program
Better Outcome (significantly different from state) Worse Outcome (significantly different from state)

142

143
HIV/AIDS

144
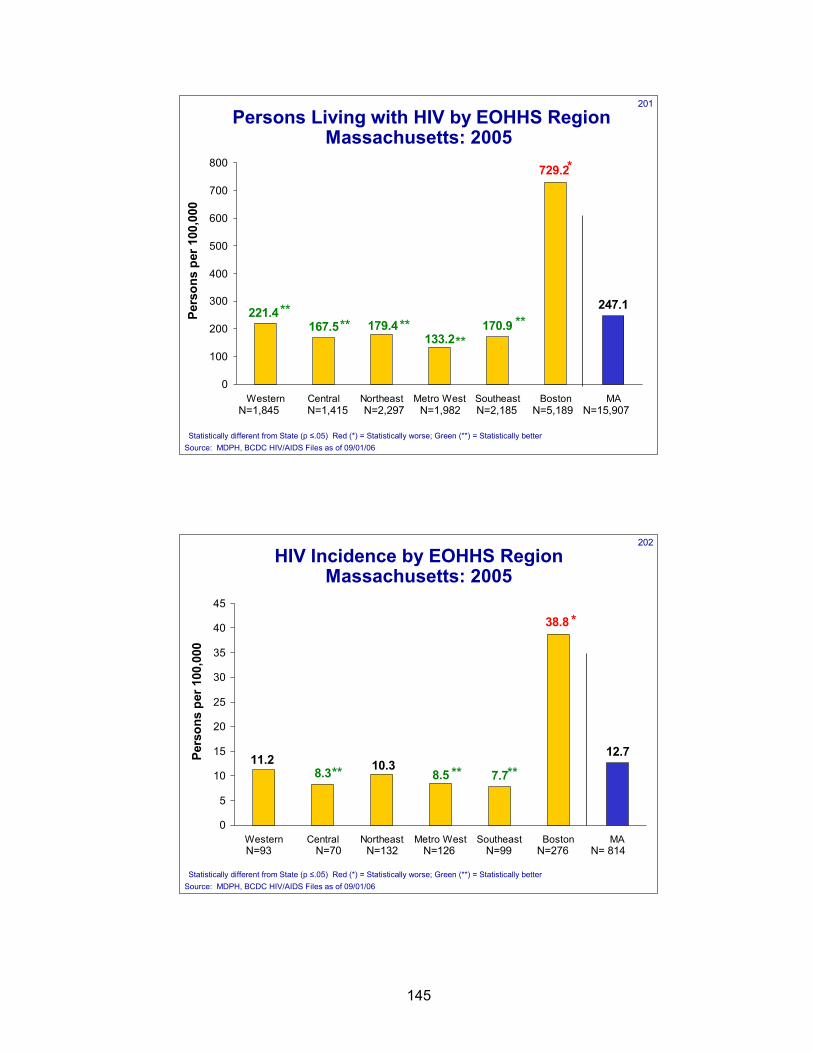
145
201
170.9247.1
133.2179.4
221.4167.5
729.2
0
100
200
300
400
500
600
700
800
Western Central Northeast Metro West Southeast Boston MA
Pers
ons
per 1
00,0
00
Persons Living with HIV by EOHHS Region Massachusetts: 2005
Source: MDPH, BCDC HIV/AIDS Files as of 09/01/06
****
*
**** **
Statistically different from State (p ≤.05) Red (*) = Statistically worse; Green (**) = Statistically better
N=15,907N=5,189N=2,185N=1,982N=2,297N=1,415N=1,845
202
HIV Incidence by EOHHS Region Massachusetts: 2005
12.7
7.78.510.311.2
8.3
38.8
0
5
10
15
20
25
30
35
40
45
Western Central Northeast Metro West Southeast Boston MA
Pers
ons
per 1
00,0
00
** ** **
*
Statistically different from State (p ≤.05) Red (*) = Statistically worse; Green (**) = Statistically better
N= 814N=276N=99N=126N=132N=70N=93
Source: MDPH, BCDC HIV/AIDS Files as of 09/01/06
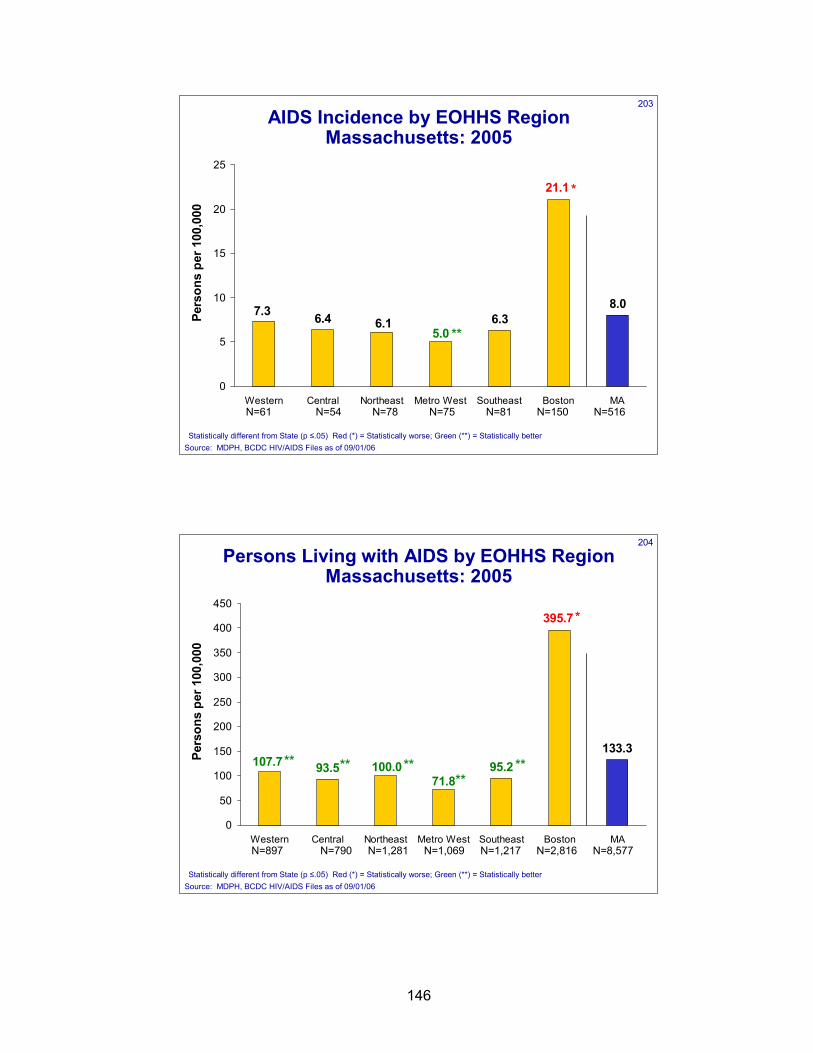
146
203
AIDS Incidence by EOHHS Region Massachusetts: 2005
6.38.0
5.06.1
7.3 6.4
21.1
0
5
10
15
20
25
Western Central Northeast Metro West Southeast Boston MA
Pers
ons
per 1
00,0
00
**
*
Statistically different from State (p ≤.05) Red (*) = Statistically worse; Green (**) = Statistically better
N=516N=150N=81N=75N=78N=54N=61
Source: MDPH, BCDC HIV/AIDS Files as of 09/01/06
204
Persons Living with AIDS by EOHHS Region Massachusetts: 2005
95.2133.3
71.8100.0107.7 93.5
395.7
0
50
100
150
200
250
300
350
400
450
Western Central Northeast Metro West Southeast Boston MA
Pers
ons
per 1
00,0
00
**
*
********
Statistically different from State (p ≤.05) Red (*) = Statistically worse; Green (**) = Statistically better
N=8,577N=2,816N=1,217N=1,069N=1,281N=790N=897
Source: MDPH, BCDC HIV/AIDS Files as of 09/01/06
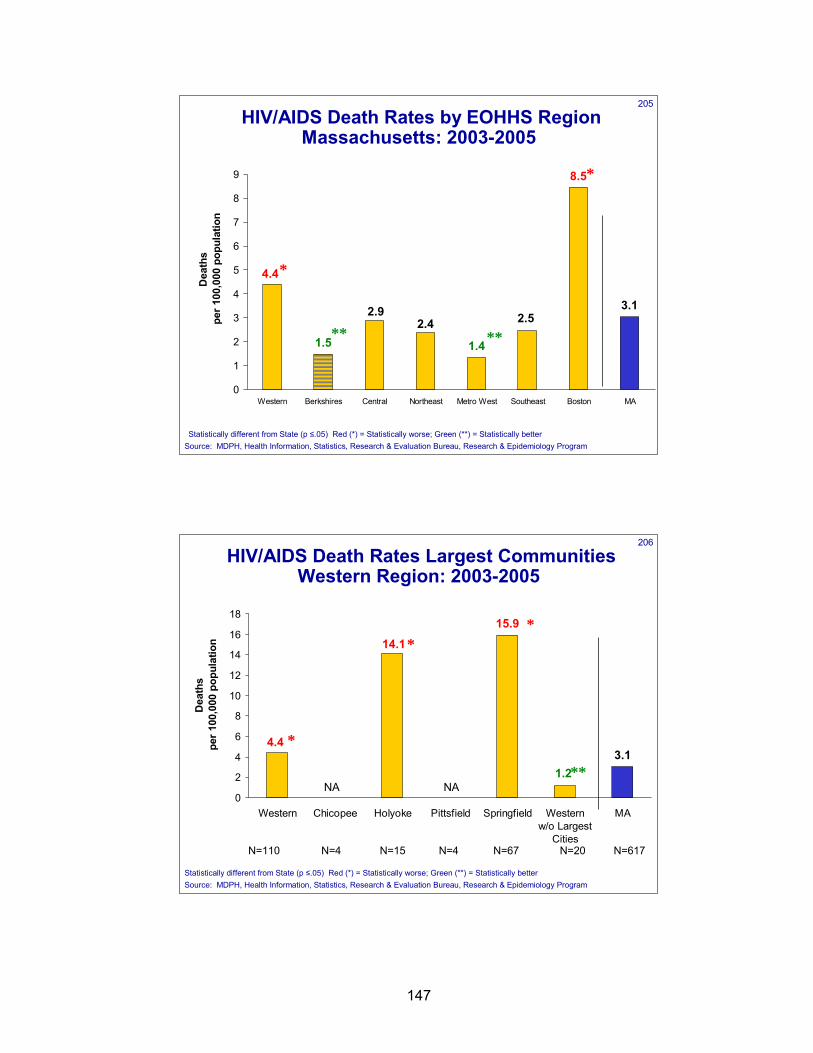
147
205
HIV/AIDS Death Rates by EOHHS Region Massachusetts: 2003-2005
3.1
1.4
8.5
2.42.9
4.4
1.5
2.5
0
1
2
3
4
5
6
7
8
9
Western Berkshires Central Northeast Metro West Southeast Boston MA
Dea
ths
per 1
00,0
00 p
opul
atio
n
Source: MDPH, Health Information, Statistics, Research & Evaluation Bureau, Research & Epidemiology Program
*
**
*
Statistically different from State (p ≤.05) Red (*) = Statistically worse; Green (**) = Statistically better
**
206
HIV/AIDS Death Rates Largest Communities Western Region: 2003-2005
3.1
15.914.1
4.4
1.2
0
2
4
6
8
10
12
14
16
18
Western Chicopee Holyoke Pittsfield Springfield Westernw/o Largest
Cities
MA
Dea
ths
per 1
00,0
00 p
opul
atio
n
Source: MDPH, Health Information, Statistics, Research & Evaluation Bureau, Research & Epidemiology Program
*
**
*
Statistically different from State (p ≤.05) Red (*) = Statistically worse; Green (**) = Statistically better
N=617N=20 N=67N=4N=15N=4N=110
*
NA NA
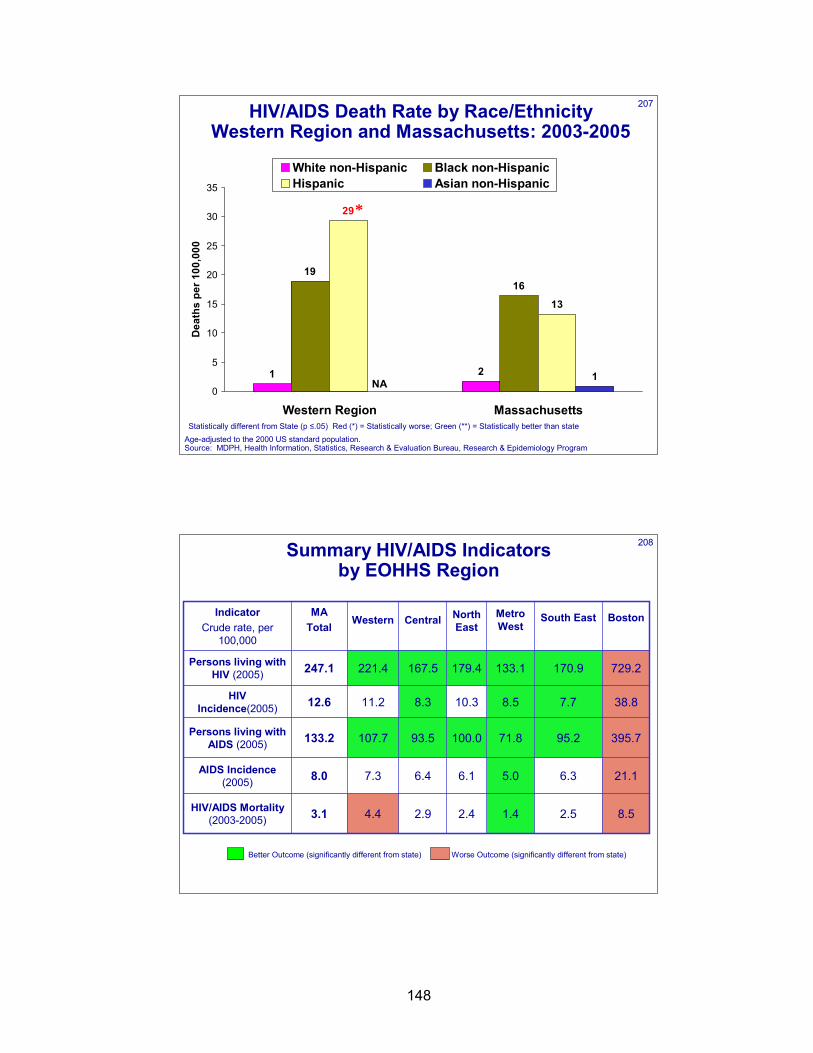
148
207HIV/AIDS Death Rate by Race/EthnicityWestern Region and Massachusetts: 2003-2005
1 2
1916
13
1
29
0
5
10
15
20
25
30
35
Western Region Massachusetts
Dea
ths
per 1
00,0
00
White non-Hispanic Black non-HispanicHispanic Asian non-Hispanic
NA
*
Statistically different from State (p ≤.05) Red (*) = Statistically worse; Green (**) = Statistically better than stateAge-adjusted to the 2000 US standard population. Source: MDPH, Health Information, Statistics, Research & Evaluation Bureau, Research & Epidemiology Program
208
38.87.78.510.38.311.212.6HIV Incidence(2005)
729.2170.9133.1179.4167.5221.4247.1Persons living with HIV (2005)
4.4
7.3
107.7
Western
2.5
6.3
95.2
South East
8.51.42.42.93.1HIV/AIDS Mortality (2003-2005)
21.15.06.16.48.0AIDS Incidence (2005)
395.771.8100.093.5133.2Persons living with AIDS (2005)
BostonMetro West
North East Central
MATotal
Indicator Crude rate, per
100,000
Summary HIV/AIDS Indicators by EOHHS Region
Better Outcome (significantly different from state) Worse Outcome (significantly different from state)
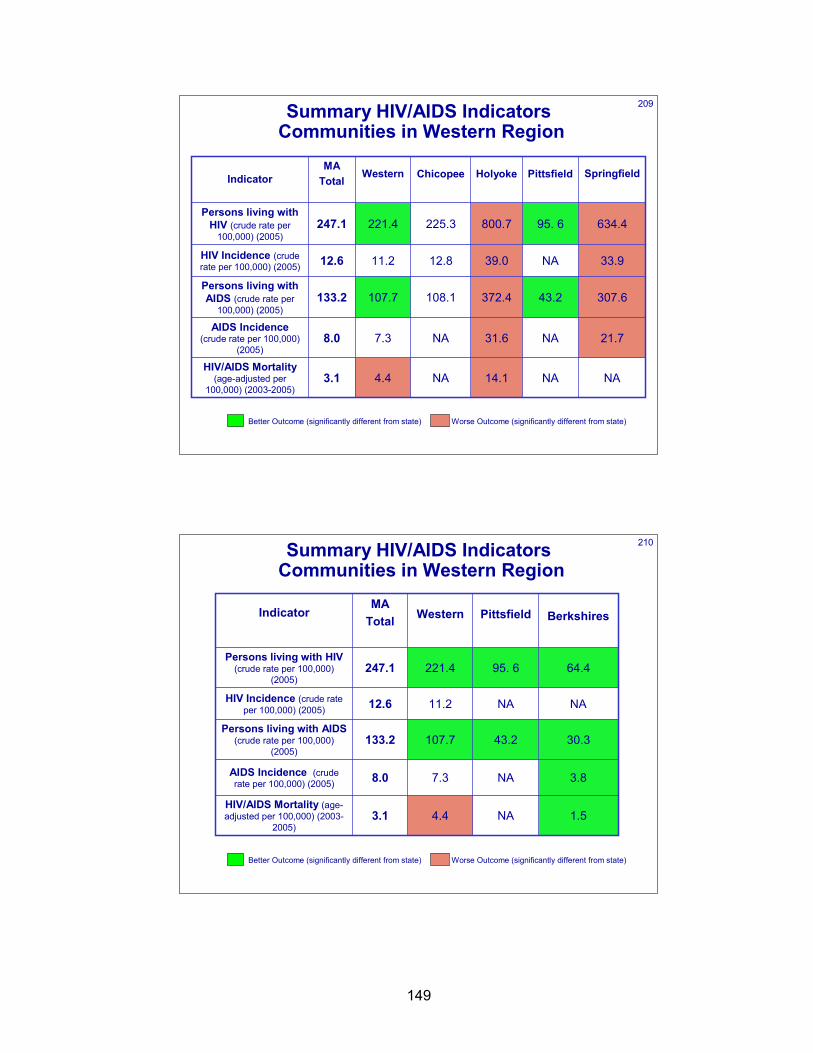
149
209
33.9NA39.012.811.212.6HIV Incidence (crude rate per 100,000) (2005)
634.495. 6800.7225.3221.4247.1Persons living with
HIV (crude rate per 100,000) (2005)
4.4
7.3
107.7
Western
NA
21.7
307.6
Springfield
NA14.1NA3.1HIV/AIDS Mortality
(age-adjusted per 100,000) (2003-2005)
NA31.6NA8.0AIDS Incidence
(crude rate per 100,000) (2005)
43.2372.4108.1133.2Persons living with AIDS (crude rate per
100,000) (2005)
PittsfieldHolyokeChicopeeMA
Total Indicator
Summary HIV/AIDS Indicators Communities in Western Region
Better Outcome (significantly different from state) Worse Outcome (significantly different from state)
210
NANA11.212.6HIV Incidence (crude rate per 100,000) (2005)
64.495. 6221.4247.1Persons living with HIV
(crude rate per 100,000) (2005)
4.4
7.3
107.7
Western
1.5
3.8
30.3
Berkshires
NA3.1HIV/AIDS Mortality (age-adjusted per 100,000) (2003-
2005)
NA8.0AIDS Incidence (crude rate per 100,000) (2005)
43.2133.2Persons living with AIDS
(crude rate per 100,000) (2005)
PittsfieldMA
Total Indicator
Summary HIV/AIDS Indicators Communities in Western Region
Better Outcome (significantly different from state) Worse Outcome (significantly different from state)

150
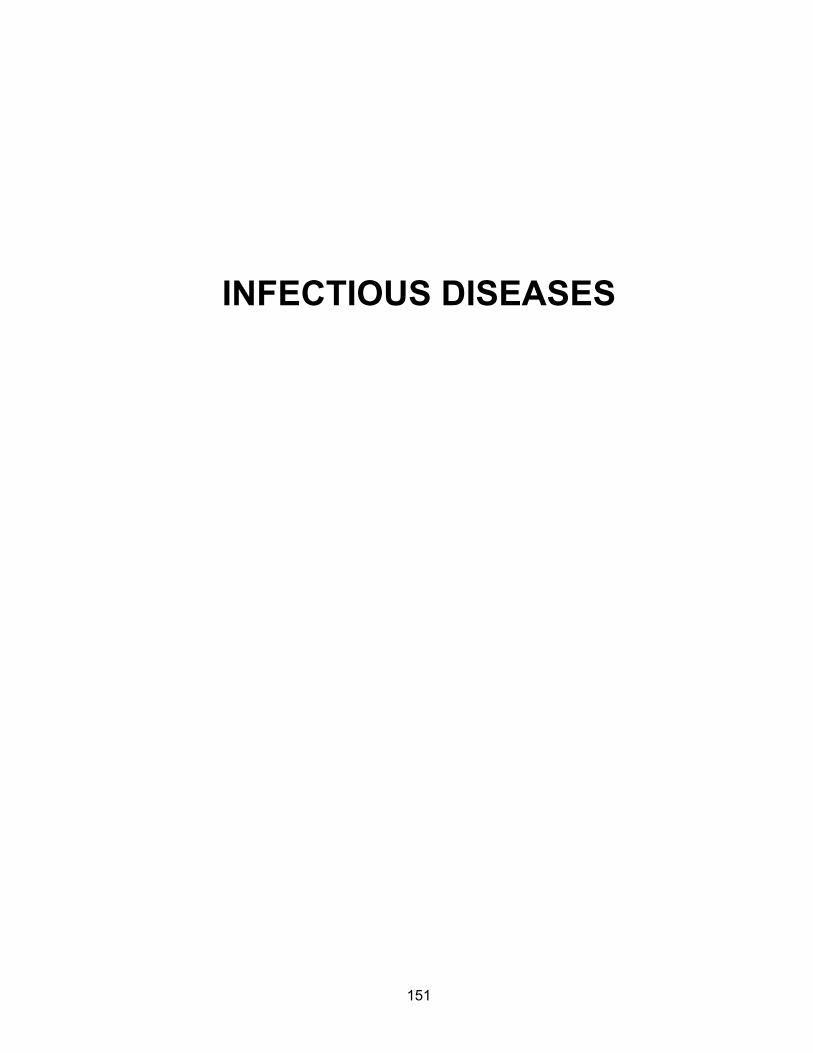
151
INFECTIOUS DISEASES

152
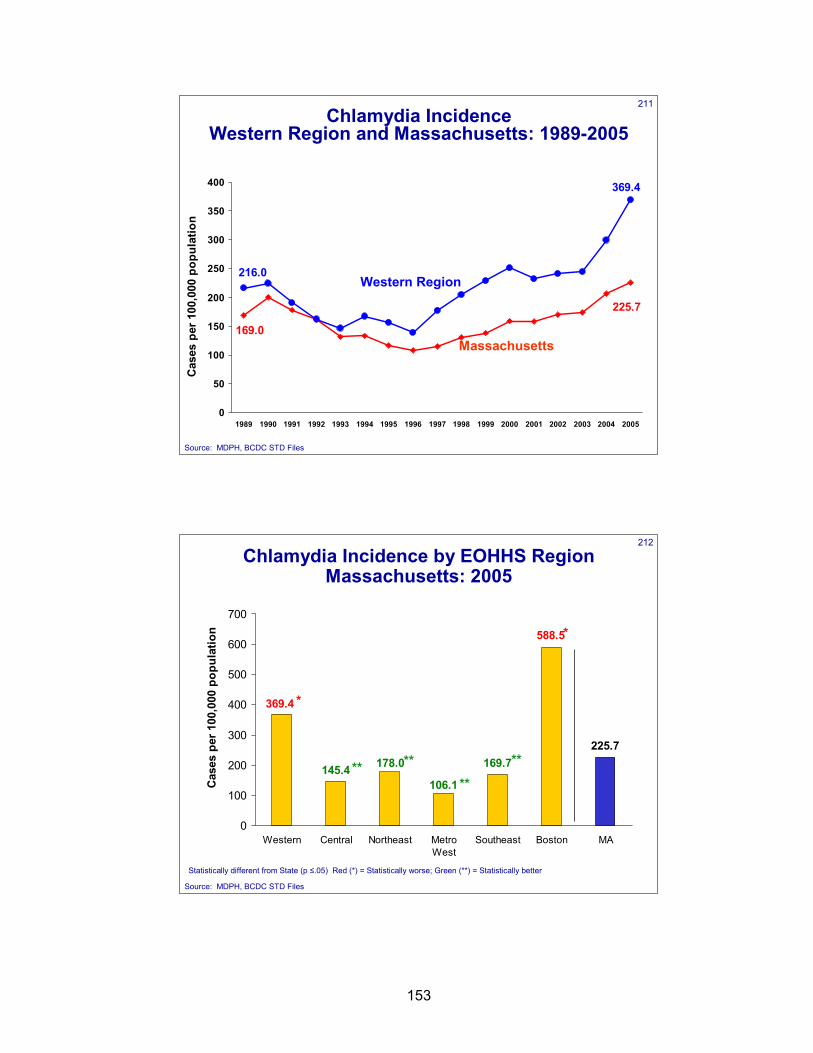
153
211Chlamydia Incidence
Western Region and Massachusetts: 1989-2005
225.7
169.0
369.4
216.0
0
50
100
150
200
250
300
350
400
1989 1990 1991 1992 1993 1994 1995 1996 1997 1998 1999 2000 2001 2002 2003 2004 2005
Cas
es p
er 1
00,0
00 p
opul
atio
n
Massachusetts
Western Region
Source: MDPH, BCDC STD Files
212
Chlamydia Incidence by EOHHS Region Massachusetts: 2005
169.7225.7
106.1
178.0
369.4
145.4
588.5
0
100
200
300
400
500
600
700
Western Central Northeast MetroWest
Southeast Boston MA
Cas
es p
er 1
00,0
00 p
opul
atio
n
Source: MDPH, BCDC STD Files
*
*
**
**
****
Statistically different from State (p ≤.05) Red (*) = Statistically worse; Green (**) = Statistically better
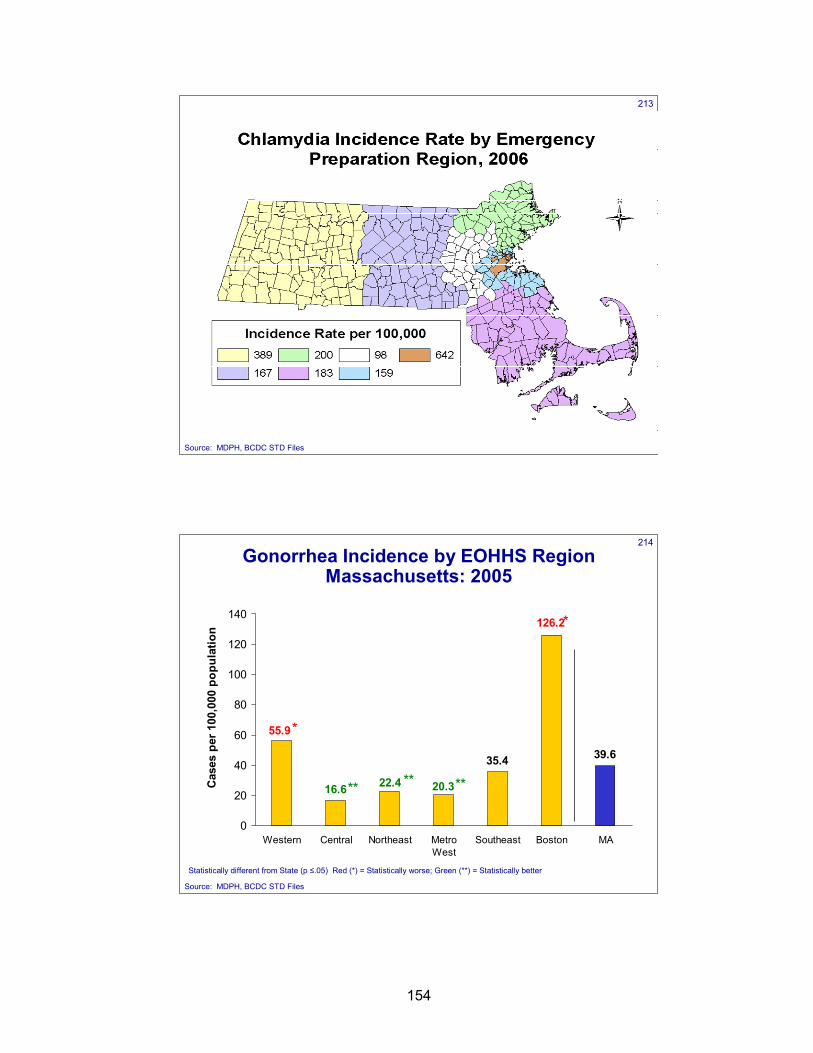
154
213
Source: MDPH, BCDC STD Files
214
Gonorrhea Incidence by EOHHS Region Massachusetts: 2005
35.4 39.6
20.322.4
55.9
16.6
126.2
0
20
40
60
80
100
120
140
Western Central Northeast MetroWest
Southeast Boston MA
Cas
es p
er 1
00,0
00 p
opul
atio
n
Source: MDPH, BCDC STD Files
*
*
******
Statistically different from State (p ≤.05) Red (*) = Statistically worse; Green (**) = Statistically better
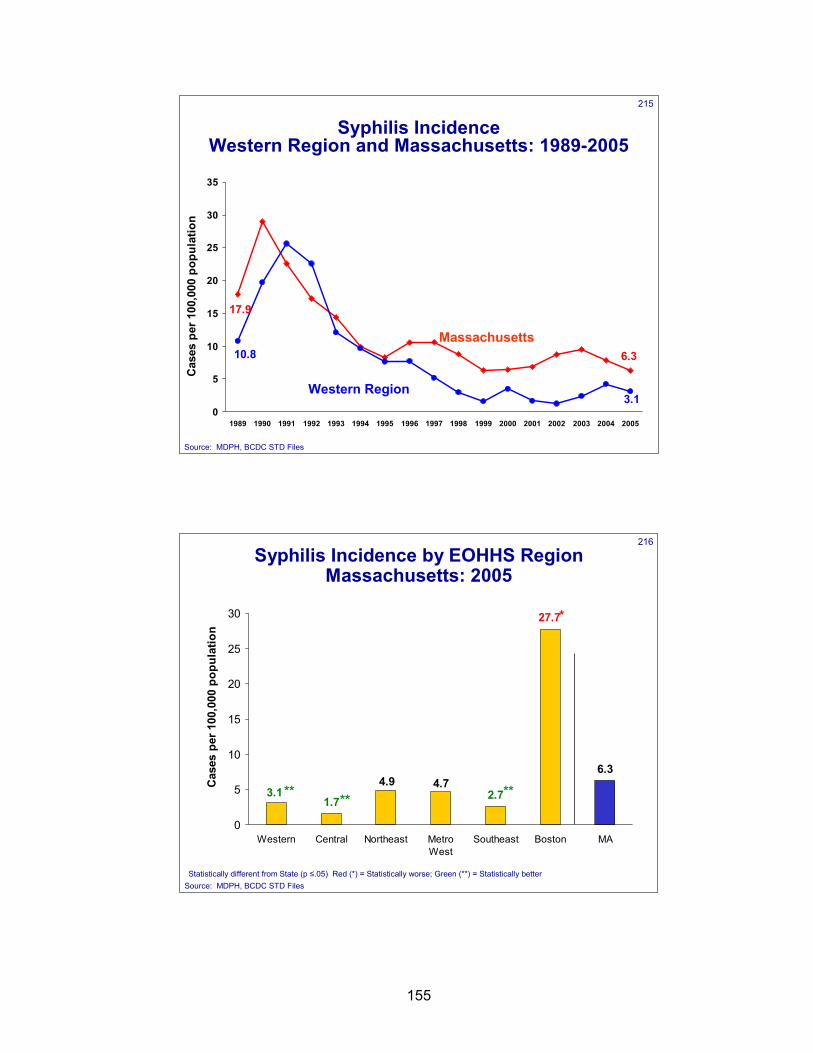
155
215
Syphilis IncidenceWestern Region and Massachusetts: 1989-2005
6.3
17.9
3.1
10.8
0
5
10
15
20
25
30
35
1989 1990 1991 1992 1993 1994 1995 1996 1997 1998 1999 2000 2001 2002 2003 2004 2005
Cas
es p
er 1
00,0
00 p
opul
atio
n
Massachusetts
Western Region
Source: MDPH, BCDC STD Files
216
Syphilis Incidence by EOHHS Region Massachusetts: 2005
6.3
2.74.74.9
3.11.7
27.7
0
5
10
15
20
25
30
Western Central Northeast MetroWest
Southeast Boston MA
Cas
es p
er 1
00,0
00 p
opul
atio
n
Source: MDPH, BCDC STD Files
**
*
****
Statistically different from State (p ≤.05) Red (*) = Statistically worse; Green (**) = Statistically better
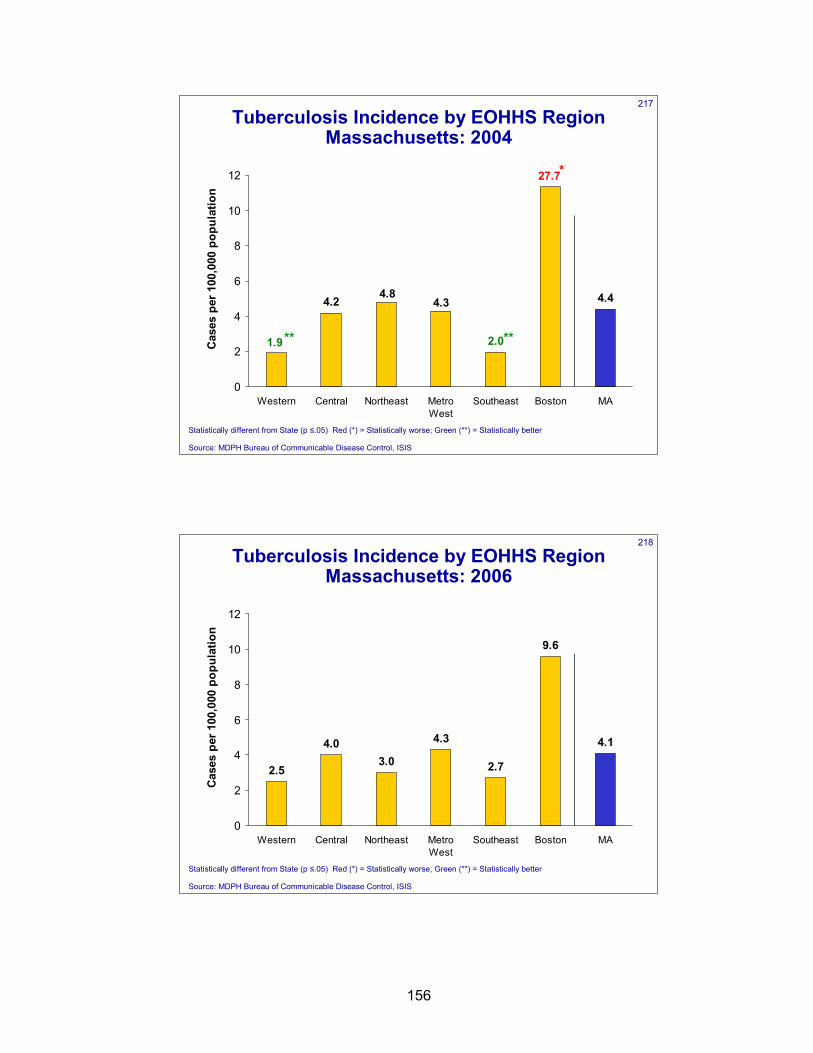
156
217
Tuberculosis Incidence by EOHHS Region Massachusetts: 2004
4.4
2.0
4.34.8
1.9
4.2
27.7
0
2
4
6
8
10
12
Western Central Northeast MetroWest
Southeast Boston MA
Cas
es p
er 1
00,0
00 p
opul
atio
n
**
*
**
Statistically different from State (p ≤.05) Red (*) = Statistically worse; Green (**) = Statistically better
Source: MDPH Bureau of Communicable Disease Control, ISIS
218
Tuberculosis Incidence by EOHHS Region Massachusetts: 2006
2.5
4.03.0
4.3
2.7
9.6
4.1
0
2
4
6
8
10
12
Western Central Northeast MetroWest
Southeast Boston MA
Cas
es p
er 1
00,0
00 p
opul
atio
n
Statistically different from State (p ≤.05) Red (*) = Statistically worse; Green (**) = Statistically better
Source: MDPH Bureau of Communicable Disease Control, ISIS
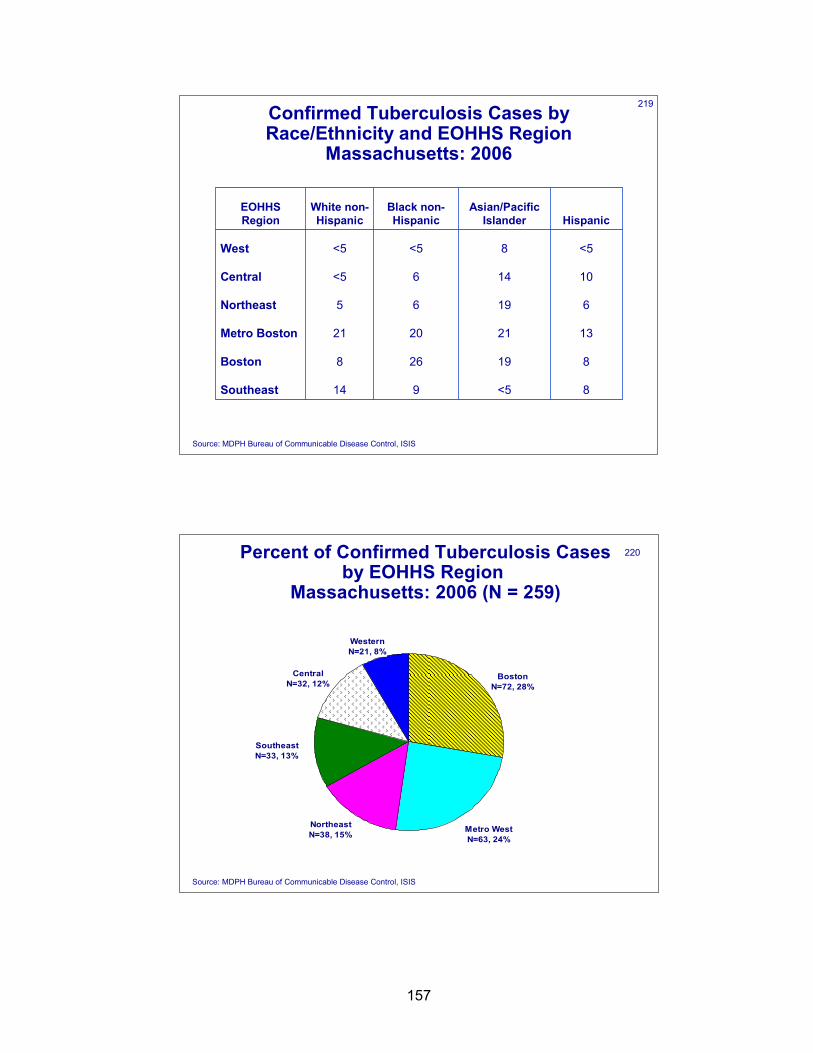
157
219Confirmed Tuberculosis Cases by Race/Ethnicity and EOHHS Region
Massachusetts: 2006
8<5914Southeast
819268Boston
13212021Metro Boston
61965Northeast
10146<5Central
<58<5<5West
HispanicAsian/Pacific
IslanderBlack non-Hispanic
White non-Hispanic
EOHHS Region
Source: MDPH Bureau of Communicable Disease Control, ISIS
Percent of Confirmed Tuberculosis Cases by EOHHS Region
Massachusetts: 2006 (N = 259)
Metro WestN=63, 24%
BostonN=72, 28%
WesternN=21, 8%
CentralN=32, 12%
SoutheastN=33, 13%
NortheastN=38, 15%
Source: MDPH Bureau of Communicable Disease Control, ISIS
220
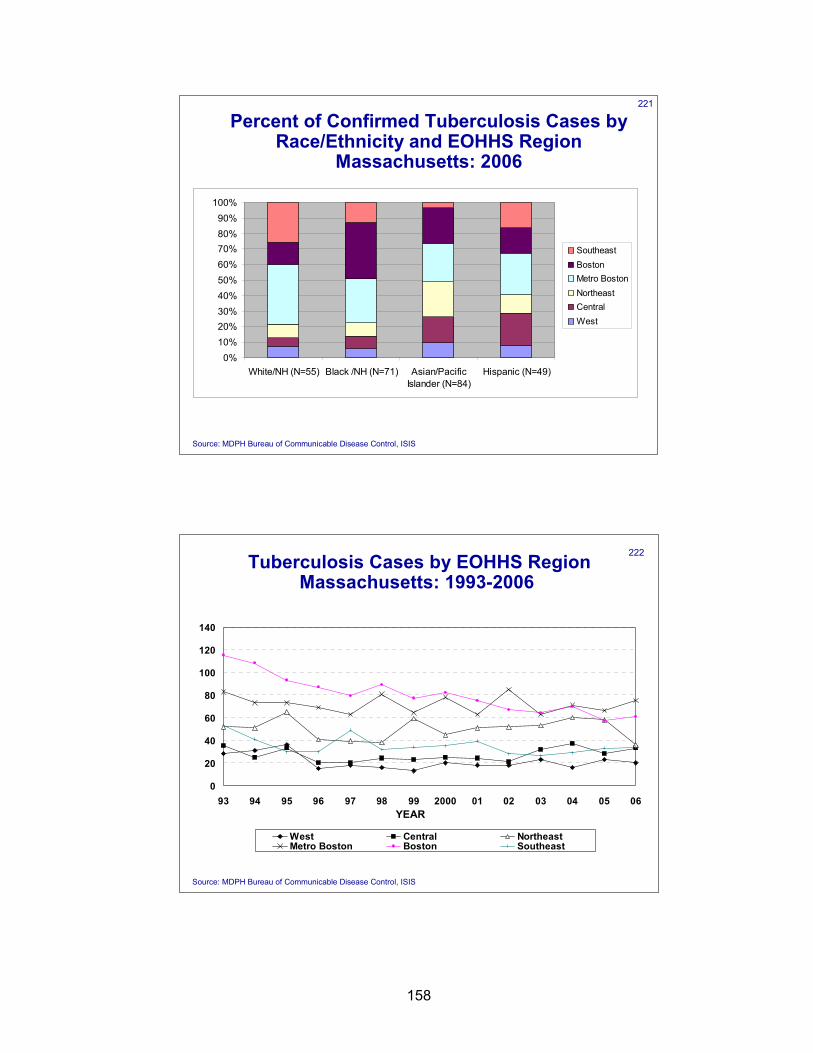
158
221
Percent of Confirmed Tuberculosis Cases by Race/Ethnicity and EOHHS Region
Massachusetts: 2006
0%10%20%30%40%50%60%70%80%90%
100%
White/NH (N=55) Black /NH (N=71) Asian/PacificIslander (N=84)
Hispanic (N=49)
SoutheastBostonMetro BostonNortheastCentralWest
Source: MDPH Bureau of Communicable Disease Control, ISIS
Tuberculosis Cases by EOHHS RegionMassachusetts: 1993-2006
0
20
40
60
80
100
120
140
93 94 95 96 97 98 99 2000 01 02 03 04 05 06
West Central NortheastMetro Boston Boston Southeast
YEAR
Source: MDPH Bureau of Communicable Disease Control, ISIS
222
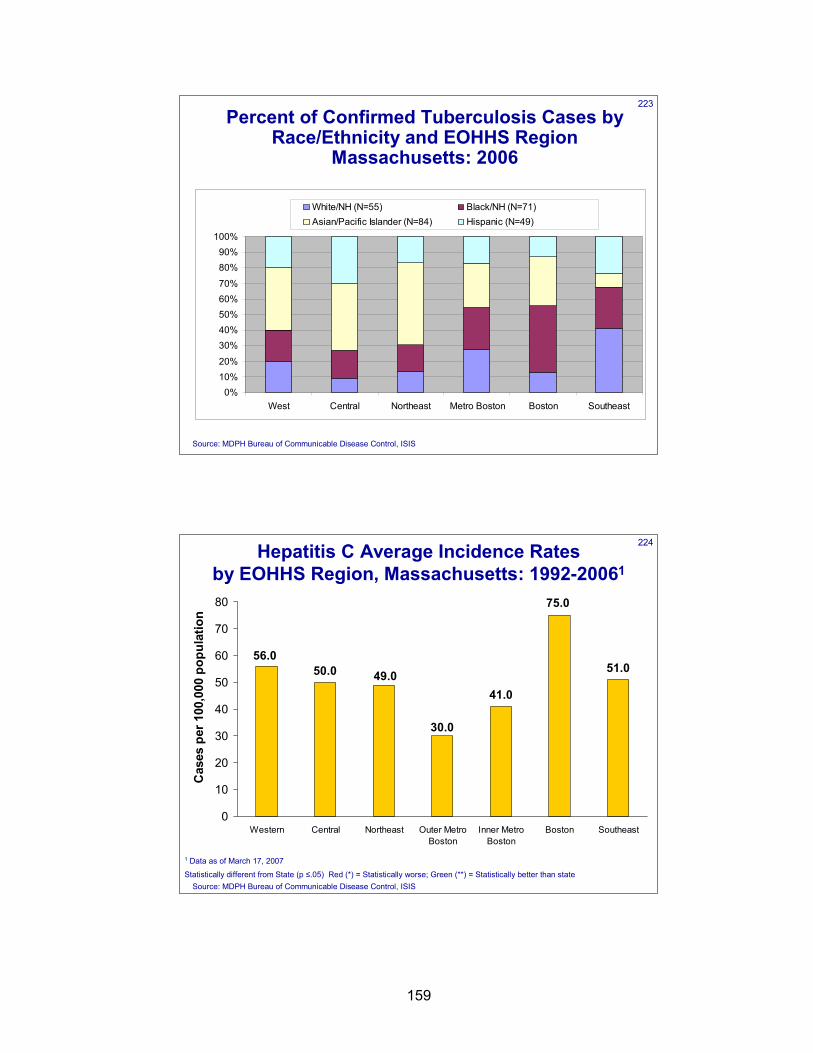
159
223
Percent of Confirmed Tuberculosis Cases by Race/Ethnicity and EOHHS Region
Massachusetts: 2006
0%10%20%
30%40%50%60%70%
80%90%
100%
West Central Northeast Metro Boston Boston Southeast
White/NH (N=55) Black/NH (N=71)Asian/Pacific Islander (N=84) Hispanic (N=49)
Source: MDPH Bureau of Communicable Disease Control, ISIS
224Hepatitis C Average Incidence Rates by EOHHS Region, Massachusetts: 1992-20061
41.0
51.0
30.0
49.056.0
50.0
75.0
0
10
20
30
40
50
60
70
80
Western Central Northeast Outer MetroBoston
Inner MetroBoston
Boston Southeast
Cas
es p
er 1
00,0
00 p
opul
atio
n
Statistically different from State (p ≤.05) Red (*) = Statistically worse; Green (**) = Statistically better than state
1 Data as of March 17, 2007
Source: MDPH Bureau of Communicable Disease Control, ISIS
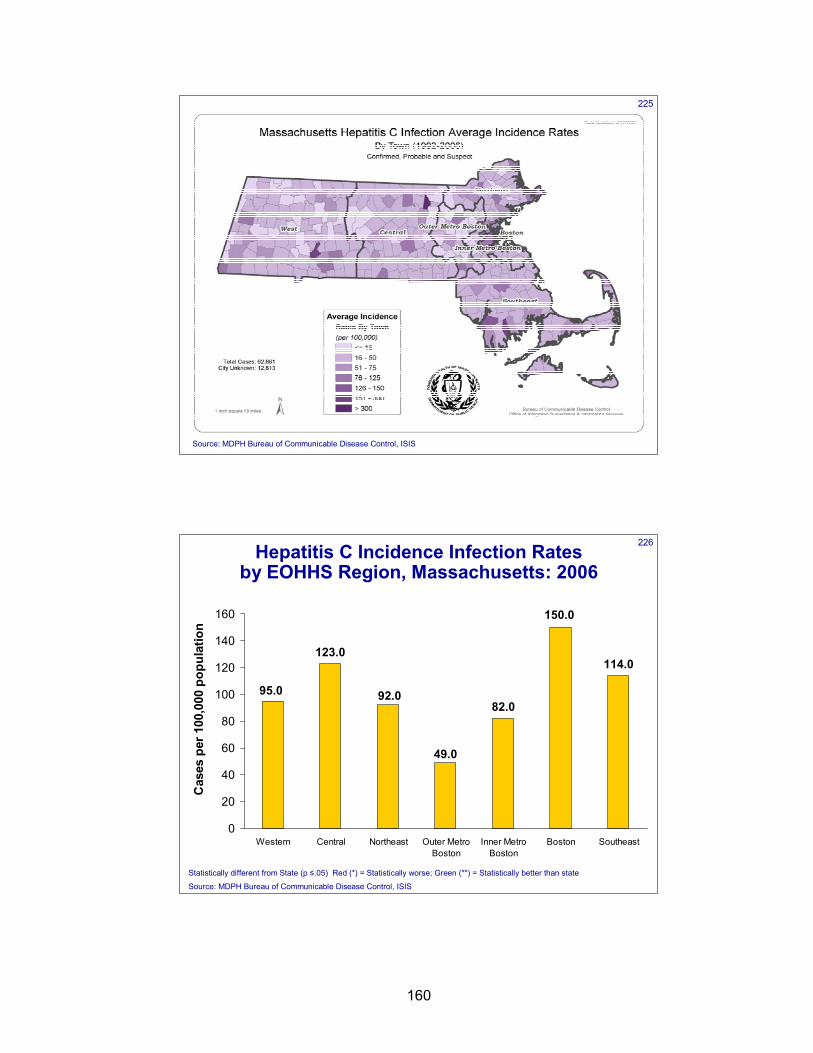
160
225
Source: MDPH Bureau of Communicable Disease Control, ISIS
226Hepatitis C Incidence Infection Rates by EOHHS Region, Massachusetts: 2006
82.0
114.0
49.0
92.095.0
123.0
150.0
0
20
40
60
80
100
120
140
160
Western Central Northeast Outer MetroBoston
Inner MetroBoston
Boston Southeast
Cas
es p
er 1
00,0
00 p
opul
atio
n
Statistically different from State (p ≤.05) Red (*) = Statistically worse; Green (**) = Statistically better than state
Source: MDPH Bureau of Communicable Disease Control, ISIS
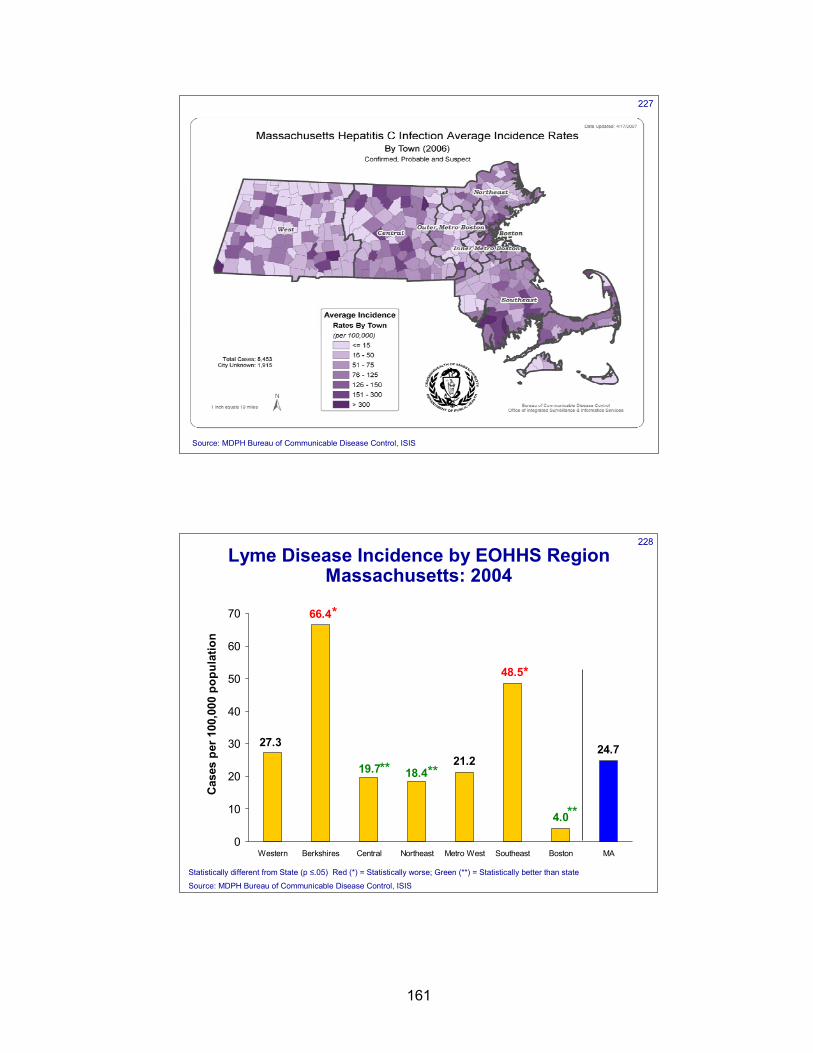
161
227
Source: MDPH Bureau of Communicable Disease Control, ISIS
228
Lyme Disease Incidence by EOHHS Region Massachusetts: 2004
24.7
4.0
21.218.419.7
27.3
66.4
48.5
0
10
20
30
40
50
60
70
Western Berkshires Central Northeast Metro West Southeast Boston MA
Cas
es p
er 1
00,0
00 p
opul
atio
n
*
**
Statistically different from State (p ≤.05) Red (*) = Statistically worse; Green (**) = Statistically better than state
****
Source: MDPH Bureau of Communicable Disease Control, ISIS
*
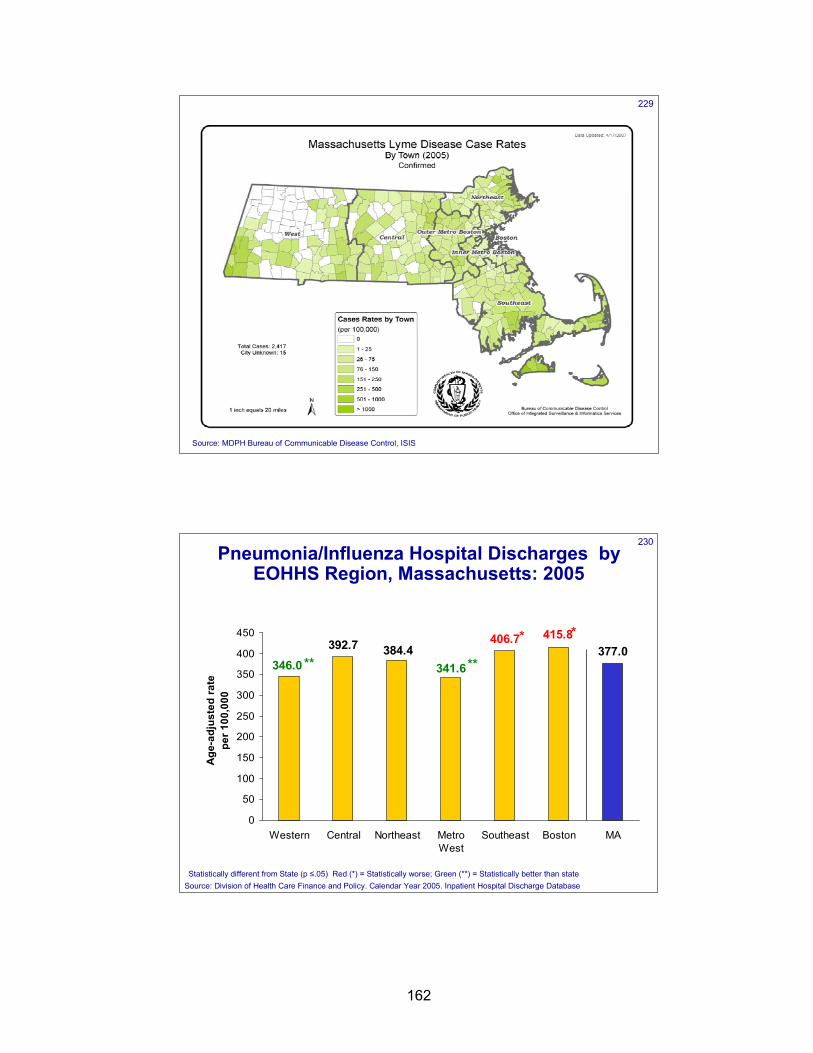
162
229
Source: MDPH Bureau of Communicable Disease Control, ISIS
230Pneumonia/Influenza Hospital Discharges by
EOHHS Region, Massachusetts: 2005
377.0406.7
341.6384.4
346.0392.7
415.8
0
50
100
150
200
250
300
350
400
450
Western Central Northeast MetroWest
Southeast Boston MA
Age
-adj
uste
d ra
te
per 1
00,0
00
Source: Division of Health Care Finance and Policy. Calendar Year 2005. Inpatient Hospital Discharge Database
** **
* *
Statistically different from State (p ≤.05) Red (*) = Statistically worse; Green (**) = Statistically better than state
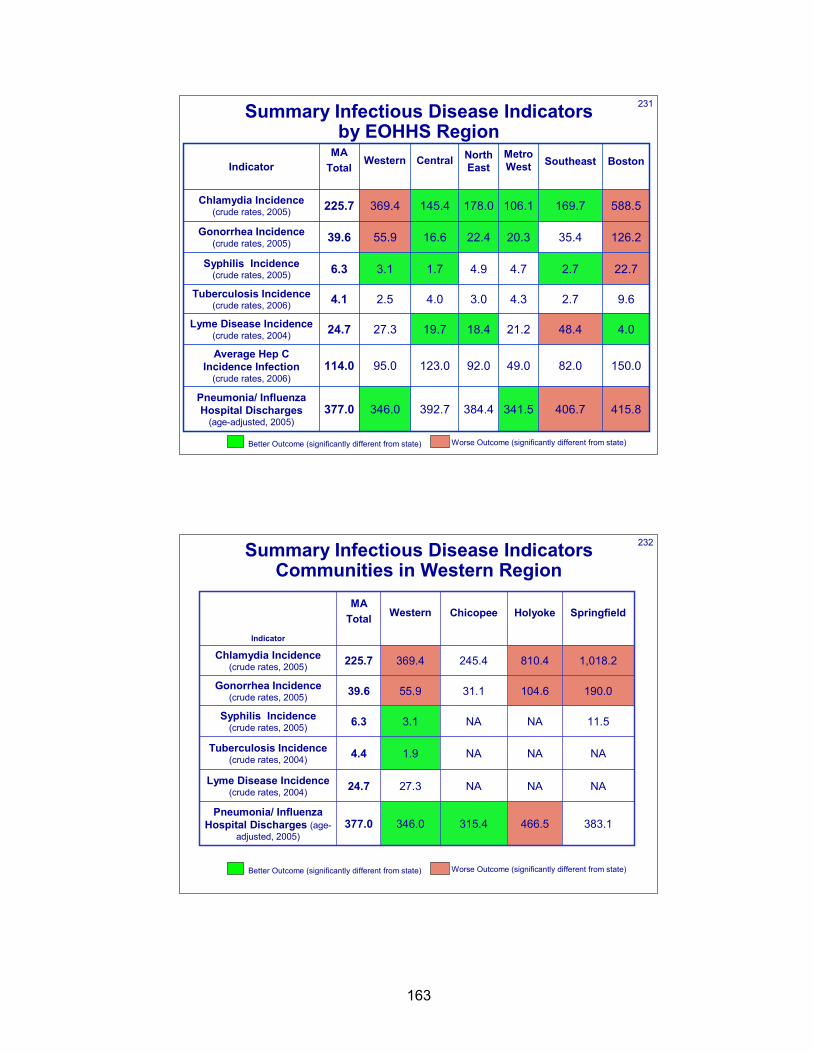
163
231
150.082.049.092.0123.095.0114.0Average Hep C
Incidence Infection(crude rates, 2006)
4.048.421.218.419.727.324.7Lyme Disease Incidence(crude rates, 2004)
9.62.74.33.04.02.54.1Tuberculosis Incidence(crude rates, 2006)
126.235.420.322.416.655.939.6Gonorrhea Incidence (crude rates, 2005)
346.0
3.1
369.4
Western
406.7
2.7
169.7
Southeast
415.8341.5384.4392.7377.0Pneumonia/ Influenza Hospital Discharges
(age-adjusted, 2005)
22.74.74.91.76.3Syphilis Incidence (crude rates, 2005)
588.5106.1178.0145.4225.7Chlamydia Incidence (crude rates, 2005)
BostonMetro West
North East Central
MATotal Indicator
Summary Infectious Disease Indicators by EOHHS Region
Better Outcome (significantly different from state) Worse Outcome (significantly different from state)
232
NANANA27.324.7Lyme Disease Incidence(crude rates, 2004)
NANANA1.94.4Tuberculosis Incidence(crude rates, 2004)
190.0104.631.155.939.6Gonorrhea Incidence (crude rates, 2005)
346.0
3.1
369.4
Western
383.1
11.5
1,018.2
Springfield
466.5315.4377.0Pneumonia/ Influenza
Hospital Discharges (age-adjusted, 2005)
NANA6.3Syphilis Incidence (crude rates, 2005)
810.4245.4225.7Chlamydia Incidence (crude rates, 2005)
HolyokeChicopeeMA
Total Indicator
Summary Infectious Disease Indicators Communities in Western Region
Better Outcome (significantly different from state) Worse Outcome (significantly different from state)
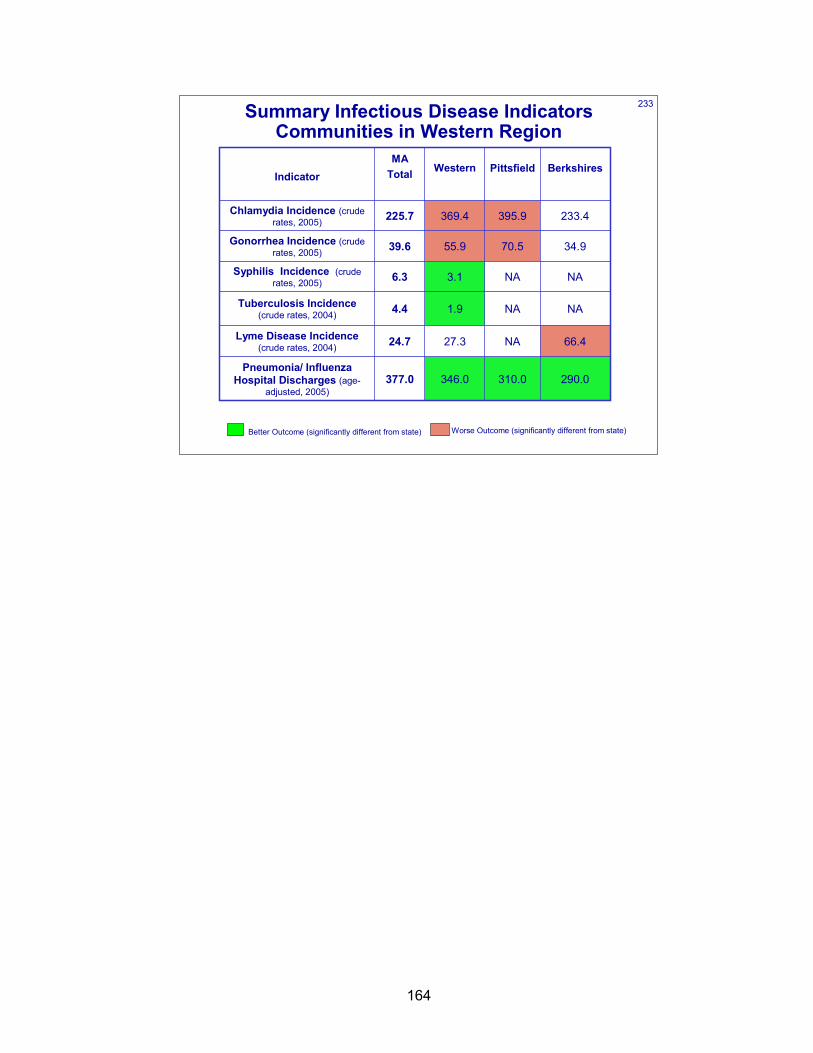
164
233
290.0
66.4
NA
NA
34.9
233.4
Berkshires
NA27.324.7Lyme Disease Incidence(crude rates, 2004)
NA1.94.4Tuberculosis Incidence(crude rates, 2004)
70.555.939.6Gonorrhea Incidence (crude rates, 2005)
346.0
3.1
369.4
Western
310.0377.0Pneumonia/ Influenza
Hospital Discharges (age-adjusted, 2005)
NA6.3Syphilis Incidence (crude rates, 2005)
395.9225.7Chlamydia Incidence (crude rates, 2005)
PittsfieldMA
Total Indicator
Summary Infectious Disease Indicators Communities in Western Region
Better Outcome (significantly different from state) Worse Outcome (significantly different from state)

165
ASTHMA

166
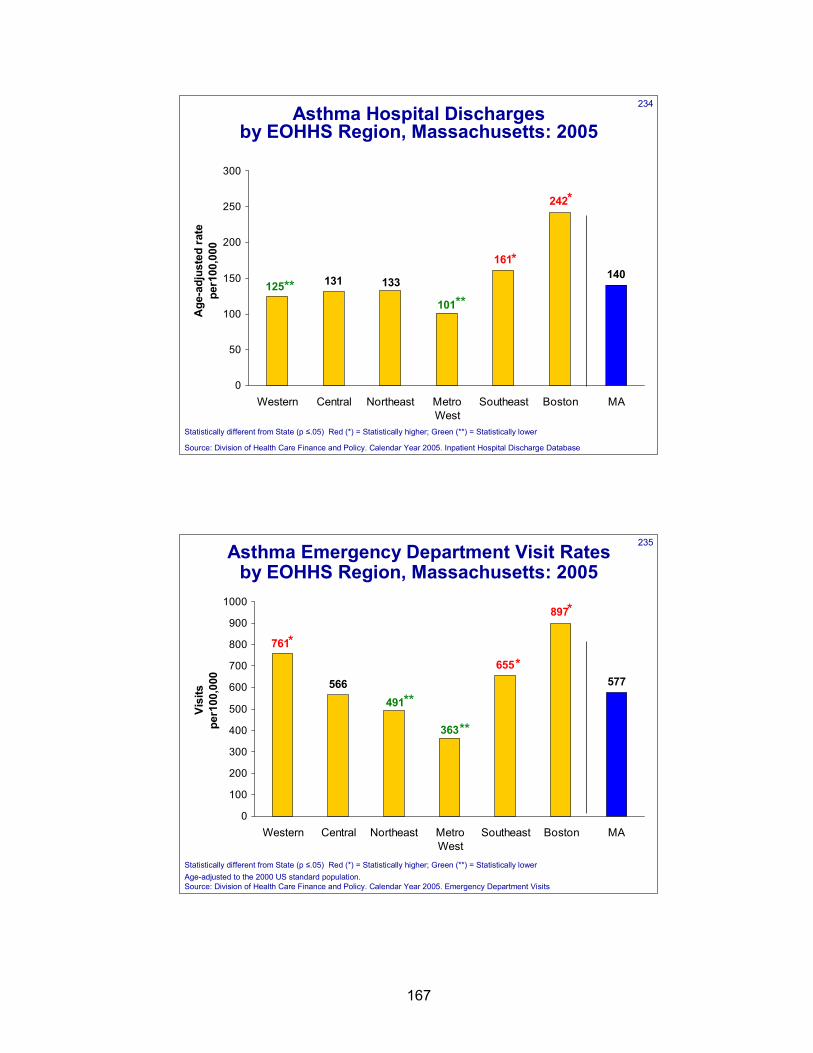
167
234Asthma Hospital Discharges
by EOHHS Region, Massachusetts: 2005
140161
101
133125 131
242
0
50
100
150
200
250
300
Western Central Northeast MetroWest
Southeast Boston MA
Age
-adj
uste
d ra
te
per1
00,0
00
Source: Division of Health Care Finance and Policy. Calendar Year 2005. Inpatient Hospital Discharge Database
****
*
*
Statistically different from State (p ≤.05) Red (*) = Statistically higher; Green (**) = Statistically lower
235Asthma Emergency Department Visit Ratesby EOHHS Region, Massachusetts: 2005
655577
363
491
761
566
897
0
100
200
300
400
500
600
700
800
900
1000
Western Central Northeast MetroWest
Southeast Boston MA
Visi
tspe
r100
,000
Age-adjusted to the 2000 US standard population.Source: Division of Health Care Finance and Policy. Calendar Year 2005. Emergency Department Visits
*
**
**
*
*
Statistically different from State (p ≤.05) Red (*) = Statistically higher; Green (**) = Statistically lower
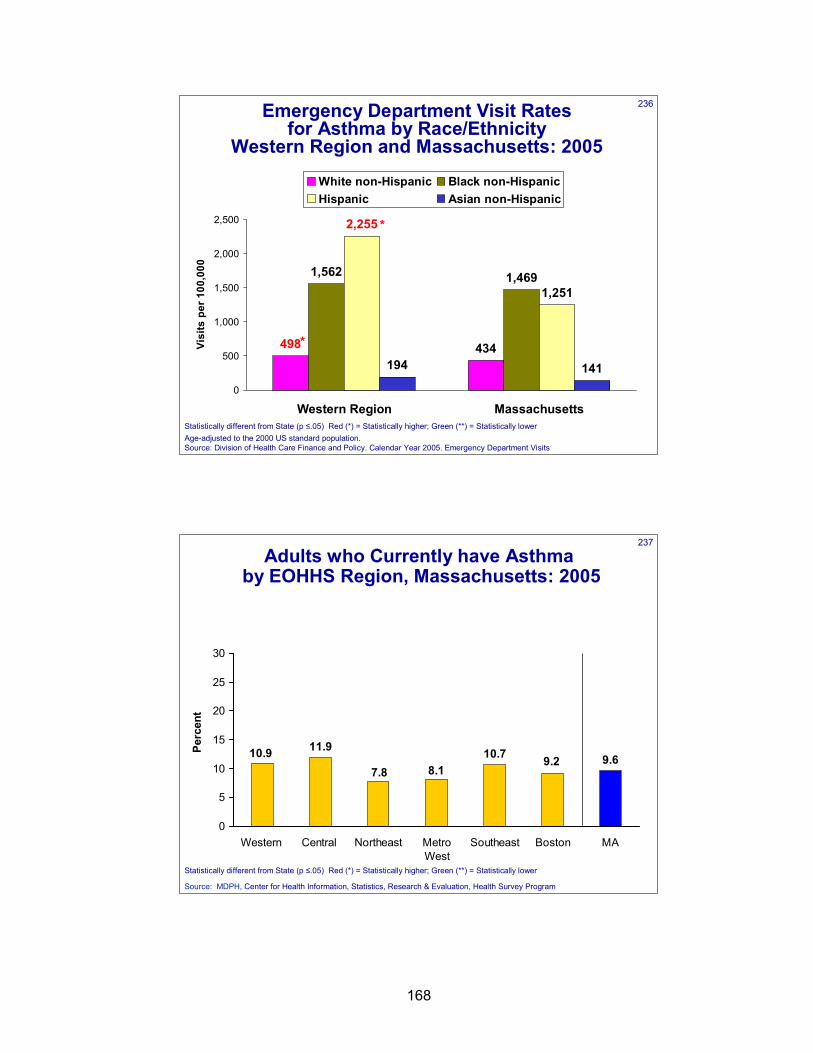
168
236Emergency Department Visit Rates for Asthma by Race/Ethnicity
Western Region and Massachusetts: 2005
434
1,4691,251
194 141
498
1,562
2,255
0
500
1,000
1,500
2,000
2,500
Western Region Massachusetts
Visi
ts p
er 1
00,0
00
White non-Hispanic Black non-HispanicHispanic Asian non-Hispanic
*
*
Age-adjusted to the 2000 US standard population.Source: Division of Health Care Finance and Policy. Calendar Year 2005. Emergency Department Visits
Statistically different from State (p ≤.05) Red (*) = Statistically higher; Green (**) = Statistically lower
237
Adults who Currently have Asthmaby EOHHS Region, Massachusetts: 2005
10.7 9.68.17.8
10.9 11.99.2
0
5
10
15
20
25
30
Western Central Northeast MetroWest
Southeast Boston MA
Perc
ent
Source: MDPH, Center for Health Information, Statistics, Research & Evaluation, Health Survey Program
Statistically different from State (p ≤.05) Red (*) = Statistically higher; Green (**) = Statistically lower
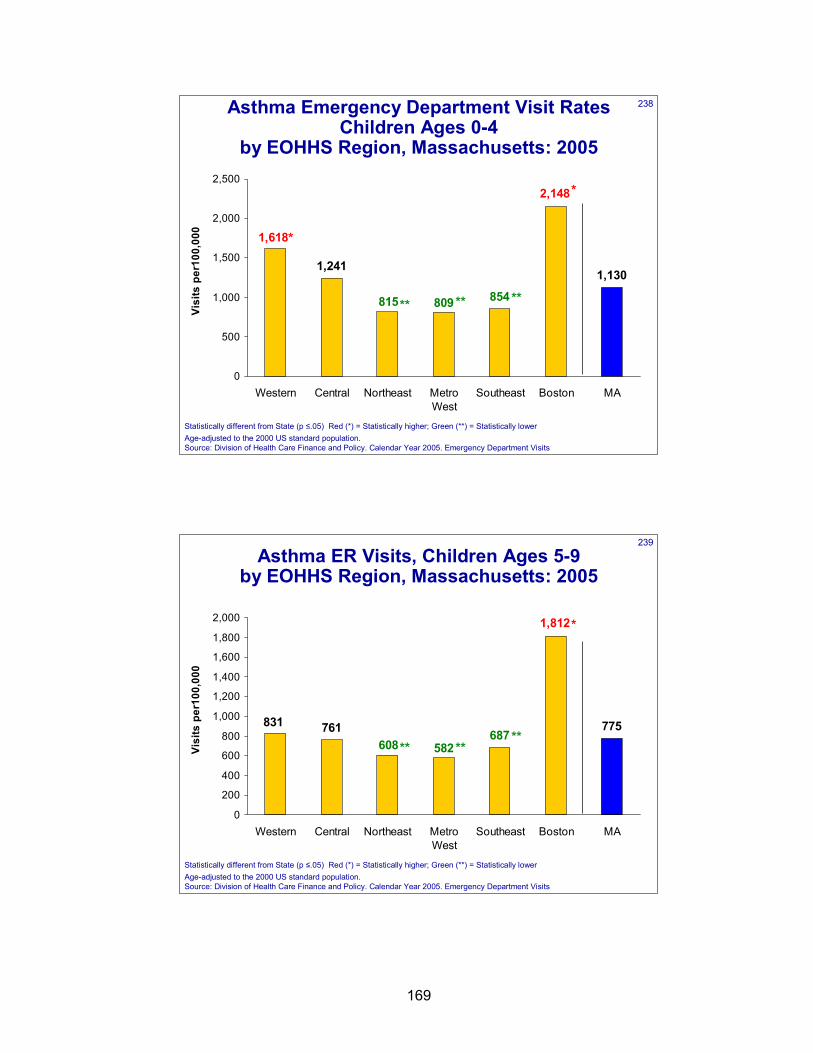
169
238Asthma Emergency Department Visit Rates Children Ages 0-4
by EOHHS Region, Massachusetts: 2005
1,130
854809815
1,618
1,241
2,148
0
500
1,000
1,500
2,000
2,500
Western Central Northeast MetroWest
Southeast Boston MA
Visi
ts p
er10
0,00
0
*
** ** **
*
Age-adjusted to the 2000 US standard population.Source: Division of Health Care Finance and Policy. Calendar Year 2005. Emergency Department Visits
Statistically different from State (p ≤.05) Red (*) = Statistically higher; Green (**) = Statistically lower
239
Asthma ER Visits, Children Ages 5-9by EOHHS Region, Massachusetts: 2005
775687
582608
831 761
1,812
0
200
400
600
800
1,000
1,200
1,400
1,600
1,800
2,000
Western Central Northeast MetroWest
Southeast Boston MA
Visi
ts p
er10
0,00
0
** ****
*
Age-adjusted to the 2000 US standard population.Source: Division of Health Care Finance and Policy. Calendar Year 2005. Emergency Department Visits
Statistically different from State (p ≤.05) Red (*) = Statistically higher; Green (**) = Statistically lower
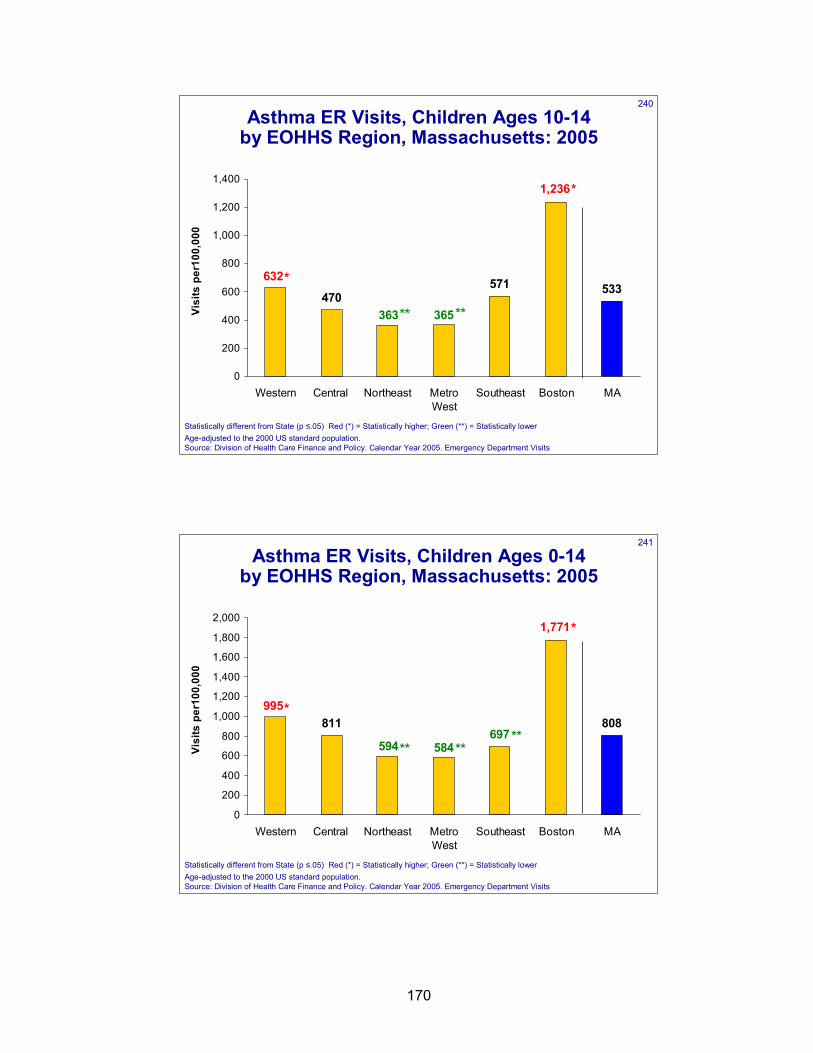
170
240
Asthma ER Visits, Children Ages 10-14by EOHHS Region, Massachusetts: 2005
571 533
365363
632
470
1,236
0
200
400
600
800
1,000
1,200
1,400
Western Central Northeast MetroWest
Southeast Boston MA
Visi
ts p
er10
0,00
0
** **
*
*
Age-adjusted to the 2000 US standard population.Source: Division of Health Care Finance and Policy. Calendar Year 2005. Emergency Department Visits
Statistically different from State (p ≤.05) Red (*) = Statistically higher; Green (**) = Statistically lower
241
Asthma ER Visits, Children Ages 0-14by EOHHS Region, Massachusetts: 2005
808697
584594
995811
1,771
0
200
400
600
800
1,000
1,200
1,400
1,600
1,800
2,000
Western Central Northeast MetroWest
Southeast Boston MA
Visi
ts p
er10
0,00
0
** **
*
*
**
Age-adjusted to the 2000 US standard population.Source: Division of Health Care Finance and Policy. Calendar Year 2005. Emergency Department Visits
Statistically different from State (p ≤.05) Red (*) = Statistically higher; Green (**) = Statistically lower
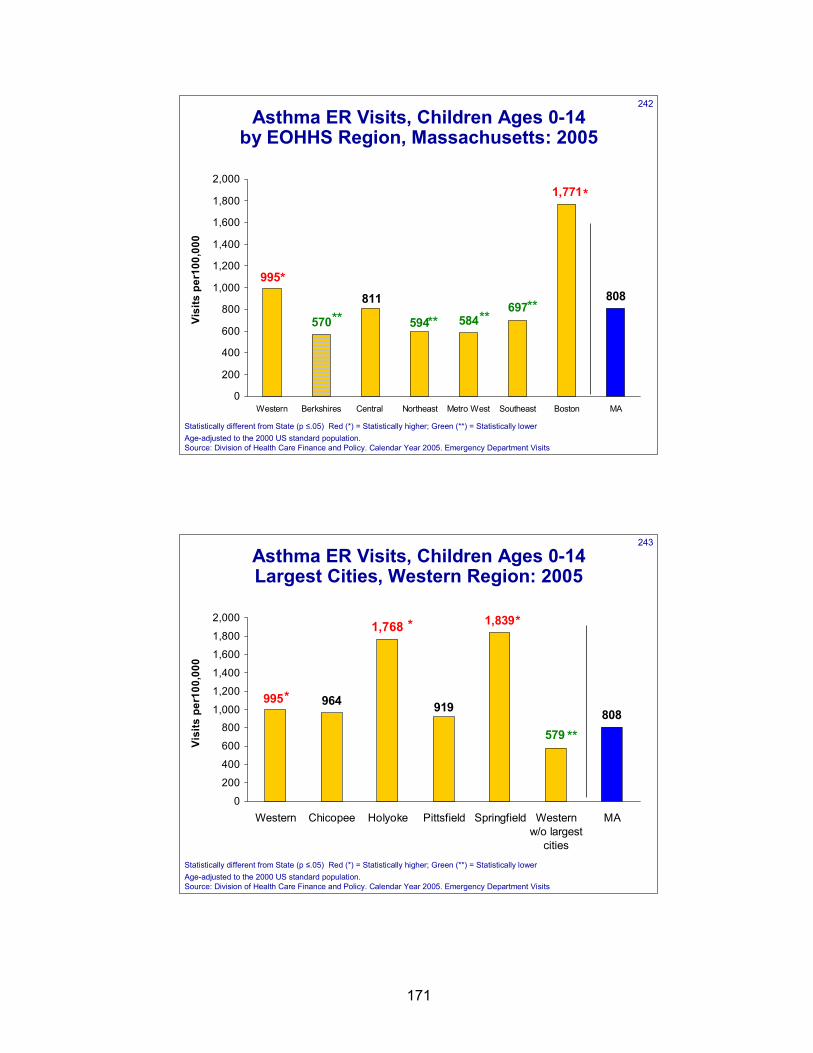
171
242
Asthma ER Visits, Children Ages 0-14by EOHHS Region, Massachusetts: 2005
808
1,771
584594
811
995
570697
0
200
400
600
800
1,000
1,200
1,400
1,600
1,800
2,000
Western Berkshires Central Northeast Metro West Southeast Boston MA
Visi
ts p
er10
0,00
0
** **
*
*
**
Age-adjusted to the 2000 US standard population.Source: Division of Health Care Finance and Policy. Calendar Year 2005. Emergency Department Visits
Statistically different from State (p ≤.05) Red (*) = Statistically higher; Green (**) = Statistically lower
**
243
Asthma ER Visits, Children Ages 0-14Largest Cities, Western Region: 2005
808
1,839
919
1,768
995 964
579
0
200
400
600
800
1,000
1,200
1,400
1,600
1,800
2,000
Western Chicopee Holyoke Pittsfield Springfield Westernw/o largest
cities
MA
Visi
ts p
er10
0,00
0
*
*
**
Age-adjusted to the 2000 US standard population.Source: Division of Health Care Finance and Policy. Calendar Year 2005. Emergency Department Visits
Statistically different from State (p ≤.05) Red (*) = Statistically higher; Green (**) = Statistically lower
*
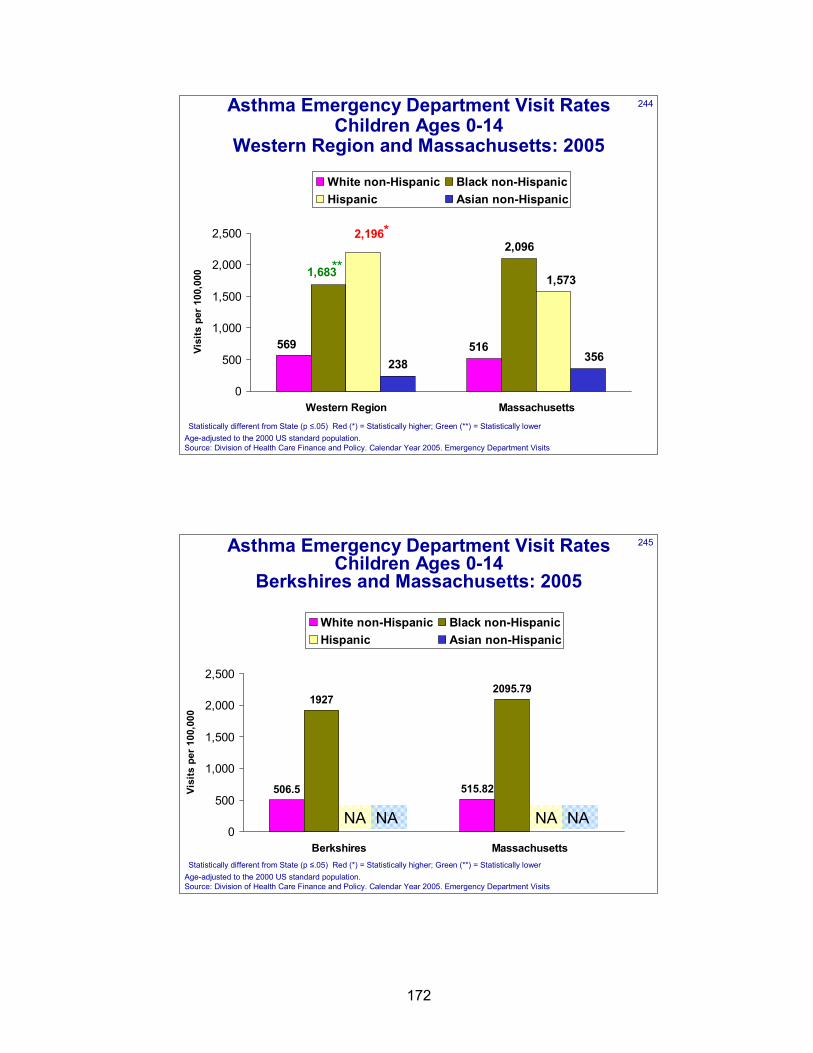
172
244Asthma Emergency Department Visit Rates Children Ages 0-14
Western Region and Massachusetts: 2005
2,096
238569 516
1,683
2,196
1,573
356
0
500
1,000
1,500
2,000
2,500
Western Region Massachusetts
Visi
ts p
er 1
00,0
00White non-Hispanic Black non-HispanicHispanic Asian non-Hispanic
**
*
Age-adjusted to the 2000 US standard population.Source: Division of Health Care Finance and Policy. Calendar Year 2005. Emergency Department Visits
Statistically different from State (p ≤.05) Red (*) = Statistically higher; Green (**) = Statistically lower
245Asthma Emergency Department Visit Rates Children Ages 0-14
Berkshires and Massachusetts: 2005
506.5 515.82
19272095.79
0
500
1,000
1,500
2,000
2,500
Berkshires Massachusetts
Visi
ts p
er 1
00,0
00
White non-Hispanic Black non-HispanicHispanic Asian non-Hispanic
Age-adjusted to the 2000 US standard population.Source: Division of Health Care Finance and Policy. Calendar Year 2005. Emergency Department Visits
Statistically different from State (p ≤.05) Red (*) = Statistically higher; Green (**) = Statistically lower
NA NA NA NA
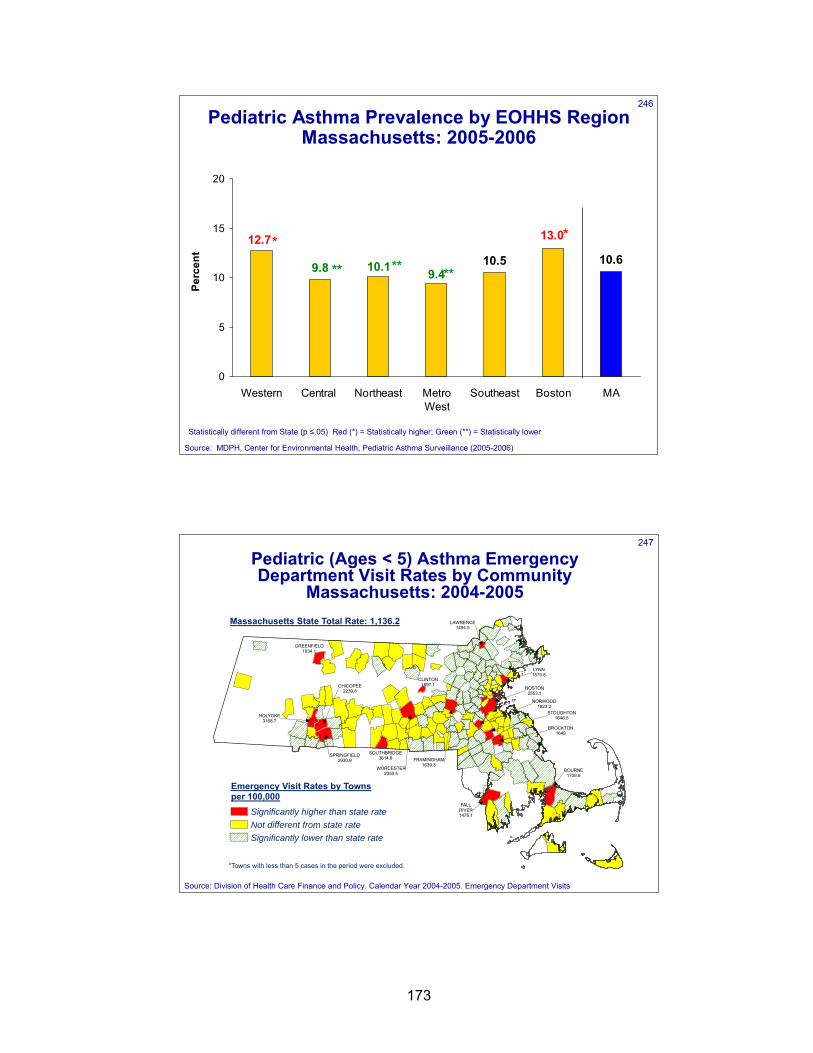
173
246
Pediatric Asthma Prevalence by EOHHS Region Massachusetts: 2005-2006
10.5 10.69.410.1
12.7
9.8
13.0
0
5
10
15
20
Western Central Northeast MetroWest
Southeast Boston MA
Perc
ent
Source: MDPH, Center for Environmental Health, Pediatric Asthma Surveillance (2005-2006)
* *
** ** **
Statistically different from State (p ≤.05) Red (*) = Statistically higher; Green (**) = Statistically lower
247
BOSTON2553.1
BOURNE1709.6
FALLRIVER1476.1
WORCESTER2350.5
SPRINGFIELD2930.9
HOLYOKE3168.7
CHICOPEE2239.8
FRAMINGHAM1639.3
BROCKTON1649
LYNN1570.8
GREENFIELD1934.1
SOUTHBRIDGE3614.8
STOUGHTON1646.5
NORWOOD1823.2
CLINTON1897.1
LAWRENCE1494.5
Pediatric Asthma Emergency Visit Rates by Towns*Among Chilldren Ages <5 Massachusetts 2004-2005
Emergency Visit Rates by Townsper 100,000
Significantly higher than state rateNot different from state rateSignificantly lower than state rate
*Towns with less than 5 cases in the period were excluded.
Massachusetts State Total Rate: 1,136.2
Pediatric (Ages < 5) Asthma Emergency Department Visit Rates by Community
Massachusetts: 2004-2005
Source: Division of Health Care Finance and Policy. Calendar Year 2004-2005. Emergency Department Visits
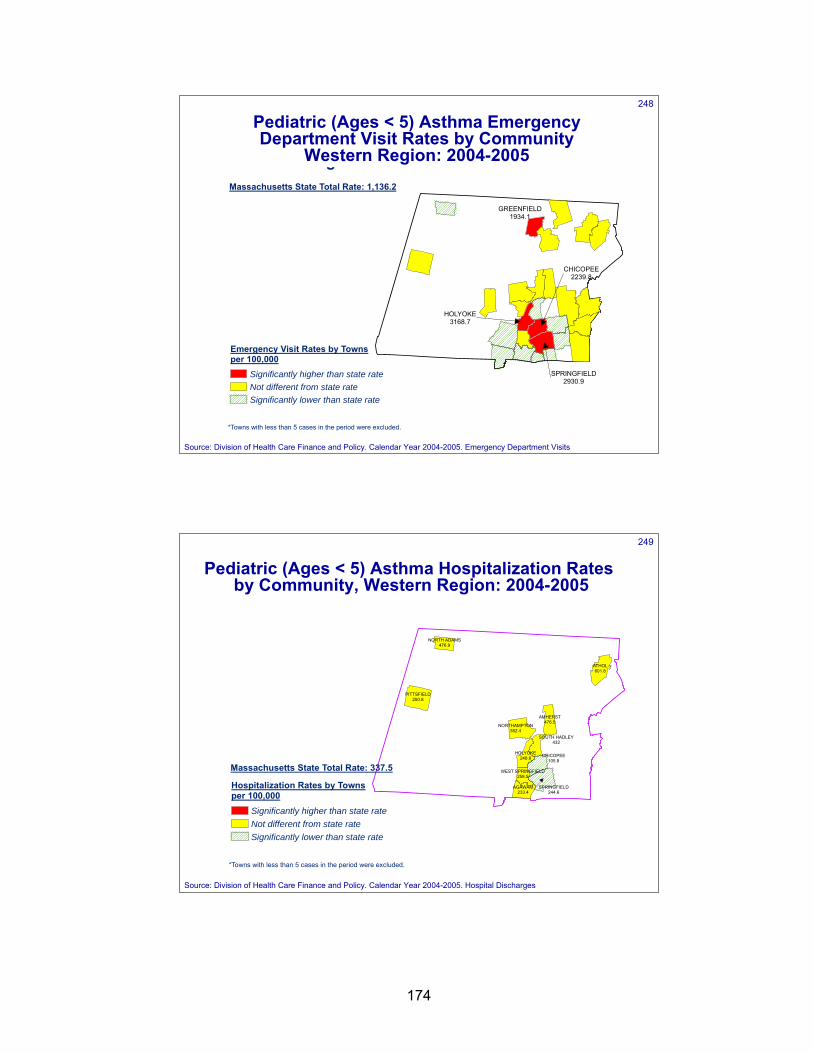
174
248
SPRINGFIELD2930.9
HOLYOKE3168.7
CHICOPEE2239.8
GREENFIELD1934.1
Pediatric Asthma Emergency Visit Rates by Towns*Among Chilldren Ages <5
West Region - Massachusetts 2004-2005
Emergency Visit Rates by Townsper 100,000
Significantly higher than state rateNot different from state rateSignificantly lower than state rate
*Towns with less than 5 cases in the period were excluded.
Massachusetts State Total Rate: 1,136.2
Pediatric (Ages < 5) Asthma Emergency Department Visit Rates by Community
Western Region: 2004-2005
Source: Division of Health Care Finance and Policy. Calendar Year 2004-2005. Emergency Department Visits
249
ATHOL601.8
PITTSFIELD250.8
AMHERST476.5
AGAWAM233.4
NORTHAMPTON382.4
HOLYOKE248.8
NORTH ADAMS476.9
SOUTH HADLEY432
WEST SPRINGFIELD258.5
SPRINGFIELD244.6
CHICOPEE105.8
Pediatric Asthma Hospitalization Rates by Towns*Among Chilldren Ages <5
West Region - Massachusetts 2004-2005
Hospitalization Rates by Townsper 100,000
Significantly higher than state rateNot different from state rateSignificantly lower than state rate
*Towns with less than 5 cases in the period were excluded.
Massachusetts State Total Rate: 337.5
Source: Division of Health Care Finance and Policy. Calendar Year 2004-2005. Hospital Discharges
Pediatric (Ages < 5) Asthma Hospitalization Ratesby Community, Western Region: 2004-2005
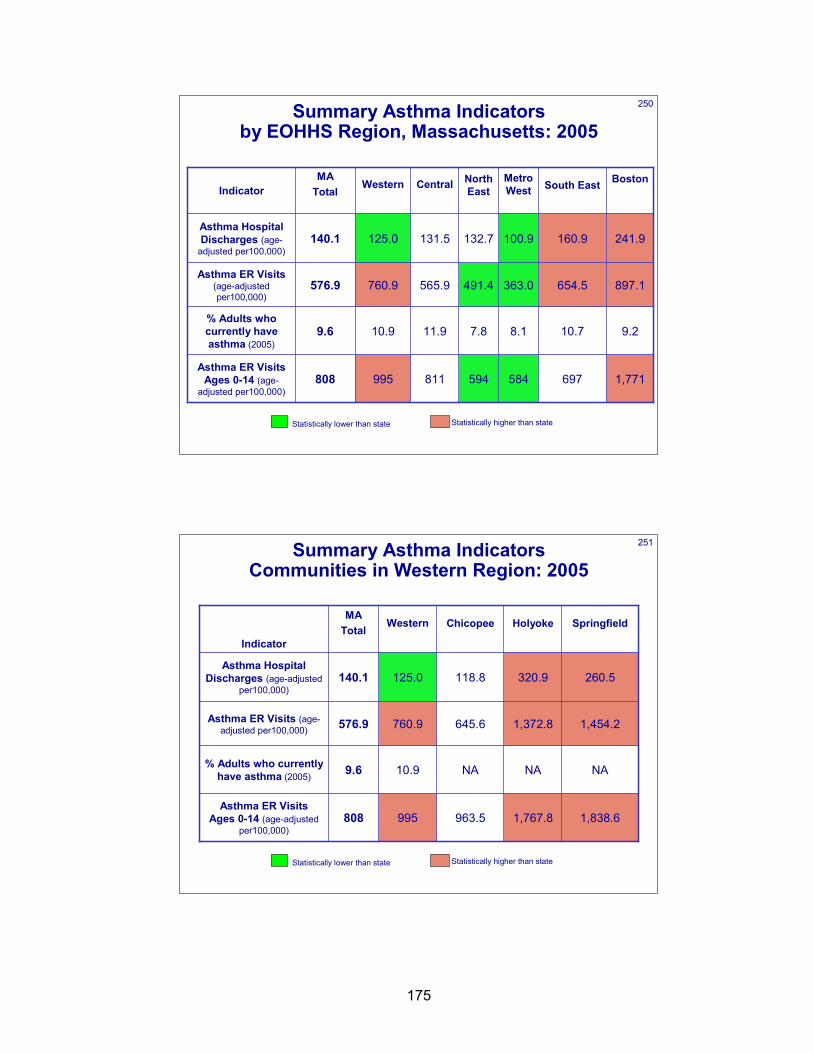
175
250
9.210.78.17.811.910.99.6% Adults who currently have asthma (2005)
1,771697584594811995808Asthma ER Visits
Ages 0-14 (age-adjusted per100,000)
897.1654.5363.0491.4565.9760.9576.9Asthma ER Visits
(age-adjusted per100,000)
125.0
Western
160.9
South East
241.9100.9132.7131.5140.1Asthma Hospital Discharges (age-
adjusted per100,000)
BostonMetro West
North East Central
MATotal Indicator
Summary Asthma Indicators by EOHHS Region, Massachusetts: 2005
Statistically lower than state Statistically higher than state
251
NANANA10.99.6% Adults who currently have asthma (2005)
1,838.61,767.8963.5995808Asthma ER Visits
Ages 0-14 (age-adjusted per100,000)
1,454.21,372.8645.6760.9576.9Asthma ER Visits (age-adjusted per100,000)
125.0
Western
260.5
Springfield
320.9118.8140.1Asthma Hospital
Discharges (age-adjusted per100,000)
HolyokeChicopeeMA
Total Indicator
Summary Asthma Indicators Communities in Western Region: 2005
Statistically lower than state Statistically higher than state
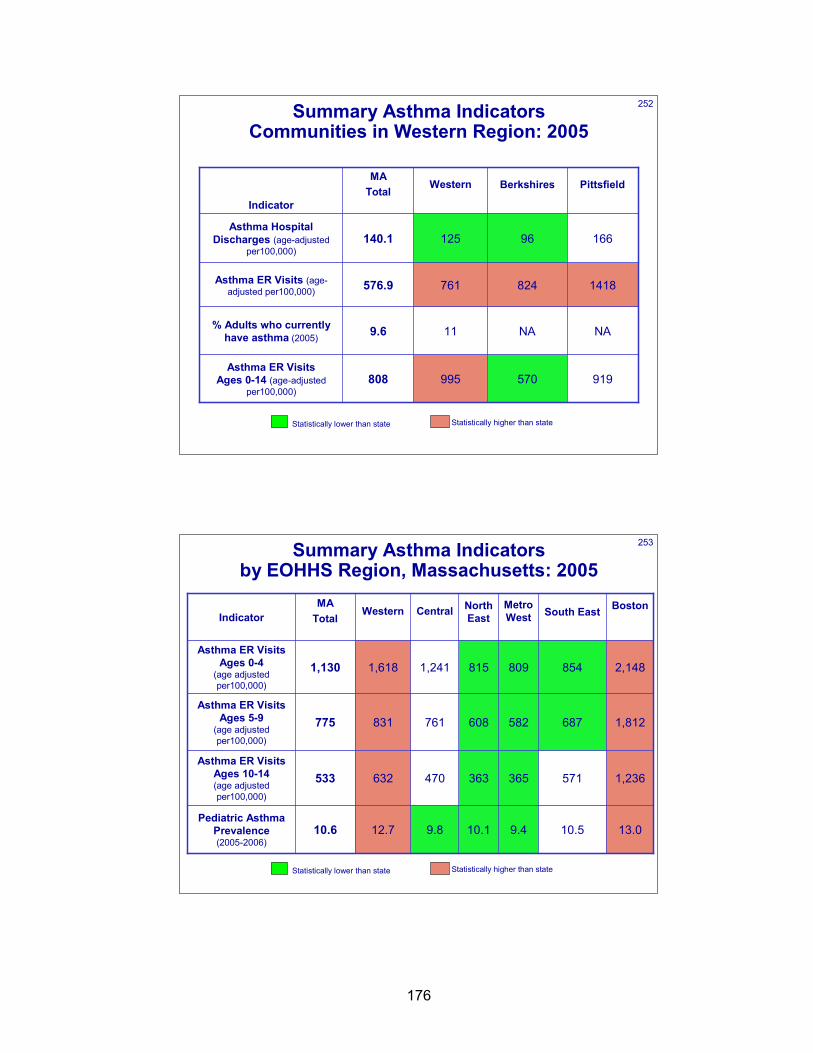
176
252
NANA119.6% Adults who currently have asthma (2005)
919570995808Asthma ER Visits
Ages 0-14 (age-adjusted per100,000)
1418824761576.9Asthma ER Visits (age-adjusted per100,000)
125
Western
16696140.1Asthma Hospital
Discharges (age-adjusted per100,000)
PittsfieldBerkshiresMA
Total Indicator
Summary Asthma Indicators Communities in Western Region: 2005
Statistically lower than state Statistically higher than state
253
1,236571365363470632533Asthma ER Visits
Ages 10-14 (age adjusted per100,000)
1,812687582608761831775Asthma ER Visits
Ages 5-9 (age adjusted per100,000)
12.7
1,618
Western
10.5
854
South East
13.09.410.19.810.6Pediatric Asthma
Prevalence (2005-2006)
2,1488098151,2411,130Asthma ER Visits
Ages 0-4 (age adjusted per100,000)
BostonMetro West
North East Central
MATotal Indicator
Summary Asthma Indicators by EOHHS Region, Massachusetts: 2005
Statistically lower than state Statistically higher than state
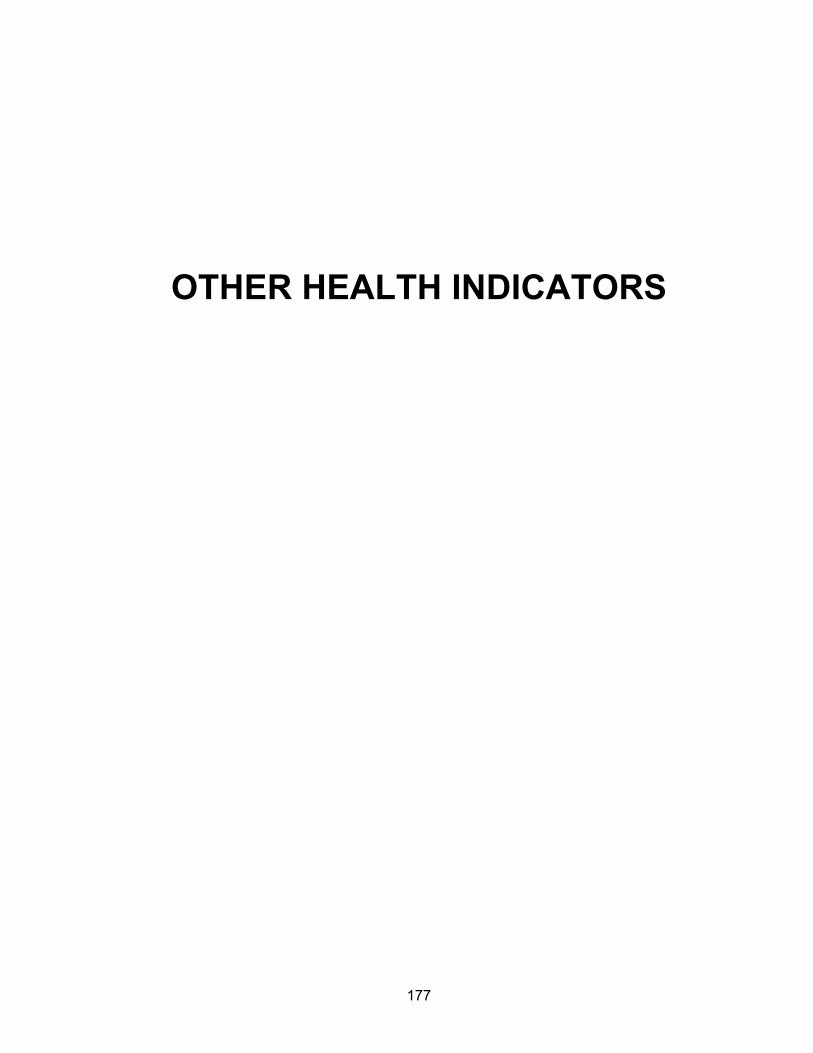
177
OTHER HEALTH INDICATORS

178
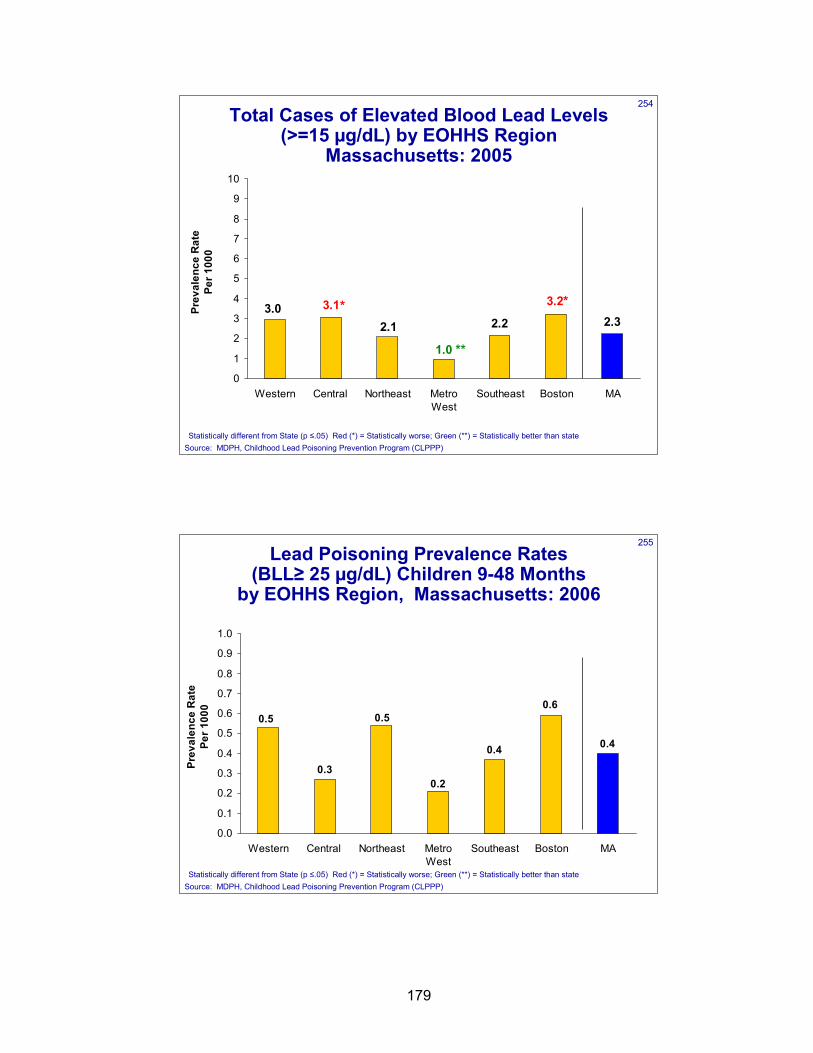
179
254Total Cases of Elevated Blood Lead Levels
(>=15 µg/dL) by EOHHS RegionMassachusetts: 2005
2.2 2.3
1.0
2.13.0 3.1 3.2
0
1
2
3
4
5
6
7
8
9
10
Western Central Northeast MetroWest
Southeast Boston MA
Prev
alen
ce R
ate
Per 1
000
Source: MDPH, Childhood Lead Poisoning Prevention Program (CLPPP)
**
* *
Statistically different from State (p ≤.05) Red (*) = Statistically worse; Green (**) = Statistically better than state
255Lead Poisoning Prevalence Rates
(BLL≥ 25 µg/dL) Children 9-48 Monthsby EOHHS Region, Massachusetts: 2006
0.4 0.4
0.6
0.3
0.5 0.5
0.2
0.0
0.1
0.2
0.3
0.4
0.5
0.6
0.7
0.8
0.9
1.0
Western Central Northeast MetroWest
Southeast Boston MA
Prev
alen
ce R
ate
Per 1
000
Source: MDPH, Childhood Lead Poisoning Prevention Program (CLPPP)Statistically different from State (p ≤.05) Red (*) = Statistically worse; Green (**) = Statistically better than state
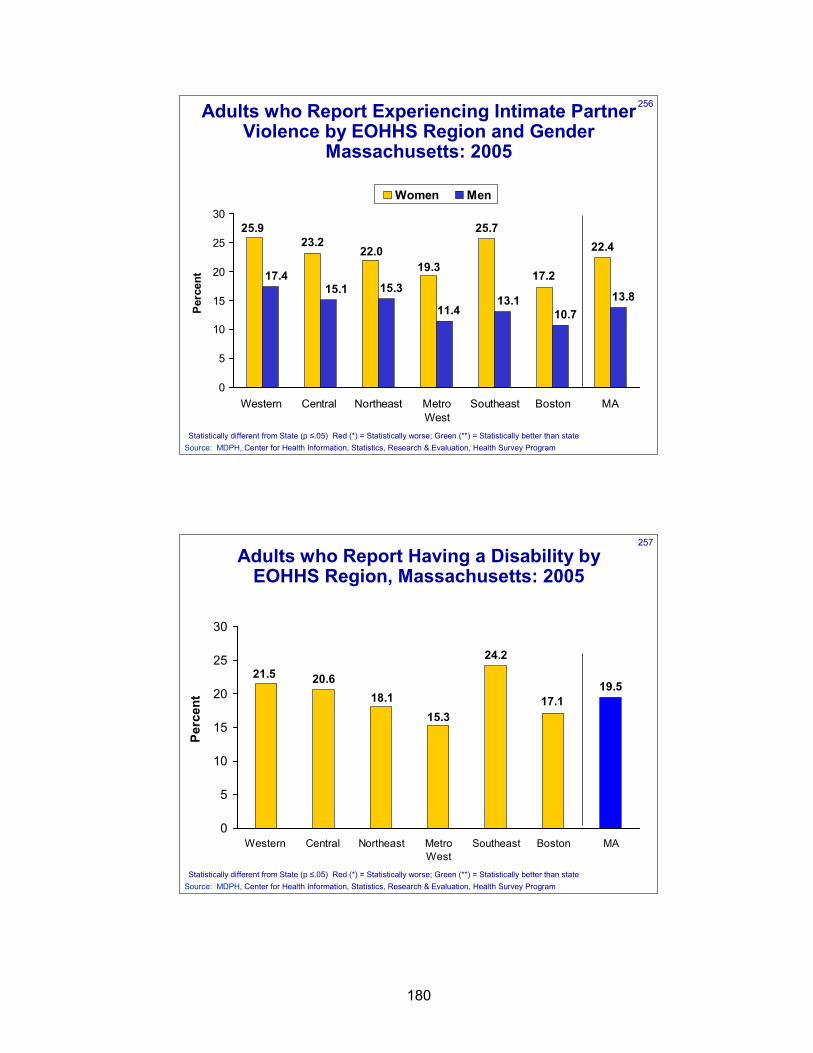
180
256Adults who Report Experiencing Intimate Partner Violence by EOHHS Region and Gender
Massachusetts: 2005
25.722.4
19.322.0
25.923.2
17.217.415.1 15.3
11.413.1
10.713.8
0
5
10
15
20
25
30
Western Central Northeast MetroWest
Southeast Boston MA
Perc
ent
Women Men
Source: MDPH, Center for Health Information, Statistics, Research & Evaluation, Health Survey ProgramStatistically different from State (p ≤.05) Red (*) = Statistically worse; Green (**) = Statistically better than state
257
Adults who Report Having a Disability by EOHHS Region, Massachusetts: 2005
24.2
19.5
15.318.1
21.5 20.6
17.1
0
5
10
15
20
25
30
Western Central Northeast MetroWest
Southeast Boston MA
Perc
ent
Source: MDPH, Center for Health Information, Statistics, Research & Evaluation, Health Survey ProgramStatistically different from State (p ≤.05) Red (*) = Statistically worse; Green (**) = Statistically better than state
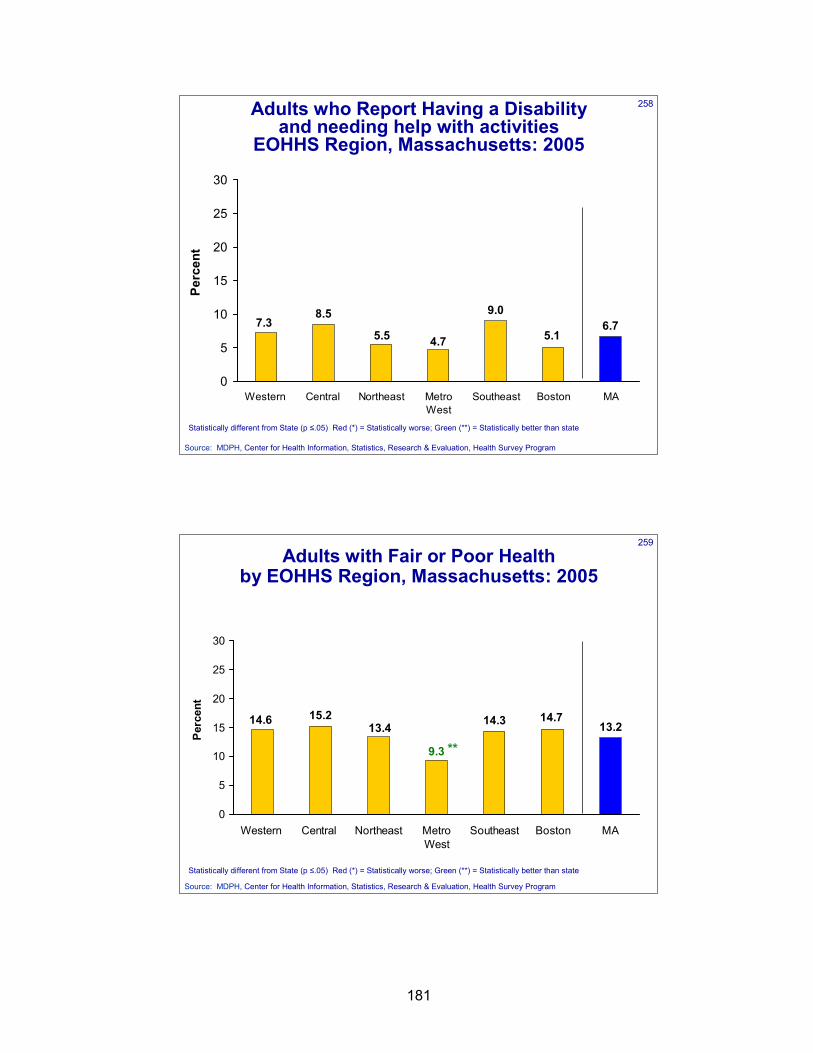
181
258Adults who Report Having a Disability and needing help with activities
EOHHS Region, Massachusetts: 2005
9.06.7
4.75.57.3
8.5
5.1
0
5
10
15
20
25
30
Western Central Northeast MetroWest
Southeast Boston MA
Perc
ent
Source: MDPH, Center for Health Information, Statistics, Research & Evaluation, Health Survey Program
Statistically different from State (p ≤.05) Red (*) = Statistically worse; Green (**) = Statistically better than state
259
Adults with Fair or Poor Health by EOHHS Region, Massachusetts: 2005
14.3 13.2
9.3
13.414.6 15.2 14.7
0
5
10
15
20
25
30
Western Central Northeast MetroWest
Southeast Boston MA
Perc
ent
**
Source: MDPH, Center for Health Information, Statistics, Research & Evaluation, Health Survey Program
Statistically different from State (p ≤.05) Red (*) = Statistically worse; Green (**) = Statistically better than state
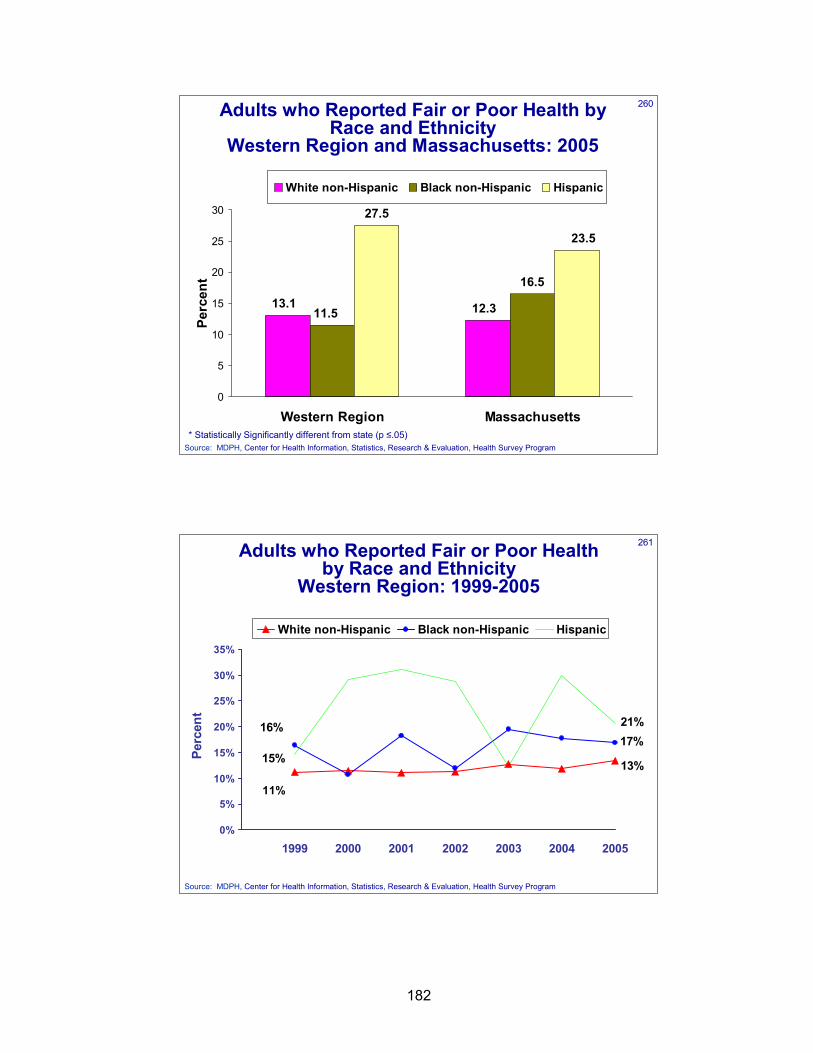
182
260Adults who Reported Fair or Poor Health by Race and Ethnicity
Western Region and Massachusetts: 2005
16.5
12.313.111.5
27.5
23.5
0
5
10
15
20
25
30
Western Region Massachusetts
Perc
ent
White non-Hispanic Black non-Hispanic Hispanic
* Statistically Significantly different from state (p ≤.05)Source: MDPH, Center for Health Information, Statistics, Research & Evaluation, Health Survey Program
261
13%
11%
17%16% 21%
15%
0%
5%
10%
15%
20%
25%
30%
35%
1999 2000 2001 2002 2003 2004 2005
Perc
ent
White non-Hispanic Black non-Hispanic Hispanic
Adults who Reported Fair or Poor Health by Race and Ethnicity
Western Region: 1999-2005
Source: MDPH, Center for Health Information, Statistics, Research & Evaluation, Health Survey Program
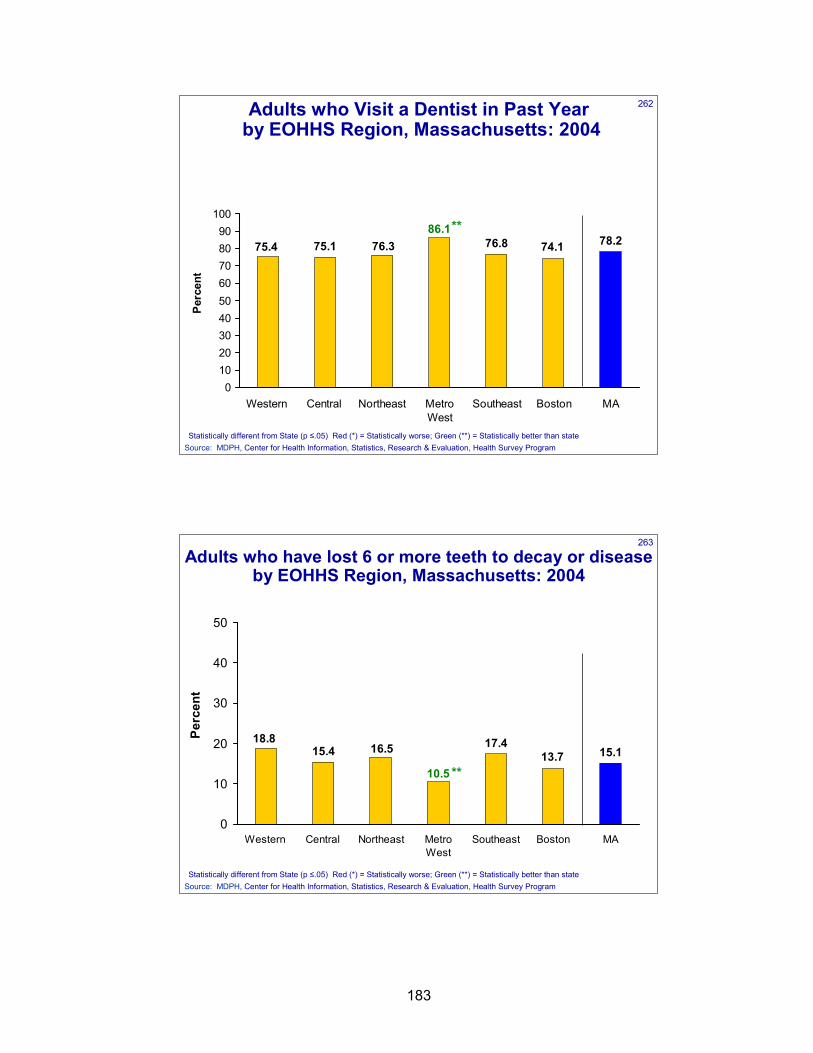
183
262Adults who Visit a Dentist in Past Yearby EOHHS Region, Massachusetts: 2004
76.8 78.286.1
76.375.4 75.1 74.1
0102030405060708090
100
Western Central Northeast MetroWest
Southeast Boston MA
Perc
ent
**
Source: MDPH, Center for Health Information, Statistics, Research & Evaluation, Health Survey ProgramStatistically different from State (p ≤.05) Red (*) = Statistically worse; Green (**) = Statistically better than state
263
Adults who have lost 6 or more teeth to decay or disease by EOHHS Region, Massachusetts: 2004
17.415.1
10.5
16.518.8
15.4 13.7
0
10
20
30
40
50
Western Central Northeast MetroWest
Southeast Boston MA
Perc
ent
**
Source: MDPH, Center for Health Information, Statistics, Research & Evaluation, Health Survey ProgramStatistically different from State (p ≤.05) Red (*) = Statistically worse; Green (**) = Statistically better than state
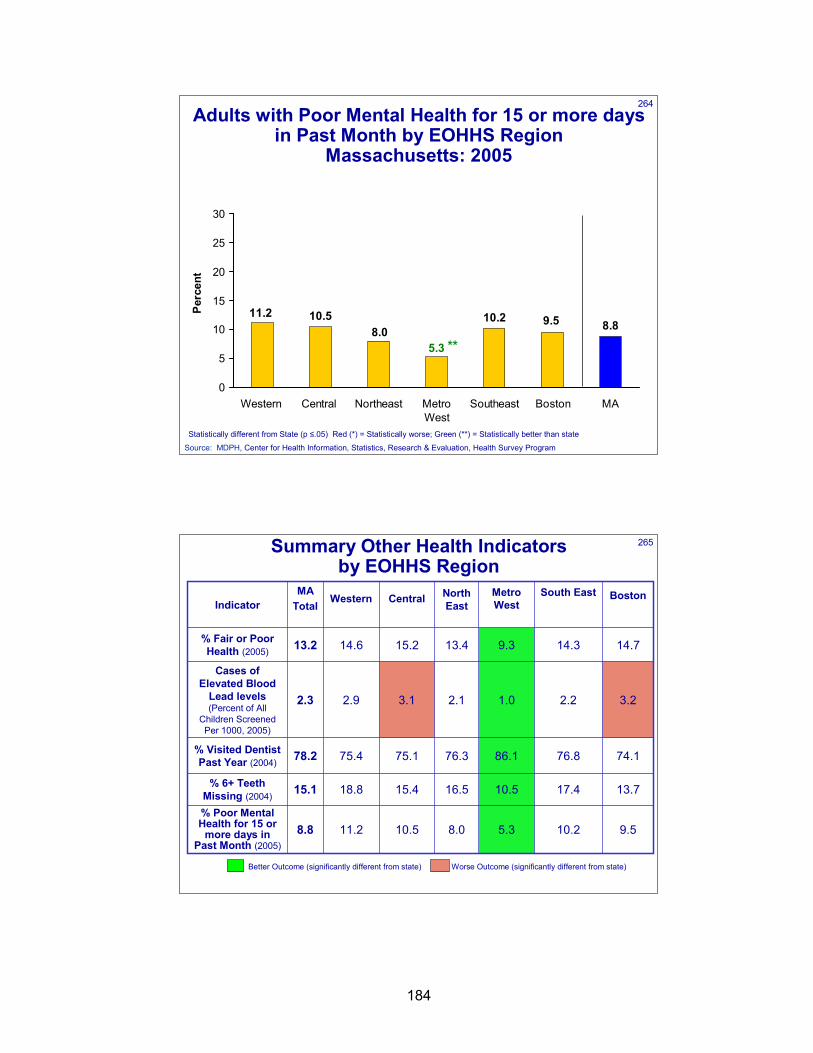
184
264Adults with Poor Mental Health for 15 or more days
in Past Month by EOHHS Region Massachusetts: 2005
10.2 8.8
5.38.0
11.2 10.5 9.5
0
5
10
15
20
25
30
Western Central Northeast MetroWest
Southeast Boston MA
Perc
ent
**
Source: MDPH, Center for Health Information, Statistics, Research & Evaluation, Health Survey Program
Statistically different from State (p ≤.05) Red (*) = Statistically worse; Green (**) = Statistically better than state
265
3.22.21.02.13.12.92.3
Cases of Elevated Blood
Lead levels (Percent of All
Children Screened Per 1000, 2005)
13.717.410.516.515.418.815.1% 6+ Teeth Missing (2004)
74.176.886.176.375.175.478.2% Visited Dentist Past Year (2004)
14.714.39.313.415.214.613.2% Fair or Poor Health (2005)
11.2
Western
10.2
South East
9.55.38.010.58.8% Poor Mental Health for 15 or
more days in Past Month (2005)
BostonMetro West
North East Central
MATotal Indicator
Summary Other Health Indicators by EOHHS Region
Better Outcome (significantly different from state) Worse Outcome (significantly different from state)
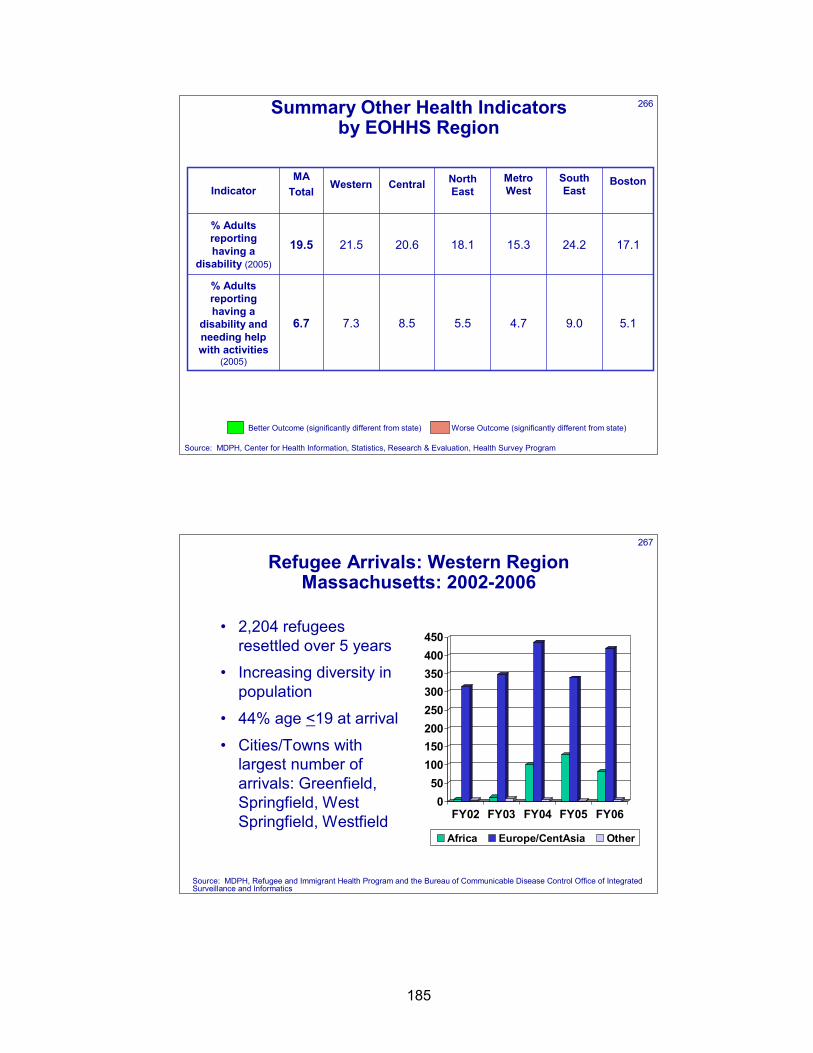
185
266
5.19.04.75.58.57.36.7
% Adults reporting having a
disability and needing help with activities
(2005)
17.124.215.318.120.621.519.5% Adults reporting having a
disability (2005)
Western South East
BostonMetro West
North East Central
MATotal Indicator
Summary Other Health Indicators by EOHHS Region
Source: MDPH, Center for Health Information, Statistics, Research & Evaluation, Health Survey Program
Better Outcome (significantly different from state) Worse Outcome (significantly different from state)
267
Refugee Arrivals: Western Region Massachusetts: 2002-2006
• 2,204 refugees resettled over 5 years
• Increasing diversity in population
• 44% age <19 at arrival
• Cities/Towns with largest number of arrivals: Greenfield, Springfield, West Springfield, Westfield
050
100150200250300350400450
FY02 FY03 FY04 FY05 FY06
Africa Europe/CentAsia Other
Source: MDPH, Refugee and Immigrant Health Program and the Bureau of Communicable Disease Control Office of Integrated Surveillance and Informatics
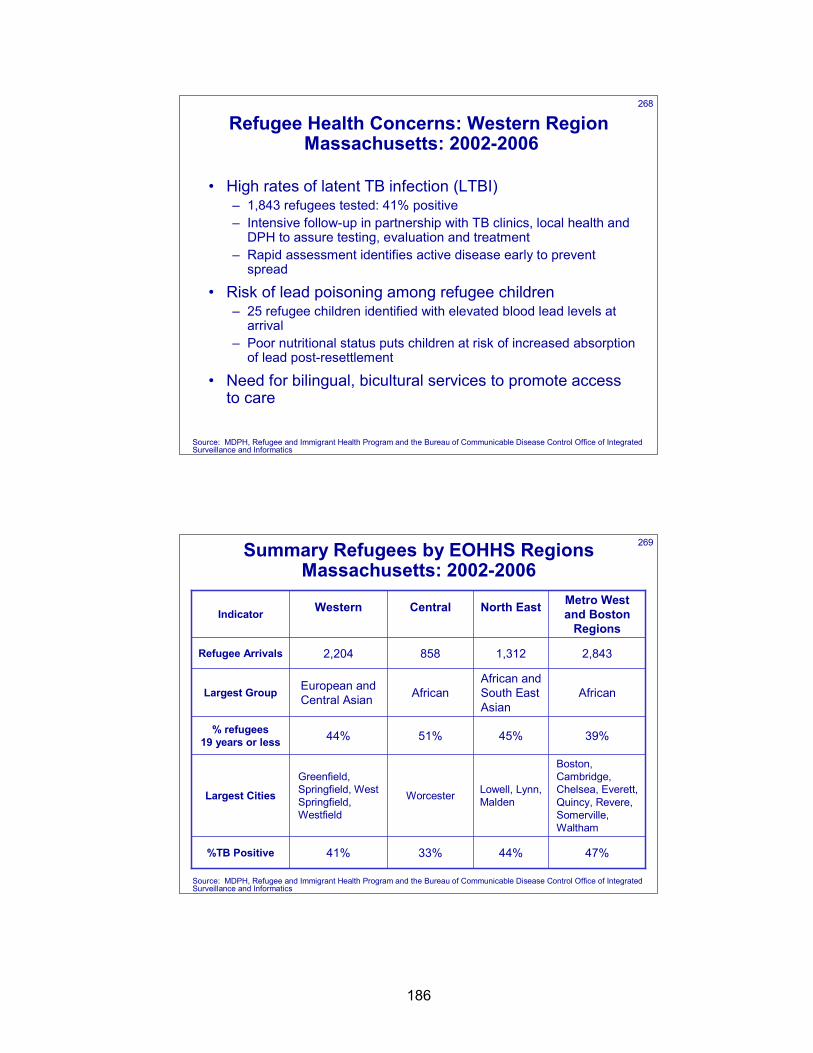
186
268
Refugee Health Concerns: Western RegionMassachusetts: 2002-2006
• High rates of latent TB infection (LTBI)– 1,843 refugees tested: 41% positive– Intensive follow-up in partnership with TB clinics, local health and
DPH to assure testing, evaluation and treatment– Rapid assessment identifies active disease early to prevent
spread
• Risk of lead poisoning among refugee children– 25 refugee children identified with elevated blood lead levels at
arrival– Poor nutritional status puts children at risk of increased absorption
of lead post-resettlement
• Need for bilingual, bicultural services to promote access to care
Source: MDPH, Refugee and Immigrant Health Program and the Bureau of Communicable Disease Control Office of Integrated Surveillance and Informatics
269
AfricanAfrican and South East Asian
AfricanEuropean and Central AsianLargest Group
2,8431,3128582,204Refugee Arrivals
47%
Boston, Cambridge, Chelsea, Everett, Quincy, Revere, Somerville, Waltham
39%
Metro West and Boston
Regions
44%33%41%%TB Positive
Lowell, Lynn, MaldenWorcester
Greenfield, Springfield, West Springfield, Westfield
Largest Cities
44%
Western
45%51%% refugees 19 years or less
North East CentralIndicator
Summary Refugees by EOHHS Regions Massachusetts: 2002-2006
Source: MDPH, Refugee and Immigrant Health Program and the Bureau of Communicable Disease Control Office of Integrated Surveillance and Informatics
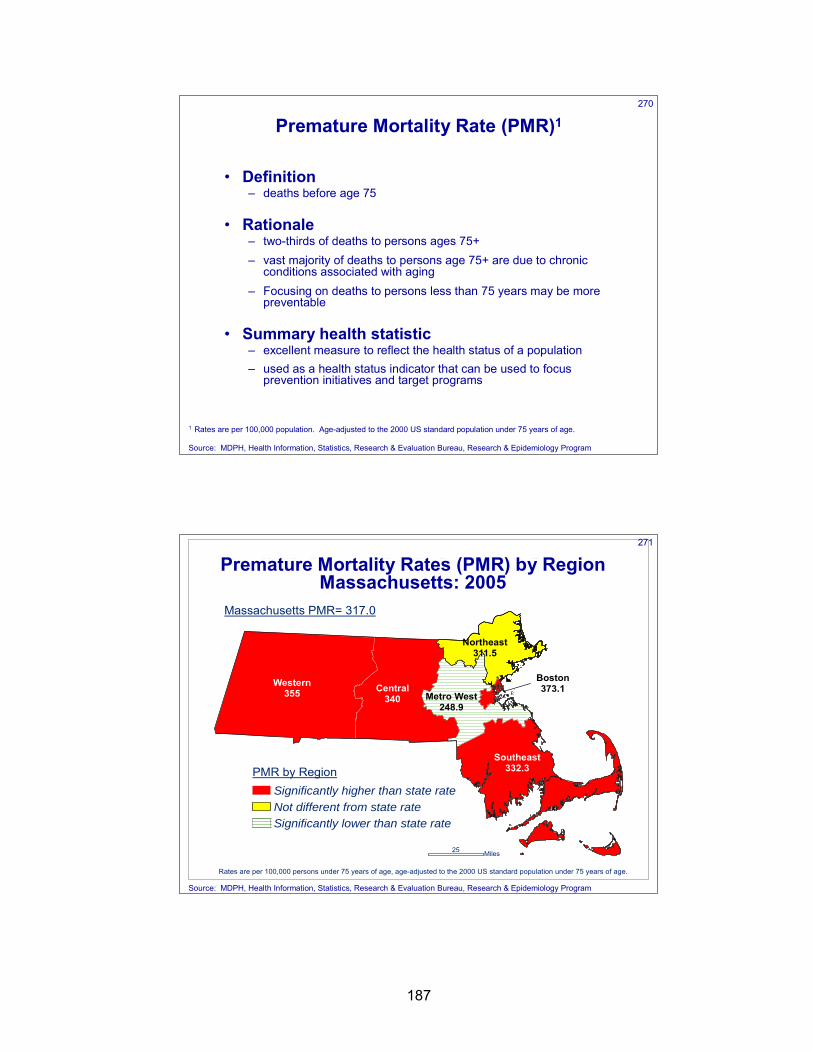
187
270
Premature Mortality Rate (PMR)1
• Definition– deaths before age 75
• Rationale– two-thirds of deaths to persons ages 75+– vast majority of deaths to persons age 75+ are due to chronic
conditions associated with aging – Focusing on deaths to persons less than 75 years may be more
preventable
• Summary health statistic– excellent measure to reflect the health status of a population– used as a health status indicator that can be used to focus
prevention initiatives and target programs
1 Rates are per 100,000 population. Age-adjusted to the 2000 US standard population under 75 years of age.
Source: MDPH, Health Information, Statistics, Research & Evaluation Bureau, Research & Epidemiology Program
271
Western355 Central
340
Southeast332.3
Boston373.1
Northeast311.5
Metro West248.9
Map 2. Premature Mortality Rate (PMR) by RegionMassachusetts: 2005
Rates are per 100,000 persons under 75 years of age, age-adjusted to the 2000 US standard population under 75 years of age.
Massachusetts PMR= 317.0
25 Miles
PMR by RegionSignificantly higher than state rateNot different from state rateSignificantly lower than state rate
Premature Mortality Rates (PMR) by RegionMassachusetts: 2005
Source: MDPH, Health Information, Statistics, Research & Evaluation Bureau, Research & Epidemiology Program
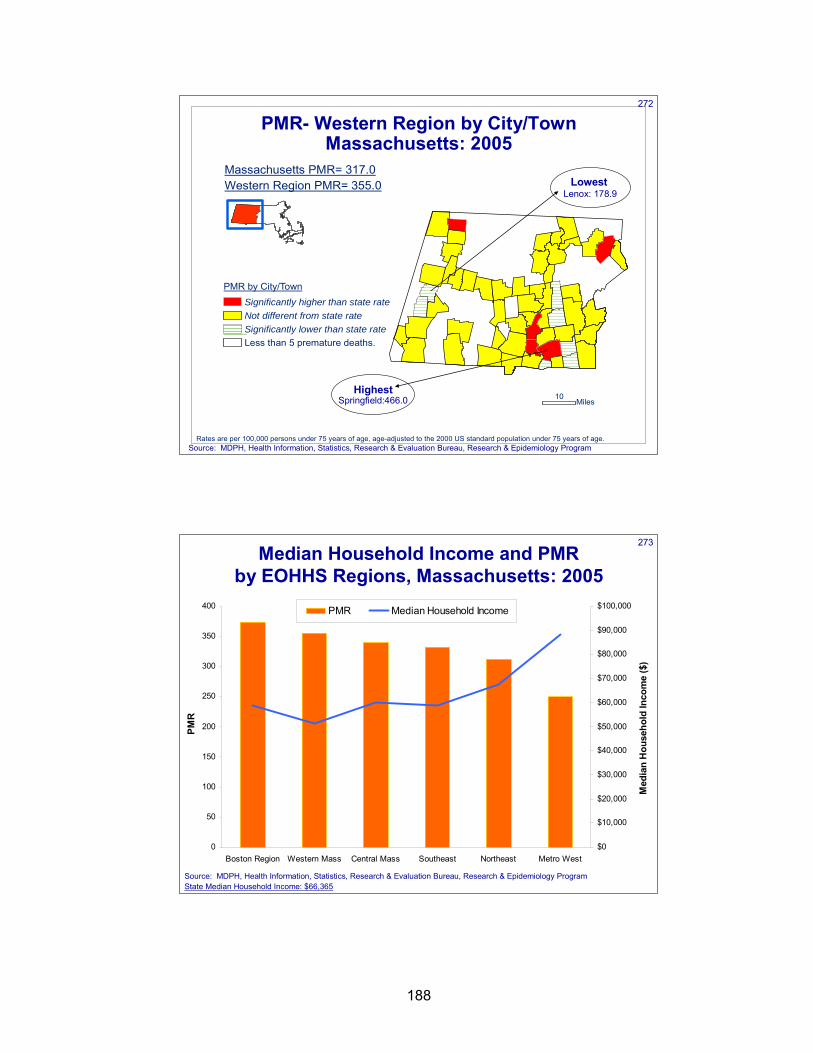
188
272
Rates are per 100,000 persons under 75 years of age, age-adjusted to the 2000 US standard population under 75 years of age.
Map 3. Premature Mortality Rates (PMR) Massachusetts Western Region by City/Town: 2005
Western Region PMR= 355.0
*R t 100 000 l ti
PMR by City/Town
Significantly higher than state rateNot different from state rateSignificantly lower than state rateLess than 5 premature deaths.
10Miles
Massachusetts PMR= 317.0
PMR- Western Region by City/Town Massachusetts: 2005
HighestSpringfield:466.0
LowestLenox: 178.9
Source: MDPH, Health Information, Statistics, Research & Evaluation Bureau, Research & Epidemiology Program
273Median Household Income and PMR
by EOHHS Regions, Massachusetts: 2005
State Median Household Income: $66,365
0
50
100
150
200
250
300
350
400
Boston Region Western Mass Central Mass Southeast Northeast Metro West
PMR
$0
$10,000
$20,000
$30,000
$40,000
$50,000
$60,000
$70,000
$80,000
$90,000
$100,000
Med
ian
Hou
seho
ld In
com
e ($
)
PMR Median Household Income
Source: MDPH, Health Information, Statistics, Research & Evaluation Bureau, Research & Epidemiology Program
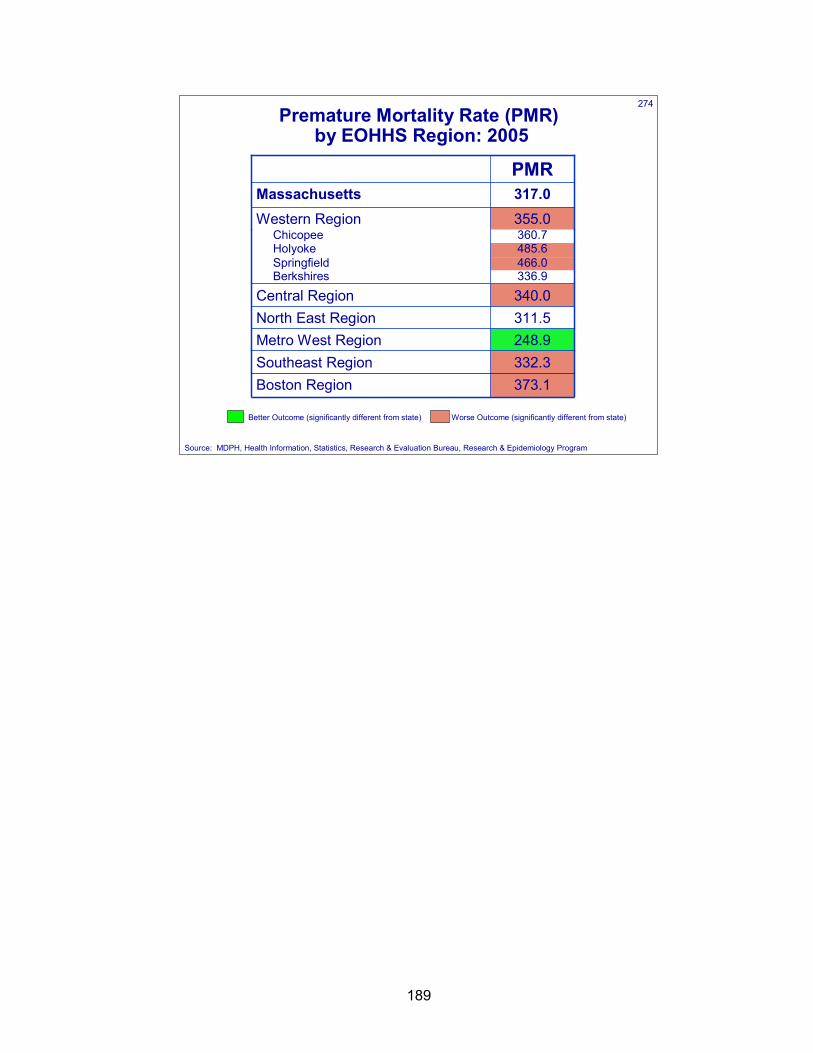
189
274Premature Mortality Rate (PMR)
by EOHHS Region: 2005
Source: MDPH, Health Information, Statistics, Research & Evaluation Bureau, Research & Epidemiology Program
Better Outcome (significantly different from state) Worse Outcome (significantly different from state)
466.0Springfield336.9Berkshires
485.6Holyoke360.7Chicopee
332.3Southeast Region
317.0Massachusetts
373.1Boston Region
248.9Metro West Region311.5North East Region340.0Central Region
355.0Western Region
PMR

190

191
SUMMARY

192
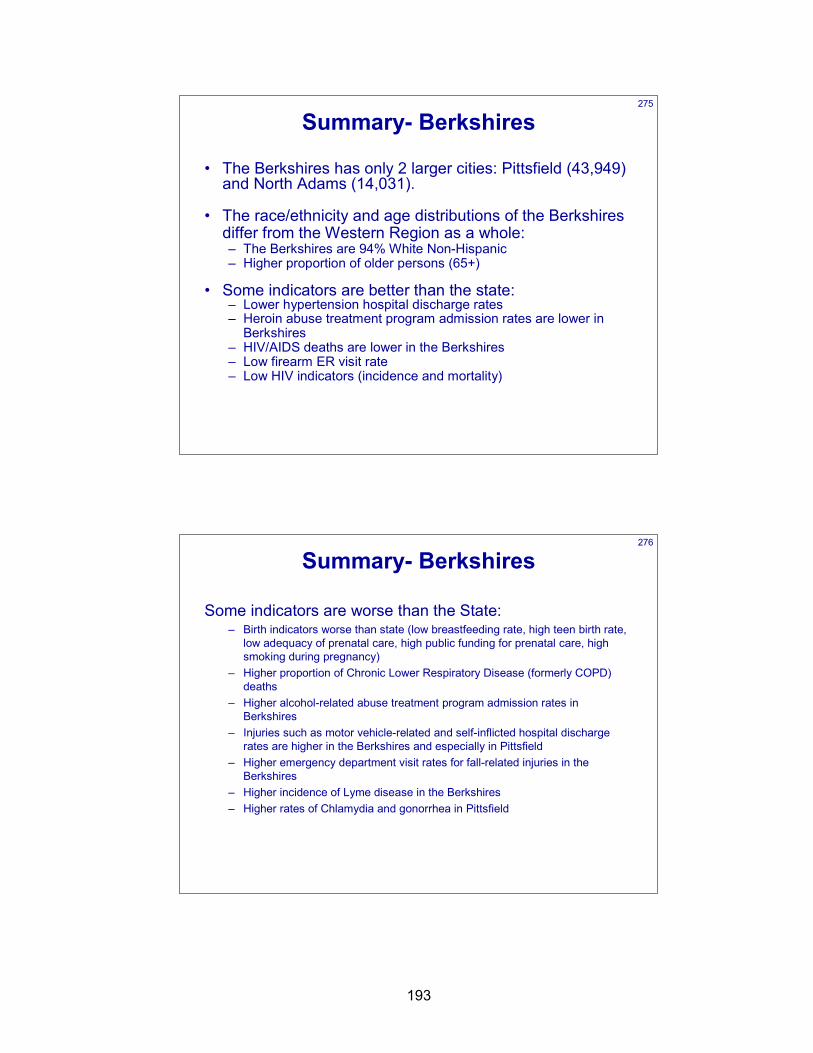
193
275
Summary- Berkshires
• The Berkshires has only 2 larger cities: Pittsfield (43,949) and North Adams (14,031).
• The race/ethnicity and age distributions of the Berkshires differ from the Western Region as a whole:– The Berkshires are 94% White Non-Hispanic – Higher proportion of older persons (65+)
• Some indicators are better than the state:– Lower hypertension hospital discharge rates– Heroin abuse treatment program admission rates are lower in
Berkshires– HIV/AIDS deaths are lower in the Berkshires– Low firearm ER visit rate– Low HIV indicators (incidence and mortality)
276
Summary- Berkshires
Some indicators are worse than the State:– Birth indicators worse than state (low breastfeeding rate, high teen birth rate,
low adequacy of prenatal care, high public funding for prenatal care, high smoking during pregnancy)
– Higher proportion of Chronic Lower Respiratory Disease (formerly COPD) deaths
– Higher alcohol-related abuse treatment program admission rates in Berkshires
– Injuries such as motor vehicle-related and self-inflicted hospital discharge rates are higher in the Berkshires and especially in Pittsfield
– Higher emergency department visit rates for fall-related injuries in the Berkshires
– Higher incidence of Lyme disease in the Berkshires– Higher rates of Chlamydia and gonorrhea in Pittsfield
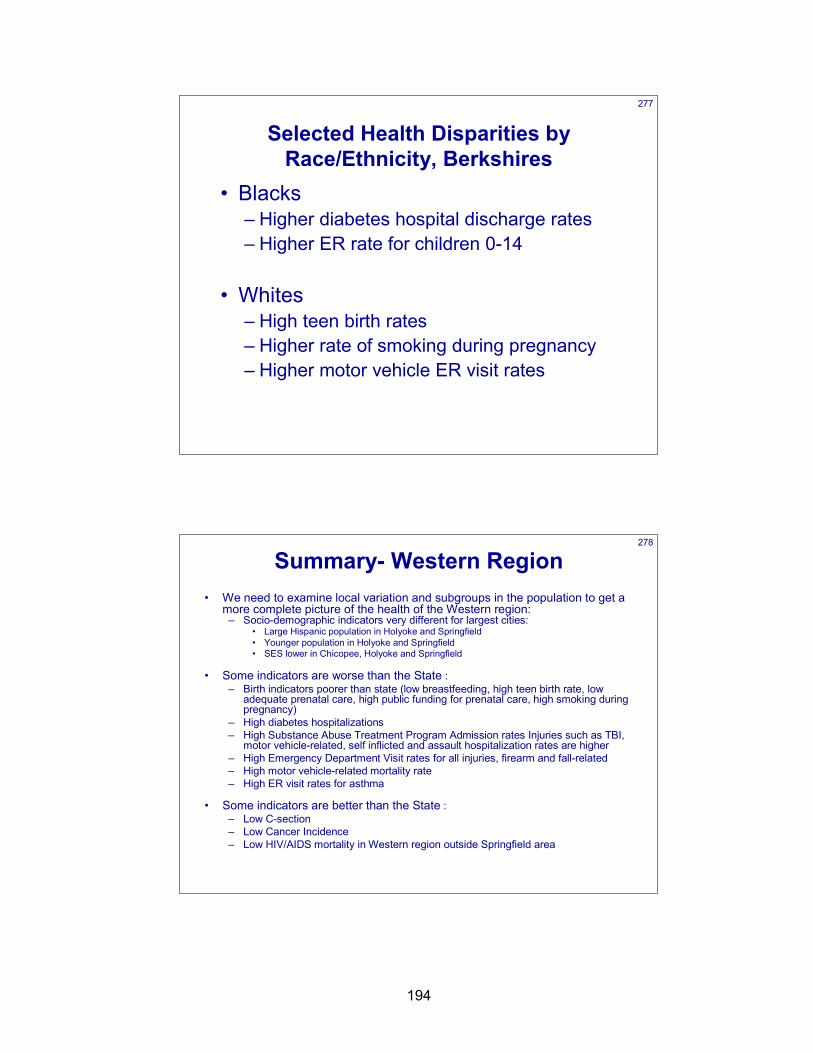
194
277
Selected Health Disparities by Race/Ethnicity, Berkshires
• Blacks– Higher diabetes hospital discharge rates– Higher ER rate for children 0-14
• Whites– High teen birth rates– Higher rate of smoking during pregnancy– Higher motor vehicle ER visit rates
278
Summary- Western Region• We need to examine local variation and subgroups in the population to get a
more complete picture of the health of the Western region:– Socio-demographic indicators very different for largest cities:
• Large Hispanic population in Holyoke and Springfield• Younger population in Holyoke and Springfield• SES lower in Chicopee, Holyoke and Springfield
• Some indicators are worse than the State :– Birth indicators poorer than state (low breastfeeding, high teen birth rate, low
adequate prenatal care, high public funding for prenatal care, high smoking during pregnancy)
– High diabetes hospitalizations– High Substance Abuse Treatment Program Admission rates Injuries such as TBI,
motor vehicle-related, self inflicted and assault hospitalization rates are higher – High Emergency Department Visit rates for all injuries, firearm and fall-related– High motor vehicle-related mortality rate– High ER visit rates for asthma
• Some indicators are better than the State :– Low C-section– Low Cancer Incidence– Low HIV/AIDS mortality in Western region outside Springfield area
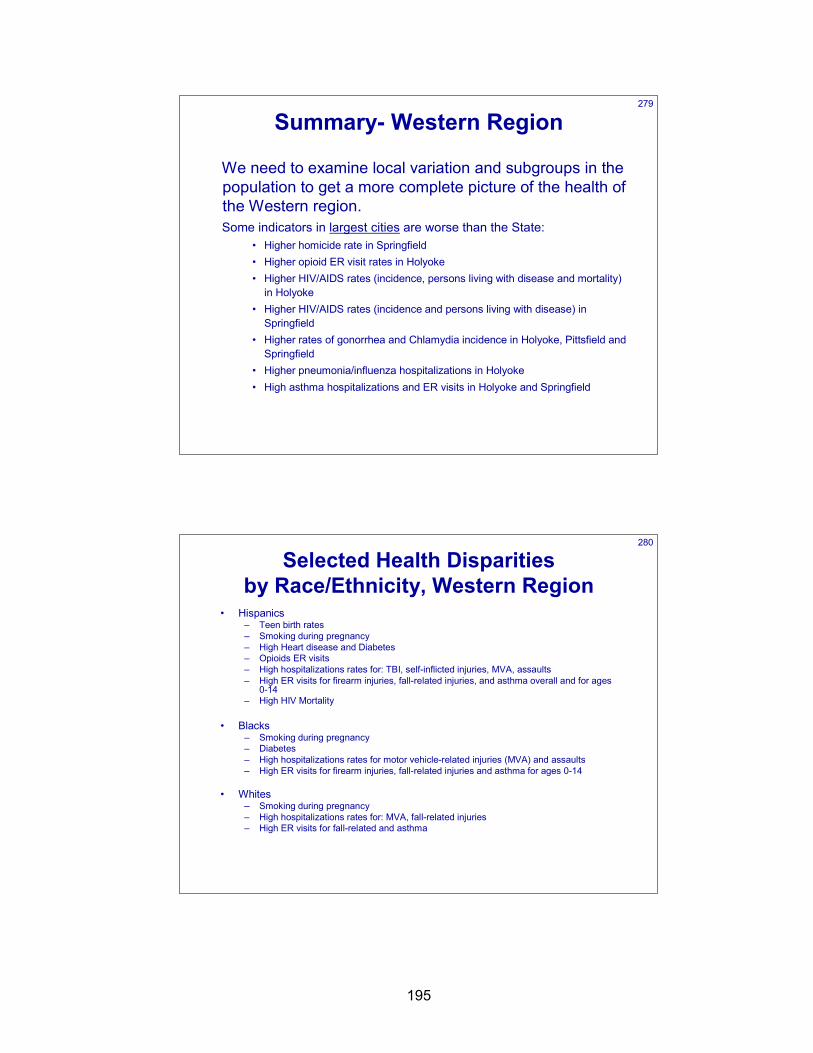
195
279
Summary- Western Region
We need to examine local variation and subgroups in the population to get a more complete picture of the health of the Western region. Some indicators in largest cities are worse than the State:
• Higher homicide rate in Springfield• Higher opioid ER visit rates in Holyoke• Higher HIV/AIDS rates (incidence, persons living with disease and mortality)
in Holyoke• Higher HIV/AIDS rates (incidence and persons living with disease) in
Springfield• Higher rates of gonorrhea and Chlamydia incidence in Holyoke, Pittsfield and
Springfield• Higher pneumonia/influenza hospitalizations in Holyoke• High asthma hospitalizations and ER visits in Holyoke and Springfield
280
Selected Health Disparities by Race/Ethnicity, Western Region
• Hispanics– Teen birth rates– Smoking during pregnancy– High Heart disease and Diabetes– Opioids ER visits– High hospitalizations rates for: TBI, self-inflicted injuries, MVA, assaults– High ER visits for firearm injuries, fall-related injuries, and asthma overall and for ages
0-14– High HIV Mortality
• Blacks– Smoking during pregnancy– Diabetes– High hospitalizations rates for motor vehicle-related injuries (MVA) and assaults– High ER visits for firearm injuries, fall-related injuries and asthma for ages 0-14
• Whites– Smoking during pregnancy– High hospitalizations rates for: MVA, fall-related injuries– High ER visits for fall-related and asthma

196

197
APPENDIX

198
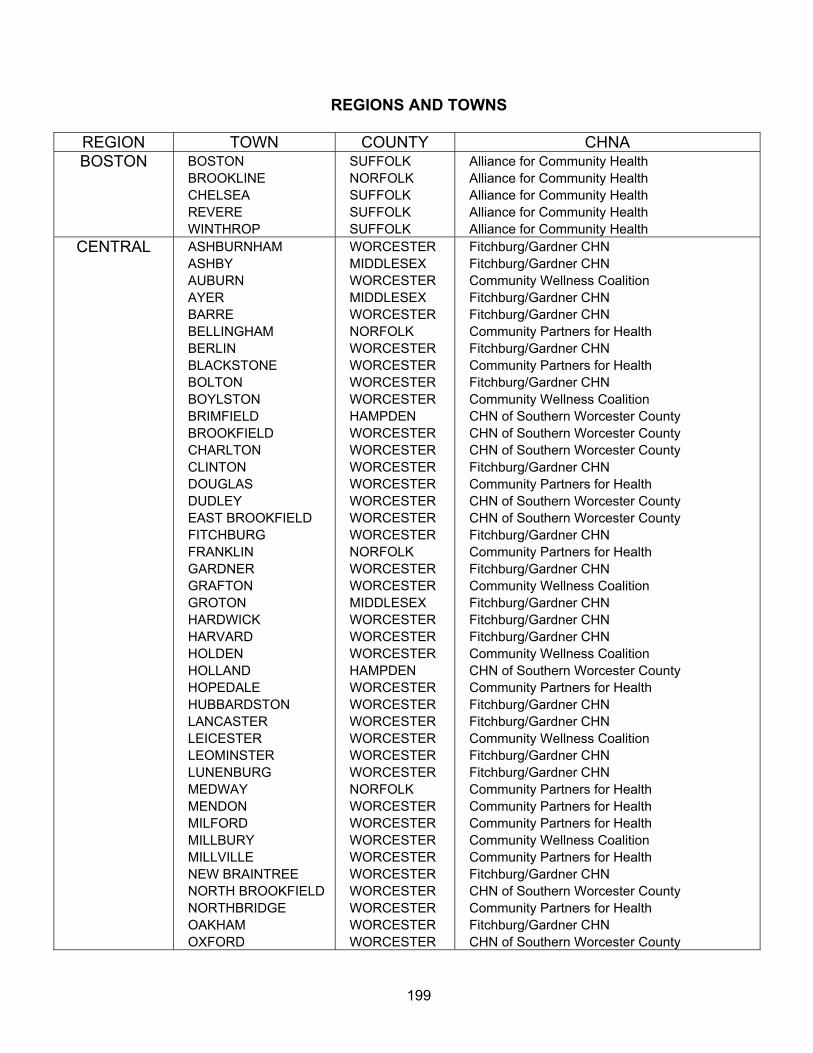
199
REGIONS AND TOWNS
REGION TOWN COUNTY CHNA BOSTON BOSTON
BROOKLINE CHELSEA REVERE WINTHROP
SUFFOLK NORFOLK SUFFOLK SUFFOLK SUFFOLK
Alliance for Community Health Alliance for Community Health Alliance for Community Health Alliance for Community Health Alliance for Community Health
CENTRAL ASHBURNHAM ASHBY AUBURN AYER BARRE BELLINGHAM BERLIN BLACKSTONE BOLTON BOYLSTON BRIMFIELD BROOKFIELD CHARLTON CLINTON DOUGLAS DUDLEY EAST BROOKFIELD FITCHBURG FRANKLIN GARDNER GRAFTON GROTON HARDWICK HARVARD HOLDEN HOLLAND HOPEDALE HUBBARDSTON LANCASTER LEICESTER LEOMINSTER LUNENBURG MEDWAY MENDON MILFORD MILLBURY MILLVILLE NEW BRAINTREE NORTH BROOKFIELD NORTHBRIDGE OAKHAM OXFORD
WORCESTER MIDDLESEX WORCESTER MIDDLESEX WORCESTER NORFOLK WORCESTER WORCESTER WORCESTER WORCESTER HAMPDEN WORCESTER WORCESTER WORCESTER WORCESTER WORCESTER WORCESTER WORCESTER NORFOLK WORCESTER WORCESTER MIDDLESEX WORCESTER WORCESTER WORCESTER HAMPDEN WORCESTER WORCESTER WORCESTER WORCESTER WORCESTER WORCESTER NORFOLK WORCESTER WORCESTER WORCESTER WORCESTER WORCESTER WORCESTER WORCESTER WORCESTER WORCESTER
Fitchburg/Gardner CHN Fitchburg/Gardner CHN Community Wellness Coalition Fitchburg/Gardner CHN Fitchburg/Gardner CHN Community Partners for Health Fitchburg/Gardner CHN Community Partners for Health Fitchburg/Gardner CHN Community Wellness Coalition CHN of Southern Worcester County CHN of Southern Worcester County CHN of Southern Worcester County Fitchburg/Gardner CHN Community Partners for Health CHN of Southern Worcester County CHN of Southern Worcester County Fitchburg/Gardner CHN Community Partners for Health Fitchburg/Gardner CHN Community Wellness Coalition Fitchburg/Gardner CHN Fitchburg/Gardner CHN Fitchburg/Gardner CHN Community Wellness Coalition CHN of Southern Worcester County Community Partners for Health Fitchburg/Gardner CHN Fitchburg/Gardner CHN Community Wellness Coalition Fitchburg/Gardner CHN Fitchburg/Gardner CHN Community Partners for Health Community Partners for Health Community Partners for Health Community Wellness Coalition Community Partners for Health Fitchburg/Gardner CHN CHN of Southern Worcester County Community Partners for Health Fitchburg/Gardner CHN CHN of Southern Worcester County
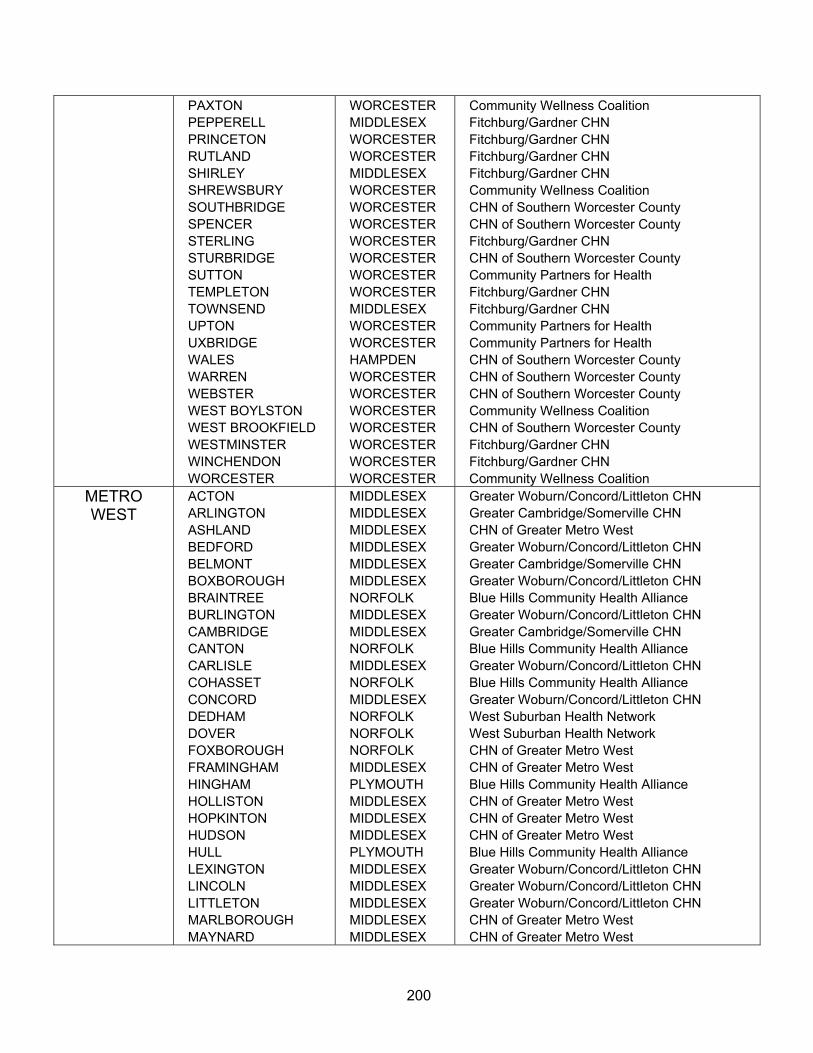
200
PAXTON PEPPERELL PRINCETON RUTLAND SHIRLEY SHREWSBURY SOUTHBRIDGE SPENCER STERLING STURBRIDGE SUTTON TEMPLETON TOWNSEND UPTON UXBRIDGE WALES WARREN WEBSTER WEST BOYLSTON WEST BROOKFIELD WESTMINSTER WINCHENDON WORCESTER
WORCESTER MIDDLESEX WORCESTER WORCESTER MIDDLESEX WORCESTER WORCESTER WORCESTER WORCESTER WORCESTER WORCESTER WORCESTER MIDDLESEX WORCESTER WORCESTER HAMPDEN WORCESTER WORCESTER WORCESTER WORCESTER WORCESTER WORCESTER WORCESTER
Community Wellness Coalition Fitchburg/Gardner CHN Fitchburg/Gardner CHN Fitchburg/Gardner CHN Fitchburg/Gardner CHN Community Wellness Coalition CHN of Southern Worcester County CHN of Southern Worcester County Fitchburg/Gardner CHN CHN of Southern Worcester County Community Partners for Health Fitchburg/Gardner CHN Fitchburg/Gardner CHN Community Partners for Health Community Partners for Health CHN of Southern Worcester County CHN of Southern Worcester County CHN of Southern Worcester County Community Wellness Coalition CHN of Southern Worcester County Fitchburg/Gardner CHN Fitchburg/Gardner CHN Community Wellness Coalition
METRO WEST
ACTON ARLINGTON ASHLAND BEDFORD BELMONT BOXBOROUGH BRAINTREE BURLINGTON CAMBRIDGE CANTON CARLISLE COHASSET CONCORD DEDHAM DOVER FOXBOROUGH FRAMINGHAM HINGHAM HOLLISTON HOPKINTON HUDSON HULL LEXINGTON LINCOLN LITTLETON MARLBOROUGH MAYNARD
MIDDLESEX MIDDLESEX MIDDLESEX MIDDLESEX MIDDLESEX MIDDLESEX NORFOLK MIDDLESEX MIDDLESEX NORFOLK MIDDLESEX NORFOLK MIDDLESEX NORFOLK NORFOLK NORFOLK MIDDLESEX PLYMOUTH MIDDLESEX MIDDLESEX MIDDLESEX PLYMOUTH MIDDLESEX MIDDLESEX MIDDLESEX MIDDLESEX MIDDLESEX
Greater Woburn/Concord/Littleton CHN Greater Cambridge/Somerville CHN CHN of Greater Metro West Greater Woburn/Concord/Littleton CHN Greater Cambridge/Somerville CHN Greater Woburn/Concord/Littleton CHN Blue Hills Community Health Alliance Greater Woburn/Concord/Littleton CHN Greater Cambridge/Somerville CHN Blue Hills Community Health Alliance Greater Woburn/Concord/Littleton CHN Blue Hills Community Health Alliance Greater Woburn/Concord/Littleton CHN West Suburban Health Network West Suburban Health Network CHN of Greater Metro West CHN of Greater Metro West Blue Hills Community Health Alliance CHN of Greater Metro West CHN of Greater Metro West CHN of Greater Metro West Blue Hills Community Health Alliance Greater Woburn/Concord/Littleton CHN Greater Woburn/Concord/Littleton CHN Greater Woburn/Concord/Littleton CHN CHN of Greater Metro West CHN of Greater Metro West
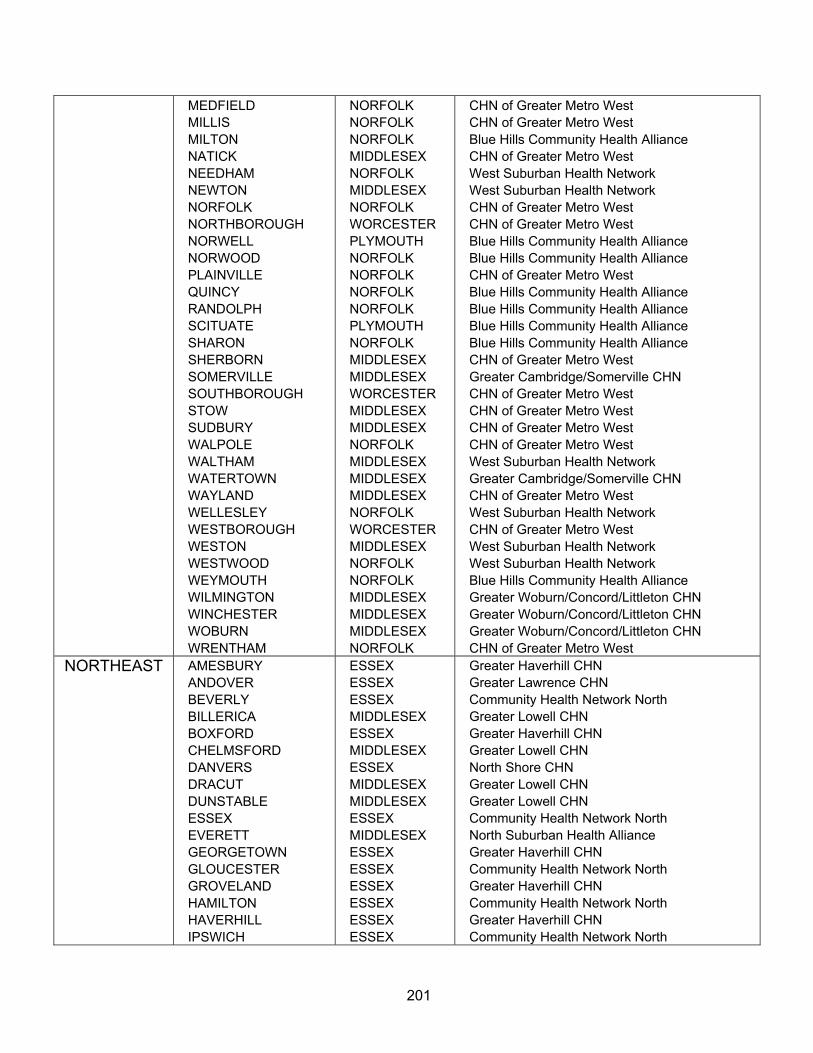
201
MEDFIELD MILLIS MILTON NATICK NEEDHAM NEWTON NORFOLK NORTHBOROUGH NORWELL NORWOOD PLAINVILLE QUINCY RANDOLPH SCITUATE SHARON SHERBORN SOMERVILLE SOUTHBOROUGH STOW SUDBURY WALPOLE WALTHAM WATERTOWN WAYLAND WELLESLEY WESTBOROUGH WESTON WESTWOOD WEYMOUTH WILMINGTON WINCHESTER WOBURN WRENTHAM
NORFOLK NORFOLK NORFOLK MIDDLESEX NORFOLK MIDDLESEX NORFOLK WORCESTER PLYMOUTH NORFOLK NORFOLK NORFOLK NORFOLK PLYMOUTH NORFOLK MIDDLESEX MIDDLESEX WORCESTER MIDDLESEX MIDDLESEX NORFOLK MIDDLESEX MIDDLESEX MIDDLESEX NORFOLK WORCESTER MIDDLESEX NORFOLK NORFOLK MIDDLESEX MIDDLESEX MIDDLESEX NORFOLK
CHN of Greater Metro West CHN of Greater Metro West Blue Hills Community Health Alliance CHN of Greater Metro West West Suburban Health Network West Suburban Health Network CHN of Greater Metro West CHN of Greater Metro West Blue Hills Community Health Alliance Blue Hills Community Health Alliance CHN of Greater Metro West Blue Hills Community Health Alliance Blue Hills Community Health Alliance Blue Hills Community Health Alliance Blue Hills Community Health Alliance CHN of Greater Metro West Greater Cambridge/Somerville CHN CHN of Greater Metro West CHN of Greater Metro West CHN of Greater Metro West CHN of Greater Metro West West Suburban Health Network Greater Cambridge/Somerville CHN CHN of Greater Metro West West Suburban Health Network CHN of Greater Metro West West Suburban Health Network West Suburban Health Network Blue Hills Community Health Alliance Greater Woburn/Concord/Littleton CHN Greater Woburn/Concord/Littleton CHN Greater Woburn/Concord/Littleton CHN CHN of Greater Metro West
NORTHEAST AMESBURY ANDOVER BEVERLY BILLERICA BOXFORD CHELMSFORD DANVERS DRACUT DUNSTABLE ESSEX EVERETT GEORGETOWN GLOUCESTER GROVELAND HAMILTON HAVERHILL IPSWICH
ESSEX ESSEX ESSEX MIDDLESEX ESSEX MIDDLESEX ESSEX MIDDLESEX MIDDLESEX ESSEX MIDDLESEX ESSEX ESSEX ESSEX ESSEX ESSEX ESSEX
Greater Haverhill CHN Greater Lawrence CHN Community Health Network North Greater Lowell CHN Greater Haverhill CHN Greater Lowell CHN North Shore CHN Greater Lowell CHN Greater Lowell CHN Community Health Network North North Suburban Health Alliance Greater Haverhill CHN Community Health Network North Greater Haverhill CHN Community Health Network North Greater Haverhill CHN Community Health Network North
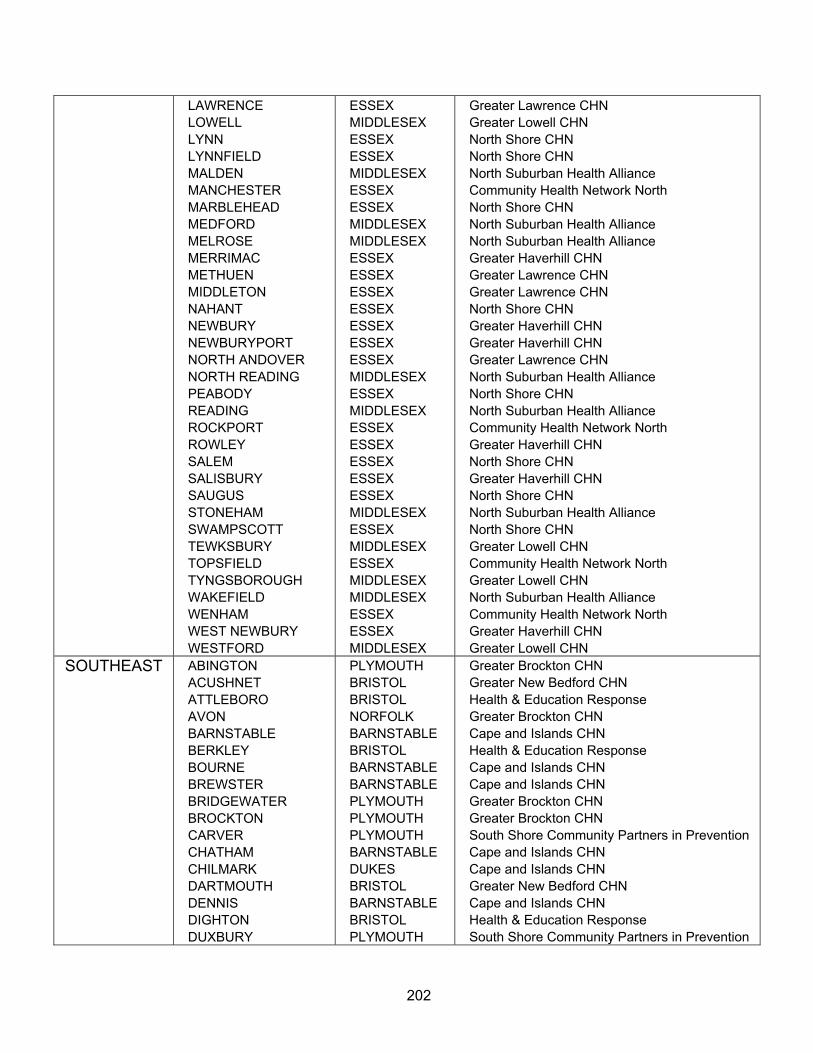
202
LAWRENCE LOWELL LYNN LYNNFIELD MALDEN MANCHESTER MARBLEHEAD MEDFORD MELROSE MERRIMAC METHUEN MIDDLETON NAHANT NEWBURY NEWBURYPORT NORTH ANDOVER NORTH READING PEABODY READING ROCKPORT ROWLEY SALEM SALISBURY SAUGUS STONEHAM SWAMPSCOTT TEWKSBURY TOPSFIELD TYNGSBOROUGH WAKEFIELD WENHAM WEST NEWBURY WESTFORD
ESSEX MIDDLESEX ESSEX ESSEX MIDDLESEX ESSEX ESSEX MIDDLESEX MIDDLESEX ESSEX ESSEX ESSEX ESSEX ESSEX ESSEX ESSEX MIDDLESEX ESSEX MIDDLESEX ESSEX ESSEX ESSEX ESSEX ESSEX MIDDLESEX ESSEX MIDDLESEX ESSEX MIDDLESEX MIDDLESEX ESSEX ESSEX MIDDLESEX
Greater Lawrence CHN Greater Lowell CHN North Shore CHN North Shore CHN North Suburban Health Alliance Community Health Network North North Shore CHN North Suburban Health Alliance North Suburban Health Alliance Greater Haverhill CHN Greater Lawrence CHN Greater Lawrence CHN North Shore CHN Greater Haverhill CHN Greater Haverhill CHN Greater Lawrence CHN North Suburban Health Alliance North Shore CHN North Suburban Health Alliance Community Health Network North Greater Haverhill CHN North Shore CHN Greater Haverhill CHN North Shore CHN North Suburban Health Alliance North Shore CHN Greater Lowell CHN Community Health Network North Greater Lowell CHN North Suburban Health Alliance Community Health Network North Greater Haverhill CHN Greater Lowell CHN
SOUTHEAST ABINGTON ACUSHNET ATTLEBORO AVON BARNSTABLE BERKLEY BOURNE BREWSTER BRIDGEWATER BROCKTON CARVER CHATHAM CHILMARK DARTMOUTH DENNIS DIGHTON DUXBURY
PLYMOUTH BRISTOL BRISTOL NORFOLK BARNSTABLE BRISTOL BARNSTABLE BARNSTABLE PLYMOUTH PLYMOUTH PLYMOUTH BARNSTABLE DUKES BRISTOL BARNSTABLE BRISTOL PLYMOUTH
Greater Brockton CHN Greater New Bedford CHN Health & Education Response Greater Brockton CHN Cape and Islands CHN Health & Education Response Cape and Islands CHN Cape and Islands CHN Greater Brockton CHN Greater Brockton CHN South Shore Community Partners in Prevention Cape and Islands CHN Cape and Islands CHN Greater New Bedford CHN Cape and Islands CHN Health & Education Response South Shore Community Partners in Prevention
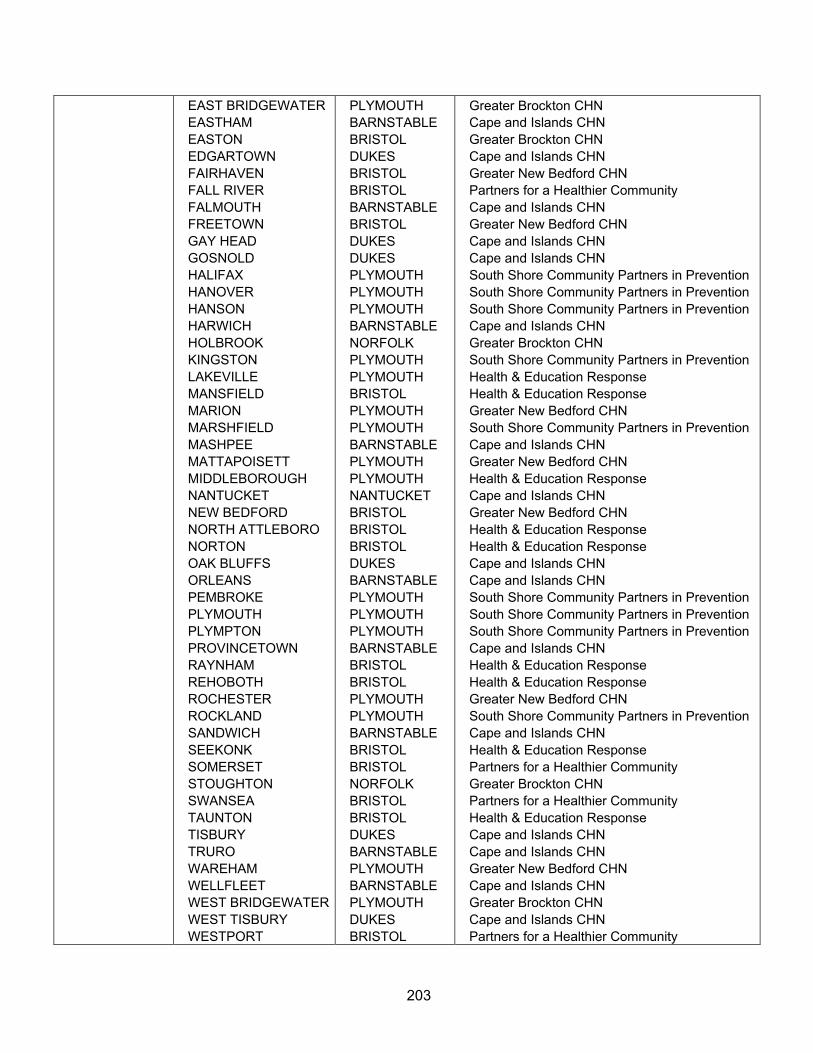
203
EAST BRIDGEWATER EASTHAM EASTON EDGARTOWN FAIRHAVEN FALL RIVER FALMOUTH FREETOWN GAY HEAD GOSNOLD HALIFAX HANOVER HANSON HARWICH HOLBROOK KINGSTON LAKEVILLE MANSFIELD MARION MARSHFIELD MASHPEE MATTAPOISETT MIDDLEBOROUGH NANTUCKET NEW BEDFORD NORTH ATTLEBORO NORTON OAK BLUFFS ORLEANS PEMBROKE PLYMOUTH PLYMPTON PROVINCETOWN RAYNHAM REHOBOTH ROCHESTER ROCKLAND SANDWICH SEEKONK SOMERSET STOUGHTON SWANSEA TAUNTON TISBURY TRURO WAREHAM WELLFLEET WEST BRIDGEWATER WEST TISBURY WESTPORT
PLYMOUTH BARNSTABLE BRISTOL DUKES BRISTOL BRISTOL BARNSTABLE BRISTOL DUKES DUKES PLYMOUTH PLYMOUTH PLYMOUTH BARNSTABLE NORFOLK PLYMOUTH PLYMOUTH BRISTOL PLYMOUTH PLYMOUTH BARNSTABLE PLYMOUTH PLYMOUTH NANTUCKET BRISTOL BRISTOL BRISTOL DUKES BARNSTABLE PLYMOUTH PLYMOUTH PLYMOUTH BARNSTABLE BRISTOL BRISTOL PLYMOUTH PLYMOUTH BARNSTABLE BRISTOL BRISTOL NORFOLK BRISTOL BRISTOL DUKES BARNSTABLE PLYMOUTH BARNSTABLE PLYMOUTH DUKES BRISTOL
Greater Brockton CHN Cape and Islands CHN Greater Brockton CHN Cape and Islands CHN Greater New Bedford CHN Partners for a Healthier Community Cape and Islands CHN Greater New Bedford CHN Cape and Islands CHN Cape and Islands CHN South Shore Community Partners in Prevention South Shore Community Partners in Prevention South Shore Community Partners in Prevention Cape and Islands CHN Greater Brockton CHN South Shore Community Partners in Prevention Health & Education Response Health & Education Response Greater New Bedford CHN South Shore Community Partners in Prevention Cape and Islands CHN Greater New Bedford CHN Health & Education Response Cape and Islands CHN Greater New Bedford CHN Health & Education Response Health & Education Response Cape and Islands CHN Cape and Islands CHN South Shore Community Partners in Prevention South Shore Community Partners in Prevention South Shore Community Partners in Prevention Cape and Islands CHN Health & Education Response Health & Education Response Greater New Bedford CHN South Shore Community Partners in Prevention Cape and Islands CHN Health & Education Response Partners for a Healthier Community Greater Brockton CHN Partners for a Healthier Community Health & Education Response Cape and Islands CHN Cape and Islands CHN Greater New Bedford CHN Cape and Islands CHN Greater Brockton CHN Cape and Islands CHN Partners for a Healthier Community
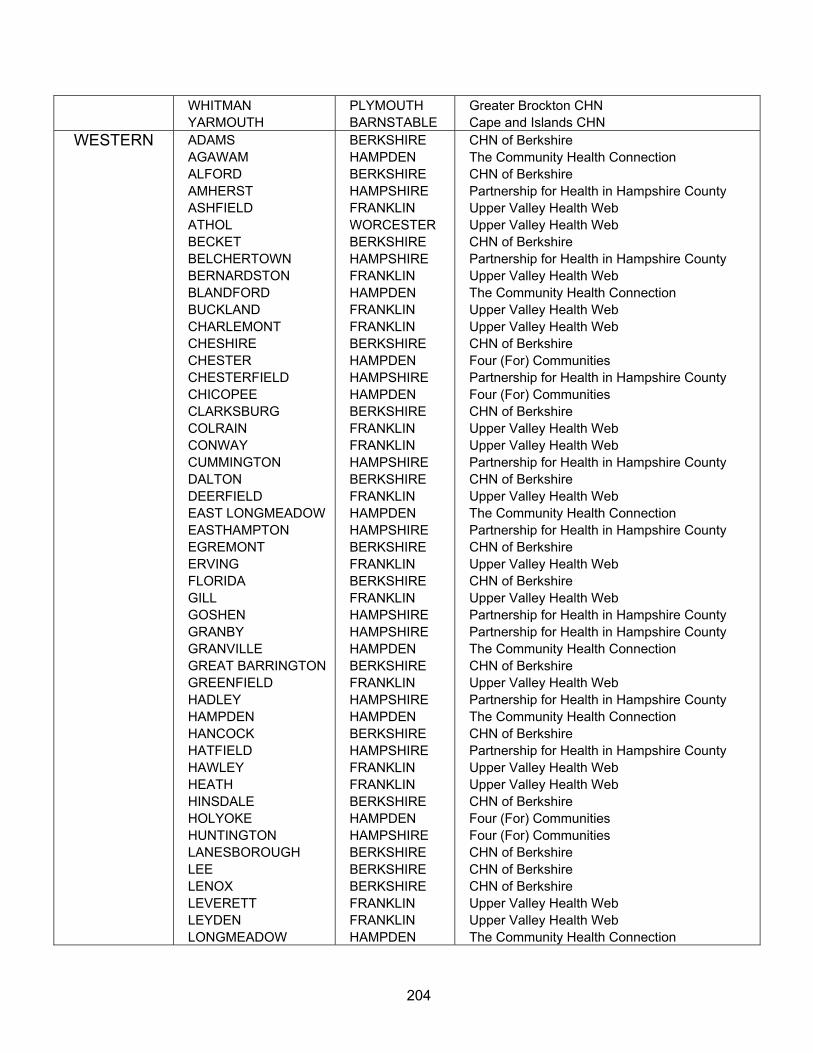
204
WHITMAN YARMOUTH
PLYMOUTH BARNSTABLE
Greater Brockton CHN Cape and Islands CHN
WESTERN ADAMS AGAWAM ALFORD AMHERST ASHFIELD ATHOL BECKET BELCHERTOWN BERNARDSTON BLANDFORD BUCKLAND CHARLEMONT CHESHIRE CHESTER CHESTERFIELD CHICOPEE CLARKSBURG COLRAIN CONWAY CUMMINGTON DALTON DEERFIELD EAST LONGMEADOW EASTHAMPTON EGREMONT ERVING FLORIDA GILL GOSHEN GRANBY GRANVILLE GREAT BARRINGTON GREENFIELD HADLEY HAMPDEN HANCOCK HATFIELD HAWLEY HEATH HINSDALE HOLYOKE HUNTINGTON LANESBOROUGH LEE LENOX LEVERETT LEYDEN LONGMEADOW
BERKSHIRE HAMPDEN BERKSHIRE HAMPSHIRE FRANKLIN WORCESTER BERKSHIRE HAMPSHIRE FRANKLIN HAMPDEN FRANKLIN FRANKLIN BERKSHIRE HAMPDEN HAMPSHIRE HAMPDEN BERKSHIRE FRANKLIN FRANKLIN HAMPSHIRE BERKSHIRE FRANKLIN HAMPDEN HAMPSHIRE BERKSHIRE FRANKLIN BERKSHIRE FRANKLIN HAMPSHIRE HAMPSHIRE HAMPDEN BERKSHIRE FRANKLIN HAMPSHIRE HAMPDEN BERKSHIRE HAMPSHIRE FRANKLIN FRANKLIN BERKSHIRE HAMPDEN HAMPSHIRE BERKSHIRE BERKSHIRE BERKSHIRE FRANKLIN FRANKLIN HAMPDEN
CHN of Berkshire The Community Health Connection CHN of Berkshire Partnership for Health in Hampshire County Upper Valley Health Web Upper Valley Health Web CHN of Berkshire Partnership for Health in Hampshire County Upper Valley Health Web The Community Health Connection Upper Valley Health Web Upper Valley Health Web CHN of Berkshire Four (For) Communities Partnership for Health in Hampshire County Four (For) Communities CHN of Berkshire Upper Valley Health Web Upper Valley Health Web Partnership for Health in Hampshire County CHN of Berkshire Upper Valley Health Web The Community Health Connection Partnership for Health in Hampshire County CHN of Berkshire Upper Valley Health Web CHN of Berkshire Upper Valley Health Web Partnership for Health in Hampshire County Partnership for Health in Hampshire County The Community Health Connection CHN of Berkshire Upper Valley Health Web Partnership for Health in Hampshire County The Community Health Connection CHN of Berkshire Partnership for Health in Hampshire County Upper Valley Health Web Upper Valley Health Web CHN of Berkshire Four (For) Communities Four (For) Communities CHN of Berkshire CHN of Berkshire CHN of Berkshire Upper Valley Health Web Upper Valley Health Web The Community Health Connection
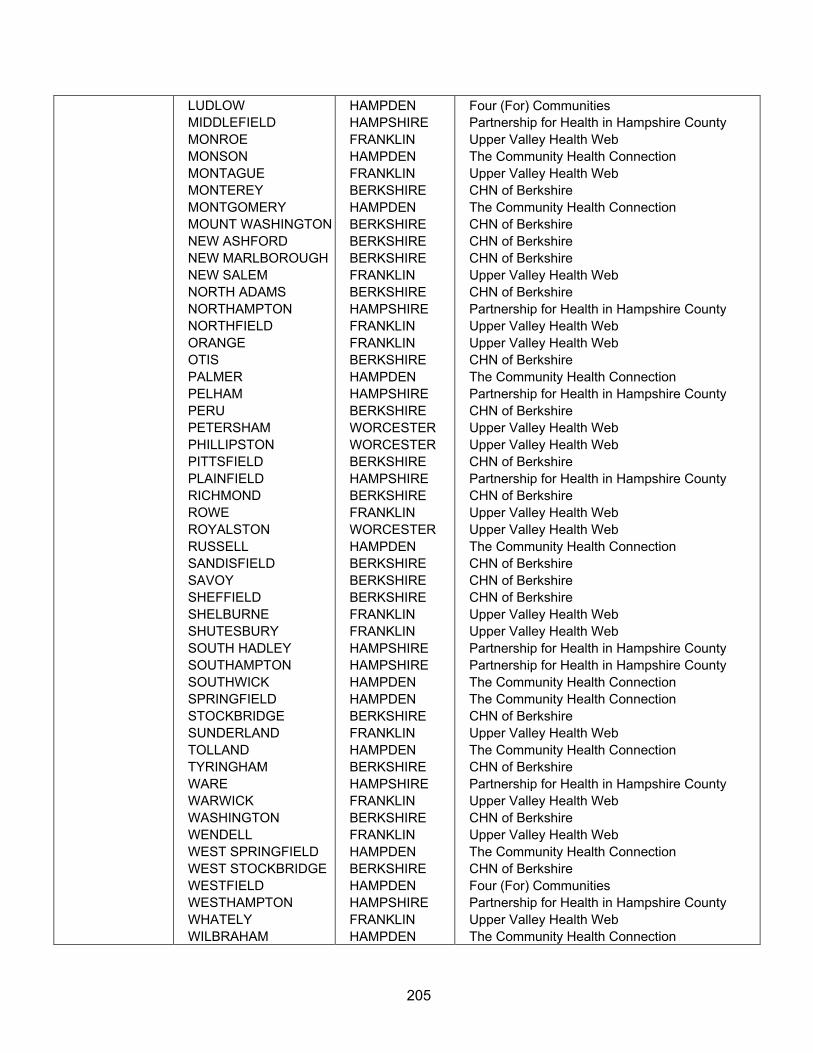
205
LUDLOW MIDDLEFIELD MONROE MONSON MONTAGUE MONTEREY MONTGOMERY MOUNT WASHINGTON NEW ASHFORD NEW MARLBOROUGH NEW SALEM NORTH ADAMS NORTHAMPTON NORTHFIELD ORANGE OTIS PALMER PELHAM PERU PETERSHAM PHILLIPSTON PITTSFIELD PLAINFIELD RICHMOND ROWE ROYALSTON RUSSELL SANDISFIELD SAVOY SHEFFIELD SHELBURNE SHUTESBURY SOUTH HADLEY SOUTHAMPTON SOUTHWICK SPRINGFIELD STOCKBRIDGE SUNDERLAND TOLLAND TYRINGHAM WARE WARWICK WASHINGTON WENDELL WEST SPRINGFIELD WEST STOCKBRIDGE WESTFIELD WESTHAMPTON WHATELY WILBRAHAM
HAMPDEN HAMPSHIRE FRANKLIN HAMPDEN FRANKLIN BERKSHIRE HAMPDEN BERKSHIRE BERKSHIRE BERKSHIRE FRANKLIN BERKSHIRE HAMPSHIRE FRANKLIN FRANKLIN BERKSHIRE HAMPDEN HAMPSHIRE BERKSHIRE WORCESTER WORCESTER BERKSHIRE HAMPSHIRE BERKSHIRE FRANKLIN WORCESTER HAMPDEN BERKSHIRE BERKSHIRE BERKSHIRE FRANKLIN FRANKLIN HAMPSHIRE HAMPSHIRE HAMPDEN HAMPDEN BERKSHIRE FRANKLIN HAMPDEN BERKSHIRE HAMPSHIRE FRANKLIN BERKSHIRE FRANKLIN HAMPDEN BERKSHIRE HAMPDEN HAMPSHIRE FRANKLIN HAMPDEN
Four (For) Communities Partnership for Health in Hampshire County Upper Valley Health Web The Community Health Connection Upper Valley Health Web CHN of Berkshire The Community Health Connection CHN of Berkshire CHN of Berkshire CHN of Berkshire Upper Valley Health Web CHN of Berkshire Partnership for Health in Hampshire County Upper Valley Health Web Upper Valley Health Web CHN of Berkshire The Community Health Connection Partnership for Health in Hampshire County CHN of Berkshire Upper Valley Health Web Upper Valley Health Web CHN of Berkshire Partnership for Health in Hampshire County CHN of Berkshire Upper Valley Health Web Upper Valley Health Web The Community Health Connection CHN of Berkshire CHN of Berkshire CHN of Berkshire Upper Valley Health Web Upper Valley Health Web Partnership for Health in Hampshire County Partnership for Health in Hampshire County The Community Health Connection The Community Health Connection CHN of Berkshire Upper Valley Health Web The Community Health Connection CHN of Berkshire Partnership for Health in Hampshire County Upper Valley Health Web CHN of Berkshire Upper Valley Health Web The Community Health Connection CHN of Berkshire Four (For) Communities Partnership for Health in Hampshire County Upper Valley Health Web The Community Health Connection
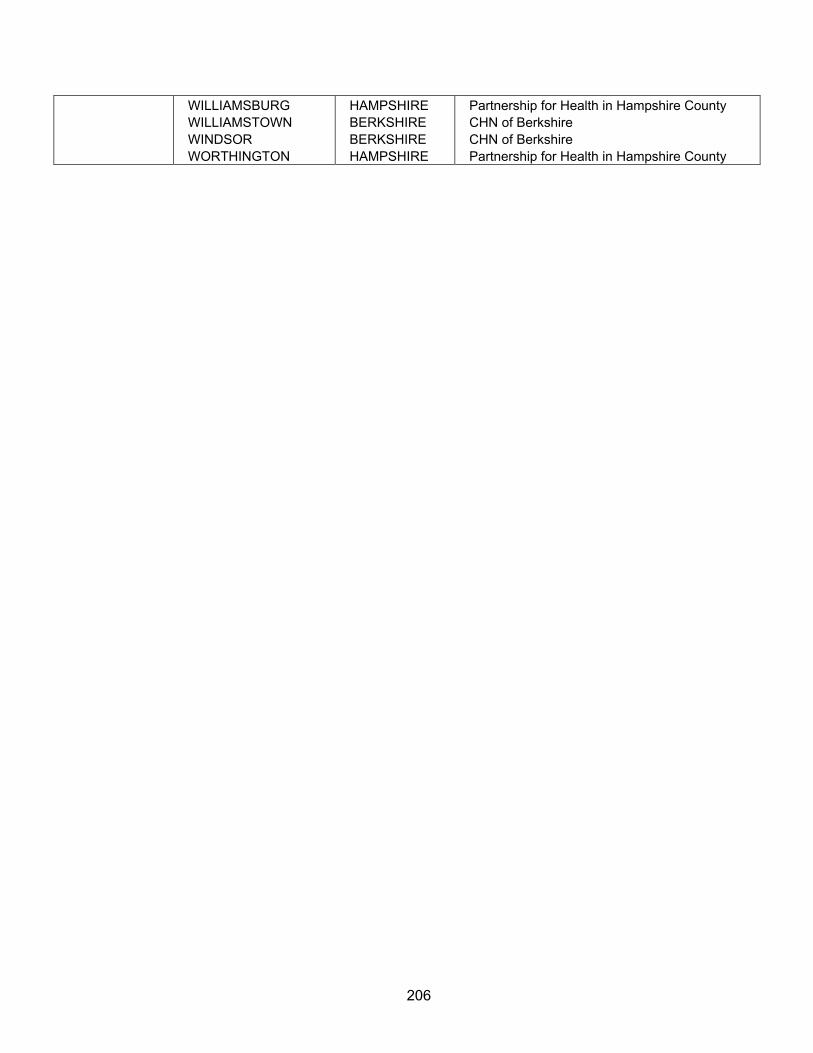
206
WILLIAMSBURG WILLIAMSTOWN WINDSOR WORTHINGTON
HAMPSHIRE BERKSHIRE BERKSHIRE HAMPSHIRE
Partnership for Health in Hampshire County CHN of Berkshire CHN of Berkshire Partnership for Health in Hampshire County
207
DATA SOURCES
Massachusetts Division of Health Care Finance and Policy MDPH, Bureau of Communicable Disease Control MDPH, Bureau of Substance Abuse Services MDPH, Environmental Health Bureau MDPH, Health Information, Statistics, Research & Evaluation Bureau SAMHSA, Office of Applied Studies