Embed Size (px)
Citation preview

Report No. 76114-MEN
Regional Gas Trade Projects
in Arab Countries
Volume 1 Main Report
Volume 2 Annex
February 2013
Sustainable Development Department (MNSSD)
Middle East and North Africa Region (MNA)
________________

The findings, interpretations, and conclusions expressed in this report are entirely those of the authors and
should not be attributed in any manner to the Public-Private Infrastructure Advisory Facility (PPIAF) or
to the World Bank, its affiliated organizations, or members of its Board of Executive Directors or the
countries they represent. Neither PPIAF nor the World Bank guarantees the accuracy of the data included
in this publication or accepts responsibility for any consequence of their use. The boundaries, colors,
denominations, and other information shown on any map in this report do not imply on the part of PPIAF
or the World Bank Group any judgment on the legal status of any territory or the endorsement or
acceptance of such boundaries.

iii
Contents
Volume 1: Main Report
Acknowledgments v
Acronyms and Abbreviations vi
Conversion Factors vii
Executive Summary viii
Gas Demand and Supply in Arab Countries ix
Assessment of Gas Deficits and Surpluses in Arab Countries xii
The Choice between Cross-Border Pipeline Transport and LNG Imports xiii
Identification of Gas Trade Projects xiv
Economic Analysis of the Identified Projects xviii
Constraints and Outlook for the Proposed Projects xix
Financing Gas Trade Projects xx
Financing the LNG Import Terminal Projects in Jordan and Lebanon xxii
Key Risks in Gas Trade Projects and Mitigation Measures xxiv
Chapter 1. The Global Gas Market : Status and Outlook 1
Recent Developments and Current Situation 1
Outlook for the Gas Business 3
Chapter 2. The Role of Arab Countries in World Gas Markets 7
Chapter 3. Gas Supply Potentials and Constraints in the Arab Countries 13
Countries with High Potential to Increase Supply 13
Countries with Some Potential to Increase Supply 18
Countries with Little or No Potential to Increase Supply 21
Chapter 4. Projection of Demand for Natural Gas in Arab Countries 25
Demand Growth to Date 25
Sectoral Composition of Gas Demand 26
The Role of the Power Sector 26
Gas Demand for Enhanced Oil Recovery 31
Future Demand Growth for Gas, by Country 32
Chapter 5. Existing and Potential Gas Trade Projects in Arab Countries 37
Existing Import Facilities 46
Characteristics of Existing Regional Gas Trade 48
Regional LNG Trade Options 55
Chapter 6. Economic Analysis of Identified Gas Trade Projects 57

iv
Pipeline Gas Trade vs. Electricity Trade 59
Emergence of a Pan-Arab Gas Pipeline System 60
Possible Shelf of Projects for Increased Regional Gas Trade 60
Economic Analysis of Possible Projects 64
Results of the Economic Analysis 65
Demonstration of the Superiority of the Combined Pipeline Project 67
Ensuring the Financial Viability of Gas Import Projects 68
Outlook for the Proposed Projects 69
Chapter 7. Financing and Implementation Arrangements 71
Financing Gas Trade Projects 71
The Roles of Government and the Private Sector 72
Key Risks in Gas Trade Projects, and Mitigation Measures 73
Public-Private Partnership Structure for Gas Trade Projects 75
Chapter 8. Legal, Regulatory, and Contractual Issues 83
Legal and Regulatory Framework 83
Government Strategies for Gas Imports 84
Gas Pricing Framework for Regional Trade 85
Gas Price by Contract 86
Terms of Gas Trade Contracts 87
References 90
Volume 2: Annex
Gas Profiles of Arab Countries

v
Acknowledgments
This study is being published by the Public-Private Infrastructure Advisory Facility (PPIAF) and the
World Bank. PPIAF is a multidonor technical assistance facility aimed at helping developing countries
improve the quality of their infrastructure through private sector involvement. For more information on
the facility see www.ppiaf.org.
The study was prepared by a team consisting of Hussam Beides (task manager), Hossien Razavi, and
Venkataraman Krishnaswamy (consultants). Hayat Taleb Al-Harazi carried out the initial statistical
analysis, and Azeb Yideru provided administrative assistance. The report was edited by Steven B.
Kennedy, and most maps were provided by Jeffrey N. Lecksell of the World Bank Map Unit.
The preparation of the study was supported by Jonathon Walters (director of Regional Programs and
Partnerships), who chaired the review process; four peer reviewers from within the World Bank (Robert
Lesnick, Alan Townsend, Franz Gerner and Andrew Jones); and two external peer reviewers (Chakib
Khelil, formerly Algeria’s minister for energy and mines, and Taisir Anbar, vice president of Shell Oil
Corporation.
vi
Acronyms and Abbreviations
AGP Arab Gas Pipeline
bcf billion cubic feet
bcm billion cubic meters
BP British Petroleum
btu British thermal unit
CAGR compound annual growth rate
EIA Energy Information Agency (United States)
EOR enhanced oil recovery
E&P exploration and production
FSRU floating storage and re-gasification unit
FSU Former Soviet Union
GCC Gulf Cooperation Council
GWh gigawatt hour
HFO Heavy fuel oil
IEA International Energy Agency
IFI international financial institutions
IPP independent power producer
IRR internal rate of return
ISCID International Settlement Center for Investment Disputes
km kilometer
kWh kilowatt hour
LDO light diesel oil
LNG liquefied natural gas
LRMC long-run marginal cost
MENA Middle East and North Africa
MIGA Multilateral Investment Guarantee Agency
mmbtu million btu
mmcfd million cubic feet per day
MW megawatt
NBP national balancing point
OECD Organisation for Economic Co-operation and Development
O&M operation and maintenance
OPEC Organization of Petroleum Exporting Countries
OAPEC Organization of Arab Petroleum Exporting Countries
PAGPS Pan-Arab Gas Pipeline System
PV present value
RPR reserves-to-production ratio
tcf trillion cubic feet
tcm trillion cubic meters
toe tons of oil equivalent
TWh terawatt hour
UAE United Arab Emirates

vii
Conversion Factors
One bcm of natural gas = 35.3 bcf of natural gas
One bcm of natural gas = 36 trillion btu
One bcm of natural gas = 0.90 million toe
One bcm of natural gas = 0.73 million tons of LNG
One bcm of natural gas = 6.29 million barrels of oil equivalent
One million tons of LNG = 1.38 bcm of natural gas
One million tons of LNG = 1.23 million toe
One million tons of LNG = 52 trillion btu
One million tons of LNG = 8.68 million barrels of oil equivalent
One nautical mile = 1.150779 miles or 1.852 km
“Tons” are metric tons (1,000 kg; 2,204.6 pounds).
$ = U.S. dollars.

Executive Summary
Context and Objective of the Study
Arab countries hold about 29 percent of the world’s proven gas reserves, but every country (except Qatar
and Algeria) is short of the gas supply needed to meet its current and projected demand. The rapid growth
in gas demand is mostly a consequence of a sharp increase in electricity consumption. Although part of
the growing electricity demand may be curbed through more effective energy conservation policies and
technologies, there is a clear need to expand electricity generating capacity in all countries of the region.
Indeed, most countries have been facing power shortages in recent years. Among the most significant
bottlenecks in developing new power-generating capacity, however, is the supply of the required fuel.
Traditionally, the region has depended on oil for power generation. That dependence was substantially
reduced as gas became a desirable substitute because of its economic and environmental attributes.
Between 1990 and 2010, the share of gas in power generation doubled from 25 percent to about 50
percent. Yet in recent years the availability of gas has become a serious issue, as countries including the
Syrian Arab Republic, Jordan, Tunisia, Morocco, Saudi Arabia, Kuwait, the United Arab Emirates
(UAE), and Egypt have come to realize that their domestic gas production is not sufficient to meet the
needs of their power sectors. This has triggered a search for alternative energy (particularly renewable
energy), as well as sources of imported gas and electricity.
Gas trade in the Arab world has been dominated by the objective of exporting gas in the form of liquefied
natural gas (LNG) to points in Asia, Europe, and North America. Algeria was, until recently, the largest
gas exporter and remains the only country that exports significant amounts of gas in the form of both
LNG and piped gas. Qatar is now the largest exporter of gas, most of it in the form of LNG. The Arab
Republic of Egypt has successfully completed implementation of two LNG plants. Oman, the UAE, and
the Republic of Yemen also have LNG export projects, though they are now in need of gas for domestic
use.
Gas trade within the region is limited to rather small volumes, moved from Algeria to Tunisia and
Morocco; from Egypt to Jordan, Syria, and Lebanon1; and from Qatar to the UAE—all through pipelines.
A small volume of LNG is also exported from Qatar to Kuwait. Yet the needs for imported gas are much
higher. Morocco and Tunisia; Jordan, Lebanon, and Syria; and Kuwait, Bahrain, the UAE, and Oman are
all in search of gas imports. Even Saudi Arabia, which has the fourth-largest gas reserves in the world, is
short of gas and is presently burning crude oil in its power stations. In sum, the potential for gas trade
within the Arab world is widespread and substantial.
This paradoxical situation, in which most Arab countries export much-needed gas to destinations outside
the region rather than within it, was created by a pricing scheme that enables better returns on gas exports
to industrialized countries outside the Arab world. This pricing scheme, however, has the potential to
change alongside the growth in regional gas demand. The gas markets of some industrialized countries (in
North America and Europe) have softened significantly, to the point that some newly commissioned LNG
projects are unable to sell to their intended markets in these countries. Meanwhile, the shortage of gas in
the Arab countries has become more pronounced, justifying the higher gas prices needed to secure
1 Egyptian gas was supplied to Lebanon for a few months in 2009–10.

REGIONAL GAS TRADE PROJECTS IN ARAB COUNTRIES
ix
imported gas or to encourage domestic gas production. Such changes in the landscape provide an impetus
for the Arab world to optimize the region’s gas resources, at least partly on the basis of meeting growing
regional demand.
The objective of this study is to assist the above attempt by (i) identifying the opportunities for gas trade
through cross-border gas pipelines and LNG; (ii) assessing the economic and political aspects of the
identified projects; (iii) proposing financing and implementation schemes that utilize the synergy between
the public and private sector in project formulation and development; and (iv) reviewing the legal,
regulatory, and contractual requirements conducive to regional gas trade. The study focuses on 16 Arab
countries situated in the Middle East and North Africa (MENA).2 Although the MENA region includes
some high-income countries (Saudi Arabia, Kuwait, the UAE, Qatar, and others), the emphasis of the
study is on the low- and middle-income countries of the region. The study draws upon publicly available
information on gas reserves, demand, and supply to carry out an economic analysis of gas trade projects
and identify the prospective projects for implementation in the short to medium term.
Gas Demand and Supply in Arab Countries
The demand for natural gas in the 16 Arab countries grew from 172.28 billion cubic meters (bcm) in 2000
to 311.82 bcm in 2010, a growth rate of 6.2 percent per annum, substantially higher than that of global
gas demand, which was 2.8 percent for the same period. Arab countries’ consumption of gas in 2010
accounted for about 10 percent of global gas use. With respect to the supply parameters, Arab countries
had in 2010 total gas reserves of 54.3 trillion cubic meters (tcm) representing 29 percent of global gas
reserves, and gas production of 480 bcm, accounting for 15 percent of global gas supply. The top five
holders of gas reserves are Qatar (46 percent), Saudi Arabia (15 percent), the UAE (11 percent), Algeria
(8 percent), Iraq (6 percent), and Egypt (4 percent). The top gas suppliers are Qatar (24 percent), Saudi
Arabia (17 percent), Algeria (16 percent), Egypt (13 percent), the UAE (11 percent), and Oman (6
percent).
Table ES1. Arab Countries’ Natural Gas Reserves, Production, Consumption, and Trade in 2010 (in bcm)
Country Reserves Production Consumption Export Import Net trade
Morocco 1.54 0.04 0.90 0.00 0.50 -0.50
Algeria 4,500.00 80.40 28.90 55.79 0.00 55.79
Tunisia 92.00 3.30 5.30 0.00 1.25 -1.25
Libya 1,500.00 15.80 6.90 9.75 0.00 9.75
Egypt 2,200.00 61.30 45.10 15.17 0.00 15.17
Maghreb subtotal 8,293.54 160.84 87.10 80.71 1.75 78.96
Iraq 3,200.00 1.30 1.30 0.00 0.00 0.00
Jordan 6.20 0.30 4.20 0.00 2.10 -2.10
Syria 300.00 7.80 8.50 0.00 0.69 -0.69
Lebanon 0.00 0.00 0.15 0.00 0.15 -0.15
2 Morocco, Algeria, Tunisia, Libya, and Egypt in North Africa are generally grouped as Maghreb countries. Jordan,
Syria, Lebanon, and Iraq are grouped as Mashreq countries (often also including Egypt). Kuwait, Bahrain, Saudi
Arabia, the United Arab Emirates, Qatar, Oman, and Yemen are grouped as Gulf countries, and all except Yemen
are members of the Gulf Cooperation Council (GCC).

REGIONAL GAS TRADE PROJECTS IN ARAB COUNTRIES
x
Country Reserves Production Consumption Export Import Net trade
Mashreq subtotal 3,506.20 9.40 14.15 0.00 2.94 -2.94
Bahrain 200.00 13.10 13.1 0.00 0.00 0.00
Kuwait 1,800.00 11.60 14.40 0.00 2.78 -2.78
Saudi Arabia 8,000.00 83.90 83.90 0.00 0.00 0.00
Qatar 25,300.00 116.70 20.40 94.90 0.00 94.90
UAE 6,000.00 51.00 60.50 7.90 17.41 -9.51
Oman 700.00 27.10 17.51 11.49 1.90 9.59
Yemen 500.00 6.20 0.76 5.48 0.00 5.48
Gulf subtotal 42,500.00 309.60 210.57 119.77 22.09 97.68
Grand total 54,299.74 479.84 311.82 200.48 26.78 173.70
World 187,100.00 3,193.30 3,169.00 975.22 975.22 0.00
Memo
Iran 29,600.00 138.50 136.90 8.42 6.85 1.57
Source: Chapter 2 of this report.
Note: UAE = United Arab Emirates.
The gas profiles of Arab countries are discussed in the subsequent chapters of this report and detailed in
annex 1 (which is contained in a separate volume). In particular, the report reviews the most important
sources of gas supply and the countries that could most easily export gas to the rest of the Arab region.
Qatar
Among these high-potential countries, Qatar is by far the largest source of gas supply in the region. It has
proven reserves of 25.37 tcm and a reserves-to-production ratio (RPR) well in excess of 200 years. It has
the world’s largest nonassociated (free) gas field, with relatively modest production costs. Its gas
production increased from 23.7 bcm in 2000 to 116.7 bcm in 2010. But the government, concerned that
the rapid pace of supply expansion could be harmful to the gas reservoir, in 2005 imposed a moratorium
on production for new exports pending a comprehensive review of reservoir operations. That moratorium
has been periodically extended and is expected to be in place until 2014, by which time all production
projects already approved would be in operation. When these are completed, the industry expects Qatar to
allow gas production to increase. According to projections by the International Energy Agency (IEA),
Qatar’s gas production should increase to 182 bcm by 2020, to 238 bcm by 2030, and to 260 bcm by
2035. The institutional and contracting arrangements used in Qatar have proven to be conducive to rapid
expansion.
Saudi Arabia
Saudi Arabia’s proven natural gas reserves are estimated at 8.0 tcm, representing the world’s fourth-
largest gas reserves after the Russian Federation, the Islamic Republic of Iran, and Qatar. About 5060
percent of the natural gas in Saudi Arabia is associated with oil deposits, and its production is linked to oil
production subject to the quota regulations of the Organization of the Petroleum Exporting Countries
(OPEC). Of the remaining nonassociated gas reserves, about 75 percent is sour gas or is found in tight gas
formations, making only 25 percent of the reserves relatively easy to develop. Since Saudi Arabia’s
annual oil production is unlikely to exceed the current level of 10 million barrels per day for various

REGIONAL GAS TRADE PROJECTS IN ARAB COUNTRIES
xi
reasons, including the OPEC quotas, prospects for increasing associated gas production are limited. Thus
any substantial increase in gas supply would be based on the development of nonassociated gas resources,
which are expensive to develop and produce compared with existing supplies. Since all incremental gas
production would be consumed within the country, gas supply prices for domestic consumers, which
currently stand at $0.75 per million British thermal units (mmbtu), need to be adjusted upwards to sustain
supply in the context of rising production costs.
Iraq
Iraq is considered a high-potential source of gas supply, though its 2010 proven gas reserves are estimated
at only 3.2 tcm. Nevertheless, the country is currently flaring about 66 percent of the region’s total
associated gas production, estimated at 810 bcm/year. Marketed gas production (which stood at 1.3
bcm/year in 2010) could be quickly increased by constructing gas-gathering systems and reducing the
amount of flared gas. In addition, Iraq is believed to have probable reserves of 4.5 tcm of nonassociated
gas and 3.0 tcm of associated gas. The government has in recent years been preoccupied with the revival
of oil production but has started focusing on the development of gas fields and entered into several
contracts for the development of three nonassociated gas fields at Akkas, Mansuriya, and Sibba. Based on
these and other envisioned contracts, the level of gas production is expected to increase to 54.81 bcm by
2020 and to 80.65 bcm by 2030. Iraq’s gas resources are not particularly difficult or expensive to develop,
but the country faces serious nontechnical problems, including security concerns and ambiguous
agreements between the central and provincial governments.
Libya
Libya’s proven gas reserves are estimated at 1.5 tcm, consisting of 45 percent associated and 55 percent
nonassociated gas. Industry observers believe the volume of proven reserves will increase notably in the
near future, based on recently commissioned exploration activities, and could reach about 5 tcm. Libya’s
marketed gas production stood at about 15.8 bcm in 2010, and base-case projections indicate volumes of
20.4 bcm in 2020 and 27.4 bcm in 2030. But it is believed that there are upside potentials to these
projections under appropriate fiscal terms and improvements in the country’s business environment.
United Arab Emirates
The UAE’s proven natural gas reserve is estimated at 6 tcm. More than 94 percent of the country’s oil and
gas reserves are located in the emirate of Abu Dhabi, and the remaining 6 percent is located in other
emirates (Sharjah, Dubai, and Ras al-Khaimah). Much of the gas in the UAE is associated, and therefore
the OPEC oil production quota acts as a constraint to increased gas production. Also a large percentage
(28 percent in 2010) of raw gas production is reinjected into oil wells to enhance oil recovery. The UAE’s
marketed gas production, therefore, increased at a very slow annual rate from 44.9 bcm in 2001 to 51.0
bcm in 2010. It is projected that the production of marketed gas will increase to 78 bcm by 2020, but most
of the incremental production of gas is going to be expensive, costing approximately $5/mmbtu. As the
domestic gas price is only about $1/mmbtu, prospects for future gas exploration and development are
cloudy.
Algeria
Algeria is a high-profile international gas supplier and until recently the largest gas exporter among the
Arab countries, with reserves estimated at 4.5 tcm. Most of its reserves are associated gas, and nearly 50
percent of its gross gas production is reinjected to enhance oil recovery. The country’s marketed gas
REGIONAL GAS TRADE PROJECTS IN ARAB COUNTRIES
xii
volume has stayed within a limited range of 8088 bcm in the past decade. Present projections indicate
that gas production could increase at 8 percent per year during 201418 and reach a plateau of 115120
bcm in the early 2020s, gradually declining thereafter. Further increases in production will have to await
developments relating to the production of unconventional gas (such as tight gas and shale gas).
Institutional and contracting arrangements have proven adequate for successful gas business in the past
decade. Low domestic gas prices ($0.50 per mmbtu indexed to exchange rates and inflation rates) could
be a constraint to gas production for domestic use.
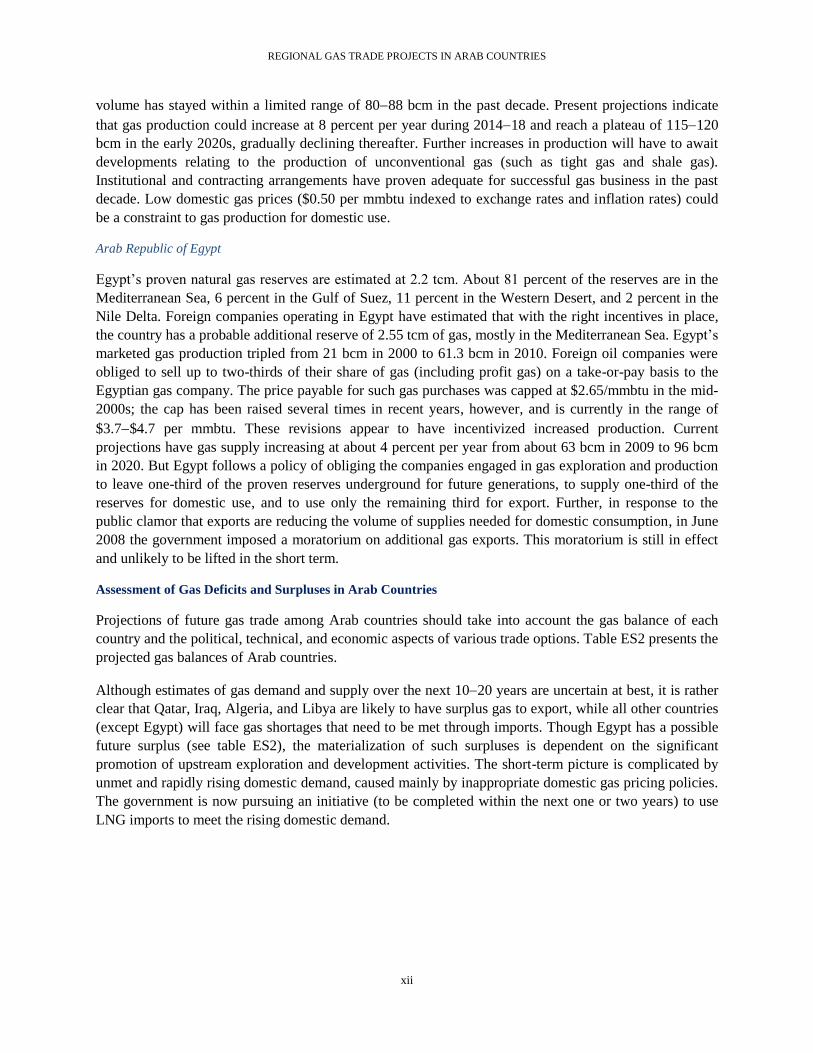
Arab Republic of Egypt
Egypt’s proven natural gas reserves are estimated at 2.2 tcm. About 81 percent of the reserves are in the
Mediterranean Sea, 6 percent in the Gulf of Suez, 11 percent in the Western Desert, and 2 percent in the
Nile Delta. Foreign companies operating in Egypt have estimated that with the right incentives in place,
the country has a probable additional reserve of 2.55 tcm of gas, mostly in the Mediterranean Sea. Egypt’s
marketed gas production tripled from 21 bcm in 2000 to 61.3 bcm in 2010. Foreign oil companies were
obliged to sell up to two-thirds of their share of gas (including profit gas) on a take-or-pay basis to the
Egyptian gas company. The price payable for such gas purchases was capped at $2.65/mmbtu in the mid-
2000s; the cap has been raised several times in recent years, however, and is currently in the range of
$3.7$4.7 per mmbtu. These revisions appear to have incentivized increased production. Current
projections have gas supply increasing at about 4 percent per year from about 63 bcm in 2009 to 96 bcm
in 2020. But Egypt follows a policy of obliging the companies engaged in gas exploration and production
to leave one-third of the proven reserves underground for future generations, to supply one-third of the
reserves for domestic use, and to use only the remaining third for export. Further, in response to the
public clamor that exports are reducing the volume of supplies needed for domestic consumption, in June
2008 the government imposed a moratorium on additional gas exports. This moratorium is still in effect
and unlikely to be lifted in the short term.
Assessment of Gas Deficits and Surpluses in Arab Countries
Projections of future gas trade among Arab countries should take into account the gas balance of each
country and the political, technical, and economic aspects of various trade options. Table ES2 presents the
projected gas balances of Arab countries.
Although estimates of gas demand and supply over the next 1020 years are uncertain at best, it is rather
clear that Qatar, Iraq, Algeria, and Libya are likely to have surplus gas to export, while all other countries
(except Egypt) will face gas shortages that need to be met through imports. Though Egypt has a possible
future surplus (see table ES2), the materialization of such surpluses is dependent on the significant
promotion of upstream exploration and development activities. The short-term picture is complicated by
unmet and rapidly rising domestic demand, caused mainly by inappropriate domestic gas pricing policies.
The government is now pursuing an initiative (to be completed within the next one or two years) to use
LNG imports to meet the rising domestic demand.

REGIONAL GAS TRADE PROJECTS IN ARAB COUNTRIES
xiii
Table ES2. Projected Surpluses and Deficits of Gas in Arab Countries through 2030 (bcm)
Country
Projected
domestic demand Projected production level Current
exports
2010
Projected
surplus or deficit
2020 2030 2020 2030 2020 2030
Morocco 5.00 8.00 0.40 0.40 0.00 -4.60 -7.60
Algeria 45.00 65.00 115.00 135.00 55.79 14.21 14.21
Tunisia 8.50 10.00 3.30 3.30 0.00 -5.20 -6.70
Libya 20.00 40.00 35.00 55.50 9.75 5.25 5.75
Egypt 72.80 97.79 100.00 120.00 15.17 12.03 7.04
Iraq 35.16 61.00 54.81 80.65 0.00 19.65 19.65
Jordan 5.60 8.10 0.30 0.30 0.00 -5.30 -7.80
Syria 20.00 39.00 15.00 20.00 0.00 -5.00 -19.00
Lebanon 7.00 10.00 0.00 0.00 0.00 -7.00 -10.00
Bahrain 29.00 37.00 27.00 30.00 0.00 -2.00 -7.00
Kuwait 38.00 60.00 20.30 51.30 0.00 -17.70 -8.70
Saudi Arabia 130.00 150.00 120.00 125.00 0.00 -10.00 -25.00
Qatar 53.00 85.00 182.00 238.00 94.90 34.10 58.10
UAE 107.50 150.00 65.00 78.00 7.90 -50.40 -79.90
Oman 40.49 65.95 45.00 56.00 11.49 -6.98 -21.44
Yemen 5.00 8.00 8.00 14.00 5.48 -2.48 0.52
Total 622.05 894.84 791.11 1,007.45 200.48 -31.42 -87.87
Source: Chapter 5 of this report.
Note: UAE = United Arab Emirates.
The Choice between Cross-Border Pipeline Transport and LNG Imports
Given the rapidly rising demand for natural gas in most Arab states, and the level of export surpluses of
some countries, there is a compelling case for a significant increase in regional gas trade among Arab
countries. Gas trade can be carried out by transporting gas through onshore or offshore pipelines, or by
liquefying natural gas, transporting it in tankers, and delivering it to storage and regasification facilities
(which, in many cases, would have to be constructed). A third alternative is to generate electricity in the
gas-rich countries and export the power.
The relative economics of pipeline transport and liquefied natural gas (LNG) are dependent on the
distances involved, the volume of gas transported, and the location of the pipeline (onshore or offshore).
The average cost of gas transport through an onshore pipeline is about $1.20/mmbtu per 1,000 kilometers
(km) for a 48-inch pipeline carrying about 15 bcm/year. There are some economies of scale in pipeline
transport of gas—the overall cost drops by about 20 percent when the volume doubles and about 25
percent when the volume triples. In general, offshore pipelines are about twice as costly as onshore
pipelines.
Under the LNG option, the cost of liquefaction of gas is about $3.5$4.0/mmbtu, the cost of shipping in
the range of $0.5$1.4/mmbtu, and the cost of regasification about $0.6/mmbtu, for a total cost of
$4.6$6.0/mmbtu. Generic analysis indicates that for distances greater than 5,000 km, LNG is more cost-
effective than onshore gas pipeline transport. The breakeven distance is about 1,600 km in the case of an

REGIONAL GAS TRADE PROJECTS IN ARAB COUNTRIES
xiv
offshore pipeline. Although significant improvements are being made to both pipeline and LNG
technologies, the comparative economics of the two options seem to remain largely unchanged. Taking
into account all 16 Arab countries, the distances between the potential exporting and importing countries
are such that pipeline gas trade is clearly the more economic option and should be pursued. But the LNG
option is of significant interest because of the region’s existing LNG trade and because the risks of an
LNG import scheme are more manageable than those of a cross-border gas pipeline. More specifically,
four (Algeria, Libya, Egypt, and Qatar) out of the five surplus countries have liquefaction and LNG
export facilities, and Iraq’s strategic plans include facilities for LNG export. All 11 potential importing
countries have their own seacoasts. Kuwait and the UAE have already constructed floating reception,
storage, and regasification facilities for LNG import, and other countries such as Bahrain, Jordan, Syria,
Morocco, and Lebanon are pursuing similar projects for LNG imports.
The choice between (i) importing gas by pipeline and using it to generate electricity and (ii) importing
electricity generated at the wellheads using gas is not always straightforward. If gas has multiple uses at
the importing end (such as electricity generation, industrial and domestic uses, and fertilizer production),
then clearly gas transport by pipeline is the only solution. If, however, the only use is to generate
electricity, then generating power at the wellhead and transmitting it to load centers could be more
economic under certain conditions. Generic analysis indicates that gas pipelines tend to be more
economical for distances greater than 1,000 km and volumes in excess of 5–10 bcm of gas. Arab
countries have proactively pursued cross-border electricity trade projects and regional integration of
power networks, but most of the implemented or ongoing schemes are aimed at small volumes (up to 600
megawatts [MW]) and reciprocal energy exchange. Large-scale energy import is expected to remain
based on pipeline and LNG options.
Identification of Gas Trade Projects
Eleven of the 16 Arab countries are candidates for gas imports. Of these, Saudi Arabia is an exceptional
case, since government policy so far has favored neither imports nor exports of gas. This policy may
change, as the country is burning an increasing amount of high-priced crude oil for power generation.
Yemen may also be regarded as an exception at this stage, since its policies focus on increasing domestic
production of gas. The remaining nine countries clearly follow a strategy of importing gas to meet the
rapidly rising demand for power and for other uses. The UAE and Oman, notable exporters of LNG, have
become importers of gas to meet their rising gas demand and are planning to reduce exports as the long-
term contracts expire over the next several years, unless they succeed in their efforts to step up gas
production from more difficult and expensive fields. Many of the importing countries have already
constructed facilities for the importation of LNG or are planning to do so in the very near future. Overall
the strategy for these countries seems to favor pipeline imports wherever possible and LNG imports
where necessary.
Within the above framework, it is conceivable to envisage—in the long term—the emergence of a Pan-
Arab Gas Pipeline System (PAGPS) supplemented by LNG trading facilities to support the objective of
promoting increased regional gas trade. The PAGPS would consist of three main corridors: the first
(partially complete) would connect Morocco, Algeria, Tunisia, Libya, and Egypt; the second (mostly
complete) would connect Egypt, Jordan, Syria, Lebanon, and Turkey; and the third (partially complete)
would connect Oman, the UAE, Qatar, Saudi Arabia, Bahrain, and Kuwait. Iraq will connect to the
PAGPS through a gas pipeline to Kuwait and another to Syria and the Arab Gas Pipeline (AGP) already
in place there. A gas pipeline between Egypt and northwestern Saudi Arabia would complete the

REGIONAL GAS TRADE PROJECTS IN ARAB COUNTRIES
xv
integration of the PAGPS. The first and second corridors would be a part of the Mediterranean Gas Ring
connecting the countries surrounding the Mediterranean Sea (figure ES1).
Figure ES1. Envisioned Outline of the Pan-Arab Gas Pipeline System
Development of the PAGPS would involve discrete projects, some of which could be implemented in the
short to medium term, and the rest in the longer term.
A possible list of projects for consideration in the short to medium term would include:
Expansion of the volume of the Algeria–Morocco gas trade
Expansion of the volume of the Algeria–Tunisia gas trade
Expansion of gas sales from Egypt to Jordan, Syria, and Lebanon through the AGP
Construction of a Libya–Tunisia gas pipeline
Expansion of trade volume between Qatar, the UAE, and Oman through the Dolphin Pipeline
Construction of a Qatar–Bahrain–Saudi Arabia–Kuwait gas pipeline
Reconstruction of the old, or construction of a new, Iraq–Kuwait gas pipeline
Construction of a gas pipeline from Iraq to Syria and linking it to the AGP
Expansion of the LNG-receiving facilities in Kuwait and the UAE
Construction of LNG-receiving facilities in Jordan, Lebanon, Bahrain, and Morocco
Possible projects likely to be considered for the longer term would include construction of:
The Libya–Egypt pipeline
REGIONAL GAS TRADE PROJECTS IN ARAB COUNTRIES
xvi
The Iraq–Saudi Arabia pipeline
The Iraq–Jordan pipeline
A direct Iraq–Turkey pipeline connecting to Europe
LNG-receiving terminals at Syria and Saudi Arabia
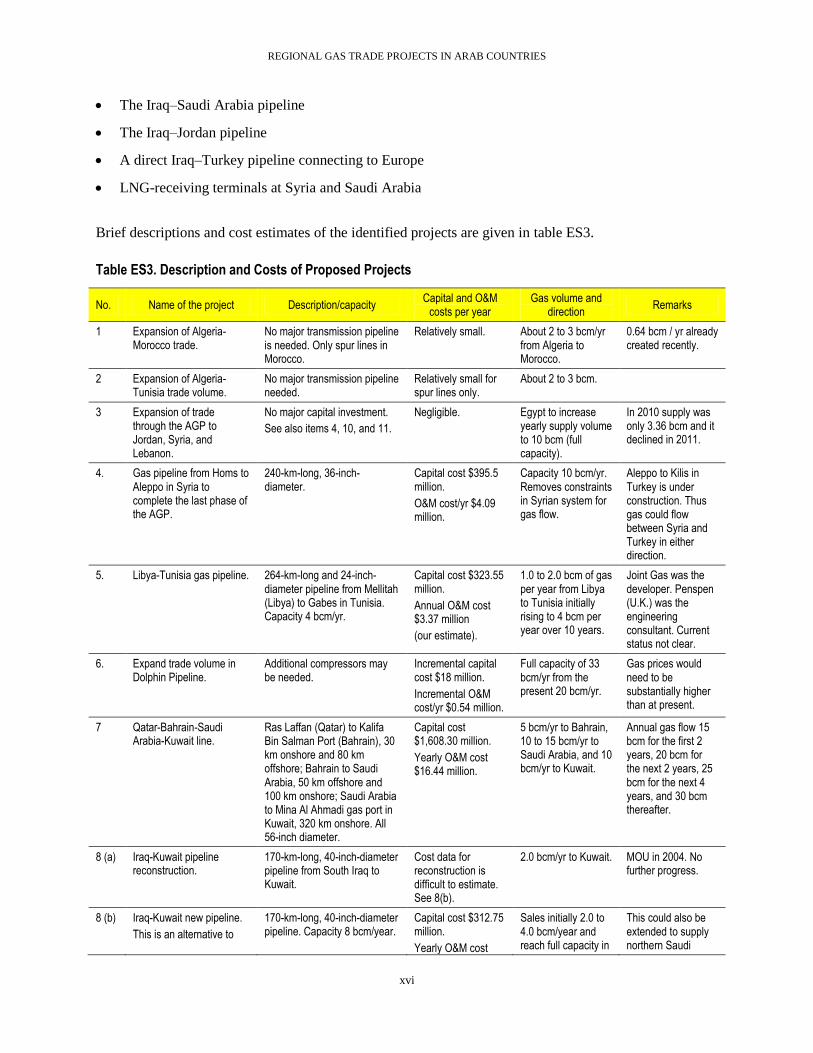
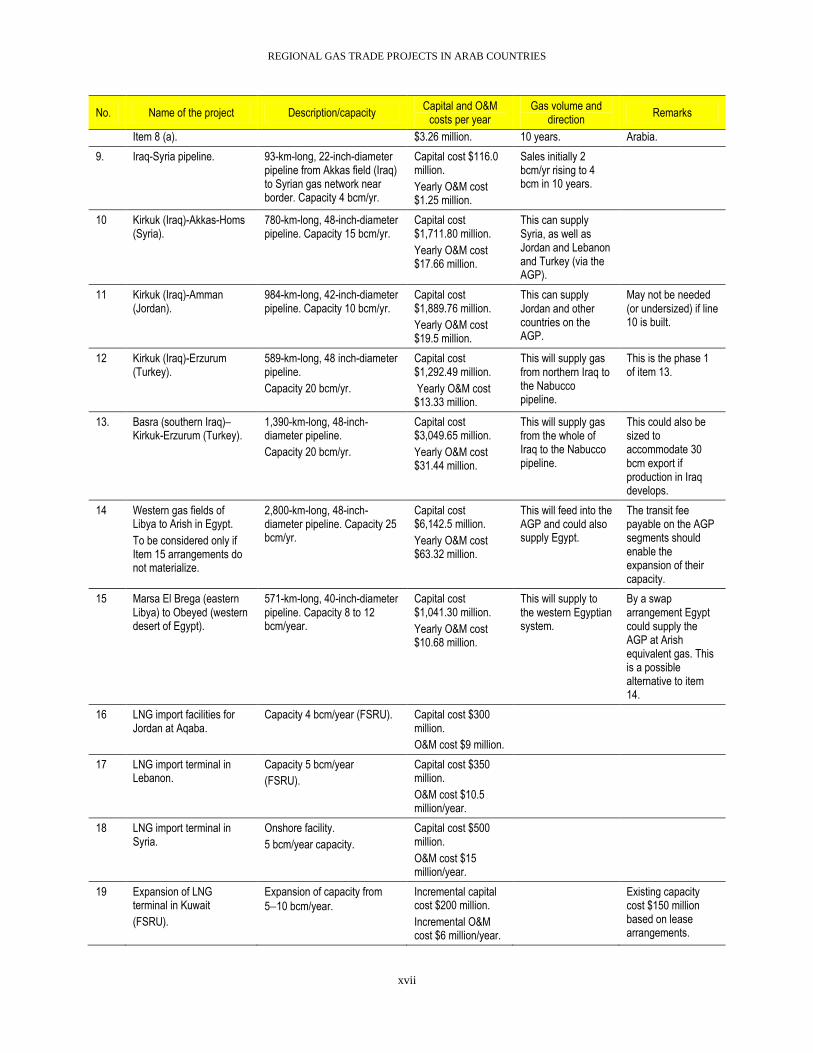
Brief descriptions and cost estimates of the identified projects are given in table ES3.
Table ES3. Description and Costs of Proposed Projects
No. Name of the project Description/capacity Capital and O&M
costs per year Gas volume and
direction Remarks
1 Expansion of Algeria-Morocco trade.
No major transmission pipeline is needed. Only spur lines in Morocco.
Relatively small. About 2 to 3 bcm/yr from Algeria to Morocco.
0.64 bcm / yr already created recently.
2 Expansion of Algeria-Tunisia trade volume.
No major transmission pipeline needed.
Relatively small for spur lines only.
About 2 to 3 bcm.
3 Expansion of trade through the AGP to Jordan, Syria, and Lebanon.
No major capital investment.
See also items 4, 10, and 11.
Negligible. Egypt to increase yearly supply volume to 10 bcm (full capacity).
In 2010 supply was only 3.36 bcm and it declined in 2011.
4. Gas pipeline from Homs to Aleppo in Syria to complete the last phase of the AGP.
240-km-long, 36-inch-diameter.
Capital cost $395.5 million.
O&M cost/yr $4.09 million.
Capacity 10 bcm/yr. Removes constraints in Syrian system for gas flow.
Aleppo to Kilis in Turkey is under construction. Thus gas could flow between Syria and Turkey in either direction.
5. Libya-Tunisia gas pipeline. 264-km-long and 24-inch-diameter pipeline from Mellitah (Libya) to Gabes in Tunisia. Capacity 4 bcm/yr.
Capital cost $323.55 million.
Annual O&M cost $3.37 million
(our estimate).
1.0 to 2.0 bcm of gas per year from Libya to Tunisia initially rising to 4 bcm per year over 10 years.
Joint Gas was the developer. Penspen (U.K.) was the engineering consultant. Current status not clear.
6. Expand trade volume in Dolphin Pipeline.
Additional compressors may be needed.
Incremental capital cost $18 million.
Incremental O&M cost/yr $0.54 million.
Full capacity of 33 bcm/yr from the present 20 bcm/yr.
Gas prices would need to be substantially higher than at present.
7 Qatar-Bahrain-Saudi Arabia-Kuwait line.
Ras Laffan (Qatar) to Kalifa Bin Salman Port (Bahrain), 30 km onshore and 80 km offshore; Bahrain to Saudi Arabia, 50 km offshore and 100 km onshore; Saudi Arabia to Mina Al Ahmadi gas port in Kuwait, 320 km onshore. All 56-inch diameter.
Capital cost $1,608.30 million.
Yearly O&M cost $16.44 million.
5 bcm/yr to Bahrain, 10 to 15 bcm/yr to Saudi Arabia, and 10 bcm/yr to Kuwait.
Annual gas flow 15 bcm for the first 2 years, 20 bcm for the next 2 years, 25 bcm for the next 4 years, and 30 bcm thereafter.
8 (a) Iraq-Kuwait pipeline reconstruction.
170-km-long, 40-inch-diameter pipeline from South Iraq to Kuwait.
Cost data for reconstruction is difficult to estimate. See 8(b).
2.0 bcm/yr to Kuwait. MOU in 2004. No further progress.
8 (b) Iraq-Kuwait new pipeline.
This is an alternative to
170-km-long, 40-inch-diameter pipeline. Capacity 8 bcm/year.
Capital cost $312.75 million.
Yearly O&M cost
Sales initially 2.0 to 4.0 bcm/year and reach full capacity in
This could also be extended to supply northern Saudi
REGIONAL GAS TRADE PROJECTS IN ARAB COUNTRIES
xvii
No. Name of the project Description/capacity Capital and O&M
costs per year Gas volume and
direction Remarks
Item 8 (a). $3.26 million. 10 years. Arabia.
9. Iraq-Syria pipeline. 93-km-long, 22-inch-diameter pipeline from Akkas field (Iraq) to Syrian gas network near border. Capacity 4 bcm/yr.
Capital cost $116.0 million.
Yearly O&M cost $1.25 million.
Sales initially 2 bcm/yr rising to 4 bcm in 10 years.
10 Kirkuk (Iraq)-Akkas-Homs (Syria).
780-km-long, 48-inch-diameter pipeline. Capacity 15 bcm/yr.
Capital cost $1,711.80 million.
Yearly O&M cost $17.66 million.
This can supply Syria, as well as Jordan and Lebanon and Turkey (via the AGP).
11 Kirkuk (Iraq)-Amman (Jordan).
984-km-long, 42-inch-diameter pipeline. Capacity 10 bcm/yr.
Capital cost $1,889.76 million.
Yearly O&M cost $19.5 million.
This can supply Jordan and other countries on the AGP.
May not be needed (or undersized) if line 10 is built.
12 Kirkuk (Iraq)-Erzurum (Turkey).
589-km-long, 48 inch-diameter pipeline.
Capacity 20 bcm/yr.
Capital cost $1,292.49 million.
Yearly O&M cost $13.33 million.
This will supply gas from northern Iraq to the Nabucco pipeline.
This is the phase 1 of item 13.
13. Basra (southern Iraq)–Kirkuk-Erzurum (Turkey).
1,390-km-long, 48-inch-diameter pipeline.
Capacity 20 bcm/yr.
Capital cost $3,049.65 million.
Yearly O&M cost $31.44 million.
This will supply gas from the whole of Iraq to the Nabucco pipeline.
This could also be sized to accommodate 30 bcm export if production in Iraq develops.
14 Western gas fields of Libya to Arish in Egypt.
To be considered only if Item 15 arrangements do not materialize.
2,800-km-long, 48-inch-diameter pipeline. Capacity 25 bcm/yr.
Capital cost $6,142.5 million.
Yearly O&M cost $63.32 million.
This will feed into the AGP and could also supply Egypt.
The transit fee payable on the AGP segments should enable the expansion of their capacity.
15 Marsa El Brega (eastern Libya) to Obeyed (western desert of Egypt).
571-km-long, 40-inch-diameter pipeline. Capacity 8 to 12 bcm/year.
Capital cost $1,041.30 million.
Yearly O&M cost $10.68 million.
This will supply to the western Egyptian system.
By a swap arrangement Egypt could supply the AGP at Arish equivalent gas. This is a possible alternative to item 14.
16 LNG import facilities for Jordan at Aqaba.
Capacity 4 bcm/year (FSRU). Capital cost $300 million.
O&M cost $9 million.
17 LNG import terminal in Lebanon.
Capacity 5 bcm/year
(FSRU).
Capital cost $350 million.
O&M cost $10.5 million/year.
18 LNG import terminal in Syria.
Onshore facility.
5 bcm/year capacity.
Capital cost $500 million.
O&M cost $15 million/year.
19 Expansion of LNG terminal in Kuwait
(FSRU).
Expansion of capacity from
510 bcm/year. Incremental capital cost $200 million.
Incremental O&M cost $6 million/year.
Existing capacity cost $150 million based on lease arrangements.
REGIONAL GAS TRADE PROJECTS IN ARAB COUNTRIES
xviii
No. Name of the project Description/capacity Capital and O&M
costs per year Gas volume and
direction Remarks
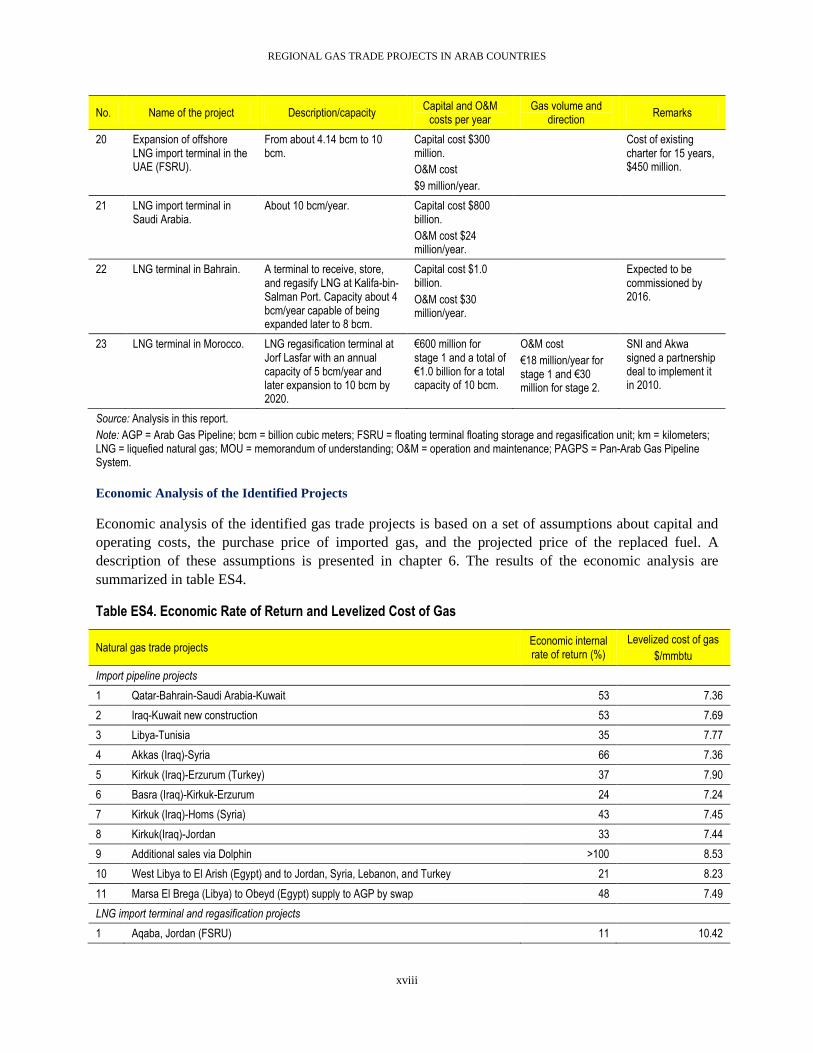
20 Expansion of offshore LNG import terminal in the UAE (FSRU).
From about 4.14 bcm to 10 bcm.
Capital cost $300 million.
O&M cost
$9 million/year.
Cost of existing charter for 15 years, $450 million.
21 LNG import terminal in Saudi Arabia.
About 10 bcm/year. Capital cost $800 billion.
O&M cost $24 million/year.
22 LNG terminal in Bahrain. A terminal to receive, store, and regasify LNG at Kalifa-bin-Salman Port. Capacity about 4 bcm/year capable of being expanded later to 8 bcm.
Capital cost $1.0 billion.
O&M cost $30 million/year.
Expected to be commissioned by 2016.
23 LNG terminal in Morocco. LNG regasification terminal at Jorf Lasfar with an annual capacity of 5 bcm/year and later expansion to 10 bcm by 2020.
€600 million for stage 1 and a total of €1.0 billion for a total capacity of 10 bcm.
O&M cost
€18 million/year for stage 1 and €30 million for stage 2.
SNI and Akwa signed a partnership deal to implement it in 2010.
Source: Analysis in this report.
Note: AGP = Arab Gas Pipeline; bcm = billion cubic meters; FSRU = floating terminal floating storage and regasification unit; km = kilometers; LNG = liquefied natural gas; MOU = memorandum of understanding; O&M = operation and maintenance; PAGPS = Pan-Arab Gas Pipeline System.
Economic Analysis of the Identified Projects
Economic analysis of the identified gas trade projects is based on a set of assumptions about capital and
operating costs, the purchase price of imported gas, and the projected price of the replaced fuel. A
description of these assumptions is presented in chapter 6. The results of the economic analysis are
summarized in table ES4.
Table ES4. Economic Rate of Return and Levelized Cost of Gas
Natural gas trade projects Economic internal rate of return (%)
Levelized cost of gas
$/mmbtu
Import pipeline projects
1 Qatar-Bahrain-Saudi Arabia-Kuwait 53 7.36
2 Iraq-Kuwait new construction 53 7.69
3 Libya-Tunisia 35 7.77
4 Akkas (Iraq)-Syria 66 7.36
5 Kirkuk (Iraq)-Erzurum (Turkey) 37 7.90
6 Basra (Iraq)-Kirkuk-Erzurum 24 7.24
7 Kirkuk (Iraq)-Homs (Syria) 43 7.45
8 Kirkuk(Iraq)-Jordan 33 7.44
9 Additional sales via Dolphin >100 8.53
10 West Libya to El Arish (Egypt) and to Jordan, Syria, Lebanon, and Turkey 21 8.23
11 Marsa El Brega (Libya) to Obeyd (Egypt) supply to AGP by swap 48 7.49
LNG import terminal and regasification projects
1 Aqaba, Jordan (FSRU) 11 10.42

REGIONAL GAS TRADE PROJECTS IN ARAB COUNTRIES
xix
Natural gas trade projects Economic internal rate of return (%)
Levelized cost of gas
$/mmbtu
2 Mediterranean port, Lebanon 33 9.33
3 Mediterranean port in Syria 9 9.46
4 West coast of Saudi Arabia, near Yanbu 11 9.41
5 Bahrain 16 8.98
6 Jorf Lasfar in Morocco 8 9.46
7 Expansion of the facilities in Kuwait Minal Al-Ahmadi gas port FSRU 71 9.62
8 Expansion of the facilities in UAE, Jebel Ali Port FSRU 40 10.01
Source: Analysis in this report.
Note: EIRR = economic rate of return; FSRU = floating terminal floating storage and regasification unit; mmbtu = million British thermal unit; UAE = United Arab Emirates.
As indicated by the above results, most gas trade projects have high rates of return. As expected, pipeline
import schemes have a higher rate of return than LNG projects. The economic internal rate of return
(EIRR) for the Morocco project is exceptionally modest because of high capital costs and long distances
of internal transport to reach the power plants. The EIRRs for the expansion projects in Kuwait and the
UAE are exceptionally high thanks to the relatively low incremental capital costs of these projects.
Economic analysis also indicates that construction of a combined pipeline project from Qatar to meet the
import needs of Bahrain, Saudi Arabia, and Kuwait is far more economically attractive than construction
of three individual projects to meet the needs of each country. Table ES5 contains the present values of
the costs of the corresponding pipeline projects.
Table ES5. Relative Costs of the Combined and Individual Projects
No Option Present value of capital cost
($ million)
Present value of O&M cost ($
million)
Present value of total cost ($
million)
1 Combined pipeline for all three countries from Qatar 1,231.95 129.80 1,361.75
2 Pipeline from Qatar to Bahrain alone 377.77 24.11 401.88
3 Pipeline from Qatar to Saudi Arabia alone 612.36 63.10 675.46
4 Pipeline from Qatar to Kuwait alone 1,274.42 130.59 1,405.01
5 Total for three separate pipelines 2,264.55 217.80 2,482.35
Source: Analysis in this report.
Note: O&M = operation and maintenance.
Constraints and Outlook for the Proposed Projects
As discussed in chapter 4, domestic prices for gas and electricity in most Arab countries are substantially
lower than the cost of supply and energy subsidy, which is a major component of fiscal expenditure
budgets. Though the projects have good internal rates of return (IRRs) based on the use of economic
prices, they become financially unviable when the highly subsidized and distorted domestic energy prices
are used in the analysis. The systematic phase-out of gas-price subsidies would be an essential component
of any gas trade project. Such a plan would need to have a clear target and time frame for implementation
in order to assure investors and financiers of the project’s financial sustainability.

REGIONAL GAS TRADE PROJECTS IN ARAB COUNTRIES
xx
Not all 23 projects listed in table 6.1 can be expected to materialize within a predictable time frame.
Resolving the domestic energy-pricing issue by phasing out extensive energy subsidies is critical to
promoting regional gas trade, though such reforms have proven politically difficult in the past. Even more
important is the need for (i) the present political turmoil in the region to subside and (ii) the restoration of
credible, legitimate, and efficient governance arrangements in many countries. These are interrelated
issues, in the sense that price reforms can be possible only when such governance arrangements are in
place. In the light of these concerns and the prevailing environment in the region, only a few projects are
likely to materialize in the near future. For the most part, the environment is not conducive to the
construction of new cross-border pipelines; LNG import terminals are likely to proceed more quickly.
Thus, among the pipeline proposals one may expect gas trade to increase relatively quickly, using existing
facilities or with marginal capacity augmentation. Example proposals include the Dolphin Pipeline (item
6), restoration and possibly some expansion of trade through the AGP to Jordan (item 3), and expansion
of trade among Algeria, Tunisia, and Morocco (items 1 and 2). Other pipelines may have to await a more
conducive environment. Among them, the QatarBahrainSaudi ArabiaKuwait line is the most
attractive, but is also dependent on the resolution of major political, strategic, and border-related issues.
The projects relating to LNG import terminals in Jordan, Lebanon, Morocco, and Bahrain (items 16, 17,
22, and 23) are going through the bidding phase, and the project relating to Saudi Arabia (item 21) will
have to await change in Saudi energy policy. The expansion of LNG import facilities in Kuwait and the
UAE (items 19 and 20) are already in the detailed planning stage.
Financing Gas Trade Projects
In many parts of the world, the natural gas industry has gone through fundamental changes, resulting in
competition in the supply of gas, elimination of many of the monopolistic features of the industry, and a
free-market determination of the price of gas. But in the Arab world the gas industry remains mostly
under government control, and the price of natural gas is set directly or indirectly by government entities.
Often that price is set at very low levels based on social and political considerations. Authorities in most
Arab countries agree that they need to increase the gas price to encourage efficiency of consumption and
to fund the domestic supply of gas (through internal production or imports). Nevertheless, it is expected
that gas price adjustments will continue to be made gradually. In the meantime, governments are carrying
the burden of substantial gas subsidies and an even larger burden when gas is not available and oil is
consumed instead.
Arab governments are encouraging private sector participation in various segments of the industry. But in
most cases such participation would require special arrangements to compensate for low domestic gas
prices and to mitigate various risks.
The analysis of risks and financing challenges of gas trade projects (chapter 7) indicates that a public-
private partnership (PPP) structure represents the most suitable arrangement for the formulation and
implementation of gas trade projects in the Arab countries. The PPP structure enables such projects to
benefit from the synergy and strengths of both public and private partners, while providing for the most
effective options for risk management and mitigation. Private sector participation is essential for efficient
formulation of project parameters, finance mobilization, and construction of the pipeline system.
Participation by the government of the exporting country provides the project company with assurances of
security related to the gas supply, the pipeline, and other transactional items (such as right of way) within
the territory of the exporting country. Participation by the government of the importing country is a
REGIONAL GAS TRADE PROJECTS IN ARAB COUNTRIES
xxi
prerequisite for cross-border gas projects in the region. The government and the national gas company
need to guarantee the offtake of imported gas in accordance with contract terms. Furthermore, the
government needs to continue to manage the subsidy scheme as long as the domestic gas price remains
substantially lower than the import price of gas.
Based on the analysis of the PPP options, this report proposes (in chapter 7) two distinct financing
schemes for cross-border pipeline systems and LNG projects in the Mashreq and Maghreb subregions, as
well as a simple financing scheme for the pipeline system transporting gas within the countries of the
Gulf Cooperation Council (GCC).
The financial structure best suited to the cross-border gas pipeline projects in the Maghreb and Mashreq
subregions is based on the industry practice of seeking 6070 percent of the capital cost as debt from
various sources, while (public and private) partners contribute the balance in the form of equity. The
private sector share of the equity is expected to come from the participating companies. The public sector
share would come in the form of government (or national gas company) contributions, which might in
turn be borrowed from official lenders such as the World Bank.
The debt component of project finance can come from a variety of sources. The public-private venture
would enable the project company to borrow from development partners—the World Bank, International
Finance Corporation (IFC), African Development Bank (AfDB), Islamic Development Bank (IsDB), and
bilateral financiers such as the export-import banks. The structure also provides the option of borrowing
from commercial sources.
The proposed partnership would facilitate the mitigation of many risks, though there may still be a need
for risk-mitigation instruments. Three important areas of risk could require explicit coverage. First, the
private sector partner(s) normally require satisfactory investment protection insurance—MIGA insurance
is often suitable for such concerns. Second, commercial lenders often require a repayment guarantee. The
World Bank’s (or AfDB’s) partial-risk guarantee instrument would be most suitable to the proposed
pipeline projects. Third, the gas-exporting country is often concerned about the ability of the importing
country to adhere to the offtake agreement. That risk could be covered to some extent by a guarantee
from the government of the importing country. Alternatively, it could be covered by a partial-risk
guarantee from the World Bank.
The financial structure for LNG schemes in the Maghreb and Mashreq subregions is very similar. As in
the case of pipeline projects, the private sector equity would come from the participating private
companies. The public sector equity would come in the form of government (or national gas company)
contributions, which might in turn be borrowed from official lenders such as the World Bank. The debt
financing could also be mobilized from official and commercial lenders.
The dynamics of financing gas trade projects in GCC countries are somewhat different. In most GCC
countries, strategic projects (even domestic infrastructure) cannot materialize without government
leadership; the deciding factors are thus much more political than economic. Cross-border projects are
exponentially more political, since they require decisions from two or several governments. Nevertheless,
when political decisions are made, financing requirements become available rather easily through
budgetary sources or commercial lenders that often view the GCC countries to be credible borrowers. The
case of the GCC regional electricity network demonstrates (i) the length of time that it took to receive
political commitments from the participating governments, and (ii) the relative ease with which the

REGIONAL GAS TRADE PROJECTS IN ARAB COUNTRIES
xxii
project was financed through the budgetary resources of the GCC governments. Similarly, the case of the
Dolphin gas project demonstrates the complexity of reaching agreements among the participating
countries and the relative speed of mobilizing private sector finance.
Financing the LNG Import Terminal Projects in Jordan and Lebanon
The governments of Jordan and Lebanon are in the process of preparing bids for the construction of LNG
import terminals. Lebanon has lost its supply of gas from Egypt and is counting on LNG as an alternative
option. Jordan experienced a major interruption in gas supply from Egypt and intends to build an LNG
terminal to diversify its sources of gas supply.
The project in Jordan would involve the construction of an LNG terminal at Aqaba Port with an annual
throughput capacity of about 5 bcm. It would lease an FSRU (with a capacity of 127,000 to 170,000 cubic
meters) for storing and regasifying LNG. These facilities would be connected to the Jordan Gas
Transmission Pipeline, which is part of the AGP. The objective is to supplement gas supplies from Egypt.
It is also possible that, in future, gas from the LNG terminal might feed the AGP to supply gas to Syria
and Lebanon, thus making Jordan an energy hub. The project will be jointly developed by the Aqaba
Development Corporation (ADC)3 and Jordan’s Ministry of Energy and Mineral Resources (MERE). The
ADC has recently issued an announcement seeking expression of interest from qualified firms for the
construction of the new LNG terminal and plans to issue tenders to prequalified firms for a turnkey
implementation of the project.
The envisioned scheme falls within a PPP structure; the ADC may partner with the Government of Jordan
to form a project company, and to consider various financial structures. In a typical project finance
structure (as given in chapter 7), the project’s equity is contributed by the ADC and the government, and
the debt is mobilized from development partners and commercial banks. This structure also includes an
insurance instrument in support of private investment, and a guarantee instrument that can cover
government obligations such as gas offtake and gas price commitments.
The project in Lebanon would involve the the construction of an FSRU-type LNG import terminal located
1.7 km off the coast, near Beddawi, with an annual LNG capacity of 3.5 million tons (or 4.83 bcm of gas).
After regasification, gas would be conveyed by a 2.5-km-long pipeline to the gas terminal near the
Beddawi power plant. The government is separately pursuing the construction of a 173-km-long, 36-inch-
diameter coastal pipeline, partly on land and partly under the sea (called Gasyle 2) to transport the gas
from Beddawi to other existing and proposed power stations on the coast.
Based on the expressions of interest received in response to advertisements issued in early 2012, the
Ministry of Energy and Water (MoEW) prepared a short list of the qualified firms who will be invited to
submit bids for the project. Under this scheme the winning bidder would build, own, and operate (BOO)
the plant. It would also be responsible for receiving, unloading, storing, and regasifying LNG on a tolling
basis for delivery to the MoEW at the high-pressure outlet flange of the FSRU. The MoEW would be
responsible for procuring LNG supply to the terminal, and for delivery of the regasified output to the
power plants. As such, the MoEW would enter into a long-term terminal use agreement (TUA) with the
3 The ADC is the main development corporation for the Aqaba Special Economic Zone (ASEZ), a liberalized, low-
tax, duty-free, multisector economic development zone. The ADC is a private shareholding company, launched by
the Government of Jordan and the Aqaba Special Economic Zone Authority (ASEZA), to transform the ASEZ into a
global hub of business and leisure.

REGIONAL GAS TRADE PROJECTS IN ARAB COUNTRIES
xxiii
project company committing the MoEW to pay the monthly capacity reservation fee regardless of actual
usage, plus a monthly throughput fee for operating costs incurred for actual usage. The Government of
Lebanon would back the MoEW’s commitments.
The above arrangements fall into a PPP structure with an explicit separation of the private and public
sector roles. There are various methods of financing this project, and in chapter 7 a typical financing
structure is presented. Under this structure the private sector’s investment can be insured by an entity such
as the Multilateral Investment Guarantee Agency (MIGA) while a multilateral entity, for example, the
World Bank, may guarantee the obligations of the MoEW under the TUA.
Legal, Regulatory, and Contractual Issues
Analysis of gas sector reform (chapter 8) indicates that in most Arab countries that already import gas or
plan to begin doing so, imports are handled by state-owned oil-and-gas entities. Regulatory requirements
such as open access and transparent allocation of transmission capacity and pricing are not yet in place.
In the absence of these regulatory arrangements, the Arab Gas Pipeline (AGP) was structured based on
the principle of regulation by contract. This model is expected to apply to most potential gas import
projects until sector reforms are more advanced.
Gas pricing is the most significant contractual issue in structuring gas trade agreements in the Arab world.
The unrealistically low domestic gas prices create a substantial barrier to imports. Aside from the low
domestic gas price, negotiations between the sellers and buyers of natural gas in the Arab world have
become quite complex due to a wide gap in their expectations. Until a decade ago gas prices were
negotiated in the range of $1$2/mmbtu. This has suddenly changed to a range of $5$10/mmbtu owing
to a shift from perceived abundance of gas supply to perceived scarcity. Negotiation of the gas price
usually takes account of the seller’s economic cost of supply as well as the purchaser’s benefit from using
the gas (referred to as the netback value of gas). The economic cost of gas in the Arab countries varies
from $2/mmbtu to $6/mmbtu, while the netback value is $10$12/mmbtu. This wide range between the
cost of supply and the netback value often complicates cross-border negotiations. As a result, exporting
countries often refer to international gas prices as a benchmark for contract negotiation.
While world gas trade is extensive, it is not yet a truly globalized market with global price convergence.
In North America and the United Kingdom, natural gas prices are influenced by extensive gas-to-gas
competition. Spot market prices (the Henry Hub price in the United States and the National Balancing
Point price in the United Kingdom) tend to be lower compared with prices in other OECD countries. In
continental Europe, where gas import contracts are mostly indexed to oil or oil-product prices, the market
price of gas is often higher than in the United States and the United Kingdom. Finally, in Japan and other
LNG-importing countries of Asia, the gas price is the highest because of its indexation to oil and the
relatively longer transport distances. The IEA projections indicate that gas price differentials among
North America, Europe, and Asia (Japan) will continue, but the margins will narrow over time (table
ES6).
Arab countries in need of gas imports will have to compete with European and Asian purchasers to secure
their gas from countries within or outside the region. This will represent a significant shift from past
practices. It will also require a mechanism to ring-fence the import price from the very low domestic price
of gas.

REGIONAL GAS TRADE PROJECTS IN ARAB COUNTRIES
xxiv
Table ES6. Prices in $/mmbtu (2009 dollars) at Wholesale Level without Taxes
Market / year 2009 2015 2020 2025 2030 2035
North America 4.1 5.6 6.1 6.4 7.0 8.0
Europe 7.4 9.0 9.5 9.7 10.1 10.9
Japan 9.4 11.5 11.7 11.9 12.3 12.9
Source: IEA 2011.
Key Risks in Gas Trade Projects and Mitigation Measures
International gas trade projects are complex and capital intensive, and they face a wide range of risks, the
mitigation of which calls for a wide range of contractual arrangements (among lenders, equity stake
holders, constructors, operators, arbitration entities, and others) and specific processes (such as financing;
guarantees; insurance; arbitration; metering and settlement mechanisms; and regulations regarding
quality, safety, and environmental soundness). These arrangements and processes should identify and
allocate all project risks to various parties.
Table ES7 summarizes the most prevalent risks in international gas trade projects as well as appropriate
mitigation measures. These risks are technical, commercial, financial, and political. The technical risks
include a reliable quantity of supply over the contract period, the quality of the gas, and the reliability of
pipeline operation and maintenance. Commercial risks include breach of contract; nonadherence to the
agreed-upon price formula; some elements of the price formula becoming irrelevant owing to rapidly
changing world trade conditions (such as floor and ceiling prices); and demand-related risks in the context
of national, regional, and worldwide economic upheavals. Financial risks include cost overruns in line
construction and operation, lack of financiers’ interest in providing additional funds, exchange-rate risks,
and the inability of the buyer to pay for the gas supplied. Political risks include withdrawal of the support
of relevant governments, expropriation of project assets, transit country problems, security of the pipeline
facilities (against sabotage and conditions of local conflict, rebellion, insurgency, war, or warlike
conditions) in the selling, buying, and transit countries; enactment of laws (legal and regulatory risks);
and currency-transfer restrictions prejudicing the interests of the pipeline operation and gas trade. Political
risks also include dispute resolution arising from the lack of a neutral and fair judiciary and lack of
enforcement mechanisms for the decisions of courts and arbitration panels. Projects also face a range of
environmental and social risks against which adequate mitigation and protection arrangements must be
designed and implemented.

REGIONAL GAS TRADE PROJECTS IN ARAB COUNTRIES
xxv
Table ES7. Key Risks and Commonly Adopted Mitigation Measures
No. Risk Mitigation measures Key mitigation
agents
A. Technical risks
1. Supply risk—quantity and quality
Independent technical audit of the reserves and quality of gas.
Incorporation of “supply or pay” conditions in the firm supply portion of the contract (see item 6 also).
Independent technical auditors
2. Reliability of pipeline operation and maintenance
Management of the pipeline operation and maintenance, metering, and settlement functions by a competent and experienced developer or by independent and neutral management contractors.
Developer or management contractor
B. Commercial risks
3. Breach of contract Structure contracts with fairness to all parties. Support contracts with international treaties such as the Energy Charter Treaty (ECT). Include dispute resolution mechanisms and compensations for the breach of contract.
Governments
4. Nonadherence to the price formula
Contract to include dispute resolution mechanisms and compensation for such nonadherence.
5. Elements of price formula becoming irrelevant
Contract to provide for periodic renegotiation to realign such elements with current realities.
6. Demand risks Contract to divide the total supply into firm contracted quantities (90 percent), and approximately 10 percent as discretionary purchases or supplies at the same agreed price. Contract to provide for take-or-pay provisions for firm supply.
C. Financial risks
7. Cost overruns Firm fixed-price engineering, procurement and construction (EPC) contracts for construction and management contracts for operation and maintenance with agreed-upon escalation clauses.
8. Lack of additional funding risk Secure contingency funding requirements from relevant governments, covered by international financial institution (IFI) guarantees.
Governments, IFIs
9. Payment risk Guarantee by the government of the importing country and, if needed, partial risk and partial credit guarantees by IFIs, counterguaranteed by the relevant governments.
Governments, commercial banks, IFIs
10. Exchange rate risk Index payments to a commonly traded currency. Both parties may hedge against exchange rate losses using commercially available products.
D. Political risks
10. Withdrawal of government support
Governments to be signatories of treaties such as the ECT. Political risk guarantees from IFIs such as the Multilateral Investment Guarantee Agency (MIGA). Involvement of IFIs in projects. Contracts to specify compensation in the event of expropriation or other acts adversely affecting the project.
IFIs, MIGA
11. Expropriation of assets
12. Legal and regulatory risks
13. Pipeline security risk Intergovernmental treaty. Project supplementing state forces to provide security and political risk guarantees as above.
Governments, MIGA
14. Dispute resolution risk Agree to a dispute resolution mechanism of the ECT, provide for international arbitration in a third country under specified third-country laws, or use the International Center for Investment Disputes (ICSID) for arbitration.
ECT, ICSID, arbitration panels

REGIONAL GAS TRADE PROJECTS IN ARAB COUNTRIES
xxvi
No. Risk Mitigation measures Key mitigation
agents
E. Environmental and social risks
15. Various Carry out environmental impact assessments and social assessments, arrange for the implementation of mitigation mechanisms, and independently monitor compliance. Involve IFIs and make use of their safeguard procedures and mechanisms.
Environmental and social specialists, IFIs, NGOs, governments
Source: Partly based on Hamso, Mashayekhi, and Razavi 1994.
Note: ECT = Energy Charter Treaty; ICSID = International Center for Investment Disputes; IFI = international financial institution; MIGA = Multilateral Investment Guarantee Agency; NGO = nongovernmental organization.

Chapter 1. The Global Gas Market : Status and Outlook
Recent Developments and Current Situation
Over the past decade (2000–10) the world’s population grew at an average annual rate of about 1.2
percent, while its real gross domestic product (GDP) grew more quickly, at an annual rate of 3.8 percent.
Annual primary energy consumption growth during this period was 2.5 percent, while both natural gas
annual production and consumption grew somewhat more rapidly, at 2.8 percent. World natural gas
production increased from 2,413.4 billion cubic meters (bcm) in 2000 to 3,062.1 bcm in 2008 at an
average annual rate of about 3.0 percent, but declined sharply by 2.8 percent to 2,975.9 bcm in 2009
because of the worldwide economic crisis.4 Natural gas production bounced back to 3,178.2 bcm in
2010—an increase of 7.3 percent that more than made up for the decline in 2009. The key reasons for this
increase were: (i) increasing demand from emerging economies and developing countries, (ii) harsh
winters and hot summers in the northern hemisphere, and (iii) to some extent, lower gas prices. World
production increased further to 3,276.2 bcm in 2011.
The total volume of gas traded in the world in 2010 amounted to 975.2 bcm, consisting of 677.6 bcm of
trade through gas pipelines and 297.6 bcm (30.5 percent) of trade in the form of liquefied natural gas
(LNG). Natural gas trade in 2010 registered growth of 10.1 percent over the previous year, driven by the
strong growth of LNG trade (a 22.6 percent increase) compared with that of pipeline trade (5.4 percent
growth). Natural gas trade showed a slower growth rate, 4 percent, in 2011, while LNG trade grew by
10.1 percent; Qatar accounted for most of the increase. Pipeline trade grew by just 1.3 percent. (Global
LNG and piped-line gas trade flows in 2011 can be seen in figure 1.1.)
Production, consumption, exports, and imports were highly concentrated in the gas trade, even more than
in the oil trade. In 2008, for example, the top five producers (the Russian Federation, the United States,
Canada, the Islamic Republic of Iran, and Norway) accounted for 52 percent of world gas production.
Likewise, the top five consumers (the United States, Russia, Iran, Japan, and the United Kingdom)
accounted for 46 percent of total consumption. The top five exporters (Russia, Canada, Norway,
Netherlands, and Qatar) accounted for 55 percent of exports. In terms of LNG exports alone the top five
exporters (Qatar, Malaysia, Indonesia, Australia, and Nigeria) accounted for 62 percent of all exports. The
top five importers of LNG (Japan, Korea, Spain, Taipei, and France) accounted for 81 percent of global
imports. The top five importers of gas (the United States, Japan, Germany, Italy, and Ukraine) accounted
for 46 percent of global imports (IEA 2010a).
The world’s proven natural gas resources at the end of 2010 were estimated at 187.1 trillion cubic meters
(tcm), enough to last for 58.6 years at the current rate of annual production. These proven reserves had
increased significantly from the level of 125.7 tcm reported in 1990. The International Energy Agency
(IEA) estimates that all ultimately recoverable conventional gas reserves amount to 400 tcm, which would
last for 120 years at current rates of extraction. The IEA further estimates that there are considerable
reserves of ultimately recoverable unconventional gases, consisting of tight gas (84 tcm), shale gas
4 The consequent gas glut (defined as the difference between the world capacity for pipeline and LNG supply and
the actual traded volumes) was estimated by the International Energy Agency (IEA) at around 130 bcm in 2009.
This was expected to increase to about 200 bcm by 2011 and to decline thereafter (IEA 2010b).

REGIONAL GAS TRADE PROJECTS IN ARAB COUNTRIES
2
(204 tcm), and coal-bed-methane (118.7 tcm). Taking both unconventional and conventional gas reserves
into account, supply should last for 250 years at current rates of production (IEA 2011).
Figure 1.1 Global Pipeline Gas and LNG Trade Flows in 2010 (in bcm)
Source: BP 2011.
While world gas trade is extensive, it is not yet a truly globalized market characterized by global price
convergence. In the United Kingdom (National Balancing Point prices) and North America (Henry Hub
prices), there is extensive gas-to-gas competition, and average spot market prices tend to be lower. In
continental Europe (prices as reported by the German government) most imported supplies tend to be in
the form of long-term contracts with some form of indexation to oil or oil-product prices, and prices tend
to be somewhat higher. LNG export prices to Japan and other Asian nations tend to be high because of
oil-price indexation and relatively longer distances. There are thus four distinct price-differentiated
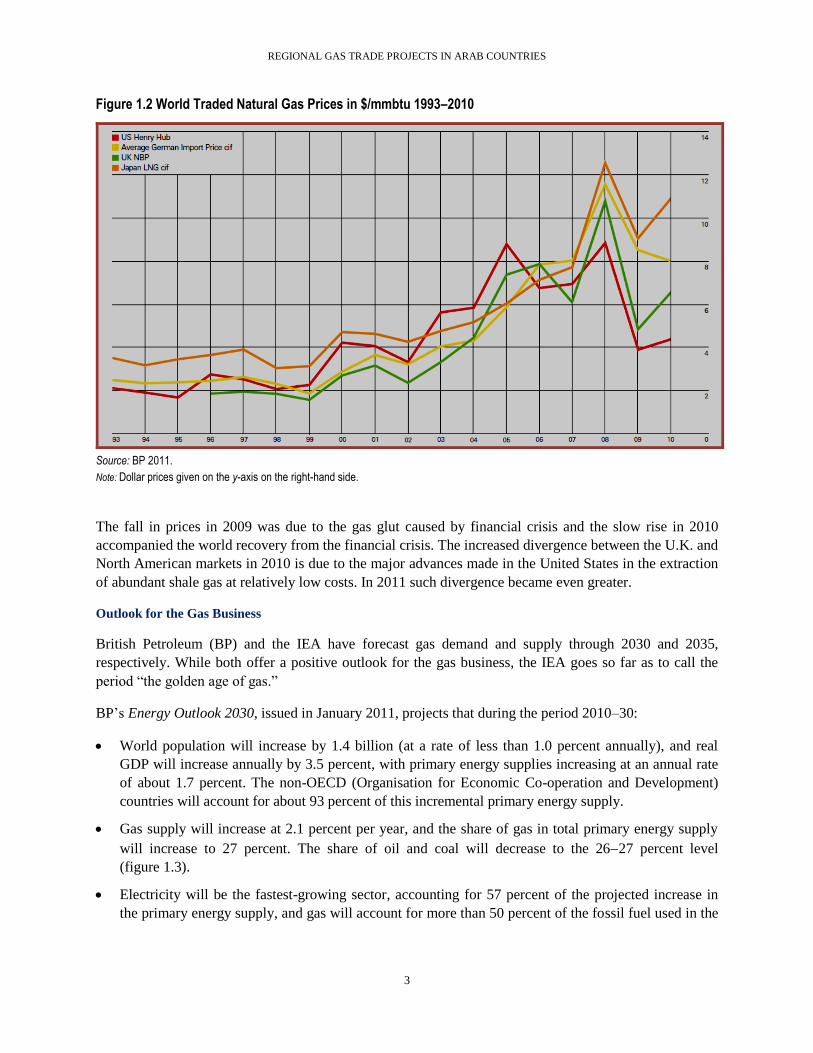
markets (for which price movements over the period 1993–2010 are presented in figure 1.2).
REGIONAL GAS TRADE PROJECTS IN ARAB COUNTRIES
3
Figure 1.2 World Traded Natural Gas Prices in $/mmbtu 1993–2010
Source: BP 2011.
Note: Dollar prices given on the y-axis on the right-hand side.
The fall in prices in 2009 was due to the gas glut caused by financial crisis and the slow rise in 2010
accompanied the world recovery from the financial crisis. The increased divergence between the U.K. and
North American markets in 2010 is due to the major advances made in the United States in the extraction
of abundant shale gas at relatively low costs. In 2011 such divergence became even greater.
Outlook for the Gas Business
British Petroleum (BP) and the IEA have forecast gas demand and supply through 2030 and 2035,
respectively. While both offer a positive outlook for the gas business, the IEA goes so far as to call the
period “the golden age of gas.”
BP’s Energy Outlook 2030, issued in January 2011, projects that during the period 2010–30:
World population will increase by 1.4 billion (at a rate of less than 1.0 percent annually), and real
GDP will increase annually by 3.5 percent, with primary energy supplies increasing at an annual rate
of about 1.7 percent. The non-OECD (Organisation for Economic Co-operation and Development)
countries will account for about 93 percent of this incremental primary energy supply.
Gas supply will increase at 2.1 percent per year, and the share of gas in total primary energy supply
will increase to 27 percent. The share of oil and coal will decrease to the 2627 percent level
(figure 1.3).
Electricity will be the fastest-growing sector, accounting for 57 percent of the projected increase in
the primary energy supply, and gas will account for more than 50 percent of the fossil fuel used in the

REGIONAL GAS TRADE PROJECTS IN ARAB COUNTRIES
4
power sector. Globally, the share of gas in electric power generation will rise from 20.5 percent to 22
percent.
World gas production over the next 20 years will increase at a rate of 2.1 percent per year, compared
with 2.4 percent over the past 20 years, and will reach about 450 billion cubic feet (bcf)/day, or 4.65
tcm in 2030.
A substantial portion of the incremental demand for gas will be from the non-OECD countries, and
the increase in demand from China and the other non-OECD Asian countries will be noteworthy
(figure 1.4).
The share of LNG in global gas supply will increase from 9 percent to 15 percent in the next 20 years.
LNG trade will grow at 4.4 percent per year, twice as fast as gas production (2.1 percent per year)—
from 30 bcf/day (or 310.2 bcm) in 2010 to 70 bcf/day (or 723.8 bcm) in 2030.
By 2030 shale gas and coal-bed methane will account for 57 percent of total gas production in North
America, and LNG imports will be negligible. The United States may even become an exporter of
LNG.
Led by Australia, increases in LNG exports will be highest in the Pacific Basin, followed by the
Atlantic Basin and the Middle East (figure 1.5).
Figure 1.3 World Production and Consumption of Natural Gas, 1990–2030 (bcf/day)
Source: BP 2011a.

REGIONAL GAS TRADE PROJECTS IN ARAB COUNTRIES
5
Figure 1.4 Gas Demand by Region, 1990–2030 Figure 1.5 LNG Exports by Basin, 1990–2030
Source: BP 2011a.
The IEA’s June 2011 special report, Are We Entering a Golden Age of Gas?, forecasts that during 2010–
35 gas use will rise by more than 50 percent and account for more than 25 percent of the world energy
demand by the end of the period. Such forecasts are greatly influenced by the tsunami-induced nuclear
disaster in Japan, the subsequent dampening of enthusiasm for nuclear power all over the world,5 and the
consequent increase in demand for gas (especially in China, Japan, and Asia), and also by the likely
increased availability of both conventional and unconventional gas in volumes sufficient to meet
incremental demand.
According to the IEA forecast, world primary energy demand will increase from 12,271 million tons of
oil equivalent (toe) in 2010 to 16,475 million toe in 2035, at an annual growth rate of 1.16 percent. The
share of gas will increase from 21 percent to 25 percent during the same period. Demand for gas will
increase from 3,149 bcm in 2008 to 5,132 bcm, an annual increase of 1.8 percent.
Power generation is and will continue to be by far the largest source of demand for gas throughout the
entire period. The sectoral composition of demand by 2035 is shown in table 1.1.
Table 1.1 Sectoral Composition of Gas Demand in 2035
Sector Gas demand in 2035 (bcm) Sectoral share (%)
Power generation 2,053 40.0
Building and agriculture 1,050 20.5
Industrial 1,000 19.5
Energy sector use, and use as feedstock 779 15.2
Transport 250 4.8
Total 5,132 100
Source: IEA 2011.
5 Germany has mothballed 7 gigawatts (GW) of its older nuclear plants. China and Thailand have suspended the
approval of new nuclear plants.

REGIONAL GAS TRADE PROJECTS IN ARAB COUNTRIES
6
World gas production is expected to grow from 3,167 bcm in 2008 to 4,019 bcm in 2020, an annual rate
of 2.0 percent, and then to 5,132 bcm by 2035 at a slightly lower annual rate of 1.6 percent. The share of
unconventional gas will increase from 12 percent in 2008 to 25 percent in 2035.6 Non-OECD countries
will contribute 85 percent of the incremental production.
Spurred on by the increasing availability of LNG and related infrastructure, the interregional gas trade is
expected to more than double during the period, to reach a level in excess of 1,000 bcm. Such traded gas
will account for 20 percent of world gas consumption in 2035. Interregional trade in gas will increase by
620 bcm during 2010–35, and this will consist of 330 bcm of pipeline gas and 290 bcm of gas in the form
of LNG. In 2035 the share of LNG in interregional trade will be 50 percent.7
North America will remain largely self-sufficient and is likely to be isolated from interregional trade. It
will enjoy relatively low prices, because of increased gas availability at lower production costs and the
pricing mechanism rooted in gas-to-gas competition. But such prices will not greatly affect prices in the
rest of the world. Instead, world prices will be shaped by sharply rising demand in Asia (China, Japan,
and India). Aided by innovations such as floating gas liquefaction facilities and floating regasification
facilities, as well as the increasing practice of stipulating minimum offtake volumes in LNG contracts, the
share of LNG trade in spot shipments is likely to increase. Import of LNG for meeting seasonal spikes in
demand will also become more prevalent. The projected price of natural gas is shown in table 1.2.
Table 1.2 Prices in $/mmbtu (2009 dollars) at Wholesale Level without Taxes
Market / Year 2009 2015 2020 2025 2030 2035
North America 4.1 5.6 6.1 6.4 7.0 8.0
Europe 7.4 9.0 9.5 9.7 10.1 10.9
Japan 9.4 11.5 11.7 11.9 12.3 12.9
Source: IEA 2011.
The IEA study indicates that the realization of these forecasts will depend on the policies of the non-
OECD countries in: (i) providing the legal and incentive framework to attract investments and promote
exploration and development of gas resources, (ii) adopting pricing reforms for domestic consumption to
enable prices to recover supply costs, and (iii) removing inefficient energy subsidies that seriously distort
rational resource allocation.
6 This will consist of shale gas (> 11 percent), coal-bed methane (7 percent), and tight gas (> 6 percent) produced in
North America, China, Russia, India, and Australia. 7 For purposes of the IEA analysis, interregional trade refers to trade among the following 11 major regions: OECD
North America, India, OECD Asia, China, OECD Europe, other Asia, Latin America, OECD Oceania, Africa,
Middle East, East Europe, and Eurasia. It does not include trade within regions. Thus, for example, considerable
trade among the United States, Canada, and Mexico is not included.

Chapter 2. The Role of Arab Countries in World Gas Markets
This report focuses on 16 Arab countries in the Middle East and North Africa (MENA) (figure 2.1).8
Together, these countries occupy a land area of about 11.06 million square kilometers and have a
population of 290.4 million. They play a significant role in the world natural gas market owing to the
large size of their proven gas reserves. Arab countries had total proven natural gas reserves of 54.3 trillion
cubic meters (tcm) (at the end of 2010), representing 29.02 percent of the total world proven reserves of
187.1 tcm. Qatar has the world’s third-largest proven gas reserves (after Russia and Iran), Saudi Arabia
has the fourth largest, and the United Arab Emirates (UAE) has the seventh largest (after Turkmenistan
and the United States).
Figure 2.1 The 16 Arab Countries Covered by This Report
The marketed gas production of the Arab countries in 2010 (excluding gas flared or reinjected for
enhanced oil recovery) amounted to 480 billion cubic meters (bcm), or 15.2 percent of world production.
Thus, their proven reserves are adequate to continue production at current annual rates for 113 years,
compared with the worldwide reserves-to-production ratio (RPR) of 58.6 years (table 2.1).
8 Morocco, Algeria, Tunisia, Libya, and the Arab Republic of Egypt in North Africa are generally grouped as
Maghreb countries. Jordan, the Syrian Arab Republic, Lebanon, and Iraq are grouped as Mashreq countries often
also including Egypt. Kuwait, Bahrain, Saudi Arabia, the United Arab Emirates (UAE), Qatar, Oman, and the
Republic of Yemen are grouped as Gulf countries, all of which except Yemen are members of the Gulf Cooperation
Council (GCC). Several members of the Arab League are not included in this analysis (Comoros, Djibouti,
Mauritania, Palestine, Somalia, and Sudan).

REGIONAL GAS TRADE PROJECTS IN ARAB COUNTRIES
8
Table 2.1 Proven Reserves and Production of Natural Gas in Arab Countries, 2010
Country Natural gas reserves
(bcm) (end 2010) Share in world reserves (%)
Production in 2010 (bcm)
Share in world production (%)
Reserves-to-production ratio (RPR) (years)
Morocco 1.54 — 0.04 0.00 38.50
Algeria 4,500.00 2.41 80.40 2.52 56.00
Tunisia 92.00 0.05 3.30 0.10 30.00
Libya 1,500.00 0.80 15.80 0.49 98.00
Egypt 2,200.00 1.18 61.30 1.92 36.00
Maghreb subtotal 8,293.54 4.43 160.84 5.04 51.56
Iraq 3,200.00 1.71 1.30 0.04 2,461.54
Jordan 6.20 0.00 0.30 0.01 20.67
Syria 300.00 0.16 7.80 0.24 38.46
Lebanon 0.00 0.00 0.00 0.00 0.00
Mashreq subtotal 3,506.20 1.87 9.40 0.29 373.00
Bahrain 200.00 0.11 13.10 0.41 16.70
Kuwait 1,800.00 0.96 11.60 0.36 155.00
Saudi Arabia 8,000.00 4.28 83.90 2.63 95.50
Qatar 25,300.00 13.52 116.70 3.65 216.80
UAE 6,000.00 3.21 51.00 1.60 117.65
Oman 700.00 0.37 27.10 0.85 25.83
Yemen 500.00 0.27 6.20 0.19 80.65
Gulf subtotal 42,500.00 22.72 309.60 9.70 137.27
Grand total 54,299.74 29.02 479.84 15.03 113.16
World 187,100.00 100.00 3,193.30 100.00 58.59
Memo
Iran 29,600.00 15.82 138.50 4.30 213.72
Source: BP 2011. Production data for Morocco relates to 2009. Data for Tunisia, Morocco, and Jordan are from Fattouh and Stern (2011) and APRC (2011).
Note: If Iraq were to achieve its annual production target of about 50 bcm by 2020, its RPR would become comparable to others. Similarly if Lebanon were to succeed in its efforts to find and produce gas in the offshore areas, its RPR would also change.
The Arab countries consumed 313.12 bcm of natural gas in 2010, or 9.9 percent of the world’s
consumption. Their consumption growth was more than 2.5 times that of world consumption. During
2000–10 their gas consumption increased by nearly 80 percent, much greater than the 31.4 percent
increase in world consumption (table 2.2).

REGIONAL GAS TRADE PROJECTS IN ARAB COUNTRIES
9
Table 2.2 Natural Gas Consumption in Arab Countries, 2000–10 (bcm, excluding flaring, venting, reinjection,
and exports)
Country 2000 2005 2010
Compound annual growth rate (CAGR)
200010 (%)
Share in world consumption, 2010
(%)
Morocco 0.07 0.54 0.90 29.0 0.03
Algeria 19.80 23.20 28.90 3.9 0.90
Tunisia 3.72 5.00 5.30 3.6 0.17
Libya 4.81 5.94 6.90 3.7 0.22
Egypt 20.00 31.60 45.10 8.5 1.40
Subtotal 48.39 66.28 87.10 6.1 2.71
Iraq 2.90 1.50 1.30 -7.7 0.04
Jordan 0.29 1.60 4.20 30.6 0.13
Syria 5.70 6.10 8.50 4.1 0.27
Lebanon 0.00 0.00 0.15 — 0.00
Subtotal 8.89 9.20 14.15 5.2 0.45
Bahrain 8.80 10.70 13.10 4.6 0.41
Kuwait 9.60 12.20 14.40 4.1 0.45
Saudi Arabia 49.80 71.20 83.90 5.4 2.65
Qatar 9.70 18.70 20.40 7.7 0.64
UAE 31.40 42.10 60.50 6.8 1.91
Oman 5.70 9.40 17.51 11.9 0.55
Yemen 0.00 0.00 0.76 — 0.02
Subtotal 115.00 164.30 210.57 6.3 6.64
Grand total 172.28 239.78 311.82 6.2 9.84
World 2,411.70 2,781.80 3,169.00 2.8 100.00
Memo
Iran 62.90 105.00 136.90 8.08 4.32
Sources: BP 2011b; Fattouh and Stern 2011; APRC 2011; EIA undated; Mott MacDonald 2010.
With a total gas export volume of 200.48 bcm in 2010, the Arab countries commanded a 20.6 percent
share of world exports of natural gas. Their share in exports by pipeline was 10.4 percent, far below their
44 percent share of liquefied natural gas (LNG) exports. Qatar, in fact, was the world’s largest LNG
exporter, and the Middle East has become the world’s largest LNG exporting region, ahead of the Pacific
Basin.
The gas import volume of Arab countries in 2010 was a modest 26.78 bcm, 2.7 percent of world imports
of natural gas. Their share in LNG imports was insignificant at less than 1 percent, and pipeline imports
all occurred within the Arab world (table 2.3).
Of the 16 Arab countries, six were net exporters (Qatar, Algeria, Egypt, Libya, Oman, and Yemen), three
had neither imports nor exports (Saudi Arabia, Bahrain, and Iraq), and the remaining seven were net
importers (the UAE, Kuwait, Jordan, Syria, Tunisia, Morocco, and Lebanon). Of these seven, the UAE
alone had both exports and imports, the latter exceeding the former; the other six had no exports at all.

REGIONAL GAS TRADE PROJECTS IN ARAB COUNTRIES
10
Table 2.3 Natural Gas Exports and Imports, 2010 (bcm)
Country Exports Imports
Net trade Pipeline LNG Total Pipeline LNG Total
Morocco 0.00 0.00 0.00 0.50 0.00 0.50 -0.50
Algeria 36.48 19.31 55.79 0.00 0.00 0.00 55.79
Tunisia 0.00 0.00 0.00 1.25 0.00 1.25 -1.25
Libya 9.41 0.34 9.75 0.00 0.00 0.00 9.75
Egypt 5.46 9.71 15.17 0.00 0.00 0.00 15.17
Subtotal 51.35 29.36 80.71 1.75 0.00 1.75 78.96
Iraq 0.00 0.00 0.00 0.00 0.00 0.00 0.00
Jordan 0.00 0.00 0.00 2.10 0.00 2.10 -2.10
Syria 0.00 0.00 0.00 0.69 0.00 0.69 -0.69
Lebanon 0.00 0.00 0.00 0.15 0.00 0.15 -0.15
Subtotal 0.00 0.00 0.00 2.94 0.00 2.94 -2.94
Bahrain 0.00 0.00 0.00 0.00 0.00 0.00 0.00
Kuwait 0.00 0.00 0.00 0.00 2.78 2.78 -2.78
Saudi Arabia 0.00 0.00 0.00 0.00 0.00 0.00 0.00
Qatar 19.15 75.75 94.90 0.00 0.00 0.00 94.90
UAE 0.00 7.90 7.90 17.25 0.16 17.41 -9.51
Oman 0.00 11.49 11.49 1.90 0.00 1.90 9.59
Yemen 0.00 5.48 5.48 0.00 0.00 0.00 5.48
Subtotal 19.15 100.62 119.77 19.15 2.94 22.09 97.68
Grand Total 70.50 129.98 200.48 23.84 2.94 26.78 173.70
World 677.59 297.63 975.22 677.59 297.63 975.22 0.00
Share of Arab countries in the world trade (%) 10.40 43.67 20.56 3.52 0.99 2.75 17.81
Memo 0.00
Iran 8.42 0.00 8.42 6.85 0.00 6.85 1.57
Sources: BP 2011b; Fattouh and Stern 2011; APRC 2011.
There are various views about the relative position of Arab countries (and those of the Middle East in
general) in the global gas market. Fattouh and Stern (2011) question the validity of the common
assumption that the MENA countries will become an ever-increasing source of internationally traded gas.
They argue that the domestic demand for gas has increased very rapidly in the Arab countries for three
reasons:
The domestic supply prices have been far below the economic costs, thus promoting inefficient and
excessive use of gas.
Governments have followed a policy of displacing liquid fuels with gas for power generation and
water desalination.
Governments have energy-intensive industries such as aluminum, steel, petrochemicals, and
fertilizers that consume gas as feedstock.

REGIONAL GAS TRADE PROJECTS IN ARAB COUNTRIES
11
Meanwhile, domestic shortages of gas, resulting in electricity shortages, are seriously eroding public
support for continued export of gas to the rest of the world (as in the case of Egypt).
Fattouh and Stern further argue that the Arab countries have nearly exhausted their low-cost gas
resources. Since incremental production is technically more difficult and far more expensive, production
increases in the medium term will be modest, despite the availability of sizeable resources. Such
conditions are not conducive to these countries continuing to play a major role in the world gas trade.
Other observers, taking a long-term view, present a much more optimistic future for the Arab gas business
as discussed below
Figure 2.2 Sectoral Demand Growth in the Middle East (in bcf/day)
Source: BP 2011a.
The BP Energy Outlook 2030 (2011a) projects that while world production of natural gas will increase
from 3,193.9 bcm in 2010 to 4,653 bcm in 2030, the share of the Middle East (including Iran) in the
world production of gas will increase from 15 percent in 2010 to 19 percent in 2030.9 The share of the
Middle East in world gas consumption will increase from 12 percent to 17 percent during this period. Gas
demand growth in the Middle East will be 3.9 percent per year, the second-fastest growth after non-
OECD Asia. Demand growth in the Middle East will be driven mainly by power generation needs,
followed by industrial needs, and other requirements (figure 2.2). Displacement of oil burning accounts
for 44 percent of the increase in the region’s gas consumption. Export growth in LNG from the Middle
East will slow after 2020, as import needs will become greater than production growth.
The IEA (2011) projects that, during 2008–35, Middle East gas demand will grow from 335 bcm to 632
bcm at an annual rate of 2.4 percent, much faster than world demand growth of 1.8 percent (from 3,149
bcm to 5,132 bcm). Similarly, gas production in the Middle East will grow from 343 bcm to 917 bcm, an
9 The term Middle East, as used in the BP and IEA reports, includes all seven GCC countries and all four Mashreq
countries as well as Iran, but excludes Algeria, Morocco, Tunisia, Libya, and Egypt (which are classified as African
countries, along with Nigeria and others).

REGIONAL GAS TRADE PROJECTS IN ARAB COUNTRIES
12
annual rate of 3.2 percent, versus growth in world gas production of 1.8 percent per year (from 3,167 bcm
to 5,132 bcm). Middle East gas exports to other regions10
will thus grow from 85 bcm (2010) to 290 bcm
(2035). The cost of production in the Middle East, which has thus far been low, will tend to rise because
of the need to access gas that is more difficult to recover (for example, tight gas at great depths, highly
sour gas, and offshore gas).
International gas trade (especially in LNG) was volatile in the past few years. From being a sellers’
market in 2007 and 2008, LNG trade became a buyers’ market in 2009, with a significant glut of LNG in
the world caused by worldwide recession (affecting European demand in particular). The condition was
exacerbated by the development of large volumes of relatively inexpensive shale gas in the United States,
practically removing North America as a major importer of LNG from other parts of the world. Though
the economic recovery is taking place slowly all over the world, it will take a few more years to fully
eliminate the LNG glut. The clearing process is aided to some extent by the increased demand from Japan
(caused by the shutdown of many nuclear power plants) and by growing demand from China and India,
but increased supplies from Australia could meet a good portion of that demand.
The times thus appear propitious for the resource-rich Arab countries to focus their attention on
substantially increasing the low volume of gas trade within the region. They need to do this even as they
prepare to meet world demand as it revives over the medium term. This report seeks to identify potential
opportunities for such regional gas trade initiatives, and promote their realization.
10
It is important to remember the difference between world trade and interregional world trade, from which trade
within the region is excluded.
Chapter 3. Gas Supply Potentials and Constraints in the Arab Countries
The total proven gas reserves of the 16 Arab countries at the end of 2010 amounted to 54.3 trillion cubic
meters (tcm), representing 29.02 percent of the total world proven reserves. Of this nearly half is found in
Qatar and nearly 97 percent in eight countries: Qatar, Saudi Arabia, the United Arab Emirates (UAE),
Algeria, Iraq, Egypt, Kuwait, and Libya. In the remaining countries (Oman, Jordan, Yemen, Syria,
Bahrain, Tunisia, Morocco, and Lebanon) reserves are less than 1.0 tcm. The reserves of Morocco and
Lebanon are statistically insignificant.
Gas production of the 16 countries in 2010 amounted to 480 billion cubic meters (bcm), or 15.03 percent
of world production. Qatar accounted for about 24 percent of the total production of the 16 Arab
countries. Seven countries (Qatar, Saudi Arabia, Algeria, Egypt, the UAE, Oman, and Libya) produced 92
percent of the total output. In six countries (Bahrain, Kuwait, Syria, Yemen, Tunisia, and Iraq) production
ranged from 13 bcm to 1.3 bcm. Production in Jordan, Morocco, and Lebanon (being substantially lower
than 1.0 bcm) was modest to insignificant
The outlook for increased gas production—evaluated in each country in terms of reserves, past trends in
production, institutions, exploration and production contracts, and the involvement of international oil
companies—has to be tempered by several constraints faced in the Arab world, such as: (i) the need for
reinjection of a large portion of gross gas production for enhanced oil recovery from aging oil wells; (ii)
limits to increases in associated gas production related to oil-production quotas imposed by the
Organization of the Petroleum Exporting Countries (OPEC); (iii) the exhaustion of easy and inexpensive
reserves; and (iv) the consequent high cost structure of incremental gas production, especially for highly
sour gases or gases occurring at great depths or in tight gas or shale gas formations. Further, most
countries have so far dealt with gas development on the basis of laws, contract arrangements, fiscal terms,
incentive structures, and industry practices that evolved for oil production; only in the past few years are
some countries trying to develop arrangements specific to the needs of the natural gas industry. Gas prices
and electricity prices to domestic consumers in almost all countries are well below the cost of supply, a
serious constraint to increasing production for domestic use. Finally, the ability to make contract
decisions transparently and in a timely manner varies across countries, widely affecting the increases in
production levels.
Countries with High Potential to Increase Supply
Five of the sixteen countries—Qatar, Iraq, Libya, Saudi Arabia, and the UAE—appear to have significant
potential to increase production in the medium to long term, given their reserves and annual production.
Qatar
Qatar has proven reserves of 25.37 tcm and an RPR well in excess of 200 years. It has the world’s largest
nonassociated gas field with relatively modest production costs. Marketed gas production has increased
from 23.7 bcm in 2000 to 116.7 bcm in 2010 at a compounded annual rate of 17.3 percent.11
11
Marketed production increased further to 146.8 bcm in 2011.
REGIONAL GAS TRADE PROJECTS IN ARAB COUNTRIES
14
In 2009, for example, marketed production was about 87 percent of the gross raw gas production, the
difference being accounted for by flaring, reinjection, and shrinkage. But production increases in the past
were perceived to have been far too rapid, and in March 2005 the government imposed a moratorium on
production for new exports, pending a comprehensive review of reservoir operations to ensure their health
in the long term. This moratorium has been periodically extended and is expected to last until 2014, by
which time all of the production projects already approved would be in operation. The last of these
projects (Barzan) in the North Gas Field is scheduled for completion by 2013, but the impact of this
project may not be fully ascertained until 2015. When all the approved production projects and gas-
processing projects currently in progress are completed, the industry expects that annual gas production
will have increased to 240 bcm. According to International Energy Agency (IEA) projections, the
marketed gas production in Qatar will increase to 182 bcm by 2020, to 238 bcm by 2030, and 260 bcm by
2035 (IEA 2011). Institutional and contracting arrangements in Qatar have proven to be conducive to
rapid expansion in the past. Increases in production for meeting rising domestic demand are likely, while
increases in production for export will depend on the market conditions for liquefied natural gas (LNG)
and strategic and price considerations for pipeline exports.
Iraq
Iraq’s proven oil reserves, estimated at 115 billion barrels at the end of 2010, were the fourth largest in
the world and represented 8.3 percent of the world’s total oil reserves. Its proven gas reserves at the end
of 2010 were 3.2 tcm, or about 1.7 percent of the world’s gas reserves (BP 2011). Its RPR for gas is well
over a few hundred years at the current low level of production. More than 80 percent of gas reserves are
in the form of associated gas, and thus development depends on the rate of development of oil production.
More than 88 percent of the associated gas reserves are in the southern oil fields; the remaining 12 percent
are in the northern and central oil fields. Much of the free gas occurs in the Kurdistan area and some of it
in the Akkas field in the western province bordering Syria. In addition, Iraq is believed to have probable
reserves of 4.5 tcm of free gas and 3.0 tcm of associated gas. It has further been estimated that Iraq has
undiscovered free gas reserves of 4.6 tcm and an additional 4.65 tcm of associated gas (Fattouh and Stern
2011, chapter 7).
Currently, two-thirds of the total associated gas production is probably flared. Iraq’s volume of flaring
(estimated at about 8 to 10 bcm) is believed to be the third largest in the world, after Russia and Nigeria.
In the short to medium term, reduction in flaring by constructing gas-gathering and -processing systems is
the most practical option, since the OPEC reported a gross production level of greater than 16 bcm in
2010, when marketed gas was only 1.3 bcm.
The Iraqi government is planning an aggressive expansion of oil production, which would also add to the
production of associated gas. The plan includes significant investments in gathering the flared gas. Apart
from arranging for the revival of oil production in the short term, the Iraqi government has already started
focusing on the development of gas fields and, after a third round of bidding conducted in 2010,
concluded, in June 2011, 20-year technical service contracts for the development of three nonassociated
gas fields at Akkas, Mansuriya, and Sibba (with a total annual production capability of about 317 bcm).
The fourth round of bidding for exploration scheduled for 2012 would cover 12 blocks, 7 of which would
be for nonassociated gas. Further, the government is reported to have signed, on July 12, 2011, a final
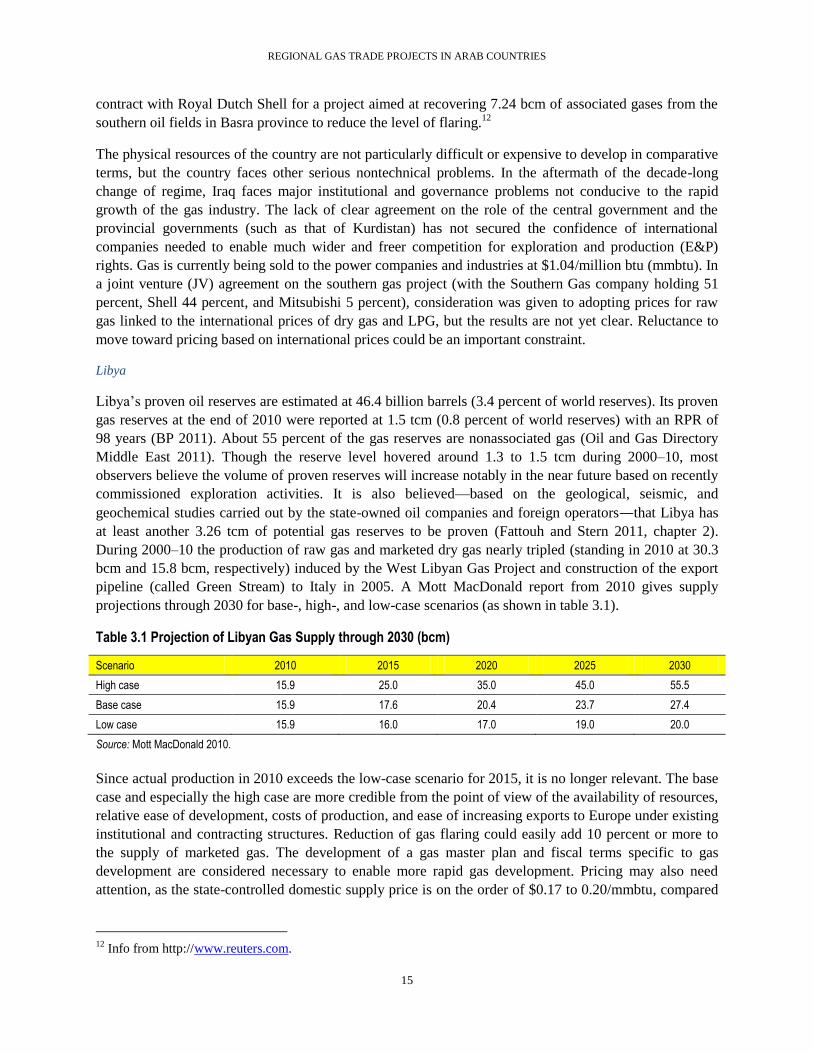
REGIONAL GAS TRADE PROJECTS IN ARAB COUNTRIES
15
contract with Royal Dutch Shell for a project aimed at recovering 7.24 bcm of associated gases from the
southern oil fields in Basra province to reduce the level of flaring.12
The physical resources of the country are not particularly difficult or expensive to develop in comparative
terms, but the country faces other serious nontechnical problems. In the aftermath of the decade-long
change of regime, Iraq faces major institutional and governance problems not conducive to the rapid
growth of the gas industry. The lack of clear agreement on the role of the central government and the
provincial governments (such as that of Kurdistan) has not secured the confidence of international
companies needed to enable much wider and freer competition for exploration and production (E&P)
rights. Gas is currently being sold to the power companies and industries at $1.04/million btu (mmbtu). In
a joint venture (JV) agreement on the southern gas project (with the Southern Gas company holding 51
percent, Shell 44 percent, and Mitsubishi 5 percent), consideration was given to adopting prices for raw
gas linked to the international prices of dry gas and LPG, but the results are not yet clear. Reluctance to
move toward pricing based on international prices could be an important constraint.
Libya
Libya’s proven oil reserves are estimated at 46.4 billion barrels (3.4 percent of world reserves). Its proven
gas reserves at the end of 2010 were reported at 1.5 tcm (0.8 percent of world reserves) with an RPR of
98 years (BP 2011). About 55 percent of the gas reserves are nonassociated gas (Oil and Gas Directory
Middle East 2011). Though the reserve level hovered around 1.3 to 1.5 tcm during 2000–10, most
observers believe the volume of proven reserves will increase notably in the near future based on recently
commissioned exploration activities. It is also believed—based on the geological, seismic, and
geochemical studies carried out by the state-owned oil companies and foreign operators—that Libya has
at least another 3.26 tcm of potential gas reserves to be proven (Fattouh and Stern 2011, chapter 2).
During 2000–10 the production of raw gas and marketed dry gas nearly tripled (standing in 2010 at 30.3
bcm and 15.8 bcm, respectively) induced by the West Libyan Gas Project and construction of the export
pipeline (called Green Stream) to Italy in 2005. A Mott MacDonald report from 2010 gives supply
projections through 2030 for base-, high-, and low-case scenarios (as shown in table 3.1).
Table 3.1 Projection of Libyan Gas Supply through 2030 (bcm)
Scenario 2010 2015 2020 2025 2030
High case 15.9 25.0 35.0 45.0 55.5
Base case 15.9 17.6 20.4 23.7 27.4
Low case 15.9 16.0 17.0 19.0 20.0
Source: Mott MacDonald 2010.
Since actual production in 2010 exceeds the low-case scenario for 2015, it is no longer relevant. The base
case and especially the high case are more credible from the point of view of the availability of resources,
relative ease of development, costs of production, and ease of increasing exports to Europe under existing
institutional and contracting structures. Reduction of gas flaring could easily add 10 percent or more to
the supply of marketed gas. The development of a gas master plan and fiscal terms specific to gas
development are considered necessary to enable more rapid gas development. Pricing may also need
attention, as the state-controlled domestic supply price is on the order of $0.17 to 0.20/mmbtu, compared
12
Info from http://www.reuters.com.

REGIONAL GAS TRADE PROJECTS IN ARAB COUNTRIES
16
with European CIF13
prices of $12.61/mmbtu, a major constraint on the production of gas for domestic
use. Finally, following the recent upheavals and regime change, some semblance of orderly governance
must return before much progress can be made in the oil and gas sector.
Saudi Arabia
Saudi Arabia has the world’s largest proven oil reserves, reported at 264.5 billion barrels at the end of
2010 (19.1 percent of world reserves), with an RPR of about 72.4 years. Its proven natural gas reserves
were reported to be 8,019 bcm at the end of 2010 (4.3 percent of world reserves), with an RPR of at least
95 years. The kingdom has the fourth-largest gas reserves after Russia, Iran, and Qatar. About 50 to 60
percent of the natural gas in Saudi Arabia is associated, and production is linked to oil production, subject
to the OPEC quota. Of the remaining (nonassociated) reserves, about 75 percent is sour gas (or high-
sulfur gas) or is found in tight gas formations. Only 25 percent of the nonassociated gas reserves are
relatively easy to develop. But proven reserves have been increasing gradually, and in the past two years
new reserves of about 449 bcm have been added. The U.S. Geological Survey (USGS) believes that Saudi
Arabia may have 19 tcm of undiscovered gas. Aramco, the state-owned national oil company, estimates
that only 15 percent of the country’s reserves have been adequately explored for gas so far. Saudi
authorities are following a plan to increase proven reserves by at least 140 bcm every year to match
envisaged annual production.
Marketed production of gas increased from 53.7 bcm in 2001 to 83.9 bcm in 2010, at a compound annual
growth rate (CAGR) of 5.1 percent. Marketed production increased further to 99.2 bcm in 2011. Since gas
flaring has been practically eliminated and gas use for reinjection in oil wells is also low, marketed
production of gas is often as high as 90 percent of the gross raw gas production. Efforts to explore and
produce gas from the kingdom’s onshore “Empty Quarter” (with 70 to 300 bcm) have not been very
successful so far, and production may not occur before 2015. Aramco is expecting to get additional
associated gas from the Khursaniyyah and Manifa oil fields by 2014. Additional nonassociated gas is
likely to come from the Karan offshore gas fields (18 bcm of sour gas by 2012 at around $3.50/mmbtu),
and the Arabiyyah, Hasbah, and Hawwiyyah fields (10 bcm at a cost of around $5.50 per mmbtu). Saudi
authorities plan to expand raw gas production from about 90 bcm in 2009 to 134 bcm by 2020. This
would imply a marketed gas production level of about 120 bcm. The IEA estimates that Saudi Arabia’s
annual marketed gas production will increase to 125 bcm by 2030 and to 139 bcm by 2035 (IEA 2011).
Since Saudi annual oil production is unlikely to exceed the current level of 10 billion barrels per day for a
variety of reasons (including OPEC quotas), associated gas production will also be limited. Development
of free gas resources involves dealing with highly sour gas or gas in tight gas formations at great depths,
which are expensive to develop and produce compared with the costs of existing supply. Since all
incremental gas production would be consumed within the country, gas supply prices for domestic
consumers, which currently stand at $0.75 per mmbtu, need to be adjusted upward to sustain supplies in
the context of rising production costs.
United Arab Emirates
The UAE’s proven natural gas reserve at the end of 2010 was reported at 6 tcm, or 3.2 percent of world
reserves. The emirates have the seventh-largest reserve in the world, with an RPR in excess of 100 years.
13
Cost, insurance, and freight.

REGIONAL GAS TRADE PROJECTS IN ARAB COUNTRIES
17
More than 94 percent of the country’s oil and gas reserves are located in Abu Dhabi, with the small
remainder in the other emirates (Sharjah, Dubai, and Ras al-Khaimah).
Much of the gas in the UAE is associated and, therefore, the OPEC oil production quota acts as a
constraint to increased gas production. Also, a large percentage of raw gas production has been used for
reinjection in oil wells to enable enhanced oil recovery. That percentage stood at 28 percent in 2010 and
is expected to grow further. Thus marketed gas production increased at a very slow annual rate of 1.43
percent, from 44.9 bcm in 2001 to 51.0 bcm in 2010, and further to 51.7 bcm in 2011.
The government accords a high priority and allocates considerable funds to exploration and production of
free gas, which, in the UAE, tends to be very sour and expensive to produce and process. Some of the
major projects being pursued are the: (i) Onshore Gas Development III Project (12 bcm/year), (ii) Asab
Gas Development Project (7.8 bcm/year), (iii) Habshan-5 project (10.3 bcm for enhanced oil recovery and
10.3 bcm for the domestic market), and (iv) Hail Gas Development Project in the offshore field of Hail
(with sour gas) in shallow waters (5.18 bcm/year).
In addition, the Shah Gas Development Project for the production of 10.32 bcm of raw gas from the
onshore Shah Gas field of Abu Dhabi is being implemented in partnership with Occidental Petroleum,
which holds a 40 percent stake. The gas from this field is highly sour, with 23 percent hydrogen sulfide
and 10 percent carbon dioxide. After processing, the anticipated output by 2014 will consist of 5.18 bcm
of dry gas/year in addition to sulfur (9,090 tons/day), condensates (50,000 barrels/day), and gas liquids
(4,400 tons/day). The gas is estimated to cost about $5/mmbtu. Further avenues for increasing domestic
supply include efforts to reduce gas flaring, boosting supply by 1.0 bcm/year or more, and to lower the
amount of gas used for enhanced oil recovery by resorting to water, nitrogen, or carbon dioxide injection
as technology progresses. This could release upwards of 18 to 20 bcm for domestic consumption. Some
efforts in this direction are already being made.
It is projected that the production of marketed gas will increase from 51 bcm in 2010 to 65 bcm by 2015
and to 78 bcm by 2020. Most of the incremental production of gas is going to be expensive, costing
around $5/mmbtu or more.
Natural gas is supplied for domestic consumption at a price below $1/mmbtu, whereas gas imports
through the Dolphin Pipeline cost $1.5/mmbtu and LNG imports cost upwards of $5$6/mmbtu. The
UAE’s own LNG exports (both under contracts and in spot markets) fetch even better prices. Incremental
production of domestic gas is likely to cost more than $5/mmbtu. Under these circumstances, price
reforms to ensure that domestic gas and electricity prices reflect the true cost of supply are key
components of both demand management and supply augmentation.
The production outlook in the five countries with high prospects is summarized in table 3.2.

REGIONAL GAS TRADE PROJECTS IN ARAB COUNTRIES
18
Table 3.2 Outlook for Production Increases in Five Countries with High Prospects
Country Proven gas
reserves 2010 (bcm)
Reserve-to-production ratio
(years)
Marketed gas production 2010
(bcm) Production forecast (bcm) Remarks
Qatar 25,370 >200 116.7 182 bcm (2020),
238 bcm (2030)
Moratorium on production for new exports until 2014.
Iraq 3,200 >200 1.37 bcm 54.81 bcm (2020) 80.65
bcm (2030) 9,200 bcm of gas yet to be discovered;
security problems.
Libya 1,500 98 15.8 35 bcm (2020),
55.5 bcm (2030)
3,200 bcm of additional potential reserves; security issues.
Saudi Arabia
8,019 95 83.9
120 bcm (2020) government
125 bcm (2030)
Highly sour free gas, expensive to produce.
UAE 6,000 >100 51 65 bcm (2015)
78 bcm (2020) Highly sour and expensive.
Source: IEA 2011; Mott MacDonald 2010; Fattouh and Stern 2011.
Note: There is considerable uncertainty regarding the actual level of marketed production in 2010 in Iraq.
Countries with Some Potential to Increase Supply
Four countries—Algeria, Egypt, Kuwait, and Oman—appear to have some potential to increase gas
supply. Except for Kuwait, however, they have relatively low RPRs.
Algeria
Algeria’s proven gas reserves at the end of 2010 were 4.5 tcm—the fifth largest among the countries of
the Middle East and North Africa (MENA)—with an RPR of 56 years. Most of the reserves are associated
gas. Additional gas resources yet to be discovered are estimated by the U.S. Geological Survey (USGS) at
another 1.0 tcm. Much of these are believed to be tight gas, with a high percentage of carbon dioxide. ENI
of Italy is cooperating with Algeria to locate unconventional gas (especially shale gas) in Algeria (APRC
2011). But the U.S. Energy Information Administration (EIA 2011) finds that the technically recoverable
reserve of shale gas is only 231 tcf or 6.54 tcm. The marketed volume of gas stagnated during the decade
in the range of 8088 bcm, declining to 78 bcm in 2011. Of the gross production, nearly 50 percent goes
for reinjection for enhanced oil recovery. Based on the projects on hand, production is expected to
increase at 8 percent per year during 2014–18, reaching a plateau of 11520 bcm in the early 2020s
before gradually declining. This is somewhat in between the base-case and high-case projections made by
Mott MacDonald (2010) for Algeria (table 3.3). Further increases in production will have to await
developments related to the production of unconventional gas (such as tight gas and shale gas).
Institutional and contracting arrangements have proven adequate for successful gas business in the past
decade. Low domestic gas prices ($0.50 per mmbtu indexed to exchange rates and inflation rates) could
be a constraint on gas production for domestic use.
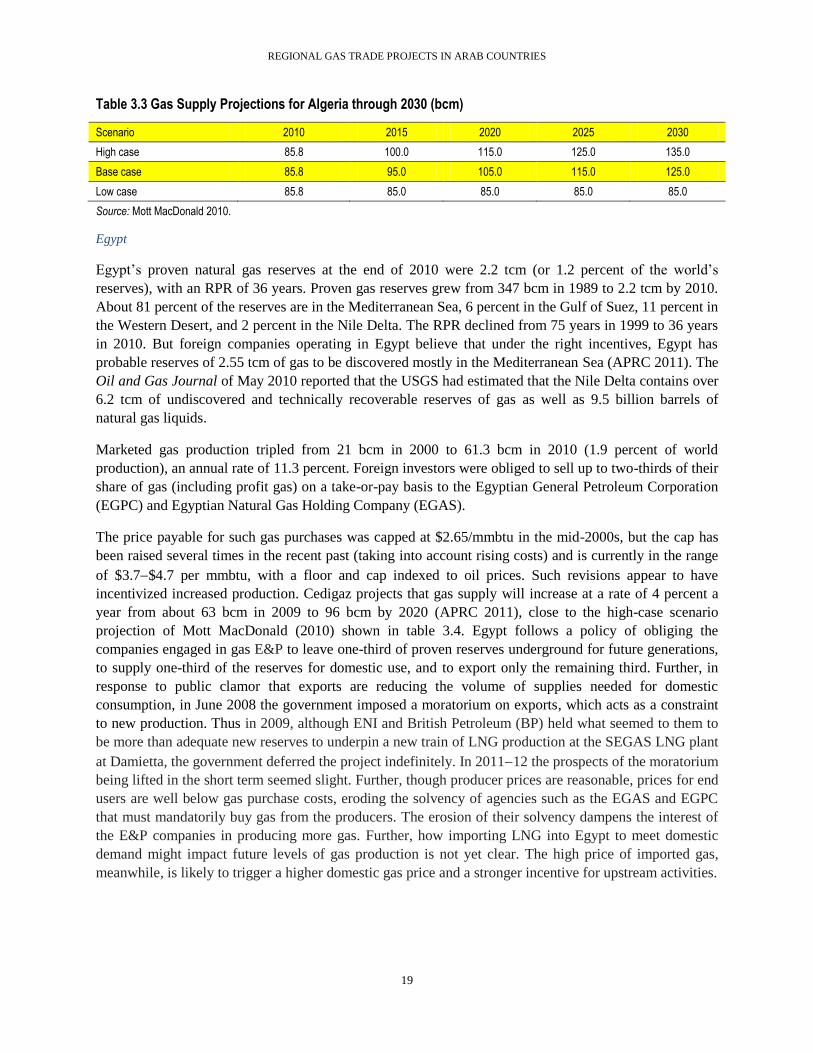
REGIONAL GAS TRADE PROJECTS IN ARAB COUNTRIES
19
Table 3.3 Gas Supply Projections for Algeria through 2030 (bcm)
Scenario 2010 2015 2020 2025 2030
High case 85.8 100.0 115.0 125.0 135.0
Base case 85.8 95.0 105.0 115.0 125.0
Low case 85.8 85.0 85.0 85.0 85.0
Source: Mott MacDonald 2010.
Egypt
Egypt’s proven natural gas reserves at the end of 2010 were 2.2 tcm (or 1.2 percent of the world’s
reserves), with an RPR of 36 years. Proven gas reserves grew from 347 bcm in 1989 to 2.2 tcm by 2010.
About 81 percent of the reserves are in the Mediterranean Sea, 6 percent in the Gulf of Suez, 11 percent in
the Western Desert, and 2 percent in the Nile Delta. The RPR declined from 75 years in 1999 to 36 years
in 2010. But foreign companies operating in Egypt believe that under the right incentives, Egypt has
probable reserves of 2.55 tcm of gas to be discovered mostly in the Mediterranean Sea (APRC 2011). The
Oil and Gas Journal of May 2010 reported that the USGS had estimated that the Nile Delta contains over
6.2 tcm of undiscovered and technically recoverable reserves of gas as well as 9.5 billion barrels of
natural gas liquids.
Marketed gas production tripled from 21 bcm in 2000 to 61.3 bcm in 2010 (1.9 percent of world
production), an annual rate of 11.3 percent. Foreign investors were obliged to sell up to two-thirds of their
share of gas (including profit gas) on a take-or-pay basis to the Egyptian General Petroleum Corporation
(EGPC) and Egyptian Natural Gas Holding Company (EGAS).
The price payable for such gas purchases was capped at $2.65/mmbtu in the mid-2000s, but the cap has
been raised several times in the recent past (taking into account rising costs) and is currently in the range
of $3.7$4.7 per mmbtu, with a floor and cap indexed to oil prices. Such revisions appear to have
incentivized increased production. Cedigaz projects that gas supply will increase at a rate of 4 percent a
year from about 63 bcm in 2009 to 96 bcm by 2020 (APRC 2011), close to the high-case scenario
projection of Mott MacDonald (2010) shown in table 3.4. Egypt follows a policy of obliging the
companies engaged in gas E&P to leave one-third of proven reserves underground for future generations,
to supply one-third of the reserves for domestic use, and to export only the remaining third. Further, in
response to public clamor that exports are reducing the volume of supplies needed for domestic
consumption, in June 2008 the government imposed a moratorium on exports, which acts as a constraint
to new production. Thus in 2009, although ENI and British Petroleum (BP) held what seemed to them to
be more than adequate new reserves to underpin a new train of LNG production at the SEGAS LNG plant
at Damietta, the government deferred the project indefinitely. In 201112 the prospects of the moratorium
being lifted in the short term seemed slight. Further, though producer prices are reasonable, prices for end
users are well below gas purchase costs, eroding the solvency of agencies such as the EGAS and EGPC
that must mandatorily buy gas from the producers. The erosion of their solvency dampens the interest of
the E&P companies in producing more gas. Further, how importing LNG into Egypt to meet domestic
demand might impact future levels of gas production is not yet clear. The high price of imported gas,
meanwhile, is likely to trigger a higher domestic gas price and a stronger incentive for upstream activities.
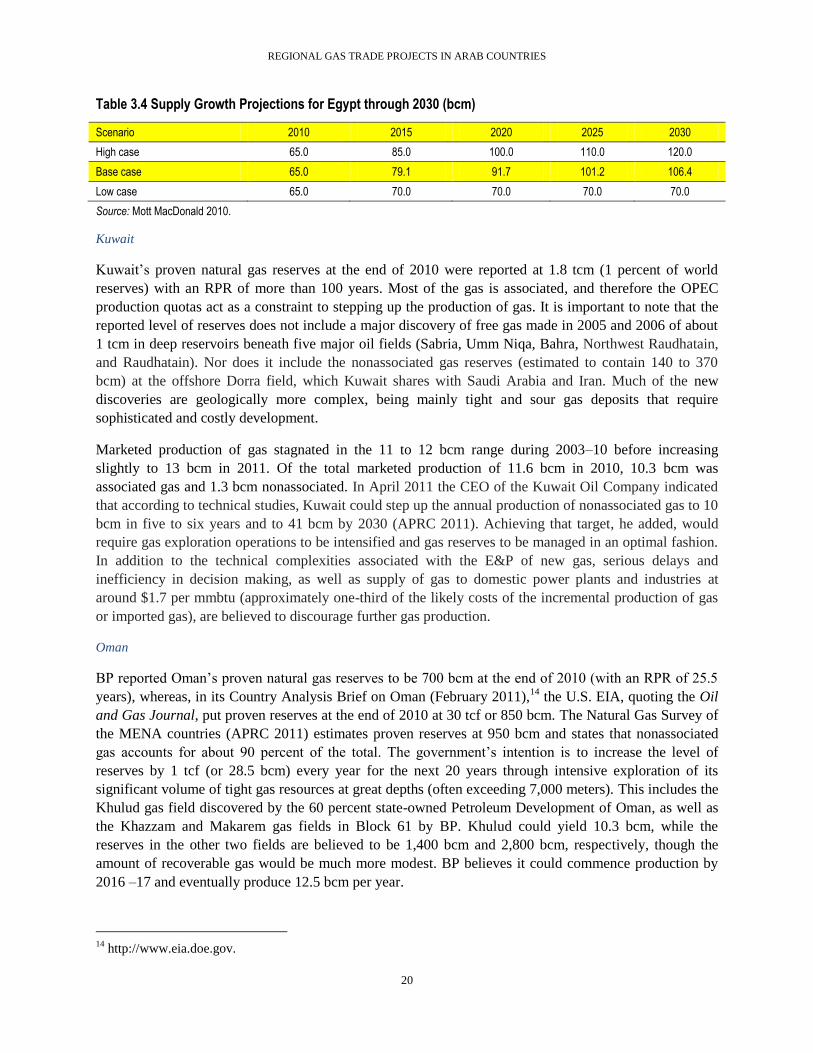
REGIONAL GAS TRADE PROJECTS IN ARAB COUNTRIES
20
Table 3.4 Supply Growth Projections for Egypt through 2030 (bcm)
Scenario 2010 2015 2020 2025 2030
High case 65.0 85.0 100.0 110.0 120.0
Base case 65.0 79.1 91.7 101.2 106.4
Low case 65.0 70.0 70.0 70.0 70.0
Source: Mott MacDonald 2010.
Kuwait
Kuwait’s proven natural gas reserves at the end of 2010 were reported at 1.8 tcm (1 percent of world
reserves) with an RPR of more than 100 years. Most of the gas is associated, and therefore the OPEC
production quotas act as a constraint to stepping up the production of gas. It is important to note that the
reported level of reserves does not include a major discovery of free gas made in 2005 and 2006 of about
1 tcm in deep reservoirs beneath five major oil fields (Sabria, Umm Niqa, Bahra, Northwest Raudhatain,
and Raudhatain). Nor does it include the nonassociated gas reserves (estimated to contain 140 to 370
bcm) at the offshore Dorra field, which Kuwait shares with Saudi Arabia and Iran. Much of the new
discoveries are geologically more complex, being mainly tight and sour gas deposits that require
sophisticated and costly development.
Marketed production of gas stagnated in the 11 to 12 bcm range during 2003–10 before increasing
slightly to 13 bcm in 2011. Of the total marketed production of 11.6 bcm in 2010, 10.3 bcm was
associated gas and 1.3 bcm nonassociated. In April 2011 the CEO of the Kuwait Oil Company indicated
that according to technical studies, Kuwait could step up the annual production of nonassociated gas to 10
bcm in five to six years and to 41 bcm by 2030 (APRC 2011). Achieving that target, he added, would
require gas exploration operations to be intensified and gas reserves to be managed in an optimal fashion.
In addition to the technical complexities associated with the E&P of new gas, serious delays and
inefficiency in decision making, as well as supply of gas to domestic power plants and industries at
around $1.7 per mmbtu (approximately one-third of the likely costs of the incremental production of gas
or imported gas), are believed to discourage further gas production.
Oman
BP reported Oman’s proven natural gas reserves to be 700 bcm at the end of 2010 (with an RPR of 25.5
years), whereas, in its Country Analysis Brief on Oman (February 2011),14
the U.S. EIA, quoting the Oil
and Gas Journal, put proven reserves at the end of 2010 at 30 tcf or 850 bcm. The Natural Gas Survey of
the MENA countries (APRC 2011) estimates proven reserves at 950 bcm and states that nonassociated
gas accounts for about 90 percent of the total. The government’s intention is to increase the level of
reserves by 1 tcf (or 28.5 bcm) every year for the next 20 years through intensive exploration of its
significant volume of tight gas resources at great depths (often exceeding 7,000 meters). This includes the
Khulud gas field discovered by the 60 percent state-owned Petroleum Development of Oman, as well as
the Khazzam and Makarem gas fields in Block 61 by BP. Khulud could yield 10.3 bcm, while the
reserves in the other two fields are believed to be 1,400 bcm and 2,800 bcm, respectively, though the
amount of recoverable gas would be much more modest. BP believes it could commence production by
2016 –17 and eventually produce 12.5 bcm per year.
14
http://www.eia.doe.gov.
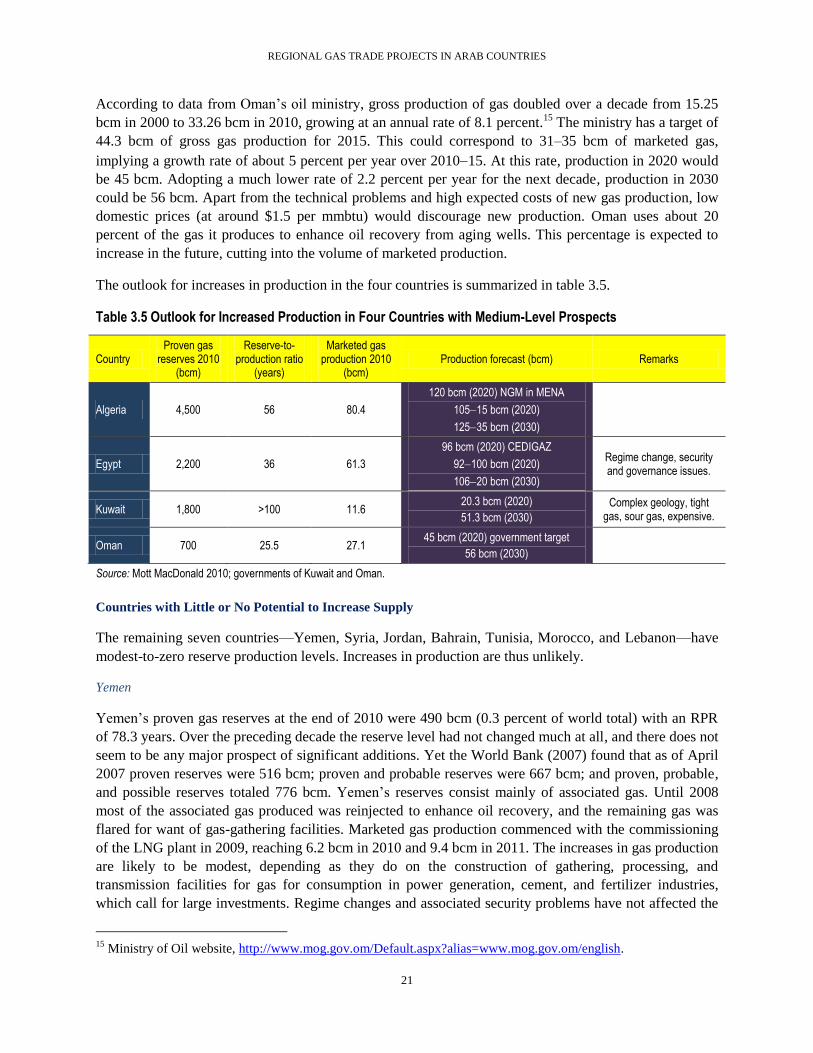
REGIONAL GAS TRADE PROJECTS IN ARAB COUNTRIES
21
According to data from Oman’s oil ministry, gross production of gas doubled over a decade from 15.25
bcm in 2000 to 33.26 bcm in 2010, growing at an annual rate of 8.1 percent.15
The ministry has a target of
44.3 bcm of gross gas production for 2015. This could correspond to 31–35 bcm of marketed gas,
implying a growth rate of about 5 percent per year over 201015. At this rate, production in 2020 would
be 45 bcm. Adopting a much lower rate of 2.2 percent per year for the next decade, production in 2030
could be 56 bcm. Apart from the technical problems and high expected costs of new gas production, low
domestic prices (at around $1.5 per mmbtu) would discourage new production. Oman uses about 20
percent of the gas it produces to enhance oil recovery from aging wells. This percentage is expected to
increase in the future, cutting into the volume of marketed production.
The outlook for increases in production in the four countries is summarized in table 3.5.
Table 3.5 Outlook for Increased Production in Four Countries with Medium-Level Prospects
Country Proven gas
reserves 2010 (bcm)
Reserve-to-production ratio
(years)
Marketed gas production 2010
(bcm) Production forecast (bcm) Remarks
Algeria 4,500 56 80.4
120 bcm (2020) NGM in MENA
10515 bcm (2020)
12535 bcm (2030)
Egypt 2,200 36 61.3
96 bcm (2020) CEDIGAZ
92100 bcm (2020)
10620 bcm (2030)
Regime change, security and governance issues.
Kuwait 1,800 >100 11.6 20.3 bcm (2020)
51.3 bcm (2030)
Complex geology, tight gas, sour gas, expensive.
Oman 700 25.5 27.1 45 bcm (2020) government target
56 bcm (2030)
Source: Mott MacDonald 2010; governments of Kuwait and Oman.
Countries with Little or No Potential to Increase Supply
The remaining seven countries—Yemen, Syria, Jordan, Bahrain, Tunisia, Morocco, and Lebanon—have
modest-to-zero reserve production levels. Increases in production are thus unlikely.
Yemen
Yemen’s proven gas reserves at the end of 2010 were 490 bcm (0.3 percent of world total) with an RPR
of 78.3 years. Over the preceding decade the reserve level had not changed much at all, and there does not
seem to be any major prospect of significant additions. Yet the World Bank (2007) found that as of April
2007 proven reserves were 516 bcm; proven and probable reserves were 667 bcm; and proven, probable,
and possible reserves totaled 776 bcm. Yemen’s reserves consist mainly of associated gas. Until 2008
most of the associated gas produced was reinjected to enhance oil recovery, and the remaining gas was
flared for want of gas-gathering facilities. Marketed gas production commenced with the commissioning
of the LNG plant in 2009, reaching 6.2 bcm in 2010 and 9.4 bcm in 2011. The increases in gas production
are likely to be modest, depending as they do on the construction of gathering, processing, and
transmission facilities for gas for consumption in power generation, cement, and fertilizer industries,
which call for large investments. Regime changes and associated security problems have not affected the
15
Ministry of Oil website, http://www.mog.gov.om/Default.aspx?alias=www.mog.gov.om/english.

REGIONAL GAS TRADE PROJECTS IN ARAB COUNTRIES
22
ongoing gas production and LNG exports so far, but the unrest could deter fresh investments in
production expansion. Production may increase to 15 bcm by 2020 and probably to 18 bcm by 2030,
assuming that there will be no expansion of annual LNG production capacity from the present level of
9.25 bcm.
Syria
Syria’s natural gas reserves at the end of 2010 were reported by BP (2011b) at 258 bcm (or 0.1 percent of
world total), with an RPR of 33.2 years. About 60 percent of the reserve is associated gas, but the Syrian
oil minister stated in mid-2010 that proven reserves were estimated at 284 bcm, 60 percent of which was
nonassociated (APRC 2011). Syrian offshore blocks are being opened for natural gas exploration. The
discovery of substantial gas deposits off the coast of Israel has incited similar expectations in Syria,
Lebanon, and Cyprus. Marketed gas production net of flared and recycled gas has increased from about 5
bcm to 7.8 bcm during the decade, and the government expects production to increase to 13 bcm by 2012
(APRC 2011). Marketed production in 2011 was 8.3 bcm. Fattouh and Stern (2011) suggest that marketed
production may increase, at best, to 15 bcm by the middle of this decade and stagnate there until 2020,
depending on improvements to production sharing contracts and terms to international oil companies.
Further increases will depend on new discoveries. From this, gross production of about 25 percent is
believed to be used for reinjection for enhanced oil recovery. Notable amounts are still flared or vented
for want of third-party access to gas pipeline systems. The ongoing civil war and associated security
problems could deter investments needed for production expansion. At best production may increase to
20 bcm by 2030.
Bahrain
Bahrain’s proven gas reserves were reported by BP (2011b) at 218 bcm at the end of 2010, with an RPR
of 16.7 years. All other sources (EIA energy statistics based on Oil and Gas Journal data, APRC [2011],
Fattouh and Stern [2011], and BP [2010]) indicate a lower reserve of 90 bcm and an RPR of 67 years.
Marketed production increased from 9 bcm in 2001 to 13.1 bcm in 2010 (an annual rate of about 4.2
percent) but declined slightly in 2011 to 13 bcm. More than 80 percent of the gas produced is
nonassociated, coming from the Khuff reservoirs at depths of 9,00011,000 feet. Bahrain is pursuing
E&P activities in onshore Khuff and pre-Khuff formations at depths of 15,00020,000 feet. If these
efforts succeed, annual gas production will double from 13 bcm to about 27 bcm by 2020 and probably
stagnate at that level, not going higher than 30 bcm by 2030. The increase in gas production from
20092010 was already 1.3 bcm. But nearly 17 percent of gross production was reinjected into oil wells,
and that percentage is expected to increase in the future.
Gas prices for domestic consumers are in the range of $1.1$1.5/mmbtu. The price charged to the ALBA
aluminum smelter is being raised to $2.25/mmbtu, but further upward revision for all consumers may be
needed to encourage production of additional gas, which is expected to cost more than $5/mmbtu.
Tunisia
Tunisia’s proven gas reserves are very small (about 66 bcm). But new discoveries have been made in
recent years, and the EIA (2011) indicates that Tunisia has technically recoverable shale gas reserves of
18 tcf (or 510 bcm). The government is actively pursuing the exploration and development of these
reserves. “Because of its favorable oil and gas investment incentives, Tunisia has attracted many
international E&P contractors, and it is the only country in North Central Africa where unconventional
REGIONAL GAS TRADE PROJECTS IN ARAB COUNTRIES
23
natural gas potential is being actively explored. Tunisia had the first shale gas well and fracking in North
Africa in March 2010 and is actively supporting the pursuit of this resource” (EIA 2011). Its production
of gas rose from 2.5 bcm in 2005 to 3.8 bcm in 2010. With the participation of ENI, OMV, and Pioneer
(who together hold a 50 percent stake), the country is building a 24-inch pipeline from its southern gas
fields and other potential areas to connect with the Enrico Mattei pipeline from Algeria to Italy via
Tunisia with the objective of facilitating Tunisian exports of gas to the European Union (EU) beginning in
2014. The cost of the project is $1.2 billion. Front-end engineering studies were done by a U.K. firm
(Fluor). Meanwhile, the offshore portion of the Enrico-Mattei gas pipeline is owned by ENI of Italy and
Sonatrach of Algeria, and the Tunisian request for capacity allocation has not yet been agreed to by
Algeria. Thus, Tunisia may have to use its additional production for domestic use, draw the transit fee in
cash instead of taking transit gas, and may also reduce its purchased gas from Algeria. The situation is not
yet clear.
Jordan
Jordan’s gas reserves are believed to be 6.03 bcm. Over the past few years, the kingdom’s production has
stayed near 0.221 bcm. Jordan does not seem to have any other gas resources, and increases in production
are unlikely.
Morocco
Morocco’s proven associated and nonassociated gas reserves at the end of 2011 were estimated at 1.5
bcm. Fattouh and Stern (2011) indicate that the Oil and Gas Journal reported a reserve of 1.48 to 1.54
bcm in 2009 and that Wood Mackenzie, however, estimated reserves of 4.9 bcm in January 2010
(including certain new discoveries in 2009).The EIA (2011) places the technically recoverable reserves of
shale gas in Morocco at 11 tcf (or 312 bcm). Production in 2010 of 0.05 bcm is statistically insignificant
from a regional perspective, and major production increases are unlikely.
Lebanon
Lebanon has no gas reserves at all. Exploration in the offshore areas is likely to be pursued in the wake of
discoveries of gas deposits off the coast of Israel. Israel’s discoveries, once developed, would not only
meet Israel’s gas needs, but would also enable it to export some gas.
The outlook for increased production in the seven countries with low prospects is summarized in
table 3.6.
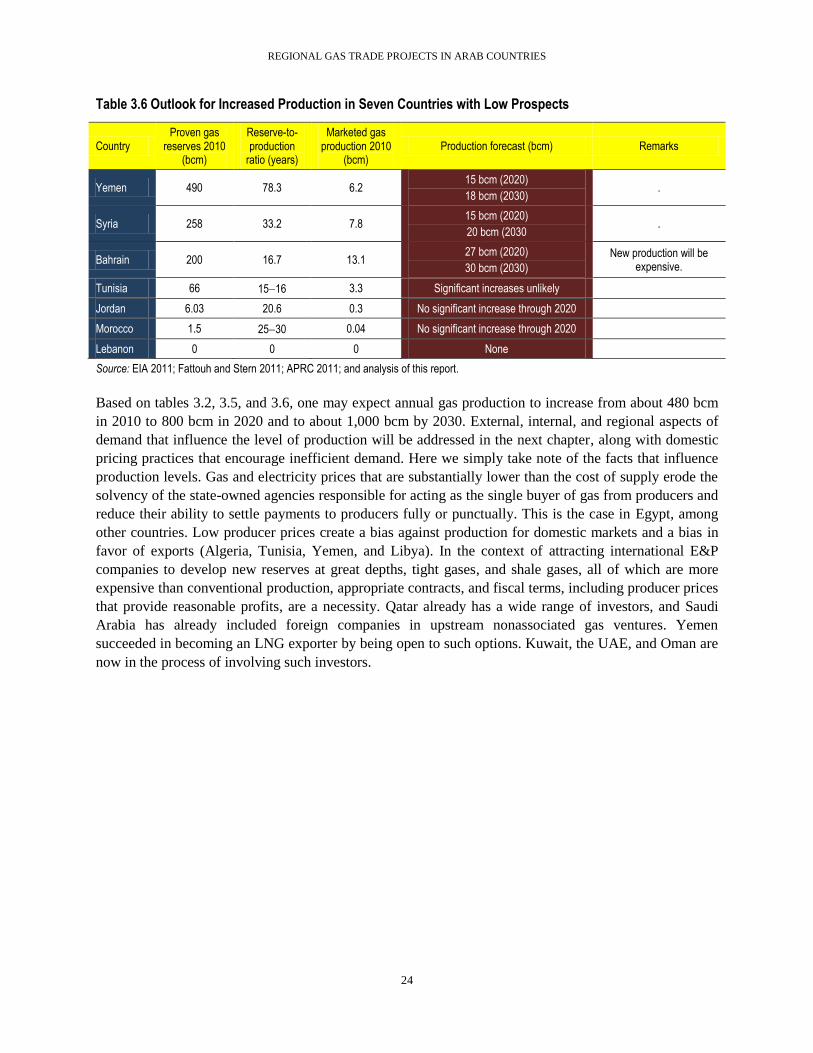
REGIONAL GAS TRADE PROJECTS IN ARAB COUNTRIES
24
Table 3.6 Outlook for Increased Production in Seven Countries with Low Prospects
Country Proven gas
reserves 2010 (bcm)
Reserve-to-production
ratio (years)
Marketed gas production 2010
(bcm) Production forecast (bcm) Remarks
Yemen 490 78.3 6.2 15 bcm (2020)
18 bcm (2030) .
Syria 258 33.2 7.8 15 bcm (2020)
20 bcm (2030 .
Bahrain 200 16.7 13.1 27 bcm (2020)
30 bcm (2030)
New production will be expensive.
Tunisia 66 1516 3.3 Significant increases unlikely
Jordan 6.03 20.6 0.3 No significant increase through 2020
Morocco 1.5 2530 0.04 No significant increase through 2020
Lebanon 0 0 0 None
Source: EIA 2011; Fattouh and Stern 2011; APRC 2011; and analysis of this report.
Based on tables 3.2, 3.5, and 3.6, one may expect annual gas production to increase from about 480 bcm
in 2010 to 800 bcm in 2020 and to about 1,000 bcm by 2030. External, internal, and regional aspects of
demand that influence the level of production will be addressed in the next chapter, along with domestic
pricing practices that encourage inefficient demand. Here we simply take note of the facts that influence
production levels. Gas and electricity prices that are substantially lower than the cost of supply erode the
solvency of the state-owned agencies responsible for acting as the single buyer of gas from producers and
reduce their ability to settle payments to producers fully or punctually. This is the case in Egypt, among
other countries. Low producer prices create a bias against production for domestic markets and a bias in
favor of exports (Algeria, Tunisia, Yemen, and Libya). In the context of attracting international E&P
companies to develop new reserves at great depths, tight gases, and shale gases, all of which are more
expensive than conventional production, appropriate contracts, and fiscal terms, including producer prices
that provide reasonable profits, are a necessity. Qatar already has a wide range of investors, and Saudi
Arabia has already included foreign companies in upstream nonassociated gas ventures. Yemen
succeeded in becoming an LNG exporter by being open to such options. Kuwait, the UAE, and Oman are
now in the process of involving such investors.

Chapter 4. Projection of Demand for Natural Gas in Arab Countries
Demand Growth to Date
The demand for natural gas in the 16 Arab countries grew from 172.28 billion cubic meters (bcm) in 2000
to 239.78 bcm in 2005 and 313.12 bcm in 2010. The compound annual growth rate (CAGR) during the
decade for these Arab countries was about 6.2 percent, substantially higher than the corresponding
worldwide demand growth rate of 2.8 percent (table 4.1).
Table 4.1 Growth in Arab Countries’ Domestic Demand for Natural Gas, 2000–10 (bcm)
Country 2000 2005 2010 CAGR 200010
(%)
Share in world consumption 2010 (%)
Morocco 0.07 0.54 0.90 29.0 0.03
Algeria 19.80 23.20 28.90 3.9 0.90
Tunisia 3.72 5.00 5.30 3.6 0.17
Libya 4.81 5.94 6.90 3.7 0.22
Egypt 20.00 31.60 45.10 8.5 1.40
Subtotal 48.39 66.28 87.10 6.1 2.71
Iraq 2.90 1.50 1.30 -7.7 0.04
Jordan 0.29 1.60 4.20 30.6 0.13
Syria 5.70 6.10 8.50 4.1 0.27
Lebanon 0.00 0.00 0.15 — 0.00
Subtotal 8.89 9.20 14.15 5.2 0.45
Bahrain 8.80 10.70 13.10 4.06 0.41
Kuwait 9.60 12.20 14.40 4.1 0.45
Saudi Arabia 49.80 71.20 83.90 5.4 2.65
Qatar 9.70 18.70 20.40 7.7 0.64
UAE 31.40 42.10 60.50 6.8 1.91
Oman 5.70 9.40 17.51 11.9 0.55
Yemen 0.00 0.00 0.76 — 0.02
Subtotal 115.00 164.30 210.57 6.2 6.64
Grand Total 172.28 239.78 311.82 6.2 9.84
World Consumption 2,411.70 2,781.80 3,169.00 2.8 100.00
Source: BP 2011b; Fattouh and Stern 2011; Mott MacDonald 2010; EIA Country Analysis Briefs; and analysis of this report.
There are some notable variations among the 16 countries. The growth rates of Morocco, Jordan, Yemen,
and Lebanon are statistical aberrations, starting as they do from zero or from very low numbers. The
consumption in Iraq had actually decreased during a decade of war and warlike conditions. Among the
other countries, Oman, Egypt, Qatar, the United Arab Emirates (UAE), and Saudi Arabia had growth
rates in the range of 510 percent while the remaining six countries were in the range of 3.64.6 percent.

REGIONAL GAS TRADE PROJECTS IN ARAB COUNTRIES
26
Sectoral Composition of Gas Demand
The sectoral composition of gas consumption in 2010 in 14 of the 16 Arab countries covered by this
report is summarized in table 4.2. In most cases consumption covers marketed gas minus exports (plus
imports), excluding the considerable amounts of gas that are flared, vented, or reinjected into wells to
enhance oil recovery. In most countries, fertilizers are included under petrochemicals; in some they are
grouped under industry.
Table 4.2 Composition of Domestic Gas Demand in Some Arab Countries, 2010 (percentage)
Country Power Petrochemicals Industry Commercial/ households
Unclassified/ remarks
Algeria 43.0 26.0 10.0 21.0
Morocco 85.0 The nonpower use is estimated at 15% but the sector use is
not specified.
Tunisia 74.0 1.0 16.0
Libya 65.6 33.2* 1.2 *Iron and steel is a major consumer.
Egypt 56.0 11.0 30.0* 3.0 *Fertilizer under industry.
Saudi Arabia (2009) 48.0 30.0 22.0* *Includes gas and oil sector use.
Kuwait (2009) 29.4 52.2 18.4
Bahrain 44.6 9.6 39.8 6.0
Qatar 22.0 62.0 16.0* *GTL projects.
Oman 36 20 44
Jordan 100.0
Syria 50.0 More than 25.0* Less than 25.0 *Mostly fertilizers.
Lebanon 100.0
Yemen 100.0
Source: BP 2011b; Fattouh and Stern 2011; Mott MacDonald 2010; EIA Country Analysis Briefs; and analysis of this report.
In all 14 countries of table 4.2, oil was the primary source of energy. When natural gas became available
either through domestic production or through imports, it was welcome in the context of volatile oil prices
and the need to maximize oil exports or reduce imports. Thus the share of gas in primary energy supply
tended to grow fast, especially in those countries with ample natural gas resources. Most oil producers
merely flare associated gas or cap the gas wells. In previous years the gas supply obtained by capturing
associated gas was relatively inexpensive, enabling the substitution of gas for oil in domestic use.
The Role of the Power Sector
With technological developments in gas turbine technology and combined-cycle technology, the use of
gas in the power sector has reduced capital costs, improved electricity generation efficiency, and reduced
overall power generation costs, compared with oil-fired power generation using conventional steam
turbines and diesel-generating sets. Thus switching from oil to gas for power generation came into vogue
across the entire region. The shift was also encouraged for environmental reasons, as gas-fired units were
less polluting and produced less greenhouse gas per kilowatt hour (kWh) generated.
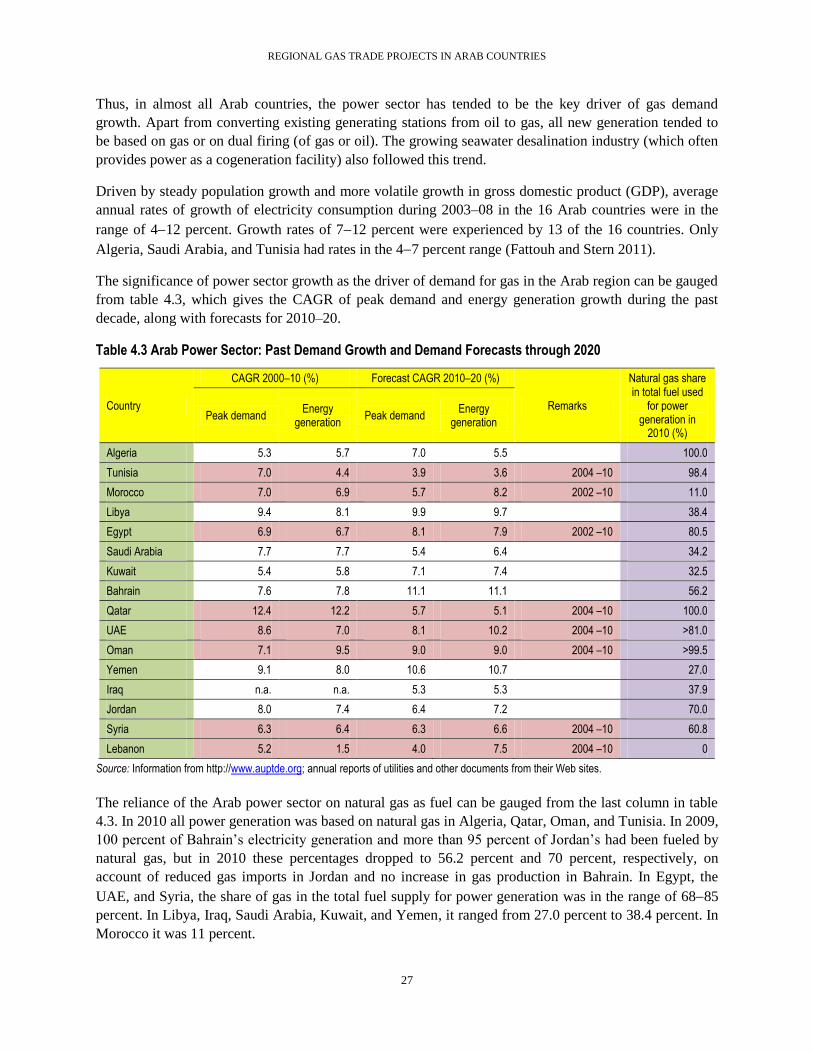
REGIONAL GAS TRADE PROJECTS IN ARAB COUNTRIES
27
Thus, in almost all Arab countries, the power sector has tended to be the key driver of gas demand
growth. Apart from converting existing generating stations from oil to gas, all new generation tended to
be based on gas or on dual firing (of gas or oil). The growing seawater desalination industry (which often
provides power as a cogeneration facility) also followed this trend.
Driven by steady population growth and more volatile growth in gross domestic product (GDP), average
annual rates of growth of electricity consumption during 2003–08 in the 16 Arab countries were in the
range of 412 percent. Growth rates of 712 percent were experienced by 13 of the 16 countries. Only
Algeria, Saudi Arabia, and Tunisia had rates in the 47 percent range (Fattouh and Stern 2011).
The significance of power sector growth as the driver of demand for gas in the Arab region can be gauged
from table 4.3, which gives the CAGR of peak demand and energy generation growth during the past
decade, along with forecasts for 2010–20.
Table 4.3 Arab Power Sector: Past Demand Growth and Demand Forecasts through 2020
Country
CAGR 2000–10 (%) Forecast CAGR 2010–20 (%)
Remarks
Natural gas share in total fuel used
for power generation in
2010 (%)
Peak demand Energy
generation Peak demand
Energy generation
Algeria 5.3 5.7 7.0 5.5 100.0
Tunisia 7.0 4.4 3.9 3.6 2004 –10 98.4
Morocco 7.0 6.9 5.7 8.2 2002 –10 11.0
Libya 9.4 8.1 9.9 9.7 38.4
Egypt 6.9 6.7 8.1 7.9 2002 –10 80.5
Saudi Arabia 7.7 7.7 5.4 6.4 34.2
Kuwait 5.4 5.8 7.1 7.4 32.5
Bahrain 7.6 7.8 11.1 11.1 56.2
Qatar 12.4 12.2 5.7 5.1 2004 –10 100.0
UAE 8.6 7.0 8.1 10.2 2004 –10 >81.0
Oman 7.1 9.5 9.0 9.0 2004 –10 >99.5
Yemen 9.1 8.0 10.6 10.7 27.0
Iraq n.a. n.a. 5.3 5.3 37.9
Jordan 8.0 7.4 6.4 7.2 70.0
Syria 6.3 6.4 6.3 6.6 2004 –10 60.8
Lebanon 5.2 1.5 4.0 7.5 2004 –10 0
Source: Information from http://www.auptde.org; annual reports of utilities and other documents from their Web sites.
The reliance of the Arab power sector on natural gas as fuel can be gauged from the last column in table
4.3. In 2010 all power generation was based on natural gas in Algeria, Qatar, Oman, and Tunisia. In 2009,
100 percent of Bahrain’s electricity generation and more than 95 percent of Jordan’s had been fueled by
natural gas, but in 2010 these percentages dropped to 56.2 percent and 70 percent, respectively, on
account of reduced gas imports in Jordan and no increase in gas production in Bahrain. In Egypt, the
UAE, and Syria, the share of gas in the total fuel supply for power generation was in the range of 6885
percent. In Libya, Iraq, Saudi Arabia, Kuwait, and Yemen, it ranged from 27.0 percent to 38.4 percent. In
Morocco it was 11 percent.

REGIONAL GAS TRADE PROJECTS IN ARAB COUNTRIES
28
Saudi Arabia’s gas-allocation policy limits the supply of gas to the power sector to the current low levels
and gives preference to petrochemicals, fertilizers, and similar industries to enable the most economic use
of gas and to add the highest possible value to the Saudi economy. In most other countries the power
sector gets a high priority in allocation, limited only by the available supply.
In countries with substantial domestic gas supply (Qatar, the UAE, Egypt, Oman, Bahrain, Kuwait, and
Algeria), governments promoted the use of gas in petrochemicals, fertilizers, and other fuel-intensive
industries, such as aluminum and steel production, mostly by supplying subsidized and low-priced gas as
feedstock or fuel to build forward linkages, move up the value chain, and to diversify the economy and
the export portfolio. Thus Bahrain has the world’s largest aluminum smelter (ALBA), and Qatar has
rapidly growing petrochemical and fertilizer industries, in addition to a large aluminum smelter of its
own. The petrochemical sector in Qatar is on track to become the fourth-largest producer in the world,
with an annual capacity of 29 million tons of 16 different products. Egypt has the third-largest gas market
among the Arab countries after Saudi Arabia and the UAE, in which, besides the power sector, the
industrial sector is a major consumer led by petrochemicals, fertilizers, steel, and cement.
The Influence of Subsidized Pricing
One of the key reasons for the rapid growth of domestic demand for gas in Arab countries, in comparison
with the rest of the world, is the low and subsidized prices at which natural gas is provided to the
domestic power sector and industrial consumers, and the low and subsidized prices at which electricity is
provided to all domestic consumers.
Prices for electricity and natural gas for domestic consumers in many of the Arab countries are well
below the cost of supply, encouraging very rapid demand growth and inefficient consumption. Further,
such low prices erode the viability of state-owned entities that must buy gas from the producers, one of
the effects of which is to delay payments for gas. This, in turn, discourages producers from increasing
production for domestic consumption and creates an export bias in Egypt, Libya, Algeria, Tunisia, and
Yemen. At the same time, by fueling rapid growth in domestic demand, artificially low domestic prices
make it difficult for some countries (Egypt, Kuwait, the UAE, Bahrain, and Oman) to maintain their level
of exports, let alone increase them (table 4.4).
Except in the case of Jordan and Syria, domestic gas prices are very low compared to the gas prices
prevailing in the world markets. Razavi (2009) provides an assessment of the economic cost of gas supply
at the city gate, netback values in the power sector, and net gain from liquefied natural gas (LNG) exports
for nine Arab countries based on 2005–06 data (table 4.5). It can be seen that compared with these values,
the current domestic gas sales prices are considerably lower, creating major distortions in the allocation of
resources. When such economic prices are used for gas supply to the power sector, the gap between the
cost of supply and electricity prices promises to become even wider than at present.

REGIONAL GAS TRADE PROJECTS IN ARAB COUNTRIES
29
Table 4.4 Domestic Pricing for Natural Gas and Electricity in the Arab Countries
Country Gas price in
$/mmbtu Remarks Electricity price in cents/kWh Remarks
Morocco 13.4417.56 (2008)
Algeria 0.50 (2008) Indexed to exchange rates and inflation rates (5% maximum).
4.846.72
(2008)
Tunisia Gas sale price was lower than purchase price by $4.28/mmbtu (2008).
9.0512.58
(2008)
Libya 0.17 to 0.20 So low that no one wants to develop gas for local supply.
1.523.64
Egypt 1.82 for power;
2.004.00 for others
Prices as of January 2013. 0.74 to 10 for households
4.02 to 10.7 for commercial
3.28 to 6.34 Industry off-peak
6.19 to 8.00 industry peak hours
Prices as of January 2013.
Jordan 4.5 Most probably gas is being sold to the IPPs at the import price of gas from Egypt by the NEPCO.
4.6516.07 for households; 12.27 for commercial;
5.227.05 for industries; 6.77 for agriculture.
Rates in 2010. This compares with the cost of production of 11.03 cents/kWh.
Syria Not available. 4.51 for HV consumers;
5.67.51 for LV consumers; and an average of 2.73 for households in many slabs.
Average tariff in the country—4.42 cents/kWh.
Lebanon n.a. — 9.4 Average tariff in 2006 based on a World Bank report (World Bank 2008).
Iraq 1.15
Kuwait 1.7 Linked to oil price range,
$87$100/barrel.
7.0 Proposals to increase under consideration.
Bahrain 1.1–1.5 Price for aluminum smelter is being raised to $2.25.
0.8–4.24 Most residential consumption is at the lower end of the price range.
Saudi Arabia
0.75 Some gas distribution companies purchase at $1.12 and sell gas at $1.34.
1.33–6.94 for residential;
3.2–6.94 for commercial;
3.2–4.0 for industries; and 6.94 for government consumers.
Time-of-use and seasonal tariffs are available for large consumers. These are well below costs based on the unsubsidized economic price of fuels.
Qatar 0.75–1.0 for petrochemicals, fertilizers
Supply to power is based on fixed-price contracts indexed for inflation.
2.2 Qatari nationals get free water and electricity up to 4,000 kWh/month.
UAE 1.0 2.0 for citizens;
4.0–5.0 for others; and 6.0–8.0 for industries.
Oman 1.5 2.6–5.2 for residences and government; 5.2 for others.
Seasonal tariffs for industries—3.12 in winter and 6.24 in summer.

REGIONAL GAS TRADE PROJECTS IN ARAB COUNTRIES
30
Country Gas price in
$/mmbtu Remarks Electricity price in cents/kWh Remarks
Yemen 3.2 This price for power companies was considered a few years ago. The current price is not known.
2.0–8.5 in several slabs for households; 8.5 for commercial consumers; 7.5 for industries; 9.0 for government; and 7.5 for water supply companies.
Average revenue is about 6.0 cents/kWh.
Source: BP 2011b; Fattouh and Stern 2011; Mott MacDonald 2010; EIA Country Analysis Briefs; information from http://www.auptde.org; and analysis of this report.
Note: NEPCO = National Electric Power Corporation of Jordan; IPPs = independent power producers.
Table 4.5 Economic Costs, Netback Values, and LNG Export Net Gains in Nine Arab Countries ($/mmbtu)
Country
Economic cost at city gate Netback value in power generation
use Net gain from LNG export
At 10% discount rate
At 5% discount rate
At 10% discount rate
At 5% discount rate
At 10% discount rate
At 5% discount rate
Algeria 2.78 4.90 7.42 7.08 2.25 3.05
Egypt 2.38 4.51 6.32 5.98 2.61 3.15
Qatar 1.39 2.86 7.22 6.88 2.31 3.08
Iraq 1.58 3.13 6.46 6.12 n.a. n.a.
Kuwait n.a. 6.15 5.82 n.a. 1.87 n.a.
Libya 2.06 4.14 7.28 6.95 n.a. 2.69
Saudi Arabia 0.82 1.93 6.30 5.97 n.a. n.a.
UAE 3.85 3.85 7.31 6.97 n.a. n.a.
Yemen n.a. n.a. 6.42 6.08 2.66 3.02
Source: Razavi 2009.
n.a. Not applicable.
Highly subsidized electricity supply has led to high per capita electricity consumption in many Arab
countries compared to the world average (figure 4.1)
Figure 4.1 Per Capita Electricity Consumption (2008)
Source: Arab Forum for Environment and Development 2011.

REGIONAL GAS TRADE PROJECTS IN ARAB COUNTRIES
31
Even more substantial is the difference in 2008 between the energy intensity of growth in many Arab
countries and the world average (measured in terms of tons of oil equivalent per $1,000 of GDP in 2000
prices). The high energy intensity of growth is a consequence of subsidized energy supply, among other
factors (figure 4.2).
Figure 4.2 Energy Intensity of Growth, 2008
Source: Arab Forum for Environment and Development 2011.
Gas Demand for Enhanced Oil Recovery
Thus far this chapter has dealt with the demand for marketed gas (gross production minus gas flared or
vented or reinjected to enhance oil recovery). It should be noted that in most major gas-producing
countries, a significant share of domestically produced gas is reinjected into aging oil wells to enhance oil
recovery, thereby reducing the amount of gas available for other uses. The volume of such consumption
in some of the Arab countries is summarized in table 4.6.
Table 4.6 Consumption of Gas for Enhanced Oil Recovery (EOR) (%)
Country Percentage of gross production
used for EOR or flared or vented
Remarks
Qatar 13 Mostly for EOR
Iraq 66 Mostly flared
Libya 45 Partly flared, mostly for EOR
Saudi Arabia 10 or less Flaring is small
UAE 36 28% is for EOR
Algeria 5055 Mostly for EOR
Kuwait Negligible
Oman 20 For EOR
Yemen (2008) 85 For EOR
Syria 25 For EOR
Bahrain 17 For EOR
Source: Fattouh and Stern 2011; APRC 2011; EIA Country Analysis Briefs; and analysis of this report.
It is noteworthy that Oman uses most of the gas it imports from Qatar through the Dolphin Pipeline for
reinjection into its oil wells.

REGIONAL GAS TRADE PROJECTS IN ARAB COUNTRIES
32
Future Demand Growth for Gas, by Country
Algeria
Using econometric modeling, the Algerian Gas and Electricity Regulatory Authority, CREG, has
projected that domestic demand for gas will grow to 47.46 bcm by 2020. The power sector will continue
to drive demand, but to a slightly smaller extent than before. The influence of fertilizers and
petrochemicals will be slightly more pronounced. The gas consumption mix in 2019 is expected to be led
by power generation (34.5 percent), followed by refinery, fertilizers, and petrochemicals (31.4 percent);
commercial and domestic uses (23.2 percent); and industrial uses (10.4 percent). Mott MacDonald
projections (2010) based on three scenarios appear in table 4.7. Growth will probably follow the high-
case scenario.
Table 4.7 Domestic Gas Demand Projections for Algeria (bcm)
Scenario 2010 2015 2020 2025 2030
High case 25.2 35.0 45.0 55.0 65.0
Base case 25.2 32.2 39.2 45.4 52.7
Low case 25.2 30.0 35.0 40.0 45.0
Source: Mott MacDonald 2010.
Tunisia
A gas demand projection for Tunisia based on the government’s vision (Fattouh and Stern 2011,
chapter 3) has total domestic demand for gas rising from about 4 bcm in 2007 to about 9.5 bcm by 2024
and then declining slightly to 8.5 bcm by 2030. Demand in 2020 could be about 8.08.5 bcm. The authors
observe that in the context of the country’s reserves-to-production ratio, in around 30 years the growth
envisioned by the government might not be sustainable. In the months since their report was published,
however, the outlook on gas reserves seems to have become better, and Tunisia is actually planning to
become an exporter of gas to Europe. The power sector will play a key role in the growth of demand for
gas. According to the forecast reported on the Web site of the Arab Union of Producers, Transporters and
Distributors of Electricity (AUPTDE) by STEG, Tunisia’s electricity and gas company, the peak demand
is expected to grow to 3,810 megawatts (MW) by 2015 and to 4,410 MW by 2020 (representing a CAGR
of 3.9 percent). Energy generation is expected to grow to 18,070 gigawatt hours (GWh) by 2015 and to
21,170 GWh by 2020 (at a CAGR of 3.6 percent). Based on power sector forecasts, gas demand for
power is likely to increase from 3.95 bcm in 2010 to 5.63 bcm by 2020.
Morocco
The energy strategy of the government16
estimates that demand for gas in the power sector will grow to 4
bcm by 2020 and to 6 bcm by 2030. Adding the needs of other sectors, gas demand has been estimated at
5 bcm by 2020 (Fattouh and Stern 2011). By 2030, demand could be 78 bcm.
Libya
The power sector is the key driver of domestic demand for gas. According to the national electrical utility,
GECOL,17
peak demand and energy generation through 2020 are forecasted to grow by 9.9 percent and
16
http://www.mem.gov.ma.
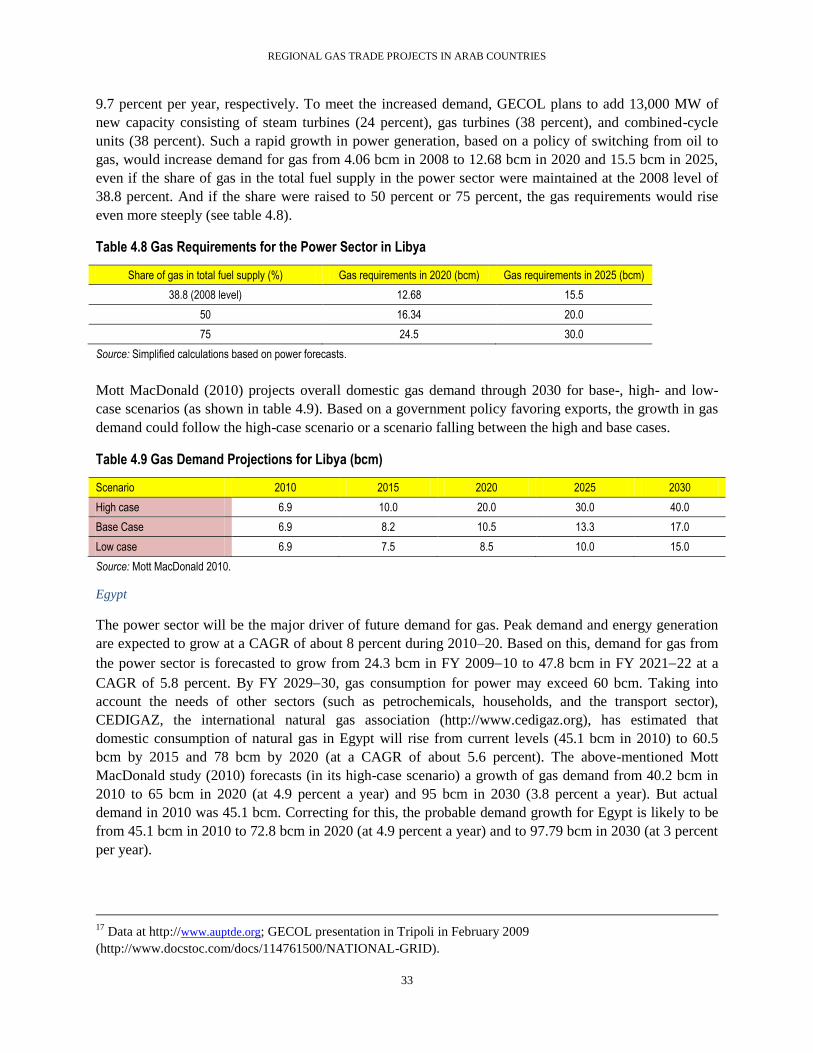
REGIONAL GAS TRADE PROJECTS IN ARAB COUNTRIES
33
9.7 percent per year, respectively. To meet the increased demand, GECOL plans to add 13,000 MW of
new capacity consisting of steam turbines (24 percent), gas turbines (38 percent), and combined-cycle
units (38 percent). Such a rapid growth in power generation, based on a policy of switching from oil to
gas, would increase demand for gas from 4.06 bcm in 2008 to 12.68 bcm in 2020 and 15.5 bcm in 2025,
even if the share of gas in the total fuel supply in the power sector were maintained at the 2008 level of
38.8 percent. And if the share were raised to 50 percent or 75 percent, the gas requirements would rise
even more steeply (see table 4.8).
Table 4.8 Gas Requirements for the Power Sector in Libya
Share of gas in total fuel supply (%) Gas requirements in 2020 (bcm) Gas requirements in 2025 (bcm)
38.8 (2008 level) 12.68 15.5
50 16.34 20.0
75 24.5 30.0
Source: Simplified calculations based on power forecasts.
Mott MacDonald (2010) projects overall domestic gas demand through 2030 for base-, high- and low-
case scenarios (as shown in table 4.9). Based on a government policy favoring exports, the growth in gas
demand could follow the high-case scenario or a scenario falling between the high and base cases.
Table 4.9 Gas Demand Projections for Libya (bcm)
Scenario 2010 2015 2020 2025 2030
High case 6.9 10.0 20.0 30.0 40.0
Base Case 6.9 8.2 10.5 13.3 17.0
Low case 6.9 7.5 8.5 10.0 15.0
Source: Mott MacDonald 2010.
Egypt
The power sector will be the major driver of future demand for gas. Peak demand and energy generation
are expected to grow at a CAGR of about 8 percent during 2010–20. Based on this, demand for gas from
the power sector is forecasted to grow from 24.3 bcm in FY 200910 to 47.8 bcm in FY 202122 at a
CAGR of 5.8 percent. By FY 202930, gas consumption for power may exceed 60 bcm. Taking into
account the needs of other sectors (such as petrochemicals, households, and the transport sector),
CEDIGAZ, the international natural gas association (http://www.cedigaz.org), has estimated that
domestic consumption of natural gas in Egypt will rise from current levels (45.1 bcm in 2010) to 60.5
bcm by 2015 and 78 bcm by 2020 (at a CAGR of about 5.6 percent). The above-mentioned Mott
MacDonald study (2010) forecasts (in its high-case scenario) a growth of gas demand from 40.2 bcm in
2010 to 65 bcm in 2020 (at 4.9 percent a year) and 95 bcm in 2030 (3.8 percent a year). But actual
demand in 2010 was 45.1 bcm. Correcting for this, the probable demand growth for Egypt is likely to be
from 45.1 bcm in 2010 to 72.8 bcm in 2020 (at 4.9 percent a year) and to 97.79 bcm in 2030 (at 3 percent
per year).
17
Data at http://www.auptde.org; GECOL presentation in Tripoli in February 2009
(http://www.docstoc.com/docs/114761500/NATIONAL-GRID).
REGIONAL GAS TRADE PROJECTS IN ARAB COUNTRIES
34
Iraq
The power sector has a severe shortage of gas and will be the main driver of gas (methane) demand. Gas
demand from the power sector is forecast to grow from current levels to 28.95 bcm by 2020 and to 44.46
bcm by 2030. Overall gas demand in the country (including linked industries based on gas) is expected to
grow to 35.16 bcm by 2020 and to 61 bcm by 2030.
Jordan
The power sector is the key driver of demand growth for gas. Power sector forecasts indicate an annual
peak demand growth of 6.4 percent, from 2,670 MW to 4,979 MW during the period 2010–20. Energy
generation is expected to increase at an annual rate of 7.2 percent, from 14.8 terawatt hours (TWh) in
2010 to 29.6 TWh in 2020. Jordan has converted most of its power plants to use gas as fuel. And the
planned new thermal plants are mostly based on gas. Mott MacDonald (2010) forecasts that gas imports
into Jordan will increase to 5.6 bcm by 2020 and to 8.1 bcm by 2030.
Syria
The power sector will continue to be the key driver of gas demand growth. Peak demand and energy
generation are forecast to grow by 6.36.6 percent a year during 2010–20. On that basis, gas demand is
expected to increase from about 6.6 bcm in 2010 to 15 bcm in 2020. The government projects that overall
gas demand will be 20 bcm by 2020. Mott MacDonald (2010) projects an increase in imports of 4.4 bcm
in 2020 and 10.9 bcm in 2030.
Lebanon
The power sector will be the key driver of domestic gas demand growth. During 2010–20, peak demand
is expected to grow from 2,510 MW to 3,715 MW, a rate of 4 percent per year, while energy generation is
expected to grow at 7.5 percent a year, from 11.2 TWh to 23.1 TWh. Lebanon uses highly expensive,
low-sulfur fuel oil and diesel, which it wishes to replace with natural gas. If the entire generation in 2020
were to be generated using combined-cycle plants, its natural gas need would be 45 bcm. Since it may
have to use a mix of combined-cycle units, open-cycle gas turbines, and some steam turbines, its gas need
is likely to be 7 bcm by 2020 and 10 bcm by 2030. An estimate of 5 bcm was indicated for 2015 in
Fattouh and Stern (2011).
Bahrain
Power sector gas consumption accounted for about 45 percent of Bahrain’s total gas consumption in
2010. Nearly all of the country’s generation was based on gas. Peak demand and energy generation are
expected to grow at 11.1 percent a year to reach 7,783 MW and 37.8 TWh, respectively, by 2020. Based
on this, gas demand for the power sector alone could be around 13 bcm by 2020. Assuming similar
growth for industries and petrochemicals, domestic gas demand in 2020 would be on the order of 29 bcm.
Fattouh and Stern (2011) suggest a gas demand of 13 to 16 bcm by 2015, influenced mainly by the
current supply constraints. Adopting a modest growth rate of 2.5 percent per year over the next decade,
domestic demand could reach 37 bcm by 2030.
Kuwait
Domestic consumption of gas in Kuwait, at 14.4 bcm in 2010, already exceeds domestic production.
Kuwait’s gas shortages in recent years have constrained growth in demand. About 30 percent of the
REGIONAL GAS TRADE PROJECTS IN ARAB COUNTRIES
35
available supply went to the power sector in 2009. Peak demand and annual generation are expected to
grow at about 7.4 percent per year—to 22,193 MW and 116.1 TWh, respectively, by 2020. Gas
consumption for the power sector alone could grow from 5.6 bcm in 2010 to 11.39 bcm in 2020,
assuming that about a third of generation would be based on natural gas, as was the case in 2010. Based
on this, the overall demand in Kuwait could grow by some 38 bcm by 2020, provided adequate imports
can be arranged. This implies a consumption growth rate of greater than 10 percent per year during 2010–
20. Adopting a growth rate of 4.6 percent per year for the subsequent decade (less than half the previous
rate), demand could grow to 60 bcm by 2030.
Saudi Arabia
Saudi Arabia consumed 83.9 bcm of gas in 2010, 23 percent of which went to the power sector and the
rest to petrochemicals and other industries. ARAMCO has projected (World Bank 2009b) that gas
consumption will increase at about 3 percent per year from 2007 through 2030, to reach 111.6 bcm in
2020 and 150 bcm in 2030. Fattouh and Stern (2011) suggest a somewhat more accelerated demand of
113 bcm by 2015. On this basis, demand in 2020 could be around 130 bcm, while for 2030 the level
suggested by ARAMCO will be retained. According to the fuel allocation policy, the level of gas supply
will remain at the current levels through 202223. Most of the demand increases will come from
petrochemicals, fertilizers, and other industries. Supply constraints are expected to emerge around 2017,
opening the question of gas imports.
Qatar
Qatar consumed 20.4 bcm of gas in 2010. Fattouh and Stern (2011) estimate that demand will grow to
34.38 by 2015 and 53 bcm by 2020. If growth continues at 910 percent, demand in 2030 could approach
85 bcm. The share of the power sector in total demand will increase from 22 percent in 2010 to 24 percent
in 2015 and 30 percent in 2020.
United Arab Emirates
The UAE’s gas consumption in 2010 was 60.5 bcm, well above the domestic production of 51 bcm. But
according Fattouh and Stern (2011, chapter 12), supply constrained consumption, which stood at 60.5
bcm in 2010 but is expected to increase to 88.5 bcm by 2015 and 107.5 bcm by 2020. Given likely
production increases, the supply constraints will prevail throughout, necessitating substantial imports.
Assuming a growth rate of 3 to 4 percent a year, demand might grow to 150 bcm by 2030.
Oman
Domestic consumption in 2010 was about 17.51 bcm. Of that, 36 percent went for power, 44 percent for
industry, and 20 percent for the oil and gas sector. Peak demand and electricity generation are expected to
grow at 9 percent per year over the decade. Overall domestic gas demand is expected to grow at 8.75
percent per year through 2020, and at the slower rate of 5 percent per year from 2020 to 2030. On this
basis, domestic demand will grow to 40.49 bcm in 2020 and 65.95 bcm in 2030.
Yemen
The domestic gas industry in Yemen is nascent. Consumption in 2010 was only 0.76 bcm, of which about
0.6 bcm went to the power sector. Based on power sector plans that foresee demand for gas in the power
sector growing to about 4 bcm by 2020, overall demand may be around 5 bcm by then. Overall demand
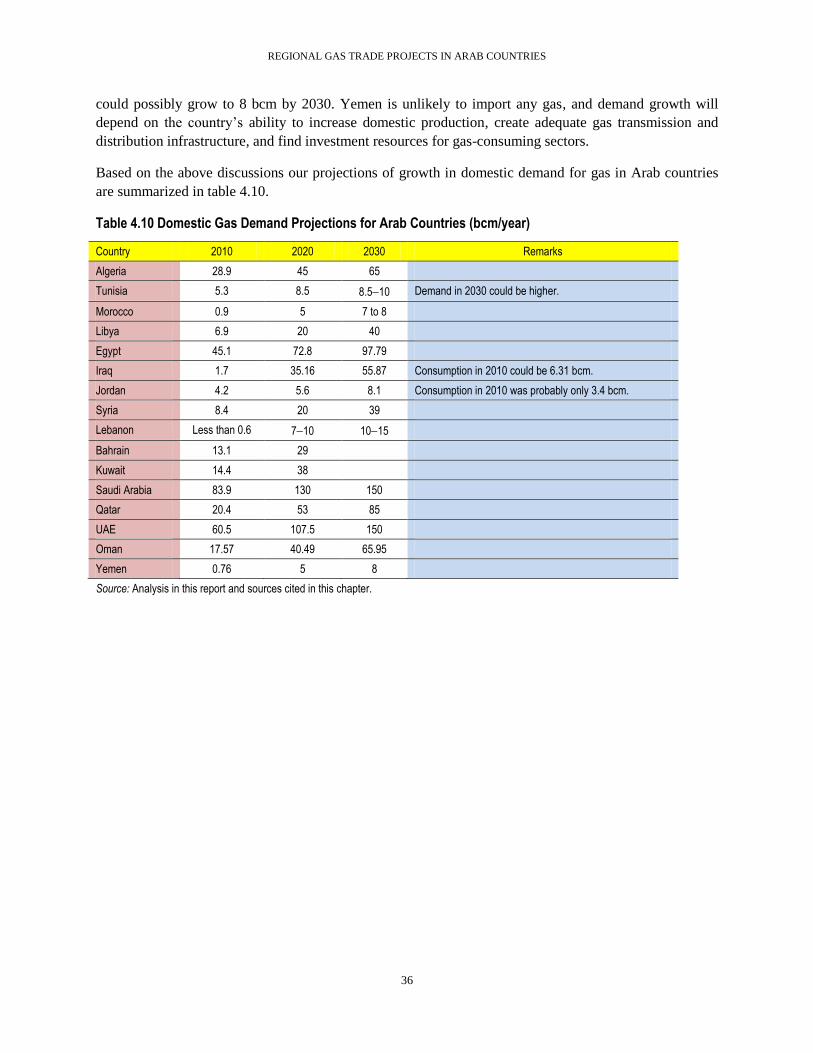
REGIONAL GAS TRADE PROJECTS IN ARAB COUNTRIES
36
could possibly grow to 8 bcm by 2030. Yemen is unlikely to import any gas, and demand growth will
depend on the country’s ability to increase domestic production, create adequate gas transmission and
distribution infrastructure, and find investment resources for gas-consuming sectors.
Based on the above discussions our projections of growth in domestic demand for gas in Arab countries
are summarized in table 4.10.
Table 4.10 Domestic Gas Demand Projections for Arab Countries (bcm/year)
Country 2010 2020 2030 Remarks
Algeria 28.9 45 65
Tunisia 5.3 8.5 8.510 Demand in 2030 could be higher.
Morocco 0.9 5 7 to 8
Libya 6.9 20 40
Egypt 45.1 72.8 97.79
Iraq 1.7 35.16 55.87 Consumption in 2010 could be 6.31 bcm.
Jordan 4.2 5.6 8.1 Consumption in 2010 was probably only 3.4 bcm.
Syria 8.4 20 39
Lebanon Less than 0.6 710 1015
Bahrain 13.1 29
Kuwait 14.4 38
Saudi Arabia 83.9 130 150
Qatar 20.4 53 85
UAE 60.5 107.5 150
Oman 17.57 40.49 65.95
Yemen 0.76 5 8
Source: Analysis in this report and sources cited in this chapter.
Chapter 5. Existing and Potential Gas Trade Projects in Arab Countries
The existing level of gas trade in Arab countries was discussed briefly in chapter 2. In this chapter, we
will review the existing trade facilities, identify the potential sellers and buyers in the regional market
among Arab countries, and identify potential pipeline projects and liquefied natural gas (LNG) facilities
to increase the volume of trade within the region. We will also look briefly at the approach to pricing to
facilitate such trade.
Existing Export Facilities
Much of the existing facilities and those being planned or built relate to international LNG exports or
pipeline gas exports to Europe.
Algeria
Algeria has two natural gas liquefaction plants located at Azrew and Skikda with a total capacity of 22
million tons/year. Two new trains are being added there. Thus, Skikda will have a new train with a
capacity of 4.5 million tons/year in 2012, and Arzew will have a new train with an annual capacity of 4.7
million tons by 2013. There are three sets of pipelines from Algeria to southern Europe; another is in an
advanced stage of planning and investment.
The Transmed Gas Pipeline (also known as the Enrico Mattei pipeline), 48 inches in diameter and
commissioned in 1983, connects Algeria to Italy via Tunisia. A parallel second pipeline, also with a 48-
inch diameter, was commissioned in 1998. The Algerian section is owned by Sonatrach of Algeria, the
Tunisian section by the Tunisian government, and the submarine section from Tunisia to Sicily by a joint
venture company in which ENI of Italy and Sonatrach hold equal stakes. The total capacity of these two
lines is 24 billion cubic meters (bcm)/year. There are ongoing efforts to expand this capacity to 33.5
bcm/year (figure 5.1).
The GME Maghreb Europe Pipeline (also known as the Pedro Duran Farrell pipeline), 48 inches in
diameter and commissioned in 1996, connects Algeria to Spain via Morocco. Its capacity until 2000 was
10 bcm; this was raised to 12 bcm in 2004. With additional compressors, the capacity could reach 1819
bcm (figure 5.1).
The Algerian section is owned and operated by Sonatrach and the Moroccan segment by a joint venture
company comprising Sagane of Spain, Transgas of Portugal, and SNPP of Morocco. The Gibraltar
crossing is owned by Engas of Spain and the Moroccan government. The total capital cost of the line is
reported to be $3.45 billion.
The Medgaz Pipeline that connects Algeria to Spain was commissioned in March 2011 after a long delay.
Medgaz links the Hassi R’Mel gas field in Algeria to the Spanish town of Almeria via the coastal town of
Beni Saf in Algeria. The submarine portion of the line is 450 kilometers (km) long, while the Algerian
land portion of the line is 638 km long and has a diameter of 48 inches. Its initial annual capacity is 8
bcm, with the possibility of expansion to 18 bcm (figure 5.2). The line is owned and operated by a joint
venture involving Sonatrach, 36 percent; Cepsa 20, percent; Iberdrola, 20 percent; Endesa, 12 percent;
and Gaz de France, 12 percent. The capital cost of the line was reported at $1 billion.

REGIONAL GAS TRADE PROJECTS IN ARAB COUNTRIES
38
Figure 5.1 Transmed and Maghreb-Europe Gas Pipelines
Source: Stern 2006.
Figure 5.2 Medgaz Pipeline
Source: ARPC 2011.
The Galsi Pipeline, intended to connect Algeria directly to Italy, has been the subject of planning and
investment discussions since 2005, but its construction does not appear to have commenced. The line will
run from the Hassi R’Mel gas field to the Algerian coastal town of El Kala (640 km), from which a
submarine pipeline will be laid to Sardinia (310 km) (figure 5.3)
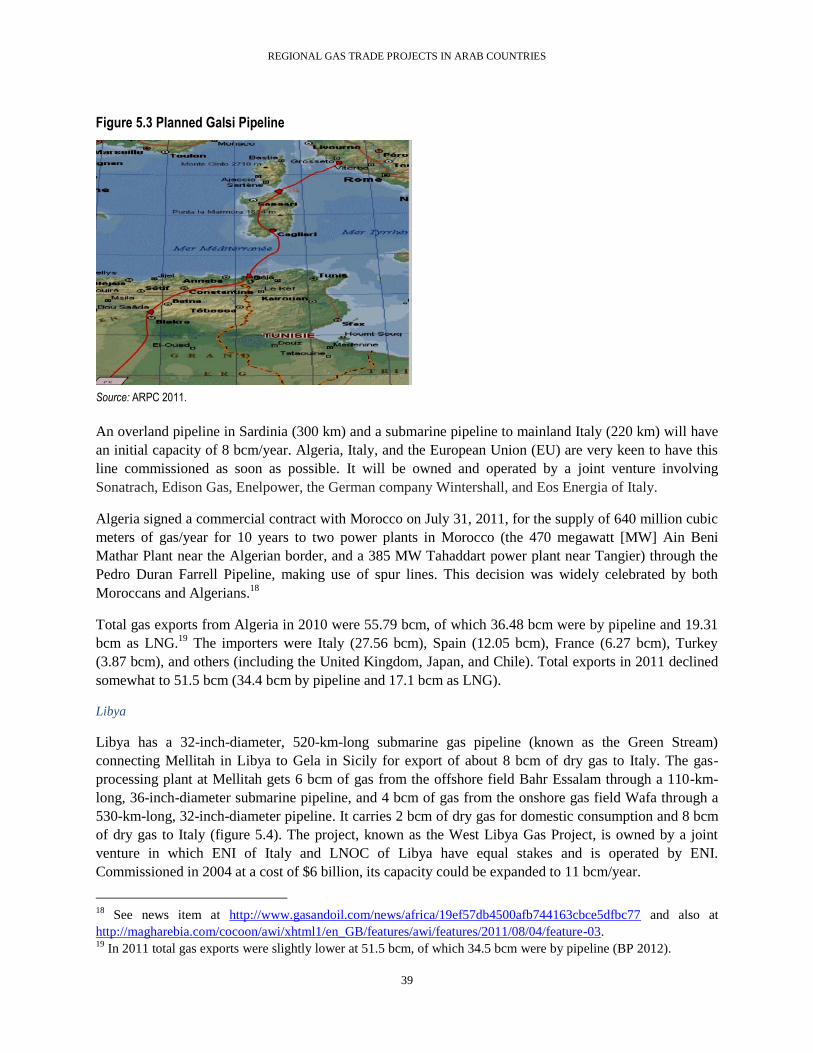
REGIONAL GAS TRADE PROJECTS IN ARAB COUNTRIES
39
Figure 5.3 Planned Galsi Pipeline
Source: ARPC 2011.
An overland pipeline in Sardinia (300 km) and a submarine pipeline to mainland Italy (220 km) will have
an initial capacity of 8 bcm/year. Algeria, Italy, and the European Union (EU) are very keen to have this
line commissioned as soon as possible. It will be owned and operated by a joint venture involving
Sonatrach, Edison Gas, Enelpower, the German company Wintershall, and Eos Energia of Italy.
Algeria signed a commercial contract with Morocco on July 31, 2011, for the supply of 640 million cubic
meters of gas/year for 10 years to two power plants in Morocco (the 470 megawatt [MW] Ain Beni
Mathar Plant near the Algerian border, and a 385 MW Tahaddart power plant near Tangier) through the
Pedro Duran Farrell Pipeline, making use of spur lines. This decision was widely celebrated by both
Moroccans and Algerians.18
Total gas exports from Algeria in 2010 were 55.79 bcm, of which 36.48 bcm were by pipeline and 19.31
bcm as LNG.19
The importers were Italy (27.56 bcm), Spain (12.05 bcm), France (6.27 bcm), Turkey
(3.87 bcm), and others (including the United Kingdom, Japan, and Chile). Total exports in 2011 declined
somewhat to 51.5 bcm (34.4 bcm by pipeline and 17.1 bcm as LNG).
Libya
Libya has a 32-inch-diameter, 520-km-long submarine gas pipeline (known as the Green Stream)
connecting Mellitah in Libya to Gela in Sicily for export of about 8 bcm of dry gas to Italy. The gas-
processing plant at Mellitah gets 6 bcm of gas from the offshore field Bahr Essalam through a 110-km-
long, 36-inch-diameter submarine pipeline, and 4 bcm of gas from the onshore gas field Wafa through a
530-km-long, 32-inch-diameter pipeline. It carries 2 bcm of dry gas for domestic consumption and 8 bcm
of dry gas to Italy (figure 5.4). The project, known as the West Libya Gas Project, is owned by a joint
venture in which ENI of Italy and LNOC of Libya have equal stakes and is operated by ENI.
Commissioned in 2004 at a cost of $6 billion, its capacity could be expanded to 11 bcm/year.
18
See news item at http://www.gasandoil.com/news/africa/19ef57db4500afb744163cbce5dfbc77 and also at
http://magharebia.com/cocoon/awi/xhtml1/en_GB/features/awi/features/2011/08/04/feature-03. 19
In 2011 total gas exports were slightly lower at 51.5 bcm, of which 34.5 bcm were by pipeline (BP 2012).

REGIONAL GAS TRADE PROJECTS IN ARAB COUNTRIES
40
Figure 5.4 West Libya Gas Project
Source: http://www.eni.com/en_IT/innovation-technology/eni-projects/western-lybian-gas-project/western-lybian-gas-project.shtml.
Exxon built an LNG facility at Marsa el-Brega in 1971 with a nameplate capacity of 2.3 million tons/year,
and Libya has been an LNG exporter since then. But owing to historic developments in Libya, the
facility’s production capacity has declined to 0.7 million tons/year and it is being operated by a subsidiary
of the Libyan national oil company. Royal Dutch Shell and the subsidiary have had agreements since
2005 to rehabilitate and upgrade capacity to 3.2 million tons/year (possibly by constructing a new plant
and prospecting for additional gas supplies). Plans to construct new LNG facilities at Mellitah and Ras
Lanuf are also being pursued.
In 2010 Libya exported 9.41 bcm of gas by pipeline to Italy and 0.34 bcm of LNG to Spain. But exports
declined steeply in 2011 to 2.4 bcm (2.3 bcm by pipeline and 0.1 bcm as LNG) on account of the political
turmoil.
Egypt
Egypt commenced gas exports through the Arab Gas Pipeline (AGP) in 2003 and exports of LNG from
2005. Exports of gas through the Arish-Ashkelon Pipeline to Israel commenced in 2008.
The AGP was constructed in several phases (figure 5.5). So far a total cost of about $900 million has been
incurred. The first phase involved the construction of a 265-km-long pipeline (with a 36-inch diameter
and an annual capacity of 10 bcm) from Arish in Egypt to Aqaba in Jordan. It included a 15-km-long
submarine pipeline at a depth of 80 meters. This was completed at a cost of $200 million in July 2003,
and deliveries began for the power station in Aqaba of Jordan at a rate of 1.1 bcm/year. During 200309
supply to Jordan increased to about 2.85 bcm/year.

REGIONAL GAS TRADE PROJECTS IN ARAB COUNTRIES
41
Figure 5.5 Arab Gas Pipeline Figure 5.6 Arish-Ashkelon Gas Pipeline to Israel
Source: APRC 2011.
In the second phase that ended in 2005, a 390-km-long, 36-inch-diameter pipeline from Aqaba to El
Rehab in Jordan was completed at a cost of $300 million, and by February 2006 gas supply to the power
stations of Samra and El Rehab had commenced.
In the third phase ending in July 2008, the 30-km-long, 36-inch-diameter pipeline from El Rehab to the
Syrian border was completed at a cost of $35 million. In the fourth phase ending in February 2008, the
construction of a 324-km-long, 36-inch-diameter pipeline from the Syria-Jordan border to Homs in Syria
was completed, and Syria began receiving Egyptian gas at the annual rate of 0.9 bcm. This rate is to be
stepped up gradually to 2.2 bcm/year by 2013. Import volumes so far have been very modest, and in 2011
the supply rate seems to have fallen to 1.3 million cubic meters/day (or 0.475 bcm/year) with major
supply interruptions. All imported gas has been delivered to the Deir Ali Power Station. The agreed price
is believed to be $5/million btu (mmbtu) for the gas, plus $2/mmbtu for transportation charges to the
Egyptian Natural Gas Holding Company (EGAS). There is also a report that the price in 2009 was
$5.25/mmbtu and that the Egyptian government was reviewing the agreement based on popular agitation
against gas exports in 2010 and 2011 (APRC 2011). Currently Egypt does not supply any gas to Syria.
In October 2009 Lebanon started receiving gas through a spur from Homs to Tripoli (32 km long) and a
power plant near Tripoli under a 15-year-swap arrangement that was expected to enable Lebanon to
obtain 0.6 bcm of Syrian gas/year in lieu of the Egyptian gas deliveries to Syria. But the supply lasted
only for a few months and did not exceed 0.3 bcm.
In the final phase, the aim is to connect Homs to Aleppo in Syria (240-km, 36-inch pipeline) and then on
to Kilis on the Turkey-Syria border (64 km) to enable the flow of Egyptian gas to Turkey and beyond.
But as questions about the availability of Egyptian gas emerged, it was decided to undertake a 64-km
REGIONAL GAS TRADE PROJECTS IN ARAB COUNTRIES
42
pipeline from Kilis to Aleppo to enable the flow of gas from Turkey to the Syrian system,20
and later to
connect Homs to Aleppo when gas availability questions are settled.
Over the past two years political problems in Egypt have inhibited any increases in gas exports, and
explosions of the gas pipeline in Egyptian territory have interrupted supplies. The minimum guaranteed
offtake through the pipeline via Jordan is 1.2 bcm, but because of energy shortages Jordan is seeking to
maximize its annual import volume to 4 bcm by 2011-12. It is however unlikely to receive from Egypt
even the minimum guaranteed offtake.
Jordan imports Egyptian gas under the terms of a 30-year state-to-state agreement concluded in June 2001
that provides for Egypt to cover Jordan’s gas requirements in full up to 2030. The initial price was
believed to be about $0.90/mmbtu. Deliveries began at a rate of 1.1 bcm/year, most of which was utilized
by the Aqaba Power Station. These rose to 2.3 bcm in 2007. In September 2007 Jordan negotiated a new
agreement with Egypt for the supply of an additional 0.55 bcm/year of gas at a higher price of
$4.50/mmbtu. As a result, Egypt stepped up its gas deliveries to Jordan to 2.9 bcm/year in the second
quarter of 2008. The additional gas was supplied at the higher price, and this price was then applied to all
of Jordan’s imports of Egyptian gas from the start of 2009 (APRC 2011).
Information from another source seems to suggest that prices remain confidential but are believed to be
similar to those at the Syrian border, namely $5/mmbtu for the gas and $2/mmbtu for transport charges of
the Egyptian gas company. Price variation clauses include ceiling and floor prices (Fattouh and Stern
2011).
Although the Arish-Ashkelon gas pipeline is not officially part of the AGP project, it branches off from
Arish on the same pipeline in Egypt and extends up to the coastal city of Ashkelon in Israel (figure 5.6).
This submarine pipeline, which is about 90 km long and has the capacity to transmit about 7.5 bcm/year,
was built and is operated by the East Mediterranean Gas Company (EMG), which is currently owned by
several Egyptian (38 percent) and Israeli (37 percent) companies, as well as PTT of Thailand (25 percent).
The line started exporting gas to Israel in May 2008, a move that soon elicited fierce protests from the
Egyptian public. The price agreed in the 2005 negotiations was believed to be $2.50$2.75/mmbtu. Initial
quantities contracted ranged from 1.2 to 1.7 bcm/per year. In mid-2009 the prices reportedly increased to
$4.5$5/mmbtu. More recently, supplies have been subject to frequent disruption, and transactions are
being reviewed. Israel has recently made significant gas discoveries that would meet its domestic needs
and leave surpluses for export.21
In this context Israel may not need any gas imports from Egypt. Because
of present gas shortages in Egypt, there is no gas supply to Syria and Lebanon through the AGP. Gas
supplies to Jordan were also interrupted for several months during 2011 and 2012. The unreliability of the
AGP gas supply has thus become a major example of the political risks associated with pipeline gas trade.
Egypt has two natural gas liquefaction plants, one at Damietta (called the SEGAS plant) with a single
train with a design capacity of 4.8 million tons/year, and the other at Idku, called ELNG, with two trains
each with a capacity of 3.6 million tons/year. It has also provision for building an additional six trains in
the future.
20
This pipeline was scheduled to be completed by early 2012, but the current status is not clear. 21
More recently it was reported that supplies have been stopped completely on account of certain contract disputes,
with Egypt claiming payment defaults and the importers disputing it (http://www.ft.com/cms/s/0/1620d1ca-8cae-
11e1-9758-00144feab49a.html#axzz29DcB0Xuf).
REGIONAL GAS TRADE PROJECTS IN ARAB COUNTRIES
43
SEGAS was constructed in 2004 by a joint venture comprising Union Fenosa of Spain (80 percent),
EGAS (10 percent), and ENI-EGPC (10 percent) at a cost of $1.3 billion. It operates on a 25-year tolling
arrangement with EGAS and EGPC.
The ELNG plant was built in 2005 at a cost of $1.9 billion. While the common facilities are owned by the
Egyptian LNG holding company (British Gas, 38 percent; Petronas, 38 percent; EGAS and EGPC, 12
percent each), each LNG train is owned by a different company. The first train is owned by the El Behera
Natural Gas Liquefaction Company (British Gas, 35.5 percent; Petronas, 35.5 percent; EGPC, 12 percent;
EGAS, 12 percent; and Gaz de France, 5 percent). And the second train is owned by the Idku Gas
Company, in which British Gas and Petronas have a 38 percent holding each, and EGPC and EGAS 12
percent each.
In 2010 Egypt exported 9.71 bcm of gas as LNG to Spain (2.62 bcm), the United States (2.07 bcm), and
14 other countries all over the world (5.02 bcm). Pipeline gas exports were to Jordan (2.52 bcm), Israel
(2.10 bcm), Syria (0.6 bcm), and Lebanon (0.15 bcm). In 2011 LNG exports declined to 8.6 bcm and
pipeline exports appeared to have become almost insignificant, owing to political disturbances.
Qatar
Qatar is the world’s largest exporter of LNG. All LNG in Qatar is produced and exported by two
companies: Qatargas and RasGas. Each has several trains of LNG production. Each train or group of
trains has different foreign partners, but Qatar Petroleum (a state-owned company) has a majority stake in
all of them. And all the LNG trains are located in the Ras Laffan Industrial City. Qatargas has four
subsidiaries and seven trains with a total capacity of 41.1 million tons/year, and RasGas has also three
subsidiaries and seven trains with a total capacity of 36 million tons/year. LNG is exported all over the
world. Much of the exports are based on long-term contracts linked to oil prices, but in the last three or
four years, increasing amounts of LNG are being sold in spot markets.
In 2010 Qatar exported 75.75 bcm of LNG to various parts of the world. The importers included the
United Kingdom (13.89 bcm), India (10.53 bcm), Japan (10.15 bcm), South Korea (10.16), Taiwan (3.75
bcm), China (1.61 bcm), and several other European, North American, and South American countries.
LNG exports increased in 2011 dramatically to 102.6 bcm. Exports to Asia were the largest at 48.6 bcm,
followed by those to Europe (43.4 bcm). North America and South America had only a modest share at
6.5 bcm and 1.7 bcm, respectively.
A Gulf Cooperation Council (GCC) gas pipeline exporting gas from Qater to other GCC countries (Saudi
Arabia, Bahrain, Kuwait, and the United Arab Emirates [UAE]) had been under discussion since the late
1980s but was stalled on account of border disputes, political tensions, and diplomatic squabbles. Saudi
Arabia denied transit rights and withdrew from participation. The idea of a limited pipeline serving only
the UAE and Oman emerged in 1999 and was pursued by Dolphin Energy Ltd. Thus, at present, the only
gas pipeline exporting gas is Dolphin—built, owned, and operated by Dolphin Energy (51 percent by the
Mubadala Development Company, which is 100 percent owned by the Abu Dhabi government, 24.5
percent by Total, and 24.5 percent by Occidental Petroleum) at a total capital cost of $10 billion.
Two 36-inch-diameter submarine pipelines (70 and 90 km long) with a capacity of about 20 bcm/year
connect the production platforms of Dolphin Energy in the North Field to the gas-processing plant in Ras
Laffan. The dry gas is then transported to the receiving facilities at Taweela in Abu Dhabi (the UAE)
through a 364-km-long submarine gas pipeline with a diameter of 48 inches. Its ultimate design capacity

REGIONAL GAS TRADE PROJECTS IN ARAB COUNTRIES
44
is about 33 bcm/year, but it is currently operated at 20 bcm/year of refined methane gas. The gas from the
receiving station at Taweela is distributed to various parts of the UAE and some part of Oman through the
Eastern Gas Distribution System (EGD). With the construction of a 182-km-long pipeline (24-inch
diameter) from Al Ain of the EGD to Fujairah in 2004, supplies have commenced to most parts of the
UAE. Also, from the receiving facilities of Taweela a 244-km-long pipeline with 48-inch diameter was
constructed to transport gas to Fujairah (in the UAE) through a difficult terrain. and was commissioned in
December 2010. After this gas also reached Oman by reversing the flow of the Fujairah-Al Ain pipeline.
Dolphin Energy has signed long-term gas supply contracts with the Abu Dhabi Water and Electricity
Authority, Dubai Supply Authority (DUSUP), and Oman Oil Company. The agreements provide for
supply of Dolphin natural gas to each customer for terms of 25 years. Exports through the Dolphin
Pipeline system have been around 1920 bcm/year since 2008 (figure 5.7).
Figure 5.7 Dolphin Pipeline System
Source: http://www.dolphinenergy.com.
Originally the Dolphin Pipeline was conceived to go up to Kuwait and Bahrain, but these portions could
not be pursued on account of Saudi Arabian objections. It is believed that the delivered price in the UAE
and Oman is about $1.35/mmbtu.22
This price was considered “political” rather than commercial.
Disagreements over the price for additional supplies has been the major stumbling block to expanding
supplies to the level of 33 bcm/year. Unless buyers are prepared to pay a commercial price related to the
current international prices, Qatar is not inclined to expand supplies. In 2010 Qatar exported gas by
pipeline to the UAE (about 17.25 bcm) and Oman (1.90 bcm). In 2011 the volume increased marginally
to 19.3 bcm.
22
http://www.stroytransgaz.com/press-center/smi/aps-review-gas-market-trends/17_01_2011.
REGIONAL GAS TRADE PROJECTS IN ARAB COUNTRIES
45
United Arab Emirates
The UAE exported a total of 7.9 bcm of LNG in 2010. Of this Japan imported 6.86 bcm, and other
countries (Brazil, China, Kuwait, South Korea, and Taiwan) imported 1.04 bcm. This included a quantity
of 0.25 bcm of LNG to Kuwait. Its LNG plant, located on Das Island and getting its gas supplies from the
Umm Shaif, Lower Zakum, and Bunduq oil fields, started with two trains in 1977, each with a capacity of
2.8 bcm/year, and expanded to include a third train with a capacity of 3.1 bcm/year in 1995. It is owned
and operated by ADGAS (Abu Dhabi national oil company, 70 percent; Mitsui, 15 percent; BP, 10
percent; and Total, 5 percent). It has been supplying LNG based on long-term contracts, mainly (nearly
85 percent) with TEPCO of Japan and has also been selling smaller quantities in other world markets,
maintaining an export level of 77.9 bcm/year. The export in 2011 was marginally higher at 8.0 bcm. The
long-term contracts are due to expire in 2019 and at that time a decision will be made as to whether the
production will be continued, expanded, or even stopped to make the gas available for domestic
consumption.
Oman
Oman exports gas mainly in the form of LNG. The liquefaction plant, located at Qalhat, has three trains,
each with an effective annual capacity of 3.5 million tons of LNG or 4.8 bcm of gas. The first two units,
which started functioning from April 2000, are owned by Oman LNG; the Omani state has a 51 percent
stake, followed by Shell Gas (30 percent), Total (5.54 percent), and five other Asian companies (13.46
percent). The third train, which started operating in December 2005, is owned by Qalhat LNG, in which
the Oman state has a 46.84 percent stake followed by Oman LNG (36.8 percent), Union Fenosa (7.6
percent), and three Japanese companies (each with a 3 percent stake). Qalhat LNG has tied up its
production with long-term contracts, while Oman LNG has long-term contracts for about 4.8 million tons
and sells the balance in spot markets or on medium-term contracts. In the context of rapidly rising
domestic demand, the country is not renewing the expired contracts and it is not clear what stand the
country will take when most of the long-term contracts come to an end during 202426. Since 2008 gas
appears to have been diverted away from LNG to domestic consumption, as the liquefaction units have
been operated at less than the rated capacity and export volumes were less than originally planned for. In
2010 Oman exported 11.49 bcm of LNG. The importers were South Korea (6.11 bcm), Japan (3.8 bcm),
Kuwait (0.91 bcm), Taiwan (0.5 bcm), and Spain (0.17 bcm). Exports in 2011 declined to 10.9 bcm of
LNG.
In addition Oman has one gas pipeline from the Bukha gas field to Ras al-Khaimah in the UAE,
supplying to the cement companies and fertilizer plant there. Oman is also supplying gas to a power plant
at Qidfa in the Fujairah Emirate of the UAE. Since all the components of the Dolphin gas pipeline were
completed, this pipeline has been used in the reverse direction to supply Qatari gas to Oman. In the
context of Dolphin gas imports, Oman has concluded a contract with Ras al-Khaimah in the UAE for the
supply of 2 bcm of gas in the winter months (when Oman’s gas demand is low) at a price of $5/mmbtu,
substantially higher than its import cost from Qatar of about $1.5/mmbtu. The volumes exchanged are
only partially shown in the export statistics data from BP.
Yemen
The Yemen LNG Company (YLNG) owns and operates the liquefaction plant at Balhalf, a southern
coastal city. It has two LNG trains with a total capacity of 6.7 million tons/year of LNG (about 9.25 bcm
of gas/year). The first train was commissioned in 2009 and first deliveries were made in November 2009.
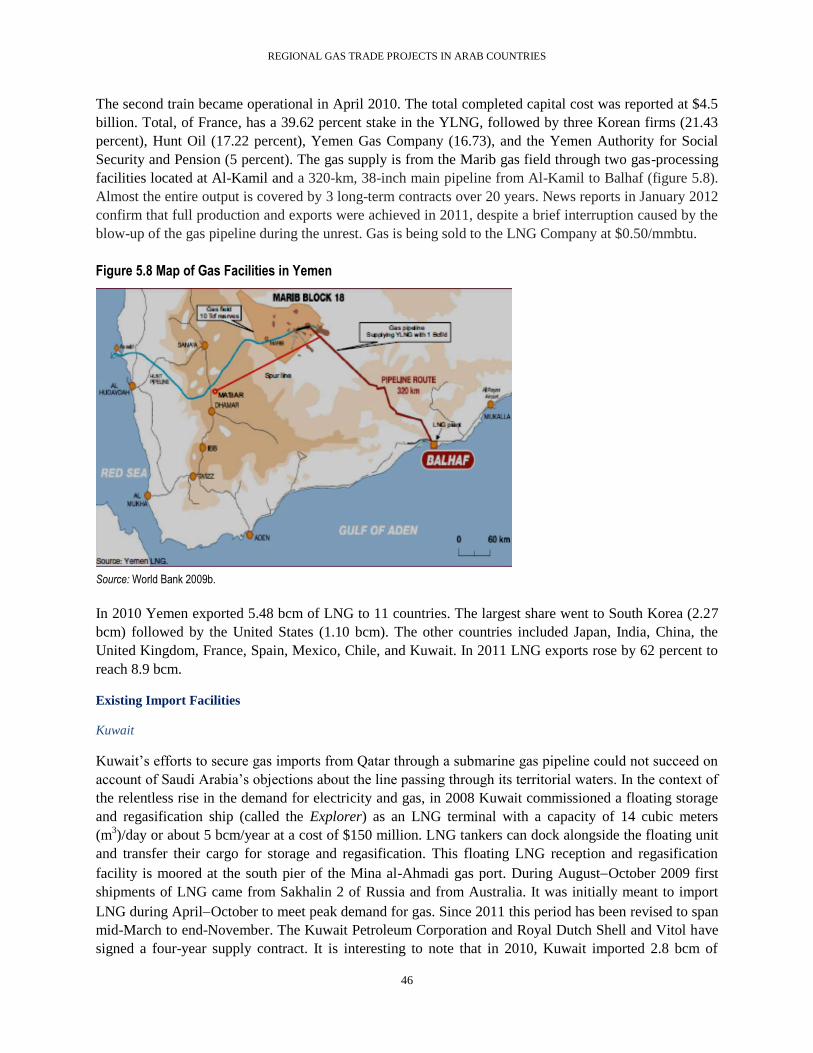
REGIONAL GAS TRADE PROJECTS IN ARAB COUNTRIES
46
The second train became operational in April 2010. The total completed capital cost was reported at $4.5
billion. Total, of France, has a 39.62 percent stake in the YLNG, followed by three Korean firms (21.43
percent), Hunt Oil (17.22 percent), Yemen Gas Company (16.73), and the Yemen Authority for Social
Security and Pension (5 percent). The gas supply is from the Marib gas field through two gas-processing
facilities located at Al-Kamil and a 320-km, 38-inch main pipeline from Al-Kamil to Balhaf (figure 5.8).
Almost the entire output is covered by 3 long-term contracts over 20 years. News reports in January 2012
confirm that full production and exports were achieved in 2011, despite a brief interruption caused by the
blow-up of the gas pipeline during the unrest. Gas is being sold to the LNG Company at $0.50/mmbtu.
Figure 5.8 Map of Gas Facilities in Yemen
Source: World Bank 2009b.
In 2010 Yemen exported 5.48 bcm of LNG to 11 countries. The largest share went to South Korea (2.27
bcm) followed by the United States (1.10 bcm). The other countries included Japan, India, China, the
United Kingdom, France, Spain, Mexico, Chile, and Kuwait. In 2011 LNG exports rose by 62 percent to
reach 8.9 bcm.
Existing Import Facilities
Kuwait
Kuwait’s efforts to secure gas imports from Qatar through a submarine gas pipeline could not succeed on
account of Saudi Arabia’s objections about the line passing through its territorial waters. In the context of
the relentless rise in the demand for electricity and gas, in 2008 Kuwait commissioned a floating storage
and regasification ship (called the Explorer) as an LNG terminal with a capacity of 14 cubic meters
(m3)/day or about 5 bcm/year at a cost of $150 million. LNG tankers can dock alongside the floating unit
and transfer their cargo for storage and regasification. This floating LNG reception and regasification
facility is moored at the south pier of the Mina al-Ahmadi gas port. During AugustOctober 2009 first
shipments of LNG came from Sakhalin 2 of Russia and from Australia. It was initially meant to import
LNG during AprilOctober to meet peak demand for gas. Since 2011 this period has been revised to span
mid-March to end-November. The Kuwait Petroleum Corporation and Royal Dutch Shell and Vitol have
signed a four-year supply contract. It is interesting to note that in 2010, Kuwait imported 2.8 bcm of

REGIONAL GAS TRADE PROJECTS IN ARAB COUNTRIES
47
LNG, about 50 percent of which came from within the region—the UAE (0.25 bcm), Egypt (0.33 bcm),
Oman (0.91 bcm), and Yemen (0.09 bcm).
United Arab Emirates
The UAE has followed the example of Kuwait and has commissioned a floating LNG reception, storage,
and regasification unit (FSRU) by converting the LNG carrier Golar Freeze into a FSRU and mooring it
near the Jebel Ali port. The FSRU, with an LNG storage capacity of 125,000 tons and a regasification
capacity of 480 mmcfd (equivalent to the regasification of 3 million tons/year of LNG), has been
chartered for 10 years with an option for 5 more years at an estimated cost of $450 million from Golar of
the United Kingdom. Dubai has signed a 15-year contract with Shell and Qatar Gas LNG for the supply
of 1.5 million tons/year of LNG during the peak season (May to October). In 2010 the UAE received an
import of 0.16 bcm of LNG from Qatar.23
Bahrain
Bahrain has decided to construct an LNG reception, storage, and regasification terminal, so that it could
rely on internationally traded LNG to meet its gas shortage. The terminal is to be built to the east of the
Khalifa Bin Salman Port at an estimated cost of about $1 billion, and will have the capacity to handle up
to 11.3 million cubic meters/day (4.125 bcm/year) of LNG, though this could be doubled should demand
require. While the terminal would allow Bahrain to import all the LNG it needs for its own economy, the
facility can also load and transfer gas cargoes to and from other destinations. It was expected to be
commissioned by 2016.24
Recent reports indicate that Bahrain has received nine bids with costs varying
from $300 million to $1.0 billion (depending on the type of terminal) and that completion is being
planned for end-2014 or early 2015.
Morocco
Morocco plans to build an LNG reception and regasification terminal at Tangier or Jorf Lasfar with an
initial annual capacity of 5 bcm (with provision to expand it to 10 bcm by 2020), at an estimated cost of
about $1.07 billion. In June 2010 the Société Nationale d’Investissement (SNI) and Akwa Group signed a
partnership agreement for the construction of this LNG terminal, for which the preferred location
considered was Jorf Lasfar. The consortium announced that it was to start by carrying out the necessary
technical studies. The terminal is expected to cost between €600 million and €1 billion to build.
Jordan
Jordan has decided to construct an FSRU-type LNG reception, storage, and regasification terminal at
Aqaba with a capacity of about 5 bcm/year. As of August 2012, 10 firms had been prequalified, and RFPs
were expected to be issued shortly for a turnkey implementation of the project, which may be
commissioned as early as 2014.25
23
http://www.ameinfo.com/154640-more1.html. 24
http://www.oxfordbusinessgroup.com/economic_updates/bahrain-tapping-new-energy-sources. 25
http://au.ibtimes.com/articles/353313/20120618/jordan-egypt-lng.htm http://community.nasdaq.com/News/2012-
06/energy-woes-force-jordan-to-import-lng-effective-2014.aspx?storyid=148946#ixzz29DpatVFb.
REGIONAL GAS TRADE PROJECTS IN ARAB COUNTRIES
48
Lebanon
On the basis of a World Bank–assisted study, Lebanon has decided to construct an FSRU-type LNG import terminal
near Beddawi with a capacity of about 4.8 bcm of gas/year. Based on the received expression of interest the
government has prepared a short list of the qualified firms who will be invited to submit bids for the project on the
basis of a build, own, and operate (BOO) arrangement. The terminal is planned to be operational by 2015.
Syria
Syria is also believed to have commissioned a study for a similar purpose.
Egypt
Egypt appears to have decided to import LNG to meet domestic gas shortages, and issued tenders in
October 2012 for the construction of an FSRU-type LNG import terminal near an Egyptian port either on
the Mediterranean or the Red Sea. The tenders envisage the following scope: (i) import of LNG; (ii)
entering into a service contract to utilize an Egyptian port on the Mediterranean or Red Sea for the
establishment/rental of a marine jetty/buoy mooring system; (iii) establishing an LNG FSRU; (iv)
constructing all necessary facilities, equipment, and pipelines to tie in to the Egyptian National Natural
Gas Grid (ENNGG); and (v) marketing and selling the imported gas locally to consumers through the
ENNGG in return for a transportation (and losses) fee per mmbtu in U.S. dollars.
Characteristics of Existing Regional Gas Trade
The existing level of gas trade among the Arab countries is modest. Out of the total gas exports by the
Arab countries of about 200 bcm in 2010 (consisting of about 70.5 bcm of pipeline gas and 129.5 bcm of
LNG), only 23.84 bcm of pipeline gas and 2.94 bcm of LNG went to the Arab countries. While a third of
the pipeline gas exports was destined for the Arab countries, only 2.27 percent of the LNG exports went
to the Arab countries. The LNG percentage may be even lower since some of the LNG imports were from
other non-Arab origins.
Thus, although theoretically, pipeline trade among the neighboring countries and countries within the
region ought to be significantly more cost-effective, the existing gas exports of Arab countries have a
distinct LNG orientation and a preference for solvent customers willing to pay at the internationally
prevailing prices.
Past experience in the regional pipeline trade was characterized by unrealistic price expectations of
buyers, persistent price haggling, undue influence of political and strategic considerations, border and
territorial water disputes, and, on occasion, by nonpayment (as in the case of Lebanon). The experience
with the AGP has highlighted the political risks and uncertainties associated with pipeline trade.
Prices negotiated at the beginning of Qatari gas exports through the Dolphin Pipeline, were considered
completely unsustainable and unrealistic. Seasonal reexport of Qatari gas by Oman to Ras al-Khaimah of
the UAE, for example, is priced five times higher than the initial purchase price from Qatar. Egyptian
export of gas through pipeline to Israel, Jordan, and Syria had considerable price-related problems.
Supply interruptions caused by political changes in Egypt have resulted in major problems for the
importing countries.
In the LNG trade many of these elements are largely nonexistent or minimal. Most importantly there is a
broad understanding of the prevailing prices of traded LNG in the European, Asian, and American
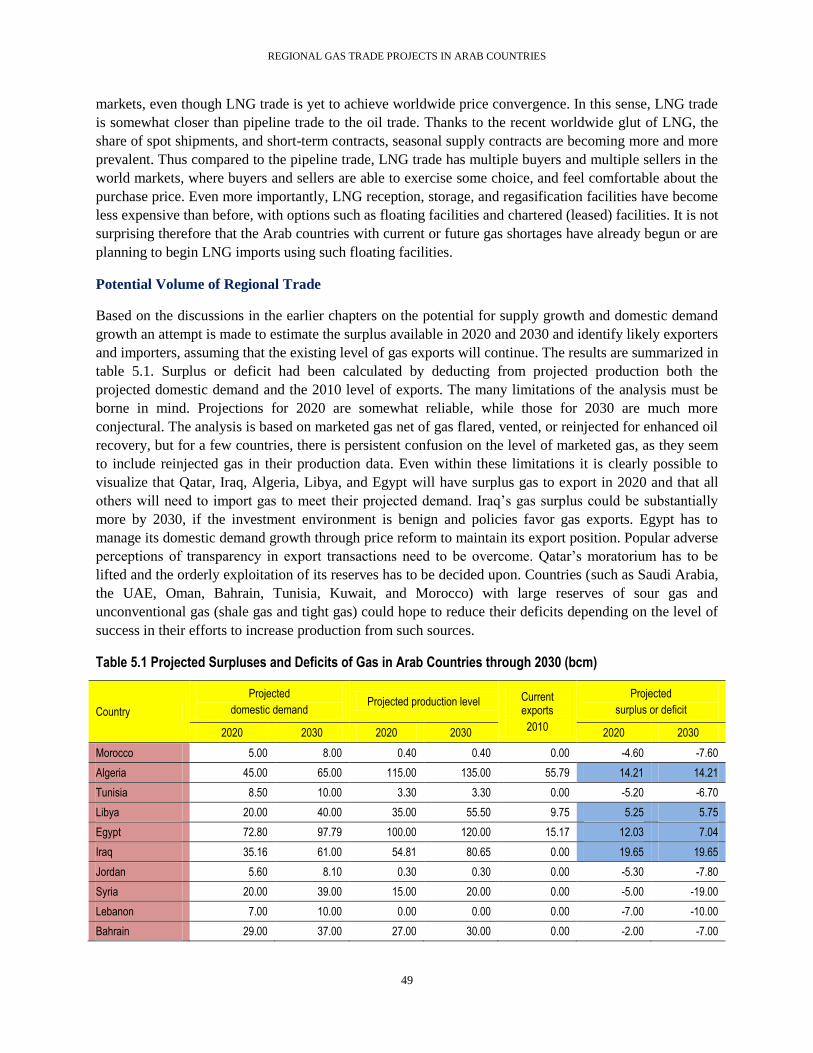
REGIONAL GAS TRADE PROJECTS IN ARAB COUNTRIES
49
markets, even though LNG trade is yet to achieve worldwide price convergence. In this sense, LNG trade
is somewhat closer than pipeline trade to the oil trade. Thanks to the recent worldwide glut of LNG, the
share of spot shipments, and short-term contracts, seasonal supply contracts are becoming more and more
prevalent. Thus compared to the pipeline trade, LNG trade has multiple buyers and multiple sellers in the
world markets, where buyers and sellers are able to exercise some choice, and feel comfortable about the
purchase price. Even more importantly, LNG reception, storage, and regasification facilities have become
less expensive than before, with options such as floating facilities and chartered (leased) facilities. It is not
surprising therefore that the Arab countries with current or future gas shortages have already begun or are
planning to begin LNG imports using such floating facilities.
Potential Volume of Regional Trade
Based on the discussions in the earlier chapters on the potential for supply growth and domestic demand
growth an attempt is made to estimate the surplus available in 2020 and 2030 and identify likely exporters
and importers, assuming that the existing level of gas exports will continue. The results are summarized in
table 5.1. Surplus or deficit had been calculated by deducting from projected production both the
projected domestic demand and the 2010 level of exports. The many limitations of the analysis must be
borne in mind. Projections for 2020 are somewhat reliable, while those for 2030 are much more
conjectural. The analysis is based on marketed gas net of gas flared, vented, or reinjected for enhanced oil
recovery, but for a few countries, there is persistent confusion on the level of marketed gas, as they seem
to include reinjected gas in their production data. Even within these limitations it is clearly possible to
visualize that Qatar, Iraq, Algeria, Libya, and Egypt will have surplus gas to export in 2020 and that all
others will need to import gas to meet their projected demand. Iraq’s gas surplus could be substantially
more by 2030, if the investment environment is benign and policies favor gas exports. Egypt has to
manage its domestic demand growth through price reform to maintain its export position. Popular adverse
perceptions of transparency in export transactions need to be overcome. Qatar’s moratorium has to be
lifted and the orderly exploitation of its reserves has to be decided upon. Countries (such as Saudi Arabia,
the UAE, Oman, Bahrain, Tunisia, Kuwait, and Morocco) with large reserves of sour gas and
unconventional gas (shale gas and tight gas) could hope to reduce their deficits depending on the level of
success in their efforts to increase production from such sources.
Table 5.1 Projected Surpluses and Deficits of Gas in Arab Countries through 2030 (bcm)
Country
Projected
domestic demand Projected production level Current
exports
2010
Projected
surplus or deficit
2020 2030 2020 2030 2020 2030
Morocco 5.00 8.00 0.40 0.40 0.00 -4.60 -7.60
Algeria 45.00 65.00 115.00 135.00 55.79 14.21 14.21
Tunisia 8.50 10.00 3.30 3.30 0.00 -5.20 -6.70
Libya 20.00 40.00 35.00 55.50 9.75 5.25 5.75
Egypt 72.80 97.79 100.00 120.00 15.17 12.03 7.04
Iraq 35.16 61.00 54.81 80.65 0.00 19.65 19.65
Jordan 5.60 8.10 0.30 0.30 0.00 -5.30 -7.80
Syria 20.00 39.00 15.00 20.00 0.00 -5.00 -19.00
Lebanon 7.00 10.00 0.00 0.00 0.00 -7.00 -10.00
Bahrain 29.00 37.00 27.00 30.00 0.00 -2.00 -7.00

REGIONAL GAS TRADE PROJECTS IN ARAB COUNTRIES
50
Country
Projected
domestic demand Projected production level Current
exports
2010
Projected
surplus or deficit
2020 2030 2020 2030 2020 2030
Kuwait 38.00 60.00 20.30 51.30 0.00 -17.70 -8.70
Saudi Arabia 130.00 150.00 120.00 125.00 0.00 -10.00 -25.00
Qatar 53.00 85.00 182.00 238.00 94.90 34.10 58.10
UAE 107.50 150.00 65.00 78.00 7.90 -50.40 -79.90
Oman 40.49 65.95 45.00 56.00 11.49 -6.98 -21.44
Yemen 5.00 8.00 15.00 18.00 9.30 0.70 0.70
Total 622.05 894.84 798.11 1,011.45 204.3 -28.24 -87.69
Source: Analysis based on data in earlier chapters of this report.
Note: In the case of Yemen the full capacity of the LNG plant, rather than the actual export in 2010, is used.
Based on the analysis in table 5.1, it appears that Qatar, Iraq, Algeria, and Libya will continue to have
surpluses until 2030 for additional exports in excess of their export level in 2010, while all other countries
have to resort to importing gas if they wish to meet their projected demand. Recent developments cast
serious doubt on the ability of Egypt to generate adequate surpluses to export. Also a country such as
Oman, which has already stopped renewing its expired long-term export contracts for LNG and is
operating its liquefaction plant at partial capacity, may possibly give up LNG exports completely when all
its long-term contracts expire in 202426, to reduce its import requirements. The UAE may face a similar
decision in 2019 when its long-term contracts to Japan expire.
Within this overall framework, it is possible for some of the regional gas trade initiatives to materialize.
In the context of the anticipated surge in the international demand for LNG from Asia and Europe, and
the demand from Europe for piped gas, the Arab countries desiring to import gas have to compete with
Europe and Asia to secure their supplies, particularly reconciling themselves to pay internationally or
regionally comparable prices. The details of these pricing aspects are discussed in chapter 6.
Pipeline Gas Trade Options
Algeria and Morocco
In the North African subregion, Algeria is far too deeply entrenched in gas exports to Europe (through
cross investments, long-term contracts, and forward trade linkages, by involving itself in market
operations in Europe and retail gas distribution) to turn back from these activities in a big way and favor
regional gas trade among Arab countries. That said, Algeria would be able to meet some relatively
smaller demands (at the right price) from Tunisia and Morocco, through which its pipelines to Europe
pass.
There has been constant political tension between Morocco and Algeria, arising, inter alia, from differing
positions regarding the status and independence of Western Sahara. Morocco had to overcome a great
many related concerns in the interest of securing regional cooperation to benefit its economy. Despite its
heavy dependence on energy imports, it has been unwilling to tie its energy future to imports from
Algeria. Thus, Algerian gas is being sold to Spanish buyers at the Algerian-Moroccan border, and the
pipeline section of the Perdo Duran Farrel Pipeline in Morocco was built and is owned by European
buyers and nominally by Morocco and not by Algeria. Under the gas export arrangements, Morocco was
given a transit fee calculated at 7 percent of the throughput of gas, which could be drawn in cash, in kind,
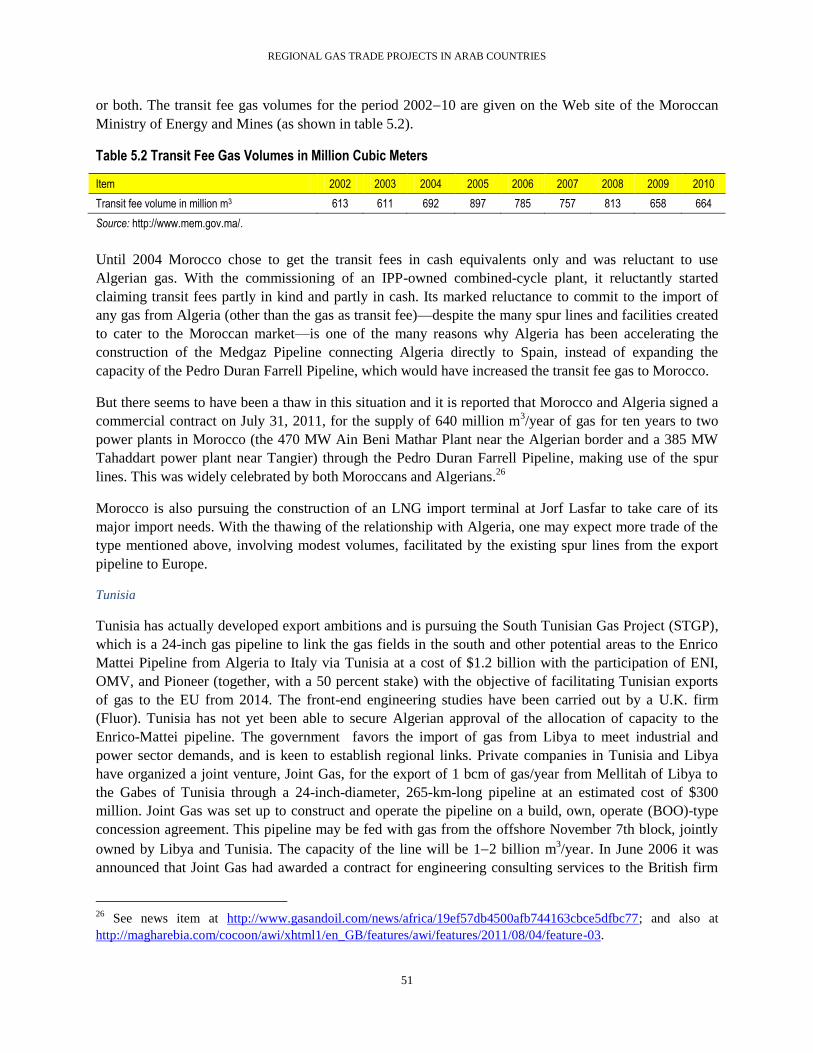
REGIONAL GAS TRADE PROJECTS IN ARAB COUNTRIES
51
or both. The transit fee gas volumes for the period 200210 are given on the Web site of the Moroccan
Ministry of Energy and Mines (as shown in table 5.2).
Table 5.2 Transit Fee Gas Volumes in Million Cubic Meters
Item 2002 2003 2004 2005 2006 2007 2008 2009 2010
Transit fee volume in million m3 613 611 692 897 785 757 813 658 664
Source: http://www.mem.gov.ma/.
Until 2004 Morocco chose to get the transit fees in cash equivalents only and was reluctant to use
Algerian gas. With the commissioning of an IPP-owned combined-cycle plant, it reluctantly started
claiming transit fees partly in kind and partly in cash. Its marked reluctance to commit to the import of
any gas from Algeria (other than the gas as transit fee)—despite the many spur lines and facilities created
to cater to the Moroccan market—is one of the many reasons why Algeria has been accelerating the
construction of the Medgaz Pipeline connecting Algeria directly to Spain, instead of expanding the
capacity of the Pedro Duran Farrell Pipeline, which would have increased the transit fee gas to Morocco.
But there seems to have been a thaw in this situation and it is reported that Morocco and Algeria signed a
commercial contract on July 31, 2011, for the supply of 640 million m3/year of gas for ten years to two
power plants in Morocco (the 470 MW Ain Beni Mathar Plant near the Algerian border and a 385 MW
Tahaddart power plant near Tangier) through the Pedro Duran Farrell Pipeline, making use of the spur
lines. This was widely celebrated by both Moroccans and Algerians.26
Morocco is also pursuing the construction of an LNG import terminal at Jorf Lasfar to take care of its
major import needs. With the thawing of the relationship with Algeria, one may expect more trade of the
type mentioned above, involving modest volumes, facilitated by the existing spur lines from the export
pipeline to Europe.
Tunisia
Tunisia has actually developed export ambitions and is pursuing the South Tunisian Gas Project (STGP),
which is a 24-inch gas pipeline to link the gas fields in the south and other potential areas to the Enrico
Mattei Pipeline from Algeria to Italy via Tunisia at a cost of $1.2 billion with the participation of ENI,
OMV, and Pioneer (together, with a 50 percent stake) with the objective of facilitating Tunisian exports
of gas to the EU from 2014. The front-end engineering studies have been carried out by a U.K. firm
(Fluor). Tunisia has not yet been able to secure Algerian approval of the allocation of capacity to the
Enrico-Mattei pipeline. The government favors the import of gas from Libya to meet industrial and
power sector demands, and is keen to establish regional links. Private companies in Tunisia and Libya
have organized a joint venture, Joint Gas, for the export of 1 bcm of gas/year from Mellitah of Libya to
the Gabes of Tunisia through a 24-inch-diameter, 265-km-long pipeline at an estimated cost of $300
million. Joint Gas was set up to construct and operate the pipeline on a build, own, operate (BOO)-type
concession agreement. This pipeline may be fed with gas from the offshore November 7th block, jointly
owned by Libya and Tunisia. The capacity of the line will be 12 billion m3/year. In June 2006 it was
announced that Joint Gas had awarded a contract for engineering consulting services to the British firm
26
See news item at http://www.gasandoil.com/news/africa/19ef57db4500afb744163cbce5dfbc77; and also at
http://magharebia.com/cocoon/awi/xhtml1/en_GB/features/awi/features/2011/08/04/feature-03.

REGIONAL GAS TRADE PROJECTS IN ARAB COUNTRIES
52
Penspen. In August 2006 the Joint Gas Company approved a budget of $250 million for the project.
Further progress needs to be analyzed. It may be dependent on the restoration of political stability in
Libya.
Libya
Libya is also, somewhat like Algeria, focused on gas exports to Europe, but should be open to smaller
volumes of export to Tunisia through lines such as the Mellitah-Gabes Pipeline. If Morocco and Tunisia
are willing to accept internationally comparable prices, trade between Algeria and Morocco, between
Algeria and Tunisia, and between Libya and Tunisia could gather momentum. With relative ease, one
could conceive of a gas grid linking Morocco, Algeria, Tunisia, and Libya.
There is also a possibility that Libya could connect to the western parts of Egypt and supply gas to that
part of the Egyptian gas market and enter into a swap arrangement whereby Egypt would put an
equivalent quantity of gas in the AGP for sale to Jordan, Syria, and Lebanon. Egyptian and Libyan gas
companies are cooperating in expanding gas transmission and distribution facilities in Libya. Such an
arrangement would provide some security of supply to the customers of the AGP.
Egypt
Egypt needs to stabilize its domestic demand through appropriate pricing reforms if it has to remain an
exporter while meeting its domestic needs. Further, the segment of the AGP connecting Syria and Turkey
needs to be completed to remove bottlenecks in the Syrian section and enable smooth flow from Jordan to
Syria, Lebanon, and Turkey, so that gas from Libya, Iraq, and Egypt can flow up to Turkey through the
AGP. Some sort of a common access regime needs to be established through contracts.
In the event of Saudi Arabia deciding to import gas, Egypt could conceivably supply the northern and
western parts of Saudi Arabia through a relatively short link between Egypt and Saudi Arabia. For this
purpose Egypt could use gas imports from Libya. The other most obvious choice for Saudi Arabia is to
connect its gas system to Qatar through a short pipeline to enable imports from Qatar, but these
developments are considered unlikely.
Iraq
In order to reduce the presently high level of gas flaring, which will be increasing substantially in the
short to medium term on account of rapid ramp-up in oil production for export, Iraq needs gas exports and
a well-defined gas export plan. Several export option schemes have been discussed in the industry with
varying degrees of seriousness. The export options include pipeline schemes such as the: (i) Kuwait
pipeline (4.14 bcm/year), (ii) Syria pipeline (25 bcm/year), (c) pipeline to Turkey (7.2312.4 bcm/year),
(iv) pipeline to Jordan (5.17 bcm/year), (v) Trans Gulf Pipeline to Saudi Arabia and the UAE (15
bcm/year), and (vi) connection to the AGP (4.14 bcm/year). The export options include an LNG train (6.2
bcm/year) with the possibility of expansion to two trains. Supply of about 15.5 bcm to the Nabucco
pipeline has been also discussed in the industry news.
The Iraqi government has already started focusing on the development of gas fields and has succeeded
(after the third round of bidding conducted in 2010) in concluding, in June 2011, a 20-year technical
service contract for the development of three nonassociated gas fields at Akkas, Mansuriya, and Sibba
(total annual production capability of about 317 bcm). The fourth round of bidding for exploration
scheduled for 2012 would cover 12 blocks, 7 of which would be for nonassociated gas. Further, the
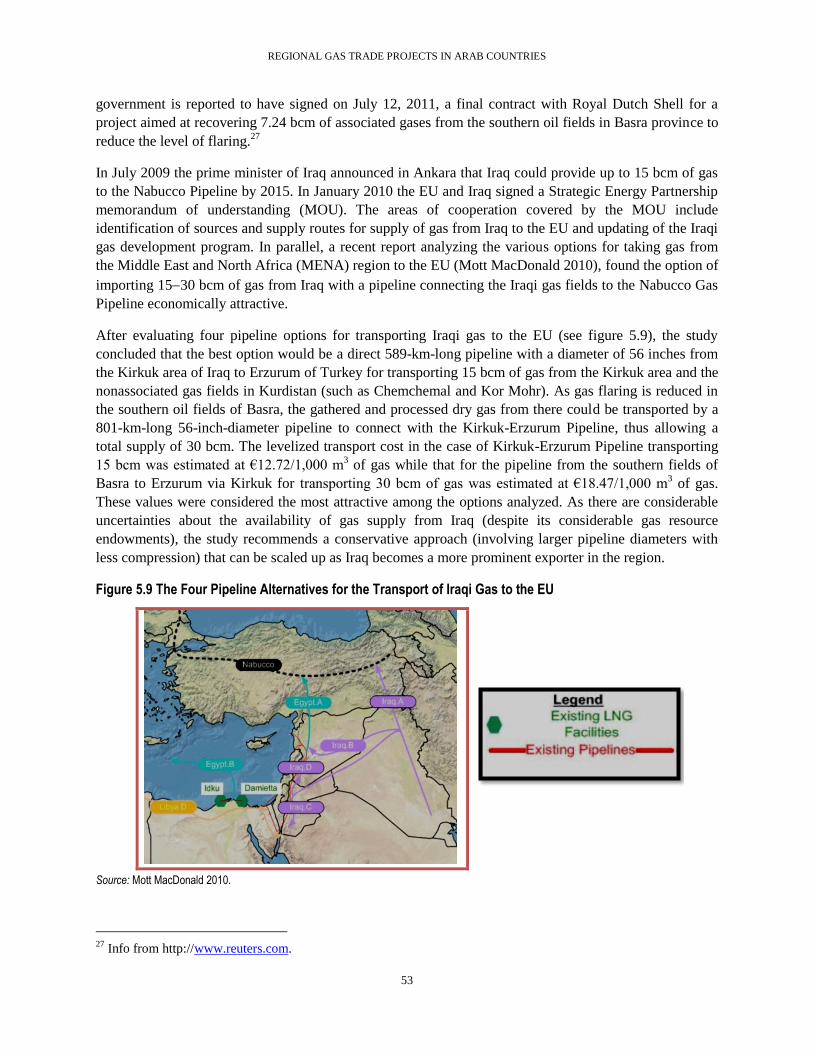
REGIONAL GAS TRADE PROJECTS IN ARAB COUNTRIES
53
government is reported to have signed on July 12, 2011, a final contract with Royal Dutch Shell for a
project aimed at recovering 7.24 bcm of associated gases from the southern oil fields in Basra province to
reduce the level of flaring.27
In July 2009 the prime minister of Iraq announced in Ankara that Iraq could provide up to 15 bcm of gas
to the Nabucco Pipeline by 2015. In January 2010 the EU and Iraq signed a Strategic Energy Partnership
memorandum of understanding (MOU). The areas of cooperation covered by the MOU include
identification of sources and supply routes for supply of gas from Iraq to the EU and updating of the Iraqi
gas development program. In parallel, a recent report analyzing the various options for taking gas from
the Middle East and North Africa (MENA) region to the EU (Mott MacDonald 2010), found the option of
importing 1530 bcm of gas from Iraq with a pipeline connecting the Iraqi gas fields to the Nabucco Gas
Pipeline economically attractive.
After evaluating four pipeline options for transporting Iraqi gas to the EU (see figure 5.9), the study
concluded that the best option would be a direct 589-km-long pipeline with a diameter of 56 inches from
the Kirkuk area of Iraq to Erzurum of Turkey for transporting 15 bcm of gas from the Kirkuk area and the
nonassociated gas fields in Kurdistan (such as Chemchemal and Kor Mohr). As gas flaring is reduced in
the southern oil fields of Basra, the gathered and processed dry gas from there could be transported by a
801-km-long 56-inch-diameter pipeline to connect with the Kirkuk-Erzurum Pipeline, thus allowing a
total supply of 30 bcm. The levelized transport cost in the case of Kirkuk-Erzurum Pipeline transporting
15 bcm was estimated at €12.72/1,000 m3 of gas while that for the pipeline from the southern fields of
Basra to Erzurum via Kirkuk for transporting 30 bcm of gas was estimated at €18.47/1,000 m3 of gas.
These values were considered the most attractive among the options analyzed. As there are considerable
uncertainties about the availability of gas supply from Iraq (despite its considerable gas resource
endowments), the study recommends a conservative approach (involving larger pipeline diameters with
less compression) that can be scaled up as Iraq becomes a more prominent exporter in the region.
Figure 5.9 The Four Pipeline Alternatives for the Transport of Iraqi Gas to the EU
Source: Mott MacDonald 2010.
27
Info from http://www.reuters.com.
REGIONAL GAS TRADE PROJECTS IN ARAB COUNTRIES
54
The assumption that by 2015 the Kurdistan gas fields of Kor Mohr and Chemchemal will produce 31 bcm
of gas, providing Kurdistan 5.16 bcm, and leaving a balance of 10.3 bcm for Turkey and 15.5 bcm for the
Nabucco Pipeline at least for the first phase, is not considered robust. The fields may not be capable of
producing such volumes of supply and reserves data may be unreliable. Also disagreements between the
Iraqi and Kurdistan governments regarding jurisdiction could pose problems.
Kuwait
Export of gas to Kuwait by rehabilitating the existing 170-km-long, 40-inch-diameter pipeline with a
capacity of 4.2 bcm/year is considered the most immediate and practical export option. The short pipeline
built in the 1980s was used to supply 1.62.1 bcm of gas annually during 198689. In December 2004 the
Iraqi and Kuwaiti governments signed an MOU to rehabilitate the pipeline and commence with supplies
at 0.361 bcm/year and eventually increase to the full capacity of 2.1 bcm/year. Kuwait would pay the
market price for the gas, with the price varying according to the quality of the gas. The gas would come
from the Rumaila field and the project would entail the installation of new junctions, pumping and
reception stations, and metering facilities. The work would be carried out in two phases. In the first phase,
Kuwait would import 35 million cubic ft/day of rich gas. In the second phase, the volume would be
stepped up to 200 million cubic ft/day. The two countries agreed that they could, if necessary, bring in
foreign companies to execute either phase of the project, but not much progress appears to have been
made under this MOU.
Syria
Export of gas to Syria from the Akkas gas field in the western part of Iraq at a distance of 40 km from the
Syrian border is considered another practical option. A technical service contract for this field had been
concluded in June 2011 with the Korean Gas Corporation. Earlier studies had indicated that the field
could produce as much as 5.2 bcm of gas/year. In 2008 the oil ministries of Iraq and Syria signed an
MOU for gas from the Akkas field to be supplied to Syria. The gas may have to be processed on-site and
conveyed to Syria through a new 92-km-long, 22-inch-diameter pipeline (43 km in Iraq and 49 km in
Syria). From there the gas could be transported by the Syrian gas network to its consumers and also to the
AGP for onward transmission to Turkey when its final phase is completed.
Additional Observations
The best thing that Qatar can do after lifting the moratorium in the context of increasing pipeline exports
is to allow the flow of gas through the Dolphin Pipeline to the UAE and Oman to increase to the full
capacity of the pipeline, that is, from 20 bcm to 33 bcm/year. To enable this, the UAE and Oman may
have to agree to realistic prices more along the lines of current international prices. A second and equally
important option is to build a pipeline to connect with the Saudi gas system to enable export of gas to
Saudi Arabia and in that context seek Saudi cooperation to extend the Dolphin Pipeline to Bahrain and
Kuwait, as originally intended. As a member of the World Trade Organization (WTO), Saudi Arabia may
be willing to reconsider the issue and enable the evolution of a regional gas grid and regional gas market.
Alternatively, a pipeline from Qatar to Kuwait that serves Bahrain and Saudi Arabia on the way could be
considered beneficial to all four countries. Here, too, Saudi reluctance to import gas and its reluctance to
allow the pipeline to pass through its territory have to be overcome through discussions.
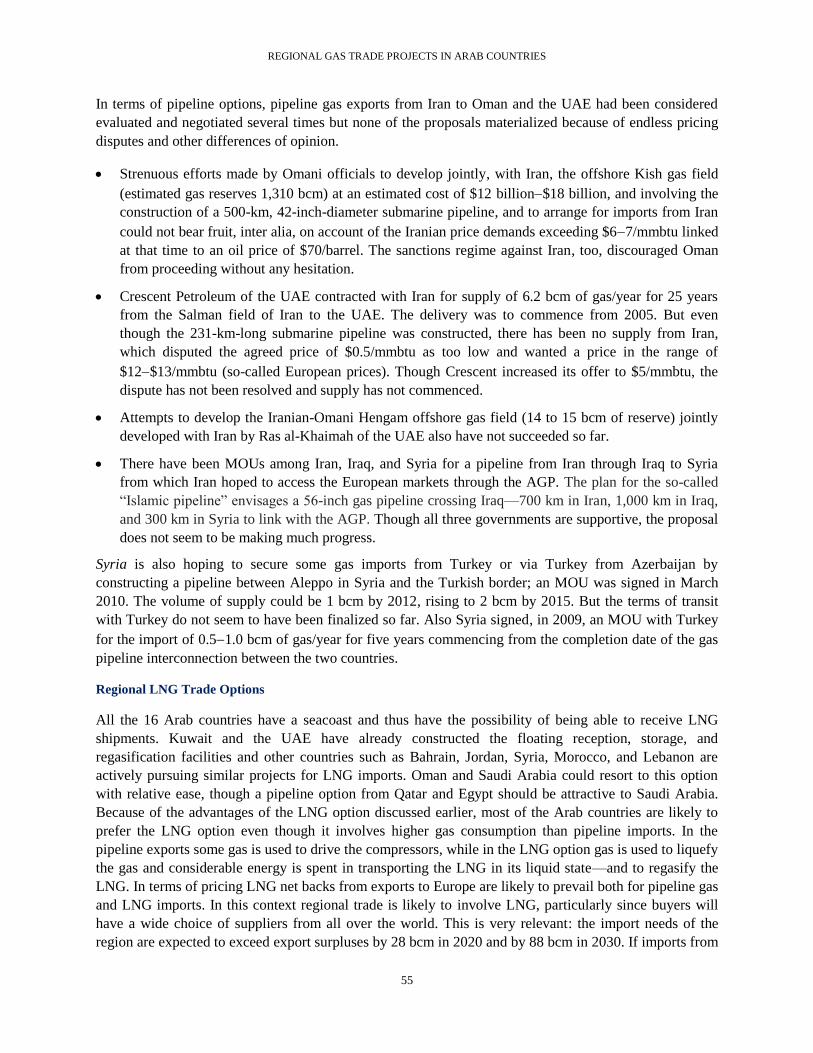
REGIONAL GAS TRADE PROJECTS IN ARAB COUNTRIES
55
In terms of pipeline options, pipeline gas exports from Iran to Oman and the UAE had been considered
evaluated and negotiated several times but none of the proposals materialized because of endless pricing
disputes and other differences of opinion.
Strenuous efforts made by Omani officials to develop jointly, with Iran, the offshore Kish gas field
(estimated gas reserves 1,310 bcm) at an estimated cost of $12 billion$18 billion, and involving the
construction of a 500-km, 42-inch-diameter submarine pipeline, and to arrange for imports from Iran
could not bear fruit, inter alia, on account of the Iranian price demands exceeding $67/mmbtu linked
at that time to an oil price of $70/barrel. The sanctions regime against Iran, too, discouraged Oman
from proceeding without any hesitation.
Crescent Petroleum of the UAE contracted with Iran for supply of 6.2 bcm of gas/year for 25 years
from the Salman field of Iran to the UAE. The delivery was to commence from 2005. But even
though the 231-km-long submarine pipeline was constructed, there has been no supply from Iran,
which disputed the agreed price of $0.5/mmbtu as too low and wanted a price in the range of
$12$13/mmbtu (so-called European prices). Though Crescent increased its offer to $5/mmbtu, the
dispute has not been resolved and supply has not commenced.
Attempts to develop the Iranian-Omani Hengam offshore gas field (14 to 15 bcm of reserve) jointly
developed with Iran by Ras al-Khaimah of the UAE also have not succeeded so far.
There have been MOUs among Iran, Iraq, and Syria for a pipeline from Iran through Iraq to Syria
from which Iran hoped to access the European markets through the AGP. The plan for the so-called
“Islamic pipeline” envisages a 56-inch gas pipeline crossing Iraq—700 km in Iran, 1,000 km in Iraq,
and 300 km in Syria to link with the AGP. Though all three governments are supportive, the proposal
does not seem to be making much progress.
Syria is also hoping to secure some gas imports from Turkey or via Turkey from Azerbaijan by
constructing a pipeline between Aleppo in Syria and the Turkish border; an MOU was signed in March
2010. The volume of supply could be 1 bcm by 2012, rising to 2 bcm by 2015. But the terms of transit
with Turkey do not seem to have been finalized so far. Also Syria signed, in 2009, an MOU with Turkey
for the import of 0.51.0 bcm of gas/year for five years commencing from the completion date of the gas
pipeline interconnection between the two countries.
Regional LNG Trade Options
All the 16 Arab countries have a seacoast and thus have the possibility of being able to receive LNG
shipments. Kuwait and the UAE have already constructed the floating reception, storage, and
regasification facilities and other countries such as Bahrain, Jordan, Syria, Morocco, and Lebanon are
actively pursuing similar projects for LNG imports. Oman and Saudi Arabia could resort to this option
with relative ease, though a pipeline option from Qatar and Egypt should be attractive to Saudi Arabia.
Because of the advantages of the LNG option discussed earlier, most of the Arab countries are likely to
prefer the LNG option even though it involves higher gas consumption than pipeline imports. In the
pipeline exports some gas is used to drive the compressors, while in the LNG option gas is used to liquefy
the gas and considerable energy is spent in transporting the LNG in its liquid state—and to regasify the
LNG. In terms of pricing LNG net backs from exports to Europe are likely to prevail both for pipeline gas
and LNG imports. In this context regional trade is likely to involve LNG, particularly since buyers will
have a wide choice of suppliers from all over the world. This is very relevant: the import needs of the
region are expected to exceed export surpluses by 28 bcm in 2020 and by 88 bcm in 2030. If imports from

REGIONAL GAS TRADE PROJECTS IN ARAB COUNTRIES
56
Iran materialize, the situation might become a little better, but considering that Iran is unable to restrain
its own domestic demand growth and has to resort to gas imports despite its being the second-largest
producer of gas in the world, this relief appears unlikely, especially in the context of a continuing
sanctions regime.
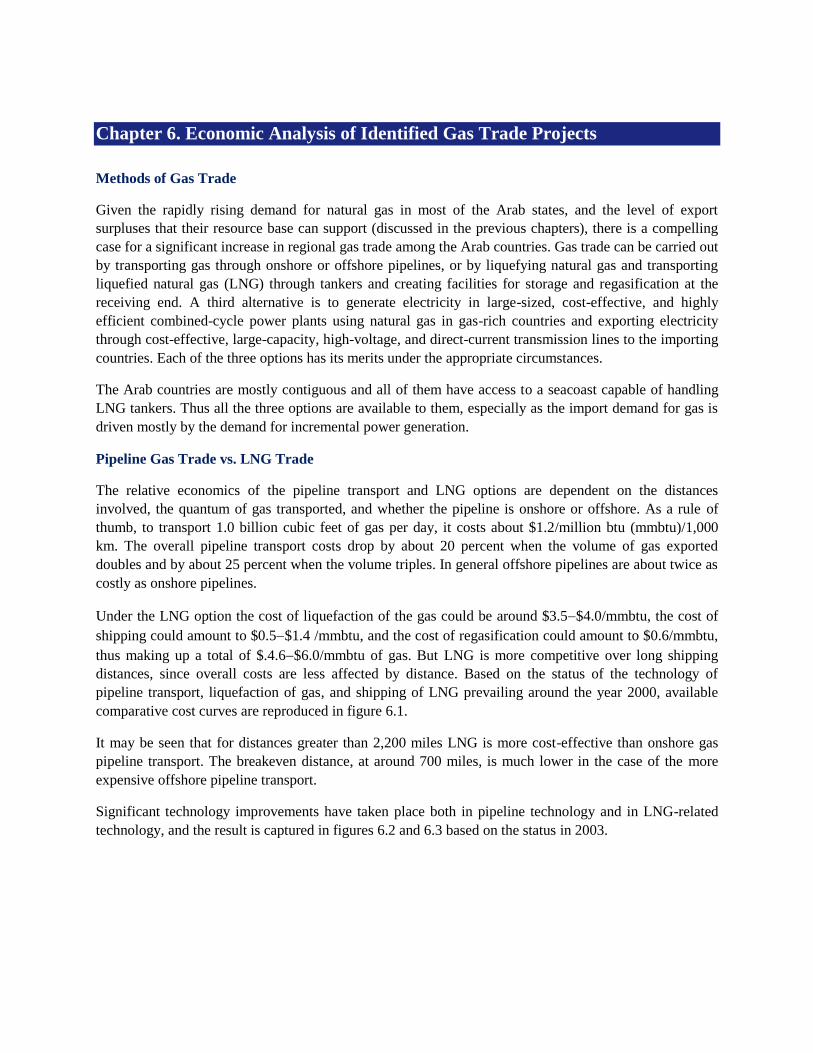
Chapter 6. Economic Analysis of Identified Gas Trade Projects
Methods of Gas Trade
Given the rapidly rising demand for natural gas in most of the Arab states, and the level of export
surpluses that their resource base can support (discussed in the previous chapters), there is a compelling
case for a significant increase in regional gas trade among the Arab countries. Gas trade can be carried out
by transporting gas through onshore or offshore pipelines, or by liquefying natural gas and transporting
liquefied natural gas (LNG) through tankers and creating facilities for storage and regasification at the
receiving end. A third alternative is to generate electricity in large-sized, cost-effective, and highly
efficient combined-cycle power plants using natural gas in gas-rich countries and exporting electricity
through cost-effective, large-capacity, high-voltage, and direct-current transmission lines to the importing
countries. Each of the three options has its merits under the appropriate circumstances.
The Arab countries are mostly contiguous and all of them have access to a seacoast capable of handling
LNG tankers. Thus all the three options are available to them, especially as the import demand for gas is
driven mostly by the demand for incremental power generation.
Pipeline Gas Trade vs. LNG Trade
The relative economics of the pipeline transport and LNG options are dependent on the distances
involved, the quantum of gas transported, and whether the pipeline is onshore or offshore. As a rule of
thumb, to transport 1.0 billion cubic feet of gas per day, it costs about $1.2/million btu (mmbtu)/1,000
km. The overall pipeline transport costs drop by about 20 percent when the volume of gas exported
doubles and by about 25 percent when the volume triples. In general offshore pipelines are about twice as
costly as onshore pipelines.
Under the LNG option the cost of liquefaction of the gas could be around $3.5$4.0/mmbtu, the cost of
shipping could amount to $0.5$1.4 /mmbtu, and the cost of regasification could amount to $0.6/mmbtu,
thus making up a total of $.4.6$6.0/mmbtu of gas. But LNG is more competitive over long shipping
distances, since overall costs are less affected by distance. Based on the status of the technology of
pipeline transport, liquefaction of gas, and shipping of LNG prevailing around the year 2000, available
comparative cost curves are reproduced in figure 6.1.
It may be seen that for distances greater than 2,200 miles LNG is more cost-effective than onshore gas
pipeline transport. The breakeven distance, at around 700 miles, is much lower in the case of the more
expensive offshore pipeline transport.
Significant technology improvements have taken place both in pipeline technology and in LNG-related
technology, and the result is captured in figures 6.2 and 6.3 based on the status in 2003.
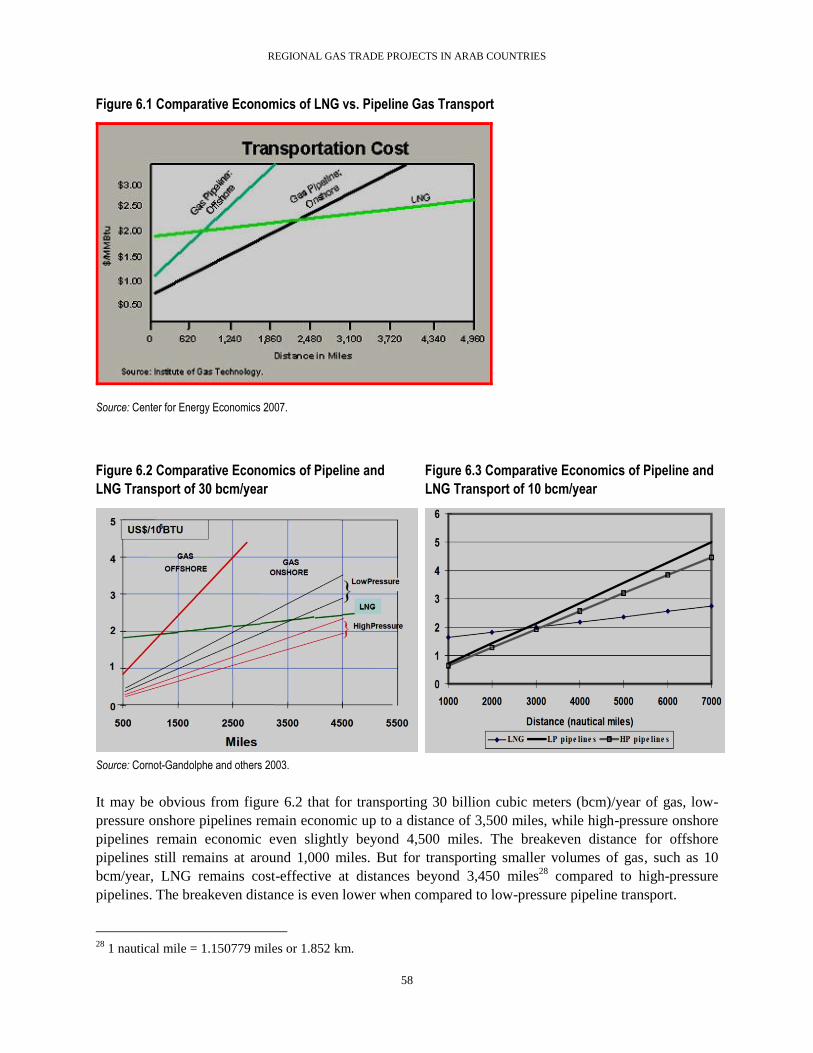
REGIONAL GAS TRADE PROJECTS IN ARAB COUNTRIES
58
Figure 6.1 Comparative Economics of LNG vs. Pipeline Gas Transport
Source: Center for Energy Economics 2007.
Figure 6.2 Comparative Economics of Pipeline and
LNG Transport of 30 bcm/year
Figure 6.3 Comparative Economics of Pipeline and
LNG Transport of 10 bcm/year
Source: Cornot-Gandolphe and others 2003.
It may be obvious from figure 6.2 that for transporting 30 billion cubic meters (bcm)/year of gas, low-
pressure onshore pipelines remain economic up to a distance of 3,500 miles, while high-pressure onshore
pipelines remain economic even slightly beyond 4,500 miles. The breakeven distance for offshore
pipelines still remains at around 1,000 miles. But for transporting smaller volumes of gas, such as 10
bcm/year, LNG remains cost-effective at distances beyond 3,450 miles28
compared to high-pressure
pipelines. The breakeven distance is even lower when compared to low-pressure pipeline transport.
28
1 nautical mile = 1.150779 miles or 1.852 km.

REGIONAL GAS TRADE PROJECTS IN ARAB COUNTRIES
59
Further technological improvements are taking place in respect to both pipeline and LNG options, and
basic costs are also changing on account of inflation and currency variables. Nonetheless, the comparative
economics between the two options seems to remain largely unchanged. A recent study carried out in
2012 for Lebanon indicates that transport via a 48-inch-diameter onshore pipeline remains a cost-effective
option (relative to the LNG option) for up to a distance of 4,000 miles, and that a 48-inch-diameter
offshore pipeline remains economic for distances below 1,000 miles.
Taking into account all 16 Arab countries, the distances between the potential exporting countries and
importing countries are such that pipeline gas trade is clearly the more economic option and should be
pursued, wherever possible, with determination to overcome obstacles. But four (Algeria, Libya, Egypt,
and Qatar) out of the five surplus countries have liquefaction and LNG export facilities, and Iraq’s
strategic plans include such facilities for LNG export. All the 11 potential importing countries have their
own seacoasts. Kuwait and the United Arab Emirates (UAE) have already constructed floating reception,
storage, and regasification facilities for LNG imports, and other countries such as Bahrain, Jordan, Syria,
Morocco, and Lebanon are actively pursuing similar projects for LNG imports. In the context of the
import needs of the region exceeding the export surpluses by 28.24 bcm by 2020 and by 87.69 bcm by
2030, the Arab countries could use the LNG-importing facilities to import LNG from other parts of the
world as well. Thus regional trade in the form of LNG would serve the objectives of the energy
diversification and energy security of the importing countries. Many European countries and Turkey have
resorted to the LNG option in addition to the pipeline option for these reasons. Since cross-border
pipelines often face considerable obstacles and need time to overcome them, the LNG option may provide
timely relief in some cases. Further, as discussed earlier, the competitiveness of LNG is improving on
account of technological advances and supply chain flexibilities, arising from the growing share of short-
term contracts and spot trades, which currently constitute more than 25 percent of the total LNG trade,
and the possible emergence of the United States as a significant LNG exporter.29
Recent experience of gas
supply interruptions and cessation of supplies in the AGP has inspired new concern about the security of
supply through cross-border gas pipelines. This is likely to have a long-lasting impact on the ability to
finance pipeline projects, which makes the LNG import option still more desirable.
Pipeline Gas Trade vs. Electricity Trade
But the choice between the import of gas by pipeline and the import of electricity produced at the
wellheads using gas is not always straightforward. If at the importing end, gas has multiple uses (such as
electricity generation, industrial and domestic uses, and fertilizer production), then clearly gas transport
by pipeline is the only solution. If, however, at the importing end the only use for gas is electricity
generation, comparative studies indicate that generating power at the wellhead and transmitting power
through high-voltage, direct current (HVDC) lines to load centers as far away as 1,0005,000 km is less
expensive than transporting gas to the load center and generating power at the load centers (Clerici and
Longhi 2008). This is especially true with respect to small gas fields located far away from load centers.
The choice between the two options is influenced by gas prices, gas volumes for transport, distance, and
various risks, including security. Gas pipelines have major economies of scale for carrying large volumes
of energy. As a rule of thumb, gas pipelines tend to be more economic for distances greater than 1,000 km
and volumes above 510 bcm of gas. In a study of electricity trade potential in the Black Sea region
carried out for the World Bank (Economic Consulting Associates 2005), consultants found that for
29
LNG prices in the United States have recently fallen below $2/mmbtu, and there is an active lobby to export cheap
and plentiful shale gas.
REGIONAL GAS TRADE PROJECTS IN ARAB COUNTRIES
60
distances of 1,000 km and volumes below 7.0 bcm/year of gas needing to generate 5,000 megawatts
(MW) of power, electricity transmission was more economic. Larger volumes such as 16bcm/year
needed to generate 13,000 MW of power, and gas pipelines were more economic even at distances of 500
km and becomes even more so for longer distances. One could conceive of private entrepreneurs setting
up large combined-cycle units in Qatar and export electricity to the Gulf Cooperation Council (GCC)
countries making use of an expanded GCC power interconnection. A keen observer of the oil and gas
sectors in the GCC countries seemed to imply in one of his recent presentations that construction of
electrical interconnections such as the GCC Interconnection Project has helped the region to forestall
many of the issues inherent in the importation of natural gas (that is, pricing, maritime boundaries, and
border disputes) (Dargin 2009). On the whole, however, gas or LNG import rather than power import is
likely to be a prevalent option. For practical reasons, the LNG import option is most likely to be
preferred.
Emergence of a Pan-Arab Gas Pipeline System
Within the above framework, it is clearly possible to visualize the emergence of a Pan-Arab Gas Pipeline
System (PAGPS) supplemented adequately by LNG-trading facilities to support the objective of
promoting increased regional gas trade. The PAGPS would consist of three main corridors: the first one
(partly built) would connect Morocco, Algeria, Tunisia, Libya, and Egypt; the second one (nearly
complete) will connect Egypt, Jordan, Syria, Lebanon, and Turkey; and the third one (a small portion
built already) connecting Oman, the UAE, Qatar, Saudi Arabia, Bahrain, and Kuwait. Iraq will become a
part of the PAGPS by a gas pipeline to Kuwait and another to Syria and the Arab gas pipeline there. A gas
pipeline between Egypt and northwestern Saudi Arabia would complete the integration of the PAGPS.
The first and the second corridors would be a part of the Mediterranean Gas Ring pursued by the
countries surrounding the Mediterranean Sea (figure 6.4). The emergence of such a pipeline network
would, at best, be a long-term proposition. Based on experience with the AGP and the current levels of
political turmoil in the region, many observers seriously doubt the possibility of any growth in cross-
border gas trade through pipelines within the region.
Possible Shelf of Projects for Increased Regional Gas Trade
Conceptually, however, the emergence of the PAGPS is an economically attractive proposition and
worthy of review and analysis. To enable the emergence of the PAGPS, a number of possible project
proposals aimed at increasing the volumes of regional gas trade need to be evaluated and pursued—some
of them capable of being implemented in the short to medium term, and the rest to be implemented in the
longer term.
A possible list of projects for consideration in the short to medium term would include:
Expansion of the Algeria-Morocco pipeline gas trade volume
Expansion of the Algeria-Tunisia pipeline gas trade volume
Expansion of gas sales from Egypt to Jordan, Syria, and Lebanon through the Arab Gas Pipeline
(AGP)
Construction of a Libya-Tunisia gas pipeline
Expansion of the trade volume between Qatar, the UAE, and Oman through the Dolphin Pipeline
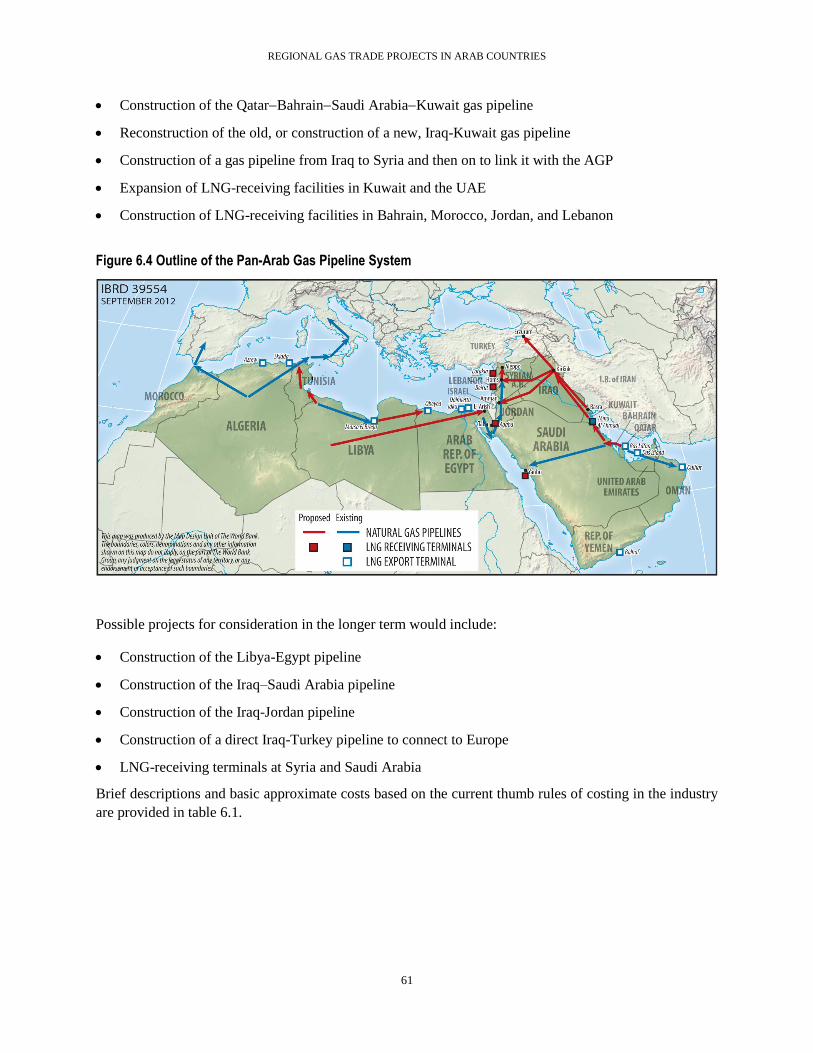
REGIONAL GAS TRADE PROJECTS IN ARAB COUNTRIES
61
Construction of the QatarBahrainSaudi ArabiaKuwait gas pipeline
Reconstruction of the old, or construction of a new, Iraq-Kuwait gas pipeline
Construction of a gas pipeline from Iraq to Syria and then on to link it with the AGP
Expansion of LNG-receiving facilities in Kuwait and the UAE
Construction of LNG-receiving facilities in Bahrain, Morocco, Jordan, and Lebanon
Figure 6.4 Outline of the Pan-Arab Gas Pipeline System
Possible projects for consideration in the longer term would include:
Construction of the Libya-Egypt pipeline
Construction of the Iraq–Saudi Arabia pipeline
Construction of the Iraq-Jordan pipeline
Construction of a direct Iraq-Turkey pipeline to connect to Europe
LNG-receiving terminals at Syria and Saudi Arabia
Brief descriptions and basic approximate costs based on the current thumb rules of costing in the industry
are provided in table 6.1.
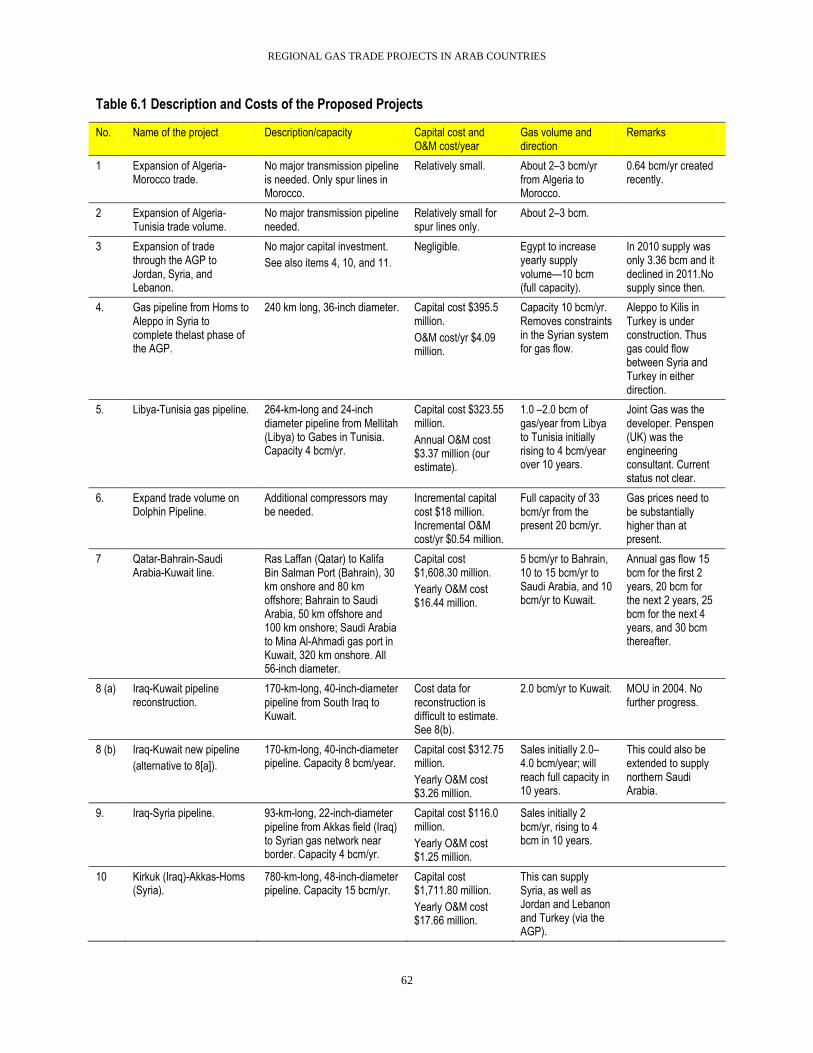
REGIONAL GAS TRADE PROJECTS IN ARAB COUNTRIES
62
Table 6.1 Description and Costs of the Proposed Projects
No. Name of the project Description/capacity Capital cost and O&M cost/year
Gas volume and direction
Remarks
1 Expansion of Algeria-Morocco trade.
No major transmission pipeline is needed. Only spur lines in Morocco.
Relatively small. About 2–3 bcm/yr from Algeria to Morocco.
0.64 bcm/yr created recently.
2 Expansion of Algeria-Tunisia trade volume.
No major transmission pipeline needed.
Relatively small for spur lines only.
About 2–3 bcm.
3 Expansion of trade through the AGP to Jordan, Syria, and Lebanon.
No major capital investment.
See also items 4, 10, and 11.
Negligible. Egypt to increase yearly supply volume—10 bcm (full capacity).
In 2010 supply was only 3.36 bcm and it declined in 2011.No supply since then.
4. Gas pipeline from Homs to Aleppo in Syria to complete thelast phase of the AGP.
240 km long, 36-inch diameter. Capital cost $395.5 million.
O&M cost/yr $4.09 million.
Capacity 10 bcm/yr. Removes constraints in the Syrian system for gas flow.
Aleppo to Kilis in Turkey is under construction. Thus gas could flow between Syria and Turkey in either direction.
5. Libya-Tunisia gas pipeline. 264-km-long and 24-inch diameter pipeline from Mellitah (Libya) to Gabes in Tunisia. Capacity 4 bcm/yr.
Capital cost $323.55 million.
Annual O&M cost $3.37 million (our estimate).
1.0 –2.0 bcm of gas/year from Libya to Tunisia initially rising to 4 bcm/year over 10 years.
Joint Gas was the developer. Penspen (UK) was the engineering consultant. Current status not clear.
6. Expand trade volume on Dolphin Pipeline.
Additional compressors may be needed.
Incremental capital cost $18 million. Incremental O&M cost/yr $0.54 million.
Full capacity of 33 bcm/yr from the present 20 bcm/yr.
Gas prices need to be substantially higher than at present.
7 Qatar-Bahrain-Saudi Arabia-Kuwait line.
Ras Laffan (Qatar) to Kalifa Bin Salman Port (Bahrain), 30 km onshore and 80 km offshore; Bahrain to Saudi Arabia, 50 km offshore and 100 km onshore; Saudi Arabia to Mina Al-Ahmadi gas port in Kuwait, 320 km onshore. All 56-inch diameter.
Capital cost $1,608.30 million.
Yearly O&M cost $16.44 million.
5 bcm/yr to Bahrain, 10 to 15 bcm/yr to Saudi Arabia, and 10 bcm/yr to Kuwait.
Annual gas flow 15 bcm for the first 2 years, 20 bcm for the next 2 years, 25 bcm for the next 4 years, and 30 bcm thereafter.
8 (a) Iraq-Kuwait pipeline reconstruction.
170-km-long, 40-inch-diameter pipeline from South Iraq to Kuwait.
Cost data for reconstruction is difficult to estimate. See 8(b).
2.0 bcm/yr to Kuwait. MOU in 2004. No further progress.
8 (b) Iraq-Kuwait new pipeline
(alternative to 8[a]).
170-km-long, 40-inch-diameter pipeline. Capacity 8 bcm/year.
Capital cost $312.75 million.
Yearly O&M cost $3.26 million.
Sales initially 2.0–4.0 bcm/year; will reach full capacity in 10 years.
This could also be extended to supply northern Saudi Arabia.
9. Iraq-Syria pipeline. 93-km-long, 22-inch-diameter pipeline from Akkas field (Iraq) to Syrian gas network near border. Capacity 4 bcm/yr.
Capital cost $116.0 million.
Yearly O&M cost $1.25 million.
Sales initially 2 bcm/yr, rising to 4 bcm in 10 years.
10 Kirkuk (Iraq)-Akkas-Homs (Syria).
780-km-long, 48-inch-diameter pipeline. Capacity 15 bcm/yr.
Capital cost $1,711.80 million.
Yearly O&M cost $17.66 million.
This can supply Syria, as well as Jordan and Lebanon and Turkey (via the AGP).

REGIONAL GAS TRADE PROJECTS IN ARAB COUNTRIES
63
No. Name of the project Description/capacity Capital cost and O&M cost/year
Gas volume and direction
Remarks
11 Kirkuk (Iraq)-Amman (Jordan).
984-km-long, 42-inch-diameter pipeline. Capacity 10 bcm/yr.
Capital cost $1,889.76 million.
Yearly O&M cost $19.5 million.
This can supply Jordan and other countries on the AGP.
May not be needed (or undersized) if line 10 is built.
12 Kirkuk (Iraq)-Erzurum (Turkey).
589-km-long, 48-inch-diameter pipeline.
Capacity 20 bcm/yr.
Capital cost $1,292.49 million. Yearly O&M cost $13.33 million.
This will supply gas from northern Iraq to the Nabucco pipeline.
This is phase 1 of Item 13.
13. Basra (southern Iraq)-Kirkuk-Erzurum (Turkey).
1,390-km-long, 48-inch-diameter pipeline.
Capacity 20 bcm/yr.
Capital cost $3,049.65 million.
Yearly O&M cost $31.44 million.
This will supply gas from the whole of Iraq to Nabucco pipeline.
This could also be sized to accommodate 30 bcm export if production in Iraq develops.
14 Western gas fields of Libya to Arish in Egypt
(to be considered only if Line 15 arrangements could not materialize).
2,800-km-long, 48-inch-diameter pipeline. Capacity 25 bcm/yr.
Capital cost $6,142.5 million. Yearly O&M cost $63.32 million.
This will feed into the AGP and could also supply Egypt.
The transit fee payable on the AGP segments should enable the expansion of their capacity.
15 Marsa El Brega (Eastern Libya) to Obeyed (Western desert of Egypt).
571-km-long, 40-inch-diameter pipeline. Capacity 8–12 bcm/year.
Capital cost $1,041.30 million.
Yearly O&M cost $10.68 million.
This will supply the Western Egyptian system.
By a swap arrangement Egypt could supply the AGP at Arish equivalent gas.
16 LNG import facilities for Jordan at Aqaba.
Capacity 4 bcm/year.
Floating Terminal Floating Storage and Re-gasification unit (FSRU).
Capital cost $300 million.
O&M cost $9 million/year.
17 LNG import terminal in Lebanon.
Capacity 5 bcm/year.
FSRU.
Capital cost $350 million.
O&M cost $10.5 million/year.
18 LNG import terminal in Syria.
Onshore facility.
5 bcm/year capacity.
Capital cost $500 million.
O&M cost $15 million/year.
19 Expansion of LNG terminal in Kuwait.
Floating facilities (FSRU).
Expansion of capacity from 5 bcm–10 bcm/year.
Incremental capital cost $200 million.
Incremental O&M cost of $6 million/year.
Existing capacity cost $150 million on the basis of lease arrangements.
20 Expansion of offshore LNG import terminal in the UAE (FSRU).
From about 4.14 bcm–10 bcm. Capital cost $300 million.
O&M cost $9 million/year.
Cost of existing charter for 15 years $450 million.
21 LNG import terminal in Saudi Arabia.
About 10 bcm/year. Capital cost $800 billion.
O&M cost $24 million/year.
22 LNG terminal in Bahrain. A terminal to receive store and regasify LNG at the Kalifa-bin-
Capital cost $1.0 billion.
Expected to be commissioned by

REGIONAL GAS TRADE PROJECTS IN ARAB COUNTRIES
64
No. Name of the project Description/capacity Capital cost and O&M cost/year
Gas volume and direction
Remarks
Salman Port. Capacity about 4 bcm capable of being expanded later to 8 bcm later.
O&M cost $30 million/year.
2016.
23 LNG terminal in Morocco. LNG regasification terminal at Jorf Lasfar with an annual capacity of 5 bcm and later expansion to 10 bcm by 2020.
€600 million for stage 1 and a total of €1.0 billion for a total capacity of 10 bcm.
O&M cost €18 million/year for stage 1 and €30 million for stage 2.
SNI and Akwa signed a partnership deal to implement it in 2010.
Source: Analysis in this report.
In table 6.1, the distances given were measured from maps; capital costs were estimated following current
industry practices, as summarized in table 6.2. The operation and maintenance (O&M) cost for each
pipeline is assumed to be 1 percent of the capital cost, and for compressors it is assumed to be 3 percent
of the capital cost. LNG import terminal and regasification facilities are assumed to have annual O&M
costs of 3 percent of their capital cost
Table 6.2 Capital Cost Calculations: Rules of Thumb
Capacity Pipeline diameter (inches)
Number of compressors Pipeline capital cost ($) / one inch of diameter / one meter of length
Compressor capital cost ($m) / piece
Up to 4 bcm/year 24 inches 1/100 km $50. $2.25
8 bcm/year 32 inches 1/100 km $47.5 $2.25
8–12 bcm/year 40 inches 1/100 km $45 $2.25
12–18 bcm/year 44 inches 1.5/100 km $45 $2.25
20–30 bcm/year 56 inches 1.5/100 km $40 $2.25
Source: Analysis in this report.
For LNG terminals in Morocco and Bahrain, the cost estimates indicated in the existing literature have
been adopted.
Economic Analysis of Possible Projects
To carry out an economic analysis of possible pipeline and LNG import projects, we need to have (in
addition to the capital and operating costs and volume of gas transported over the lifetime of the projects)
an oil price projection and a suitable formula for indexing the price of gas and LNG to oil prices, as well
as the netback value of gas in the importing countries.
Oil price projections follow the commodity price forecasts of the World Bank. Oil prices (in real terms)
are projected to decline from $90 in 2012 to $70 in 2015, and stay at that level for the remaining period of
analysis.
In the gas and LNG trade, traders traditionally use a generic formula for linking the oil price to gas or
LNG, as shown below:
Gas price in $/mmbtu = a constant + (slope x oil price in $/barrel).
Gas achieves oil price parity when the constant is zero and the slope is 0.17. Often the slope is smaller
(such as 0.10), to limit the rate of increase in gas prices when the oil price rises fast. Similarly a constant

REGIONAL GAS TRADE PROJECTS IN ARAB COUNTRIES
65
such as 2 is introduced to limit the decline in gas prices when oil prices rapidly drop. Gas price
negotiations thus focus on reaching agreement on the slope and the constant in the above generic formula.
In most Asian contracts the slope is as high as 0.15, while in Europe it is around 0.10.
Based on the current oil price outlook as well as world gas supply and demand outlook, the experts
consulted believe that it will be appropriate to use the following formulae for the purposes of our
economic analysis in the envisaged time frame:
Gas price in $/mmbtu = (-1) + 0.14 x crude price in $/barrel
LNG price in $/mmbtu = (0) + 0.14 x crude price in $/barrel
The trade practice for exports of pipeline gas is to quote the price of gas for delivery at the exporting
country’s border, to which further transport costs have to be added depending on the destination. In
respect to LNG trades, the prices quoted are free on board (FOB) to which shipping costs are to be added.
Since in most cases the seller arranges shipping, the seller could also quote cost, insurance, and freight
(CIF) costs.
At the projected oil price of $70/barrel, the purchase price of gas would be $8.8/mmbtu. It is important to
note that this price is for delivery at the border of the exporting country and if the country happens to be
large, the cost of transportation from the wellhead to that border point has to be deducted from the gas
purchase prices, derived from the formula. In the analysis the cost of such transport for this purpose is
assumed to be $0.15/100 km/mmbtu.
At the stated oil price of $70/barrel, the LNG price would amount to $9.8/mmbtu on an FOB basis, to
which we have to add the shipping costs to arrive at the CIF price at the import terminal. For this purpose
shipping costs have been assumed to be $0.5/mmbtu, as most of the LNG is expected from within the
region. Results have also been tested for a shipping cost of $0.75/mmbtu (an increase of 50 percent).
Further, the imported gas or the regasified LNG has to be transported within the importing country until
the gates of the power plants and these internal transport costs have been calculated at $0.15/mmbtu/100
km, based on the estimated average distances involved. In a country like Turkey with well-developed gas
transmission system a lower cost has been assumed.
Thus in the economic analysis carried out, the costs of any pipeline/LNG import projects include the
capital costs of the pipeline/import terminal and the regasification facilities, the related annual O&M cost,
adjustments for internal transport within the exporting and importing countries, gas or LNG input prices
calculated on the basis of oil price projections, and the noted oil-to-gas formulae. The benefits are the
netback value of the gas for power generation, since most of the imported gas is likely to go for power
generation.
Results of the Economic Analysis
The results of the economic analysis are provided in appendix 2; economic internal rates of return are
summarized in table 6.3 for pipeline projects and in table 6.4 for LNG terminal projects.

REGIONAL GAS TRADE PROJECTS IN ARAB COUNTRIES
66
Table 6.3 The EIRRs and Levelized Cost of Gas for Pipeline Projects
No. Name of pipeline EIRR (%) Levelized cost of gas @5% discount rate
$/mmbtu
1 Qatar–Bahrain–Saudi Arabia–Kuwait Pipeline 53 7.36
2 Iraq-Kuwait Pipeline New Construction 53 7.69
3 Libya-Tunisia Pipeline 35 7.77
4 Akkas (Iraq)-Syria Pipeline 66 7.36
5 Kirkuk (Iraq)-Erzurum (Turkey) Pipeline 37 7.90
6 Basra (Iraq)-Kirkuk-Erzurum Pipeline 24 7.24
7 Kirkuk (Iraq)-Homs (Syria) Pipeline 43 7.45
8 Kirkuk (Iraq)-Jordan Pipeline 33 7.44
9 Additional sales via Dolphin Pipeline 974 8.53
10 West Libya to El Arish (Egypt) and to Jordan, Syria, Lebanon, and Turkey 21 8.23
11 Marsa El Brega (Libya) to Obeyd (Egypt) supply to AGP by swap 48 7.49
Source: Analysis in this report.
All these projects have robust economic internal rates of return (EIRRs) and can stand significant adverse
variations in capital costs and gas flows. The EIRR of the project for additional sales via the Dolphin
Pipeline are very high, because of the substantial unutilized capacity in the existing pipeline and the need
for only a modest incremental investment to sell an annual additional volume of 13 bcm of gas. The
levelized cost of gas calculated at a 5 percent discount rate indicates a reasonable range of
$7.24$8.53/mmbtu for the various lines. It is important to note that the levelized cost indicated is for the
project as a whole and not for individual countries, of which the project covers many.
The LNG terminals include facilities for receiving LNG tankers, storage, and regasification facilities.
Those based on the concept of floating facilities are much less expensive than those based on land. Where
plans seem to be firm for land-based facilities, such facilities are chosen; for the rest, floating facilities are
proposed.
Table 6.4 The EIRRs and Levelized Cost of Gas for LNG import Projects
No. Location of the LNG import terminal and regasification project EIRR (%) Levelized cost of gas
$/mmbtu
1 Aqaba, Jordan (FSRU) 11 10.42
2 Mediterranean port, Lebanon 33 9.33
3 Mediterranean port in Syria 9 9.46
4 West coast of Saudi Arabia, near Yanbu 11 9.41
5 Bahrain 16 8.98
6 Jorf Lasfar in Morocco 8 9.46
7 Expansion of the facilities in Kuwait Minal Al-Ahmadi gas port (FSRU) 71 9.62
8 Expansion of the facilities in the UAE, Jebel Ali Port (FSRU) 40 10.01
Source: Analysis in this report.

REGIONAL GAS TRADE PROJECTS IN ARAB COUNTRIES
67
The EIRR for the Morocco project is modest because of high capital costs and long distances of internal
transport to reach the power plants. Economies in capital costs and restricting supplies to power plants
located closer to the LNG import facility would improve the project economics. Also for Morocco, it
would be far less expensive to import gas from Algeria than to use LNG. Syria also needs to use gas in
power plants closer to the proposed LNG import facility. Here, too, there is no compelling reason to resort
to LNG imports since there is easy access to pipeline gas from Iraq. The EIRRs of the expansion projects
in Kuwait and the UAE have high EIRRs because of the relatively low incremental capital costs.
The financial implication for the above economic analysis and calculations would appear to be that
financial gas prices at the origin could range from a gas input price indicated in each case to the level
needed to provide an internal rate of return (IRR) of 10 percent (which may be regarded as the minimum
needed for such investments). The seller will tend to quote prices approaching the netback value of gas in
the market, while the buyer will tend to limit the purchase price to the negotiated oil-related input prices
along the lines indicated in the analysis (negotiating the constant and the slope). The other implication is
the need to realign the financial prices of alternate fuels closer to the economic netback value.
Demonstration of the Superiority of the Combined Pipeline Project
The economic analysis (in appendix 3) carried out also demonstrates how the construction of a combined
pipeline project in Qatar—to meet the import needs of Bahrain, Saudi Arabia, and Kuwait—is far more
economically attractive compared to the construction of three individual projects to meet the needs of
each country, as can be seen from the summary given in table 6.5.
Table 6.5 Relative Costs of Combined and Individual Projects
No Option PV of capital cost ($ million)
PV of O&M cost ($ million)
PV of total cost ($ million)
1 Combined pipeline for all three countries from Qatar 1,231.95 129.80 1,361.75
2 Pipeline from Qatar to Bahrain alone 377.77 24.11 401.88
3 Pipeline from Qatar to Saudi Arabia alone 612.36 63.10 675.46
4 Pipeline from Qatar to Kuwait alone 1,274.42 130.59 1,405.01
5 Total for three separate pipelines 2,264.55 217.80 2,482.35
Source: Analysis in this report.
The present values calculated at a discount rate of 12 percent are significantly lower for the combined
project than the total of all three individual projects, in respect to capital costs, O&M costs, and total
costs, indicating the superiority of the combined project. Further, the total costs of the combined project
have been allocated among the three countries, adopting the following formulas:
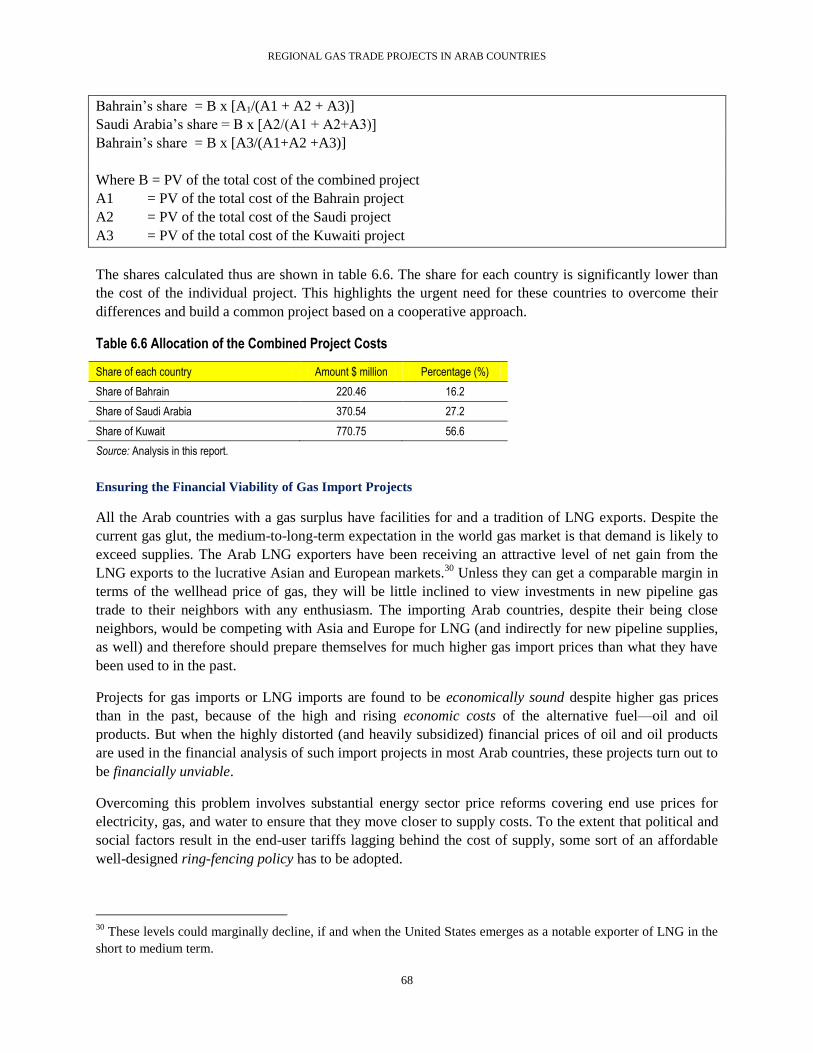
REGIONAL GAS TRADE PROJECTS IN ARAB COUNTRIES
68
Bahrain’s share = B x [A1/(A1 + A2 + A3)]
Saudi Arabia’s share = B x [A2/(A1 + A2+A3)]
Bahrain’s share = B x [A3/(A1+A2 +A3)]
Where B = PV of the total cost of the combined project
A1 = PV of the total cost of the Bahrain project
A2 = PV of the total cost of the Saudi project
A3 = PV of the total cost of the Kuwaiti project
The shares calculated thus are shown in table 6.6. The share for each country is significantly lower than
the cost of the individual project. This highlights the urgent need for these countries to overcome their
differences and build a common project based on a cooperative approach.
Table 6.6 Allocation of the Combined Project Costs
Share of each country Amount $ million Percentage (%)
Share of Bahrain 220.46 16.2
Share of Saudi Arabia 370.54 27.2
Share of Kuwait 770.75 56.6
Source: Analysis in this report.
Ensuring the Financial Viability of Gas Import Projects
All the Arab countries with a gas surplus have facilities for and a tradition of LNG exports. Despite the
current gas glut, the medium-to-long-term expectation in the world gas market is that demand is likely to
exceed supplies. The Arab LNG exporters have been receiving an attractive level of net gain from the
LNG exports to the lucrative Asian and European markets.30
Unless they can get a comparable margin in
terms of the wellhead price of gas, they will be little inclined to view investments in new pipeline gas
trade to their neighbors with any enthusiasm. The importing Arab countries, despite their being close
neighbors, would be competing with Asia and Europe for LNG (and indirectly for new pipeline supplies,
as well) and therefore should prepare themselves for much higher gas import prices than what they have
been used to in the past.
Projects for gas imports or LNG imports are found to be economically sound despite higher gas prices
than in the past, because of the high and rising economic costs of the alternative fuel—oil and oil
products. But when the highly distorted (and heavily subsidized) financial prices of oil and oil products
are used in the financial analysis of such import projects in most Arab countries, these projects turn out to
be financially unviable.
Overcoming this problem involves substantial energy sector price reforms covering end use prices for
electricity, gas, and water to ensure that they move closer to supply costs. To the extent that political and
social factors result in the end-user tariffs lagging behind the cost of supply, some sort of an affordable
well-designed ring-fencing policy has to be adopted.
30
These levels could marginally decline, if and when the United States emerges as a notable exporter of LNG in the
short to medium term.
REGIONAL GAS TRADE PROJECTS IN ARAB COUNTRIES
69
Egypt, for example, allows reasonably attractive producer prices of gas for upstream international gas
production companies to incentivize them to produce gas for the domestic market, even though its state-
regulated gas price for domestic consumers is substantially less. The difference between the two sets of
prices is borne by the state and is made available to the state-owned domestic gas supply companies to
enable them to buy gas at high prices from the international companies.
Similar ring-fencing mechanisms may have to be used for high-priced imported gas as well, to the extent
that domestic retail prices cannot be increased to match the increasing supply costs induced by imported
gas.
That said, several caveats are in order. Such a ring-fencing mechanism must be viewed as a temporary
and “second-best” option to be phased out over the medium term so as not to erode consumption
efficiency, demand management efficiency, and resource allocation efficiency. Best efforts need to be
made to make the gap between the supply costs and tariffs as small as possible. Intelligent use of internal
cross-subsidies and block tariffs could possibly reduce the total volume of the subsidy. Based on the
problems faced in Egypt, administrative systems and procedures need to be improved to ensure that
government subsidies are paid in full and in a timely fashion to enable domestic gas suppliers and
domestic power and water utilities to pay for the imported gas punctually and avoid payment defaults.
The overall volume of such subsidies should not erode the macroeconomic soundness and fiscal balance
of the country.
The systematic phase-out of gas-price subsidies is an essential component of the formulation of any gas
trade project. Such a plan needs to have a clear target and time frame for implementation to assure
investors and financiers of the project’s financial sustainability.
Outlook for the Proposed Projects
Not all the 23 projects listed in table 6.1 can be expected to materialize in a predictable time frame.
Resolving the domestic energy-pricing issue by phasing out energy subsidies is the most important reform
needed to promote regional gas trade, though such a reform has proven politically difficult in the past.31
Even more important is the need for (i) the present political turmoil in the region to subside and (ii) the
restoration of credible, legitimate, and efficient governance arrangements in many countries. These are
interrelated issues: price reforms will be possible only when such governance arrangements are in place.
In the light of these concerns and the prevailing environment in the region, only a few projects are likely
to materialize in the near future. Today’s environment is not conducive to the construction of new cross-
border pipelines; LNG import terminals are likely to proceed more quickly. Thus, among the pipeline
proposals one may expect gas trade to increase relatively quickly, using existing facilities or with
marginal capacity augmentation. Examples include the Dolphin Pipeline (item 6); restoration and possibly
some expansion of trade through the AGP to Jordan (item 3); and expansion of trade among Algeria,
Tunisia, and Morocco (items 1 and 2). Other pipelines may have to await a more conducive environment.
Among them the QatarBahrainSaudi ArabiaKuwait line is the most attractive, but is also dependent
on the resolution of major political, strategic, and border-related issues.
The projects relating to the LNG import terminals in Jordan, Lebanon, Morocco, and Bahrain (items 16,
17, 22, and 23) are going through the bidding phase, and the project relating to Saudi Arabia (item 21)
31
It continues to be difficult; consider the violent and widespread agitation prompted by the recent energy price
increases announced in Jordan.

REGIONAL GAS TRADE PROJECTS IN ARAB COUNTRIES
70
will have to await a change in Saudi energy policy. The expansion of LNG import facilities in Kuwait and
the UAE (items 19 and 20) are already in the detailed planning stage.

Chapter 7. Financing and Implementation Arrangements
Financing Gas Trade Projects
Pipeline gas projects take considerable time to materialize. The exporting country’s capacity and
reliability of supply has to be reasonably ensured for at least 20 to 30 years through a technical review
and audit of the dedicated gas resources by independent firms and appropriate “supply or pay” conditions
in the supply contract. Similarly the demand forecasts in the importing country have to be reviewed to
ensure assurance of offtake and by incorporating take-or-pay conditions in the purchase contract. Pipeline
routes have to be settled, taking into account right-of-way problems and environmental regulations in all
relevant countries. Territorial disputes or border disputes, if any, need to be addressed. The full
cooperation of the transit country (countries) needs to be ensured both politically and in contractual terms.
Overarching agreements of cooperation among the governments of the exporting, importing, and transit
countries may have to be negotiated and signed to avoid political risks and pipeline security risks even
when the entire project is fully financed, implemented, and operated by private entrepreneurs. Financing
gas trade projects would require assurance of long-term reliability and stability of gas flows and financial
flows, which call for tight and comprehensive risk mitigation, and contractual and guarantee
arrangements. Many of these elements are applicable for long-term liquefied natural gas (LNG) supply
contracts also. Only physical constraints relating to the actual pipelines do not apply in the case of LNG
trade, except to the extent that pipelines supplying gas to the liquefaction trains in the exporting country
might face similar constraints.
Preparing a financeable gas trade project requires striking a balance among the following three
components:
Ownership structure. The shareholding of the project interest may be purely private, purely public, or
some combination of public and private investment. The ownership structure should be suitable to the
nature of the project and also to the ability of various shareholders to contribute to the successful
implementation and operation of the corresponding facilities. The ownership structure is often
adjusted through the course of project preparation in response to various constraints and
requirements.
Financial structure. The first decision in structuring the financial package is the portion of the project
cost that should be funded in the form of equity; the rest will be project debt. For gas trade projects,
equity varies between 20 and 40 percent of the project cost. Clearly, a higher equity ratio means a
higher commitment by project sponsors and a lower risk for lenders. Thus, lenders like to see high
equity ratios, whereas sponsors prefer lower ratios to minimize the funds they lock into one project.
The acceptable equity ratio depends on the creditworthiness of the sponsors, the risks, and the
location of the project.
Risk mitigation package. Essential to structuring a project finance package are identification, analysis,
allocation, and mitigation of project risks. These risks are related to events that could endanger the
project during development, construction, and operation. Ideally, the security package should protect
the project against all significant risks. In particular measures intended to manage the risks try to
convince financiers that: costs will not exceed the projected levels, and, if they do, some other party

REGIONAL GAS TRADE PROJECTS IN ARAB COUNTRIES
72
will take the burden before the cost increase affects the financing of the project; revenues will not fall
short of projected levels, and, if they do, some other party will make up the shortfall so that project
finances are not hurt; and the investment is safe and returns can be transferred out of the country, or,
if funds cannot be transferred, a credible agency will cover legitimate losses due to the
nontransferability of funds.
The balance among the above three components of the project structure is a very delicate matter in the
case of gas trade projects. Preparation of the project structure may go through several iterations before
one can get the right sponsors who are willing and able to bring in financial resources while providing a
comparative advantage in project construction and operation.
The Roles of Government and the Private Sector
In many parts of the world, the natural gas industry has gone through fundamental changes resulting in
competition in the supply of gas, elimination of many of the monopolistic features of the industry, and a
free market determination of the price of gas. But in the Arab countries the gas industry remains mostly
under government control while the price of natural gas is set directly or indirectly by government
entities. The price of gas is often set at very low levels based on social and political considerations.
Authorities in most Arab countries agree that they need to increase the gas price to encourage efficiency
of gas consumption, and to fund the domestic supply or import of gas. Nevertheless, the gas price
adjustment is expected to take place in a step-by-step and gradual fashion. In the meantime the
government is carrying the burden of substantial amounts of gas subsidies and even larger magnitudes
when gas is not available and oil is consumed instead.
Arab governments are encouraging private sector participation in various segments of the industry. But in
most cases such participation would require special arrangements to compensate for low domestic gas
prices and to mitigate various risks.
In most of the gas-exporting countries upstream activities are being carried out by joint ventures among
international oil and gas companies and mostly state-owned national oil and gas companies, while
pipelines within the country are owned and operated by the national oil and gas companies. In the case of
cross-border pipelines, appropriate ownership structures for the pipeline segments and common operating
regimes for the entire pipeline have to be evolved and agreed upon. When the gas trade takes place
through a dedicated line, which is used exclusively for that trade, the arrangements are somewhat less
complicated. When the cross-border pipeline becomes a part of the national network of the relevant
countries, matters become more complicated in terms of capacity allocation, congestion management, and
consistency of regulatory arrangements in all relevant countries. When trade is handled by a dedicated
and exclusive cross-border pipeline, regulation can be handled generally through contract terms. In terms
of ownership structuring there has been some experience in the region in respect to the several pipelines
from Algeria to Europe directly and through Morocco and Tunisia. The Arab Gas Pipeline (AGP) and the
Dolphin Pipeline provide possible further variations. The cross-border pipeline segment in each country
could be owned jointly by the developer and the national oil or gas company of that country, though the
entire pipeline is constructed and operated by the developer. Whatever way the deal is structured, it would
be necessary and fruitful to ensure that operation and maintenance of the entire line are handled by one
entity with competence and high stakes in the venture. Giving a management contract to an outside,
internationally recognized competent company has been successful in many cases. Such an arrangement
facilitates independent and neutral measurement of the gas flows (in relation to the export contracts) and
help in the settlement of payments.
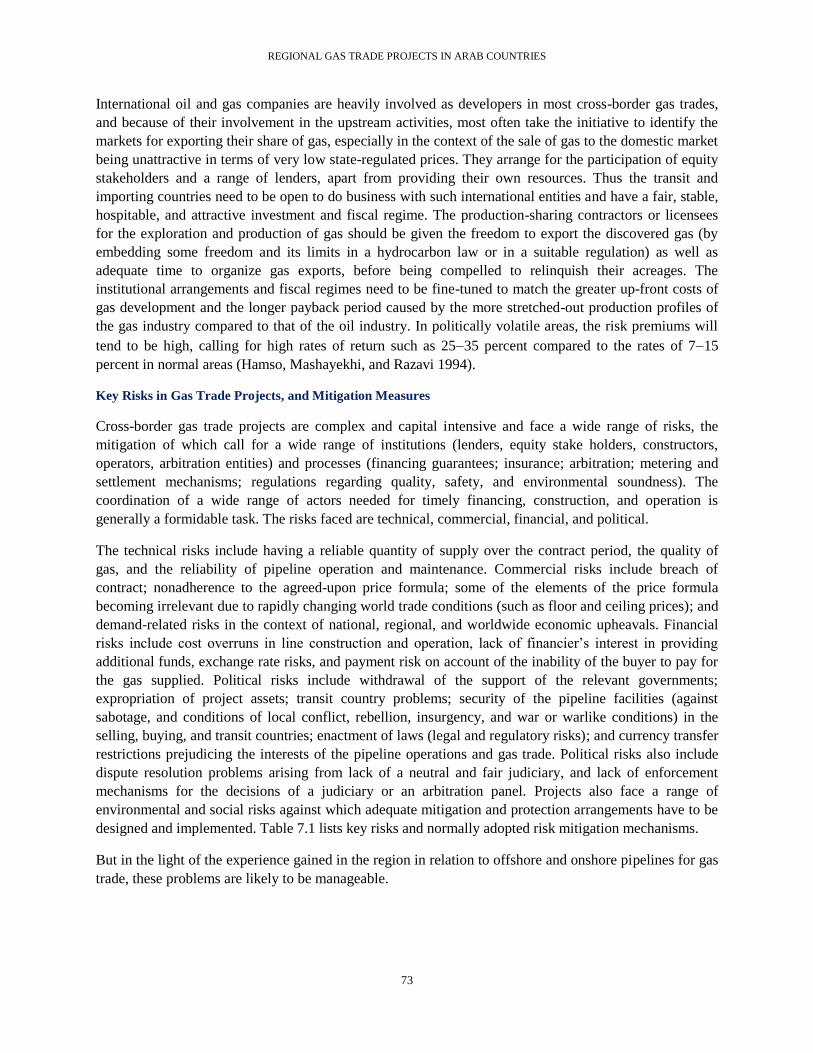
REGIONAL GAS TRADE PROJECTS IN ARAB COUNTRIES
73
International oil and gas companies are heavily involved as developers in most cross-border gas trades,
and because of their involvement in the upstream activities, most often take the initiative to identify the
markets for exporting their share of gas, especially in the context of the sale of gas to the domestic market
being unattractive in terms of very low state-regulated prices. They arrange for the participation of equity
stakeholders and a range of lenders, apart from providing their own resources. Thus the transit and
importing countries need to be open to do business with such international entities and have a fair, stable,
hospitable, and attractive investment and fiscal regime. The production-sharing contractors or licensees
for the exploration and production of gas should be given the freedom to export the discovered gas (by
embedding some freedom and its limits in a hydrocarbon law or in a suitable regulation) as well as
adequate time to organize gas exports, before being compelled to relinquish their acreages. The
institutional arrangements and fiscal regimes need to be fine-tuned to match the greater up-front costs of
gas development and the longer payback period caused by the more stretched-out production profiles of
the gas industry compared to that of the oil industry. In politically volatile areas, the risk premiums will
tend to be high, calling for high rates of return such as 2535 percent compared to the rates of 715
percent in normal areas (Hamso, Mashayekhi, and Razavi 1994).
Key Risks in Gas Trade Projects, and Mitigation Measures
Cross-border gas trade projects are complex and capital intensive and face a wide range of risks, the
mitigation of which call for a wide range of institutions (lenders, equity stake holders, constructors,
operators, arbitration entities) and processes (financing guarantees; insurance; arbitration; metering and
settlement mechanisms; regulations regarding quality, safety, and environmental soundness). The
coordination of a wide range of actors needed for timely financing, construction, and operation is
generally a formidable task. The risks faced are technical, commercial, financial, and political.
The technical risks include having a reliable quantity of supply over the contract period, the quality of
gas, and the reliability of pipeline operation and maintenance. Commercial risks include breach of
contract; nonadherence to the agreed-upon price formula; some of the elements of the price formula
becoming irrelevant due to rapidly changing world trade conditions (such as floor and ceiling prices); and
demand-related risks in the context of national, regional, and worldwide economic upheavals. Financial
risks include cost overruns in line construction and operation, lack of financier’s interest in providing
additional funds, exchange rate risks, and payment risk on account of the inability of the buyer to pay for
the gas supplied. Political risks include withdrawal of the support of the relevant governments;
expropriation of project assets; transit country problems; security of the pipeline facilities (against
sabotage, and conditions of local conflict, rebellion, insurgency, and war or warlike conditions) in the
selling, buying, and transit countries; enactment of laws (legal and regulatory risks); and currency transfer
restrictions prejudicing the interests of the pipeline operations and gas trade. Political risks also include
dispute resolution problems arising from lack of a neutral and fair judiciary, and lack of enforcement
mechanisms for the decisions of a judiciary or an arbitration panel. Projects also face a range of
environmental and social risks against which adequate mitigation and protection arrangements have to be
designed and implemented. Table 7.1 lists key risks and normally adopted risk mitigation mechanisms.
But in the light of the experience gained in the region in relation to offshore and onshore pipelines for gas
trade, these problems are likely to be manageable.

REGIONAL GAS TRADE PROJECTS IN ARAB COUNTRIES
74
Table 7.1 Key Risks and Commonly Adopted Mitigation Measures
No. Risk Mitigation measures Key mitigation agents
A. Technical risks
1. Supply risk quantity and quality
Independent technical audit of the reserves and quality of gas.
Incorporation of “supply or pay” conditions in the contract for the firm supply portion of the contract (see item 6 also).
Independent technical auditors
2. Reliability of pipeline operation and maintenance
Management of the pipeline operation and maintenance, metering, and settlement functions by a competent and experienced developer or by independent and neutral management contractors.
Developer or management contractor
B. Commercial risks
3. Breach of contract Structure contracts with fairness to all parties, support contracts with international treaties such as the Energy Charter Treaty (ECT). Contracts to include dispute resolution mechanism and compensation for its breach.
Governments
4. Nonadherence to the price formula
Contract to include dispute resolution mechanism and compensation for nonadherence.
5. Elements of price formula becoming irrelevant
Contract to provide for periodic renegotiation to realign such elements with current realities.
6. Demand risks Contract to divide the total supply into firm contracted quantities (90 percent) and something like 10 percent as discretionary purchases or supplies at the same agreed price. Contract to provide for take-or-pay provisions for the firm supply.
C. Financial risks
7. Cost overruns Firm fixed-price EPC contracts for construction, and management contract for O&M with agreed escalation clauses.
8. Lack of additional funding risk Secure such contingency funding requirements from relevant governments, covered by IFI guarantees.
Governments and IFIs
9. Payment risk Guarantee by the government of the importing country and, if needed, partial risk and partial credit guarantees by IFIs, counter guaranteed by the relevant governments.
Governments, commercial banks, and IFIs.
10. Exchange rate risk Index payments to a commonly traded currency. Both parties to hedge against exchange rate losses using commercially available products.
D. Political risks
10. Withdrawal of government support
Governments to be signatories of treaties such as the ECT. Political risk guarantees from IFIs such as the MIGA. Involvement of IFIs in the project. Contracts to specify compensation in the event of expropriation or other acts adversely affecting the project.
IFIs, MIGA
11. Expropriation of assets
12. Legal and regulatory risks
13. Pipeline security risk Intergovernmental treaty, project supplementing state forces to provide security, political risk guarantees as above.
Governments and the MIGA
14. Dispute resolution risk Agree to the dispute resolution mechanism of the ECT or provide for international arbitration in a third country under specified third country laws or use the ICSID for arbitration.
The ECT, the ICSID, arbitration panels
E. Environmental and social risks
15. Environmental and social risks
Carry out environmental impact assessments and social assessments, arrange for the implementation of mitigation mechanisms, and for independent monitoring of compliance. Involve IFIs and make use of their safeguard procedures and mechanisms.
Environmental and social specialists, IFIs, NGOs, governments.
Source: Partly based on Hamso, Mashayekhi, and Razavi (1994).
Note: ECT = Energy Charter Treaty; ICSID = International Center for the Settlement of Investment Disputes; IFI = international financial institution; MIGA = Multilateral Investment Guarantee Agency; NGO = nongovernmental organization.

REGIONAL GAS TRADE PROJECTS IN ARAB COUNTRIES
75
Public-Private Partnership Structure for Gas Trade Projects
The concept of public-private partnerships (PPPs) is rather broad; a PPP can involve any type of long-
term contract between the public and private sectors for the construction and operation of infrastructure
facilities. With this wide definition, a PPP could mean: (i) joint shareholding by public and private
investors in a project; (ii) public contribution to debt; (iii) subsidized purchase of output; or (iv) more
generally, public purchase of the output. Thus almost all existing and potential gas trade projects in the
Arab world are considered PPPs.
The PPP structure is indeed the most suitable solution to financing future gas trade projects in the Arab
world. The ownership and financial structure of these projects vary somewhat depending on whether the
corresponding project is a cross-border pipeline or an LNG terminal project. The structure, or more
precisely the list of participants, varies depending on whether the project is located in the Gulf
Cooperation Council (GCC) region or other subregions of the Arab world.
PPP for Pipeline Projects
For pipeline projects within the Mashreq and Maghreb subregions, the most suitable structure is a PPP
among the two (exporting and importing) governments and a private company (or consortium). This
ownership structure will enable the project to benefit from the synergy and the strengths of the partners. It
will also provide for the most effective options for risk management and mitigation.
Participation by the private sector is essential for efficient formulation of the project, mobilizing finance,
and construction of the pipeline system. Nevertheless, it needs to interact with national gas companies in
both the exporting and importing countries. The technical and financial competence of the private partner
is key to successful project implementation and operation. The private sector should be expected to accept
project risks that are under its own control. These would include the risks of cost overrun, construction
schedules, and reliability of operations and maintenance.
Participation of the government of the exporting country provides private sector actors the possibility of
effectively managing interactions with corresponding government entities, including the national (oil) gas
company. It also enables the project to ensure security of gas supply, acquire the right of way and
assurance for security of the pipeline, and other transactional items within the territory of the exporting
country.
Participation by the government of the importing country is a prerequisite for the cross-border gas
projects in the Arab countries. The government and/or the national gas company would need to guarantee
the offtake of the gas in accordance with the terms of a contract. Furthermore, the government would
need to manage the subsidy scheme that will be necessary as long as the domestic gas price is kept
substantially lower than the import price of gas.
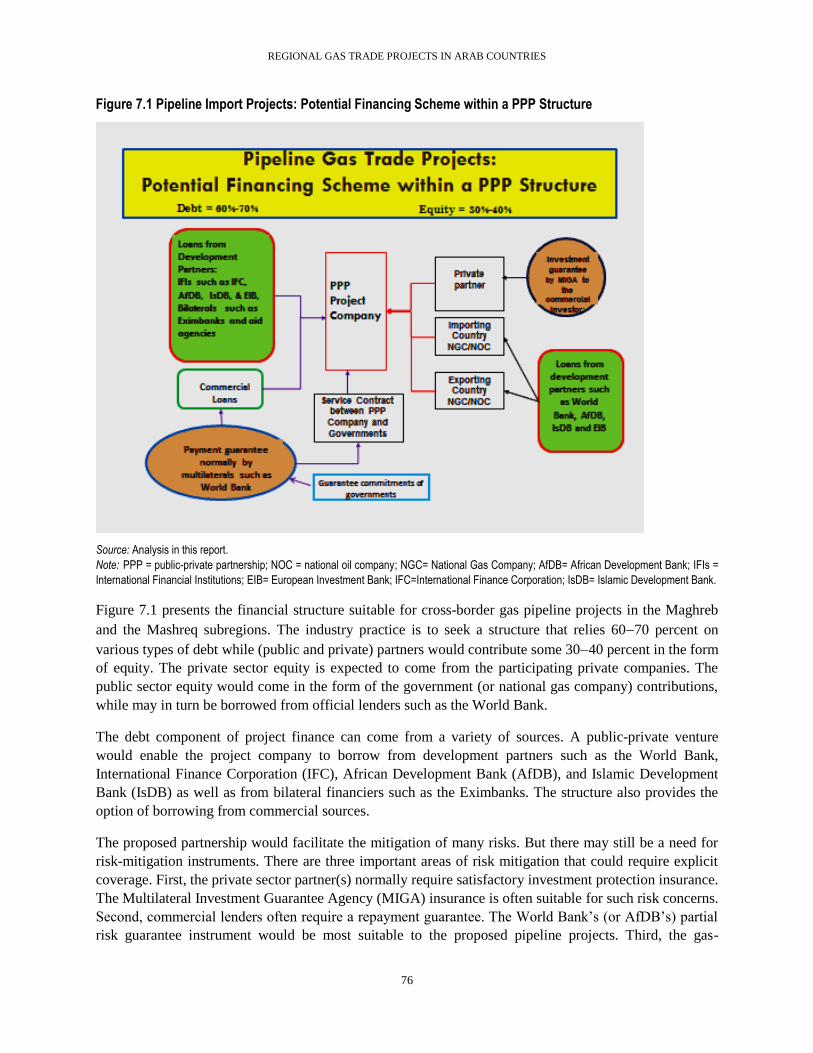
REGIONAL GAS TRADE PROJECTS IN ARAB COUNTRIES
76
Figure 7.1 Pipeline Import Projects: Potential Financing Scheme within a PPP Structure
Source: Analysis in this report.
Note: PPP = public-private partnership; NOC = national oil company; NGC= National Gas Company; AfDB= African Development Bank; IFIs =
International Financial Institutions; EIB= European Investment Bank; IFC=International Finance Corporation; IsDB= Islamic Development Bank.
Figure 7.1 presents the financial structure suitable for cross-border gas pipeline projects in the Maghreb
and the Mashreq subregions. The industry practice is to seek a structure that relies 6070 percent on
various types of debt while (public and private) partners would contribute some 3040 percent in the form
of equity. The private sector equity is expected to come from the participating private companies. The
public sector equity would come in the form of the government (or national gas company) contributions,
while may in turn be borrowed from official lenders such as the World Bank.
The debt component of project finance can come from a variety of sources. A public-private venture
would enable the project company to borrow from development partners such as the World Bank,
International Finance Corporation (IFC), African Development Bank (AfDB), and Islamic Development
Bank (IsDB) as well as from bilateral financiers such as the Eximbanks. The structure also provides the
option of borrowing from commercial sources.
The proposed partnership would facilitate the mitigation of many risks. But there may still be a need for
risk-mitigation instruments. There are three important areas of risk mitigation that could require explicit
coverage. First, the private sector partner(s) normally require satisfactory investment protection insurance.
The Multilateral Investment Guarantee Agency (MIGA) insurance is often suitable for such risk concerns.
Second, commercial lenders often require a repayment guarantee. The World Bank’s (or AfDB’s) partial
risk guarantee instrument would be most suitable to the proposed pipeline projects. Third, the gas-

REGIONAL GAS TRADE PROJECTS IN ARAB COUNTRIES
77
exporting country is often concerned about the ability of the importing country to adhere to the offtake
and payment of the contracted gas trade. This risk could be somewhat covered by a guarantee from the
government of the importing country. Alternatively, the risk could be covered by a World Bank partial
risk guarantee.
PPP for LNG Import Projects
LNG import schemes often consist of a reciving terminal, regasification facilities, and a pipeline system
that takes the gas to the grid or large consumers. Therefore, project financing should be structured to
cover all the relevant components of the LNG scheme. Within the Mashreq and Maghreb subregions, the
most suitable structure for financing LNG schemes is a PPP among the government of the importing
country and a private company (or consortium). This ownership structure will enable the project to benefit
from the synergy and strengths of these partners. It will also provide for the most effective options for risk
management and mitigation.
Private sector investment in the receiving terminal and regasification facilities is already an accepted
practice in the GCC countries. For countries in the Maghreb and Mashreq subregions, private sector
participation could be even broader to cover the receiving terminal, the regasification facilities, as well as
the corresponding pipeline system that would take the gas to the major consumption centers. The role of
the private sector will be important in efficient formulation of the project, mobilizing finance, and
construction of the entire LNG scheme. Private sector actors should be also expected to accept project
risks under their control.
Participation by the government of the importing country is essential in establishing the political direction
for such a strategic project. The government and/or the national gas company would also need to
guarantee the offtake of the gas in accordance with the terms of the contract. Furthermore, the
government would need to manage the subsidy scheme that will be necessary as long as the domestic gas
price is kept substantially lower than the import price of gas.
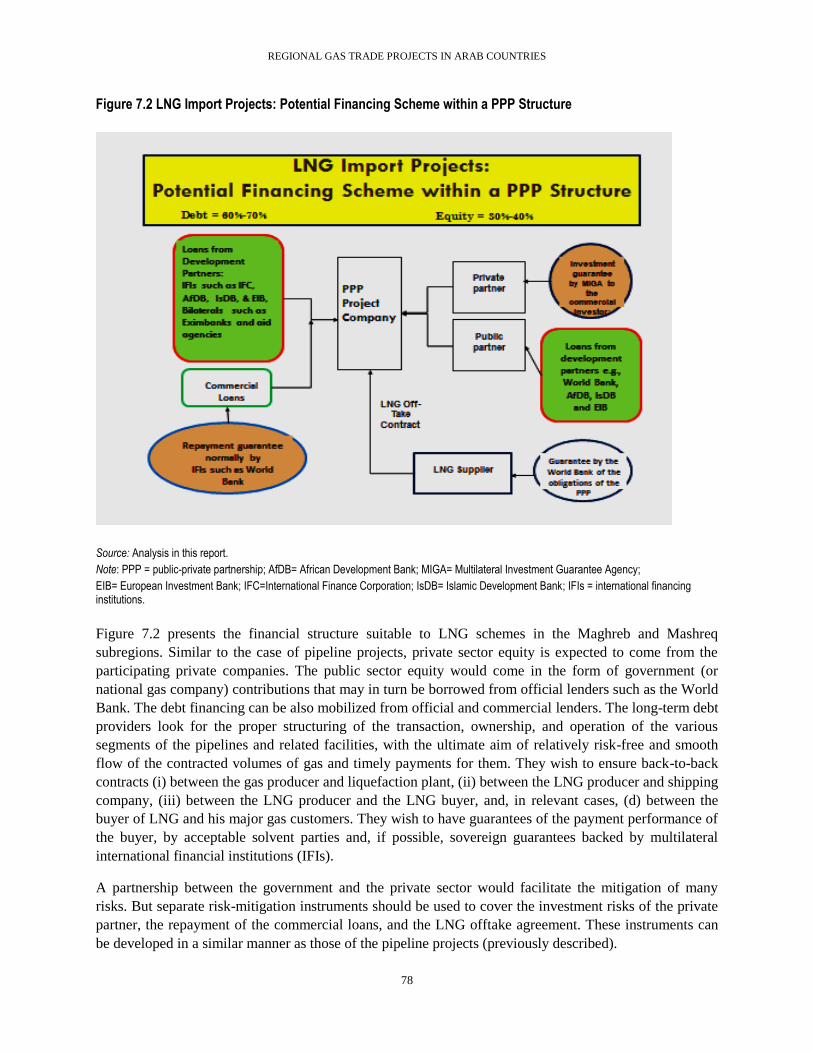
REGIONAL GAS TRADE PROJECTS IN ARAB COUNTRIES
78
Figure 7.2 LNG Import Projects: Potential Financing Scheme within a PPP Structure
Source: Analysis in this report.
Note: PPP = public-private partnership; AfDB= African Development Bank; MIGA= Multilateral Investment Guarantee Agency;
EIB= European Investment Bank; IFC=International Finance Corporation; IsDB= Islamic Development Bank; IFIs = international financing institutions.
Figure 7.2 presents the financial structure suitable to LNG schemes in the Maghreb and Mashreq
subregions. Similar to the case of pipeline projects, private sector equity is expected to come from the
participating private companies. The public sector equity would come in the form of government (or
national gas company) contributions that may in turn be borrowed from official lenders such as the World
Bank. The debt financing can be also mobilized from official and commercial lenders. The long-term debt
providers look for the proper structuring of the transaction, ownership, and operation of the various
segments of the pipelines and related facilities, with the ultimate aim of relatively risk-free and smooth
flow of the contracted volumes of gas and timely payments for them. They wish to ensure back-to-back
contracts (i) between the gas producer and liquefaction plant, (ii) between the LNG producer and shipping
company, (iii) between the LNG producer and the LNG buyer, and, in relevant cases, (d) between the
buyer of LNG and his major gas customers. They wish to have guarantees of the payment performance of
the buyer, by acceptable solvent parties and, if possible, sovereign guarantees backed by multilateral
international financial institutions (IFIs).
A partnership between the government and the private sector would facilitate the mitigation of many
risks. But separate risk-mitigation instruments should be used to cover the investment risks of the private
partner, the repayment of the commercial loans, and the LNG offtake agreement. These instruments can
be developed in a similar manner as those of the pipeline projects (previously described).
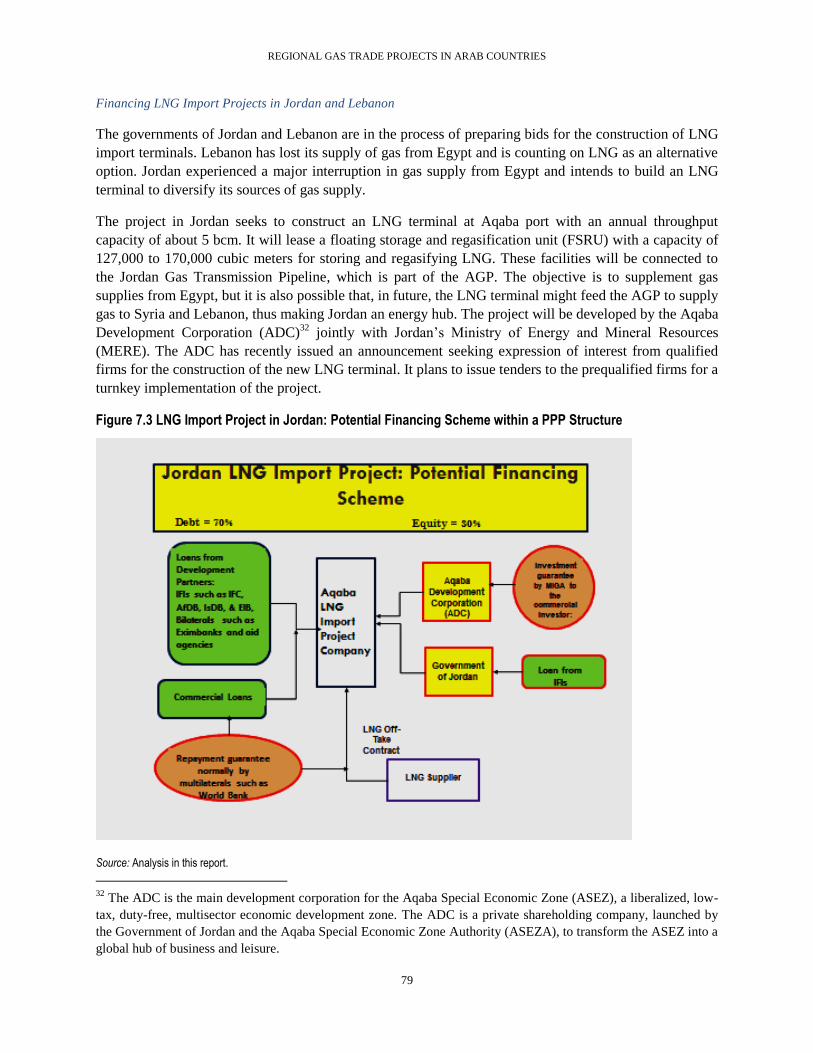
REGIONAL GAS TRADE PROJECTS IN ARAB COUNTRIES
79
Financing LNG Import Projects in Jordan and Lebanon
The governments of Jordan and Lebanon are in the process of preparing bids for the construction of LNG
import terminals. Lebanon has lost its supply of gas from Egypt and is counting on LNG as an alternative
option. Jordan experienced a major interruption in gas supply from Egypt and intends to build an LNG
terminal to diversify its sources of gas supply.
The project in Jordan seeks to construct an LNG terminal at Aqaba port with an annual throughput
capacity of about 5 bcm. It will lease a floating storage and regasification unit (FSRU) with a capacity of
127,000 to 170,000 cubic meters for storing and regasifying LNG. These facilities will be connected to
the Jordan Gas Transmission Pipeline, which is part of the AGP. The objective is to supplement gas
supplies from Egypt, but it is also possible that, in future, the LNG terminal might feed the AGP to supply
gas to Syria and Lebanon, thus making Jordan an energy hub. The project will be developed by the Aqaba
Development Corporation (ADC)32
jointly with Jordan’s Ministry of Energy and Mineral Resources
(MERE). The ADC has recently issued an announcement seeking expression of interest from qualified
firms for the construction of the new LNG terminal. It plans to issue tenders to the prequalified firms for a
turnkey implementation of the project.
Figure 7.3 LNG Import Project in Jordan: Potential Financing Scheme within a PPP Structure
Source: Analysis in this report.
32
The ADC is the main development corporation for the Aqaba Special Economic Zone (ASEZ), a liberalized, low-
tax, duty-free, multisector economic development zone. The ADC is a private shareholding company, launched by
the Government of Jordan and the Aqaba Special Economic Zone Authority (ASEZA), to transform the ASEZ into a
global hub of business and leisure.
REGIONAL GAS TRADE PROJECTS IN ARAB COUNTRIES
80
The envisioned scheme falls within a PPP structure; the ADC may partner with the Government of Jordan
to form a project company. The financing scheme for this project has not been confirmed, and ADC and
the government may consider various financial structures. Figure 7.3 shows a typical structure, in which
the project’s equity would be contributed by the ADC and the government. The debt would then then
mobilized from development partners and commercial banks.
Repayment of the loan to commercial banks can be guaranteed by multilateral institutions such as the
World Bank. The guarantee instrument can cover government obligations such as gas offtake and gas-
price commitments, which are very important items in LNG contracts.
The project in Lebanon involves the construction of an FSRU-type LNG import terminal located 1.7 km
off the coast, near Beddawi, with an annual capacity of 3.5 million tons of LNG (or 4.83 bcm of gas).
After regasification, gas would be conveyed by a 2.5-km-long pipeline to the gas terminal near the
Beddawi power plant. The government is separately pursuing the construction of a 173-km-long, 36-inch-
diameter coastal pipeline, partly on land and partly under the sea (called Gasyle 2) to convey the gas from
Beddawi to the other existing and proposed power stations on the coast. The construction of this line is
expected to start in 2013 and has a construction period of 28 months.
Based on the expressions of interest received in response to advertisements issued in early 2012, the
Ministry of Energy and Water (MoEW) prepared a short list of the qualified firms who will be invited to
submit bids for the project. Under this scheme the winning bidder will build, own, and operate (BOO) the
plant. It will be responsible for receiving, unloading, storing, and regasifying the LNG on a tolling basis
for delivery to the MoEW at the high-pressure outlet flange of the FSRU. The MoEW will be responsible
for procuring LNG supply to the terminal, and for delivery of the regasified output to the power plants. As
such, the MoEW would enter into a long-term terminal use agreement (TUA) with the project company,
committing the MoEW to pay a monthly capacity reservation fee regardless of actual usage plus a
monthly throughput fee for operating costs incurred for actual usage. The Government of Lebanon would
back the MoEW’s commitments.
The above arrangements fall into a PPP structure with an explicit separation of private and public sector
roles. The private company takes responsibility for the major investments while the public sector
(MoEW) focuses on LNG acquisition and gas supply to the power plants. This arrangement enables the
government to mitigate political and market risks while the project company manages the construction
and operational risks. There are various methods of financing such a project—figure 7.4 presents a typical
financing structure that could be considered. Under this financing structure the private sector’s investment
could be insured by an entity such as the MIGA, while a multilateral entity, for example, the World Bank,
might guarantee the obligations of the MoEW under the TUA.

REGIONAL GAS TRADE PROJECTS IN ARAB COUNTRIES
81
Figure 7.4 LNG Import Project in Lebanon: Potential Financing Scheme within a PPP Structure
Source: Analysis in this report.
Financing Gas Trade Projects in the GCC Countries
Financing gas trade projects in the GCC countries cannot be initiated prior to the clear commitment of the
corresponding countries. But financing can be mobilized faster after such commitments are in place. In
most GCC countries strategic projects (even domestic infrastructure) cannot materialize without
government leadership; deciding on such projects involves more political factors than economic.
Therefore cross-border projects will become exponentially more political due to the requirement for
political decisions by two or several governments. Nevertheless, when political decisions are made,
financing requirements quickly become available through budgetary sources or commercial lenders that
view the GCC countries to be credible borrowers. The case of the GCC regional electricity network
demonstrates (i) the very long time that it took to receive political commitment from the participating
governments, and (ii) the relative ease with which the project was financed through the budgetary
resources of the GCC governments. On the other hand, the case of the Dolphin gas project demonstrates
the complexity of reaching agreements among participating companies and the relatively easy process of
mobilizing finance from the private sector.
The GCC gas trade projects are of three distinct types: (i) projects whose assets are located in one
country, that is, the LNG-receiving terminals and gasification facilities; (ii) projects involving two
countries, for example, pipeline projects involving one exporting and one importing country; and (iii)

REGIONAL GAS TRADE PROJECTS IN ARAB COUNTRIES
82
projects involving several countries. The first type of project is more straightforward in its planning and
finance. This is basically the reason that the United Arab Emirates (UAE) and Kuwait have moved in this
direction, despite the fact that the cost of LNG is higher than what could be achieved through a pipeline
system.
This study demonstrates (see chapter 6) that pipeline projects in the GCC subregion could provide a very
attractive economic reward for both the exporting and importing countries. In particular, the study shows
that a joint pipeline exporting gas from Qatar to Bahrain, Kuwait, and Saudi Arabia represents the most
economical solution to covering the gas shortages of the importing countries. It is well noted that there are
significant political challenges in achieving a consensus among these countries regarding such a pipeline
system. Nevertheless, this project is worth considering due its economic efficiency and the fact that the
current political relationship and dialogue among the GCC countries could be considered in line with a
concrete cooperation in building a joint infrastructure project.
Although the GCC electricity project was built as a purely public corporation, the GCC gas pipeline
company would benefit from private sector participation through a PPP ownership structure. As
demonstrated in the case of the Dolphin project, a private sector entity can play an instrumental role in the
construction and operation of the pipeline system while meeting the technical requirements of each
participating country. Nevertheless, participation by the governments of the corresponding countries is
absolutely essential to facilitate risk management and numerous administrative requirements. The
participation of the governments of importing countries is also necessary to handle the substantial subsidy
and price gaps (figure 7.5).
Figure 7.5 Potential Financing Scheme for the Qatar-Bahrain-Kuwait-Saudi Pipeline System
Source: Analysis in this report.
In summary, financing gas trade projects in Arab countries is more challenging than domestic gas projects
because of the need for strong government support and a broader set of project risks. The PPP structure
incorporates the government role into project construction and management. The PPP structure also
enables the project company to draw upon financial resources that are available to both public and private
sectors. Finally, the PPP structure enables risk allocation to project participants in accordance to their
comparative advantage and ability to manage such risks.

Chapter 8. Legal, Regulatory, and Contractual Issues
Legal and Regulatory Framework
Development of the gas sector is highly capital intensive and calls for a great deal of complex technical
expertise. Most often these requirements necessitate the extensive participation of foreign and local
private sector investments, both in the upstream and downstream activities. Much of the activities involve
large up-front capital investments and useful economic operating lives with a steady stream of cash flows
for periods of 2030 years. Thus to attract and retain private sector interest and involvement, an
independent, transparent, fair, and stable regulatory environment is a pre-requisite.
In the upstream segment of businesses, all the producing countries have been reasonably successful in
establishing regulatory regimes that are suitable to oil exploration and development. Most countries are
now trying to modify and adapt the regulatory and fiscal regimes to the practices of the international gas
industry. The fiscal terms may need further improvements to incentivize the development of gas in
difficult reserves at great depths or in tight gas formations.
In most countries that import gas now or plan to import gas soon, gas imports are handled by state-owned
(oil/gas) entities and sold mainly to major consumers directly through their own transmission system and
spur lines. The exceptions are Algeria, Tunisia, and Egypt, where the gas sector is unbundled with
upstream exploration and production companies and downstream transmission and distribution
companies. In the first two countries, gas legislation and regulations are compatible with the European
Union (EU) directives, including defined third-party access rules for transmission and distribution
networks. They also have gas regulatory bodies carrying out economic and technical regulation. Egypt
has an unbundled sector structure, but no clear regulations on transmission access. It was reported in 2010
that the government would undertake sector reforms and appoint a gas sector regulator. Jordan has a
regulatory body for electricity and it is expected soon to handle gas regulation, too. Abu Dhabi and Oman
have electricity regulators and may soon have gas regulators as well. In most other countries the
regulatory functions are combined with sector policy functions and handled by the ministries of energy or
oil and gas.
In the absence of a fully developed sector structure and independent regulatory arrangements, the Arab
Gas Pipeline (AGP) was organized following the principle of “regulation by contract.” Under the
memorandum of understanding (MOU) signed by the relevant governments, an Arab gas organization
was set up in Beirut with the responsibility for coordinating the work carried out by the four countries’
gas companies and for controlling quality, setting tariffs, and conducting studies for the expansion of the
gas pipeline for increasing trade. Price provisions and settlement provisions and dispute resolution
provisions were incorporated in the contract. While the segment in each country was nominally regulated
by its respective ministries, the harmonization of standards, coordination, and all the needs of the safe and
reliable operation of the pipeline were embedded in the gas supply contracts (APRC 2011). Based on the
example of a segment in Jordan, the company Al Fajr was licensed by the Ministry of Energy and Mineral
Resources of Jordan to construct and operate the pipeline and also to handle the purchase of gas from
Egypt at prices agreed between Jordan and Egypt and supply gas to large consumers at prices determined
by the regulator. While the license for Al Fajr was for 30 years or more, it was given exclusivity for 18
REGIONAL GAS TRADE PROJECTS IN ARAB COUNTRIES
84
years, after which the company will unbundle its technical pipeline operations and sales functions and
third parties will have access to the line (Euro-Arab Mashreq Gas Co-operation Center 2007).
In most of the analysis and discussion of gas sector regulation and restructuring in the Arab world, the
case of Turkey is used as a benchmark and an appropriate model to follow. Turkey depends on gas
imports from several sources (piped gas from Russia, Iran, and Azerbaijan; and liquefied natural gas
[LNG] from Algeria and some other suppliers). It also expects to become a major gas hub for the supply
of gas to Europe. Turkey’s gas sector reform (including transparent regulatory oversight of the market) is
generally in line with the EU gas directives.
As trade matures and large consumers are allowed to import directly from exporter(s), there will be a need
to unbundle the transmission and import functions and provide for nondiscriminatory transmission access.
Such third-party access may be needed in respect to the AGP if it has to handle Iraqi and Libyan gas
going to the Mashreq countries, Turkey, and Europe. More broadly, the Pan-Arab Gas Pipeline System
(PAGPS) would operate meaningfully when third-party access is provided either on a regulated or
competitive basis.
While there is a need to establish unbundled gas transmission networks, the development of regional gas
trade could take place even under the present circumstances, provided there is a transparent system for
setting the transmission charges. Also, in the absence of suitable regulation, the terms and costs of gas
transmission services can be included in cross-border trade contracts.
Government Strategies for Gas Imports
Eleven out of the 16 Arab countries are candidates for gas imports. Of these, Saudi Arabia is an
exceptional case, since its government policy has so far favored neither imports nor exports of gas. Its
policy is aimed at self-sufficiency in gas; serious efforts have been made to augment domestic supplies,
stepping up exploration and development of even high-sulfur gas and gas occurring at great depths.
Nonetheless many observers seem to believe that Saudi Arabia will face shortages in the next few years
and may have to resort to gas imports as a component of its energy strategy. Continuing to burn high-
priced oil instead of gas for power generation appears no longer to be an acceptable option. Yemen may
also be regarded as an exception at this stage since its policies focus on augmenting domestic production
of gas, as well as creating a domestic market for gas anchoring in its nascent power sector. The remaining
nine countries follow an energy strategy involving gas imports to meet the rapidly rising demand for
power (as well as for other uses in some countries), since the only alternative, fuel oil (in most cases), is
becoming an excessively expensive option. Substitution of oil by gas for power generation is the key
central component of the energy strategy of these countries. The UAE and Oman, notable exporters of
LNG, have become importers of gas to meet their rising gas demand, and are planning to reduce exports
as their long-term contracts expire in the next several years unless they succeed in their efforts to step up
additional gas production from more difficult and more expensive fields. Many of the importing countries
have already constructed facilities for the import of LNG or are planning to do so in the very near future.
Overall the strategy for these countries seems to be to favor pipeline imports wherever possible and LNG
imports where necessary.
Even if all investment and operations are carried out by private investors, the governments of the
exporting, importing, and transit countries have a very important role to play in every regional gas trade
project. An intergovernmental agreement would best welcome and promise to cooperate to support the
project through its lifetime. Governments should agree not to enact any laws or regulations jeopardizing

REGIONAL GAS TRADE PROJECTS IN ARAB COUNTRIES
85
the investments or otherwise adversely affecting the functioning of the project. They should eliminate the
risk of expropriation (especially those without adequate and fair compensation for the project assets),
damages caused and foregone future earnings. They could become signatories of the Energy Charter
Treaty (ECT) and abide by its rules.33
Among other things the provisions of the treaty regarding transit of
gas could minimize the gas transit-related risks. They should facilitate the financial viability of the buying
institution by enabling the gas to be sold to customers at prices that recover the cost of supply fully and
enable the entities to observe the payment discipline for gas imports. To the extent that the relevant
governments are unable to do this in the short to medium term, they should ring-fence the gas import
costs by reimbursing the gas-importing entity for the difference between the import price and domestic
gas sales price. The governments involved need to maintain law and order to safeguard the pipeline and
other project facilities from attacks by insurgents or disgruntled citizens. The justice system and
regulatory system should fully protect property rights and enable the gas importer to recover from its
customers its dues fully and punctually, by authorizing and effectively supporting the denial of service to
those who do not pay for the service. Finally, governments should facilitate and not discourage in any
manner the gas-importing entity from abiding by the decisions of international arbitration.
Gas Pricing Framework for Regional Trade
Gas pricing is the most significant regulatory and contractual issue in structuring gas trade agreements in
the Arab world. As described in chapter 4, domestic gas prices are unrealistically low in most Arab
countries. The low, subsidized price is known to create serious inefficiencies in the supply and
consumption of natural gas. It creates substantial barriers to gas imports.
Aside from low domestic gas prices, the negotiations between the sellers and buyers of natural gas in the
Arab world have become quite complex. Until a decade ago, gas prices were negotiated in the range of
$1$2/million btu (mmbtu). This changed to a range of $5$10/mmbtu due to the change of perception
from one of abundant availability to that of scarcity of gas.
Negotiations of gas prices take account of the seller’s cost of supply as well as the purchaser’s benefit
from using the gas. Theoretically, the cost of supply of pipeline gas at the receiving end should be the
sum of the cost of gas at the wellhead, the cost of gas processing, and the cost of the gas transport by
pipeline to the destination.34
The economic cost of the gas at the wellhead is the long-run marginal cost of
production plus depletion premium (which is a function of the size of gas reserves, rate of depletion, and
the cost of the alternate source when the gas is fully depleted). This is usually considered the minimum
price, below which an exporter cannot be expected to sell.
But the imported gas is used at the destination to displace more expensive alternate fuels (such as fuel oil
and diesel for power generation, fuel oil for industrial boilers and for heat generation, fuel oil and
electricity for space heating, and so on). The value of gas calculated on the basis of the price of alternate
fuel(s) after adjusting for combustion efficiency, savings in capital and operating costs, and
environmental gains is referred to as the netback value of gas at the consumer end (often referred to as the
netback value at the burner tip). The price of gas at the wellhead calculated on the basis of deducting from
the above netback value, the costs of pipeline transportation, and gas processing is referred to as the
netback price of gas at the wellhead and represents the possible ceiling for the sale of gas. No buyer could
be expected to pay a higher price than this. The price agreed for the gas trade has to be somewhere
33
Many of the Arab countries have observer status in the Energy Charter Treaty. 34
The term “cost” here includes the cost of capital.
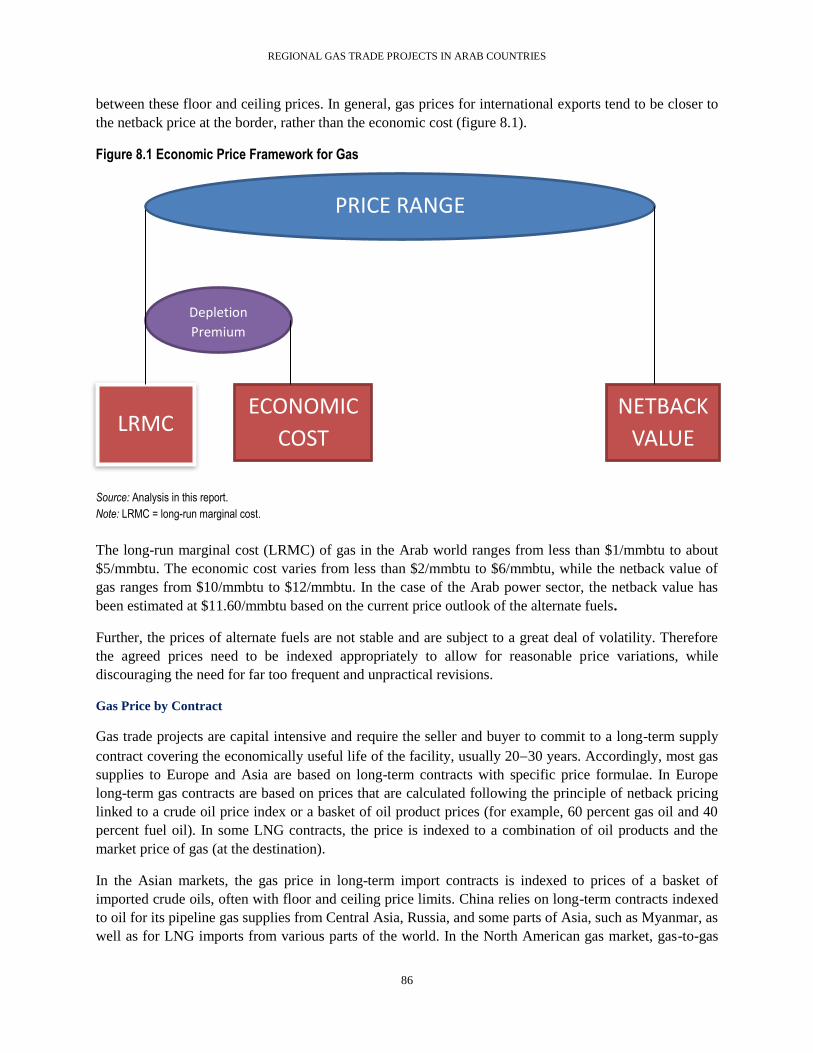
REGIONAL GAS TRADE PROJECTS IN ARAB COUNTRIES
86
between these floor and ceiling prices. In general, gas prices for international exports tend to be closer to
the netback price at the border, rather than the economic cost (figure 8.1).
Figure 8.1 Economic Price Framework for Gas
Source: Analysis in this report.
Note: LRMC = long-run marginal cost.
The long-run marginal cost (LRMC) of gas in the Arab world ranges from less than $1/mmbtu to about
$5/mmbtu. The economic cost varies from less than $2/mmbtu to $6/mmbtu, while the netback value of
gas ranges from $10/mmbtu to $12/mmbtu. In the case of the Arab power sector, the netback value has
been estimated at $11.60/mmbtu based on the current price outlook of the alternate fuels.
Further, the prices of alternate fuels are not stable and are subject to a great deal of volatility. Therefore
the agreed prices need to be indexed appropriately to allow for reasonable price variations, while
discouraging the need for far too frequent and unpractical revisions.
Gas Price by Contract
Gas trade projects are capital intensive and require the seller and buyer to commit to a long-term supply
contract covering the economically useful life of the facility, usually 2030 years. Accordingly, most gas
supplies to Europe and Asia are based on long-term contracts with specific price formulae. In Europe
long-term gas contracts are based on prices that are calculated following the principle of netback pricing
linked to a crude oil price index or a basket of oil product prices (for example, 60 percent gas oil and 40
percent fuel oil). In some LNG contracts, the price is indexed to a combination of oil products and the
market price of gas (at the destination).
In the Asian markets, the gas price in long-term import contracts is indexed to prices of a basket of
imported crude oils, often with floor and ceiling price limits. China relies on long-term contracts indexed
to oil for its pipeline gas supplies from Central Asia, Russia, and some parts of Asia, such as Myanmar, as
well as for LNG imports from various parts of the world. In the North American gas market, gas-to-gas
LRMC
ECONOMIC
COST
NETBACK
VALUE
PRICE RANGE
Depletion
Premium

REGIONAL GAS TRADE PROJECTS IN ARAB COUNTRIES
87
competition is prevalent and determines the spot market price of gas, which in turn affects the contract
prices.
While world gas trade is extensive, it is not yet a truly globalized market with global price convergence.
In North America and the United Kingdom the natural gas prices are influenced by extensive gas-to-gas
competition, and therefore the spot market prices (Henry Hub price in the United States and the National
Balancing Point price in the United Kingdom) tend to be lower compared with prices in other
Organisation for Economic Co-operation and Development (OECD) countries. In continental Europe,
where gas import contracts are mostly indexed to oil or oil-product prices, the market price of gas is often
higher than in the United States and United Kingdom. Finally, in Japan and other LNG-importing
countries of Asia, the gas price is the highest because of the indexation to oil and relatively longer
transport distances of LNG. The International Energy Agency (IEA) projections indicate that the gas price
differentials among North America, Europe, and Asia (Japan) will continue but the margins will narrow
over time (table 8.1).
Table 8.1 Prices in $/mmbtu (2009 dollars) at Wholesale Level without Taxes
Market / Year 2009 2015 2020 2025 2030 2035
North America 4.1 5.6 6.1 6.4 7.0 8.0
Europe 7.4 9.0 9.5 9.7 10.1 10.9
Japan 9.4 11.5 11.7 11.9 12.3 12.9
Source: IEA 2011.
For the import of gas into the Arab countries, the application of the above principles becomes somewhat
complex because of pricing distortions in the domestic energy markets, caused by extensive energy
subsidies (for electricity, gas, as well as oil products such as diesel and fuel oil) provided by the
governments based on a range of political and social considerations. Netback values calculated on the
basis of such highly distorted and subsidized financial prices of alternate fuels have no meaning in world
trade. Thus, in most Arab countries, netback values have to be calculated on the basis of economic values
of alternate fuels. Negotiated gas prices in the cross-border pipeline gas trade are often the result of the
political and strategic considerations of the negotiating governments. A move away from this tradition
toward price negotiations based on the principles discussed above is the key requirement for the rapid
growth of regional gas trade.
Terms of Gas Trade Contracts
Most pipeline gas and LNG import contracts are long-term contracts for 1520 years, with a clear
emphasis on the security of supply and financial flows as a prerequisite for securing funding for heavy
upfront capital investments. Medium-term contracts (57 years) for seasonal demands, and short-term
contracts (for unanticipated additional demands), are used in the LNG trade. Such medium- and short-
term trades are handled mostly by the aggregators. Spot shipments of LNG are also used for such
purposes.
Sellers
In most exporting Arab countries the sellers of gas are the various gas producers (usually joint ventures
among international developers and national oil or gas companies) or the national oil or gas companies.
For LNG, there are various kinds of sellers: (i) integrated companies that produce gas upstream and
REGIONAL GAS TRADE PROJECTS IN ARAB COUNTRIES
88
liquefy gas and sell—such as Ras Gas and Qatar Gas in Qatar— contracting with buyers; (ii) independent
LNG companies that buy gas from upstream producers, liquefy the gas, and contract with buyers for the
sale of LNG—such as in Oman, Yemen, and Nigeria; (iii) upstream gas producers, who get the gas
liquefied by a service company (through a tolling arrangement) and contract with buyers for the sale of
LNG, such as in Egypt and Indonesia; and (iv) a large number of aggregators—such as British Gas,
British Petroleum, GDF Suez, Total, Exxon Mobil, Shell, Total, and Stream—who contract with buyers
and arrange for substantial volumes of flexible LNG supply available in the short to medium term.
Buyers
The buyers in most importing Arab countries are likely to be the national oil or gas companies. Over a
period of time, when the gas sector matures and modernizes on fully commercialized lines, large
consumers such as power plants (independent power producers, IPPs), petrochemical industries, and
aluminum and steel plants may be allowed to directly contract for imports.
Contract Volume
Annual contract quantity can remain fixed over the contract years or can change according to an agreed-
upon schedule to cover gradually increasing demand during the build-up period or gradually declining
supply during the years closer to the full depletion of the reserves.
A substantial portion of the annual contract quantity (usually 8590 percent) is covered by take-or-pay
arrangements. Annual supplies are delivered in monthly batches of shipments. Until a few years ago
contracts had destination clauses that prohibited the buyer from diverting the shipments to other countries,
but in recent years, in the context of a gas glut, there is a more relaxed approach to this issue. The buyer
takes the volume risk up to the quantity covered by the take-or-pay clause. The seller takes the price risk.
Upward tolerances are allowed up to 1015 percent of the annual contract quantity.
Take-or-pay provisions are applied to monthly shipments, and often contracts provide that the buyer can
recover shipments that are thus “paid but not taken” during subsequent years, usually within a five-year
period.
Gas quality is specified in terms of calorific value, as well in terms of the composition of gas (methane,
butane, pentane, nitrogen, hydrogen sulfide, and sulfur in any other form).
The contract price clearly spells out the indexation formula and mechanism, allowing for quarterly
adjustments according to the agreed indexes, and provides for a price review at periodic intervals, usually
three or five years. Increasingly, contract prices are at the receiving end (cost, insurance, and freight) of
transportation and insurance costs. For LNG, shipping is increasingly organized and paid for by the seller.
Many sellers such as Qatar have their own fleet of LNG tankers. Recent increases in the shipping capacity
have facilitated the growth of spot LNG sales and short-term contracts. Free on board (FOB) contracts
and delivered ex-ship (DES) contracts are also common in the LNG trade.
In respect to the pipeline gas supply contracts, depending on the structure of ownership of the pipeline
segments, prices are stipulated at the origin and destination, with clear disaggregation of gas and
transportation costs. Depending on the structure of the pipeline gas trade, separate gas supply contracts
and gas transportation contracts may have to be adopted.

REGIONAL GAS TRADE PROJECTS IN ARAB COUNTRIES
89
If transit countries are involved, separate transportation contracts for each of the transit segments may
have to be made. In such cases transportation charges to the transit country may have to be made in cash
or in the form of gas at the choice of the transit country.
Transportation charges can be single-bundled tariffs ($1,000/cubic meter/100 km) or two-part unbundled
tariffs with a capacity charge ($/month) and actual gas transport charge ($1,000/cubic meter/100 km). In
addition there will be separate charges for gas storage services, if provided. These tariffs are usually
determined following the “cost plus” principle. In more complex gas networks, such as in the European
Union, where competition objectives are pursued, capacity charges are based on auctions carried out to
manage congestion in the network.
Besides the above, gas supply contracts specify metering/measurement protocols, quantity upward or
downward tolerance for the buyer and seller, payment procedures and mechanisms (such as letter of
credit, force majeure clauses (including accidents and breakdowns in the liquefaction and regasification
plants), and dispute resolution mechanisms (such as resolution by a neutral expert and international
arbitration such as those under the UNCITRAL rules). They also specify the governing law, usually an
English law (because of extensive maritime jurisprudence).
The key to a successful long-term contract is the fair allocation of risks among the parties, and the
willingness and ability of all parties to abide by the terms of the contract (Melling 2010).

REGIONAL GAS TRADE PROJECTS IN ARAB COUNTRIES
90
References
This reference list includes works cited in volumes 1 and 2.
APRC (Arab Petroleum Research Center). 2011. Natural Gas Survey, Middle East and North Africa
2011. Paris: APRC.
Arab Forum for Environment and Development. 2011. Arab Environment.4—Green Economy:
Sustainable Transition in a Changing Arab World. Report of the Arab Forum for Environment
and Development, Beirut.
BP (British Petroleum). 2010. BP Statistical Review of World Energy. London. June.
———. 2011a. BP Energy Outlook 2030. London. January.
———. 2011b. BP Statistical Review of World Energy. London. June.
———. 2012. BP Statistical Review of World Energy. London.
Breeze, Paul. 2010. “UAE Seeks Broader Fuel Mix.”
http://www.powerengineeringint.com/articles/mee/print/volume-7/issue-4/features/uae-seeks-
broader-fuel-mix.html.
CEE (Center for Energy Economics). 2007. “An Introduction to LNG.”
http://www.beg.utexas.edu/energyecon/lng/default.php.
CIA (Central Intelligence Agency). “CIA Fact Book.” https://www.cia.gov/library/publications/the-
world-factbook/.
Clerici, Alessandro, and Andrea Longhi. 2008. “Competitive Transmission Systems as Alternative to
Pipeline Gas Transport For Electricity Delivery.” World Energy Council.
http://www.worldenergy.org/wec-geis/publications/default/tech_papers/17th_congress/2_2_08.
Credit Suisse Security (Europe) Limited. 2011. Global Gas. Global Equity Research. November 22.
https://doc.research-and-
analytics.csfb.com/docView?language=ENG&source=ulg&format=PDF&document_id=9302412
91&serialid=FLoXy50ozejW9omrsXigbICBBqVvtGuZZgRHfhyBOwY%3D
Cornot-Gandolphe, Sylvie, Olivier Appert, Ralf Dickel, Marie-Françoise Chabrelie, and Alexandre Rojey.
2003. “The Challenges of Further Cost Reductions for New Supply Options (Pipeline, LNG,
GTL).”
Presented at the World Gas Conference 22, Tokyo, Japan, June 15.
http://www.cedigaz.org/Fichiers/pdf_papers/challenge%20of%20further.pdf.
Dargin, Justin. 2009. “Prospects for Energy Integration in the GCC.” Presentation at Research Seminar-
Dubai School of Government, March 3, 2009. http://www.dsg.ae/Portals/0/DSG-Seminar-2009-
Dargin1.pdf.
Economic Consulting Associates. 2005. “Study of Electricity Trade Potential in the Black Sea Region.”
Study carried out for the World Bank. London. October.
REGIONAL GAS TRADE PROJECTS IN ARAB COUNTRIES
91
EEHC (Egyptian Electricity Holding Company). Annual Report of EEHC for FY 2009–10.
http://www.egelec.com/.
EIA (U.S. Energy Information Agency). 2011. World Shale Gas Resources: An Initial Assessment of 14
Regions outside the United States. U.S. Department of Energy, Washington, DC.
———. Various dates. “Country Analysis Briefs.” U.S. Department of Energy, Washington, DC.
http://www.eia.gov.
Euro-Arab Mashreq Gas Cooperation Center. 2007. Euro-Arab Mashreq Gas Market Project—
Legislative and Regulatory Survey.
Fattouh, Bassam, and Jonathan Stern (eds.). 2011. Natural Gas Markets in the Middle East and North
Africa. Oxford: Oxford Institute for Energy Studies/Oxford University Press.
GECOL (General Electricity Company of Libya). 2009. “The Libyan Electric Power Sector.” GECOL
presentation, Tripoli, February 2009.
http://www.auptde.org/newsite/UploadFiles/Activitypaperfile/367.ppt.
Hakim, Mohamed. “Nuclear Power Plant Feasibility Study Human Resource Development.” A
presentation at Abu Dhabi, March 2010. http://www.iaea.org.
Hamso, Bjorn, Afsaneh Mashayekhi, and Hossein Razavi. 1994. “International Gas Trade, Potential
Major Projects.” Annual Review of Energy and Environment 19: 3773.
IEA (International Energy Agency). 2010a. Medium-Term Oil and Gas Markets. Paris.
———. 2010b. World Energy Outlook. Paris.
———. 2011. Are We Entering a Golden Age of Gas? Special Report, Paris, June.
———. 2012. Iraq Energy Outlook. World Energy Outlook Special Report. Paris. October 9.
Kupisz, Richard. 2009. “Strategic Issues and Options for the Arab Mashreq Gas Market, Round Table on
Energy Tariffs and Investment.” Presentation by Team Leader at the Euro-Arab Mashreq Gas
Cooperation Center, February 11, 2009.
Melling, Anthony J. 2010. Natural Gas Pricing and Its Future: Europe as the Battleground. Washington,
DC: Carnegie Endowment for International Peace.
MERE (Ministry of Energy and Mineral Resources) (Jordan). 2009. Annual Report 2009. Amman:
MERE.
Mott MacDonald. 2010. Supplying the EU Natural Gas Market—Final Report. Croydon, England.
http://ec.europa.eu/energy/international/studies/doc/2010_11_supplying_eu_gas_market.pdf.
Nomura Research Group. February 2009. Report on Middle East Energy and Power. London.
http://www.nomura.com.
Oil and Gas Directory Middle East. 2011. “Research Profile Libya.”
http://www.oilandgasdirectory.com/research/libya.pdf.
REGIONAL GAS TRADE PROJECTS IN ARAB COUNTRIES
92
Razavi, Hossein. 2009. “Natural Gas Pricing in Countries of MENA.” The Energy Journal 30 (3).
Sleiman, Zahar. 2012. “Lebanese Current and Future Gas Markets.” Presentation to Lebanon International
Petroleum Exploration Forum and Exhibition, July 3–4. http://www.lebanon-
exploration.com/DownLoads/LIPE_2012/Presentations/MEW-F-Lebanese_Gas_Market.pdf.
Stern, Jonathan. 2006. “Natural Gas in Europe—The Importance of Russia.”
http://www.centrex.at/en/files/study_stern_e.pdf.
The Oil Drum. 2011. “Egypt’s Natural Gas Trends and Potential Impacts.”
http://www.theoildrum.com/node/7477.
Wood Mackenzie Ltd. 2011. “Upstream Insights—Iraq’s Gas Export Options.” London, October.
World Bank. 2007. “Republic of Yemen, A Natural Gas Incentive Framework.” Formal Report 327/07,
Washington, DC, June.
———. 2008. “Republic of Lebanon: Electricity Sector Public Expenditure Review.” World Bank Report
41421-LB, Washington, DC, January 31.
———. 2009a. “Syria Electricity Strategy Note.” World Bank, Washington, DC.
———. 2009b. Exploring the Potential for Interconnection and Electricity Trade among Yemen and the
GCC Countries. Washington, DC: World Bank.
———. 2010a. “Electricity Trade Study for the Kingdom of Saudi Arabia.” World Bank, Washington,
DC.
———. 2010b. “Project Appraisal Document, Giza North Power Project.” World Bank, Washington, DC.
———. 2010c. “Potential of Energy Integration in Mashreq and Neighboring Countries.” Report 54455-
MNA. Washington, DC. June.
Regional Gas Trade Projects
in Arab Countries
Volume 2 Annex
Gas Sector Profiles of Arab Countries

iii
Contents
Algeria 1
Reserves 1
Production 1
Consumption 2
Power Sector 2
Prices 2
Exports 3
Export Facilities 3
Outlook 4
Bahrain 7
Reserves 7
Production 8
Consumption 8
Power Sector 8
Overall Outlook 9
Prices 10
Arab Republic of Egypt 11
Reserves 11
Production 11
Consumption 12
Role of the Power Sector in Consumption 13
Supply Demand Forecasts 14
Exports 15
Iraq 20
Reserves 20
Production and Consumption 21
Power Sector Outlook and Gas Demand for Power Sector 21
Gas Export Possibilities 23
Effect on Exports of Reducing Gas Flaring 24
Prices 26
Jordan 27
Resources 27
Gas Imports 28
Power Sector 30
LNG Import Terminal 31
Prices 32

iv
Gas Demand Forecasts 33
Kuwait 34
Reserves 34
Production 35
Consumption 35
Power Sector 36
Prices 37
LNG Imports 37
Outlook 37
Lebanon 39
Gas Reserves 39
Gas Imports 39
Electricity Sector 41
Gas Demand Forecasts 42
Libya 44
Reserves 44
Production 44
Consumption 45
More on Existing Export Facilities 46
Demand-Supply Balance and Export Potential 47
Electricity Sector 48
Gas pricing 50
Scope for New Pipelines and Exports 50
Morocco 51
Reserves 51
Production and Consumption 51
Power Sector 52
Transit Country Experience and Future Outlook 53
Oman 55
Reserves 55
Production 56
Exports 57
Imports 58
Consumption 58
Power Sector 58
Prices of Gas/Electricity 59
Outlook 60
Qatar 61
Reserves 61
v
Production 61
Consumption 63
Exports 63
Moratorium 63
LNG Production and Exports 64
Exports through the Dolphin Pipeline 64
Forecasts 65
Power Sector 66
Supply Demand Balance by 2020 67
Saudi Arabia 68
Resources 68
Production 69
Consumption 70
Power Sector 70
Expected Deficits and Import Options 72
Prices 73
Syrian Arab Republic 74
Reserves 74
Production 75
Consumption 75
Gas Imports 75
Gas Exports 76
Power Sector 76
Prices 77
Outlook 77
Tunisia 78
Reserves 79
Production 79
Consumption 79
Power Sector 80
Gas Demand Forecast 81
Tunisia as a Transit Country 81
Libya-Tunisia Pipeline 81
Gas Prices 82
United Arab Emirates (UAE) 83
Reserves 83
Production 84
Outlook for Increased Production 85
Consumption 85
Power Sector 85

vi
Prices 87
LNG Exports 87
Imports 87
Republic of Yemen 89
Reserves and Production 89
LNG Export 90
Domestic Consumption 91
Power Sector 91
Prices 92
Outlook 92
References 93

Algeria
With an area of 2.4 million square kilometers (km2) and a population of 36.2 million (2011), Algeria is an
upper-middle-income country with a per capita gross national income (GNI) of $4,450 (2010).
Reserves
Proven Algerian gas reserves at the end of 2010 were reported by British Petroleum (BP) at 4.5 trillion
cubic meters (tcm) with a reserves-to-production ratio (RPR) of 56 years (BP 2011b). This is the fifth-
largest reserve among the Middle East and North Africa (MENA) countries. The Arab Petroleum
Research Center’s natural gas survey (APRC 2011), meanwhile, reports a proven reserve of 4.6 tcm as of
January 2011. Additional gas resources yet to be discovered are estimated by the U.S. Geological Survey
at around 1.0 tcm. Much of this is believed to be tight gas with a high percentage of carbon dioxide
(CO2). The Algerian minister of energy and mines, Mr. Youcef Yousfi, stated in a presentation in Houston
in March 2011 that geologists estimate the shale gas reserves of Algeria at 25,000 trillion cubic feet (tcf),
or 708 tcm, though these estimates are preliminary. ENI of Italy is cooperating with Algeria in looking for
unconventional gas (especially shale gas) in Algeria (APRC 2011). But the U.S. Energy Information
Agency’s (EIA’s) World Shale Gas Resources: An Initial Assessment of 14 Regions outside the United
States 2011 estimates the technically recoverable reserves of shale gas at 231 tcf, or 6.54 tcm only.
Production
Production and domestic consumption of gas over the decade 2000–10 were reported by BP (2011b) as
shown in the table A1.1.
Table A1.1 Algeria’s Natural Gas Production, Consumption, and Exports: 2000–10 (bcm)
Item 2000 2001 2002 2003 2004 2005 2006 2007 2008 2009 2010
Production 84.4 78.2 80.4 82.8 82.0 88.2 84.5 84.8 85.8 79.6 80.4
Consumption 19.8 20.5 20.2 21.4 22.0 23.2 23.7 24.3 25.4 27.2 28.9
Exports 56.97 57.86 59.85 59.64 64.27 61.60 58.30 58.83 52.67 55.28
Source: BP 2011b.
Note: Production and consumption data are from BP, and exports data are from CEDIGAZ quoted in APRC (2011).
Production here is net of gas volumes flared, vented, or reinjected for enhanced oil recovery (EOR), gas
liquids recovery, and to maintain reservoir pressure. While annual production has hovered in the range of
8088 bcm, consumption has registered a secular growth of 3.85 percent per year. The Organization of
Petroleum Exporting Countries (OPEC) Annual Statistics for 201011 reports a gross production of 192.2
billion cubic meters (bcm) and a marketed production of 83.9 bcm. Volume flared amounted to 5 bcm,
reinjected to 89.1 bcm, and shrinkage to 13.52 bcm. Chapter 1 of Natural Gas Markets in the Middle East
and North Africa (Fattouh and Stern, 2011) speaks of the reinjection volume being nearly 50 percent of
the gross production, probably based on this.
Production is expected to be around 87 bcm until 2011–12. During 2014–18 there will be significant
additions to production, at the rate of 8 percent per year; thereafter production is expected to decline
slightly and reach a plateau of 115–20 bcm until the early 2020s, and decline further later (chapter 1,
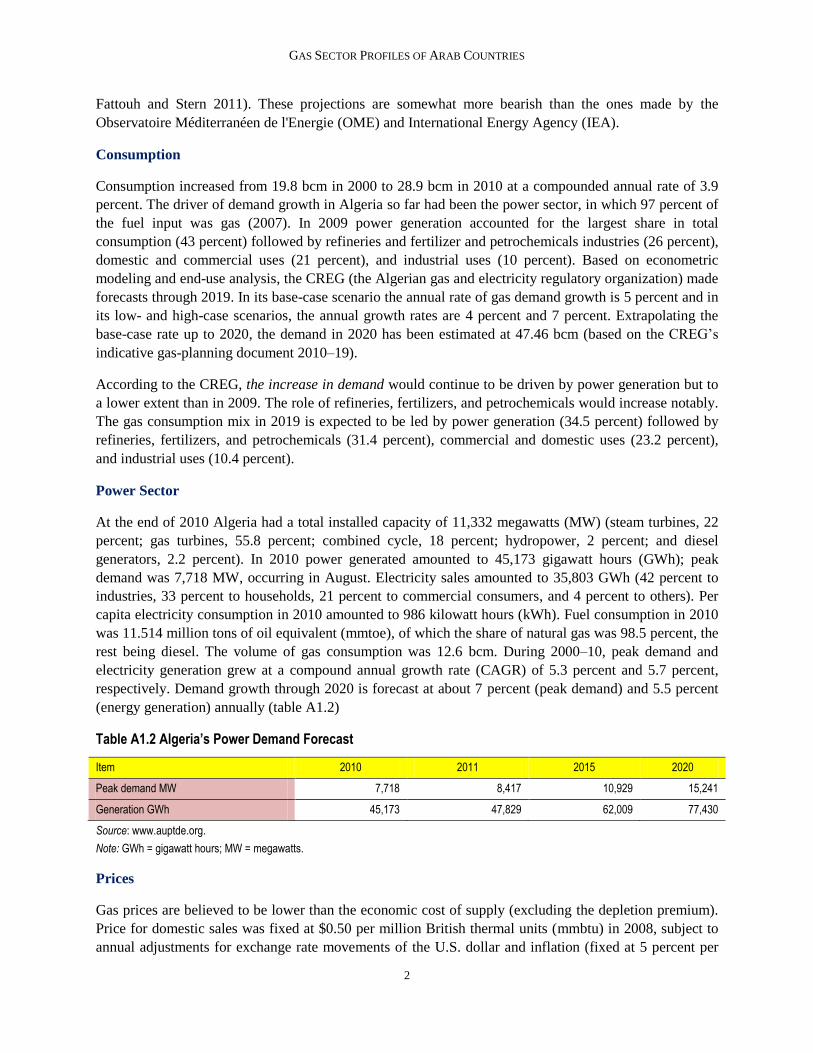
GAS SECTOR PROFILES OF ARAB COUNTRIES
2
Fattouh and Stern 2011). These projections are somewhat more bearish than the ones made by the
Observatoire Méditerranéen de l'Energie (OME) and International Energy Agency (IEA).
Consumption
Consumption increased from 19.8 bcm in 2000 to 28.9 bcm in 2010 at a compounded annual rate of 3.9
percent. The driver of demand growth in Algeria so far had been the power sector, in which 97 percent of
the fuel input was gas (2007). In 2009 power generation accounted for the largest share in total
consumption (43 percent) followed by refineries and fertilizer and petrochemicals industries (26 percent),
domestic and commercial uses (21 percent), and industrial uses (10 percent). Based on econometric
modeling and end-use analysis, the CREG (the Algerian gas and electricity regulatory organization) made
forecasts through 2019. In its base-case scenario the annual rate of gas demand growth is 5 percent and in
its low- and high-case scenarios, the annual growth rates are 4 percent and 7 percent. Extrapolating the
base-case rate up to 2020, the demand in 2020 has been estimated at 47.46 bcm (based on the CREG’s
indicative gas-planning document 2010–19).
According to the CREG, the increase in demand would continue to be driven by power generation but to
a lower extent than in 2009. The role of refineries, fertilizers, and petrochemicals would increase notably.
The gas consumption mix in 2019 is expected to be led by power generation (34.5 percent) followed by
refineries, fertilizers, and petrochemicals (31.4 percent), commercial and domestic uses (23.2 percent),
and industrial uses (10.4 percent).
Power Sector
At the end of 2010 Algeria had a total installed capacity of 11,332 megawatts (MW) (steam turbines, 22
percent; gas turbines, 55.8 percent; combined cycle, 18 percent; hydropower, 2 percent; and diesel
generators, 2.2 percent). In 2010 power generated amounted to 45,173 gigawatt hours (GWh); peak
demand was 7,718 MW, occurring in August. Electricity sales amounted to 35,803 GWh (42 percent to
industries, 33 percent to households, 21 percent to commercial consumers, and 4 percent to others). Per
capita electricity consumption in 2010 amounted to 986 kilowatt hours (kWh). Fuel consumption in 2010
was 11.514 million tons of oil equivalent (mmtoe), of which the share of natural gas was 98.5 percent, the
rest being diesel. The volume of gas consumption was 12.6 bcm. During 2000–10, peak demand and
electricity generation grew at a compound annual growth rate (CAGR) of 5.3 percent and 5.7 percent,
respectively. Demand growth through 2020 is forecast at about 7 percent (peak demand) and 5.5 percent
(energy generation) annually (table A1.2)
Table A1.2 Algeria’s Power Demand Forecast
Item 2010 2011 2015 2020
Peak demand MW 7,718 8,417 10,929 15,241
Generation GWh 45,173 47,829 62,009 77,430
Source: www.auptde.org.
Note: GWh = gigawatt hours; MW = megawatts.
Prices
Gas prices are believed to be lower than the economic cost of supply (excluding the depletion premium).
Price for domestic sales was fixed at $0.50 per million British thermal units (mmbtu) in 2008, subject to
annual adjustments for exchange rate movements of the U.S. dollar and inflation (fixed at 5 percent per
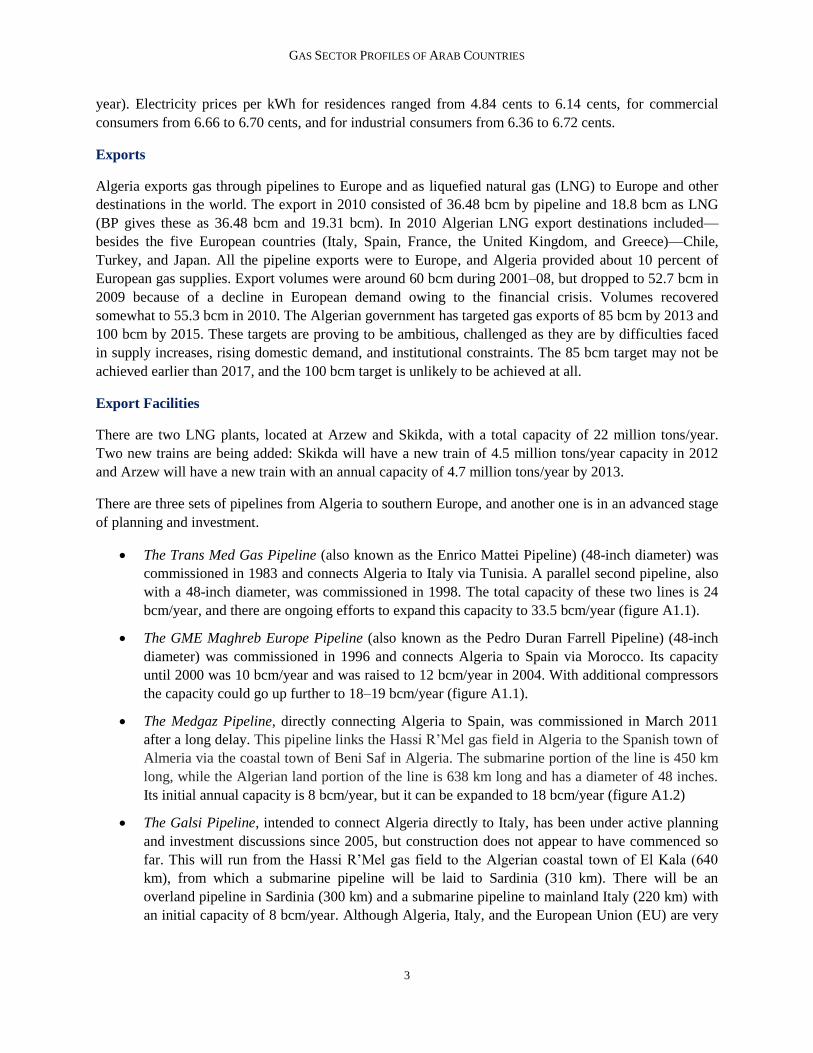
GAS SECTOR PROFILES OF ARAB COUNTRIES
3
year). Electricity prices per kWh for residences ranged from 4.84 cents to 6.14 cents, for commercial
consumers from 6.66 to 6.70 cents, and for industrial consumers from 6.36 to 6.72 cents.
Exports
Algeria exports gas through pipelines to Europe and as liquefied natural gas (LNG) to Europe and other
destinations in the world. The export in 2010 consisted of 36.48 bcm by pipeline and 18.8 bcm as LNG
(BP gives these as 36.48 bcm and 19.31 bcm). In 2010 Algerian LNG export destinations included—
besides the five European countries (Italy, Spain, France, the United Kingdom, and Greece)—Chile,
Turkey, and Japan. All the pipeline exports were to Europe, and Algeria provided about 10 percent of
European gas supplies. Export volumes were around 60 bcm during 2001–08, but dropped to 52.7 bcm in
2009 because of a decline in European demand owing to the financial crisis. Volumes recovered
somewhat to 55.3 bcm in 2010. The Algerian government has targeted gas exports of 85 bcm by 2013 and
100 bcm by 2015. These targets are proving to be ambitious, challenged as they are by difficulties faced
in supply increases, rising domestic demand, and institutional constraints. The 85 bcm target may not be
achieved earlier than 2017, and the 100 bcm target is unlikely to be achieved at all.
Export Facilities
There are two LNG plants, located at Arzew and Skikda, with a total capacity of 22 million tons/year.
Two new trains are being added: Skikda will have a new train of 4.5 million tons/year capacity in 2012
and Arzew will have a new train with an annual capacity of 4.7 million tons/year by 2013.
There are three sets of pipelines from Algeria to southern Europe, and another one is in an advanced stage
of planning and investment.
The Trans Med Gas Pipeline (also known as the Enrico Mattei Pipeline) (48-inch diameter) was
commissioned in 1983 and connects Algeria to Italy via Tunisia. A parallel second pipeline, also
with a 48-inch diameter, was commissioned in 1998. The total capacity of these two lines is 24
bcm/year, and there are ongoing efforts to expand this capacity to 33.5 bcm/year (figure A1.1).
The GME Maghreb Europe Pipeline (also known as the Pedro Duran Farrell Pipeline) (48-inch
diameter) was commissioned in 1996 and connects Algeria to Spain via Morocco. Its capacity
until 2000 was 10 bcm/year and was raised to 12 bcm/year in 2004. With additional compressors
the capacity could go up further to 18–19 bcm/year (figure A1.1).
The Medgaz Pipeline, directly connecting Algeria to Spain, was commissioned in March 2011
after a long delay. This pipeline links the Hassi R’Mel gas field in Algeria to the Spanish town of
Almeria via the coastal town of Beni Saf in Algeria. The submarine portion of the line is 450 km
long, while the Algerian land portion of the line is 638 km long and has a diameter of 48 inches.
Its initial annual capacity is 8 bcm/year, but it can be expanded to 18 bcm/year (figure A1.2)
The Galsi Pipeline, intended to connect Algeria directly to Italy, has been under active planning
and investment discussions since 2005, but construction does not appear to have commenced so
far. This will run from the Hassi R’Mel gas field to the Algerian coastal town of El Kala (640
km), from which a submarine pipeline will be laid to Sardinia (310 km). There will be an
overland pipeline in Sardinia (300 km) and a submarine pipeline to mainland Italy (220 km) with
an initial capacity of 8 bcm/year. Although Algeria, Italy, and the European Union (EU) are very

GAS SECTOR PROFILES OF ARAB COUNTRIES
4
keen to have this line commissioned as soon as possible, Italy has not yet provided formal
approvals (figure A1.3).
Figure A1.1 Transmed and Maghreb-Europe Gas Pipelines
Source: Jonathan Stern, Natural Gas in Europe- The Importance of Russia http://www.centrex.at/en/files/study_stern_e.pdf. .
Outlook
Algeria is deeply committed to retaining and expanding its export market in Europe, where it is building
forward linkages in the value chain of gas. Thus in the United Kingdom it has set up a joint venture to
import LNG with capacity rights in the Isle of Grain LNG regasification terminal. It operates in the U.K.
gas market through its subsidiary. Similar arrangements in France, Italy, and Spain have been made. In
addition, Algeria is trading in the European spot markets and is increasing the share of spot supplies in its
exports. It is investing in European power plants importing gas (for example, in Portugal).

GAS SECTOR PROFILES OF ARAB COUNTRIES
5
Figure A1.2 Medgaz Pipeline Figure A1.3 Galsi Pipeline
Source: APRC 2011. Source: APRC 2011.
Projections made by Mott MacDonald in the report Supplying the EU Natural Gas Market—Final Report
(November 2010) for exportable surplus from Algeria to Europe are reproduced in table A1.3.
Table A1.3 Export Surplus Projections for Algeria through 2030
Item Scenario 2010 2015 2020 2025 2030
Gas supply bcm/year
High case 85.8 100.0 115.0 125.0 135.0
Base case 85.8 95.0 105.0 115.0 125.0
Low case 85.8 85.0 85.0 85.0 85.0
Gas demand bcm/year
High case 25.2 35.0 45.0 55.0 65.0
Base case 25.2 32.2 39.2 45.4 52.7
Low case 25.2 30.0 35.0 40.0 45.0
Gas export surplus bcm/year
High case 60.6 70.0 75.0 85.0 90.0
Base case 60.6 62.8 65.8 69.6 72.3
Low case 60.6 50.0 40.0 30.0 20.0
Source: Mott MacDonald 2010.
Note: bcm = billion cubic meters.
While much of its export surplus would go to Europe, Algeria could possibly supply some small
quantities to Morocco and Tunisia, if they are willing to pay commercial prices. Recent reports indicate
that for the first time Morocco and Algeria signed a commercial contract (on July 31, 2011), for the
supply of 640 million cubic meters of gas per year over 10 years, to two power plants in Morocco (the
470 MW Ain Beni Mathar Plant near the Algerian border and the 385 MW Tahaddart power plant near

GAS SECTOR PROFILES OF ARAB COUNTRIES
6
Tangier) through the Pedro Duran Farrell Pipeline, making use of the spur lines. This report was widely
celebrated by both Moroccans and Algerians.1
1 See news item at http://www.gasandoil.com/news/africa/19ef57db4500afb744163cbce5dfbc77 and also at
http://magharebia.com/cocoon/awi/xhtml1/en_GB/features/awi/features/2011/08/04/feature-03.
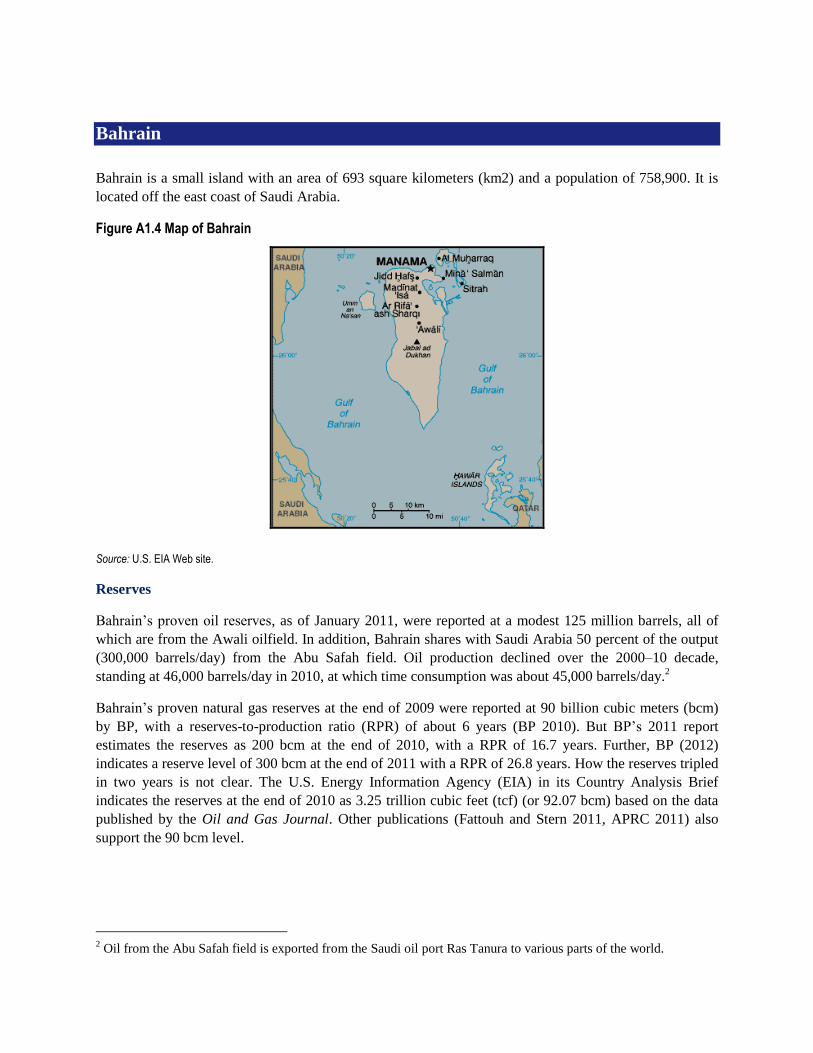
Bahrain
Bahrain is a small island with an area of 693 square kilometers (km2) and a population of 758,900. It is
located off the east coast of Saudi Arabia.
Figure A1.4 Map of Bahrain
Source: U.S. EIA Web site.
Reserves
Bahrain’s proven oil reserves, as of January 2011, were reported at a modest 125 million barrels, all of
which are from the Awali oilfield. In addition, Bahrain shares with Saudi Arabia 50 percent of the output
(300,000 barrels/day) from the Abu Safah field. Oil production declined over the 2000–10 decade,
standing at 46,000 barrels/day in 2010, at which time consumption was about 45,000 barrels/day.2
Bahrain’s proven natural gas reserves at the end of 2009 were reported at 90 billion cubic meters (bcm)
by BP, with a reserves-to-production ratio (RPR) of about 6 years (BP 2010). But BP’s 2011 report
estimates the reserves as 200 bcm at the end of 2010, with a RPR of 16.7 years. Further, BP (2012)
indicates a reserve level of 300 bcm at the end of 2011 with a RPR of 26.8 years. How the reserves tripled
in two years is not clear. The U.S. Energy Information Agency (EIA) in its Country Analysis Brief
indicates the reserves at the end of 2010 as 3.25 trillion cubic feet (tcf) (or 92.07 bcm) based on the data
published by the Oil and Gas Journal. Other publications (Fattouh and Stern 2011, APRC 2011) also
support the 90 bcm level.
2 Oil from the Abu Safah field is exported from the Saudi oil port Ras Tanura to various parts of the world.
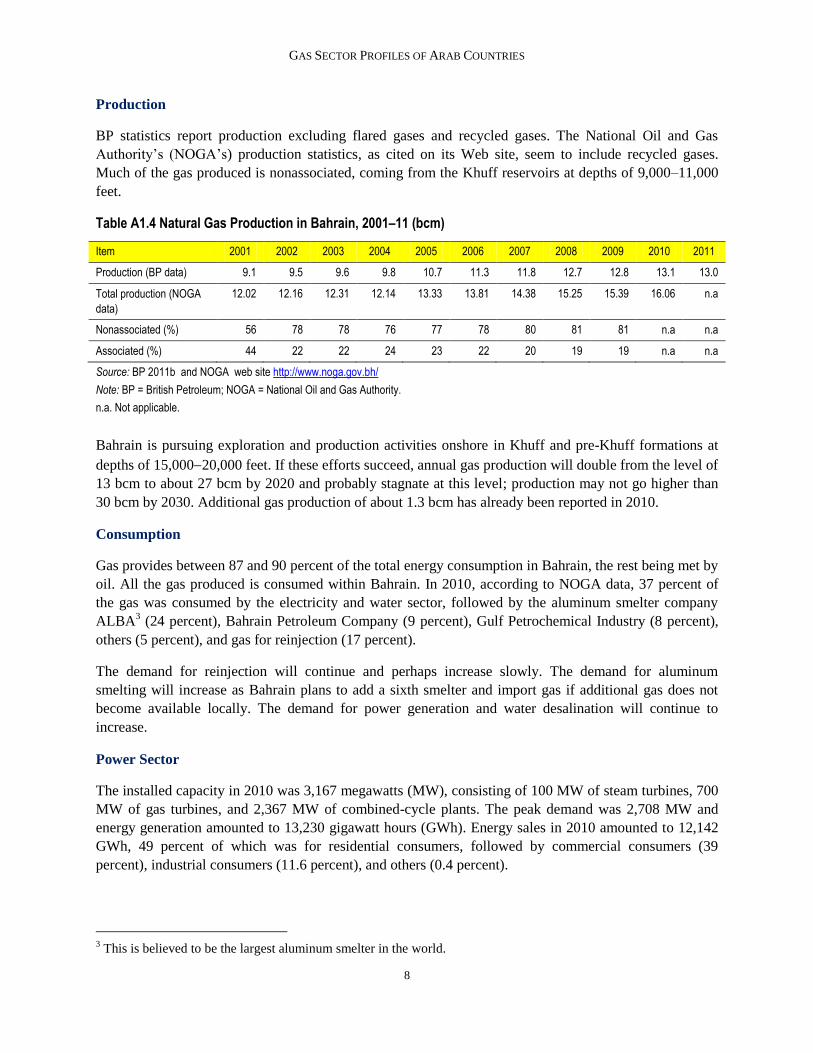
GAS SECTOR PROFILES OF ARAB COUNTRIES
8
Production
BP statistics report production excluding flared gases and recycled gases. The National Oil and Gas
Authority’s (NOGA’s) production statistics, as cited on its Web site, seem to include recycled gases.
Much of the gas produced is nonassociated, coming from the Khuff reservoirs at depths of 9,000–11,000
feet.
Table A1.4 Natural Gas Production in Bahrain, 2001–11 (bcm)
Item 2001 2002 2003 2004 2005 2006 2007 2008 2009 2010 2011
Production (BP data) 9.1 9.5 9.6 9.8 10.7 11.3 11.8 12.7 12.8 13.1 13.0
Total production (NOGA
data)
12.02 12.16 12.31 12.14 13.33 13.81 14.38 15.25 15.39 16.06 n.a
Nonassociated (%) 56 78 78 76 77 78 80 81 81 n.a n.a
Associated (%) 44 22 22 24 23 22 20 19 19 n.a n.a
Source: BP 2011b and NOGA web site http://www.noga.gov.bh/
Note: BP = British Petroleum; NOGA = National Oil and Gas Authority.
n.a. Not applicable.
Bahrain is pursuing exploration and production activities onshore in Khuff and pre-Khuff formations at
depths of 15,00020,000 feet. If these efforts succeed, annual gas production will double from the level of
13 bcm to about 27 bcm by 2020 and probably stagnate at this level; production may not go higher than
30 bcm by 2030. Additional gas production of about 1.3 bcm has already been reported in 2010.
Consumption
Gas provides between 87 and 90 percent of the total energy consumption in Bahrain, the rest being met by
oil. All the gas produced is consumed within Bahrain. In 2010, according to NOGA data, 37 percent of
the gas was consumed by the electricity and water sector, followed by the aluminum smelter company
ALBA3 (24 percent), Bahrain Petroleum Company (9 percent), Gulf Petrochemical Industry (8 percent),
others (5 percent), and gas for reinjection (17 percent).
The demand for reinjection will continue and perhaps increase slowly. The demand for aluminum
smelting will increase as Bahrain plans to add a sixth smelter and import gas if additional gas does not
become available locally. The demand for power generation and water desalination will continue to
increase.
Power Sector
The installed capacity in 2010 was 3,167 megawatts (MW), consisting of 100 MW of steam turbines, 700
MW of gas turbines, and 2,367 MW of combined-cycle plants. The peak demand was 2,708 MW and
energy generation amounted to 13,230 gigawatt hours (GWh). Energy sales in 2010 amounted to 12,142
GWh, 49 percent of which was for residential consumers, followed by commercial consumers (39
percent), industrial consumers (11.6 percent), and others (0.4 percent).
3 This is believed to be the largest aluminum smelter in the world.

GAS SECTOR PROFILES OF ARAB COUNTRIES
9
All the plants consumed only natural gas in 2009, when the capacity was 2,779 MW and energy
generation was 12,056 GWh; the fuel consumption was reported at 4.24 bcm of gas. In the period
200508 also, natural gas had a share of 95100 percent in total fuel consumption by the power sector. In
2010, however, the power plants are reported to have consumed 4.473 bcm of gas and 3.14 million tons of
oil equivalent (mmtoe) of liquid fuels, perhaps indicating the tightening of the gas supply situation.4 (This
could also be a reporting error.) During 2000–10, peak demand grew from 1,307 MW to 2,708 MW, at a
compound annual growth rate (CAGR) of 7.6 percent, while energy generation grew from 6,297 GWh to
13,230 GWh at a CAGR of 7.8 percent. A forecast through 2020 provided by the utility for the Arab
Union of Producers, Transporters and Distributors of Electricity (AUPTDE) in 2010 observed a demand
and energy growth rate of about 11.1 percent per year.5
Table A1.5 Bahrain’s Electricity Demand Forecasts through 2020
Item 2010 (actual) 2011 2015 2020 CAGR (%)
Peak demand (MW) 2,708 3,000 4,507 7,783 11.1
Energy generation (GWh) 13,230 15,297 22,437 37,796 11.1
Source: http://www.auptde.org.
Note: CAGR = compound annual growth rate; GWh = gigawatt hours; MW = megawatts.
Overall Outlook
On this basis one may expect the annual demand for electricity alone to go up to 13 bcm by 2020. If the
power sector’s share in total marketed gas consumption remains at around 45 percent, the total gas
demand of Bahrain could be of the order of 29 bcm by 2020. If efforts to drill for gas and oil at Khuff and
pre-Khuff formations at great depths succeed (as they appear to have so far), Bahrain should be able to
meet most of this level of demand, but would still need some imports. Adopting a modest growth rate of
2.5 percent per year, the domestic demand could reach 37 bcm by 2030. But during the past several years
Bahrain has been making efforts to secure pipeline gas from Iran and Qatar, without any success. Iraq is
also being considered as a possible supplier, but probably in the longer term. In any regional pipeline
project scheme, Bahrain needs to be counted as a prospective importer of about 56 bcm of gas/year.
Bahrain has prudently commissioned studies to look at the possibility of having a liquefied natural gas
(LNG) terminal, so that it could rely on internationally traded LNG to meet any shortfall. At the heart of
the plan is an LNG import terminal, to be built to the east of the Khalifa Bin Salman Port. The terminal,
with a price tag of some $1 billion, would have the capacity to handle up to 11.3 million cubic meters/day
(4.125 bcm/year), though this could be doubled should demand require. While the terminal would allow
Bahrain to import all the LNG it needs for its own economy, the facility could also load and transfer gas
cargoes to and from other destinations. Bahrain’s petroleum minister is reported to have announced on
May 7, 2012, that the contract for the LNG import terminal would be awarded by the end of 2012 on the
basis of nine bids received, with costs varying from $300 million to $1 billion depending on different
technology choices. The oil and gas holding company known as NOGA Holding (the business and
investment arm of the national oil and gas authority), has been given a mandate to proceed with the
formation of an entity that will be responsible for LNG supply and the development, financing, operation,
4 It is important to note here that, based on the info given at www.noga.gov.bh, the electricity and water sectors
consumed 37 percent of the gross gas production of 543.422 bcf in 2009, which amounts to 5.7 bcm of gas. Thus
probably the water sector (desalination units) consumed 5.7–4.24 bcm = 1.46 bcm. This needs verification. 5 The World Bank (2009b) gives a much lower forecast for 2015 and 2020 based on the outlook prevailing in 2008.
GAS SECTOR PROFILES OF ARAB COUNTRIES
10
maintenance, and management of an LNG import and regasification terminal. It was originally expected
that the terminal would be commissioned by 2016.6 The minister’s announcement in May 2012
mentioned above implied that the project would be commissioned by late 2014 or early 2015.
Prices
Gas is being sold for domestic consumption in the price range of $1.1$1.5 per million British thermal
units (mmbtu). In the context of gas production costs rising (on account of the need to extract gas from
great depths and difficult formations) to the level of $5$6/mmbtu, domestic prices will face the pressure
for upward revision. In September 2011 the energy minister of Bahrain announced that the gas tariff for
the aluminum smelter ALBA would be raised from $1.5 to $2.25/mmbtu as of January 1, 2012.7
Residential consumers (who consume around 49 percent of the total electricity sales) pay 0.8 cents/kWh
for the first 3,000 KWh, 2.4 cents/kWh for the next slab of 3,0015,000 kWh, and 4.24 cents/kWh for
consumption above 5,000 kWh/month. Since the annual per capita electricity consumption in 2010 is
reported at 10,710 kWh, it is likely that the majority of consumers are charged at the first slab. All other
consumers pay at the rate of 4.24 cents/kWh.8 This compares with the reported cost of production of 22.9
cents/kWh in 2008 and the off-take price of 37.3 cents/kWh from the independent power producers
(IPPs).9
6 http://www.oxfordbusinessgroup.com/economic_updates/bahrain-tapping-new-energy-sources.
7 See news item at http://www.reuters.com/article/2011/09/26/idU.S.L5E7KQ2P920110926.
8 http://www.mew.gov.bh/default.asp?action=category&id=40. Exchange rate is 1 Kuwaiti dinar = 1,000 fils =
$2.65. 9 The source is Fattouh and Stern 2011, but the figure seems to be based on the miscalculation that one Kuwaiti
dinar has 100 fils, rather than 1,000 fils.

Arab Republic of Egypt
Egypt has a large area (1 million square kilometers, km2) and a sizeable population (82.5 million). Its per
capita gross domestic product (GDP) in 2011 was estimated at around $2,800.
Reserves
Its proven oil reserves at the end of 2010 were reported at 4.5 billion barrels (0.3 percent of the world’s
reserves) with a reserves-to-production ratio (RPR) of only 16.7 years. Its oil production in 2010 stood at
736,000 barrels/day while its consumption was running at 757,000 barrels/day, thus making the country a
marginal net importer of oil. Its proven natural gas reserves at the end of 2010 were reported at 2.2 trillion
cubic meters (tcm) (or 1.2 percent of the world’s reserves) with a RPR of 36 years (BP 2011b).
Proven gas reserves grew from 347 billion cubic meters (bcm) in 1989 to 2.2 tcm by 2010. Growth has
been much slower since 1999 than before. About 81 percent of the reserves are in the Mediterranean Sea,
6 percent in the Gulf of Suez, 11 percent in the Western Desert, and 2 percent in the Nile Delta. The RPR
declined from 75 years in 1999 to 36 years in 2010, but foreign companies operating in Egypt believe that
under the right incentives Egypt has probable reserves of 2.55 tcm of gas, mostly in the Mediterranean
Sea (APRC 2011). The Oil and Gas Journal of May 2010 reported a U.S. Geological Survey estimate
that the Nile Delta contains over 6.2 tcm of undiscovered and technically recoverable reserves of gas and
also 9.5 billion barrels of natural gas liquids (NGLs).
Production
Marketed production increased from 21 bcm in 2000 to 62.7 bcm by 2009, and slightly declined to 61.3
bcm in 2010 (1.9 percent of the world production) at a compound annual growth rate (CAGR) of 11.3
percent. Exploration and production are undertaken by joint venture companies (in which the foreign
contractor has 50 percent ownership, and the state-owned oil and gas enterprises, such as EGPC and
EGAS, the remaining 50 percent).10
The foreign investors have been obliged to sell up to two-thirds of
their share of gas (including profit gas) on a take-or-pay basis to the EGPC and EGAS. The price payable
for such gas purchases was capped at $2.65 per million British thermal units (mmbtu) in the mid-2000s,
but the cap has been raised several times in the recent past, taking into account the rising costs, and is
currently in the range of $3.7$4.7/mmbtu, with a floor and cap and indexed to oil prices. Such revisions
are believed to have incentivized increased production.
10
EGPC is the Egyptian General Petroleum Corporation and EGAS is the Egyptian Natural Gas Holding Company.

GAS SECTOR PROFILES OF ARAB COUNTRIES
12
Table A1.6 Egyptian Production, Consumption, and Exports of Gas: 2000–10 (bcm)
Item 2000 2005 2006 2007 2008 2009 2010
Marketed gas production 21.0 42.5 54.7 55.7 59.0 62.7 61.3
Domestic gas consumption 20.0 31.6 36.5 38.4 40.8 42.5 45.1
Exports of gas by pipeline 0.0 1.10 1.93 2.35 2.86 5.5 5.46
Exports of gas as LNG 0.0 6.93 14.97 13.61 14.06 12.82 9.71
Exports total 0.0 8.03 16.90 15.96 16.92 18.32 15.17
Source: BP 2011b
Note: bcm = billion cubic meters; LNG = liquefied natural gas.
The 2012 edition of the British Petroleum (BP) Statistical Review of World Energy reports a marketed
production level of 61.3 bcm for 2011 (about the same as in 2010), but an increased consumption level of
49.6 bcm (a 10 percent increase over 2010 levels) and a corresponding decline in exports.
Consumption
Domestic consumption has increased rapidly from 20 bcm in 2000 to 45.1 bcm in 2010 (1.4 percent of the
world consumption) with a CAGR of 8.5 percent. According to a late 2010 EGAS report, the power
sector was the largest consumer of gas (56 percent) followed by the industrial sector (fertilizer, cement,
iron and steel, and others) (30 percent), petroleum and petrochemicals (11 percent), residential consumers
(2 percent), and motor vehicles using compressed natural gas (1 percent). In late 2010 a total of 3.8
million households were connected to the gas network, which exceeded 17,950 km. The government
follows the policy of encouraging switching from oil to gas use wherever possible in an attempt to contain
oil import volumes. Figure A1.5 represents the gas sector infrastructure in the country.

GAS SECTOR PROFILES OF ARAB COUNTRIES
13
Figure A1.5 Gas Sector Infrastructure in Egypt
Source: The Oil Drum 2011; also at http://www.egas.com.
Role of the Power Sector in Consumption
Egypt operates a large power system with an installed power-generating capacity of 24,726 MW (11.3
percent hydro, 86.7 percent thermal, and 2 percent wind), an annual power generation of 139,000
gigawatt hours (GWh) (9.25 percent hydro, 89.7 percent thermal, and 1.0 percent wind), a peak demand
of 22,750 MW, and a customer base of 25.7 million. The fiscal year is from July 1 to June 30.11
Of the installed generation capacity, steam turbine units had the largest share at 46.3 percent, followed by
combined-cycle (28.9 percent), gas turbine (11.5 percent), hydropower (11.3 percent), and wind (2
percent) units. Total fuel consumption amounted to 26.8 million.12
Natural gas, with a share of 80.5
percent, was the predominant fuel for thermal power. Heavy and light fuel oil contributed the balance,
and were mainly used to meet peak demand or as backup fuel in steam power units. Natural gas
consumption for power generation amounted to 24.3 bcm in FY 2009–10.
Peak demand has grown from 13,326 MW in FY 2001–02 to 22,750 MW in FY 2009–10 at a CAGR of
6.9 percent, while energy generation grew from 83 terawatt hours (TWh) to 139 TWh at a CAGR of 6.7
11
All data relate to FY 2009–10 (unless otherwise stated) and are from the annual report of the Egyptian Electricity
Holding Company (EEHC 2010). 12
Tons of oil equivalent.
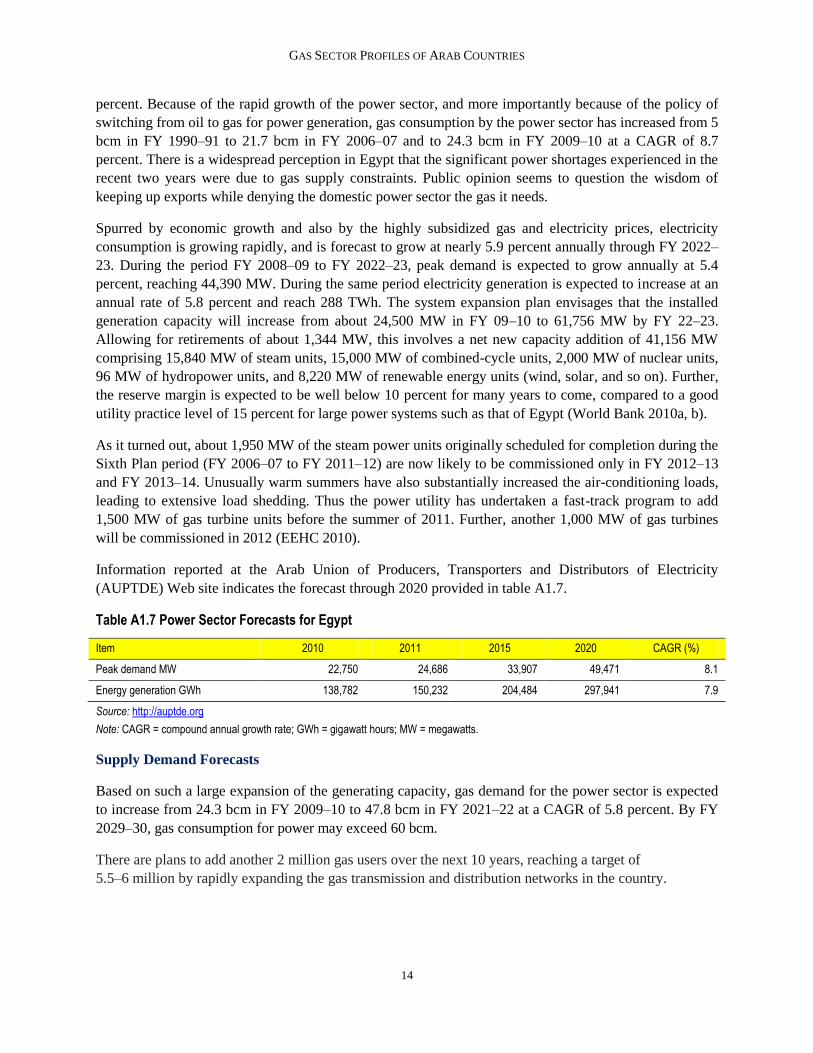
GAS SECTOR PROFILES OF ARAB COUNTRIES
14
percent. Because of the rapid growth of the power sector, and more importantly because of the policy of
switching from oil to gas for power generation, gas consumption by the power sector has increased from 5
bcm in FY 1990–91 to 21.7 bcm in FY 2006–07 and to 24.3 bcm in FY 2009–10 at a CAGR of 8.7
percent. There is a widespread perception in Egypt that the significant power shortages experienced in the
recent two years were due to gas supply constraints. Public opinion seems to question the wisdom of
keeping up exports while denying the domestic power sector the gas it needs.
Spurred by economic growth and also by the highly subsidized gas and electricity prices, electricity
consumption is growing rapidly, and is forecast to grow at nearly 5.9 percent annually through FY 2022–
23. During the period FY 2008–09 to FY 2022–23, peak demand is expected to grow annually at 5.4
percent, reaching 44,390 MW. During the same period electricity generation is expected to increase at an
annual rate of 5.8 percent and reach 288 TWh. The system expansion plan envisages that the installed
generation capacity will increase from about 24,500 MW in FY 09–10 to 61,756 MW by FY 22–23.
Allowing for retirements of about 1,344 MW, this involves a net new capacity addition of 41,156 MW
comprising 15,840 MW of steam units, 15,000 MW of combined-cycle units, 2,000 MW of nuclear units,
96 MW of hydropower units, and 8,220 MW of renewable energy units (wind, solar, and so on). Further,
the reserve margin is expected to be well below 10 percent for many years to come, compared to a good
utility practice level of 15 percent for large power systems such as that of Egypt (World Bank 2010a, b).
As it turned out, about 1,950 MW of the steam power units originally scheduled for completion during the
Sixth Plan period (FY 2006–07 to FY 2011–12) are now likely to be commissioned only in FY 2012–13
and FY 2013–14. Unusually warm summers have also substantially increased the air-conditioning loads,
leading to extensive load shedding. Thus the power utility has undertaken a fast-track program to add
1,500 MW of gas turbine units before the summer of 2011. Further, another 1,000 MW of gas turbines
will be commissioned in 2012 (EEHC 2010).
Information reported at the Arab Union of Producers, Transporters and Distributors of Electricity
(AUPTDE) Web site indicates the forecast through 2020 provided in table A1.7.
Table A1.7 Power Sector Forecasts for Egypt
Item 2010 2011 2015 2020 CAGR (%)
Peak demand MW 22,750 24,686 33,907 49,471 8.1
Energy generation GWh 138,782 150,232 204,484 297,941 7.9
Source: http://auptde.org
Note: CAGR = compound annual growth rate; GWh = gigawatt hours; MW = megawatts.
Supply Demand Forecasts
Based on such a large expansion of the generating capacity, gas demand for the power sector is expected
to increase from 24.3 bcm in FY 2009–10 to 47.8 bcm in FY 2021–22 at a CAGR of 5.8 percent. By FY
2029–30, gas consumption for power may exceed 60 bcm.
There are plans to add another 2 million gas users over the next 10 years, reaching a target of
5.5–6 million by rapidly expanding the gas transmission and distribution networks in the country.

GAS SECTOR PROFILES OF ARAB COUNTRIES
15
Taking also into account the needs of other sectors (such as industry, petrochemicals, households, and
transport) CEDIGAZ13
has estimated that the domestic consumption of natural gas in Egypt would rise
from the current levels to 60.5 bcm by 2015 and 78 bcm by 2020. CEDIGAZ has further estimated that to
sustain gas exports at the 2009 level of 18.3 bcm and meet the planned growth in domestic consumption,
production would need to increase from 63 bcm in 2009 to 79 bcm in 2015 and 96 bcm in 2020. Over the
longer period, that represents a steady production growth of 4 percent/year (APRC 2011). Mott
MacDonald (November 2010), in a report entitled Supplying the EU Natural Gas Market—Final Report,
has made the supply, demand, and export surplus projections for three different scenarios through 2030 as
shown in table A1.8.
Table A1.8 Supply, Demand, and Export Surplus Projections for Egypt through 2030
Item Scenario 2010 2015 2020 2025 2030
Gas supply bcm/year
High case 65.0 85.0 100.0 110.0 120.0
Base case 65.0 79.1 91.7 101.2 106.4
Low case 65.0 70.0 70.0 70.0 70.0
Gas demand bcm/year
High case 40.2 50.0 65.0 80.0 95.0
Base case 40.2 48.9 59.5 69.0 80.0
Low case 40.2 45.0 50.0 55.0 60.0
Gas export availability bcm/year
High case 24.8 40.0 50.0 55.0 60.0
Base case 24.8 30.2 32.2 32.2 26.4
Low case 24.8 20.0 5.0 –10.0 –25.0
Source: Mott MacDonald 2010.
Note: bcm = billion cubic meters.
But the actual demand in 2010 was 45.1 bcm. Correcting for this, the probable demand growth for Egypt
is likely to be from 45.1 bcm in 2010 to 72.8 bcm in 2020 (at 4.9 percent a year) and to 97.79 bcm in
2030 (at 3 percent per year).
Exports
Egyptian gas exports using the Arab Gas Pipeline (AGP) started in 2003, and exports of liquefied natural
gas (LNG) started from 2005. Exports of gas through the East Mediterranean Gas Company (EMG)
Pipeline to Israel commenced in 2008. The details of these are discussed below.
Arab Gas Pipeline (AGP)
The AGP was constructed in several phases (figure A1.6). So far a total cost of about $900 million has
been incurred. The first phase involved the construction of a 265-km-long pipeline (with a 36-inch
diameter and an annual capacity of 10 bcm) from Arish in Egypt to Aqaba in Jordan, which includes a 15-
km-long submarine pipeline at a depth of 80 meters. This was completed at a cost of $200 million in July
2003, and deliveries began for the power station in Aqaba at a rate of 1.1 bcm/year.
13
CEDIGAZ is an international association dedicated to natural gas information, created in 1961 by a group of
international gas companies and the Institut Français du Pétrole (IFP). It is based near Paris.

GAS SECTOR PROFILES OF ARAB COUNTRIES
16
In the second phase a 390-km-long, 36-inch-diameter pipeline from Aqaba to El Rehab in Jordan was
completed at a cost of $300 million at the end of 2005, and by February 2006 gas supply to the power
stations of Samra and El Rehab had commenced.
In the third phase the 30-km-long, 36-inch-diameter pipeline from El Rehab to the Syrian border was
completed in July 2008 at a cost of $35 million. In the fourth phase the construction of a 324-km-long,
36-inch-diameter pipeline from the Syria-Jordan border to Homs in Syria was completed in February
2008, and Syria started receiving Egyptian gas at the annual rate of 0.9 bcm. This rate was to be increased
to 2.19 bcm by 2012–13. In August 2009 it was reported that gas to Syria was being priced at
$5.25/mmbtu.
In October 2009 Lebanon started receiving gas through a spur from Homs to Tripoli and a power plant
near Tripoli under a 15-year swap arrangement, which enables Lebanon to get 0.6 bcm of Syrian gas/year
in lieu of the Egyptian gas deliveries to Syria. Lebanon received only half the contracted volume of
supply and only for a few months.
In the final phase the aim was to connect Homs to Aleppo in Syria and then on to Kilis on the Turkey-
Syria border to enable the flow of Egyptian gas to Turkey and beyond. But by this time questions about
the adequacy and availability of Egyptian gas for exports had emerged, and it was decided to undertake
the 64-km pipeline from Kilis to Aleppo to enable the flow of gas from Turkey to the Syrian system,14
and later connect Homs to Aleppo when Egyptian gas availability questions were settled.
Figure A1.6 Arab Gas Pipeline Figure A1.7 Arish-Ashkelon Gas Pipeline to Israel
Source: APRC 2011 Source:
http://en.wikipedia.org/w/index.php?title=File:Arab_Gas_Pipeline.svg&page=1
.
14
This pipeline was scheduled to be completed by early 2012. The current situation, however, is not clear.

GAS SECTOR PROFILES OF ARAB COUNTRIES
17
Over the last two years in Egypt, because of turmoil associated with the change in regime and in order to
meet rising domestic demand for gas, supply was frequently reduced or interrupted. Presently there is no
supply at all through the AGP to Syria and Lebanon. The supply to Jordan resumed in late 2012 and
reached 240 million cubic feet per day (corresponding to an annual supply rate of about 2.48 bcm) in the
first week of January 2013.15
Thus the experience of the AGP has highlighted major concerns over the
security of supply inherent in cross-border gas pipeline trade and the political risks such trade faces.
Pipeline to Israel
Although the Arish-Ashkelon gas pipeline is not officially a part of the AGP project, it branches off from
Arish on the same pipeline in Egypt and goes up to the coastal city of Ashkelon in Israel (figure A1.7).
This submarine pipeline, which is about 90 km long and has the capacity to transmit about 7.5 bcm/year,
was built and is operated by the EMG, which is currently owned by several Egyptian (38 percent) and
Israeli (37 percent) companies as well as by PTT of Thailand (25 percent). The line started exporting gas
to Israel in May 2008, but soon elicited fierce protests from the Egyptian public. The price agreed in 2005
negotiations was believed to be $2.50$2.75/mmbtu, and initial quantities contracted ranged from 1.2 to
1.7 bcm/per year. In mid-2009 the prices were believed to have been increased to $4.5$5/mmbtu. In the
more recent days, supplies have been disrupted often and the transactions are being reviewed. Recently
Egypt appears to have ceased supply, claiming payment defaults by buyers. Israel has recently made
significant offshore gas discoveries, which would fully meet its domestic needs and leave surpluses for
export. In this context it is possible that Israel may not need any gas imports from Egypt in the future.
LNG Plants
Egypt has two natural gas liquefaction plants, one at Damietta called the SEGAS plant with a single train
and a design capacity of 4.8 million tons/year, and the other at Idku called ELNG with two trains and a
capacity of 3.6 million tons/year. It has also provision for constructing an additional six trains in the
future.
SEGAS was constructed in 2004 by a joint venture comprising Union Fenosa of Spain (80 percent), the
EGAS (10 percent), and the ENI-EGPC (10 percent), at a cost of $1.3 billion. It operates on a 25-year
tolling arrangement with the EGAS and EGPC.
The ELNG plant was constructed in 2005 at a cost of $1.9 billion. While the common facilities are owned
by the Egyptian LNG Holding company (British Gas, 38 percent; Petronas, 38 percent; EGAS and EGPC,
12 percent each), each LNG train is owned by a different company. The first train is owned by El Behera
Natural Gas Liquefaction Company (British Gas, 35.5 percent; Petronas, 35.5 percent; the EGPC, 12
percent; the EGAS, 12 percent; and Gaz de France, 5 percent). And the second train is owned by Idku Gas
Company, in which British Gas and Petronas have 38 percent holdings each and the EGPC and EGAS, 12
percent each.
In 2010 LNG from Egypt was exported to Spain (2.62 bcm), the United States (2.07 bcm), and 14 other
countries all over the world. Pipeline gas exports went to Jordan (2.52 bcm), Israel (2.10 bcm), Syria (0.6
bcm), and Lebanon (0.15 bcm). In 2011 LNG exports declined to 8.6 bcm and pipeline exports may have
declined to 1.8 bcm or even lower.
15
http://www.albawaba.com/business/jordan-egypt-gas-461389
GAS SECTOR PROFILES OF ARAB COUNTRIES
18
Moratorium on New Exports
The announced government policy in the natural gas sector is to use one-third of the reserves for export,
one-third for domestic consumption, and to leave the balance underground for future generations. Despite
this, concerns emerged in 2008 that increasing volumes of export was causing domestic shortages of gas;
pending a detailed review of this issue, in June 2008 the government announced a moratorium on new
exports, initially for a period of two years. Since then the public perception has become more hostile to
exports, based, inter alia, on the belief that gas is being exported at throwaway prices. The officials have
pointed out that the average price of pipeline gas exported by Egypt in the 12 months up to March 2010
was $4.25/mmbtu. In the same period the average price for LNG exports was $4.80/mmbtu. Over this
period Henry Hub prices averaged $4.10/mmbtu and European spot prices averaged $4.25/mmbtu.
Thus in 2009, despite ENI and BP holding up what seemed to them to be more-than-adequate new
reserves to underpin a new train at the SEGAS LNG plant at Damietta, the government deferred the
project indefinitely. Essentially, the companies were told that they would need to prove a quantity twice
as large as they had done already. In 2011 the prospects for the moratorium being lifted in the short term
seemed slight.
Outlook for Increased Exports
As of now the prospects look bleak, despite the advances made to incentivize the foreign investors. With
its resource position and location as well as the already created infrastructure, Egypt is well poised to
increase its pipeline exports to the Mashreq countries—especially in the context of Jordan, Syria, and
others being agreeable to pay reasonable prices (in the range of $4$5.5/mmbtu)—while meeting its
domestic demand. However, the recent developments leading to the complete cessation of gas supply to
Syria, Lebanon, and Israel and prolonged disruption of supplies to Jordan during 2011 and 2012 creates
serious doubts about the ability of Egypt even to maintain the current level of exports, let alone increase
them. While advances have been made in terms of producer prices, domestic gas and electricity prices
still need substantial reform to discourage inefficient consumption and keep the single gas-buying agency
(EGAS) solvent enough to settle dues to the producers fully and punctually. The overall energy subsidy
burden (estimated at 8–10 percent of the GDP and about 25 percent of the government expenditures) is a
drain on government revenues, which rapidly increases inefficient domestic demand and cuts into export
revenues, thus straining the economy at both ends.
Since June 2008 the government has been trying to increase domestic natural gas prices to narrow the gap
between supply prices and supply costs. In this endeavor, it has achieved only modest success. As of
January 2013, the price of gas for energy-intensive industries varies from $2 to $4 per mmbtu, while the
price for the power sector has reached $1.82/mmbtu. There is also a proposal to link supply prices for
energy-intensive industries to the import price of LNG (see recent developments below). Households and
commercial consumers seem to pay around $1.25/mmbtu. Electricity prices, as of January 2013, ranged
from 0.74 cents to 10 cents/kWh to households (in six ascending tariff blocks). Commercial consumers
paid prices from 4.02 cents to $10.7 cents (in five ascending blocks). Energy-intensive industries faced
off-peak tariffs from 3.28 cents to 6.34 cents; during peak hours they paid from 6.19 cents to 8.0
cents/kWh. The power supply company is to be compensated directly from the state budget for increases
in fuel prices that are not met by increases in retail price. Price increases expressed in local currency have
not kept pace with the depreciation of the Egyptian pound in relation to the U.S. dollar during 2010–13.
Thus while the present improvements are welcome, much more needs to be done in relation to gas and
power prices.

GAS SECTOR PROFILES OF ARAB COUNTRIES
19
Recent Developments
In an attempt to meet rapidly rising domestic demand, the Egyptian government has decided to
commission an LNG import terminal. In terms of the strategy of the Ministry of Petroleum to “satisfy the
local market demand for natural gas and minimize the use of liquid fuels,” EGAS announced the details
of a global LNG tender on October 24, 2012. That tender had the following scope:
Importation of LNG
Execution of a service contract to utilize an Egyptian port on the Mediterranean or Red Sea for
the establishment or rental of a marine jetty/buoy mooring system
Establishment of an LNG floating storage and re-gasification unit (FSRU)
Construction of all necessary facilities, equipment, and pipelines to tie in to the Egyptian national
natural gas grid (ENNGG)
Marketing and sale of the imported gas locally to consumers through the ENNGG in return for a
transportation (and loss) fee expressed in $/mmbtu.
It is not clear whether imports of LNG will have an adverse impact on the investor’s enthusiasm for new
exploration and production. On the other hand, the high cost of the imported LNG could help dispel the
notion of “cheap gas” in the minds of the Egyptian people, possibly paving the way for price adjustments.
Given the current political milieu, however, such developments appear unlikely.
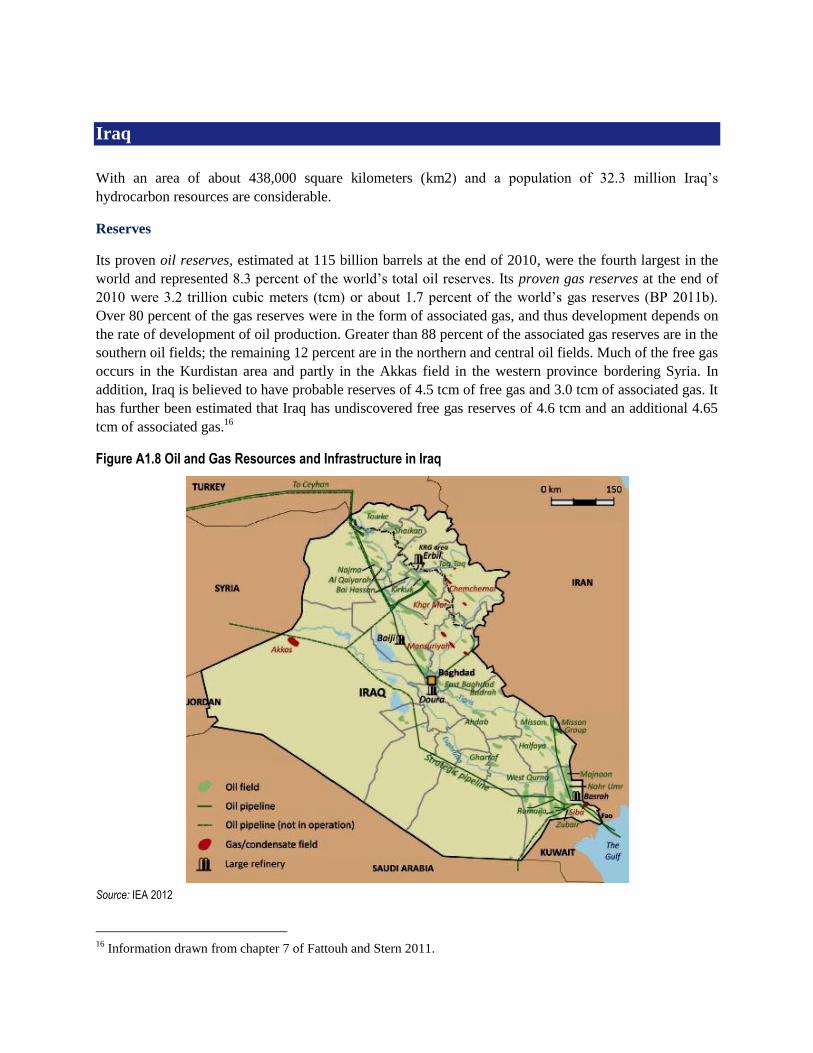
Iraq
With an area of about 438,000 square kilometers (km2) and a population of 32.3 million Iraq’s
hydrocarbon resources are considerable.
Reserves
Its proven oil reserves, estimated at 115 billion barrels at the end of 2010, were the fourth largest in the
world and represented 8.3 percent of the world’s total oil reserves. Its proven gas reserves at the end of
2010 were 3.2 trillion cubic meters (tcm) or about 1.7 percent of the world’s gas reserves (BP 2011b).
Over 80 percent of the gas reserves were in the form of associated gas, and thus development depends on
the rate of development of oil production. Greater than 88 percent of the associated gas reserves are in the
southern oil fields; the remaining 12 percent are in the northern and central oil fields. Much of the free gas
occurs in the Kurdistan area and partly in the Akkas field in the western province bordering Syria. In
addition, Iraq is believed to have probable reserves of 4.5 tcm of free gas and 3.0 tcm of associated gas. It
has further been estimated that Iraq has undiscovered free gas reserves of 4.6 tcm and an additional 4.65
tcm of associated gas.16
Figure A1.8 Oil and Gas Resources and Infrastructure in Iraq
Source: IEA 2012
16
Information drawn from chapter 7 of Fattouh and Stern 2011.

GAS SECTOR PROFILES OF ARAB COUNTRIES
21
Production and Consumption
Gas production and consumption data are inconsistent and unreliable. British Petroleum (BP) statistics
report a marketed production of 1.3 billion cubic meters (bcm) for 2010, net of gas reinjected for oil
recovery and extensive gas flaring. It is believed that currently nearly 66 percent of the total production is
flared. Iraq’s volume of flaring (estimated at about 810 bcm) is the third largest in the world after those
of Russia and Nigeria. The annual statistical bulletins of the Organization of the Petroleum Exporting
Countries (OPEC) provide the data summarized in table A1.9, the consistency or correctness of which has
been questioned by some observers.
Table A1.9 Iraq Natural Gas Production Data, 2001–10 (bcm)
Item 2001 2005 2006 2007 2008 2009 2010
Gross production 4.0 11.4 11.9 13.6 14.8 16.6 16.9
Marketed production 2.8 1.5 1.5 1.5 1.9 1.1 1.3
Gas flared 1.0 7.9 6.6 6.6 6.0 7.0 7.6
Gas reinjected 0.0 0.8 0.8 0.8 0.9 1.0 0.8
Shrinkage 0.2 1.2 3.0 4.7 6.0 7.5 7.2
Source: http://www.opec.org.
Note: bcm = billion cubic meters.
In the short term, the Iraqi authorities are focusing on rapidly increasing oil production for export, which
would result in increased production of associated gas, creating the need for gas-use and gas-export
strategies. In the short term, gas flaring is expected to be on the order of 10.4 bcm to 15.5 bcm per year,
and gas-gathering and gas-processing investments will have to be made on a high priority basis. A master
gas system linking production and consumption centers (mainly the power stations) could be built,
possibly using a part of the increased oil revenues. In the medium and long term, exploration and
production of nonassociated gas will also pick up, and gas flaring could substantially increase unless
export options are pursued vigorously, along with investments in domestic gas-consuming industries such
as petrochemicals and fertilizers. However, to sustain the level of exports, gas will have to be produced
from new fields from 2020 onwards.
The key driver of demand for gas in Iraq is the power sector, followed by gas-consuming industries that
produce both for domestic consumption and for export. However, given the rapid buildup of associated
gas production and the lead times needed for gas-consuming investments, gas exports become a key
component in Iraq’s resource use plan.
Power Sector Outlook and Gas Demand for Power Sector
Power generation capacity at the end of 2010 amounted to 15,070 MW, comprising gas turbines (47
percent), steam turbines (33.1 percent), hydropower stations (16.7 percent), and diesel-fueled stations (3.2
percent). The age of the units, fuel constraints, and water flow variations had significantly reduced the
level of available capacity to nearly a third of the installed capacity. Electricity generated in 2010
amounted to 48,906 GWh, of which the share of gas turbines was 55 percent, followed by steam turbines
(31 percent), hydropower (9.7 percent), and diesel sets (4.3 percent). Iraq also imported 6,153 GWh of

GAS SECTOR PROFILES OF ARAB COUNTRIES
22
electricity. In 2010 Iraq’s fuel consumption for power generation was reported at 14.994 million tons of
oil equivalent, of which 37.9 percent was natural gas amounting to 6.31 bcm. 17
Iraq has also recently completed a 20-year power system master plan, the findings of which were
presented in a conference on Iraq’s energy future in Istanbul in September 2011. The master plan
estimated underlying demand in the Iraqi system in 2009 as 11,250 MW (power sent out) and projected
that, under the base case, demand would grow from 11,781 MW (2010) to 31,722 MW (2030) at a
compound annual growth rate (CAGR) of 5.1 percent. Under the high case, demand was expected to grow
at a CAGR of 6.9 percent to 45,078 MW (2030). To meet the forecast load in the high-case scenario, a
generation-capacity expansion plan as indicated in figure A1.9 is envisaged.18
According to the plan, capacity expands from the 2010 level of about 15,070 MW to 40,000 MW by 2020
and to 53,000 MW by 2030. Annual energy generation increases from the 2010 level of 49 terawatt hours
(TWh) to 133 TWh by 2020 and to 203 TWh by 2030. Gas’s share in the total fuel needs of the power
sector swell from 37.9 percent in 2010 to 51 percent by 2015 and to 89 percent by 2017, reaching 92–93
percent in 2022, which is maintained through 2030.
Figure A1.9 Evolution of Capacity mix in the Power Sector of Iraq through 2030 (GW)
Source: Power System Master Plan of Iraq.
17
www.auptde.org . It is to be noted that BP statistics gives the marketed production as 1.7 bcm, while power sector
consumption has been reported at 6.31 bcm. 18
This study covered the whole of Iraq excluding the Kurdistan area for which a similar study had been completed
earlier. The capacity there is expected to be about 3,030 MW in 2030 including some imports from the rest of Iraq.

GAS SECTOR PROFILES OF ARAB COUNTRIES
23
Gas Export Possibilities
Iraq, by virtue of its location and resource abundance, has the potential to export to the Mashreq and the
GCC countries to meet their growing gas needs. It also has the potential to export gas to the European
Union via Turkey. Pipelines to Syria and Turkey are under discussion. A pipeline to Kuwait already
exists and needs only to be rehabilitated and activated. Pipelines to Syria and Jordan could make use of
the Arab Gas Pipeline (AGP) infrastructure. Pipeline distances to Syria, Jordan, Turkey and Kuwait are
not very long, so capital costs would be modest, making Iraq competitive against other potential
suppliers.
Many of the pipeline options to these destinations have been found to have attractive IRRs and reasonable
levelized costs at the destinations.
Given the timing constraints and peculiarities of resource development in Iraq, any gas export strategy
must: (a) secure flexible contracts with regional countries, with short-term commitment on volumes and a
possibility to enlarge the contract if additional volumes of gas become available at a later stage; and (b)
focus on increasing the production of nonassociated gas to sustain exports in the longer term.
The Iraqi government has already started focusing on the development of gas fields and has succeeded
(after the third round of bidding conducted in 2010) in concluding in June 2011 the 20-year technical
service contracts for the development of three nonassociated gas fields at Akkas, Mansuriya, and Sibba
(total annual production capability of about 317 bcm). The fourth round of bidding for exploration
scheduled for 2012 would cover 12 blocks, 7 of which would be for nonassociated gas. Further, the
government is reported to have signed on July 12, 2011, a final contract with Royal Dutch Shell for a
project aimed at recovering 7.24 bcm of associated gases from the southern oilfields in Basra province to
reduce the level of flaring.19
In July 2009 the prime minister of Iraq announced in Ankara that Iraq could provide up to 15 bcm of gas
to the Nabucco Pipeline by 2015. In January 2010 the European Union (EU) and Iraq signed a Strategic
Energy Partnership memorandum of understanding (MOU). The areas of cooperation covered by the
MOU included identification of sources and supply routes for supply of gas from Iraq to the EU and the
updating of the Iraqi gas development program. In parallel, a recent report analyzing the various options
for taking gas from the Middle East and North Africa (MENA) region to the EU (Mott MacDonald 2010),
found the option of importing 1530 bcm of gas from Iraq with a pipeline connecting the Iraqi gas fields
to the Nabucco gas pipeline economically attractive.
After evaluating four pipeline options for transporting Iraqi gas to the EU, the study concluded that a
direct 589-km-long, 56-inch-diameter pipeline from the Kirkuk area of Iraq to Erzurum of Turkey for
transporting 15 bcm of gas from the Kirkuk area and in the nonassociated gas fields in Kurdistan (such as
Chemchemal and Kor Mohr) was the best option. As gas flaring is reduced in the southern oil fields of
Basra, the gathered and processed dry gas from there could be transported by a 801-km-long, 56-inch-
diameter pipeline to connect with the Kirkuk-Erzurum Pipeline, thus allowing a total supply of 30 bcm.
The levelized transport cost in the case of the Kirkuk-Erzurum Pipeline, transporting 15 bcm, was
estimated at €12.72/1,000 cubic meters of gas, while that for the pipeline from the Southern fields of
Basra to Erzurum via Kirkuk for transporting 30 bcm of gas was estimated at €18.47/1,000 cubic meters
of gas. These values were considered the most attractive among the options analyzed. As there are
19
Information from http://www.reuters.com.

GAS SECTOR PROFILES OF ARAB COUNTRIES
24
considerable uncertainties about the availability of gas supply from Iraq (despite its considerable gas
resource endowments), the study recommends a conservative approach involving larger pipeline
diameters with less compression to be scaled up as Iraq becomes a more prominent exporter in the region.
The source-of-supply assumption that by 2015 the Kurdistan gas fields of Kor Mohr and Chemchemal
would produce 31 bcm of gas, providing Kurdistan 5.16 bcm, and leaving a balance of 10.3 bcm for
Turkey and 15.5 bcm for the Nabucco Pipeline, at least for the first phase, is not considered robust. The
fields may not be capable of producing such volumes of supply, and reserves data may not be fully
reliable. Also disagreements between the Iraqi and Kurdistan governments regarding jurisdiction could
pose problems.
Export of gas to Kuwait by rehabilitating the existing 170-km-long, 40-inch-diameter pipeline with a
capacity of 4.2 bcm/year is considered the most immediate and practical export option. The short pipeline
built in the 1980s was used to supply 1.62.1 bcm of gas annually during 1986–89. In December 2004 the
Iraqi and Kuwaiti governments signed an MOU in terms of which the pipeline would be rehabilitated to
commence with supplies at 0.361 bcm/year and eventually increasing to the full capacity of 2.1 bcm/year.
Kuwait would pay the market price for the gas, with the price varying according to the quality of the gas.
The gas would come from the Rumaila field and the project would entail the installation of new junctions,
pumping and reception stations, and metering facilities. The work would be carried out in two phases. In
the first phase, Kuwait would import 35 million cubic feet (cu ft)/day (0.361 bcm/yr) of rich gas. In the
second phase, the volume would be stepped up to 200 million cu ft/day (2.7 bcm/yr). The cost of
rehabilitation was expected at around $800 million. The two countries agreed that they could, if
necessary, bring in foreign companies to execute either phase of the project, but not much progress
appears to have been made under this MOU.
Export of gas to Syria from the Akkas gas field in the western part of Iraq at a distance of 40 km from the
Syrian border is considered another practical option. A technical service contract for this field was
concluded in June 2011 with the Korean Gas Corporation. Earlier studies have indicated that the field
could produce as much as 5.2 bcm of gas/year. In 2008 the oil ministries of Iraq and Syria signed an
MOU for gas from the Akkas field to be supplied to Syria. The gas would have to be processed on-site
and conveyed to Syria through a new 92-km-long, 22-inch-diameter pipeline (43 km in Iraq and 49 km in
Syria). From thereon the gas could be transported by the Syrian gas network to its consumers and also to
the AGP for onward transmission to Turkey on completion of its final phase.
Iraq has also the possibility of exporting gas in the form of LNG through its port in the Gulf.
Effect on Exports of Reducing Gas Flaring
A recent report (Wood Mackenzie Ltd. 2011) forecasts production increases in Iraq through 2025, as
shown in figure A1.10.
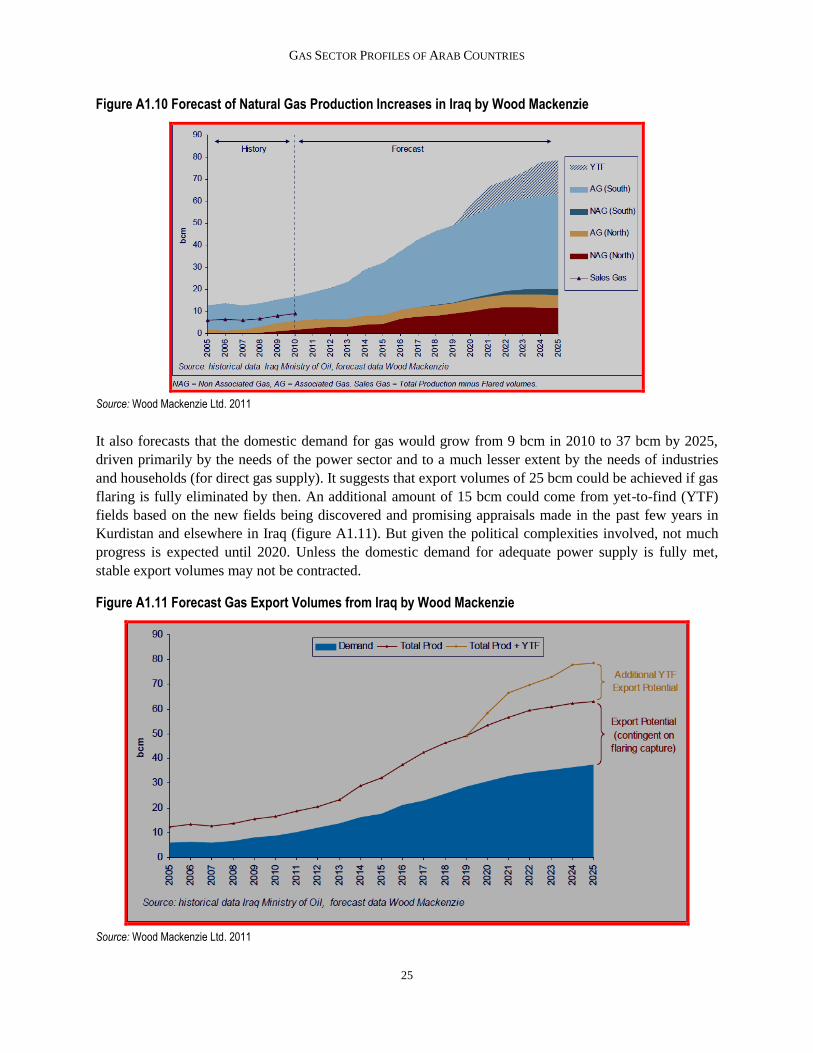
GAS SECTOR PROFILES OF ARAB COUNTRIES
25
Figure A1.10 Forecast of Natural Gas Production Increases in Iraq by Wood Mackenzie
Source: Wood Mackenzie Ltd. 2011
It also forecasts that the domestic demand for gas would grow from 9 bcm in 2010 to 37 bcm by 2025,
driven primarily by the needs of the power sector and to a much lesser extent by the needs of industries
and households (for direct gas supply). It suggests that export volumes of 25 bcm could be achieved if gas
flaring is fully eliminated by then. An additional amount of 15 bcm could come from yet-to-find (YTF)
fields based on the new fields being discovered and promising appraisals made in the past few years in
Kurdistan and elsewhere in Iraq (figure A1.11). But given the political complexities involved, not much
progress is expected until 2020. Unless the domestic demand for adequate power supply is fully met,
stable export volumes may not be contracted.
Figure A1.11 Forecast Gas Export Volumes from Iraq by Wood Mackenzie
Source: Wood Mackenzie Ltd. 2011

GAS SECTOR PROFILES OF ARAB COUNTRIES
26
Prices
The most recent price (2011) charged to the Iraqi power sector and industrial consumers for the supply of
gas, is $1.04/mmbtu. But in respect to the project for gas flaring reduction in southern Iraq, the Heads of
Agreements (HOAs) of 2008 provide for the sale of raw gas at the well head at prices linked to the
international prices of dry natural gas and liquid petroleum gas (LPG), which will be produced by
gathering and processing the raw gas. Iraqi politicians and industry circles were not happy with the
pricing formula and the HOAs had not been approved by the government. A formal contract with the joint
venture partners (state-owned Southern Gas Company, 51 percent; Shell, 44 percent; and Mitsubishi, 5
percent) appears to have been signed on July 12, 2011, for implementation of the project, but the pricing
formula contained in it has not been disclosed.
Power prices in 2011 are reported in the range of 14 cents/kWh and cover only a very small percentage
of the cost of supply. But only 17 percent of the electricity supplied is converted into collected cash—18
percent is lost in transmission and 18 percent in distribution (half of which is theft), 5 percent is not billed
at all, and 41 percent is not collected. Power supply is highly unreliable and intermittent, and unless
supply is stabilized it may be difficult to raise the prices.
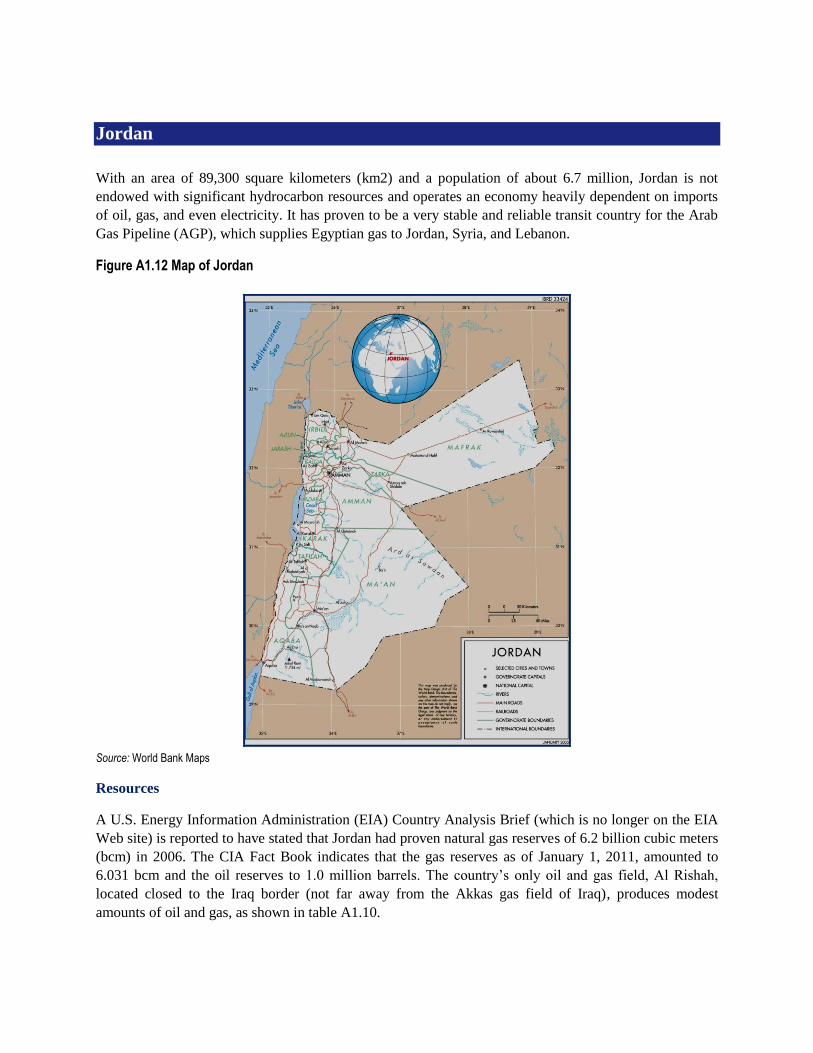
Jordan
With an area of 89,300 square kilometers (km2) and a population of about 6.7 million, Jordan is not
endowed with significant hydrocarbon resources and operates an economy heavily dependent on imports
of oil, gas, and even electricity. It has proven to be a very stable and reliable transit country for the Arab
Gas Pipeline (AGP), which supplies Egyptian gas to Jordan, Syria, and Lebanon.
Figure A1.12 Map of Jordan
Source: World Bank Maps
Resources
A U.S. Energy Information Administration (EIA) Country Analysis Brief (which is no longer on the EIA
Web site) is reported to have stated that Jordan had proven natural gas reserves of 6.2 billion cubic meters
(bcm) in 2006. The CIA Fact Book indicates that the gas reserves as of January 1, 2011, amounted to
6.031 bcm and the oil reserves to 1.0 million barrels. The country’s only oil and gas field, Al Rishah,
located closed to the Iraq border (not far away from the Akkas gas field of Iraq), produces modest
amounts of oil and gas, as shown in table A1.10.

GAS SECTOR PROFILES OF ARAB COUNTRIES
28
Table A1.10 Production of Oil and Gas in Jordan, 2005–09
Year Oil ‘000 tons Gas (bcm)
2005 1.1 0.241
2006 1.2 0.252
2007 1.2 0.218
2008 1.7 0.204
2009 1.5 0.221
Source: Ministry of Energy and Mineral Resources 2009.
Note: bcm = billion cubic meters.
Average annual production of about 0.227 bcm of gas is enough to produce only about 4 percent of the
electricity needed by the country. The annual production of both oil and gas met about 3.3 percent of the
total energy needs of Jordan in 2009. During that year Jordan imported 4.557 million tons of oil
equivalent (mmtoe) of oil and oil products, 3.149 bcm of gas, and 383 gigawatt hours (GWh) of
electricity.
Jordan is believed to have extensive oil shale resources, estimated at 42 billion tons, containing more than
4 billion tons of oil. The government is aggressively pursuing the exploitation of these resources, and
concessions have been given to several international oil companies.
Gas Imports20
Jordan cooperated in the construction of the AGP and gets all of its gas imports from Egypt through this
line. Volumes of gas imports from 2004 to 2010 are shown in table A1.11.
Table A1.11 Gas Imports by Jordan, 2004–10
Item 2004 2005 2006 2007 2008 2009 2010
Gas imports in bcm 1.10 1.10 1.93 2.35 2.72 2.85 2.52
Source: BP (2011b) and earlier years.
Note: bcm = billion cubic meters.
The AGP map is given in figure A1.13 and the details of the pipeline components are given below.
20
These figures do not agree with those of the Ministry of Energy and Mineral Resources, and there is confusion as
to the actual level of gas consumption in 2010.

GAS SECTOR PROFILES OF ARAB COUNTRIES
29
Figure A1.13 Arab Gas Pipeline
Source: APRC 2011.
The pipeline was established in early 2001 with a memorandum of understanding (MOU) signed by the
governments of Egypt, Jordan, Syria, and Lebanon. The AGP has been developed in phases as detailed
below and illustrated by figure A1.13.
The first section of approximately 265 km goes from Arish in Egypt to Aqaba in Jordan and was
completed in 2003 at a cost of approximately $220 million. The second section of 390 km goes from
Aqaba through Amman to El Rehab near the border with Syria and was completed in 2005 at a cost of
$300 million. The third section of 320 km goes from El Rehab via Damascus to Homs in Syria and was
completed in 2008. The fourth section is a branch line from Homs to Tripoli in Lebanon—a 64-km
pipeline built by a local firm, Argosy-Hawi, at a cost of about $13.7 million. The planned final section in
Syria between Homs and Aleppo (construction of a 36-inch pipeline section) has been postponed because
there are no sales or transit agreements between Egypt and Turkey for the export of gas. Instead, as a
short-term measure, a 600 DN (nominal diameter in millimeters) section of the existing Syrian gas
network is being used to create the connection to Aleppo, although this existing pipeline has very limited
capacity. The AGP is being extended from Aleppo to Kilis on the Syrian border with Turkey. BOTAS
(Turkey’s state-owned pipeline company), however, does not appear to have any current plans to finance
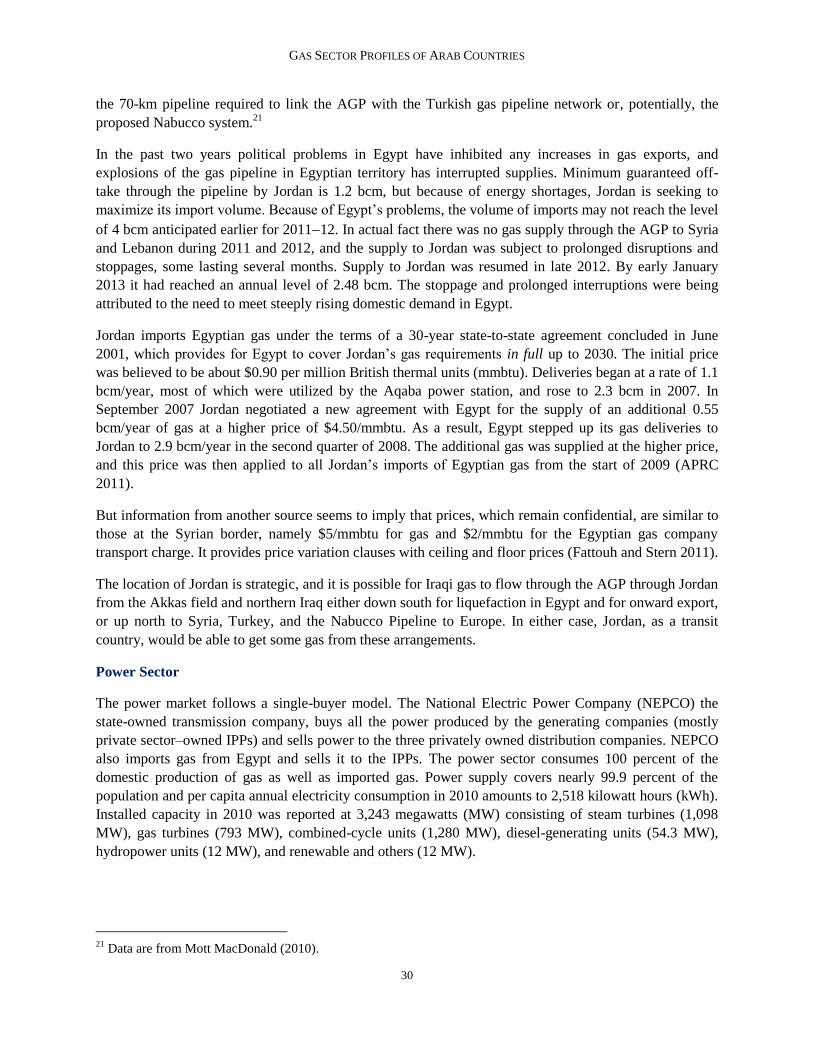
GAS SECTOR PROFILES OF ARAB COUNTRIES
30
the 70-km pipeline required to link the AGP with the Turkish gas pipeline network or, potentially, the
proposed Nabucco system.21
In the past two years political problems in Egypt have inhibited any increases in gas exports, and
explosions of the gas pipeline in Egyptian territory has interrupted supplies. Minimum guaranteed off-
take through the pipeline by Jordan is 1.2 bcm, but because of energy shortages, Jordan is seeking to
maximize its import volume. Because of Egypt’s problems, the volume of imports may not reach the level
of 4 bcm anticipated earlier for 201112. In actual fact there was no gas supply through the AGP to Syria
and Lebanon during 2011 and 2012, and the supply to Jordan was subject to prolonged disruptions and
stoppages, some lasting several months. Supply to Jordan was resumed in late 2012. By early January
2013 it had reached an annual level of 2.48 bcm. The stoppage and prolonged interruptions were being
attributed to the need to meet steeply rising domestic demand in Egypt.
Jordan imports Egyptian gas under the terms of a 30-year state-to-state agreement concluded in June
2001, which provides for Egypt to cover Jordan’s gas requirements in full up to 2030. The initial price
was believed to be about $0.90 per million British thermal units (mmbtu). Deliveries began at a rate of 1.1
bcm/year, most of which were utilized by the Aqaba power station, and rose to 2.3 bcm in 2007. In
September 2007 Jordan negotiated a new agreement with Egypt for the supply of an additional 0.55
bcm/year of gas at a higher price of $4.50/mmbtu. As a result, Egypt stepped up its gas deliveries to
Jordan to 2.9 bcm/year in the second quarter of 2008. The additional gas was supplied at the higher price,
and this price was then applied to all Jordan’s imports of Egyptian gas from the start of 2009 (APRC
2011).
But information from another source seems to imply that prices, which remain confidential, are similar to
those at the Syrian border, namely $5/mmbtu for gas and $2/mmbtu for the Egyptian gas company
transport charge. It provides price variation clauses with ceiling and floor prices (Fattouh and Stern 2011).
The location of Jordan is strategic, and it is possible for Iraqi gas to flow through the AGP through Jordan
from the Akkas field and northern Iraq either down south for liquefaction in Egypt and for onward export,
or up north to Syria, Turkey, and the Nabucco Pipeline to Europe. In either case, Jordan, as a transit
country, would be able to get some gas from these arrangements.
Power Sector
The power market follows a single-buyer model. The National Electric Power Company (NEPCO) the
state-owned transmission company, buys all the power produced by the generating companies (mostly
private sector–owned IPPs) and sells power to the three privately owned distribution companies. NEPCO
also imports gas from Egypt and sells it to the IPPs. The power sector consumes 100 percent of the
domestic production of gas as well as imported gas. Power supply covers nearly 99.9 percent of the
population and per capita annual electricity consumption in 2010 amounts to 2,518 kilowatt hours (kWh).
Installed capacity in 2010 was reported at 3,243 megawatts (MW) consisting of steam turbines (1,098
MW), gas turbines (793 MW), combined-cycle units (1,280 MW), diesel-generating units (54.3 MW),
hydropower units (12 MW), and renewable and others (12 MW).
21
Data are from Mott MacDonald (2010).

GAS SECTOR PROFILES OF ARAB COUNTRIES
31
Generation in 2010 amounted to 14,777 GWh, of which nearly 65 percent was produced from the
combined-cycle units and gas turbines. Steam turbines produced about 34 percent; hydropower stations,
renewable sources, and diesel generators contributed the remaining 1 percent.
Fuel consumption for power generation amounted to 3.270 million tons of oil equivalent (mmtoe) and the
share of natural gas was about 70 percent. The volume of gas used was about 2.54 bcm. The share of gas
in total fuel supply for the power sector in the previous year was higher, at close to 90 percent, because of
the higher volume of import. Electricity sales were reported at 12,843 GWh, of which households had a
share of 41 percent followed by industrial consumers (25 percent), commercial consumers (17 percent),
and others (17 percent).
Peak demand had grown from 1,238 MW in 2000 to 2,670 MW in 2010 at a compound annual growth
rate (CAGR) of 8.0 percent, and energy generation had grown from 7.4 terawatt hours (TWh) to 14.8
TWh at a CAGR of 7.2 percent. Forecasts made on the Web site of the AUPTDE indicate a CAGR of
peak demand at 6.4 percent and of energy generation at 7.2 percent through 2020 (table A1.12).
Table A1.12 Power Demand Forecasts for Jordan
Item 2010 2011 2015 2020 CAGR (%)
Peak demand in MW 2,670 2,812 3,662 4,979 6.4
Energy generation in GWh 14,777 16,045 21,127 29,625 7.2
Source: http://www.auptde.org.
Note: CAGR = compound annual growth rate; GWh = gigawatt hours; MW = megawatts.
Jordan has converted most of its power plants for using gas as fuel, and the planned new thermal plants
are mostly based on gas. But in view of the uncertainty of gas imports, the government is making major
efforts to promote renewable energy and even greater efforts to establish two nuclear power units of 700
1000 MW capacity in the course of this decade. An Estonian company has also been contracted to
establish a thermal power station (600900 MW), which can directly burn oil shale by 2014–15.
Nonetheless, the government is keen to increase its import of gas and for this purpose has also
commissioned a study for a liquefied natural gas (LNG) reception and regasification terminal at Aqaba.22
LNG Import Terminal
The complete cessation of gas supply through the AGP has forced Jordan to import increased volumes of
liquid fuels, thereby incurring substantial additional expenses. In this context the government has decided
to proceed rapidly with the LNG import terminal project. The project is designed to build an LNG
terminal at Aqaba port with an annual throughput capacity of about 5 bcm. It will lease a FSRU (with a
capacity of 127,000 to 170,000 cubic meters) for storing and re-gasifying LNG. These facilities will be
connected to the Jordan gas transmission pipeline which is part of the AGP. The objective is to supply gas
to Jordanian power plants to replace liquid fuels. It is also possible that in future the gas from the LNG
terminal may feed the AGP to supply gas to Syria and Lebanon, thus making Jordan an energy hub. The
22
The section on power is based on info obtained from Arab Union of Producers, Transporters and Distributors of
Electricity (AUPTDE) Web site (http://www.auptde.org), the Annual Report of the Ministry of Energy and Mineral
resources (2009), and the Web site of the National Electric Power Corporation of Jordan
(http://www.nepco.com.jo/eindex.aspx).

GAS SECTOR PROFILES OF ARAB COUNTRIES
32
project will be developed by Aqaba Development Corporation (ADC)23
jointly with Jordan’s Ministry of
Energy and Mineral Resources (MERE). ADC recently issued an announcement seeking expressions of
interest from qualified firms for the construction of the new LNG terminal. It plans to issue tenders to the
prequalified firms for a turn-key implementation of the project. International bidders will be required to
engage a local Jordanian contracting firm, either in the form a joint venture or as subcontractor for at least
25 percent of the value of the contract. As of August 2012, ten firms had been prequalified and RFPs
were expected to be issued shortly. The LNG terminal may be commissioned as early as 2014.24
Figure A1.14 Power Grid Map of Jordan
Source: http://www.nepco.com.jo/eindex.aspx.
Prices
Residential electricity prices per kWh in Jordan ranged from 4.65 cents to 16.07 cents in three slabs—
commercial consumers were charged at 12.27 cents, industrial consumers’ prices ranged from 5.22 cents
to 7.05 cents, and agricultural consumers paid 6.77 cents. This compares with the cost of supply per kWh
of 11.03 cents and fuel cost per kWh of 6.12 cents. Gas is being sold to the power companies at the gas
23
ADC is the main development corporation for the Aqaba Special Economic Zone (ASEZ), a liberalized, low-tax,
duty-free, multisector economic development zone. ADC is a private shareholding company, launched by the
government of Jordan and the Aqaba Special Economic Zone Authority (ASEZA), to transform the ASEZ into a
leading world hub for business and leisure. 24
http://au.ibtimes.com/articles/353313/20120618/jordan-egypt-lng.htm; http://community.nasdaq.com/News/2012-
06/energy-woes-force-jordan-to-import-lng-effective-2014.aspx?storyid=148946#ixzz29DpatVFb.
GAS SECTOR PROFILES OF ARAB COUNTRIES
33
import prices from Egypt ($4.5/mmbtu).25
Due to the nonavailability of Egyptian gas during most of 2011
and 2012, the IPPs had to use liquid fuels, pushing the cost of supply up sharply. According to the annual
report of the Electricity Regulatory Commission for 2011, the average cost of supply in 2011 rose to
21.12 cents/kWh (of which fuel cost accounted for 16.6 cents), while the average retail sales price/kWh in
2011 was around 10 cents.
Gas Demand Forecasts
Mott MacDonald (2010) has projected that the demand for imported gas will grow to 5.6 bcm by 2020
and to 8.1 bcm by 2030. This seems to be reasonable in the light of the power demand forecasts
mentioned above. The possible sources of supply are Egypt, Iraq, and Qatar. The supplies may come
partly as pipeline gas and partly as LNG.
25
This is based on information in the Annual Report 2010 of the Electricity Regulatory Commission of Jordan.
Exchange rate used is: 1 Jordanian dinar = 1,000 fils = $1.47.

Kuwait
Despite a significant level of reserves and production of natural gas, Kuwait has become an importer of
gas. It has an area of 17,820 square kilometers (km2) and a population of 3.4 million.
Figure A1.15 Map of Kuwait
Source: U.S. EIA Web site.
Reserves
Kuwait’s proven oil reserves at the end of 2010 were reported at 101.45 billion barrels (7.3 percent of the
world oil reserves) with a reserves-to-production ratio (RPR) of greater than 100 years. In 2010 it
produced 2.508 million barrels/day (3.1 percent of world oil production) and consumed 0.413 million
barrels/day (0.4 percent of world consumption).
Kuwait’s proven natural gas reserves at the end of 2010 were reported at 1.8 trillion cubic meters (tcm) (1
percent of world reserves) with an RPR of greater than 100 years. Most of the gas is associated, and
therefore the Organization of Petroleum Exporting Countries (OPEC) production quotas act as a
constraint on stepping up the production of gas.
It is important to note that the above levels of reserves do not include a major discovery of free gas made
in 2005 and 2006 of about 1 tcm in deep reservoirs beneath five major oilfields (Sabria, Umm Niqa,
Bahra, Northwest Raudhatain, and Raudhatain). Nor does it include the nonassociated gas reserves
(estimated to contain 140370 bcm) at the offshore Dorra field, which Kuwait shares with Saudi Arabia
and Iran. Many of the new discoveries are geologically more complex, being mainly tight and sour gas
deposits which require more sophisticated and costly development methods.
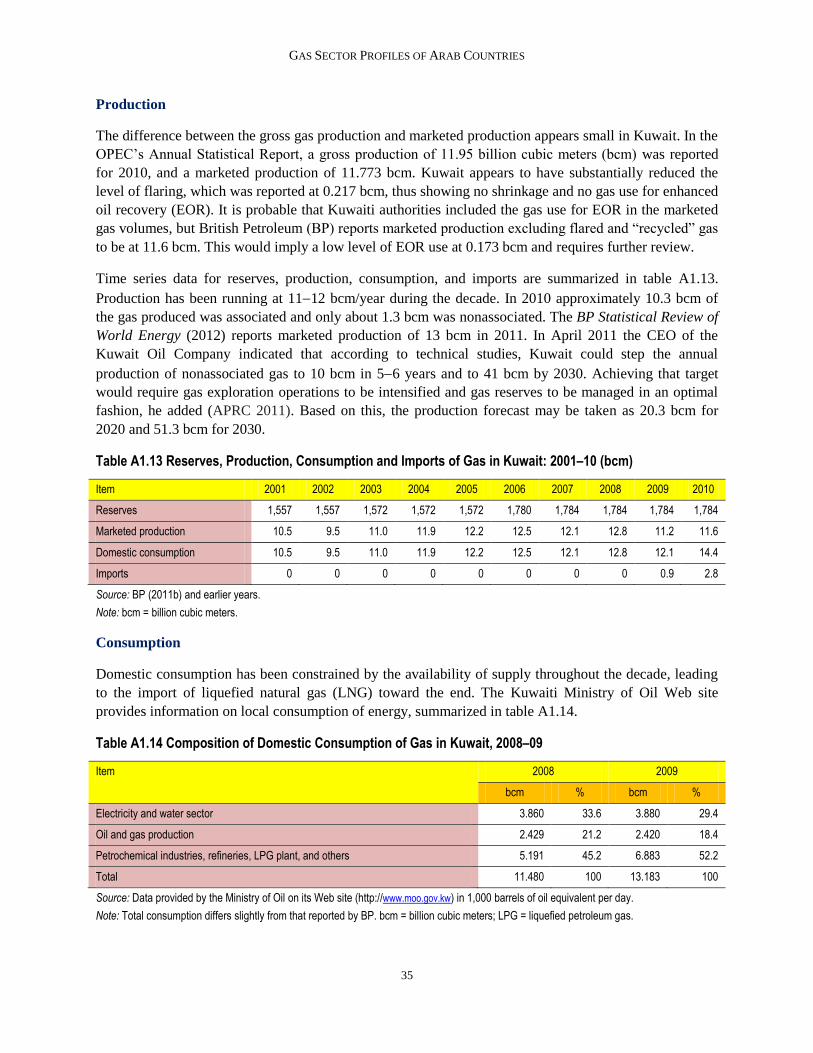
GAS SECTOR PROFILES OF ARAB COUNTRIES
35
Production
The difference between the gross gas production and marketed production appears small in Kuwait. In the
OPEC’s Annual Statistical Report, a gross production of 11.95 billion cubic meters (bcm) was reported
for 2010, and a marketed production of 11.773 bcm. Kuwait appears to have substantially reduced the
level of flaring, which was reported at 0.217 bcm, thus showing no shrinkage and no gas use for enhanced
oil recovery (EOR). It is probable that Kuwaiti authorities included the gas use for EOR in the marketed
gas volumes, but British Petroleum (BP) reports marketed production excluding flared and “recycled” gas
to be at 11.6 bcm. This would imply a low level of EOR use at 0.173 bcm and requires further review.
Time series data for reserves, production, consumption, and imports are summarized in table A1.13.
Production has been running at 1112 bcm/year during the decade. In 2010 approximately 10.3 bcm of
the gas produced was associated and only about 1.3 bcm was nonassociated. The BP Statistical Review of
World Energy (2012) reports marketed production of 13 bcm in 2011. In April 2011 the CEO of the
Kuwait Oil Company indicated that according to technical studies, Kuwait could step the annual
production of nonassociated gas to 10 bcm in 56 years and to 41 bcm by 2030. Achieving that target
would require gas exploration operations to be intensified and gas reserves to be managed in an optimal
fashion, he added (APRC 2011). Based on this, the production forecast may be taken as 20.3 bcm for
2020 and 51.3 bcm for 2030.
Table A1.13 Reserves, Production, Consumption and Imports of Gas in Kuwait: 2001–10 (bcm)
Item 2001 2002 2003 2004 2005 2006 2007 2008 2009 2010
Reserves 1,557 1,557 1,572 1,572 1,572 1,780 1,784 1,784 1,784 1,784
Marketed production 10.5 9.5 11.0 11.9 12.2 12.5 12.1 12.8 11.2 11.6
Domestic consumption 10.5 9.5 11.0 11.9 12.2 12.5 12.1 12.8 12.1 14.4
Imports 0 0 0 0 0 0 0 0 0.9 2.8
Source: BP (2011b) and earlier years.
Note: bcm = billion cubic meters.
Consumption
Domestic consumption has been constrained by the availability of supply throughout the decade, leading
to the import of liquefied natural gas (LNG) toward the end. The Kuwaiti Ministry of Oil Web site
provides information on local consumption of energy, summarized in table A1.14.
Table A1.14 Composition of Domestic Consumption of Gas in Kuwait, 2008–09
Item 2008 2009
bcm % bcm %
Electricity and water sector 3.860 33.6 3.880 29.4
Oil and gas production 2.429 21.2 2.420 18.4
Petrochemical industries, refineries, LPG plant, and others 5.191 45.2 6.883 52.2
Total 11.480 100 13.183 100
Source: Data provided by the Ministry of Oil on its Web site (http://www.moo.gov.kw) in 1,000 barrels of oil equivalent per day.
Note: Total consumption differs slightly from that reported by BP. bcm = billion cubic meters; LPG = liquefied petroleum gas.

GAS SECTOR PROFILES OF ARAB COUNTRIES
36
While the Web site does not explicitly state this, it is fair to conjecture that the volume shown for oil and
gas production probably represents the gas used for EOR.26
While Kuwait is making major efforts to
replace gas with other materials such as nitrogen, carbon dioxide, and water for EOR — a national
priority — these efforts are still experimental and about 1520 percent of gas produced goes for EOR.
Allocation of gas for power generation is also a priority to reduce the use of high-priced oil, which could
be exported at high prices. Inadequate gas and also inadequate capacity have led to serious power
shortages over the past decade.
Power Sector
At the end of 2010 Kuwait had an installed power-generating capacity of 13,383 megawatts (MW),
consisting of 8,970 MW of steam turbines, 3,637 MW of gas turbines, and 776 MW of combined-cycle
plants. Most of the generating units were capable of using oil or gas. Peak demand in 2010 was at 10,890
MW and annual generation was reported at 57,029 gigawatt hours (GWh). Total electricity sales in 2010
amounted to 50,136 GWh, of which residential consumers had a share of 48 percent, followed by
industrial consumers (12 percent), commercial consumers (7 percent), and others (33 percent). During
2000–10 peak demand grew from 6,450 MW to 10.890 MW at a compound annual growth rate (CAGR)
of 5.4 percent, and energy generation grew from 32.3 TWh to 57 TWh at a CAGR of 5.8 percent.27
Actual
demand was much higher, leading to load shedding and unreliable supply especially during summer and
peak periods. The power utility’s forecast in 2010 is given table A1.15.
Table A1.15 Power Demand Forecast for Kuwait through 2020
Item 2010 2011 2015 2020 CAGR (%)
Peak demand MW 10,890 11,716 15,110 22,193 7.38
Energy generation TWh 57,029 61.59 79.203 116.055 7.36
Source: http://www.auptde.org for 2010.
Note: CAGR = compound annual growth rate; TWh = terawatt hours; MW = megawatts.
In 2010 the power sector consumed a total of 15,503 million tons of oil equivalent (mmtoe) of fuel to
produce 57,029 GWh of electricity. Of this the share of natural gas was 5,041 mmtoe or 32.5 percent,
which corresponds to about 5.6 bcm of gas. The share of heavy and light fuel oil was 59.5 percent and 8
percent, respectively.
To meet the forecast loads, Kuwait plans to add, by 2015, 16,000 MW of new capacity to the level of
11,300 MW existing at the end of 2008. The additions would consist of new gas turbines and the
conversion of some existing gas turbines into combined-cycle stations by adding low-pressure steam
boilers to make use of the waste heat. By 2020 a total capacity of about 30,000 MW might be needed. If
gas supply is maintained in the same proportion as is prevalent now, the power sector gas demand would
rise from 5.6 bcm in 2010 to 11.39 bcm/year by 2020; but since most old and new plants are capable of
using gas and liquid fuels, the sector can absorb substantially more gas, if allocated. Assuming 75 percent
of electricity generation is using gas, the gas demand for the power sector by 2020 could be as high as
2627 bcm/year. In a market research report dated November 22, 2011, of Credit Suisse entitled Global
26
The U.S. EIA’s Country Analysis Brief (2011) for Kuwait also speaks of significant consumption of gas for EOR. 27
Based on information from Statistical Year Books in http://www.mew.gov.kw.
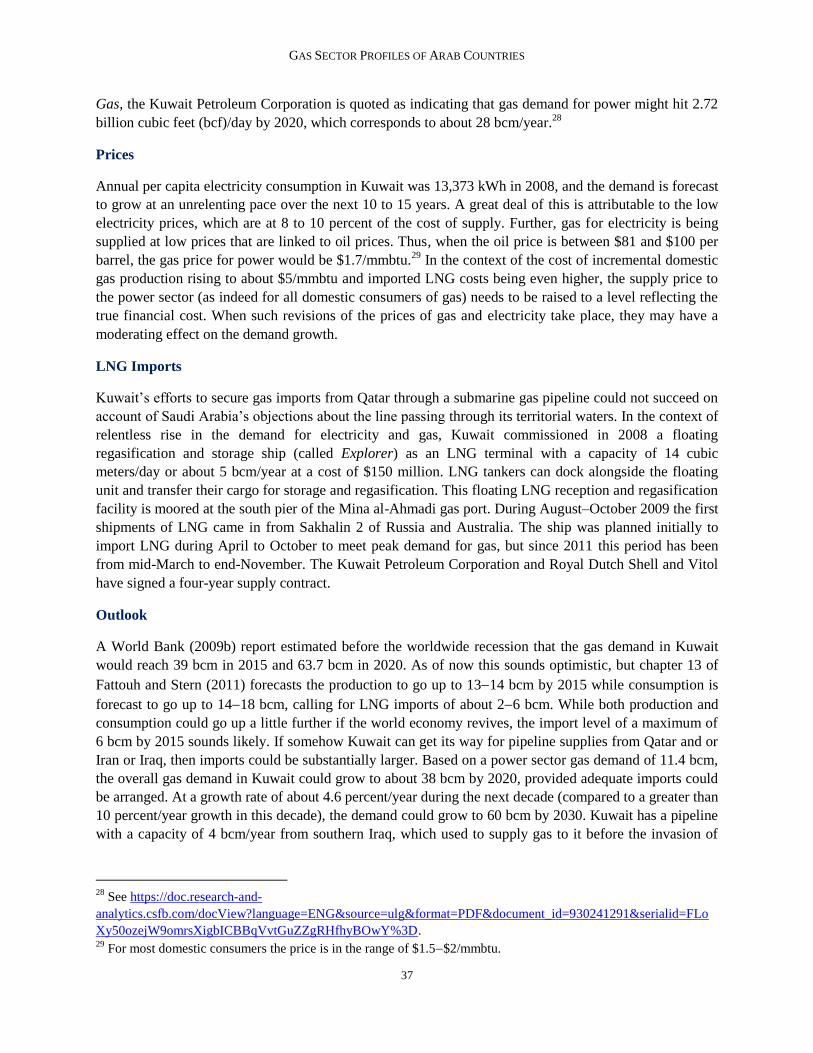
GAS SECTOR PROFILES OF ARAB COUNTRIES
37
Gas, the Kuwait Petroleum Corporation is quoted as indicating that gas demand for power might hit 2.72
billion cubic feet (bcf)/day by 2020, which corresponds to about 28 bcm/year.28
Prices
Annual per capita electricity consumption in Kuwait was 13,373 kWh in 2008, and the demand is forecast
to grow at an unrelenting pace over the next 10 to 15 years. A great deal of this is attributable to the low
electricity prices, which are at 8 to 10 percent of the cost of supply. Further, gas for electricity is being
supplied at low prices that are linked to oil prices. Thus, when the oil price is between $81 and $100 per
barrel, the gas price for power would be $1.7/mmbtu.29
In the context of the cost of incremental domestic
gas production rising to about $5/mmbtu and imported LNG costs being even higher, the supply price to
the power sector (as indeed for all domestic consumers of gas) needs to be raised to a level reflecting the
true financial cost. When such revisions of the prices of gas and electricity take place, they may have a
moderating effect on the demand growth.
LNG Imports
Kuwait’s efforts to secure gas imports from Qatar through a submarine gas pipeline could not succeed on
account of Saudi Arabia’s objections about the line passing through its territorial waters. In the context of
relentless rise in the demand for electricity and gas, Kuwait commissioned in 2008 a floating
regasification and storage ship (called Explorer) as an LNG terminal with a capacity of 14 cubic
meters/day or about 5 bcm/year at a cost of $150 million. LNG tankers can dock alongside the floating
unit and transfer their cargo for storage and regasification. This floating LNG reception and regasification
facility is moored at the south pier of the Mina al-Ahmadi gas port. During August–October 2009 the first
shipments of LNG came in from Sakhalin 2 of Russia and Australia. The ship was planned initially to
import LNG during April to October to meet peak demand for gas, but since 2011 this period has been
from mid-March to end-November. The Kuwait Petroleum Corporation and Royal Dutch Shell and Vitol
have signed a four-year supply contract.
Outlook
A World Bank (2009b) report estimated before the worldwide recession that the gas demand in Kuwait
would reach 39 bcm in 2015 and 63.7 bcm in 2020. As of now this sounds optimistic, but chapter 13 of
Fattouh and Stern (2011) forecasts the production to go up to 1314 bcm by 2015 while consumption is
forecast to go up to 1418 bcm, calling for LNG imports of about 26 bcm. While both production and
consumption could go up a little further if the world economy revives, the import level of a maximum of
6 bcm by 2015 sounds likely. If somehow Kuwait can get its way for pipeline supplies from Qatar and or
Iran or Iraq, then imports could be substantially larger. Based on a power sector gas demand of 11.4 bcm,
the overall gas demand in Kuwait could grow to about 38 bcm by 2020, provided adequate imports could
be arranged. At a growth rate of about 4.6 percent/year during the next decade (compared to a greater than
10 percent/year growth in this decade), the demand could grow to 60 bcm by 2030. Kuwait has a pipeline
with a capacity of 4 bcm/year from southern Iraq, which used to supply gas to it before the invasion of
28
See https://doc.research-and-
analytics.csfb.com/docView?language=ENG&source=ulg&format=PDF&document_id=930241291&serialid=FLo
Xy50ozejW9omrsXigbICBBqVvtGuZZgRHfhyBOwY%3D. 29
For most domestic consumers the price is in the range of $1.5$2/mmbtu.

GAS SECTOR PROFILES OF ARAB COUNTRIES
38
Kuwait by Iraq. It needs to be rehabilitated, but despite agreements signed by both sides in 2004 not much
progress has been made.

Lebanon
With a population of about 4.4 million, an area of 10,450 square kilometers, and a per capita gross
national income of about $5,500, Lebanon has relatively few indigenous energy resources and depends
almost entirely on energy imports.
Gas Reserves
Two- and three-dimensional seismic surveys carried out in recent years suggest the presence of 87
hydrocarbon sources along the Lebanese coastal areas in the Mediterranean Sea. The U.S. Geological
Survey in 2010 estimated the technically recoverable hydrocarbon reserves in the Levant basin region,
which covers 83,000 square kilometers in the eastern Mediterranean) at around 1,689 million barrels of
oil and 122.4 trillion cubic feet (tcf) of gas (3.5 trillion cubic meters, tcm). Significant natural gas
discoveries have been made off the coast of Israel (especially in the Leviathan field), and in 2010 Noble
Energy Limited (a U.S. hydrocarbon exploring company) confirmed the commercial viability of the gas
deposits. In this context, Lebanon accelerated the passage of legislation on offshore oil reserves. It further
planned to divide its offshore area into blocks and carry out international rounds of bidding to award
exploration and production contracts. However, though the law was passed in August 2010, the issuance
of decrees to implement the law has been considerably delayed. Meanwhile, Lebanon has raised the issue
with the United Nations that Israel may be drilling in the exclusive economic zone of Lebanon. Although
Israel and Cyprus have concluded littoral agreements defining their exclusive economic zones, other
parties such as Lebanon, Turkey, and Egypt have raised objections. These territorial disputes inject a great
deal of uncertainty into the exploration and production of gas in these areas.
Gas Imports
Until now Lebanon has not produced any natural gas. However, it was able to receive some imported gas
as a result of the Arab Gas Pipeline (AGP) initiative, in which it played a notable role. Egyptian gas is
delivered by the AGP to the Syrian gas system in Homs. The Syrian gas grid absorbs the gas and supplies
to Lebanon from its own system through a spur line of 12 kilometers (with a 24-inch diameter) off the
Homs-Baniyas mainline. The spur continues for a distance of 34 km within Lebanon to the Beddawi
power station north of Tripoli. This pipeline is known as Gasyle-1.
The 20-year sale-and-purchase agreement signed between Syria and Lebanon in 2001 provided for a
supply of 1.5 million cubic meters per day (or about 0.55 billion cubic meters per year) in the first phase,
to be doubled to 3 million cubic meters per day (or 1.1 bcm per year) in the next phase. However, actual
supply through the line commenced only in late 2009. The supply represented only half the contracted
amount and was provided for only a few months.
The original plan was to construct the Gasyle-2 pipeline (120-km long, 24 inches in diameter) from
Beddawi in the north to the Zahrani power station in the south. Through small spur lines, it would supply
the power stations at Al-Haricha, Zouq, and Jiyyeh, as well as some industrial customers along the way.

GAS SECTOR PROFILES OF ARAB COUNTRIES
40
Imports from Syria would rise to 1.1 bcm/year. This was to be the backbone of a domestic gas
transmission and distribution network. 30
Plans for LNG Import
Deliveries of gas through Gasyle-1 were suspended toward the end of 2010 when Lebanon failed to pay
its bills. In 2011, explosions in the Sinai desert disrupted the supply of gas through the AGP. Since then
there has been no supply of gas through the AGP to Lebanon or Syria. Supply to Jordan resumed through
the AGP in late 2012.
After gas imports by pipeline became unreliable, Lebanon studied the importation of liquefied natural gas
(LNG). It has decided to import LNG through a floating storage and regasification unit (FSRU) about 2
km off the coast of Beddawi with an annual capacity of 3.5 million tons of LNG (or 4.83 bcm of gas).
Based on received expressions of interest, the government has prepared a short list of qualified firms that
will be invited to submit bids for the project. The terminal is set to be operational by 2015. After
regasification, gas will be conveyed by a 2.5 km long pipeline to the gas terminal near the Beddawi power
plant. The government is separately pursuing the construction of a 173-km-long, 36-inch-diameter coastal
pipeline, partly on land and partly under the sea (called Gasyle 2) to convey the gas from Beddawi to
other existing and proposed power stations on the coast. Nineteen companies have been prequalified, and
the construction is expected to start by 2013 and be completed 28 months thereafter (figure A1.16).31
Figure A1.16 The Route of the Gasyle-2 Gas Pipeline through Lebanon
Source: Sleiman 2012.
30
Information in this and the preceding paragraphs is from APRC (2011). 31
This paragraph is based on Sleiman (2012).
GAS SECTOR PROFILES OF ARAB COUNTRIES
41
Note: FSRU= floating storage and regasification unit; CCGT= combined cycle gas turbines; RFO= residual fuel oil.
Under this scheme the winning bidder will build, own, and operate the plant. It will be responsible for
receiving, unloading, storing and re-gasifying the LNG on a tolling basis for delivery to the Ministry of
Energy and Water (MoEW) at the high pressure outlet flange of the FSRU. MoEW will be responsible for
procuring LNG supply to the terminal, and for delivery of re-gasified output to the power plants. As such,
MoEW would enter into a long-term terminal use agreement with the project company, committing
MoEW to pay a monthly capacity reservation fee regardless of actual usage plus a monthly throughput fee
for operating costs incurred for actual usage. The government of Lebanon would stand behind MoEW’s
commitments.
Electricity Sector
According to the information supplied by Electricité du Liban (EDL), the Lebanese power utility, to the
Arab Union for the Production, Transmission, and Distribution of Electricity (AUPTDE), the country’s
power system in 2010 had an installed generation capacity of 2,313 MW (fuel-oil-fired steam turbines,
44.4 percent; diesel-fired combined-cycle units, 37.6 percent; diesel-fired gas turbines, 6.1 percent; and
hydropower units, 11.9 percent), a peak demand of 2,501 MW, and energy generation of 11, 211 GWh
(combined-cycle gas turbines, 49.6 percent; steam turbines, 38.6 percent; hydropower units, 7.5 percent;
and gas turbines 4.3 percent). In addition Lebanon imported 1,249 GWh of electricity in 2010. That year,
its per capita electricity consumption was reported to be 2,492 kWh.
More than 96 percent of the population had access to electricity, and in 2009 there were a total of 1.23
million consumers, more than 98 percent of whom were residential consumers. There were only 6,700
industrial consumers, and the remaining 13,300 consumers were classified as “others” (presumably
including commercial consumers). In terms of electricity consumption, residential consumers accounted
for 39 percent, followed by industrial consumers (27 percent), commercial consumers (17 percent), and
“others” (18 percent).
The cost of producing electricity in Lebanon is very high because of the extensive reliance on imported
diesel and fuel oil for power generation and because of the age and inefficiency of some of the big
generation units. The average cost of generation per kWh as reported to AUPTDE was 14.2 cents in 2010.
The Energy Ministry’s power policy paper for 200932
speaks of a cost per kWh of more than 17.14 cents.
Tariffs for consumers are well below the costs of supply. As a result, EDL shows heavy losses, creating
substantial budget problems for the government.
There is a continuing and serious shortage of power, and supply is unreliable. The power system has
major operating deficiencies. The same policy paper mentions that losses in the power system were 40
percent in 2009, consisting of technical losses (15 percent), commercial losses (20 percent), and
uncollected bills (5 percent). World Bank documents, meanwhile, indicate that technical and commercial
(theft) losses amounted to about 33 percent of the power generated (including power imports from Syria).
Of the 67 percent of the supplied power billed, less than 90 percent was collected. A recent review of a
World Bank–funded project found that the targets for reducing unbilled energy from 18 to 8 percent and
32
Policy Paper for the Electricity Sector, June 2010, Ministry of Energy and Water available at
http://www.tayyar.org/tayyar/temp/EDL_startegy.pdf.

GAS SECTOR PROFILES OF ARAB COUNTRIES
42
reducing technical losses from 15 to 10 percent had not been achieved by 2012 and might take another
two years to achieve.33
In 2009, the power system had a total of 1,427 km of transmission lines at 400 kV, 220 kV, 150 kV, and
66 kV, as well as a relatively modern load-dispatch center built in 2006. Lebanon is electrically
interconnected with Syria through a 220 kV Tartous–Deir Nbouh line in the north of Lebanon, a double-
circuit 66 kV Dimas–Anjar line in the center-east part of the country, and a 400 kV line from Dimas to
Kesara. Imports from Syria began in 1995 and have since tripled. In some years, power is also imported
from Egypt through the above-mentioned high-voltage lines.
The distribution system includes 12,000 km of overhead and underground lines (33 kV, 20 kV, 15 kV, 11
kV, and 5 kV) and 15,000 transformers. Despite some rehabilitation, the system has a high level of
technical losses, calling for further action.
Based on the government’s 2008 generation and transmission master plan, the World Bank (2010c) made
the following forecast of power demand (table A1.16).
Table A1.16 World Bank Electricity Demand Forecast
Item 2008 2010 2020 2030
Peak demand MW 2,309 2,403 3,059 3,875
Energy demand TWh 10.15 14.9 18.9 24.0
Source: World Bank 2010c.
Note: Energy for 2010 includes import of 1.25 TWh.
Actual peak demand in 2010 was slightly higher, at 2,510 MW, and actual energy demand was lower, at
12.46 TWh. Nevertheless, EDL has reported to AUPTDE the following somewhat optimistic forecast
(table A1.17).
Table A1.17 Electricity Demand Forecast of EDL (2010)
Item 2010 2011 2015 2020
Peak demand MW 2,510 2,610 3,054 3,715
Energy demand TWh 12.46 16.24 18.99 23.11
Source: www.auptde.org.
Gas Demand Forecasts
The key component of Lebanon’s energy strategy is to replace liquid fuels used in the power sector with
natural gas imported through pipeline or as LNG. Some existing and future industries, such as cement,
could switch to gas. However, extensive reticulation of gas for public supply is not considered to be
economic. Annual consumption of gas during 2009–12 had been well below 0.5 bcm because supply
through the AGP has been intermittent. According to the World Bank forecast cited above, gas demand
would increase from 0.9 bcm in 2010 to 2.7 bcm in 2020 and to 4.0 bcm in 2030. Fattouh and Stern
(2011) suggest that gas demand could rise to 5 bcm per year by 2015. Sleiman (2012) indicates that the
proposal to import LNG is based on the forecast that demand for LNG would rise to 1.2 million tons (1.66
33
Emergency Power Sector Reform Capacity Reinforcement Project, World Bank, February 2007.
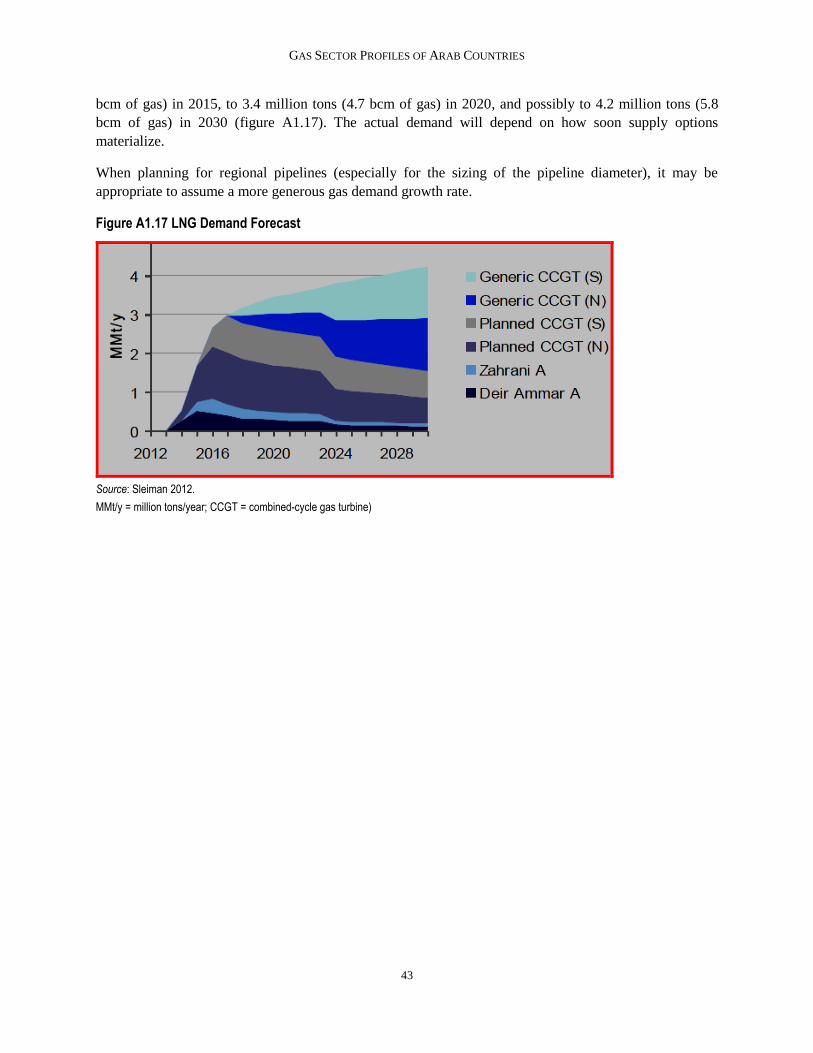
GAS SECTOR PROFILES OF ARAB COUNTRIES
43
bcm of gas) in 2015, to 3.4 million tons (4.7 bcm of gas) in 2020, and possibly to 4.2 million tons (5.8
bcm of gas) in 2030 (figure A1.17). The actual demand will depend on how soon supply options
materialize.
When planning for regional pipelines (especially for the sizing of the pipeline diameter), it may be
appropriate to assume a more generous gas demand growth rate.
Figure A1.17 LNG Demand Forecast
Source: Sleiman 2012.
MMt/y = million tons/year; CCGT = combined-cycle gas turbine)

Libya
With a vast area (1.76 million square kilometers, km2), a long coast line (2,000 km), and a sizeable
population (6.3 million), Libya is the fourth-largest country in Africa and possesses considerable oil and
gas resources.
Reserves
The country’s proven oil reserves were estimated at 46.4 billion barrels (3.4 percent of the world
reserves). Its proven gas reserves at the end of 2010 were reported at 1.5 trillion cubic meters (tcm) (0.8
percent of world reserves) (BP 2011b). About 55 percent of the gas reserves are nonassociated gas, while
45 percent of the reserves are associated gas (Oil and Gas Directory Middle East 2011). Though the
reserve level was hovering around 1.3 to 1.5 tcm during 2000–10, most observers believe the volume of
proven reserves will increase notably in the near future based on recently commissioned exploration
activities. It is also believed, based on the geological, seismic, and geochemical studies carried out by
state-owned oil companies and foreign operators, that Libya has at least another 3.26 tcm of potential gas
reserves to be proven (Fattouh and Stern 2011, chapter 2).
Production
During 2000–10 gross gas production increased from 10.2 bcm to 30.3 billion cubic meters (bcm) at a
compound annual growth rate (CAGR) of 11.5 percent, while the marketed gas volumes increased from
5.9 bcm to 16.8 bcm at a CAGR of 11.0 percent The difference in 2010 was accounted for by flared gases
(11.6 percent), gas used for reinjection in oil wells (11.2 percent), and shrinkage (21.8 percent) (table
A1.18).
Table A1.18 Gas Production Data for Libya, 2000–10 (bcm)
Item 2000 2005 2006 2007 2008 2009 2010
Gross gas production 10.2 21.9 27.1 29.2 30.3 29.3 30.3
Marketed production 5.9 11.3 13.2 15.3 15.9 15.9 16.8
Flared or vented gases 1.4 2.6 3.0 2.9 3.9 3.3 3.5
Gas reinjected for higher oil recovery 2.5 3.5 3.6 3.4 3.5 3.6 3.4
Shrinkage 0.4 4.5 7.3 7.6 7.0 6.5 6.6
Total gas exports 0.77 5.47 8.41 9.96 10.4 9.89 9.97
Domestic consumption 5.13 5.83 4.79 5.34 5.50 6.01 6.03
Source: OPEC annual statistical bulletins; and APRC 2011.
Note: Export data for 2000 actually relates to 2001. BP reports a marketed production of 15.8 bcm in 2010 and an export of 9.75 bcm for 2010,
of which pipeline exports amounted to 9.41 bcm.
Gas production increased significantly after the completion of the West Libyan Gas project and the
submarine gas pipeline from Mellitah Libya to Gela in Sicily in 2004 and 2005 (details given later).
Libyan gas production consists of both associated and nonassociated gas. Since the commissioning of the
West Libyan Gas project, the share of nonassociated (or free) gas had been rising and in 2008 it stood at

GAS SECTOR PROFILES OF ARAB COUNTRIES
45
58.5 percent of the total gas production. Production forecasts made by the Libyan National Oil
Corporation (LNOC) indicate that this share will be maintained through 2013.
Consumption
Time series data on domestic gas consumption and using consistent definitions are difficult to obtain.
Various sources use definitions that include and exclude different items. The Country Analysis Brief of
the Department of Energy (DOE) of the U.S. Energy Information Agency (EIA) adopts the common-
sense approach that the difference between marketed production and exports represents domestic
consumption (figure A1.18). On this basis, domestic consumption was somewhat stagnant, hovering
around 5.5 bcm a year, while marketed production and exports were registering notable increases during
2000–10. This has been attributed to inadequate domestic gas transportation infrastructure, which is likely
to be improved in the near future when planned pipelines and proposed combined-cycle power plants
materialize.
Figure A1.18 Marketed Production, Exports, and Consumption of Gas in Libya
Source: U.S. EIA.
Note: 1 cubic meter = 35.3 cubic feet.
It was estimated that in 2009 (in relation to the volume of gross production) about 42.5 percent was
exported to Italy, 13 percent went for domestic consumption, 12.4 percent was used for reinjection, and
10.1 percent was flared. In addition, 9.6 percent went for auxiliary or self-consumption of the oil and gas
industry, 8.8 percent went for the el-Brega liquefied natural gas (LNG) and petrochemical plants, and the
remaining 3.6 percent went for the production of condensates. The estimate further showed that 65.6
percent of the domestic consumption was by power and water desalination plants followed by the iron and
steel industry (17.6 percent), other industries (15.6 percent), and other miscellaneous consumers (1.2
percent) (Fattouh and Stern 2011, chapter 2).
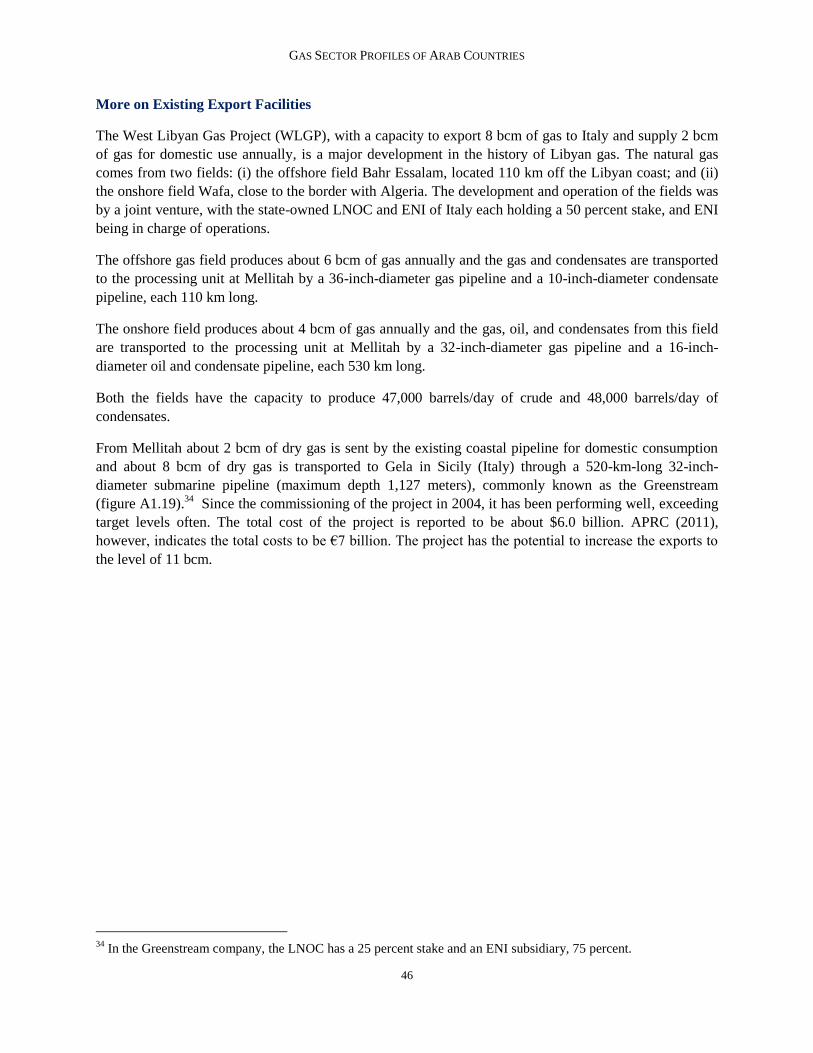
GAS SECTOR PROFILES OF ARAB COUNTRIES
46
More on Existing Export Facilities
The West Libyan Gas Project (WLGP), with a capacity to export 8 bcm of gas to Italy and supply 2 bcm
of gas for domestic use annually, is a major development in the history of Libyan gas. The natural gas
comes from two fields: (i) the offshore field Bahr Essalam, located 110 km off the Libyan coast; and (ii)
the onshore field Wafa, close to the border with Algeria. The development and operation of the fields was
by a joint venture, with the state-owned LNOC and ENI of Italy each holding a 50 percent stake, and ENI
being in charge of operations.
The offshore gas field produces about 6 bcm of gas annually and the gas and condensates are transported
to the processing unit at Mellitah by a 36-inch-diameter gas pipeline and a 10-inch-diameter condensate
pipeline, each 110 km long.
The onshore field produces about 4 bcm of gas annually and the gas, oil, and condensates from this field
are transported to the processing unit at Mellitah by a 32-inch-diameter gas pipeline and a 16-inch-
diameter oil and condensate pipeline, each 530 km long.
Both the fields have the capacity to produce 47,000 barrels/day of crude and 48,000 barrels/day of
condensates.
From Mellitah about 2 bcm of dry gas is sent by the existing coastal pipeline for domestic consumption
and about 8 bcm of dry gas is transported to Gela in Sicily (Italy) through a 520-km-long 32-inch-
diameter submarine pipeline (maximum depth 1,127 meters), commonly known as the Greenstream
(figure A1.19).34
Since the commissioning of the project in 2004, it has been performing well, exceeding
target levels often. The total cost of the project is reported to be about $6.0 billion. APRC (2011),
however, indicates the total costs to be €7 billion. The project has the potential to increase the exports to
the level of 11 bcm.
34
In the Greenstream company, the LNOC has a 25 percent stake and an ENI subsidiary, 75 percent.
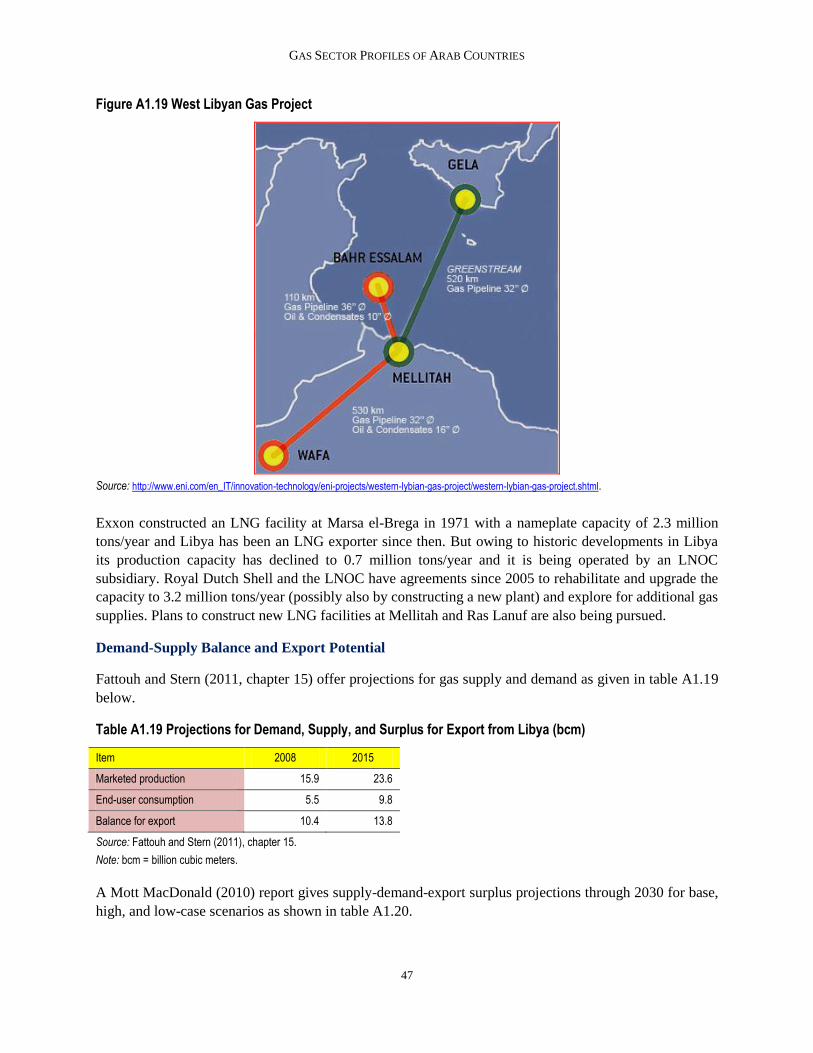
GAS SECTOR PROFILES OF ARAB COUNTRIES
47
Figure A1.19 West Libyan Gas Project
Source: http://www.eni.com/en_IT/innovation-technology/eni-projects/western-lybian-gas-project/western-lybian-gas-project.shtml.
Exxon constructed an LNG facility at Marsa el-Brega in 1971 with a nameplate capacity of 2.3 million
tons/year and Libya has been an LNG exporter since then. But owing to historic developments in Libya
its production capacity has declined to 0.7 million tons/year and it is being operated by an LNOC
subsidiary. Royal Dutch Shell and the LNOC have agreements since 2005 to rehabilitate and upgrade the
capacity to 3.2 million tons/year (possibly also by constructing a new plant) and explore for additional gas
supplies. Plans to construct new LNG facilities at Mellitah and Ras Lanuf are also being pursued.
Demand-Supply Balance and Export Potential
Fattouh and Stern (2011, chapter 15) offer projections for gas supply and demand as given in table A1.19
below.
Table A1.19 Projections for Demand, Supply, and Surplus for Export from Libya (bcm)
Item 2008 2015
Marketed production 15.9 23.6
End-user consumption 5.5 9.8
Balance for export 10.4 13.8
Source: Fattouh and Stern (2011), chapter 15.
Note: bcm = billion cubic meters.
A Mott MacDonald (2010) report gives supply-demand-export surplus projections through 2030 for base,
high, and low-case scenarios as shown in table A1.20.
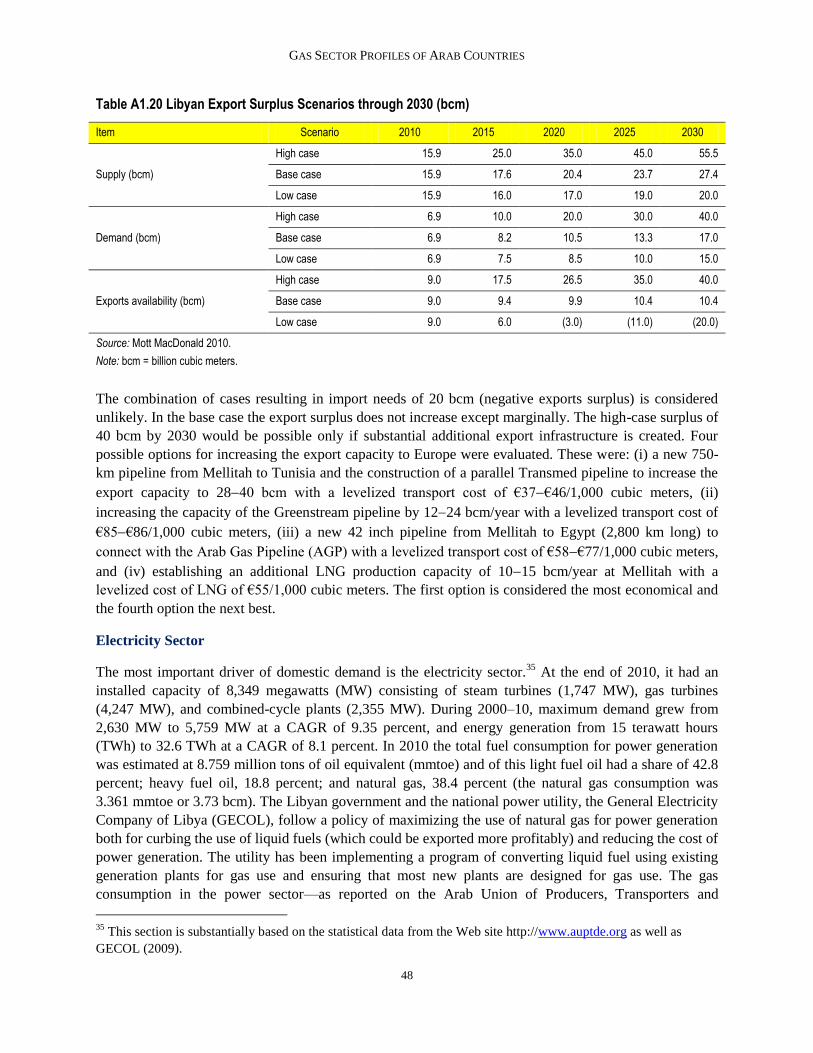
GAS SECTOR PROFILES OF ARAB COUNTRIES
48
Table A1.20 Libyan Export Surplus Scenarios through 2030 (bcm)
Item Scenario 2010 2015 2020 2025 2030
Supply (bcm)
High case 15.9 25.0 35.0 45.0 55.5
Base case 15.9 17.6 20.4 23.7 27.4
Low case 15.9 16.0 17.0 19.0 20.0
Demand (bcm)
High case 6.9 10.0 20.0 30.0 40.0
Base case 6.9 8.2 10.5 13.3 17.0
Low case 6.9 7.5 8.5 10.0 15.0
Exports availability (bcm)
High case 9.0 17.5 26.5 35.0 40.0
Base case 9.0 9.4 9.9 10.4 10.4
Low case 9.0 6.0 (3.0) (11.0) (20.0)
Source: Mott MacDonald 2010.
Note: bcm = billion cubic meters.
The combination of cases resulting in import needs of 20 bcm (negative exports surplus) is considered
unlikely. In the base case the export surplus does not increase except marginally. The high-case surplus of
40 bcm by 2030 would be possible only if substantial additional export infrastructure is created. Four
possible options for increasing the export capacity to Europe were evaluated. These were: (i) a new 750-
km pipeline from Mellitah to Tunisia and the construction of a parallel Transmed pipeline to increase the
export capacity to 2840 bcm with a levelized transport cost of €37€46/1,000 cubic meters, (ii)
increasing the capacity of the Greenstream pipeline by 1224 bcm/year with a levelized transport cost of
€85€86/1,000 cubic meters, (iii) a new 42 inch pipeline from Mellitah to Egypt (2,800 km long) to
connect with the Arab Gas Pipeline (AGP) with a levelized transport cost of €58€77/1,000 cubic meters,
and (iv) establishing an additional LNG production capacity of 1015 bcm/year at Mellitah with a
levelized cost of LNG of €55/1,000 cubic meters. The first option is considered the most economical and
the fourth option the next best.
Electricity Sector
The most important driver of domestic demand is the electricity sector.35
At the end of 2010, it had an
installed capacity of 8,349 megawatts (MW) consisting of steam turbines (1,747 MW), gas turbines
(4,247 MW), and combined-cycle plants (2,355 MW). During 2000–10, maximum demand grew from
2,630 MW to 5,759 MW at a CAGR of 9.35 percent, and energy generation from 15 terawatt hours
(TWh) to 32.6 TWh at a CAGR of 8.1 percent. In 2010 the total fuel consumption for power generation
was estimated at 8.759 million tons of oil equivalent (mmtoe) and of this light fuel oil had a share of 42.8
percent; heavy fuel oil, 18.8 percent; and natural gas, 38.4 percent (the natural gas consumption was
3.361 mmtoe or 3.73 bcm). The Libyan government and the national power utility, the General Electricity
Company of Libya (GECOL), follow a policy of maximizing the use of natural gas for power generation
both for curbing the use of liquid fuels (which could be exported more profitably) and reducing the cost of
power generation. The utility has been implementing a program of converting liquid fuel using existing
generation plants for gas use and ensuring that most new plants are designed for gas use. The gas
consumption in the power sector—as reported on the Arab Union of Producers, Transporters and
35
This section is substantially based on the statistical data from the Web site http://www.auptde.org as well as
GECOL (2009).
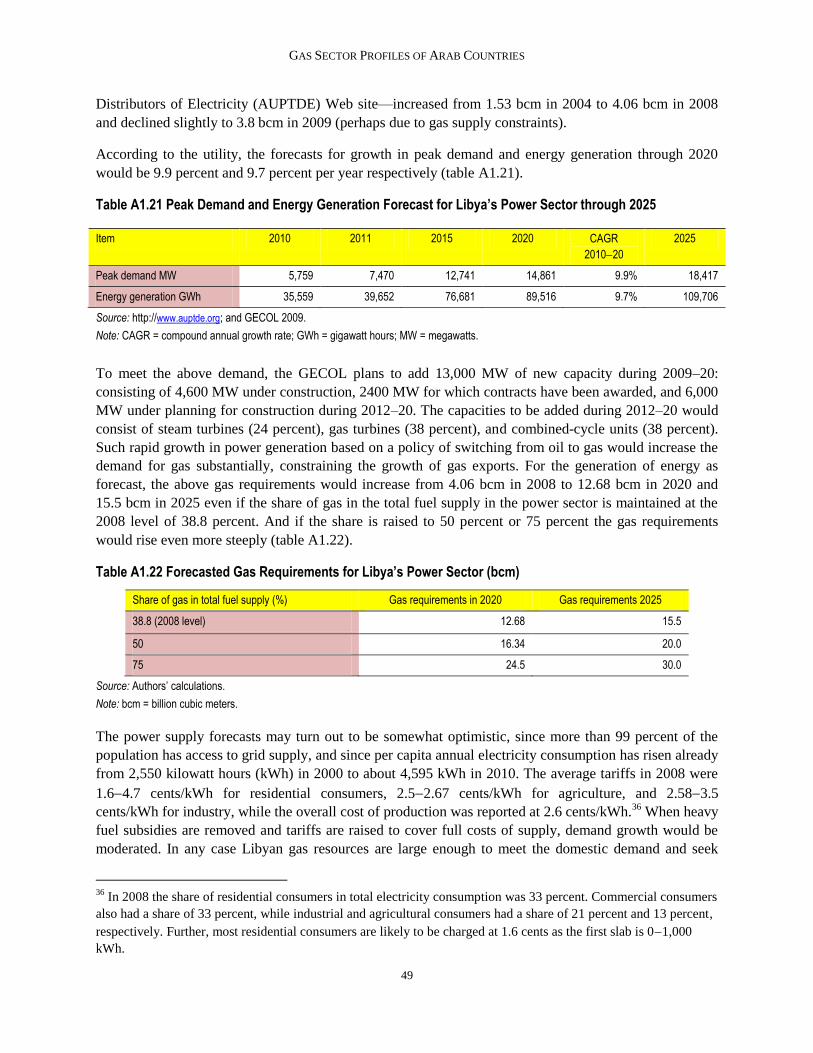
GAS SECTOR PROFILES OF ARAB COUNTRIES
49
Distributors of Electricity (AUPTDE) Web site—increased from 1.53 bcm in 2004 to 4.06 bcm in 2008
and declined slightly to 3.8 bcm in 2009 (perhaps due to gas supply constraints).
According to the utility, the forecasts for growth in peak demand and energy generation through 2020
would be 9.9 percent and 9.7 percent per year respectively (table A1.21).
Table A1.21 Peak Demand and Energy Generation Forecast for Libya’s Power Sector through 2025
Source: http://www.auptde.org; and GECOL 2009.
Note: CAGR = compound annual growth rate; GWh = gigawatt hours; MW = megawatts.
To meet the above demand, the GECOL plans to add 13,000 MW of new capacity during 2009–20:
consisting of 4,600 MW under construction, 2400 MW for which contracts have been awarded, and 6,000
MW under planning for construction during 2012–20. The capacities to be added during 2012–20 would
consist of steam turbines (24 percent), gas turbines (38 percent), and combined-cycle units (38 percent).
Such rapid growth in power generation based on a policy of switching from oil to gas would increase the
demand for gas substantially, constraining the growth of gas exports. For the generation of energy as
forecast, the above gas requirements would increase from 4.06 bcm in 2008 to 12.68 bcm in 2020 and
15.5 bcm in 2025 even if the share of gas in the total fuel supply in the power sector is maintained at the
2008 level of 38.8 percent. And if the share is raised to 50 percent or 75 percent the gas requirements
would rise even more steeply (table A1.22).
Table A1.22 Forecasted Gas Requirements for Libya’s Power Sector (bcm)
Share of gas in total fuel supply (%) Gas requirements in 2020 Gas requirements 2025
38.8 (2008 level) 12.68 15.5
50 16.34 20.0
75 24.5 30.0
Source: Authors’ calculations.
Note: bcm = billion cubic meters.
The power supply forecasts may turn out to be somewhat optimistic, since more than 99 percent of the
population has access to grid supply, and since per capita annual electricity consumption has risen already
from 2,550 kilowatt hours (kWh) in 2000 to about 4,595 kWh in 2010. The average tariffs in 2008 were
1.64.7 cents/kWh for residential consumers, 2.52.67 cents/kWh for agriculture, and 2.583.5
cents/kWh for industry, while the overall cost of production was reported at 2.6 cents/kWh.36
When heavy
fuel subsidies are removed and tariffs are raised to cover full costs of supply, demand growth would be
moderated. In any case Libyan gas resources are large enough to meet the domestic demand and seek
36
In 2008 the share of residential consumers in total electricity consumption was 33 percent. Commercial consumers
also had a share of 33 percent, while industrial and agricultural consumers had a share of 21 percent and 13 percent,
respectively. Further, most residential consumers are likely to be charged at 1.6 cents as the first slab is 01,000
kWh.
Item 2010 2011 2015 2020 CAGR
201020
2025
Peak demand MW 5,759 7,470 12,741 14,861 9.9% 18,417
Energy generation GWh 35,559 39,652 76,681 89,516 9.7% 109,706

GAS SECTOR PROFILES OF ARAB COUNTRIES
50
export growth, so long as policies for attracting investment in exploration and production are sound and
transparent. Also, there is an immediate and cost-effective potential for increasing gas supply by
eliminating extensive gas flaring.
Gas pricing
There is a very large gap between the prices that developers can get in the export markets and the
government-controlled price for gas for domestic consumption. While prices to Europe (cost, insurance,
and freight) varied from $3.83$12.61 per million British thermal units (mmbtu) during 1985 to 2008,
domestic gas prices have remained at 1720 cents/mmbtu. Thus developers are not motivated to develop
resources for domestic consumption. This huge artificial gap needs to be narrowed down for developers to
develop resources both for export and for domestic use. Unless solvent domestic demand is met to a
reasonable extent, large-volume exports cannot be sustained against public discontent. Pricing of gas and
electricity is thus a key issue to be resolved to arrive at a desirable balance between domestic and export
demands.
Scope for New Pipelines and Exports
Apart from increasing gas exports to the European Union (EU) through the existing and planned facilities
described earlier, Libya could effectively support efforts to promote regional gas trade. First, it could
follow up on the Mellitah-Gabes pipeline to Tunisia, which is being developed by a Tunisian-Libyan joint
venture, Joint Gas (266 km long and 24 inches in diameter). Joint Gas set up to construct and operate the
pipeline on a build-operate-own concession agreement. This pipeline may be fed with gas from the
offshore November 7th block jointly owned by Libya and Tunisia. The capacity of the line will be 1-2
bcm/year. In June 2006 it was announced that Joint Gas had awarded a contract for engineering
consulting services to the British firm, Penspen. In August 2006, Joint Gas approved a budget of $250
million for the project. Second, gas interconnection to Egypt would enable Libya to export gas to the
Mashreq countries (such as Jordan, Syria, Palestine, and Lebanon), though it is not clear whether Iraq
might be a better source for them than the faraway Libya. Perhaps it could export gas to Egypt to help the
latter solve the problem of balancing its domestic needs and export commitments. On the whole Libya’s
logical market seems to be the EU. In any case, establishing large LNG plants at Mellitah, El-Brega, and
Ras Lanuf could enable Libya to supply to anybody in the world including regional neighbors with a sea
coast.

Morocco
Morocco is a transit country for the Pedro Duran Farrell gas pipeline (also known as the Gazoduc
Maghreb Europe [GME] pipeline) from Algeria to Spain. With an area of 710,000 square kilometers
(km2) and a population of 33.6 million, Morocco has only very modest energy resource endowments and
is dependent on imports for more than 92 percent of its primary energy needs. Its primary energy
consumption has been rising rapidly (nearly tripling in the period 19802008), and is further expected to
rise through 2020. The steep rise in the imported energy costs and energy security concerns have led the
government to an energy strategy focused on the promotion of gas, coal, and renewable energy sources to
diversify the primary energy mix.
Reserves
Its proven crude and condensate reserves are estimated to be slightly under a million barrels by
independent sources, though official sources indicated a higher figure of 1.9 billion barrels some time
ago. In addition, Morocco has substantial oil shale reserves: the oil in place is conservatively estimated at
around 5055 billion barrels. Its oil and condensate production in 2010 ran at 206 barrels/day (or 0.0753
million barrels/year), compared to its import of 38.43 million barrels of crude.
Its proven associated and nonassociated gas reserves at the end of 2011 were estimated at 1.5 billion cubic
meters (bcm). The Oil and Gas Journal reported a reserve of 1.481.54 bcm in 2009; Wood Mackenzie,
however, indicates a reserve estimate of 4.9 bcm as of January 2010 (including certain new discoveries in
2009). The U.S. Energy Information Agency’s (EIA’s) World Shale Gas Report (2011) places the
technically recoverable reserves of shale gas in Morocco at 11 trillion cubic feet (tcf) (or 312 bcm).
Production and Consumption
Natural gas production has fluctuated greatly in recent years (table A1.23). The authorities are
nevertheless hoping that gas production will start increasing again in the future thanks to the various
natural gas discoveries made in recent years.
Table A1.23 Natural Gas Production in Morocco, 2004–10 (million cubic meters)
Item 2004 2005 2006 2007 2008 2009 2010
Natural gas production in million cubic meters 55.9 39.5 56.4 60.3 49.6 41.2 49.9
Natural gas consumption in million cubic meters 50 421 532 600 592 651 703
Source: Web site of the Ministry of Energy and Mines, http://www.mem.gov.ma.
Annual natural gas consumption was hovering around 50 million cubic meters until 2004, and increased
sharply in 2005 and 2006 with the commissioning of a 384 megawatts (MW) combined-cycle unit using
natural gas as fuel, and further increased to 703 million cubic meters by 2010. The share of natural gas in
total energy consumption rose from 0.5 percent in 2002 to 3.9 percent in 2010.37
The source of gas for
consumption in excess of production is the transit fees (or royalty) paid in kind partially for the Pedro
37
Total energy consumption increased from 10.4 mmtoe in 2002 to 16.5 mmtoe in 2010.
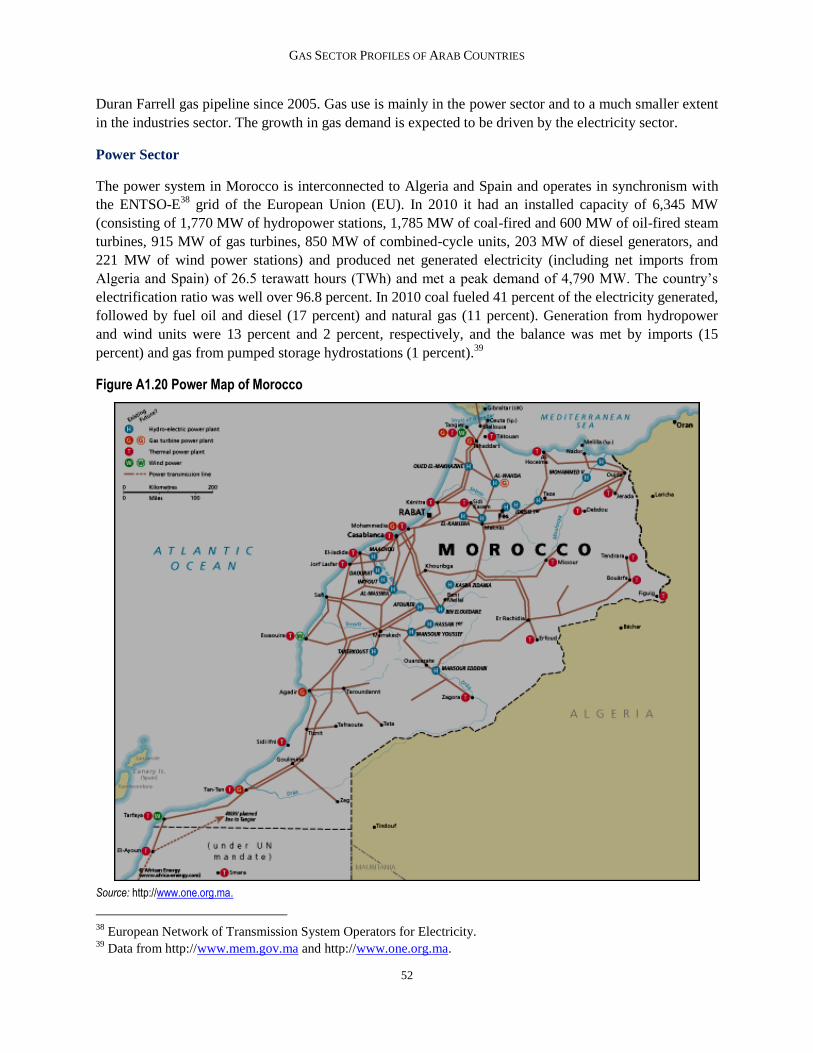
GAS SECTOR PROFILES OF ARAB COUNTRIES
52
Duran Farrell gas pipeline since 2005. Gas use is mainly in the power sector and to a much smaller extent
in the industries sector. The growth in gas demand is expected to be driven by the electricity sector.
Power Sector
The power system in Morocco is interconnected to Algeria and Spain and operates in synchronism with
the ENTSO-E38
grid of the European Union (EU). In 2010 it had an installed capacity of 6,345 MW
(consisting of 1,770 MW of hydropower stations, 1,785 MW of coal-fired and 600 MW of oil-fired steam
turbines, 915 MW of gas turbines, 850 MW of combined-cycle units, 203 MW of diesel generators, and
221 MW of wind power stations) and produced net generated electricity (including net imports from
Algeria and Spain) of 26.5 terawatt hours (TWh) and met a peak demand of 4,790 MW. The country’s
electrification ratio was well over 96.8 percent. In 2010 coal fueled 41 percent of the electricity generated,
followed by fuel oil and diesel (17 percent) and natural gas (11 percent). Generation from hydropower
and wind units were 13 percent and 2 percent, respectively, and the balance was met by imports (15
percent) and gas from pumped storage hydrostations (1 percent).39
Figure A1.20 Power Map of Morocco
Source: http://www.one.org.ma.
38
European Network of Transmission System Operators for Electricity. 39
Data from http://www.mem.gov.ma and http://www.one.org.ma.
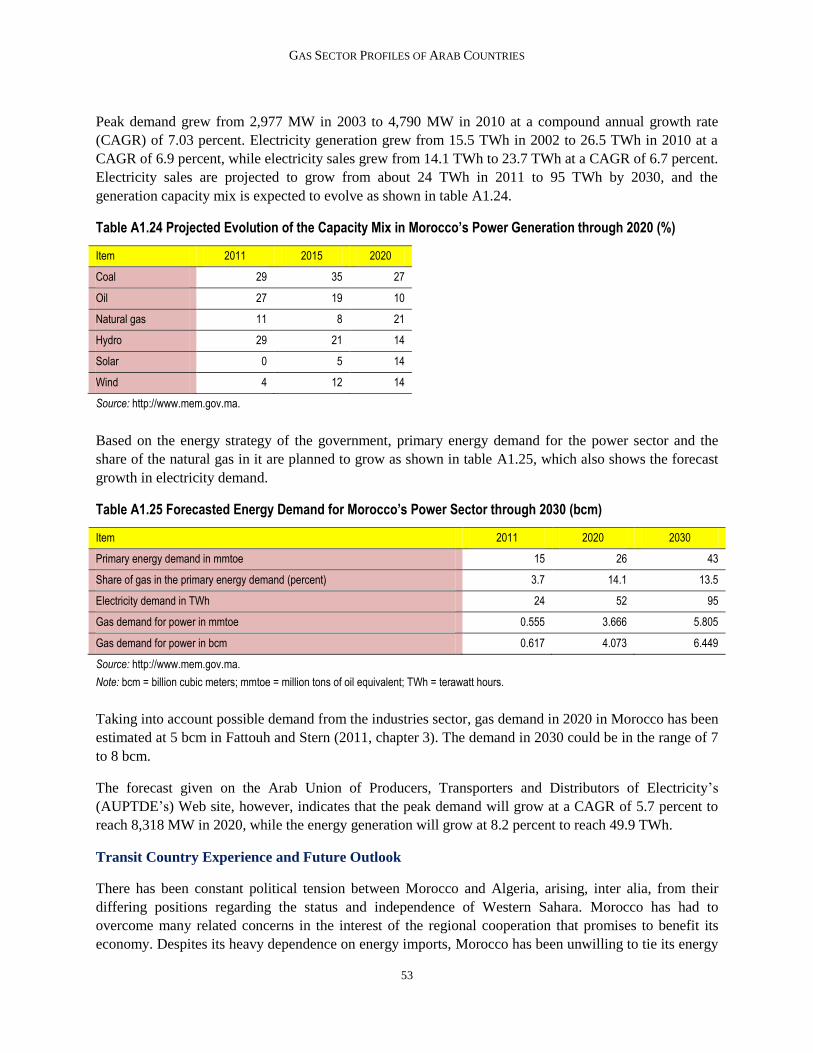
GAS SECTOR PROFILES OF ARAB COUNTRIES
53
Peak demand grew from 2,977 MW in 2003 to 4,790 MW in 2010 at a compound annual growth rate
(CAGR) of 7.03 percent. Electricity generation grew from 15.5 TWh in 2002 to 26.5 TWh in 2010 at a
CAGR of 6.9 percent, while electricity sales grew from 14.1 TWh to 23.7 TWh at a CAGR of 6.7 percent.
Electricity sales are projected to grow from about 24 TWh in 2011 to 95 TWh by 2030, and the
generation capacity mix is expected to evolve as shown in table A1.24.
Table A1.24 Projected Evolution of the Capacity Mix in Morocco’s Power Generation through 2020 (%)
Item 2011 2015 2020
Coal 29 35 27
Oil 27 19 10
Natural gas 11 8 21
Hydro 29 21 14
Solar 0 5 14
Wind 4 12 14
Source: http://www.mem.gov.ma.
Based on the energy strategy of the government, primary energy demand for the power sector and the
share of the natural gas in it are planned to grow as shown in table A1.25, which also shows the forecast
growth in electricity demand.
Table A1.25 Forecasted Energy Demand for Morocco’s Power Sector through 2030 (bcm)
Item 2011 2020 2030
Primary energy demand in mmtoe 15 26 43
Share of gas in the primary energy demand (percent) 3.7 14.1 13.5
Electricity demand in TWh 24 52 95
Gas demand for power in mmtoe 0.555 3.666 5.805
Gas demand for power in bcm 0.617 4.073 6.449
Source: http://www.mem.gov.ma.
Note: bcm = billion cubic meters; mmtoe = million tons of oil equivalent; TWh = terawatt hours.
Taking into account possible demand from the industries sector, gas demand in 2020 in Morocco has been
estimated at 5 bcm in Fattouh and Stern (2011, chapter 3). The demand in 2030 could be in the range of 7
to 8 bcm.
The forecast given on the Arab Union of Producers, Transporters and Distributors of Electricity’s
(AUPTDE’s) Web site, however, indicates that the peak demand will grow at a CAGR of 5.7 percent to
reach 8,318 MW in 2020, while the energy generation will grow at 8.2 percent to reach 49.9 TWh.
Transit Country Experience and Future Outlook
There has been constant political tension between Morocco and Algeria, arising, inter alia, from their
differing positions regarding the status and independence of Western Sahara. Morocco has had to
overcome many related concerns in the interest of the regional cooperation that promises to benefit its
economy. Despites its heavy dependence on energy imports, Morocco has been unwilling to tie its energy

GAS SECTOR PROFILES OF ARAB COUNTRIES
54
future to imports from Algeria. Thus Algerian gas had to be sold to Spanish buyers at the Algerian-
Moroccan border and the pipeline section had to constructed and owned only by European buyers and
nominally Morocco and not by Algeria. Under the gas export arrangements, Morocco was given a transit
fee calculated at 7 percent of the throughput of gas, which could be drawn in cash or kind or both. The
transit fee gas volumes for the period from 2002 to 2010 are shown in table A1.26.
Table A1.26 Transit Fee Gas Volumes in Morocco, 2002–10 (million cubic meters)
Item 2002 2003 2004 2005 2006 2007 2008 2009 2010
Transit fee volume in million cubic meters 613 611 692 897 785 757 813 658 664
Source: http://www.mem.gov.ma.
Until 2004 Morocco chose to get the transit fees in cash equivalents only and was reluctant to use
Algerian gas. With the commissioning of an independent power producer (IPP)-owned combined-cycle
plant, it reluctantly started claiming transit fees partly in kind and partly in cash. Its marked reluctance to
commit to the import of any gas from Algeria (other than the gas as transit fee) (despite the many spur
lines and facilities created to cater for the Moroccan market) is one of the many reasons that Algeria is
accelerating the construction of the Medgaz pipeline connecting Algeria directly to Spain, instead of
expanding the capacity of the Pedro Duran Farrell pipeline, which would have increased the transit fee of
gas to Morocco.
The Moroccan strategy to meet the expected increased demand for gas appears to comprise three
elements. First, the transit fee would be increasingly claimed in kind. Second, exploration and production
of gas in Morocco would be sharply stepped up, especially for shale gas and oil. Third, there are plans to
build a liquefied natural gas (LNG) reception and regasification terminal at Tangier or Jorf Lasfar with an
initial annual capacity of 5 bcm (with provision to expand it to 10 bcm by 2020) at an estimated cost of
about $1.07 billion. In June 2010 the Société Nationale d’Investissement (SNI) and Akwa Group signed a
partnership agreement for the construction of this LNG terminal, for which the preferred location was
considered Jorf Lasfar. The consortium announced that it was to start by carrying out the necessary
technical studies. The terminal is expected to cost between €600 million and €1 billion to build.
Thus, though one of the four pillars of the government’s energy strategy is to focus on regional
cooperation, it appears that the future gas demand would most probably be met by LNG imports.
But there seems to have been a thaw in this situation and it is reported that for the first time Morocco and
Algeria signed a commercial contract—on July 31, 2011—for the supply of 640 million cubic meters of
gas per year for ten years to two power plants in Morocco (a 470 MW Ain Beni Mathar Plant near the
Algerian border and a 385 MW Tahaddart power plant near Tangier) through the Pedro Duran Farrell
pipeline making use of the spur lines. This move was widely celebrated by both Moroccans and
Algerians.40
40
See news item at http://www.gasandoil.com/news/africa/19ef57db4500afb744163cbce5dfbc77; and also at
http://magharebia.com/cocoon/awi/xhtml1/en_GB/features/awi/features/2011/08/04/feature-03.

Oman
Oman is located strategically close to the Strait of Hormuz, has an area of 212,000 square kilometers
(km2) and a population of 2.9 million.
Figure A1.21 Map of Oman
Source: World Bank Maps IBRD 33459
Reserves
Oman’s proven oil reserves at the end of 2010 were reported at 5.5 billion barrels (0.4 percent of the
world total) with a reserves-to-production ratio (RPR) of 17.4 years. In 2010 it produced 865,000
barrels/day of oil (1 percent of the world total) and consumed 115,000 barrels/day of oil products and
exported the rest. It is not, however, a member of the Organization of Petroleum Exporting Countries
(OPEC).
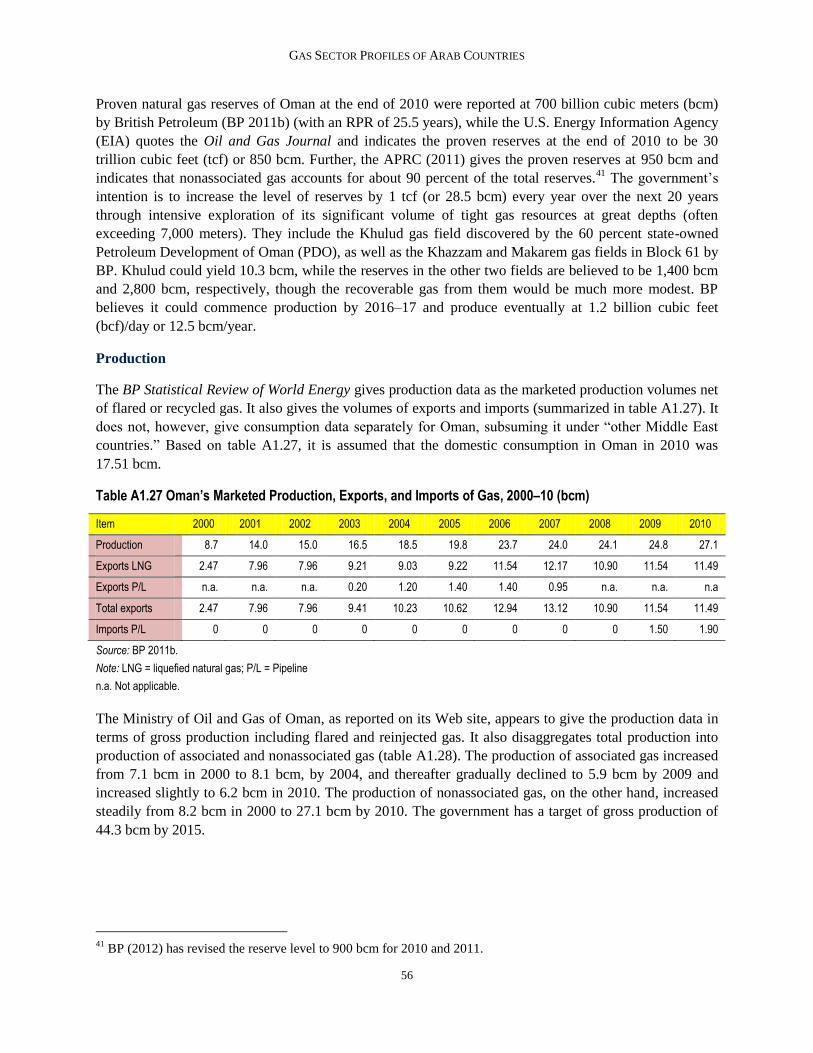
GAS SECTOR PROFILES OF ARAB COUNTRIES
56
Proven natural gas reserves of Oman at the end of 2010 were reported at 700 billion cubic meters (bcm)
by British Petroleum (BP 2011b) (with an RPR of 25.5 years), while the U.S. Energy Information Agency
(EIA) quotes the Oil and Gas Journal and indicates the proven reserves at the end of 2010 to be 30
trillion cubic feet (tcf) or 850 bcm. Further, the APRC (2011) gives the proven reserves at 950 bcm and
indicates that nonassociated gas accounts for about 90 percent of the total reserves.41
The government’s
intention is to increase the level of reserves by 1 tcf (or 28.5 bcm) every year over the next 20 years
through intensive exploration of its significant volume of tight gas resources at great depths (often
exceeding 7,000 meters). They include the Khulud gas field discovered by the 60 percent state-owned
Petroleum Development of Oman (PDO), as well as the Khazzam and Makarem gas fields in Block 61 by
BP. Khulud could yield 10.3 bcm, while the reserves in the other two fields are believed to be 1,400 bcm
and 2,800 bcm, respectively, though the recoverable gas from them would be much more modest. BP
believes it could commence production by 2016–17 and produce eventually at 1.2 billion cubic feet
(bcf)/day or 12.5 bcm/year.
Production
The BP Statistical Review of World Energy gives production data as the marketed production volumes net
of flared or recycled gas. It also gives the volumes of exports and imports (summarized in table A1.27). It
does not, however, give consumption data separately for Oman, subsuming it under “other Middle East
countries.” Based on table A1.27, it is assumed that the domestic consumption in Oman in 2010 was
17.51 bcm.
Table A1.27 Oman’s Marketed Production, Exports, and Imports of Gas, 2000–10 (bcm)
Item 2000 2001 2002 2003 2004 2005 2006 2007 2008 2009 2010
Production 8.7 14.0 15.0 16.5 18.5 19.8 23.7 24.0 24.1 24.8 27.1
Exports LNG 2.47 7.96 7.96 9.21 9.03 9.22 11.54 12.17 10.90 11.54 11.49
Exports P/L n.a. n.a. n.a. 0.20 1.20 1.40 1.40 0.95 n.a. n.a. n.a
Total exports 2.47 7.96 7.96 9.41 10.23 10.62 12.94 13.12 10.90 11.54 11.49
Imports P/L 0 0 0 0 0 0 0 0 0 1.50 1.90
Source: BP 2011b.
Note: LNG = liquefied natural gas; P/L = Pipeline
n.a. Not applicable.
The Ministry of Oil and Gas of Oman, as reported on its Web site, appears to give the production data in
terms of gross production including flared and reinjected gas. It also disaggregates total production into
production of associated and nonassociated gas (table A1.28). The production of associated gas increased
from 7.1 bcm in 2000 to 8.1 bcm, by 2004, and thereafter gradually declined to 5.9 bcm by 2009 and
increased slightly to 6.2 bcm in 2010. The production of nonassociated gas, on the other hand, increased
steadily from 8.2 bcm in 2000 to 27.1 bcm by 2010. The government has a target of gross production of
44.3 bcm by 2015.
41
BP (2012) has revised the reserve level to 900 bcm for 2010 and 2011.

GAS SECTOR PROFILES OF ARAB COUNTRIES
57
Table A1.28 Government Data on Gross Production of Gas in Oman, 2000–10 (bcm)
Item 2000 2001 2002 2003 2004 2005 2006 2007 2008 2009 2010
Associated gas 7.06 7.71 7.96 7.50 8.13 7.65 6.87 6.18 6.26 5.88 6.17
Nonassociated gas 8.19 13.00 14.36 16.58 15.97 18.29 23.24 24.08 23.97 25.14 27.09
Total gross production 15.25 20.71 22.32 24.08 24.10 25.94 30.21 30.26 30.23 31.02 33.26
Source: Ministry of Oil Web site, http://www.mog.gov.om/Default.aspx?alias=www.mog.gov.om/english.
Note: bcm = billion cubic meters.
While the volume of gas flared or vented is probably very small in Oman, it consumes substantial
quantities of gas for enhanced oil recovery (EOR) from its aging and mature oil wells. Currently about 20
percent of the produced gas goes for EOR.42
Given the difficulties Oman is facing in trying to arrest the
decline of its oil output, it is projected that the volume of gas used for EOR would reach 30 percent of
total gross production by 2015.
Exports
Oman’s gas exports are mainly in the form of liquefied natural gas (LNG). The liquefaction plant is
located at Qalhat, and it has three trains each with an effective annual capacity of 3.5 million tons of LNG
or 4.8 bcm of gas. The first two units, which started functioning from April 2000, are owned by Oman
LNG in which the Omani state has a 51 percent stake, followed by Shell Gas (30 percent), Total (5.54
percent), and five other Asian companies (13.46 percent). The third train, which started operating in
December 2005, is owned by Qalhat LNG in which the Oman state has a 46.84 percent stake followed by
Oman LNG (36.8 percent), Union Fenosa (7.6 percent), and three Japanese companies (each with a 3
percent stake). Qalhat LNG has tied up its production with long-term contacts, while Oman LNG has
long-term contracts for about 4.8 million tons, and sells the balance in spot markets or on medium-term
contracts. In the context of rapidly rising domestic demand, the country is not renewing the expired
contracts and it is not clear what stand the country will take when most of the long-term contracts come to
an end during 2024–26. Since 2008 gas appears to have been diverted away from LNG to domestic
consumption as the liquefaction units operated at less than the rated capacity and export volumes were
less than originally planned for.
In addition Oman has one gas pipeline from the Bukha gas field to the United Arab Emirate’s (UAE’s)
Ras al-Khaimah gas field, supplying to the cement companies and fertilizer plant there. Oman was also
supplying gas to a power plant at Qidfa in the Fujairah Emirate of the UAE. After all the components of
the Dolphin gas pipeline were completed, this pipeline was used in the reverse direction to supply Qatari
gas to Oman. In the context of Dolphin gas imports, Oman has concluded a contract with Ras al-Khaimah
of the UAE for the supply of 2 bcm of gas in the winter months (when Oman’s gas demand is low) at a
price of $5 per million British thermal units (mmbtu), substantially higher than its import costs from
Qatar of about $1.5/mmbtu. The volumes exchanged are only partially shown in the export statistics data
from BP.
42
It is interesting to note that Oman’s import of about 2 bcm of gas from Qatar through the Dolphin Pipeline was
mainly intended for EOR use.

GAS SECTOR PROFILES OF ARAB COUNTRIES
58
Imports
Under the Dolphin submarine pipeline project, Qatar has contracted to import 2 bcm/year, much of it for
EOR. Attempts to increase the volume of imports have not been successful partly because of the Qatari
moratorium on new export contracts and also because the prices agreed upon for the initial volumes are
no longer considered relevant in today’s world gas markets.
Strenuous efforts made by Omani officials to develop, jointly with Iran, the offshore Kish gas field (with
estimated gas reserves of 1,310 bcm) at an estimated cost of $12$18 billion and involving the
construction of a 500-km-long, 42-inch-diameter submarine pipeline to arrange for imports from Iran
could not bear fruit, inter alia, on account of the Iranian price demands exceeding $6$7/mmbtu, linked at
that time to the oil price of $70/barrel. The sanctions regime against Iran did not encourage Oman to
proceed with the proposal without hesitation. The subsequent negotiations have left Omani officials
convinced that pursuing domestic gas production from difficult fields of their own will be less expensive
than such imports.
Consumption
Data relating to the domestic consumption seem to be inconsistent across sources. But despite the
differences, it is clear that about 20 percent of the gross production goes for EOR and for the oil and gas
sector’s own use, about 40 percent goes for export as LNG, and the remaining 40 percent is consumed by
the power and industries sectors. Among the two sectors the share of the industries sector seems to have
increased slightly more in the recent years than that of the power sector, and currently the shares are
around 22 percent for industries and 18 percent for power. But the government seems to consider the
allocation of gas to the power sector a high priority. If we exclude the gas used for EOR and for exports
and calculate the percentages of sectoral shares on the remaining domestic gas consumption in 2010, the
share of the power sector would be about 36 percent, that of industries would be 44 percent, and the oil
and gas sector (such as for refineries and so on) the remaining 20 percent.
Power Sector
The Omani power system is not fully interconnected.43
The largest part of the system, known as the Main
Interconnected System (MIS), covers the northern part of the Sultanate. A smaller system owned by the
Dhofar Power Company serves the Salalah area in the south, and the rest of the country is supplied by the
Rural Areas Electricity Company. The total installed capacity at the end of 2010 was 4,054 megawatts
(MW), and the gross generation in 2010 was 19.8 terawatt hours (TWh). Peak demand in the MIS was
3,613 MW and that in the Salalah area was 356 MW. Peak demand occurs in June and the lowest demand
is in January.
Total electricity sales in the country were 16.1 TWh of which 14.1 TWh was in the MIS, where
residential consumers had a share of 54 percent, followed by commercial consumers (22 percent),
industries (8 percent), government and defense (15 percent), and agriculture and fisheries (1 percent).
43
The information in this section is from the: (i) Annual Report (2010) of the Authority for Electricity Regulation of
Oman (http://www.aer-oman.org); (ii) Annual Report (2010) of the Power and Water Procurement Company of
Oman and its Seven Year Statement (2011–17) (http://www.omanpwp.com); (iii) Annual Report (2010) of the
Oman Gas Company (http://www.oman-gas.com.om).

GAS SECTOR PROFILES OF ARAB COUNTRIES
59
More than 99.5 percent of the electricity was generated using natural gas as fuel, and a small volume of
diesel was used in certain rural areas. Gas consumption for power generation and water desalination in
2010 amounted to 6.284 bcm.
Electricity generation had increased from 11.5 TWh in 2004 to 19.8 TWh in 2010 at a compound annual
growth rate (CAGR) of 9.48 percent, while peak demand grew from 2,626 MW to 3,969 MW at a CAGR
of 7.13 percent and electricity sales grew from 8.0 TWh to 16.1 TWh at a CAGR of 12.4 percent.
According to the Seven Year Statement (2011–17) of the Water and Power Procurement Company of
Oman, the MIS load is forecast to grow at 9 percent per year during this period in the base-case scenario.
Peak demand will thus reach 6,371 MW and energy generation will reach 30.3 TWh. The lower-case
scenario uses 6 percent and higher case uses 1213 percent.
Current installed capacity is around 3,800 MW and new capacity of about 3,500 MW is under
construction or about to be implemented. These actions will be commissioned during 2012–14. In
addition, 100200 MW of solar power units are to be connected to the grid by 2015. Under the base- and
low-case scenarios, no further new capacity additions are envisaged until 2017. Under the high-case
scenario, additional new capacity of 2,069 MW needs to be added by 2017.
The Salalah system is expected to grow faster, at 11 percent per year, and the peak demand is expected to
reach 719 MW by 2017. The average energy demand will reach 3.88 TWh. The low-case scenario uses 8
percent growth and the high-case scenario uses 14 percent growth. Present capacity is around 298 MW
and a new integrated water and power plant (IWPP) with a power capacity of 445 MW is under
construction and is expected to be commissioned in two phases in 2011 and 2012. In the low-case
scenario, no new capacity needs to be added until 2017; in the base-case scenario, a new capacity of 60
MW would be needed by 2017; and in the high-case scenario, 445 MW needs to be added partly in 2015
and partly in 2017.
Similar projections have been made for the water sector also. Taking into account the needs of the power
and water sectors, their gas demand is projected to be between 8.2 bcm and 11.5 bcm by 2017,
respectively, depending on the scenario chosen. Gas availability until 2013 has been assured by the
ministry for the high-case scenario, until 2016 for the base-case scenario, and until 2018 for the low-case
scenario. Based on similar assumptions, one could conjecture a gas demand of 1820 bcm for the power
and water desalination sector by 2030, subject to gas availability.
Prices of Gas/Electricity
Gas is being made available to most domestic consumers at around $1.5/mmbtu. Though the gas through
the Dolphin Pipeline (2 bcm a year) was secured at about this price, no future import would be possible at
such prices. Domestic gas production costs are likely to rise to about the $4 to $5 range, because of the
complexities of incremental production from new and difficult fields with tight gas at great depths.
Oman’s own sale of 2 bcm of seasonal gas to Ras al-Khaimah is at $5/mmbtu. Considering all these
factors, there is pressure for the upward revision of domestic gas prices to reflect supply costs.
Electricity prices for residential and government users range from 2.6 cents to 5.2 cents/kWh in three
slabs and most of the others are charged at 5.2 cents/kWh. Industries have seasonal tariffs at 3.12
cents/kWh in winter and 6.24 cents/kWh in summer. These prices would not be adequate when gas prices

GAS SECTOR PROFILES OF ARAB COUNTRIES
60
for power generators are raised. Even the current prices involve substantial consumer subsidies. Price
reforms are needed to raise energy-use efficiency and restrain demand.
Outlook
Fattouh and Stern (2011) project a growth rate of about 8.75 percent per annum during 2008–15 for
domestic gas demand in Oman. Applying the same rate of growth, the domestic demand for gas may
grow from 17.51 bcm in 2010 to 40.49 bcm by 2020; at a 5 percent annual growth rate in the next decade,
it will increase to 65.95 bcm by 2030. The Government of Oman has a target of gas production of 44.3
bcm by 2015, which would correspond to a marketed production of about 35 bcm, implying a marketed
production growth rate of about 5 percent per year. Assuming the same rate, the production level in 2020
could be projected at around 45 bcm. At about 2.2 percent per year during the period 202030, production
could grow to 56 bcm by 2030. The potential production growth is unlikely to keep pace with such
growth in demand, and Oman may have to rely on large imports.
Oman’s current gas situation cannot yet be described as a crisis, but may well develop into one in the
medium term if efforts to step up domestic production do not succeed. Having tried, without much
success, to secure additional gas imports, the country has now decided to focus intensively on augmenting
domestic production.
Qatar
Qatar, with an area of 11,437 square kilometers and a population of 1,687,000, plays a significant role in
the world gas business. After Russia and Iran it has the third-largest proven natural gas reserves in the
world, and it is the world’s largest producer and exporter of liquefied natural gas (LNG).
Driven by its oil and gas exports, Qatar has one of the fastest-growing economies of the world, with low
inflation. Successfully weathering the recent world financial crisis, its economy grew at 16.3 percent in
2010 and is forecast to grow at around 20 percent in 2011. Its per capita gross domestic product (GDP)
was estimated at slightly lower than $80,000.44
On a purchase power parity basis, the per capita GDP in
2010 was estimated at $88,599 (APRC 2011). Oil and gas production account for more than 50 percent of
GDP, approximately 85 percent of export earnings, and 70 percent of government revenues.
Reserves
At the end of 2010 Qatar’s proven natural gas reserves were estimated at 25.37 trillion cubic meters
(tcm), representing 13.5 percent of the world’s total reserves. The reserves-to-production ratio (RPR) is in
excess of 200 years. More than 98 percent of the reserves are located in the massive offshore North Field,
which is the world’s largest nonassociated natural gas field.
The only other source of nonassociated gas in Qatar is the formation that lies under the Dukhan oilfield,
an onshore field where oil is produced from three shallower reservoirs. The overall structure, about 60 km
long and 25 km wide, was discovered in 1960 and brought into production in 1978. Qatar has associated
gas reserves in two offshore oilfields, Bul Hanine and Maydan Mahzam, and in other offshore oilfields
operated by foreign companies, primarily the al-Shaheen and Idd al-Shargi fields.
Production
Marketed gas production increased from 23.7 billion cubic meters (bcm) in 2000 to 116.7 bcm in 2010 at
a compounded annual rate of 17.28 percent, while domestic consumption increased from 9.7 bcm to 20.4
bcm at a compounded annual rate of 7.7 percent (table A1.29). It increased further to 146 bcm in 2011
(BP 2012).
44
http://www.imf.org.
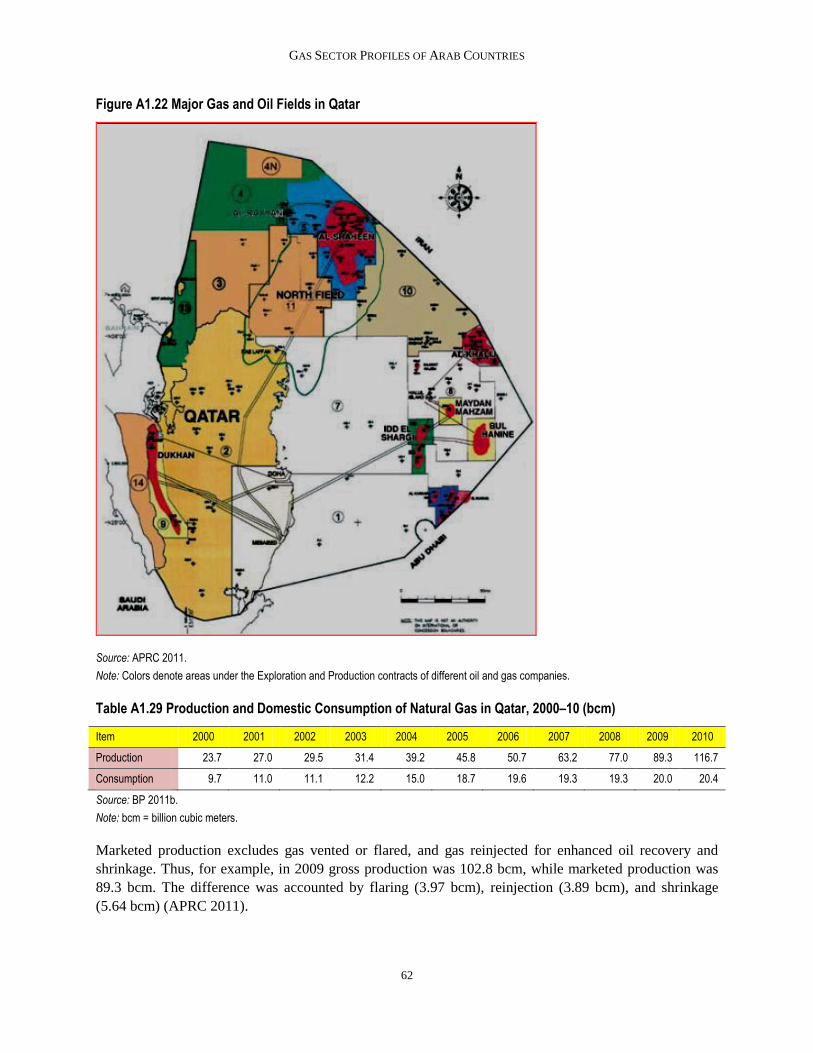
GAS SECTOR PROFILES OF ARAB COUNTRIES
62
Figure A1.22 Major Gas and Oil Fields in Qatar
Source: APRC 2011.
Note: Colors denote areas under the Exploration and Production contracts of different oil and gas companies.
Table A1.29 Production and Domestic Consumption of Natural Gas in Qatar, 2000–10 (bcm)
Item 2000 2001 2002 2003 2004 2005 2006 2007 2008 2009 2010
Production 23.7 27.0 29.5 31.4 39.2 45.8 50.7 63.2 77.0 89.3 116.7
Consumption 9.7 11.0 11.1 12.2 15.0 18.7 19.6 19.3 19.3 20.0 20.4
Source: BP 2011b.
Note: bcm = billion cubic meters.
Marketed production excludes gas vented or flared, and gas reinjected for enhanced oil recovery and
shrinkage. Thus, for example, in 2009 gross production was 102.8 bcm, while marketed production was
89.3 bcm. The difference was accounted by flaring (3.97 bcm), reinjection (3.89 bcm), and shrinkage
(5.64 bcm) (APRC 2011).

GAS SECTOR PROFILES OF ARAB COUNTRIES
63
Consumption
Domestic consumption increased from 9.7 bcm in 2000 to 20.4 bcm in 2010 at a compound annual
growth rate (CAGR) of 7.7 percent. It increased further to 23.8 bcm in 2011. For domestic consumption,
the largest share went to petrochemical industries (62 percent), followed by power generation (22 percent)
and gas to liquid conversion (16 percent). The gas supply price for petrochemical and fertilizer industries
using gas as feedstock is believed to be at $0.75$1.0 per million British thermal units (mmbtu). Gas
supply to power sector is by fixed price contracts by Qatar Petroleum, indexed to inflation.
Exports
Natural gas exports have increased from 14.04 bcm in 2000 to 94.9 bcm in 2010 at a CAGR of 21.05
percent (table A1.30). The share of LNG exports have dramatically increased since 2004. In 2009, for
example, LNG exports amounted to 49.44 bcm and these increased further to 75.75 bcm in 2010. In 2011
further dramatic increases in exports were reported at 121.8 bcm of which 102.6 bcm was in the form of
LNG.
Table A1.30 Gas Exports from Qatar, 2000–10 (bcm)
Item 2000 2001 2002 2003 2004 2005 2006 2007 2008 2009 2010
Exports 14.04 16.54 18.39 19.19 24.06 27.10 31.09 43.50 56.78 68.19 94.90
Source: BP World Energy Statistical Reviews; and OPEC as quoted in APRC (2011).
Moratorium
Production increases were perceived as far too rapid, and in March 2005 the government paused
production for new exports (generally referred to as a “moratorium” in the gas literature) to enable a
comprehensive review of reservoir operations to ensure that no reservoir damage is occurring. This
moratorium has been periodically extended and is expected to last until 2014, by which time all the
production projects already approved would be in operation. The last of these projects (Barzan) in the
North Gas Field is scheduled for completion by 2013, but the impact of this project on field may not be
fully ascertained until 2015.
Qatar government officials mention a policy of considering further export contracts only after ensuring:
(i) that the increasing domestic demand (for power generation, water desalination, and large industrial
undertakings) would be fully met, (ii) that the operation of the field would not jeopardize the long-term
health of the gas field, and (iii) that such contracts are consistent with Qatar’s overall strategic concerns.
Further, any such new contract will have to be based on the buyers being prepared to pay a fair value for
the hydrocarbon resources (meaning world-LNG-price-based net backs). In such a context, it is advisable
that international oil companies see the national oil companies as resource holders looking to receive
greater value and willing to give up less than in the past.
On the whole, official opinion in Qatar seems to be crystalizing around the theme that Qatar’s share of the
world gas market as of 2010 should be more than adequate for the country’s development strategy. In this
context, after lifting the “moratorium” an additional production of 17 bcm may come from de-
bottlenecking the LNG trains. In addition Dolphin Energy will continue to produce 20 bcm for export
through a pipeline to the United Arab Emirates (UAE) and Oman. Small additional supply may be

GAS SECTOR PROFILES OF ARAB COUNTRIES
64
possible on the basis of interruptible supplies or seasonal supplies. It may also be possible to increase
supply through the Dolphin Pipeline from 20 bcm to about 33 bcm—the full capacity of the line.
LNG Production and Exports
All LNG in Qatar is produced and exported by two companies, Qatargas and RasGas. Each has several
trains of LNG production, all located in Ras Laffan Industrial City. Each train or groups of trains have
different foreign partners, but Qatar Petroleum (a state-owned company) has a majority stake in all of
them. Qatargas has four subsidiaries and seven trains with a total capacity of 41.1 million tons/year, and
RasGas has also three subsidiaries with seven trains with a total capacity of 36 million tons/year. LNG is
exported all over the world and most of the exports are based on long-term contracts linked to oil prices,
but in the recent three to four years increasing amounts of LNG are being sold in spot markets
Exports through the Dolphin Pipeline
A Gulf Cooperation Council (GCC) gas pipeline exporting gas from Qater to other GCC countries had
been under discussion for a long time since the late 1980s but could not make progress on account of
border disputes, political tension, and diplomatic squabbles. Saudi Arabia denied transit rights and
withdrew from participation. The idea of a limited pipeline serving only the UAE and Oman emerged in
1999 and was pursued by Dolphin Energy Ltd. Thus, as of now, the only gas pipeline exporting gas is
Dolphin—constructed, owned, and operated by Dolphin Energy.
Figure A1.23 Dolphin Pipeline System
Source: http://www.dolphinenergy.com.
Two 36-inch-diameter submarine pipelines (70 and 90 km long) with a capacity of about 20 bcm/year
connect the production platforms of Dolphin Energy in the North Field to the gas-processing plant in Ras
Laffan. The dry gas is then transported to the receiving facilities at Taweela in Abu Dhabi (UAE) through
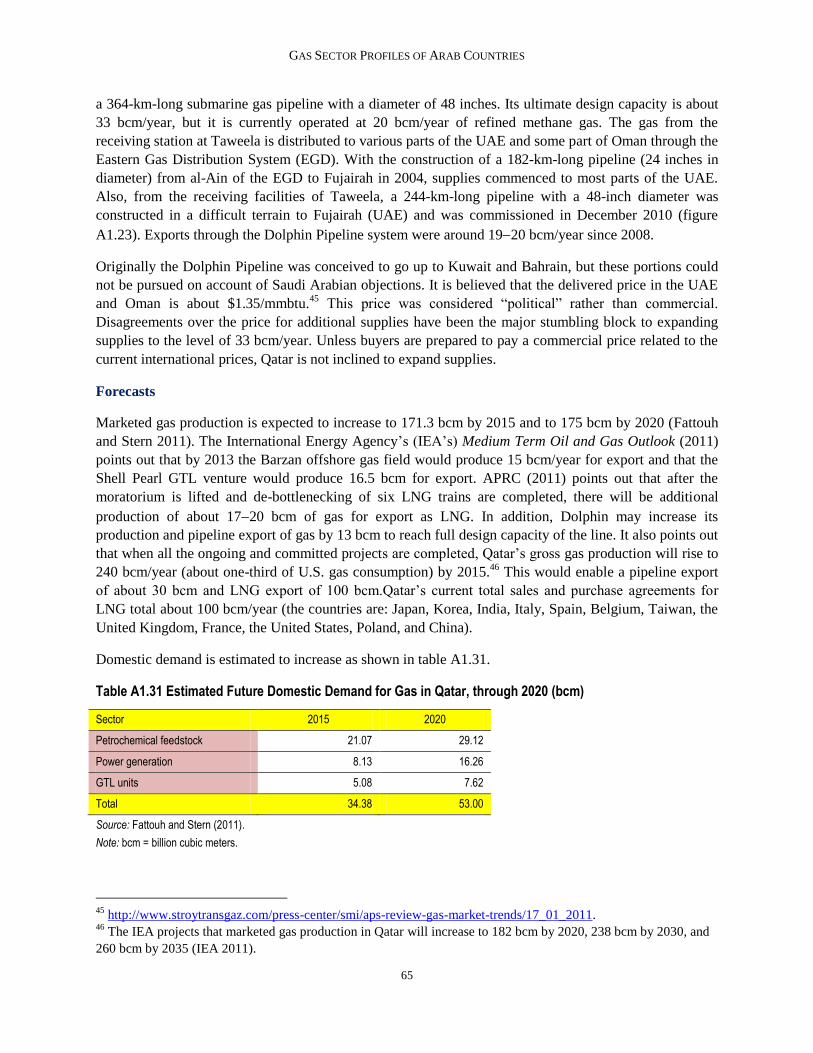
GAS SECTOR PROFILES OF ARAB COUNTRIES
65
a 364-km-long submarine gas pipeline with a diameter of 48 inches. Its ultimate design capacity is about
33 bcm/year, but it is currently operated at 20 bcm/year of refined methane gas. The gas from the
receiving station at Taweela is distributed to various parts of the UAE and some part of Oman through the
Eastern Gas Distribution System (EGD). With the construction of a 182-km-long pipeline (24 inches in
diameter) from al-Ain of the EGD to Fujairah in 2004, supplies commenced to most parts of the UAE.
Also, from the receiving facilities of Taweela, a 244-km-long pipeline with a 48-inch diameter was
constructed in a difficult terrain to Fujairah (UAE) and was commissioned in December 2010 (figure
A1.23). Exports through the Dolphin Pipeline system were around 1920 bcm/year since 2008.
Originally the Dolphin Pipeline was conceived to go up to Kuwait and Bahrain, but these portions could
not be pursued on account of Saudi Arabian objections. It is believed that the delivered price in the UAE
and Oman is about $1.35/mmbtu.45
This price was considered “political” rather than commercial.
Disagreements over the price for additional supplies have been the major stumbling block to expanding
supplies to the level of 33 bcm/year. Unless buyers are prepared to pay a commercial price related to the
current international prices, Qatar is not inclined to expand supplies.
Forecasts
Marketed gas production is expected to increase to 171.3 bcm by 2015 and to 175 bcm by 2020 (Fattouh
and Stern 2011). The International Energy Agency’s (IEA’s) Medium Term Oil and Gas Outlook (2011)
points out that by 2013 the Barzan offshore gas field would produce 15 bcm/year for export and that the
Shell Pearl GTL venture would produce 16.5 bcm for export. APRC (2011) points out that after the
moratorium is lifted and de-bottlenecking of six LNG trains are completed, there will be additional
production of about 1720 bcm of gas for export as LNG. In addition, Dolphin may increase its
production and pipeline export of gas by 13 bcm to reach full design capacity of the line. It also points out
that when all the ongoing and committed projects are completed, Qatar’s gross gas production will rise to
240 bcm/year (about one-third of U.S. gas consumption) by 2015.46
This would enable a pipeline export
of about 30 bcm and LNG export of 100 bcm.Qatar’s current total sales and purchase agreements for
LNG total about 100 bcm/year (the countries are: Japan, Korea, India, Italy, Spain, Belgium, Taiwan, the
United Kingdom, France, the United States, Poland, and China).
Domestic demand is estimated to increase as shown in table A1.31.
Table A1.31 Estimated Future Domestic Demand for Gas in Qatar, through 2020 (bcm)
Sector 2015 2020
Petrochemical feedstock 21.07 29.12
Power generation 8.13 16.26
GTL units 5.08 7.62
Total 34.38 53.00
Source: Fattouh and Stern (2011).
Note: bcm = billion cubic meters.
45
http://www.stroytransgaz.com/press-center/smi/aps-review-gas-market-trends/17_01_2011. 46
The IEA projects that marketed gas production in Qatar will increase to 182 bcm by 2020, 238 bcm by 2030, and
260 bcm by 2035 (IEA 2011).

GAS SECTOR PROFILES OF ARAB COUNTRIES
66
The above demand estimate may prove to be somewhat underestimated. Qatar has aluminum and steel
industries and a host of other industries using gas. Driven by increased population and steeply increasing
per capita incomes, electricity demand is increasing faster than all earlier estimates.
Export demand is expected to increase only moderately through 2020. Because of shale gas developments
in North America, sales of LNG to the United States may have to be shifted to Europe and the Far East.
LNG sales may reach a temporary pleatau of about 100 bcm, and pipeline sales through Dolphin could be
expected to increase from 20 bcm to 33 bcm. Agreement by the GCC countries to buy gas at commercial
prices related to international gas prices could spur regional exports, but most probably in the form of
LNG rather than as piped gas, unless the countries overcome border disputes, transit issues, and
associated obstacles.
Power Sector
The power sector in Qatar was partially unbundled in 2000 when power generation and water production
activities were allocated to independent water and power producers (IWPPs), and transmission and
distribution and retail sales of water and electricity were allocated to the newly established Qatar Electric
and Water Corporation or Kahrama.
The installed capacity at the end of 2010 was 7,801 megawatts (MW), consisting of 6,306 MW of
combined-cycle plants and 1,495 MW of gas turbines. The electricity generation in 2010 was 26,362
gigawatt hours (GWh), and the peak demand in 2010 was reported at 5,090 MW, and 100 percent of
electricity generation was based on natural gas fuel. Based on 2008 and 2009 data, about 45 percent of the
sales were to residential consumers, 27 percent to industrial consumers, 18 percent to commercial
consumers, and 10 percent to other consumers. All Qatari citizens (they account for 25 percent of the total
consumers and 40 percent of total consumption) are supplied water and electricity free of cost. Such free
power is subject to a ceiling of 4,000 kWh/month; others pay about 2.2 cents/kWh (World Bank 2009b).
Per capita annual electricity consumption in 2009 was about 12,694 kWh.
Peak demand grew from 2,520 MW in 2004 to 5,090 MW in 2010 at a CAGR of 12.4 percent, while
energy generation grew from 13,232 GWh to 26,362 GWh at a CAGR of 12.2 percent. A forecast through
2020 is given in table A1.32.
Table A1.32 Electricity Forecast for Qatar through 2020
Item 2010 2011 2015 2020
Peak demand MW 5,090 5,561 7,197 8,883
Energy generation GWh 26,362 26,672 34,674 43,380
Source: http://www.auptde.org.
Note: MW = megawatts; GWh = gigawatt hours.
The above forecasts imply a CAGR of 5.7 percent for peak demand and 5.1 percent for energy generation,
and appear to be somewhat low compared to growth in the past six years. Business Monitor International
in its forecast made in the third quarter of 2011 seems to indicate a higher level of growth, 7.1 percent for
peak demand and 7.8 percent for energy generation through 2020. The gas demand estimate of 1617
bcm by 2010 for the power sector seems to be appropriate. Since the government policy is to give the
highest priority in gas allocation for domestic gas needs, Qatar should not have any difficulty in allocating
the needed gas for the power sector.
GAS SECTOR PROFILES OF ARAB COUNTRIES
67
In the context of resuming new gas exports, Qatar could also consider allowing private investors to
establish large combined-cycle plants (of about 5,000 MW capacity) and enable the export of gas in the
form of electricity to its GCC neighbors.
Supply Demand Balance by 2020
If gross production increases to 240 bcm by 2015, marketed gas would be around 200 bcm or more. Of
this, 100 bcm would go for the LNG export contracts on hand. Exports by the Dolphin Pipeline, which are
currently at 20 bcm, can expand with relative ease to 32 bcm (making use of the pipeline capacity in full),
since both the UAE and Oman have the demand growth and willingness and ability to pay market prices
for gas. This should leave a surplus of 68 bcm, 50 percent of which could go to meet the domestic
demand and the remaining 50 percent for increased exports of LNG (Kuwait, Bahrain, Jordan) or new
pipeline exports (Saudi Arabia).

Saudi Arabia
Saudi Arabia, with an area of 2.15 million square kilometers (km2) and a population of 28 million (2011),
is the largest country among the members of Gulf Cooperation Council (GCC). Its hydrocarbon resource
endowments are among the largest in the world.
Resources
The nation has the world’s largest proven oil reserves, reported at 264.5 billion barrels at the end of 2010
(19.1 percent of world reserves) with a reserves-to-production ratio (RPR) of about 72.4 years. In 2010 it
produced a little over 10 million barrels/day of oil (12 percent of the world production), consumed 2.812
million barrels/day (3.1 percent of the world consumption), and exported about 7.5 million barrels/day.
Rapidly rising domestic oil consumption eroding an oil export surplus has emerged as a major concern.
Figure A1.24 Map of Saudi Arabia
Source: World Bank Maps IBRD 33474
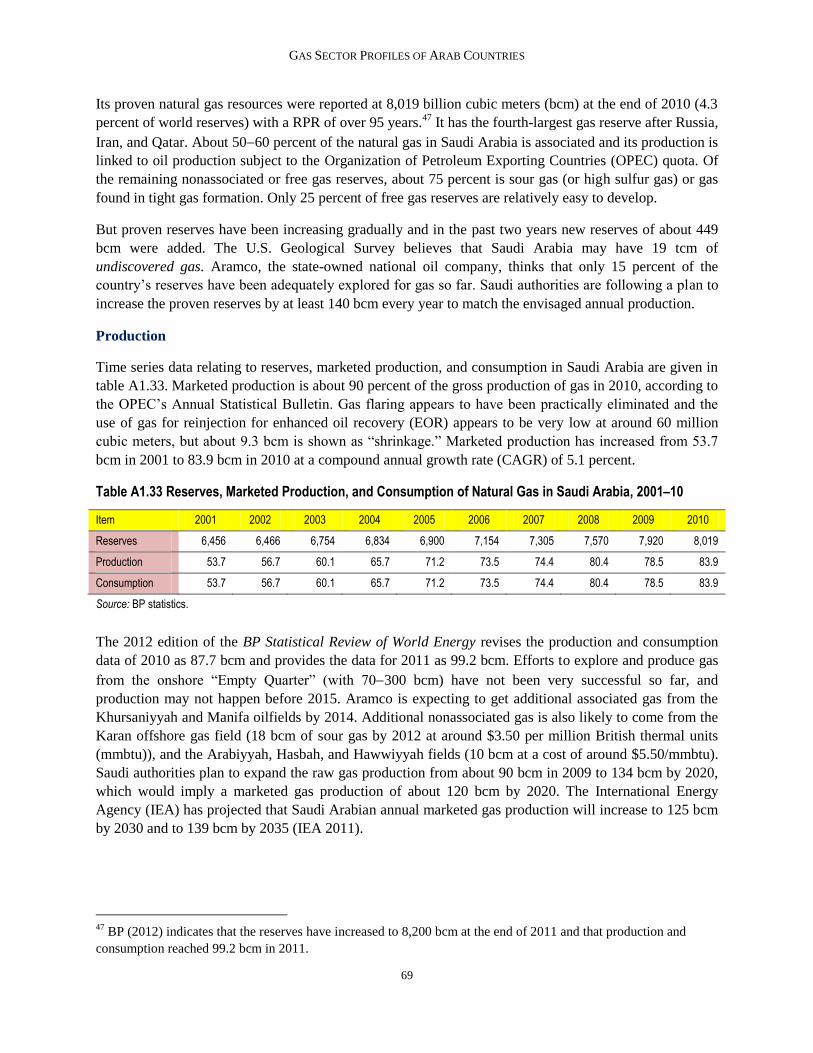
GAS SECTOR PROFILES OF ARAB COUNTRIES
69
Its proven natural gas resources were reported at 8,019 billion cubic meters (bcm) at the end of 2010 (4.3
percent of world reserves) with a RPR of over 95 years.47
It has the fourth-largest gas reserve after Russia,
Iran, and Qatar. About 5060 percent of the natural gas in Saudi Arabia is associated and its production is
linked to oil production subject to the Organization of Petroleum Exporting Countries (OPEC) quota. Of
the remaining nonassociated or free gas reserves, about 75 percent is sour gas (or high sulfur gas) or gas
found in tight gas formation. Only 25 percent of free gas reserves are relatively easy to develop.
But proven reserves have been increasing gradually and in the past two years new reserves of about 449
bcm were added. The U.S. Geological Survey believes that Saudi Arabia may have 19 tcm of
undiscovered gas. Aramco, the state-owned national oil company, thinks that only 15 percent of the
country’s reserves have been adequately explored for gas so far. Saudi authorities are following a plan to
increase the proven reserves by at least 140 bcm every year to match the envisaged annual production.
Production
Time series data relating to reserves, marketed production, and consumption in Saudi Arabia are given in
table A1.33. Marketed production is about 90 percent of the gross production of gas in 2010, according to
the OPEC’s Annual Statistical Bulletin. Gas flaring appears to have been practically eliminated and the
use of gas for reinjection for enhanced oil recovery (EOR) appears to be very low at around 60 million
cubic meters, but about 9.3 bcm is shown as “shrinkage.” Marketed production has increased from 53.7
bcm in 2001 to 83.9 bcm in 2010 at a compound annual growth rate (CAGR) of 5.1 percent.
Table A1.33 Reserves, Marketed Production, and Consumption of Natural Gas in Saudi Arabia, 2001–10
Item 2001 2002 2003 2004 2005 2006 2007 2008 2009 2010
Reserves 6,456 6,466 6,754 6,834 6,900 7,154 7,305 7,570 7,920 8,019
Production 53.7 56.7 60.1 65.7 71.2 73.5 74.4 80.4 78.5 83.9
Consumption 53.7 56.7 60.1 65.7 71.2 73.5 74.4 80.4 78.5 83.9
Source: BP statistics.
The 2012 edition of the BP Statistical Review of World Energy revises the production and consumption
data of 2010 as 87.7 bcm and provides the data for 2011 as 99.2 bcm. Efforts to explore and produce gas
from the onshore “Empty Quarter” (with 70300 bcm) have not been very successful so far, and
production may not happen before 2015. Aramco is expecting to get additional associated gas from the
Khursaniyyah and Manifa oilfields by 2014. Additional nonassociated gas is also likely to come from the
Karan offshore gas field (18 bcm of sour gas by 2012 at around $3.50 per million British thermal units
(mmbtu)), and the Arabiyyah, Hasbah, and Hawwiyyah fields (10 bcm at a cost of around $5.50/mmbtu).
Saudi authorities plan to expand the raw gas production from about 90 bcm in 2009 to 134 bcm by 2020,
which would imply a marketed gas production of about 120 bcm by 2020. The International Energy
Agency (IEA) has projected that Saudi Arabian annual marketed gas production will increase to 125 bcm
by 2030 and to 139 bcm by 2035 (IEA 2011).
47
BP (2012) indicates that the reserves have increased to 8,200 bcm at the end of 2011 and that production and
consumption reached 99.2 bcm in 2011.
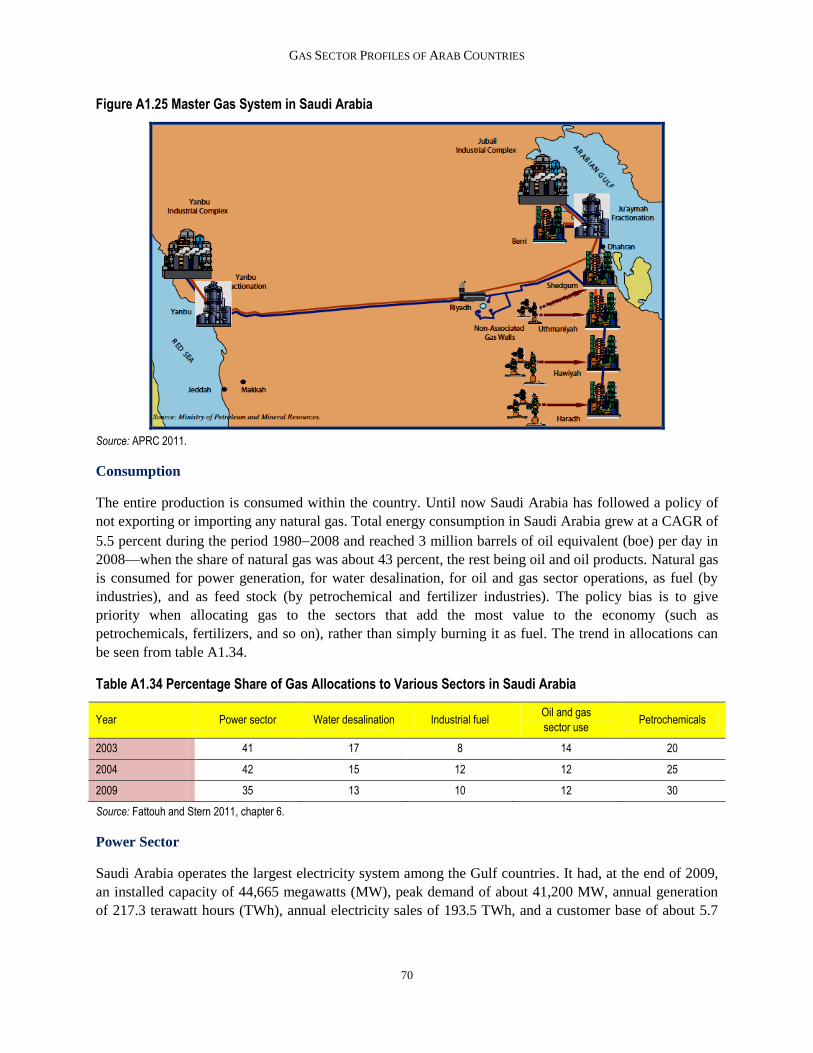
GAS SECTOR PROFILES OF ARAB COUNTRIES
70
Figure A1.25 Master Gas System in Saudi Arabia
Source: APRC 2011.
Consumption
The entire production is consumed within the country. Until now Saudi Arabia has followed a policy of
not exporting or importing any natural gas. Total energy consumption in Saudi Arabia grew at a CAGR of
5.5 percent during the period 19802008 and reached 3 million barrels of oil equivalent (boe) per day in
2008—when the share of natural gas was about 43 percent, the rest being oil and oil products. Natural gas
is consumed for power generation, for water desalination, for oil and gas sector operations, as fuel (by
industries), and as feed stock (by petrochemical and fertilizer industries). The policy bias is to give
priority when allocating gas to the sectors that add the most value to the economy (such as
petrochemicals, fertilizers, and so on), rather than simply burning it as fuel. The trend in allocations can
be seen from table A1.34.
Table A1.34 Percentage Share of Gas Allocations to Various Sectors in Saudi Arabia
Year Power sector Water desalination Industrial fuel Oil and gas
sector use Petrochemicals
2003 41 17 8 14 20
2004 42 15 12 12 25
2009 35 13 10 12 30
Source: Fattouh and Stern 2011, chapter 6.
Power Sector
Saudi Arabia operates the largest electricity system among the Gulf countries. It had, at the end of 2009,
an installed capacity of 44,665 megawatts (MW), peak demand of about 41,200 MW, annual generation
of 217.3 terawatt hours (TWh), annual electricity sales of 193.5 TWh, and a customer base of about 5.7

GAS SECTOR PROFILES OF ARAB COUNTRIES
71
million.48
The Saudi Arabian power system comprises four operating areas (eastern, central, western, and
southern), each containing a major grid and a few small isolated systems. About 85 percent of the
installed generation capacity in 2009 (37,913 MW) was owned and operated by the Saudi Electric
Company (SEC), the dominant vertically integrated power utility of the country. The remaining capacity
was purchased by the SEC from large industrial consumers (3,851 MW), desalination plants (1,954 MW),
and rental diesel units (767 MW). The first two provided peak power support and the rental units met the
summer demands in isolated systems. The total available capacity was reported at 44,485 MW,
distributed among the four operating areas as follows: eastern 38.7 percent; central 23.3 percent; western
29.6 percent; and southern 8.4 percent. Much of the electricity generation is based on liquid fuels such as
crude oil, heavy fuel oil, and diesel. Gas allocation for power generation is limited and generally
declining.
From the fuel consumption data for power generation reported for Saudi Arabia on the Arab Union of
Producers, Transporters and Distributors of Electricity (AUPTDE) Web site, it may be seen than the gas
allocation to the power sector fell during the period 2004–10, both in terms of volume and in terms of the
percentage share in the total fuels used (table A1.35).
Table A1.35 Natural Gas Consumption in Saudi Arabia’s Power Sector, 2004–10
Year
Total fuel consumption
for power generation
(thousand toe)
Natural gas
consumption for power
generation
(thousand toe)
Natural gas
consumption
(in bcm)
Share of natural gas in
total fuel consumption
for power generation
(percent)
2004 39,198 19,912 22.12 50.80
2005 42,677 22,196 24.66 52.01
2006 43,731 22,020 24.46 50.35
2007 44,045 20,196 22.44 45.85
2008 48,221 21,376 23.75 44.33
2009 51,580 19,460 21.62 37.72
2010 50,309 17,208 19.12 34.20
Source: http://www.auptde.org.
Note: bcm = billion cubic meters; toe = tons of oil equivalent.
Gas is supplied as fuel for power generation to only two of the operating areas (central and eastern) of the
power system and not in the southern and western areas. The current policy is to continue to supply
natural gas only to those units already getting it and to allocate not more than 300 million cubic feet/day
of additional gas to a new plant in the central operating area. Large base load plants (including
independent power producers, IPPs) in the coastal areas are expected to use heavy fuel oil or heavy crude
oil as fuel.
During 2000–10 peak demand grew from 21,673 MW to 45,661 MW at a CAGR of 7.7 percent, more
than double the rate of gross domestic product (GDP) growth. The energy generation grew from 114 TWh
48
The recently released annual report (2010) of the Saudi Electric Company (SEC) indicates a total generation
capacity of 50,132 MW, annual generation of 234,371 GWh, energy sales of 212,263 GWh, and a customer base of
nearly 6 million for the year 2010. It also indicates a peak demand of 45,661 MW, of which 2,448 MW is related to
isolated grids, the rest relating to the large interconnected grids.
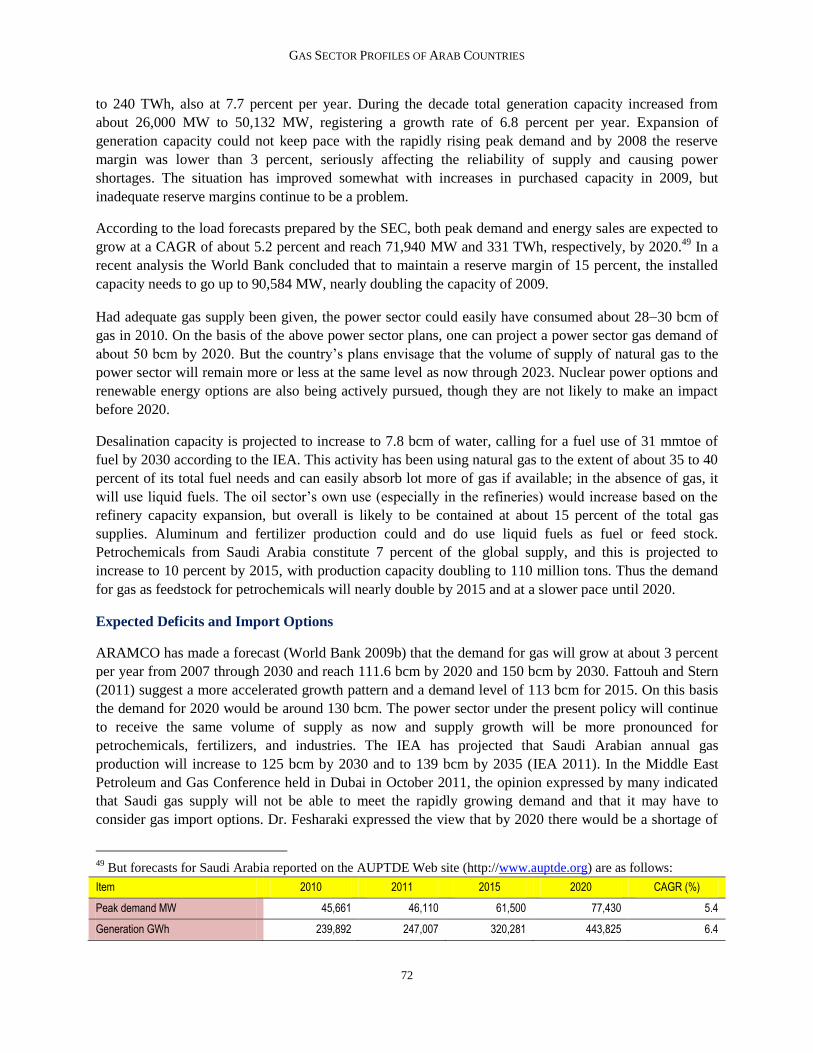
GAS SECTOR PROFILES OF ARAB COUNTRIES
72
to 240 TWh, also at 7.7 percent per year. During the decade total generation capacity increased from
about 26,000 MW to 50,132 MW, registering a growth rate of 6.8 percent per year. Expansion of
generation capacity could not keep pace with the rapidly rising peak demand and by 2008 the reserve
margin was lower than 3 percent, seriously affecting the reliability of supply and causing power
shortages. The situation has improved somewhat with increases in purchased capacity in 2009, but
inadequate reserve margins continue to be a problem.
According to the load forecasts prepared by the SEC, both peak demand and energy sales are expected to
grow at a CAGR of about 5.2 percent and reach 71,940 MW and 331 TWh, respectively, by 2020.49
In a
recent analysis the World Bank concluded that to maintain a reserve margin of 15 percent, the installed
capacity needs to go up to 90,584 MW, nearly doubling the capacity of 2009.
Had adequate gas supply been given, the power sector could easily have consumed about 2830 bcm of
gas in 2010. On the basis of the above power sector plans, one can project a power sector gas demand of
about 50 bcm by 2020. But the country’s plans envisage that the volume of supply of natural gas to the
power sector will remain more or less at the same level as now through 2023. Nuclear power options and
renewable energy options are also being actively pursued, though they are not likely to make an impact
before 2020.
Desalination capacity is projected to increase to 7.8 bcm of water, calling for a fuel use of 31 mmtoe of
fuel by 2030 according to the IEA. This activity has been using natural gas to the extent of about 35 to 40
percent of its total fuel needs and can easily absorb lot more of gas if available; in the absence of gas, it
will use liquid fuels. The oil sector’s own use (especially in the refineries) would increase based on the
refinery capacity expansion, but overall is likely to be contained at about 15 percent of the total gas
supplies. Aluminum and fertilizer production could and do use liquid fuels as fuel or feed stock.
Petrochemicals from Saudi Arabia constitute 7 percent of the global supply, and this is projected to
increase to 10 percent by 2015, with production capacity doubling to 110 million tons. Thus the demand
for gas as feedstock for petrochemicals will nearly double by 2015 and at a slower pace until 2020.
Expected Deficits and Import Options
ARAMCO has made a forecast (World Bank 2009b) that the demand for gas will grow at about 3 percent
per year from 2007 through 2030 and reach 111.6 bcm by 2020 and 150 bcm by 2030. Fattouh and Stern
(2011) suggest a more accelerated growth pattern and a demand level of 113 bcm for 2015. On this basis
the demand for 2020 would be around 130 bcm. The power sector under the present policy will continue
to receive the same volume of supply as now and supply growth will be more pronounced for
petrochemicals, fertilizers, and industries. The IEA has projected that Saudi Arabian annual gas
production will increase to 125 bcm by 2030 and to 139 bcm by 2035 (IEA 2011). In the Middle East
Petroleum and Gas Conference held in Dubai in October 2011, the opinion expressed by many indicated
that Saudi gas supply will not be able to meet the rapidly growing demand and that it may have to
consider gas import options. Dr. Fesharaki expressed the view that by 2020 there would be a shortage of
49
But forecasts for Saudi Arabia reported on the AUPTDE Web site (http://www.auptde.org) are as follows:
Item 2010 2011 2015 2020 CAGR (%)
Peak demand MW 45,661 46,110 61,500 77,430 5.4
Generation GWh 239,892 247,007 320,281 443,825 6.4
GAS SECTOR PROFILES OF ARAB COUNTRIES
73
about 21 bcm per year. Such a shortage could occur even as early as 2017, probably reflecting the
uncertainty of production increases.50
While the Saudi authorities should continue their major efforts to augment domestic supplies, the time has
probably come for them to consider import options as a permanent or temporary component of the supply
augmentation strategy. Imports from Qatar through a pipeline are an obvious choice to be worked out
carefully. Import of liquefied natural gas (LNG) (following the examples of Kuwait and the United Arab
Emirates, UAE) is another faster option. Also, connection of Qatar and Egypt to the Saudi Master Gas
system will lead to the evolution of a regional gas grid.
Prices
Price reform remains the most important option for restraining demand and improving allocation
efficiency. Gas prices at $0.75/mmbtu need to move in phases up to the levels of the rising costs of
domestic gas production and possible import prices.51
Electricity prices per kWh in 2011 ranged from
1.33 cents to 6.94 cents for residential consumers (based on 11 slabs), from 3.2 to 6.94 cents for
commercial consumers, 3.2 cents to 4.0 cents for industries, and 6.94 cents for government consumers.52
These electricity prices are well below the economic costs of supply calculated using the unsubsidized
traded price of fuels. The electricity price needs to reflect the true economic costs of fuels used, both to
ensure the financial solvency of energy entities and minimize overall losses to the economy.
50
See new item at: http://www.platts.com/RSSFeedDetailedNews/RSSFeed/NaturalGas/8417326. 51
Some gas distribution companies seem to buy gas at $1.12/mmbtu and sell at $1.34/mmbtu (World Bank 2009b). 52
See http://www.ecra.gov.sa. An exchange rate of $1=SR3.75 was used for conversion.

Syrian Arab Republic
With an area of 185,180 square kilometers (km2) and a population of 21.8 million, Syria occupies a
strategic position in the regional energy map, and, despite its current political turmoil and unrest, is an
important transit country for any major regional energy initiative.
Figure A1.26 Map of Syria
Source: World Bank Map IBRD 33492
Reserves
Syria’s proven oil reserves at the end of 2010 are reported at 2.5 million barrels (0.2 percent of the world
total) with a reserves-to-production ratio (RPR) of 17.8 years. Its oil production, which had been
declining over the past several years, stood at 385,000 barrels/day in 2010. It consumed about 72 percent
of the production and exported the balance, which is estimated at 109,000 barrels/day. It also has notable
reserves of oil shale.
Its proven natural gas reserves at the end of 2010 were reported in British Petroleum (BP 2011b) at 258
billion cubic meters (bcm) (or 0.1 percent of world total) with a RPR of 33.2 years. About 60 percent of
the reserves is associated gas. But Syrian oil minister stated that in mid-2010 the proven reserves were
estimated at 284 bcm, 60 percent of which was nonassociated. Syrian offshore blocks are being opened

GAS SECTOR PROFILES OF ARAB COUNTRIES
75
for natural gas exploration (APRC 2011). The discovery of substantial gas deposits offshore of Israel has
induced similar expectations in Syria, Lebanon, and Cyprus offshore blocks.
Production
Marketed domestic production net of flared and recycled gas has increased from about 5 bcm to 7.8 bcm
during the decade (table A1.36), and the government expects production to increase to 13 bcm by 2012.
Table A1.36 Gas Reserves, Production, and Import Data for Syria (bcm)
Item 2000 2001 2002 2003 2004 2005 2006 2007 2008 2009 2010
Reserves 241 250 290 290 290 290 284 270 265 258
Marketed production 5.5 5.0 6.1 6.2 6.4 5.5 5.7 5.6 5.3 5.7 7.8
Imports 0.0 0.0 0.0 0.0 0.0 0.0 0.0 0.0 0.14 0.91 0.60
Consumption 5.5 5.0 6.1 6.2 6.4 5.5 5.7 5.6 5.44 6.61 8.40
Source: BP 2011b.
Note: bcm = billion cubic meters.
Marketed production increased to 8.3 bcm in 2011 (BP 2012), and Fattouh and Stern (2011) suggest that
production could at best increase to 15 bcm with improvements to production sharing agreements (PSAs)
and terms to international oil companies (IOCs) (by 2015) and stagnate until 2020. Further increases will
depend on new discoveries. From gross production, about 25 percent is believed to be used for reinjection
for enhanced oil recovery (EOR). Notable amounts are still flared or vented for want of third-party access
to the gas pipeline systems. The IOCs are believed to sell gas to the state companies at $2.5 per million
British thermal units (mmbtu). One may conjecture production to best reach 20 bcm by 2030, if new gas
reserves are found.
Consumption
Consumption, which stood at around 8.4 bcm in 2010, is expected to more than double and reach 20 bcm
by 2020. The power industry currently accounts for over half the country’s gas consumption, while the
rest is utilized by industry in general and by fertilizer plants in particular. The proportion of electricity
generated from gas is now in excess of 55 percent, and with more power stations being converted to gas,
the proportion is expected to reach 75 percent by 2012. The government is also encouraging the transport
sector to substitute gas for oil where possible, and in particular seeking to develop the use of compressed
natural gas (CNG). The Integrated Energy Strategy Study for Iraq (December 2011), while evaluating the
potential export markets of Iraq, estimates that the Syrian demand for gas will reach 39 bcm by 2030.
Gas Imports
Syria started to import gas through the Arab Gas Pipeline (AGP) from 2008 and contracted for supplies
with Egypt for the initial volume of 0.9 bcm to be stepped up gradually to 2.2 bcm/year by 2013. The
volumes of previous exports were modest and in 2011, the supply rate seems to have fallen to 1.3 million
cubic meters/day (or 0.475 bcm/year) with major supply interruptions. All the imported gas was delivered
to the Deir Ali power station. The price agreed is believed to be $5/mmbtu for the gas, plus $2/mmbtu for
transportation charges to the Egyptian Natural Gas Holding Company (EGAS). There is also a report that
the price in 2009 was $5.25/mmbtu (APRC 2011). However, supply through the AGP was subject to
GAS SECTOR PROFILES OF ARAB COUNTRIES
76
several interruptions in 2011 and to a prolonged stoppage in 2012. Currently there is no gas supply
through the AGP on account of gas shortages in Egypt.
Syria is pursuing several other possibilities for gas imports. These include:
Import of gas from Iraq’s Akkas gas field on its way up to Europe or on its way down to Egypt
via Syria and the AGP.
Import of gas from Turkey for which Syria’s signed an MOU with Turkey in 2009 for the import
of 0.51.0 bcm of gas per year for five years, commencing from the completion date of the gas
pipeline interconnection between the two countries.
Import of Azerbaijani gas through Turkey (and through the pipeline under construction between
Aleppo of Syria and the Turkish border) for which a memorandum of understanding (MOU) was
signed in March 2010. The volume of supply could be 1 bcm by 2012, rising to 2 bcm by 2015.
But the terms of transit with Turkey do not seem to have been finalized so far.
Import of gas from Iran through a gas pipeline from Iran to Syria via Iraq and then on for export
to Europe (the so-called Islamic pipeline). The plan envisages a 56-inch gas pipeline crossing Iraq
—700 km in Iran, 1,000 km in Iraq, and 300 km in Syria—to link with the AGP.
Since Syria has a Mediterranean coastline, it can also possibly pursue an option of importing liquefied
natural gas (LNG). It is believed to have carried out a study for LNG reception and regasification
facilities. Mott Mac Donald’s (2010) study projects Syria’s gas import volumes to grow to 4.4 bcm by
2020 and to 10.9 bcm by 2030.
Gas Exports
A small spur gas pipeline (12 km long with a 24-inch diameter) from the Syrian Gas Pipeline network
near Homs to the Lebanese border was completed in 2003. The 340-kilometer-long pipeline section from
the Lebanese border to the Beddawi power station (650 MW) in Lebanon was completed in 2005. Under
the AGP arrangements, there was an agreement between Syria and Lebanon to supply initially about
0.548 bcm/year of gas to this power station. The supply volume was to be increased to 1.278 bcm/year in
the second phase, when Lebanon would extend the connection to the Zahrani power station in southern
Lebanon by the construction of a 24-inch-diameter, 120-km pipeline. Actual supply commenced only in
October 2009, when a swap arrangement among the Egyptian, Syrian, and Lebanese parties was agreed
upon by which Syria supplied Lebanon from its own system and Egypt supplied an equivalent quantity at
the southern border of Syria. BP statistics indicate an import of 0.04 bcm in 2009 and 0.15 bcm in 2010
from Egypt. The supply was disconnected toward the end of 2010 on account of nonpayment for gas
deliveries by Lebanon. Further disruptions in the Egyptian sections of the AGP have not been conducive
to maintaining continuity of the supply.
Power Sector
The Syrian power system in 2010 had a total installed capacity of 8,200 megawatts (MW) (40 percent
steam turbines, 33.7 percent combined-cycle plants, 10.1 percent gas turbines, 15.2 percent hydropower
units, and 1 percent diesel-generating units) and generated 46,413 gigawatt hours (GWh) of electricity.
The system peak demand was 7,843 MW and the system peak occurred in December. Energy sales in
2010 totaled 33,654 GWh (46 percent residential, 34 percent industrial, 10.4 percent commercial, and 9.6
percent others). The system served nearly 99.9 percent of the population of 20.69 million, and per capita

GAS SECTOR PROFILES OF ARAB COUNTRIES
77
electricity consumption in 2010 was reported at 2,232 kilowatt hours (kWh). Fuel consumption in 2010
was reported at 9.751 millions of tons of oil equivalent (mmtoe), 60.8 percent of which was natural gas,
39 percent heavy fuel oil, and the rest diesel. The natural gas volume used amounted to 6.587 bcm.
During 2004–10 the peak demand and energy generation grew at 6.5 percent per year and 6.4 percent per
year, respectively, and the power system continued to be supply constrained with loads being shed. The
forecast given on the Arab Union of Producers, Transporters and Distributors of Electricity (AUPTDE)
Web site indicates a 6.3 percent per year growth in peak demand and a 6.6 percent growth in energy
generation during 2010–20 (table A1.37)
Table A1.37 Demand Forecast for Electricity in Syria, through 2020
Item 2010 2011 2015 2020 CAGR (%)
Peak demand MW 7,843 8,318 10,632 14,431 6.3
Energy generation GWh 46,413 50,276 64,727 88,490 6.6
Source: http://www.auptde.org.
Note: CAGR = compound annual growth rate; MW = megawatts; GWh = gigawatt hours.
In a 2009 report (World Bank 2009a) the World Bank made a forecast for the period 2007–10. In the base
case the peak demand was projected to grow at 4.9 percent and energy demand at about 4 percent. The
study indicated, for 2020, a peak demand of 12,245 MW and energy generation of 65,752 GWh, both
substantially lower than what is given in table A1.37. Its higher-case projections (15,141 MW and 80,970
GWh) are much closer to the above projection. Its base case indicated a gas requirement of 13.2 bcm per
year by 2020. Based on the data in table A1.37, gas requirements could be around 15 bcm or more if
supplies could be ensured.
Prices
Electricity prices lag behind the cost of production of 8 cents/KWh reported for 2010. The average
electricity tariff in the country is 4.42 cents/kWh. Households pay an average of 2.73 cents/kWh in
several slabs. High-volume consumers pay 4.51 cents/kWh, and low-volume consumers pay 5.67.51
cents/kWh. Price reform, load management, and energy efficiency programs are needed to manage
demand at sustainable levels. It is worth noting that in 2009 the Syrian authorities were considering a gas
price of $10.76/mmbtu for the power sector, corresponding to $387.5 per thousand cubic meters. The
World Bank report cited above suggested that the proposed price for the power sector was well above the
European gas price and the regional gas import price of about $260 per thousand cubic meters (including
local pipeline transport costs), and that a price corresponding to that level might be more appropriate.
Outlook
Syria will be a major player in any regional gas trade initiative because of its strategic location, and its
growing import demand for gas, which could be around 5 bcm by 2020 and 19 bcm by 2030. It will also
be an important transit country. However the current unrest and political turmoil introduce a great deal of
uncertainty. Peace and stability have to be ensured, if any progress has to take place.

Tunisia
Tunisia is a transit country for the export of Algerian gas to Europe. From being a gas importer and minor
producer of gas for a number of years, it is attempting to become an exporter of gas in the near future.
The country has a modest area of 164,150 square kilometers (km2) and a population of 10.2 million.
Figure A1.27 Oil and Gas Map of Tunisia
Source: http://www.etap.com.tn.
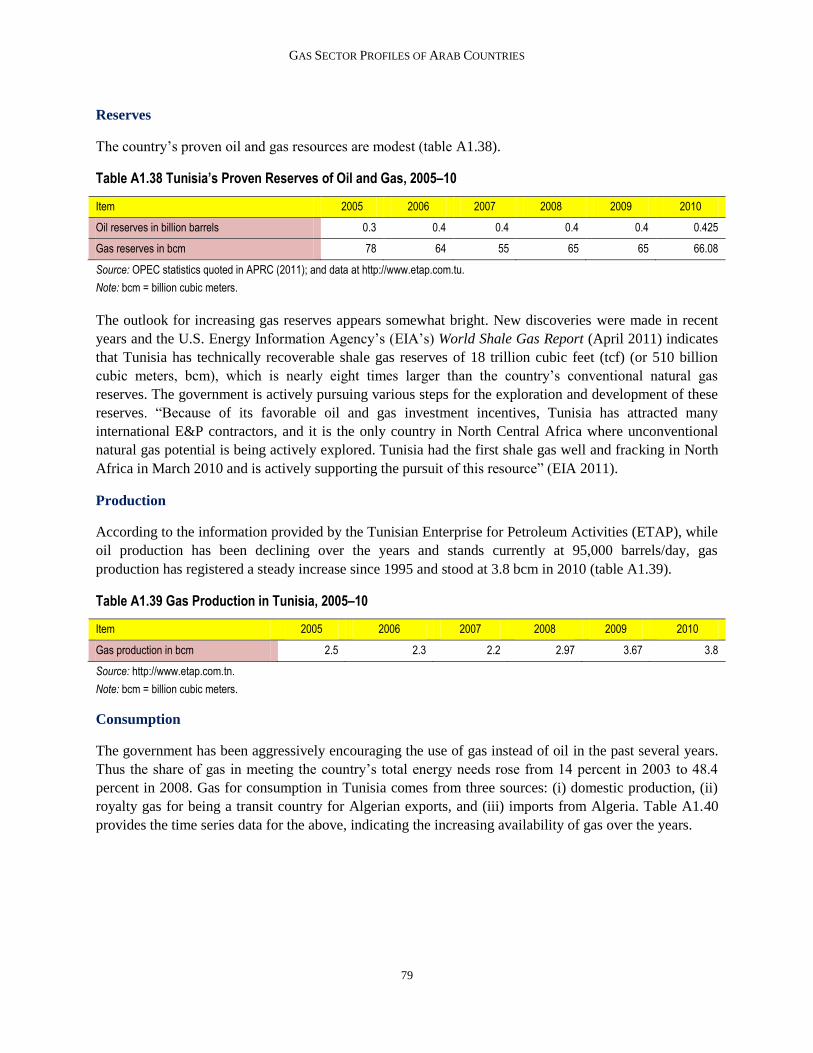
GAS SECTOR PROFILES OF ARAB COUNTRIES
79
Reserves
The country’s proven oil and gas resources are modest (table A1.38).
Table A1.38 Tunisia’s Proven Reserves of Oil and Gas, 2005–10
Item 2005 2006 2007 2008 2009 2010
Oil reserves in billion barrels 0.3 0.4 0.4 0.4 0.4 0.425
Gas reserves in bcm 78 64 55 65 65 66.08
Source: OPEC statistics quoted in APRC (2011); and data at http://www.etap.com.tu.
Note: bcm = billion cubic meters.
The outlook for increasing gas reserves appears somewhat bright. New discoveries were made in recent
years and the U.S. Energy Information Agency’s (EIA’s) World Shale Gas Report (April 2011) indicates
that Tunisia has technically recoverable shale gas reserves of 18 trillion cubic feet (tcf) (or 510 billion
cubic meters, bcm), which is nearly eight times larger than the country’s conventional natural gas
reserves. The government is actively pursuing various steps for the exploration and development of these
reserves. “Because of its favorable oil and gas investment incentives, Tunisia has attracted many
international E&P contractors, and it is the only country in North Central Africa where unconventional
natural gas potential is being actively explored. Tunisia had the first shale gas well and fracking in North
Africa in March 2010 and is actively supporting the pursuit of this resource” (EIA 2011).
Production
According to the information provided by the Tunisian Enterprise for Petroleum Activities (ETAP), while
oil production has been declining over the years and stands currently at 95,000 barrels/day, gas
production has registered a steady increase since 1995 and stood at 3.8 bcm in 2010 (table A1.39).
Table A1.39 Gas Production in Tunisia, 2005–10
Item 2005 2006 2007 2008 2009 2010
Gas production in bcm 2.5 2.3 2.2 2.97 3.67 3.8
Source: http://www.etap.com.tn.
Note: bcm = billion cubic meters.
Consumption
The government has been aggressively encouraging the use of gas instead of oil in the past several years.
Thus the share of gas in meeting the country’s total energy needs rose from 14 percent in 2003 to 48.4
percent in 2008. Gas for consumption in Tunisia comes from three sources: (i) domestic production, (ii)
royalty gas for being a transit country for Algerian exports, and (iii) imports from Algeria. Table A1.40
provides the time series data for the above, indicating the increasing availability of gas over the years.

GAS SECTOR PROFILES OF ARAB COUNTRIES
80
Table A1.40 Increasing Availability of Gas for Tunisia’s Domestic Consumption, 1988–08 (bcm)
Item 1988 1996 2000 2005 2008 2008 (%)
Domestic production 0.393 0.838 1.996 2.524 2.202 47.0
Royalty gas from Algeria 0.517 0.952 1.286 1.295 1.275 27.2
Imported gas from Algeria 0.548 1.039 0.463 0.567 1.206 25.8
Total gas available for consumption 1.458 2.839 3.715 4.386 4.683 100.0
Source: Fattouh and Stern 2011.
Note: bcm = billion cubic meters.
The Web site of STEG, the state-owned electricity and gas utility, indicates slightly different gas
availability data for the period 2006–09, as shown in table A1.41.
Table A1.41 Gas Availability in Tunisia According to STEG, 2006–09
Item 2006 2007 2008 2009
Total gas availability in bcm (converted from toe @ 1 toe = 1.111 bcm) 4.597 4.777 4.933 5.562
Source: STEG’s Web site.
Note: bcm = billion cubic meters; toe = tons of oil equivalent.
On account of the prevailing shortages of gas for domestic consumption, the exploration and production
companies are obliged to sell all marketable gas to STEG at prices given in the government decree under
the Hydrocarbon Code and indexed to 80 percent of the low-sulfur heating oil and 85 percent of the high-
sulfur heating oil (cost, insurance, and freight to Tunisian ports) during the previous nine months. STEG
transported and distributed gas in 2010 to 14 power plants (its own and those of independent power
producers, IPPs), 551 industries, 321 hotels, 314 commercial service entities, and 467,107 other
customers (mostly households). The power sector had the largest share in total consumption at 74 percent,
followed by industry (10 percent) and residential and others (16 percent). The total number of consumers
at present stands at 538,000, and is expected to increase annually by 70,000 through 2015.
Power Sector
At the end of 2010 Tunisia operated a power system with an installed capacity of 3,598 megawatts (MW)
(43 percent gas turbines, 30.3 percent steam power units, 23.2 percent of combined-cycle units, 1.7
percent of hydropower units, and 1.8 percent of wind units), a peak demand of 3,010 MW, and a customer
base of 3.145 million. The electrification rate in the country was 99.5 percent.
In 2010 it produced 14,866 gigawatt hours (GWh) of electricity (98.4 percent thermal power, 1.2 percent
from wind power, and 0.4 percent from hydropower). Its electricity sales in 2010 amounted to 12,867
GWh (43 percent to residential and other LV consumers, 35.6 percent to industrial consumers, and 21.4
percent to commercial, tourism, transport, and services sectors). More than 95 percent of the thermal-
generating capacity had switched from liquid fuels to gas, and all future capacity additions will be based
on the use of natural gas. In 2010 STEG reported that 98.4 percent of the electricity generation was based
on natural gas. The volume of gas consumed in 2010 appears to be 3.95 bcm and the average cost of
production of electricity was reported at 11.4 cents/kWh (http://www.auptde.org).
GAS SECTOR PROFILES OF ARAB COUNTRIES
81
During 2004–10 peak demand grew at a compound annual growth rate (CAGR) of 7 percent and energy
generation at 4.36 percent.53
According to the forecast reported to the AUPTDE Web site by STEG, peak
demand is expected to grow to 3,810 MW by 2015 and to 4,410 MW by 2020, representing a CAGR of
3.9 percent, and energy generation is expected to grow to 18,070 GWh by 2015 and 21,170 GWh by 2020
at a CAGR of 3.6 percent. Forecasts made in the context of a nuclear power project indicate that by 2031
the installed capacity would grow to 10,500 MW (including 1,000 MW of a nuclear plant) and energy
generation would increase to 31 terawatt hours (TWh) (Hakim 2010). Based on power sector forecasts,
gas demand for power is likely to increase from 3.95 bcm in 2010 to 5.63 bcm by 2020 in the absence of
any nuclear power generation.
Gas Demand Forecast
Fattouh and Stern (2011, chapter 3) quote a gas demand projection for Tunisia based on its government’s
vision. This indicates the total domestic demand for gas rising from about 4 bcm in 2007 to about 9.5 bcm
by 2024, and declining slightly to 8.5 bcm by 2030. It observes that in the context of the Tunisian
reserves-to-production ratio (RPR) being around 30 years, the above growth may not be sustainable.
Since then, the outlook on gas reserves seems to have become better and the country is actually planning
to become an exporter of gas to Europe. It is pursuing the South Tunisian Gas Project (STGP) which is a
24-inch gas pipeline to link the gas fields in the south and other potential areas to the Enrico Mattei
Pipeline from Algeria to Italy via Tunisia at a cost of $1.2 billion with the participation of ENI, OMV,
and Pioneer (who altogether have a 50 percent stake), with the objective of facilitating Tunisian exports
of gas to the European Union (EU) from 2014. The front-end engineering studies have been carried out by
a U.K. firm (Fluor). However, Algeria, which, along with ENI of Italy, owns the offshore part of the
Enrico Mattiei pipeline, has not agreed to any capacity allocation for this purpose. Tunisia could use its
new gas production to displace the transit gas it gets from Algeria (by choosing to receive the transit fee
in cash) and additional gas imports from Algeria.
Tunisia as a Transit Country
Tunisia was friendly with both Italy and Algeria and was perceived as a risk-free transit country. But
Tunisia opposed the participation of Sonatrach (of Algeria) in the ownership of the pipeline section
passing through Tunisia. Thus ownership of the gas was transferred to the Italian off-takers at the Algeria-
Tunisia border. Also, there were hassles regarding the transit fees and after a prolonged argument the fee
(or royalty) was settled at 5.25 percent to 6.5 percent of the throughput in cash or kind. The construction
of the pipeline section (370 km) was fully financed by ENI and later turned over to Tunisia, although the
ENI subsidiary retained the exclusive right to transport gas over the pipeline, including the right to allow
third-party access. The above arrangements have been working smoothly.
Libya-Tunisia Pipeline
Private companies in Tunisia and Libya have organized a joint venture, Joint Gas, for the export of 1 bcm
of gas/year from Mellitah of Libya to Gabes of Tunisia through a 24-inch-diameter, 265-km-long pipeline
at an estimated cost of $300 million. Though the planning started in 2003 with the active support of the
two governments, not much progress has been reported so far. The Tunisian government is keen on this to
establish regional links.
53
2004 data are from http://www.auptde.org.

GAS SECTOR PROFILES OF ARAB COUNTRIES
82
Gas Prices
Presently all gas producers are obliged to sell their entire marketed gas to STEG at state-fixed prices,
which are linked to the Tunisia port prices (cost, insurance, freight basis) of a mix of low and high sulfur
heating oils during the previous nine months. Until about 2000 STEG was charging prices to domestic
consumers that involved no subsidy. Since then a gap has developed between the buying and selling
prices of STEG resulting in a subsidy of $227 million tons of oil equivalent of gas (equivalent to $4.28
per million British thermal units) by 2008.

United Arab Emirates (UAE)
The UAE has an area of 84,000 square kilometers (km2) and a population of 4.8 million. It came into
existence on December 2, 1971, when six Trucial sheikdoms entering into a union named the United Arab
Emirates. These were Abu Dhabi, Dubai, Ajman, Sharjah, Umm al Qaiwan, and Fujairah. The seventh
sheikhdom, Ras al-Khaimah, joined in early 1972 (figure A1.28, which spells the place names slightly
differently). Each of these emirates has its own ruler and operates with substantial autonomy, practicing a
form of flexible federalism.
Figure A1.28 Map of the United Arab Emirates
Source: World Bank Map IBRD 33506
Reserves
The UAE has substantial oil and gas resources. Its proven oil reserves were reported at 97.8 billion
barrels, the sixth largest in the world, with a share of 7.1 percent of total world reserves and a reserves-to-
production ratio (RPR) of 94.1 years. It produced, in 2010, a total of 2.849 million barrels/day (3.3
percent of world production) and consumed 0.682 million barrels/day (0.8 percent of world consumption).
Its proven natural gas reserves at the end of 2010 were reported at 6 trillion cubic meters (tcm) or 3.2
percent of the world reserves. It has the seventh-largest reserves in the world with a RPR of over 100
years. Its marketed gas production in 2010 was 51 billion cubic meters (bcm) (or 1.6 percent of the world

GAS SECTOR PROFILES OF ARAB COUNTRIES
84
total), but domestic consumption, at 60.5 bcm (1.9 percent of world total), exceeded production, thus
calling for the import of gas.
More than 94 percent of the country’s oil and gas reserves are located in the Abu Dhabi emirate and the
remaining 6 percent is located in the other emirates (mainly Sharjah, Dubai, and Ras al-Khaimah).
Much of the gas in the UAE is associated and therefore the Organization of Petroleum Exporting
Countries (OPEC) oil production quota acts as a constraint to increased gas production. The free gas tends
to be very sour and expensive to produce and process.
Production
In 2010 the marketed gas was only 64.3 percent of the gross gas production of 79.8 bcm. About 28
percent of the gas was reinjected into the oil wells for enhanced oil recovery (EOR), 1.2 percent was
flared, and 6.5 percent was accounted as “shrinkage.” The need for such a high volume of reinjection
persisted over the decade and gradually increased in percentage terms (annual statistical bulletins of the
OPEC). It is further expected to increase at an annual rate of 8 percent through 2020, unless alternative
techniques for enhanced oil recovery are found.
Data relating to reserves, marketed production, consumption, and exports and imports of gas are
summarized in table A1.42. During 2001–10 domestic consumption increased at a compound annual
growth rate (CAGR) of 5.3 percent, while production could increase at a CAGR of 1.4 percent only.
Thus, the UAE has had to import gas since 2003 to meet domestic needs while maintaining the level of
liquefied natural gas (LNG) exports.54
Until 2006 the UAE had been importing relatively small quantities
of gas by pipeline from Oman. When the Dolphin Pipeline from Qatar was commissioned toward the end
of 2007, larger volumes of import took place from Qatar. In 2010 Dubai commissioned a floating LNG
receiving and regasification terminal,55
and concluded a 15-year LNG purchase/supply contract with
Royal Dutch Shell and Qatargas for an annual supply of 4.13 bcm. In 2010 the UAE imported 17.25 bcm
of gas through the Dolphin Pipeline and 0.16 bcm of LNG from Qatar.
Table A1.42 Reserves, Production, Consumption, Exports, and Imports of Gas in the UAE, 2001–11 (bcm)
Item 2001 2002 2003 2004 2005 2006 2007 2008 2009 2010 2011
Reserves 6,058 6,054 6,047 6,083 6.115 6,441 6,437 6,090 6,090 6,031 6,100
Marketed production 44.9 43.4 44.8 46.3 47.8 49.0 50.3 50.2 48.8 51.0 51.7
Domestic consumption 37.9 36.4 37.9 40.2 42.1 43.4 49.2 59.5 59.1 60.5 62.9
LNG exports 7.08 7.11 7.40 7.41 7.50 7.77 7.72 7.57 7.69 7.98 8.0
Imports 0.0 0.0 0.20 1.2 1.40 1.40 1.75 15.4 17.25 17.41 19.2
Source: BP 2011b.
Note: bcm = billion cubic meters; LNG = liquefied natural gas; UAE = United Arab Emirates.
The 2012 edition of the BP Statistical Review of World Energy indicates a marketed production of 51.7
bcm and a consumption level of 62.9 bcm in 2011. LNG exports were at 8 bcm and imports were 17.3
bcm by pipeline and 1.9 bcm as LNG.
54
LNG exports from the UAE commenced as early as 1977. 55
The terminal will have annual capacity of 4.14 bcm or 3 million tons of LNG.

GAS SECTOR PROFILES OF ARAB COUNTRIES
85
Outlook for Increased Production
Increases in the production of associated gas are seriously constrained by the Organization of Petroleum
Exporting Countries (OPEC) production quotas, as well as the increased need for gas reinjection for EOR.
Therefore, the government is according high priority and a large allocation of funds for the exploration
and production of free gas. Some of the major projects being pursued are the: (i) Onshore Gas
Development III Project (12 bcm/year), (ii) Asab Gas Development Project (7.8 bcm/year), (iii) Habshan-
5 project (10.3 bcm/year for enhanced oil recovery and 10.3 bcm for domestic market), and (iv) Hail Gas
Development Project in the offshore field of Hail (with sour gas) in the shallow waters (5.18 bcm/year)
In addition, the Shah Gas Development Project for the production of 10.32 bcm of raw gas from the
onshore Shah Gas field of Abu Dhabi is being implemented with Occidental Petroleum as a partner with a
40 percent stake. The gas from this field is highly sour with 23 percent of hydrogen sulfide and 10 percent
carbon dioxide. After processing, the output will consist of 5.18 bcm of dry gas/year besides sulfur (9,090
tons/day), condensates (50,000 barrels/day), and gas liquids (4,400 tons/day). The gas is estimated to cost
about $5 per million British thermal units (mmbtu) and the output is expected by 2014.
Further avenues for increasing domestic supply include efforts to: (i) reduce gas flaring further leading to
an incremental supply of 1.0 bcm/year or more, and (ii) reduce the gas used for EOR by resorting to
water, nitrogen, or carbon dioxide injection as technology progresses. This could release upwards of 18 to
20 bcm for domestic consumption. Some efforts in this regard are already being made.
It is projected that the production of marketed gas will increase from 51 bcm in 2010 to 65 bcm by 2015
and to 78 bcm by 2020. Also, most of the incremental production of gas is going to be expensive, costing
around $5/mmbtu or more.
Consumption
The supply situation was tight during the past few years leading to serious power shortages and load
shedding, constraining industrial growth as originally planned and causing problems to the public.
Consumption is mainly driven by the fuel needs for power generation, but the demand for water from
desalination plants, petrochemical industries, fertilizer units, cement plants, aluminum industries, and
compressed gas for motor vehicles, as well as for the distribution network serving the population are
becoming significant. Overall the demand for domestic consumption was expected to increase at 8
percent per year as estimated by the UAE authorities. But according to Fattouh and Stern (2011, chapter
12), supply constrained consumption, which stood at 60.5 bcm in 2010 and is expected to increase to 88.5
bcm by 2015 and 107.5 bcm by 2020 (Fattouh and Stern 2011, chapter 12). Given the likely production
increases the supply constraint will prevail throughout, necessitating substantial imports.
Power Sector
Power generation (including sea water desalination) is the key activity that drives gas demand in the
UAE.56
More than 95 percent of electricity in Abu Dhabi and more than 81 percent of the electricity in the
UAE as a whole are based on the use of natural gas fuel.
56
This section is based on information from EIA (2011), Nomura Research Group (2009), Breeze (2010), and
http://www.auptde.org.

GAS SECTOR PROFILES OF ARAB COUNTRIES
86
Figure A1.29 Electricity Map of the UAE
Source: Abu Dhabi Water and Electricity Company.
The installed capacity in the UAE at the end of 2010 was 23,238 MW of which 12,222 MW was in the
Abu Dhabi emirate, 7,361 MW was in the Dubai emirate, 2,576 MW was in the Sharjah emirate, and
1,080 MW was in the other emirates. In Abu Dhabi, nearly 96 percent of the capacity is being owned and
operated by independent power producers (IPPs) and independent water and power producers (IWPPs).
The peak demand in the UAE in 2010 was 16,980 MW and electricity generation was reported at 88.2
terawatt hours (TWh).
Peak demand had grown from 10,334 MW in 2004 to 16,980 MW in 2010 at an annual rate of 8.63
percent and was expected (by the authorities) to grow to 40,858 MW by 2020. Energy generation grew
from 58.5 TWh in 2004 to 88.2 TWh in 2010 at a CAGR of 7.1 percent. But the government has since
scaled down the growth rates based on the 2008 recession and projected a revised peak demand of 33.5
gigawatts by 2020 (Fattouh and Stern 2011, chapter 12). In a recent forecast made by the Nomura
Research Group a peak demand of 31,000 MW and a generation of 172 TWh were envisaged for 2020,
probably also based on the earlier world economic recession. But on the Web site of the Arab Union for
Producers, Transmitters and Distributors of Electricity (www.auptde.org), the UAE reported a forecast for
the year 2009 summarized in table A1.43.
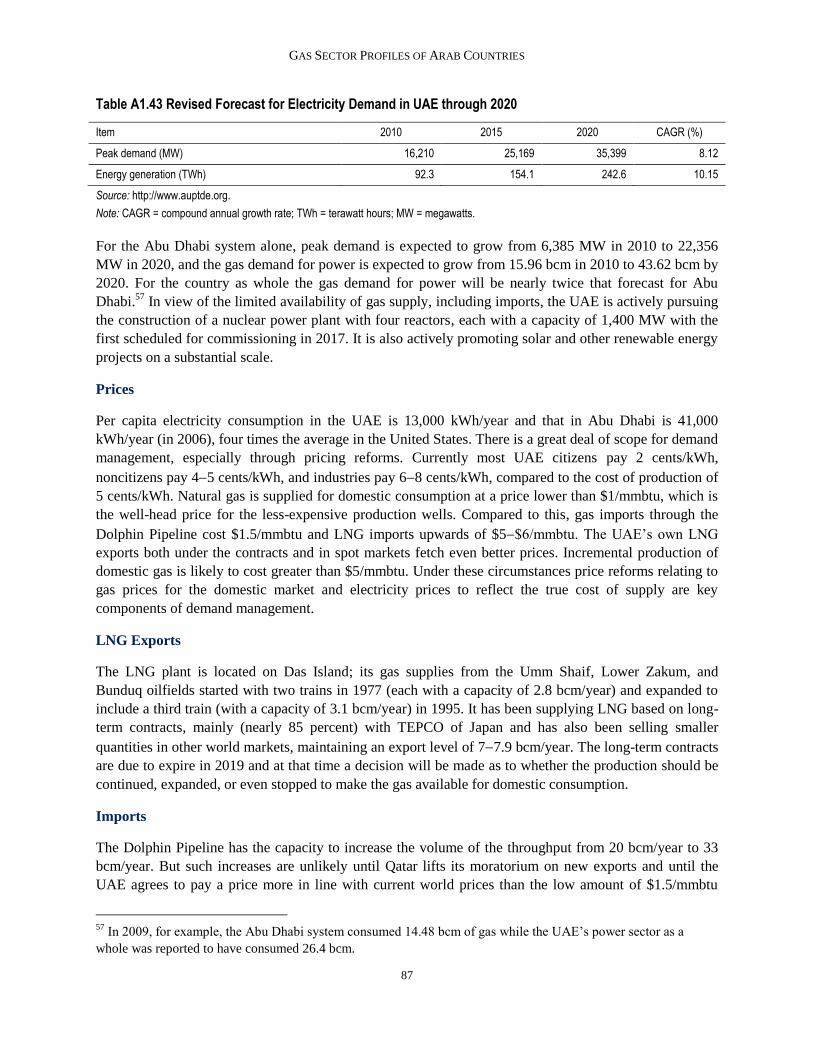
GAS SECTOR PROFILES OF ARAB COUNTRIES
87
Table A1.43 Revised Forecast for Electricity Demand in UAE through 2020
Item 2010 2015 2020 CAGR (%)
Peak demand (MW) 16,210 25,169 35,399 8.12
Energy generation (TWh) 92.3 154.1 242.6 10.15
Source: http://www.auptde.org.
Note: CAGR = compound annual growth rate; TWh = terawatt hours; MW = megawatts.
For the Abu Dhabi system alone, peak demand is expected to grow from 6,385 MW in 2010 to 22,356
MW in 2020, and the gas demand for power is expected to grow from 15.96 bcm in 2010 to 43.62 bcm by
2020. For the country as whole the gas demand for power will be nearly twice that forecast for Abu
Dhabi.57
In view of the limited availability of gas supply, including imports, the UAE is actively pursuing
the construction of a nuclear power plant with four reactors, each with a capacity of 1,400 MW with the
first scheduled for commissioning in 2017. It is also actively promoting solar and other renewable energy
projects on a substantial scale.
Prices
Per capita electricity consumption in the UAE is 13,000 kWh/year and that in Abu Dhabi is 41,000
kWh/year (in 2006), four times the average in the United States. There is a great deal of scope for demand
management, especially through pricing reforms. Currently most UAE citizens pay 2 cents/kWh,
noncitizens pay 45 cents/kWh, and industries pay 68 cents/kWh, compared to the cost of production of
5 cents/kWh. Natural gas is supplied for domestic consumption at a price lower than $1/mmbtu, which is
the well-head price for the less-expensive production wells. Compared to this, gas imports through the
Dolphin Pipeline cost $1.5/mmbtu and LNG imports upwards of $5$6/mmbtu. The UAE’s own LNG
exports both under the contracts and in spot markets fetch even better prices. Incremental production of
domestic gas is likely to cost greater than $5/mmbtu. Under these circumstances price reforms relating to
gas prices for the domestic market and electricity prices to reflect the true cost of supply are key
components of demand management.
LNG Exports
The LNG plant is located on Das Island; its gas supplies from the Umm Shaif, Lower Zakum, and
Bunduq oilfields started with two trains in 1977 (each with a capacity of 2.8 bcm/year) and expanded to
include a third train (with a capacity of 3.1 bcm/year) in 1995. It has been supplying LNG based on long-
term contracts, mainly (nearly 85 percent) with TEPCO of Japan and has also been selling smaller
quantities in other world markets, maintaining an export level of 77.9 bcm/year. The long-term contracts
are due to expire in 2019 and at that time a decision will be made as to whether the production should be
continued, expanded, or even stopped to make the gas available for domestic consumption.
Imports
The Dolphin Pipeline has the capacity to increase the volume of the throughput from 20 bcm/year to 33
bcm/year. But such increases are unlikely until Qatar lifts its moratorium on new exports and until the
UAE agrees to pay a price more in line with current world prices than the low amount of $1.5/mmbtu
57
In 2009, for example, the Abu Dhabi system consumed 14.48 bcm of gas while the UAE’s power sector as a
whole was reported to have consumed 26.4 bcm.

GAS SECTOR PROFILES OF ARAB COUNTRIES
88
agreed for the first 18.6 bcm. It is possible that after the moratorium is lifted some additional volumes of
interruptible supplies could materialize for meeting peak-hour or peak-season demands at international
prices.
Crescent Petroleum of the UAE contracted with Iran for supply of 6.2 bcm of gas/year for 25 years from
the Salman field of Iran to the UAE. The delivery was to commence from 2005. But even though the 231-
km-long submarine pipeline has been constructed there has been no supply from Iran, which has disputed
that the agreed price of $0.5/mmbtu is too low and wants a price in the range of $1213 /mmbtu (so-
called “European prices”). Though Crescent increased its offer to $5/mmbtu, the dispute has not been
resolved yet and there has been no supply.
The UAE is also pursuing a LNG import option. Shell and Qatar Petroleum’s Qatargas LNG venture has
signed a 15-year LNG supply contract with Dubai, which will import 1.5 million tons/year delivered
throughout the peak demand season (May to October), starting in 2010. The gas will be partly sourced
from Qatargas’ liquefaction plants (most probably from the Qatargas IV train) in Qatar, and partly from
other facilities in Shell’s LNG production portfolio.
The U.K.’s Golar has been awarded the contract to supply a floating storage and regasification unit
(FSRU) vessel to the Dubai Supply Authority (DUSUP, Dubai’s state-owned authority owning all gas
pipelines and managing its gas purchases). The DUSUP has signed a 10-year charter agreement, with a
five-year extension option, whereby Golar will convert its LNG carrier Golar Freeze into a FSRU, with an
LNG storage capacity of 125,000 tons and a regasification capacity of 480 million cubic feet/day
(equivalent to the regasification of 3 million tons/year of LNG). Golar put the value of its 10-year contract
at $450 million. The conversion was finalized and the ship commissioned for its Dubai mission by the
beginning of the second quarter of 2010.
The DUSUP constructed a jetty for the FSRU’s permanent mooring as well as receiving facilities
(including a 1,500-meter undersea gas pipeline, connections to the local pipeline network, and landing
areas for delivery vessels), in addition to the permanent jetty at the Jebel Ali port.58
In 2010 the UAE actually imported 0.16 bcm of LNG from Qatar, and volume seems to have increased to
1.9 bcm in 2011.
A recent proposal to establish an FSRU-type LNG import terminal on the Omani coast at Fujairah has is
being considered by the Abu Dhabi government, as such a location would avoid the need for LNG cargo
ships to pass through the Strait of Hormuz and the waterway that separates the UAE from Iran.59
58
http://www.ameinfo.com/154640.html. 59
http://www.thenational.ae/events/areas/abu-dhabi/mubadala-to-build-big-gas-terminal-in-fujairah.
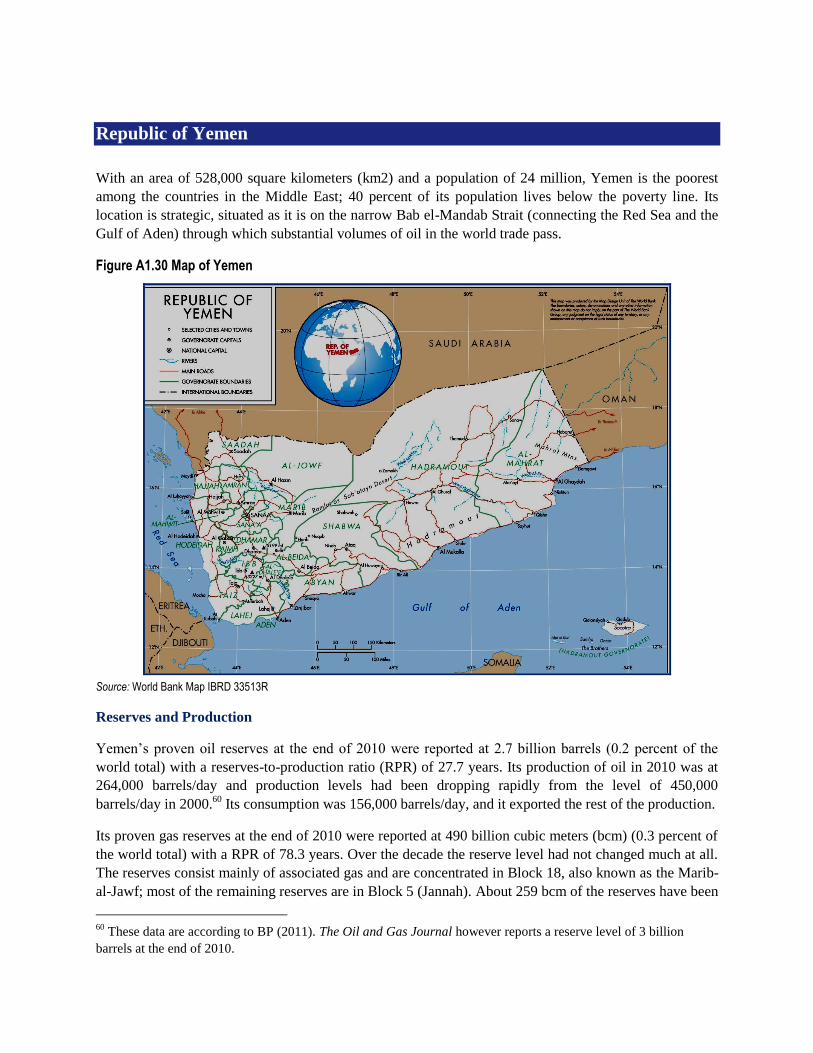
Republic of Yemen
With an area of 528,000 square kilometers (km2) and a population of 24 million, Yemen is the poorest
among the countries in the Middle East; 40 percent of its population lives below the poverty line. Its
location is strategic, situated as it is on the narrow Bab el-Mandab Strait (connecting the Red Sea and the
Gulf of Aden) through which substantial volumes of oil in the world trade pass.
Figure A1.30 Map of Yemen
Source: World Bank Map IBRD 33513R
Reserves and Production
Yemen’s proven oil reserves at the end of 2010 were reported at 2.7 billion barrels (0.2 percent of the
world total) with a reserves-to-production ratio (RPR) of 27.7 years. Its production of oil in 2010 was at
264,000 barrels/day and production levels had been dropping rapidly from the level of 450,000
barrels/day in 2000.60
Its consumption was 156,000 barrels/day, and it exported the rest of the production.
Its proven gas reserves at the end of 2010 were reported at 490 billion cubic meters (bcm) (0.3 percent of
the world total) with a RPR of 78.3 years. Over the decade the reserve level had not changed much at all.
The reserves consist mainly of associated gas and are concentrated in Block 18, also known as the Marib-
al-Jawf; most of the remaining reserves are in Block 5 (Jannah). About 259 bcm of the reserves have been
60
These data are according to BP (2011). The Oil and Gas Journal however reports a reserve level of 3 billion
barrels at the end of 2010.

GAS SECTOR PROFILES OF ARAB COUNTRIES
90
allocated for LNG export and 29 bcm for domestic use. The remaining 142 bcm of the above reserves are
yet to be independently certified. About 54 bcm of them could be mobilized in the near term for
additional supplies. There does not seem to be any major prospect of significant additions to the reserves.
But the World Bank (June 2007) report, Republic of Yemen, A Natural Gas Incentive Framework,
indicates that as of April 2007 Yemen’s proven reserves were 516 bcm; proven and probable reserves
were 667 bcm; and proven, probable, and possible reserves were 776 bcm.
The gas produced in Yemen is associated; therefore an increase in gas production is tied up with increases
in oil production, which are proving difficult. The oil production also calls for an ever-increasing volume
of gas for enhanced oil recovery (EOR). Natural gas production began in Yemen in 1993, reached a peak
of 20.5 bcm in 2005, and began to decline thereafter. Until 2008 most of the associated gas produced was
reinjected for EOR and the remaining gas was flared for want of gas gathering and utilizing facilities.
With the commissioning of the LNG plant in 2009, marketed gas production commenced and shot up to
6.2 bcm in 2010. According to the EIA Country Analysis Brief of February 2011, Yemen produced 14.42
bcm of gas—of which 12.49 bcm was reinjected for EOR, 0.51 bcm was vented or flared, and 1.42 bcm
was marketed in 2009. Out of this 0.42 bcm was allocated for the liquefied natural gas (LNG) facility and
the rest was consumed domestically. But British Petroleum (BP) statistics indicate a much lower level of
marketed production at 0.8 bcm (table A1.44). By 2011, however, the situation had improved in terms of
marketed production and exports.
Table A1.44 Reserves, Production, Exports, and Consumption of Natural Gas in Yemen, 2001–11 (bcm)
2001 2002 2003 2004 2005 2006 2007 2008 2009 2010 2011
Proven reserves 479 479 479 479 479 485 488 490 488 490 500
Marketed production — — — — — — — — 0.80 6.24 9.4
LNG exports — — — — — — — — 0.42 5.48 8.9
Consumption — — — — — — — — 0.38 0.76 0.5
Source: BP 2011b and 2012.
Note: bcm = billion cubic meters; LNG = liquefied natural gas.
— Not available.
LNG Export
Yemen LNG Company (YLNG) owns and operates the liquefaction plant at Balhalf, a southern coastal
city. It has two LNG trains with a total capacity of 6.7 million tons of LNG per year (about 9.246 bcm of
gas/year). The first train was commissioned in 2009 and deliveries commenced in November 2009; the
second train became operational in April 2010. The total completed capital cost was reported at $4.5
billion. Total of France has a 39.62 percent stake in YLNG, followed by three Korean firms (21.43
percent), Hunt Oil (17.22 percent), Yemen Gas Company (16.73), and Yemen Authority for Social
Security and Pension (5 percent). The gas is supplied from the Marib gas field through two gas-
processing facilities located at al-Kamil, and a 320-km-long, 38-inch-diameter main pipeline from al-
Kamil to Balhaf. Almost the entire output is covered by three long-term contracts for a term of 20 years.
News reports in January 2012 confirm that production and exports of about 8.9 bcm were achieved in
2011, despite a brief interruption caused by the blow-up of the gas pipeline during the unrest. Gas is being
sold to the LNG Company at $0.50 per million British thermal units (mmbtu).
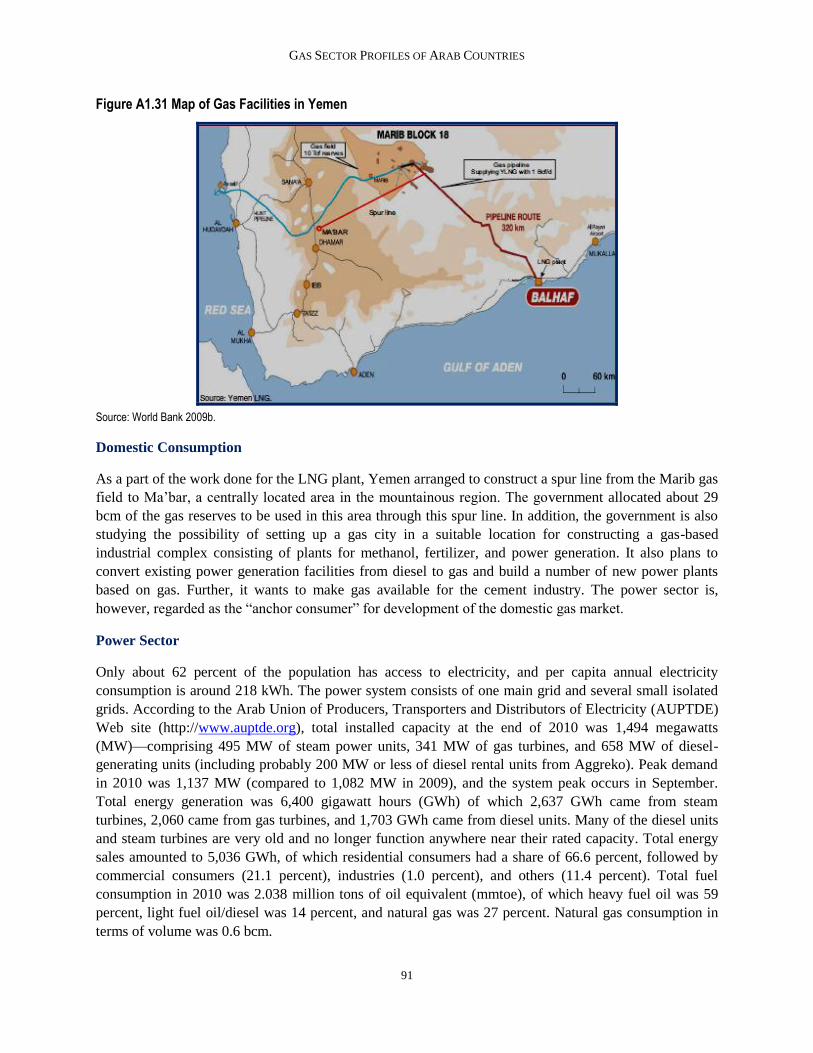
GAS SECTOR PROFILES OF ARAB COUNTRIES
91
Figure A1.31 Map of Gas Facilities in Yemen
Source: World Bank 2009b.
Domestic Consumption
As a part of the work done for the LNG plant, Yemen arranged to construct a spur line from the Marib gas
field to Ma’bar, a centrally located area in the mountainous region. The government allocated about 29
bcm of the gas reserves to be used in this area through this spur line. In addition, the government is also
studying the possibility of setting up a gas city in a suitable location for constructing a gas-based
industrial complex consisting of plants for methanol, fertilizer, and power generation. It also plans to
convert existing power generation facilities from diesel to gas and build a number of new power plants
based on gas. Further, it wants to make gas available for the cement industry. The power sector is,
however, regarded as the “anchor consumer” for development of the domestic gas market.
Power Sector
Only about 62 percent of the population has access to electricity, and per capita annual electricity
consumption is around 218 kWh. The power system consists of one main grid and several small isolated
grids. According to the Arab Union of Producers, Transporters and Distributors of Electricity (AUPTDE)
Web site (http://www.auptde.org), total installed capacity at the end of 2010 was 1,494 megawatts
(MW)—comprising 495 MW of steam power units, 341 MW of gas turbines, and 658 MW of diesel-
generating units (including probably 200 MW or less of diesel rental units from Aggreko). Peak demand
in 2010 was 1,137 MW (compared to 1,082 MW in 2009), and the system peak occurs in September.
Total energy generation was 6,400 gigawatt hours (GWh) of which 2,637 GWh came from steam
turbines, 2,060 came from gas turbines, and 1,703 GWh came from diesel units. Many of the diesel units
and steam turbines are very old and no longer function anywhere near their rated capacity. Total energy
sales amounted to 5,036 GWh, of which residential consumers had a share of 66.6 percent, followed by
commercial consumers (21.1 percent), industries (1.0 percent), and others (11.4 percent). Total fuel
consumption in 2010 was 2.038 million tons of oil equivalent (mmtoe), of which heavy fuel oil was 59
percent, light fuel oil/diesel was 14 percent, and natural gas was 27 percent. Natural gas consumption in
terms of volume was 0.6 bcm.

GAS SECTOR PROFILES OF ARAB COUNTRIES
92
Total, a major stake holder in YLNG and the operator of certain oilfields in Block 10, is constructing a 40
MW power plant (to be eventually expanded to about 100 MW) which is likely to be commissioned in
2012. This plant will use natural gas extracted from the Kharir oilfield in Block 10 as fuel and will mainly
provide electricity for the industrial facilities and operations at the field. It would feed the surplus power
to the grid.
During 2000–10 peak demand grew from 477 MW to 1,137 MW at a compound annual growth rate
(CAGR) of 9.1 percent, and energy generation grew from 2,960 GWh to 6,400 GWh at a CAGR of 8.0
percent. Utility forecasts made in 2009 on the above Web site indicate a peak demand 1,647 MW and an
energy generation of 10,687 GWh for 2020, implying a growth rate of 3.8 percent (in peak demand) and
6.7 percent (in energy generation).
But the Ministry seemed to have made a forecast of 3,102 MW of peak demand and 17,663 GWh of
energy generation in 2020 (implying a growth rate of 10.6 percent for peak demand and 10.7 percent for
energy generation), calling for the addition of 3,722 MW to make up for the retirement of old units and to
provide a 20 percent reserve margin (World Bank 2009b). Thus the government drew up an ambitious
program of adding 10 new gas-fired turbine power stations with a total capacity of 3,435 MW in the next
several years which would (over their lifetime of 25 years) require 6.5 bcm of gas/year. Uncertainty about
the availability of that much gas and the need to use gas efficiently (based on its true economic value) led
to a change in the plans, reducing the number of stations to realistic levels and turning most of them into
combined-cycle plants. Thus by 2020 new capacity added would most likely be Marib 2 (528 MW) and
Marib 3 (396 MW), besides some wind and solar units (180 MW).
A World Bank (2007) report calculated that about 2,500 MW of power plants (consisting of about 590
MW of existing plants run on oil and planned new plants of about 1,910 MW) could be run on natural
gas, the annual demand for which was calculated as 4.088 bcm on the basis that all new additions would
be open-cycle gas turbines. If some of them were to be constructed as combined-cycle units, the gas
demand could come down to 3.316 bcm.
Prices
Average electricity revenue is about 6 cents/kilowatt hour (kWh). Residences pay 2.08.5 cents in several
slabs, commercial consumers pay 8.5 cents, industrial consumers pay 7.5 cents, the government pays 9
cents, and water supply companies pay 7.5 cents/kWh. Gas prices to the power company are not
available, but there are reports that the government considered a rate of $3.2/mmbtu before gas supply
commenced (World Bank 2009b).
Outlook
Yemen is likely to continue its LNG exports at the current level and develop a domestic gas market
gradually, with the power sector providing the anchor demand. It is unlikely to increase its exports or
resort to imports of gas. Its domestic gas market growth will be determined by the pace of growth of its
modest resource potential. The domestic demand may increase to 5 bcm by 2020 and 8 bcm by 2030,.
Assuming that there is no further expansion of the LNG production facility, the total demand for gas in
Yemen may rise to about 15 bcm by 2020 and to 18 bcm by 2030. Production increases could possibly
meet this level of demand, provided peace and order are restored and legitimate governance arrangements
are in place.
References
This reference list includes works cited in volumes 1 and 2.
APRC (Arab Petroleum Research Center). 2011. Natural Gas Survey, Middle East and North Africa
2011. Paris.
Arab Forum for Environment and Development. 2011. Arab Environment.4—Green Economy:
Sustainable Transition in a Changing Arab World. Report of the Arab Forum for Environment
and Development. Beirut.
BP (British Petroleum). 2010. BP Statistical Review of World Energy. London. June.
———. 2011a. BP Energy Outlook 2030. London. January.
———. 2011b. BP Statistical Review of World Energy. London. June.
———. 2012. BP Statistical Review of World Energy. London.
Breeze, Paul. 2010. “UAE Seeks Broader Fuel Mix.”
http://www.powerengineeringint.com/articles/mee/print/volume-7/issue-4/features/uae-seeks-
broader-fuel-mix.html.
CEE (Center for Energy Economics). 2007. “An Introduction to LNG.”
http://www.beg.utexas.edu/energyecon/lng/default.php.
CIA (Central Intelligence Agency). “CIA Fact Book.” https://www.cia.gov/library/publications/the-
world-factbook/.
Clerici, Alessandro, and Andrea Longhi. 2008. “Competitive Transmission Systems as Alternative to
Pipeline Gas Transport For Electricity Delivery.” World Energy Council.
http://www.worldenergy.org/wec-geis/publications/default/tech_papers/17th_congress/2_2_08.
Credit Suisse Security (Europe) Limited. 2011. Global Gas. Global Equity Research. November 22.
https://doc.research-and-
analytics.csfb.com/docView?language=ENG&source=ulg&format=PDF&document_id=9302412
91&serialid=FLoXy50ozejW9omrsXigbICBBqVvtGuZZgRHfhyBOwY%3D
Cornot-Gandolphe, Sylvie, Olivier Appert, Ralf Dickel, Marie-Françoise Chabrelie, and Alexandre Rojey.
2003. “The Challenges of Further Cost Reductions for New Supply Options (Pipeline, LNG,
GTL).”
Presented at the World Gas Conference 22, Tokyo, Japan, June 15.
http://www.cedigaz.org/Fichiers/pdf_papers/challenge%20of%20further.pdf.
Dargin, Justin. 2009. “Prospects for Energy Integration in the GCC.” Presentation at Research Seminar-
Dubai School of Government, March 3, 2009. http://www.dsg.ae/Portals/0/DSG-Seminar-2009-
Dargin1.pdf.
GAS SECTOR PROFILES OF ARAB COUNTRIES
94
Economic Consulting Associates. 2005. “Study of Electricity Trade Potential in the Black Sea Region.”
Study carried out for the World Bank. London. October.
EEHC (Egyptian Electricity Holding Company). Annual Report of EEHC for FY 2009–10.
http://www.egelec.com/.
EIA (U.S. Energy Information Agency). 2011. World Shale Gas Resources: An Initial Assessment of 14
Regions outside the United States. U.S. Department of Energy, Washington, DC.
———. Various dates. Country Analysis Briefs. U.S. Department of Energy, Washington, DC.
www.eia.gov.
Euro-Arab Mashreq Gas Cooperation Center. 2007. Euro-Arab Mashreq Gas Market Project—
Legislative and Regulatory Survey.
Fattouh, Bassam, and Jonathan Stern (eds.). 2011. Natural Gas Markets in the Middle East and North
Africa. Oxford: Oxford Institute for Energy Studies/Oxford University Press.
GECOL (General Electricity Company of Libya). 2009. “The Libyan Electric Power Sector.” GECOL
presentation, Tripoli, February 2009.
http://www.auptde.org/newsite/UploadFiles/Activitypaperfile/367.ppt.
Hakim, Mohamed. “Nuclear Power Plant Feasibility Study Human Resource Development.” A
presentation at Abu Dhabi, March 2010. http://www.iaea.org
Hamso, Bjorn, Afsaneh Mashayekhi, and Hossein Razavi. 1994. “International Gas Trade, Potential
Major Projects.” Annual Review of Energy and Environment 19: 3773.
IEA (International Energy Agency). 2010a. Medium-Term Oil and Gas Markets. Paris.
———. 2010b. World Energy Outlook. Paris.
———. 2011. Are We Entering a Golden Age of Gas? Special Report. Paris. June.
———. 2012. Iraq Energy Outlook. World Energy Outlook Special Report. Paris. October 9.
Kupisz, Richard. 2009. “Strategic Issues and Options for the Arab Mashreq Gas Market, Round Table on
Energy Tariffs and Investment.” Presentation by Team Leader at the Euro-Arab Mashreq Gas
Cooperation Center, February 11, 2009.
Melling, Anthony J. 2010. Natural Gas Pricing and Its Future: Europe as the Battleground. Washington,
DC: Carnegie Endowment for International Peace.
MERE (Ministry of Energy and Mineral Resources) (Jordan). 2009. Annual Report 2009. Amman:
MERE.
Mott MacDonald. 2010. Supplying the EU Natural Gas Market—Final Report. Croydon, England.
http://ec.europa.eu/energy/international/studies/doc/2010_11_supplying_eu_gas_market.pdf.
Nomura Research Group. February 2009. “Report on Middle East Energy and Power.” London.
http://www.nomura.com.

GAS SECTOR PROFILES OF ARAB COUNTRIES
95
Oil and Gas Directory Middle East. 2011. “Research Profile Libya.”
http://www.oilandgasdirectory.com/research/libya.pdf.
Razavi, Hossein. 2009. “Natural Gas Pricing in Countries of MENA.” The Energy Journal 30 (3).
Sleiman, Zahar. 2012. “Lebanese Current and Future Gas Markets.” Presentation to Lebanon International
Petroleum Exploration Forum and Exhibition, July 3–4. http://www.lebanon-
exploration.com/DownLoads/LIPE_2012/Presentations/MEW-F-Lebanese_Gas_Market.pdf.
Stern, Jonathan. “Natural Gas in Europe—The Importance of Russia.”
http://www.centrex.at/en/files/study_stern_e.pdf.
The Oil Drum. 2011. “Egypt’s Natural Gas Trends and Potential Impacts.”
http://www.theoildrum.com/node/7477.
Wood Mackenzie, Ltd. 2011. “Upstream Insights—Iraq’s Gas Export Options.” London. October.
World Bank. 2007. “Republic of Yemen, A Natural Gas Incentive Framework.” Formal Report 327/07.
Washington, DC. June.
———. 2008. “Republic of Lebanon: Electricity Sector Public Expenditure Review.” World Bank Report
41421-LB, Washington, DC, January 31, 2008.
———. 2009a. “Syria Electricity Strategy Note.” World Bank, Washington, DC.
———. 2009b. Exploring the Potential for Interconnection and Electricity Trade among Yemen and the
GCC Countries. Washington, DC: World Bank. October.
———. 2010a. “Electricity Trade Study for the Kingdom of Saudi Arabia.” World Bank, Washington,
DC.
———. 2010b. Project Appraisal Document, Giza North Power Project. World Bank, Washington, DC.
———. 2010c. “Potential of Energy Integration in Mashreq and Neighboring Countries.” Report 54455-
MNA. Washington, DC. June.