Embed Size (px)
Citation preview

Regional Energy Outlook
ASIA: IndiaMudit Narain, Laboratory for Energy and the EnvironmentMassachussetts Insitute of Technology
Zehra Ali, Mechanical EngineeringMassachussetts Insitute of Technology

The Rise of China and India
• Land and population• Recent economic growth – opportunity or
threat to the world?• Increase of global influence • Development vs. environment protection• Global climate change• Focus on India

Outline
• Energy and emissions data• Energy consumption and rural
development: Re-examining the relation• Energy, environment and poverty• Economics of supplying clean energy• Suggested policy map

A Rapidly Growing Economy
• Real GDP growth: 6.9% (1991-2005)
• Expected GDP growth 2006: 8.9%

Outline
• Energy and emissions data• Energy consumption and rural
development:– Re-examining the relation– Energy, environment and poverty
• Economics of supplying clean energy• Suggested policy map

Energy related figures (EIA figures)
• Oil Consumption (2005): 2.52 million barrels per day (US: ~21mbpd)
• Recoverable Coal Reserves: (2003Est) 92 Billion tons– Current consumption: ~380 million tons per
year• Per capita annual electricity consumption:
~530 kWh

Energy situation in India and growth projections
Wind0.001%
Hydro Power1.4%
Coal33%
Biomass and Waste43%
Nuclear Power0.2%
Oil19%
Gas3.9%
India has an annual primary energy consumption of 19 EJ per year

India’s primary energy consumption
India's primary energy supply by source
53%34%
7% 5% 1%
Coal
Oil
natural Gas
Hydro
Nuclear
• The annual primary commercial energy consumption around 14.7 EJ
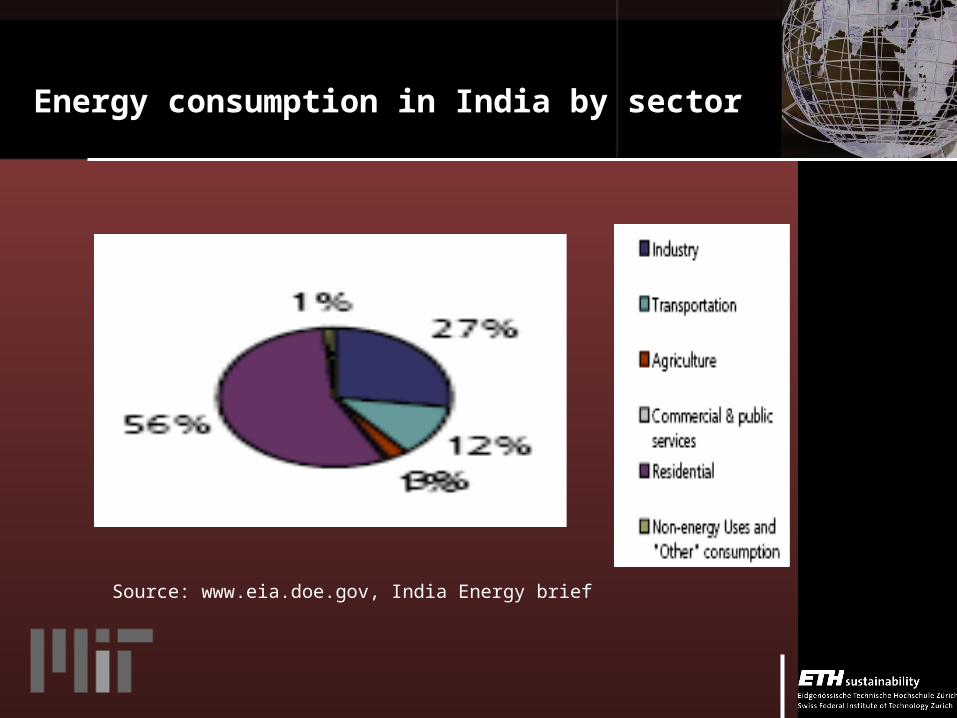
Energy consumption in India by sector
Source: www.eia.doe.gov, India Energy brief

Emissions from India
• Energy-Related Carbon Dioxide Emissions (2004) 1,112.84 million metric tons, – Coal (65%)
• Per-Capita, Energy-Related Carbon Dioxide Emissions (2004E) – 1 metric ton CO2,( ~300kg C)
• China: 3.62 tons/year/person• US: 20.18 tons/year/person• Europe: 7.96 tons/year/person
– Absolute emissions: 1/6th of that of US– Per Capita emissions: 1/20th that of the US
• Carbon Dioxide Intensity (2003E) 0.4 Metric tons per thousand $2000-PPP
Sources: US Energy Information Administrationwww.eia.doe.gov/environmentent.html

Relative comparison
0
5
10
15
20
25
Annual per capita CO2 emissions
India China EU-15 USA
Annual per capita CO2 emissions
Source: www.eia.doe.gov

Projected emissions:
Shukla P R. 1996. “The Modelling of Policy Options for Greenhouse Gas Mitigation in India”,AMBIO, XXV (4), 240-248, 2001:
(The projections submitted by the Indian National Communication Panel to the IPCC )

The Energy Hungry Giants
http://www.eia.doe.gov/oiaf/1605/1605a.html?62,74

Our beautiful world(land area map)
Reference for cartograms http://www.sasi.group.shef.ac.uk/worldmapper/textindex/text_polution.htm

Reminder
• This series of maps shows Pakistan-Occupied Kashmir as part of Pakistan.
• Jammu and Kashmir, in its entirety, is an integral part of the Republic of India throughout history.
• This status is recognized by the UN, pending resolution of disputes
• India does not recognize the occupation of NW Kashmir by Pakistan and NE Kashmir by China as legal.
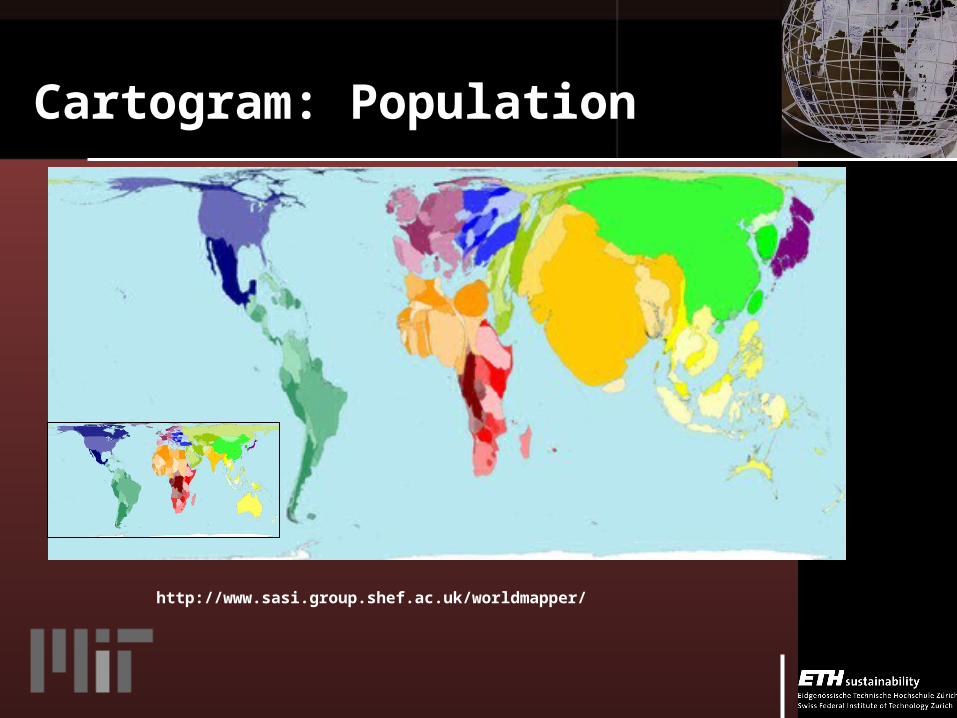
Cartogram: Population
http://www.sasi.group.shef.ac.uk/worldmapper/

Cartogram: People living below $1/day
http://www.sasi.group.shef.ac.uk/worldmapper/

Cartogram: Primary energy consumption
http://www.sasi.group.shef.ac.uk/worldmapper/

Cartogram: Greenhouse Gases
http://www.sasi.group.shef.ac.uk/worldmapper/

Outline
• Energy and emissions data• Energy consumption and
development: – Re-examining the relation– Energy, environment and poverty
• Economics of supplying clean energy• Suggested policy map

Link between energy consumption and development
• National HDI increase: 0.302 (1981) to 0.381 (1991) and then to 0.472 (2001).
India

Current development situation
• Even though India’s GDP growth rate as been increasing ….. But 36% of the population still lives on less than $1/day• GINI Index of 32.5• Trends in development
Although from 1951-1995 the: Still today:
Per capita income x2
Index of industrial production x15
*36% of the population lives below the poverty line
Food grain production x4, famine reduced
Improvement in self sufficiency in grain production
*53% of children under 4 (60 million) remain malnourished
Reference : Kumar A., Poverty and Human Development in India: Getting Priorities Right http://www.undp.org.in/report/PHDI.htm#foot1

The current situation:Disparity in energy access
• In 2000 India had the highest percentage (35%) of the World‘s total population without electricity access.
• At present 71% of India‘s rural population lives in rural areas: 95000 villages still unelectrified
• As a result, 90 % of households in rural areas (58% of the total population) use biomass as primary energy source(Reference: Malhotra P., Bhandari P., Khanna R., Upriti R., Rural energy data sources and estimations in India )
(Reference :Ailawadi V., Bhattarcharyya S., Access to energy services by the poor in India: Current situation and need for alternative strategies
Rural S. Asia

The associated problems:Rural energy poverty and rural development
• With the increasing population growth in rural areas there is an increasing demand for energy access in rural areas for provision of basic needs – Household consumption (cooking, heating, lighting)– Food production and water supply– Production activities for small industries– Health care and education
•(Reference: Rehfuess E., Fuel for Life: Household energy and Health WHO press 2006)
• Intricate link between household energy (85% of total rural energy consumption) and development
Energy and development
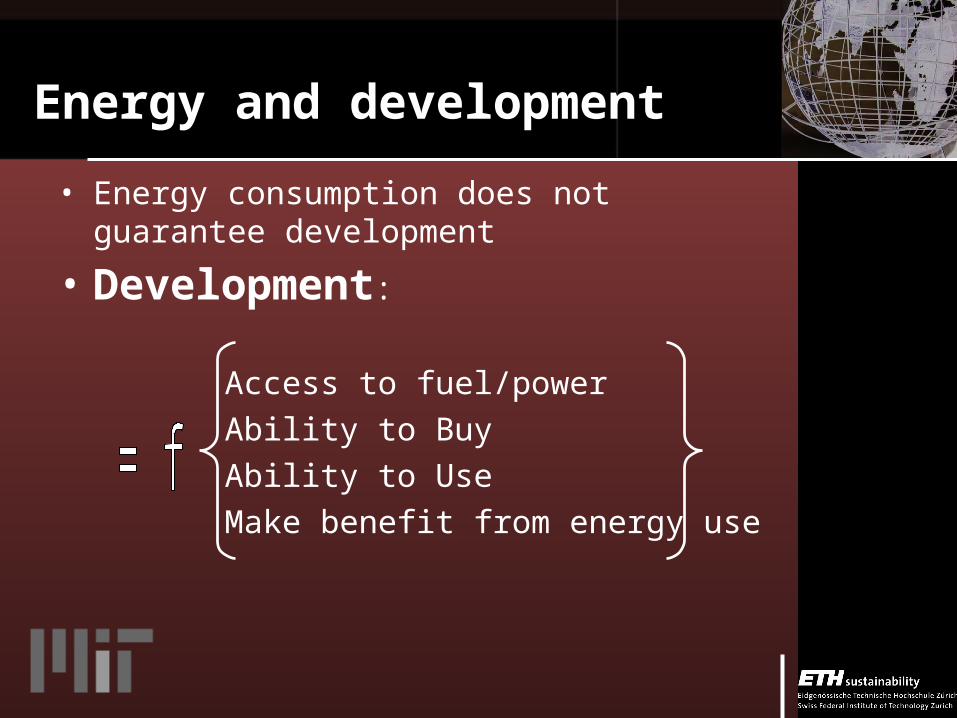
• Energy consumption does not guarantee development
• Development:
Access to fuel/powerAbility to BuyAbility to UseMake benefit from energy use

Re-evaluating the link between energy and development
The access to improved level of energy services amongst different sectors, regions and segments of the population is critical for meeting basic human needs :•to bring people out of poverty, •decrease climate impact vulnerability•improve standards of living

Our vision
– To overcome the supply and affordability constraint to allow the transition from traditional to modern energy services
– Transition from rudimentary technology to more appropriate technology that is more• Efficient• adaptable • Has increased application through
improved management

Sector related challenges Household: Lighting•Lighting:
“In India 2.5 million people (350,000 of them children) suffer severe burns each year from house fires, due to overturned kerosene lamps”(Reference: Light up the world www.lutw.org)
•The current situation: 60% of the total kerosene consumption for rural lighting (use of kerosene lamp)
•Appropriate solution: www.lutw.org •LUTW 1Watt LED lamp system
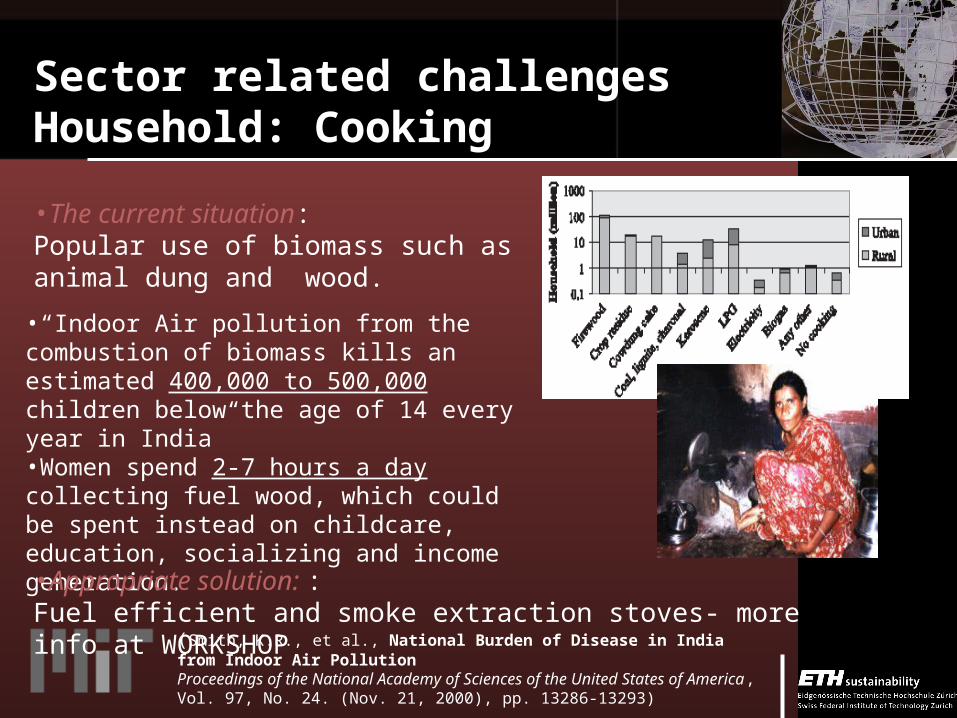
Sector related challenges Household: Cooking
•“Indoor Air pollution from the combustion of biomass kills an estimated 400,000 to 500,000 children below the age of 14 every year in India” •Women spend 2-7 hours a day collecting fuel wood, which could be spent instead on childcare, education, socializing and income generation.
(Smith, K.R., et al., National Burden of Disease in India from Indoor Air Pollution Proceedings of the National Academy of Sciences of the United States of America, Vol. 97, No. 24. (Nov. 21, 2000), pp. 13286-13293)
•The current situation: Popular use of biomass such as animal dung and wood.
•Appropriate solution: : Fuel efficient and smoke extraction stoves- more info at WORKSHOP

Sector related challengesAgriculture & small scale industriesCurrent situationLow energy efficiency and poor energy access for these sectors coupled with increasing fuel prices might impede growth and effective delivery of services.
Agricultural sector :•Consumes 30% of the total electricity•Contributes only 8% of the revenues generated
•High subsidies and free power in some statesSmall scale industries sector:
•40% of industrial production, 35% of total exports•Employ 17 million people in 3 million small scale industries in the organized sector
Appropriate solution: More resource efficient technologies
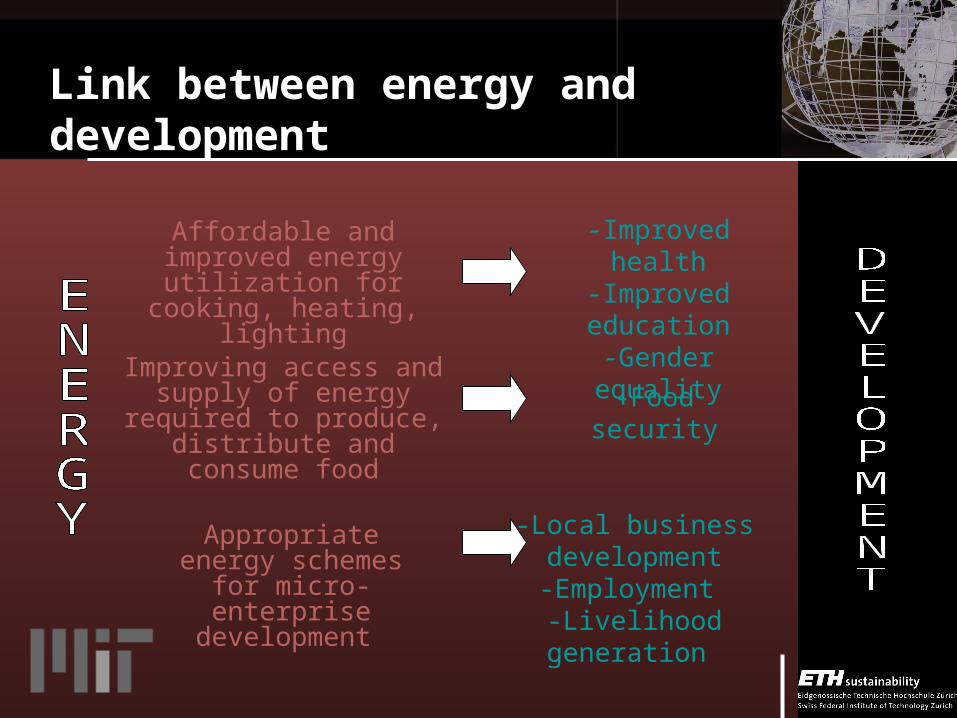
Link between energy and development
-Improved health-Improved education
-Gender equality
-Food security
-Local business development-Employment
-Livelihood generation
Affordable and improved energy
utilization for cooking, heating, lighting
Improving access and supply of energy
required to produce, distribute and consume
food
Appropriate energy schemes for micro-
enterprise development
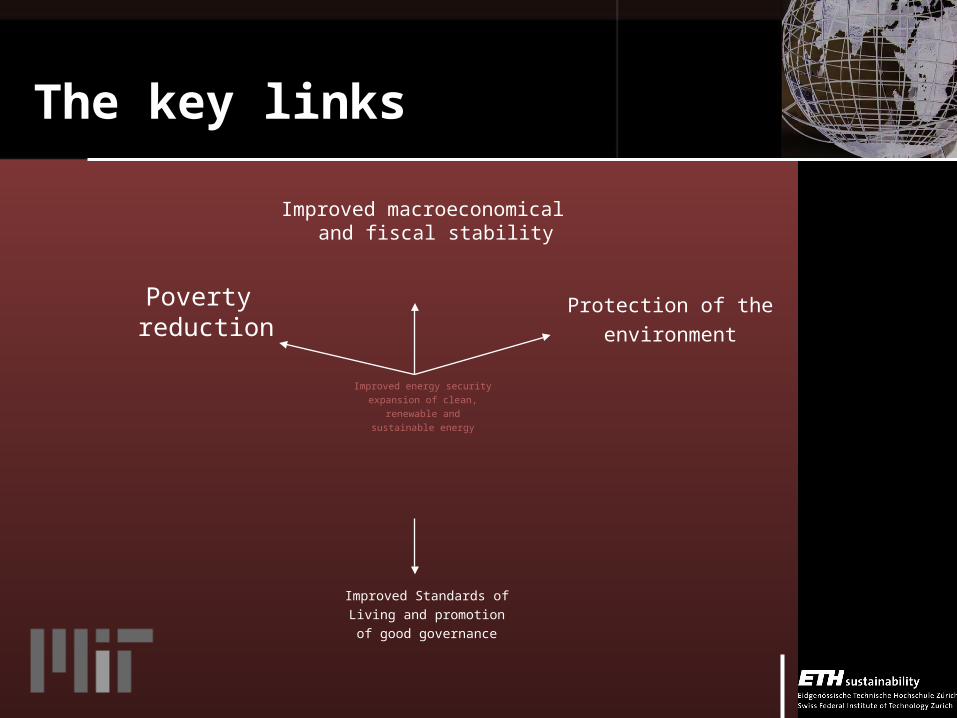
The key links
Poverty reduction
Improved energy securityexpansion of clean,
renewable andsustainable energy
Protection of theenvironment
Improved macroeconomical and fiscal stability
Improved Standards ofLiving and promotionof good governance

NEED FOR A SUSTAINABLE ENERGY FUTURE
– Critical need to improve energy service options through increase efficiency and distribution across sectors and regions in order to • Reduce poverty• Reduce hunger• Improve education• Improve gender equality• Improve health
– Why? Because the poor are often most vulnerable to climate change• For example: in Orissa, climate change is already happening • For them it is a matter of life and death

Outline
• Energy and emissions data• Energy consumption and development:
– Re-examining the relation– Energy, environment and poverty
• Economics of supplying clean energy
• Suggested policy map

The Kaya Equation for Emissions:The equation that matters
• Emissions = Populationx (GDP/person) x (Energy/unit of
GDP) x (emissions/unit of
energy) • Hence, emissions depend on:
– Population– GDP– Energy Intensity– Emissions Intensity

The possibilities
• We cannot to expect to reduce– Population– GDP/person
• We need to work on reducing:– Energy Intensity– Emissions Intensity

Energy Intensity trend
Energy Intensity: Total Primary Energy Consumption per Dollar of Gross Domestic Product (GDP)
020,00040,00060,00080,000
100,000120,000
1980
1982
1984
1986
1988
1990
1992
1994
1996
1998
2000
2002
Time
Btu
/ $ G
DP
India
China
Source: India and China energy historic datawww.eia.doe.gov
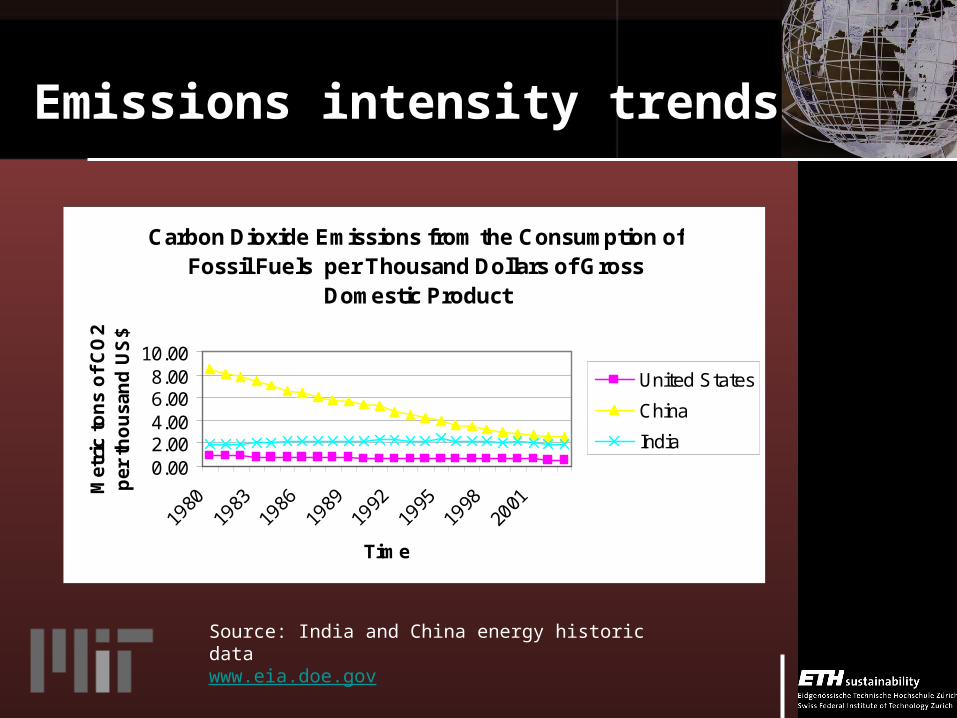
Emissions intensity trends
Carbon Dioxide Emissions from the Consumption of Fossil Fuels per Thousand Dollars of Gross
Domestic Product
0.002.004.006.008.00
10.00
1980
1983
1986
1989
1992
1995
1998
2001
Time
Met
ric
ton
s o
f C
O2
per
th
ou
san
d U
S$
United States
China
India
Source: India and China energy historic datawww.eia.doe.gov
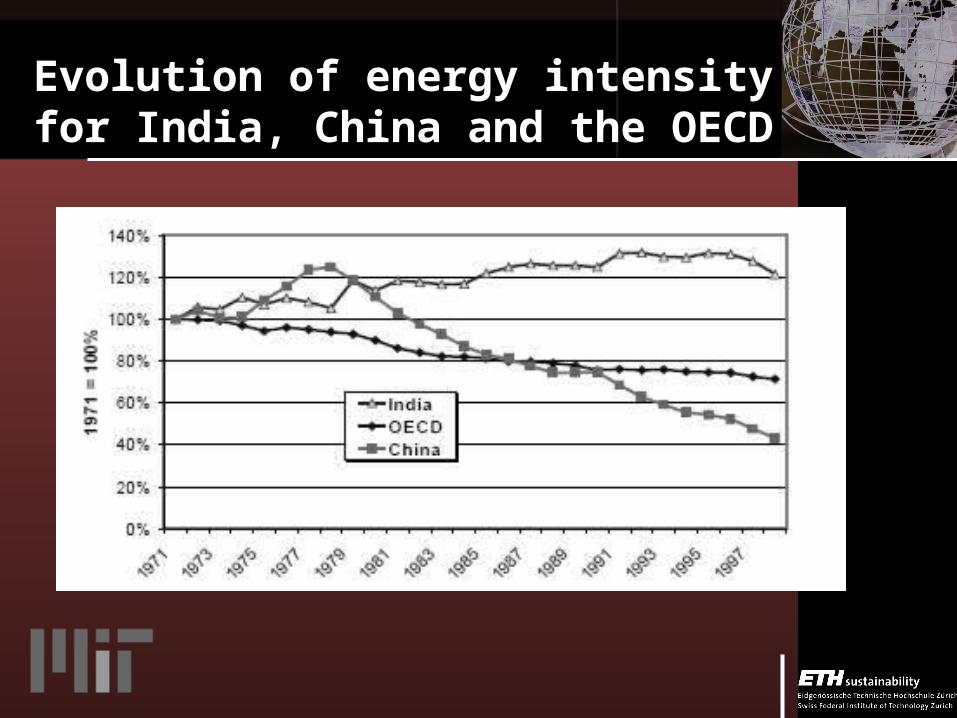
Evolution of energy intensity for India, China and the OECD

Possibilities and Our Challenge

Drivers possible
• Technological innovation: – Lower carbon energy sources
• Require new and advanced technologies
• Greater emphasis on renewable energy sources
• Energy efficiency: The pot of gold at the end of the rainbow

Energy Efficiency
•Eg. Using higher efficiency, renewable resources like small hydro and cogeneration, consuming 2/5th less electricity, 2/3rd less capital and 95% less fossil fuel in the state of Karnataka:
– Natural Capitalism, Amory Lovins et al, Rocky Mountain Institute

Economic Mechanisms: The nuts and bolts
• Reference costs: – Coal
• Subcritical Pulverized coal: US $1100-1300/kW
• Ultrasupercritical PC: US $1300-1500/kW• IGCC with CCS: US $ 1600-1900/kW
– Natural Gas: ~1000-1300/kW– Nuclear and Hydro: ~undefined, contextual costs– Wind energy: ~$2700/kW– Solar PV: ~US $ 4000/kW
• Bottom-line: Where’s the money, honey?
Outline
• Energy and emissions data• Energy consumption and development:
– Re-examining the relation– Energy, environment and poverty
• Economics of supplying clean energy• Suggested policy map
Facing the reality
• Any constraint will hamper the much required and long overdue economic development.
• Emission constraints not viable till a certain threshold of economic development not reached
• In case of immediate carbon restraint, developed countries should pay for emissions since 1960? 1980? 1896? (first explanation of Greenhouse Effect by Arrhenius)?

Contributions to global warming: Historical CO2 emissions from fossil fuel combustion, 1990-1999

Silver Bullets:One enough or a handful needed?
• Possible Silver bullets to promote RE– Carbon taxes
• Reference value: $100/tC: Makes wind, solar thermal and nuclear financially viable
• Translates to an increase of $0.25/gallon of gasoline or $0.07/litre of fuel
• Introduced by many European countries
• Perfect implementation of Polluter Pays Principle
• The ultimate T-word!

Silver Bullets
• The Inverted Telescope: Increasing costs of marginal electricity to discourage frivolous use of energy.– Provide cheap energy to individuals
trying to get on the first rung of development
– Make using plasma TVs and big ACs expensive• Possible implementation problems,
but fewer than others

Keep the bullets coming
• Government incentives to adopt renewable technologies– Funded by CDM CER sales– Aggressive CDM strategies needed
• Technology transfer to enable new efficient technology adoption today, not tomorrow

Policy Goal
• Reliable and abundant energy to enable rapid development for the deprived classes
• Access to energy to allow vast majority of population a chance to get on the ladder of growth

Policy Goals: Sustainable Energy Future
• Equity: access an adequate and reliable supply of energy to reduce poverty and hunger, while improving education, gender equality and health conditions.
• Efficiency: The contextually efficient utilization of energy resources
• Liberty: Freedom from human suffering caused by lack of access to energy
• Security: Ability to plan for a future instead of fighting for day-to-day survival
Framework: Policy Paradox and Political Reason, Deborah Stone

Energy and development
• Energy consumption does not guarantee development
• Development:
Access to fuel/powerAbility to BuyAbility to UseMake benefit from energy use

Suggested policy measures and steps
• Proper technology, appropriate for the context
• Design of proper market mechanism with regulatory oversight, free of distortions– Subsidies highly undesirable, distort
market, pre-empt innovation

Contextually appropriate technologies
• Technologies are designed for particular situations
• Appropriate technology may differ for each region and context
• Misplaced technologies just as likely to fail as misguided policies
• Social factors, economic development and geography of the area should be taken into account– Clinical Diagnosis (Jeffrey Sachs, The
End of Poverty)

Your earth or mine?
• Equal access to global environmental resources the basis of human equity– India and China can not be expected to bear a
C-tax this early in their development levels– Cheap energy and high emissions due to
extravagant lifestyles in the West for a long time
– Inter-generational responsibility includes from the past

Love or peace?
• Denial of access to development may be reason for conflict
• Cooperation and Polluter Pays Principle need to go hand in hand to divide up global resources
• Principle of “Distinguished but Common Responsibility (Kyoto Protocol 1997)”
• Conflict not palatable– Nuclear powers– Two largest armies (1.7 and 1.2 million
standing armies, respectively)
• Polluter pays: Who pays for the build-up
Ultimate Test
• Progress not to be measured in MW of power produced or power plants installed or emissions reduced
• Final test: Number of people brought out of poverty, lives improved, value generated in a climate and environmentally friendly way

Sustainable energy perspective
• Solutions in Energy that incorporate innovation, affordability, cultural acceptability for :– Household use– Commercial (health, education)– Food security (agriculture)– Small scale industries and sub sectors
India and China
• The peoples whose time has come.