Embed Size (px)
Citation preview
Regional Economic Integration in the
Pacific:An Empirical Study
T.K. Jayaraman,Huay-Huay Lee and
Hock-Ann Lee
1. Introduction Regional Integration in the Pacific:
Inspired by Successful efforts in Europe
Initiatives in 2002
Promotion of Free Trade by 2010 amongst Pacific Island Countries
Larger Free Trade Area by 2015 with Australia and New Zealand
The Pacific Plan for Strengthening Regional Cooperation and Integration (the Pacific Plan) was approved by Pacific Islands (PICs) Forum (the Forum), which is the regional organization
Forum comprises 14 PICs & two major metropolitan powers: Australia & New Zealand.
2. Economic Integration Efforts in the Pacific Island Countries
Considerable Diversity: Physical Endowments, Natural Resources & Population (Table 1).
Despite these Variations PICS Face Similar Economic Challenges
Small Domestic Markets & Remoteness from Major Markets
PICs Depend upon Imports for all Basic Commodities .
PICs Depend Heavily on Foreign Aid.
PICs: Open Economies Exports & Imports as percentages of
GDP are High Range from 120% in Kiribati to 68% in
Republic of Marshall Islands Major Trading Partners: Australia &
New Zealand. PICs Exports: Limited in Range. PICs:More competitive than
complementary to each other.
Low Intra-PIC trade: (Table 2). Major intra-regional trading partners are
Fiji & PNG PICs’ Financial Sectors are at infant
stages of development. PICs have liberalised current accounts in
BOP Capital controls exist to prevent de-
stabilising outflows. PICs Exchange Rate Regimes Vary
Eight PICs: Use currencies of Australia, NZ or United States
Kiribati, Nauru & Tuvalu: Aussie $ Cook Islands & Niue: New Zealand $ FSM, RMI, and Palau: United States $
Five PICs (Fiji, Samoa, Solomon
Islands, Tonga and Vanuatu): own currencies
Pegged to Baskets of Currencies PNG: Flexible Exchange Rate Regime.

Objectives of the Study Objective : Measure Impact of
Integration efforts undertaken so far in Trade and Services.
Study Utilizes Parity Conditions Degree of Integration Amongst PICs Degree of Integration between PICs
and Aus & NZ
3. Review of Literatures
Economic integration: Real & Financial Integration.
Study follows Laurenceson (2003): Empirical tests: international parity
conditions Real Interest Parity (RIP) Uncovered Interest Parity (UIP) Purchasing Power Parity (PPP)
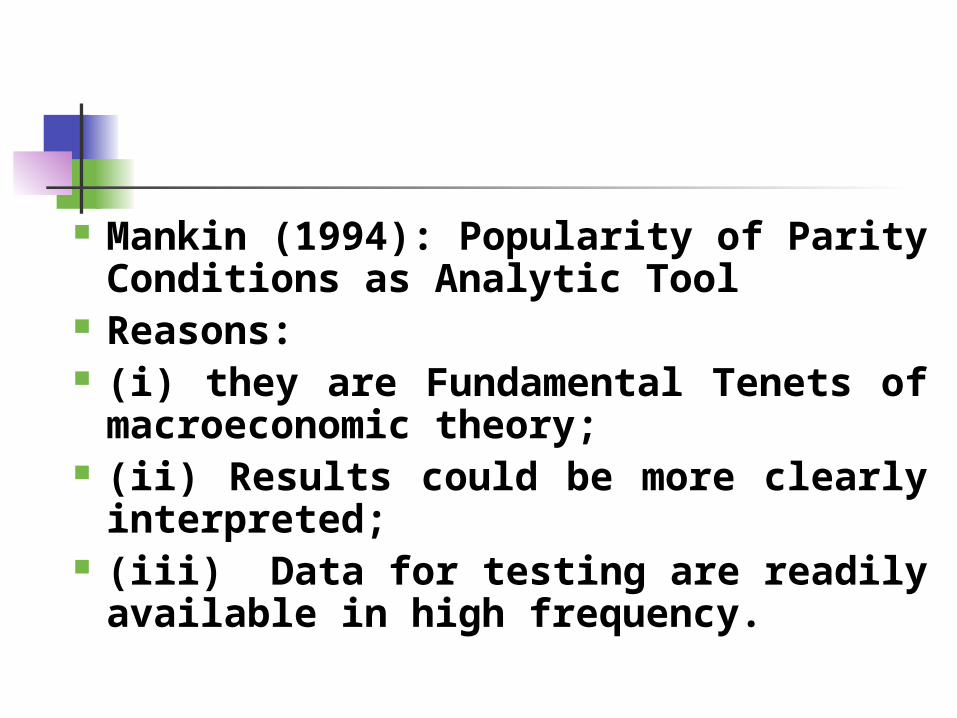
Mankin (1994): Popularity of Parity Conditions as Analytic Tool
Reasons: (i) they are Fundamental Tenets
of macroeconomic theory; (ii) Results could be more clearly
interpreted; (iii) Data for testing are readily
available in high frequency.
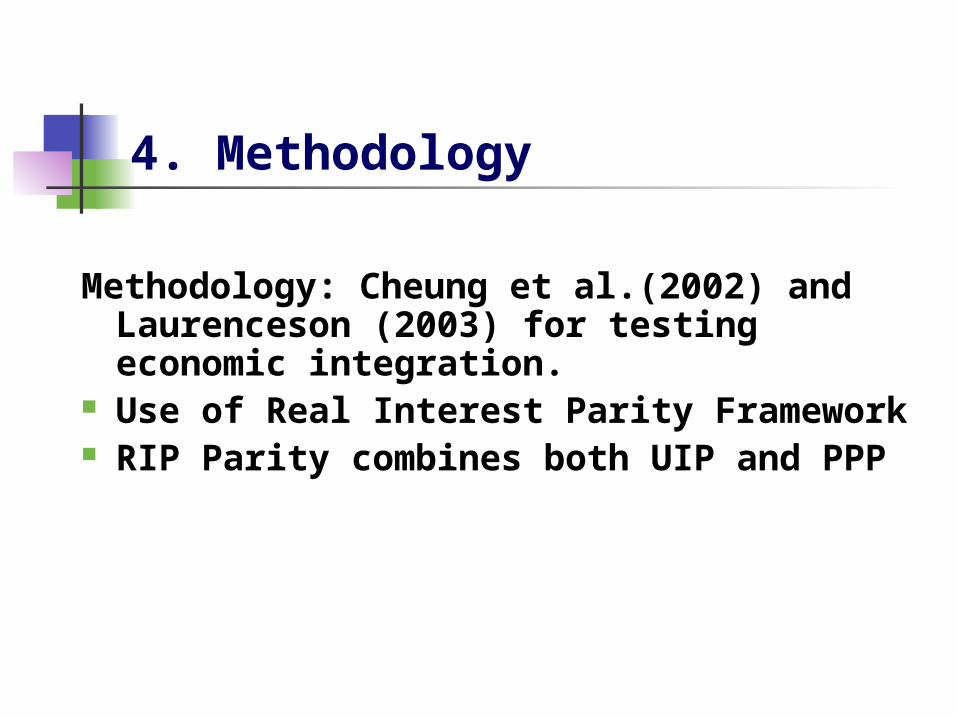
4. Methodology
Methodology: Cheung et al.(2002) and Laurenceson (2003) for testing economic integration.
Use of Real Interest Parity Framework RIP Parity combines both UIP and PPP
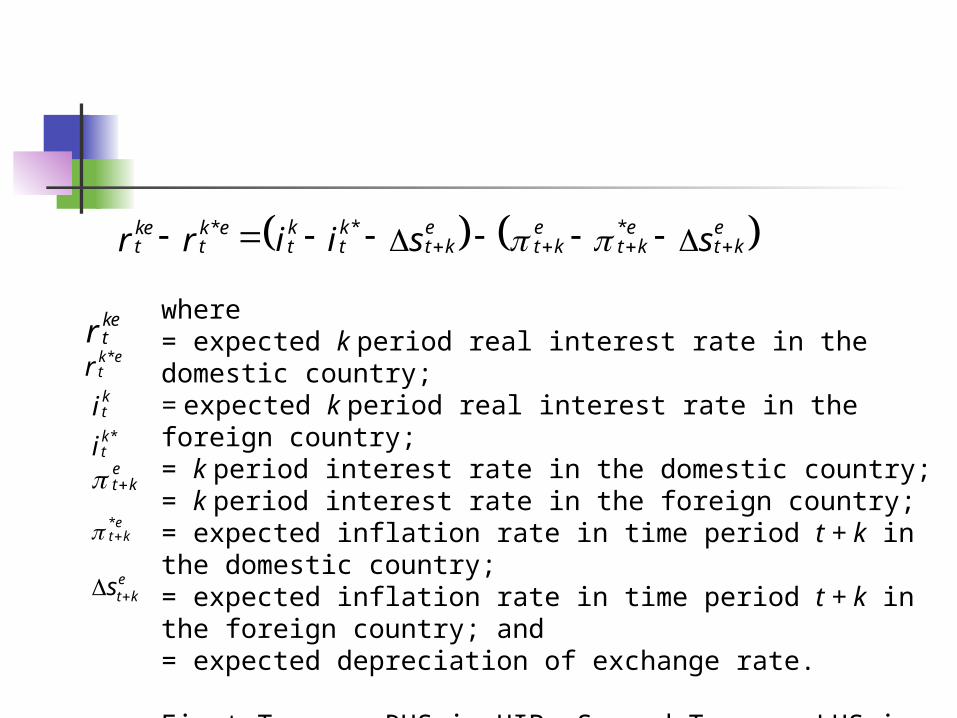
where= expected k period real interest rate in the domestic country;= expected k period real interest rate in the foreign country;= k period interest rate in the domestic country;= k period interest rate in the foreign country;= expected inflation rate in time period t + k in the domestic country;= expected inflation rate in time period t + k in the foreign country; and= expected depreciation of exchange rate.
First Term on RHS is UIP; Second Term on LHS is PP
*ktiet k
*et k
ketr*k etrkti
* ** k k e e e eke k et t t t t k t k t k t ki i s sr r
ekts
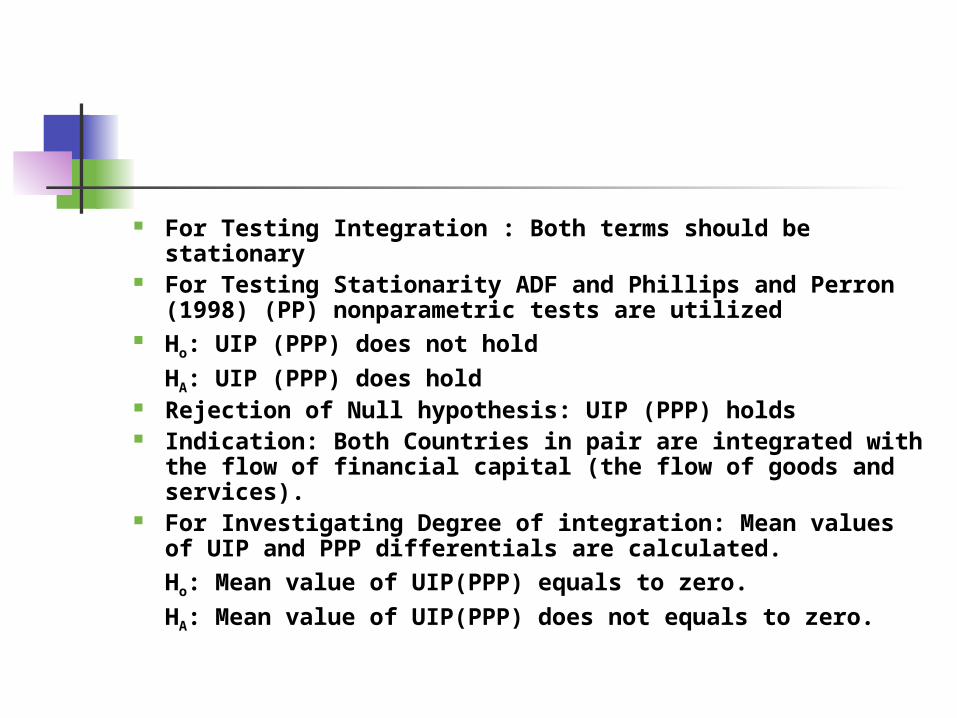
For Testing Integration : Both terms should be stationary
For Testing Stationarity ADF and Phillips and Perron (1998) (PP) nonparametric tests are utilized
Ho: UIP (PPP) does not hold
HA: UIP (PPP) does hold Rejection of Null hypothesis: UIP (PPP) holds Indication: Both Countries in pair are integrated with
the flow of financial capital (the flow of goods and services).
For Investigating Degree of integration: Mean values of UIP and PPP differentials are calculated.Ho: Mean value of UIP(PPP) equals to zero.
HA: Mean value of UIP(PPP) does not equals to zero.
4.1 Data
Monthly data cover from 1985Q4 to 2004Q1.
Description and data source: Table 3.
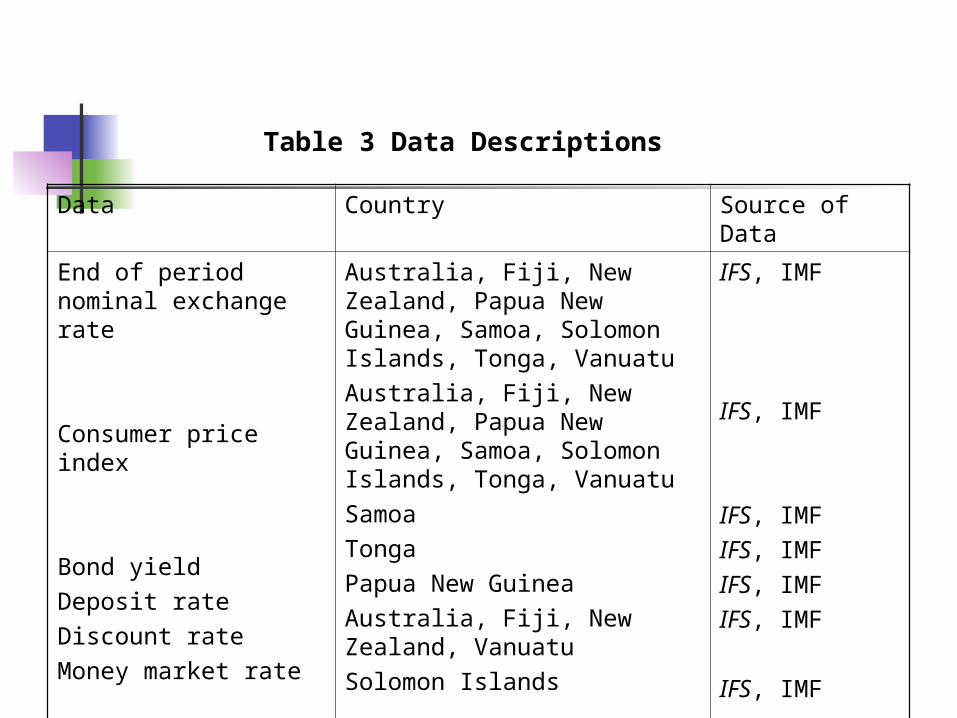
Data Country Source of Data
End of period nominal exchange rate
Consumer price index
Bond yieldDeposit rateDiscount rateMoney market rate
3-month TB rate
Australia, Fiji, New Zealand, Papua New Guinea, Samoa, Solomon Islands, Tonga, Vanuatu Australia, Fiji, New Zealand, Papua New Guinea, Samoa, Solomon Islands, Tonga, Vanuatu SamoaTongaPapua New GuineaAustralia, Fiji, New Zealand, Vanuatu Solomon Islands
IFS, IMF
IFS, IMF
IFS, IMFIFS, IMFIFS, IMFIFS, IMF
IFS, IMF
Table 3 Data Descriptions
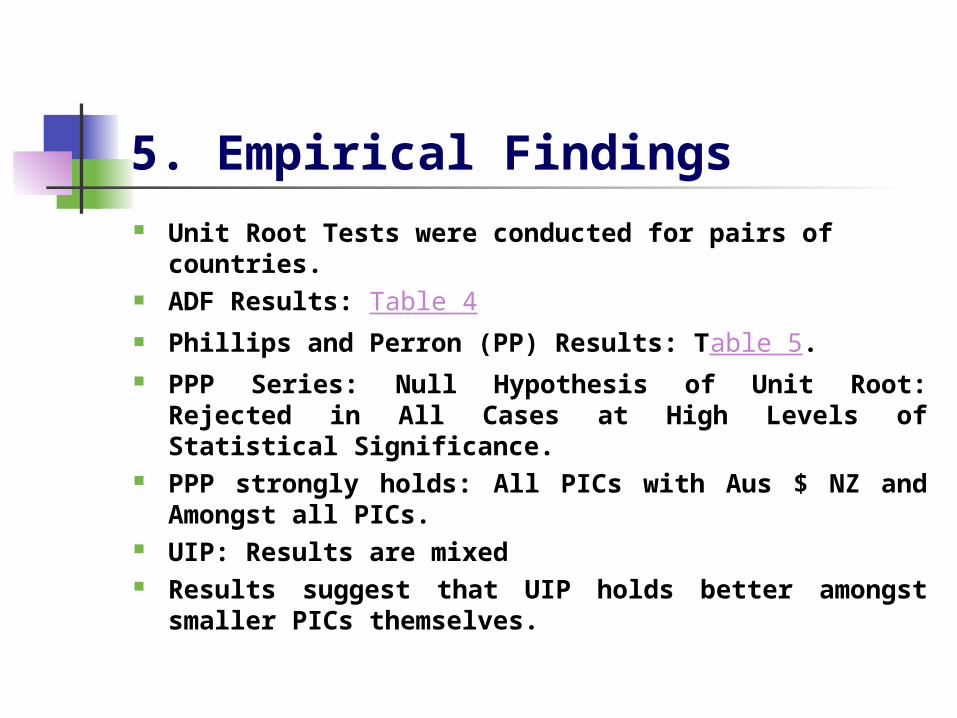
5. Empirical Findings Unit Root Tests were conducted for pairs of
countries. ADF Results: Table 4 Phillips and Perron (PP) Results: Table 5. PPP Series: Null Hypothesis of Unit Root:
Rejected in All Cases at High Levels of Statistical Significance.
PPP strongly holds: All PICs with Aus $ NZ and Amongst all PICs.
UIP: Results are mixed Results suggest that UIP holds better amongst
smaller PICs themselves.
Ten Pairs of PICs out of 15 Pairs: PICs’ integration with AUS & NZ remains
weak & incomplete Six PICs: More integrated with NZ than
with Australia in respect of both goods and services and financial markets.
PICs’ integration with Australia and New Zealand is relatively higher with respect to goods and services markets.
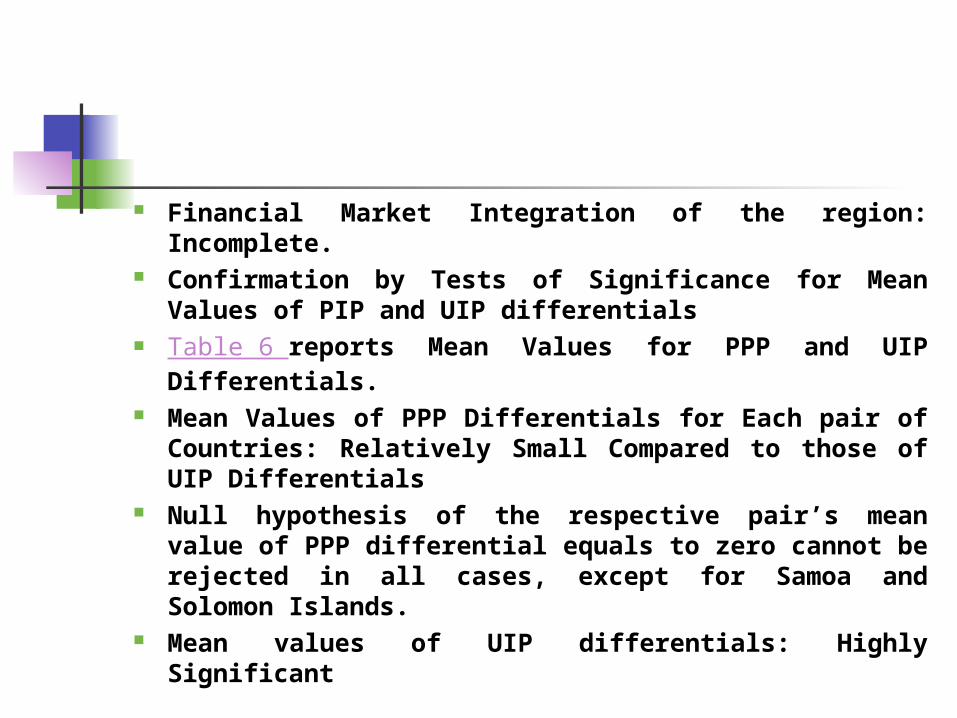
Financial Market Integration of the region: Incomplete.
Confirmation by Tests of Significance for Mean Values of PIP and UIP differentials
Table 6 reports Mean Values for PPP and UIP Differentials.
Mean Values of PPP Differentials for Each pair of Countries: Relatively Small Compared to those of UIP Differentials
Null hypothesis of the respective pair’s mean value of PPP differential equals to zero cannot be rejected in all cases, except for Samoa and Solomon Islands.
Mean values of UIP differentials: Highly Significant
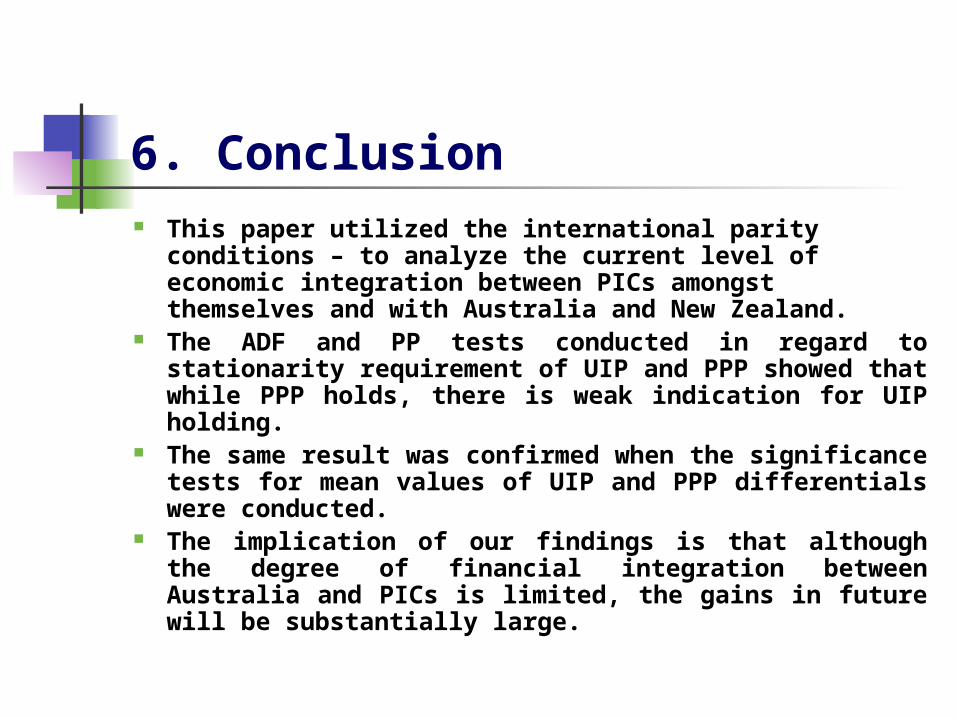
6. Conclusion This paper utilized the international parity
conditions – to analyze the current level of economic integration between PICs amongst themselves and with Australia and New Zealand.
The ADF and PP tests conducted in regard to stationarity requirement of UIP and PPP showed that while PPP holds, there is weak indication for UIP holding.
The same result was confirmed when the significance tests for mean values of UIP and PPP differentials were conducted.
The implication of our findings is that although the degree of financial integration between Australia and PICs is limited, the gains in future will be substantially large.
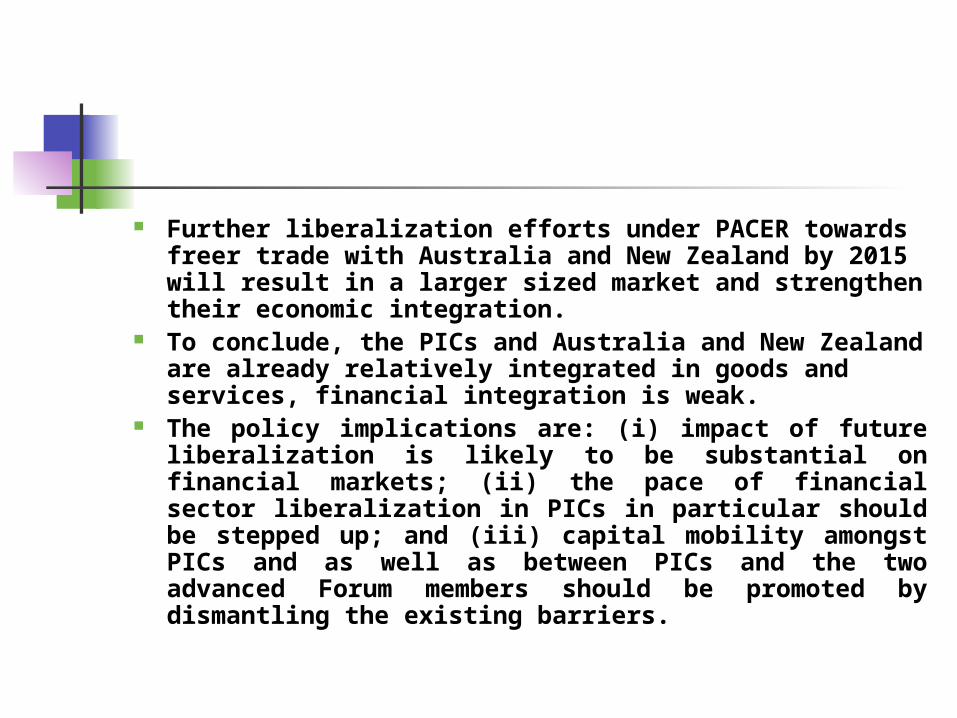
Further liberalization efforts under PACER towards freer trade with Australia and New Zealand by 2015 will result in a larger sized market and strengthen their economic integration.
To conclude, the PICs and Australia and New Zealand are already relatively integrated in goods and services, financial integration is weak.
The policy implications are: (i) impact of future liberalization is likely to be substantial on financial markets; (ii) the pace of financial sector liberalization in PICs in particular should be stepped up; and (iii) capital mobility amongst PICs and as well as between PICs and the two advanced Forum members should be promoted by dismantling the existing barriers.

-The End-
![Part I: Company Law - sile.edu.sg2018).pdf · Part I: Company Law A. BUSINESS VEHICLES . Tan Cheng Han, ed., ... Quek Leng Chye v Attorney-General [1985-1986] SLR(R) 282 . Lee Huay](https://img.pdfslide.us/doc/110x75/5aeec84a7f8b9ac2468bd297/part-i-company-law-sileedusg-2018pdfpart-i-company-law-a-business-vehicles.jpg)


![[Tan Huay Peng] Fun With Chinese Characters(Bookos-z1.Org)](https://img.pdfslide.us/doc/110x75/55cf99fb550346d0339ffded/tan-huay-peng-fun-with-chinese-charactersbookos-z1org.jpg)