Embed Size (px)
Citation preview

Regional Economic Convergence: Do Policy Instruments Make a Difference?
Somik Lall and Serdar Yilmaz
World Bank Institute
Copyright © 2000 The International Bank for Reconstruction and Development/The World Bank 1818 H Street, N.W. Washington, D.C. 20433, U.S.A. First Printing December 2000 The World Bank enjoys copyright under protocol 2 of the Universal Copyright Convention. This material may nonetheless be copied for research, educational, or scholarly purposes only in the member countries of The World Bank. Material in this series is subject to revision. The findings, interpretations, and conclusions expressed in this document are entirely those of the author(s) and should not be attributed in any manner to the World Bank, to its affiliated organizations, or the members of its Board of Executive Directors or the countries they repre-sent. Regional Economic Convergence: Regional Economic Convergence: Regional Economic Convergence: Regional Economic Convergence: Do Policy Instruments Make a Difference?Do Policy Instruments Make a Difference?Do Policy Instruments Make a Difference?Do Policy Instruments Make a Difference? Somik Lall and Serdar Yilmaz 2000. 18 pages. Stock No. 37161

Contents
Abstract v
Introduction 1
Some Measures of Convergence 2
The Data Set and Econometric Methods 4
Methodology 5
Empirical Results 6
Spatial Interaction 10
Conclusions 12
References 15

v
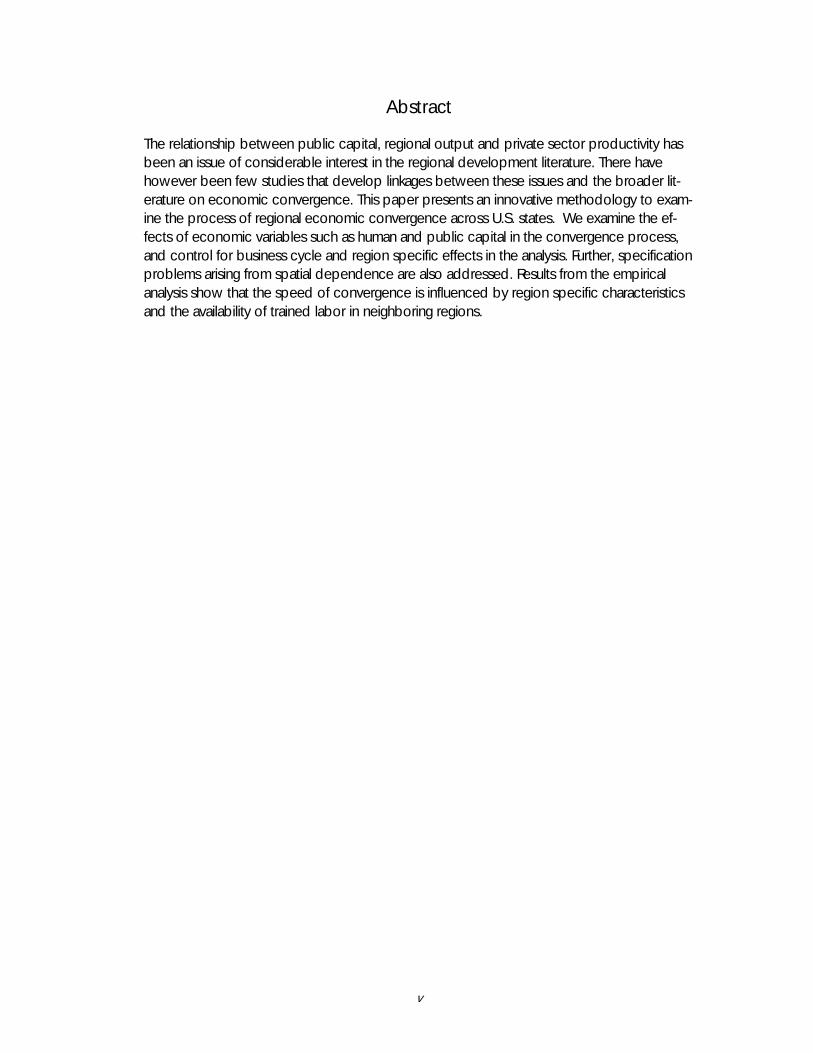
Abstract
The relationship between public capital, regional output and private sector productivity has been an issue of considerable interest in the regional development literature. There have however been few studies that develop linkages between these issues and the broader lit-erature on economic convergence. This paper presents an innovative methodology to exam-ine the process of regional economic convergence across U.S. states. We examine the ef-fects of economic variables such as human and public capital in the convergence process, and control for business cycle and region specific effects in the analysis. Further, specification problems arising from spatial dependence are also addressed. Results from the empirical analysis show that the speed of convergence is influenced by region specific characteristics and the availability of trained labor in neighboring regions.

1
I. IntroductionI. IntroductionI. IntroductionI. Introduction
Variations in the economic performance of nations and regions have fueled debates about the role of the public policies in economic growth. While the relationship between public capital, regional output, and private sector productivity has been an issue of considerable interest in the regional development literature, there have however been few studies that developed linkages with the broader literature on economic convergence. In the neoclassi-cal framework, built on assumptions of decreasing returns to reproducible factors, disparities arising from differences in regional capital/labor ratios diminish over time and both trade and factor flows tend to equalize factor prices. However, proponents of regional policies argue that increasing returns, often seen as arising from technological or pecuniary agglomeration externalities, generate a process of circular, cumulative causation leading to decreasing costs of production. This rationalization is consistent with some of the endogenous growth theoriz-ing where both capital and labor flow to richer regions, which have the advantages of lower unit costs, higher wages and larger market sizes. Altering factor mobility remains critical for the prospects of poorer regions in this type of analysis. The stocks of public and human capital appear to be important determinants of regional economic growth. In general, public capital and human capital can be considered to be categories of infrastructure that influence factors of production1. Appropriate and efficiently supplied infrastructure has an inherent role in improving access to markets, reducing unit cost of production and generating consumer surplus by reducing cost of consumption, improving the general quality of life, as well as in attracting private investment. The spatial distribution of infrastructure, both physical and human capital, has important implications for changing re-gional disparities and by extension, for the convergence process. Recent literature has pointed to the existence of spatial externalities (or spillovers) of infrastructure investments. The stock of infrastructure in a particular region may contribute to output gains in adjoining regions. Further, it is possible that infrastructure investment may influence regional disparities by the changing the competitive and comparative advantages of neighboring states. When factors of production are mobile, public infrastructure investments in one location can draw production away from other locations or provide access to adjacent locations not previously accessible. Boarnet (1998) shows that highway projects in California counties provide bene-fits to the investing counties at the expense of other counties within the state. Kelejian and Robinson (1997) make similar arguments concerning externalities at the state level. From this perspective, policy interventions in the form of public capital (including various infrastructure
1 From the early references to the term infrastructure by Nurske (1952) and Hirschman (1958), the definition of infrastructure has undergone many changes. The early definitions list features like 'provide services basic to any production capacity,' 'cannot be imported from abroad,' and 'large and costly installations,' to define infrastruc-ture. In general, infrastructure includes the supply of services through a networked delivery system designed to serve a multitude of users, particularly for public utilities such as piped water, electric power, gas, telecommunica-tions, sewerage, and rail services (Gramlich, 1994; World Bank, 1994). These infrastructure categories have often been called hard or economic infrastructure. In addition to economic infrastructure, human capital indicators like education and health are considered as social infrastructure that increase labor productivity and help in attracting private capital.
categories) influence regional economic performance2 and the convergence process. Thus, the stocks of public and human capital have important effects on the structure of the local economy, and analysis of convergence without considering these factors may not be useful for guiding policy decisions. This paper employs a pooled data set for the US states over the period 1969-1995 to ad-dress two fundamental questions. First, to what extent is the economic performance of these states converging or diverging? Second, to what extent can this regional growth performance be explained by stocks of physical and human capital within each state? The paper contrib-utes to the conceptual and empirical debate on the role of public policies in stimulating re-gional economic performance. In a methodological context, a spatial econometric approach is used to examine the extent to which spatial externalities influence the speed of conver-gence. The paper is organized as follows: Section 2 presents and discusses various measures of convergence; Section 3 presents the data and econometric approach adopted; Section 4 presents the empirical results; and Section 5 concludes the paper.
II. Some Measures of ConvergenceII. Some Measures of ConvergenceII. Some Measures of ConvergenceII. Some Measures of Convergence
Most 'determinants of growth' studies have been performed at the national level. The first generation of empirical work focussed on examining the stability of factor shares within a sin-gle economy. The more recent empirical literature on growth focuses on growth across countries. These studies have usually been motivated by a need to explain persistent dispari-ties in aggregate growth rates across countries. These disparities have often translated into large differences in per capita welfare. Reviews by Barro and Sala-i-Martin (1995), Pritchet (1997), and Romer (1996), among others provide succinct reviews of this body of literature. Theoretical growth models are based on an aggregate production function with the quantity of labor input, physical capital, and technology as parameters in examining changes in output. Technology is introduced in the relationship as either labor augmenting or Hicks Neutral. Empirical estimation of growth models rely on more readily available operational variables such as real per capita income, domestic investment and savings as a share of GDP, govern-ment consumption, exports, labor force, share of labor in Agriculture and Industry, and hu-man capital or education variables like school enrollment, high school/ college graduates as percentage of population. Cross-country regressions have also used levels of democratiza-tion and other political variables in analyzing growth. Such estimates can be useful for deter-mining policy priorities. For example, the rate of savings was considered a critical parameter in the early literature on development, whereas more recently it has been suggested that the efficiency of investment rather than only the level of investment is very important in determin-ing growth performance across countries (Easterly and Wetzel, 1989).
2 It is difficult to predict, a priori, the exact effect of public capital on regional growth. It is possible that some types of public investments (for example, roads and education) are complementary to private investment and therefore likely to crowd-in private investment, while others (for example, investments in industry and state owned enterprises) are substitutes and likely to crowd-out private investment.
Regional Economic Convergence: Do Policy Instruments Make a Difference? 3
The interest in examining convergence across economic units is partly motivated by research examining the determinants of long term growth. There appear to be two main measures of economic convergence. These are: (1) Sigma (Sigma (Sigma (Sigma (σσσσ) convergence) convergence) convergence) convergence: dispersion of per-capita income reduces over time. This ag-
gregate convergence framework is consistent with the neo classical framework where each region converges to a common rate or level.
(2) Beta (Beta (Beta (Beta (ββββ) convergence) convergence) convergence) convergence: poorer economies tend to grow faster than wealthier ones.
Conditional beta convergence becomes relevant when regional economies are not structurally similar and welfare or output measures do not converge to the same level but the differences across regions become stationary and growth rates are the same in the long run. Aggregate convergence, in contrast, is consistent with a neo classical framework whereby each region, while having different initial position, converge to a common per-capita rate determined by exogenous technical progress (Button, 1998).
Barro and Sala-i-Martin's studies are the most cited contemporary studies on economic con-vergence. They find evidence supporting conditional convergence where regions are con-verging towards their national steady state at an annual rate of about 2 percent. While the papers of Baumol (1986), Dowrick and Nguyen (1989), Barro (1991) and Barro and Sala-i-Martin (1991, 1992) are part of the large body of empirical work that tests for convergence, these studies mainly address the issue of convergence among large numbers of countries or regions. Papers that move away from this conditional, cross-section convergence approach however, show more mixed results. For example, Quah (1996) suggests that the data can show persistence and immobility across countries, evidence of convergence clubs and some evidence shows the poor getting poorer and the rich richer with the middle class van-ishing. At the regional level, Chatterji and Dewhurst (1996), in their study of convergence clubs, find that convergence is associated with recession while divergent economic per-formance is found in boom periods. The idea of conditional convergence is a reformulation of the standard beta conver-gence model. This concept suggests that convergence depends on the structural character-istics of each economy (including public policies), and these structural differences imply that different countries will have different steady states relative per capita incomes. Martin and Sunley (1998) argue that it is necessary to hold the steady state of each economy constant in order to test for conditional convergence. One method of doing this is to introduce addi-tional structural variables in the basic growth regression. This method to test for conditional has been used, among others, by Barro (1991), and Mankiw, Romer, and Weil (1992).
Public capital accumulation and human capital formation are important factors contributing to variations in regional economic structures. Availability and quality of these factors are likely to influence economic performance. In a recent study, de la Fuente and Vives (1995) show that the convergence of average years of schooling of the employed labor force and the work-ing-age population contributes significantly to the reduction of per capita income inequalities among 17 regions of Spain between 1980 and 1991. In Japan, public sector investment and improved productive infrastructure in the regions is considered to have been instrumental in
promoting regional development (World Bank, 1986). Thus, in the endogenous framework public investments can be viewed as external shocks or perturbations to stimulate lagging regions and bring about some degree of regional convergence (Button, 1998). If these in-vestments are not geographically targeted and timed properly however, the benefits of these investments could disproportionately accrue to richer regions. The short review of the literature tends to suggest that regional heterogeneity and factors rep-resenting public and human capital are influential in the regional growth process. In the fol-lowing section, these ideas are used to motivate the choice of estimation methods and the interpretation of the results.
III. The Data Set and Econometric MethodsIII. The Data Set and Econometric MethodsIII. The Data Set and Econometric MethodsIII. The Data Set and Econometric Methods
A common problem in all the measures of convergence when considering regional econo-mies in that they may be influenced by the national business cycle especially over the short period. In order to take account of this effect, we use pooled data (LSDV models), enabling us to include time-period dummy variables to capture business cycle effects. However, a potential problem with this method is that it is short term, measuring convergence from year to year. As a result the time period dummies frequently dominate the regional dummies (But-ton, Arena, Lall, 1998). There are several advantages of using panel data over time series and cross section data. These include: (1) panel data usually provide a large number of observations, which in-creases degrees of freedom, reduces collinearity among explanatory variables, and increases the probability of producing more reliable parameter estimates; (2) it is possible to specify and test sophisticated models that incorporate less restrictive behavioral assumptions. As there are large differences in the growth performance of states, which are due to regional factors such as institutions, leadership, and technological adoption, the use of panel data provide methods to examine the heterogeneity across statistical units; and (3) these data sets enable the identification and measurement of effects that are not observable in pure cross section or time series analysis. For example, it is argued that cross section data reflect long-run behavior and time series data show short run effects, the combination of these two in a panel data set enable the formulation of a comprehensive dynamic structure (Hsiao, 1986; Balestra, 1996). Given the influential role of public capital and human capital in the development process, we extend the convergence analysis by adding the effects of these factors, and also accounting for the effects of temporal shocks and region specific characteristics. Per capita income data for US states were taken from the Regional Economic Information Sys-tem. Regional Economic Information System provides data on states and counties in the US. These data were collected for the 1969-1995 time period. All nominal data were converted to real 1982 dollars for the empirical analysis. There are several methodological innovations with this data set. The most important is the construction of a constant price regional public capital stock variable. This was done by ex-
Regional Economic Convergence: Do Policy Instruments Make a Difference? 5
tending the data provided in Munnell (1990) through 1995. Munnell’s original series is avail-able from 1970 through 1986. In extending her data set, expenditures on public capital out-lays were collected from the Census of Government for each state from 1987 to 1995. The BEA procedure outlined in Munnell (1990) was followed to calculate estimates for public capital stock in each state. Even though the BEA has made improvements in the wealth esti-mates in 1995, the old method is preferred in extending the Munnell series to be consistent with previous estimations. In order to be consistent with her estimates, the old BEA proce-dure of the Winfrey pattern straight-line depreciation and assumed patterns of retirements have been used for calculating discard values. The average service life for public capital is estimated by using Munnell’s specification. Next, the value of discards was subtracted from the annual gross investment figures. The state totals for each year were used to apportion the BEA national total amounts with Tangible Wealth figures in the Survey of Current Business. The totals of state estimates equal to more than 90 % of the BEA estimates. As in Munnell’s esti-mates, all the figures were deflated to 1982 dollars. Data from the U.S. Census Bureau for 1960, 1970, 1980 and 1990 were used for the human capital variable. The exact series used was the percent of each state's population that had completed 4 or more years of college.
Methodology
Following Barro and Sala-i-Martin, the rate of convergence of real per capita personal in-comes across states is:
Where yi,t-T is per capita personal income in state i at the beginning of the study period, yi,t is the per capital personal income in state i at time t; and T is the length of the study period. The parameter βy is a measure of Beta-convergence. It measures convergence in per capita incomes, which is the relative degree to which the growth of low-income states exceeds that of higher income states. To try to explain the US state growth rates, a model is set up to test for conditional beta-convergence. The usual Barro framework is modified to include two additional explanatory variables -- public and human capital. Public capital is taken as a proxy for infrastructure with the rationale that infrastructure has growth enhancing and private capital stimulating effects. Percent of population with college degrees is taken as an indicator of human capital. Unlike Barro, a pooled data set is used and allowance is made for different regional effects and dif-ferent time period effects, by using regional and time period dummy variables to capture any cyclical effects.
−−=
−−
− Teya
yy
TyT
TtiyTti
it 1).1).(log(log1,
,
β (1)
The econometric specification used is: log(yit) = a -blog(y it-1) + ckZ kit-1 + diDi + eiTt (2) In this model, Z is a vector of k additional regional characteristics such as human capital and public capital. D is a vector of 48 regional dummy variables that provide a set of regional co-efficients di., that can be interpreted as capturing specific regional characteristics. T is a vector of t time dummy variables included to capture trends in the economy, such that coefficients ei capture the time specific nature of the rate of growth of regional income per capita. These types of panel data models can be generalized of the type where the slope is constant but the intercept varies over regions and time.
IV. Empirical ResultsIV. Empirical ResultsIV. Empirical ResultsIV. Empirical Results
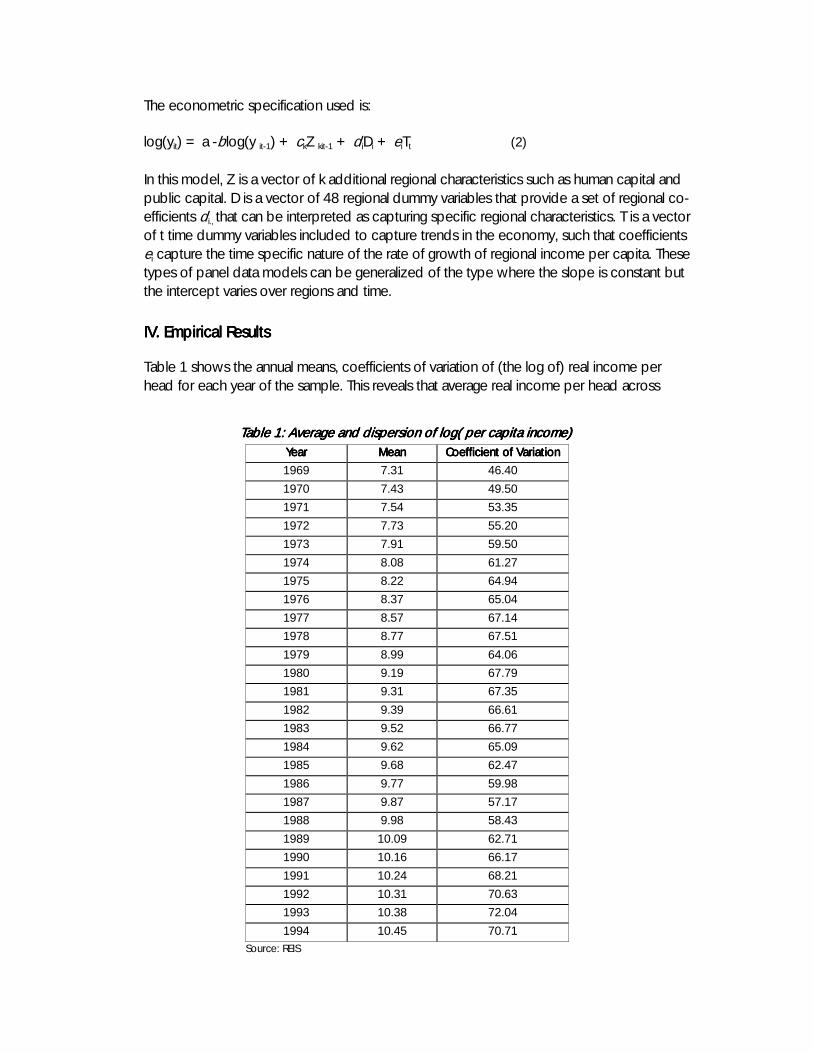
Table 1 shows the annual means, coefficients of variation of (the log of) real income per head for each year of the sample. This reveals that average real income per head across
Table 1: Average and dispTable 1: Average and dispTable 1: Average and dispTable 1: Average and dispersion of log( per capita income)ersion of log( per capita income)ersion of log( per capita income)ersion of log( per capita income) YearYearYearYear MeanMeanMeanMean Coefficient of VariationCoefficient of VariationCoefficient of VariationCoefficient of Variation
1969 7.31 46.40
1970 7.43 49.50
1971 7.54 53.35
1972 7.73 55.20
1973 7.91 59.50
1974 8.08 61.27
1975 8.22 64.94
1976 8.37 65.04
1977 8.57 67.14
1978 8.77 67.51
1979 8.99 64.06
1980 9.19 67.79
1981 9.31 67.35
1982 9.39 66.61
1983 9.52 66.77
1984 9.62 65.09
1985 9.68 62.47
1986 9.77 59.98
1987 9.87 57.17
1988 9.98 58.43
1989 10.09 62.71
1990 10.16 66.17
1991 10.24 68.21
1992 10.31 70.63
1993 10.38 72.04
1994 10.45 70.71 Source: REIS
Regional Economic Convergence: Do Policy Instruments Make a Difference? 7
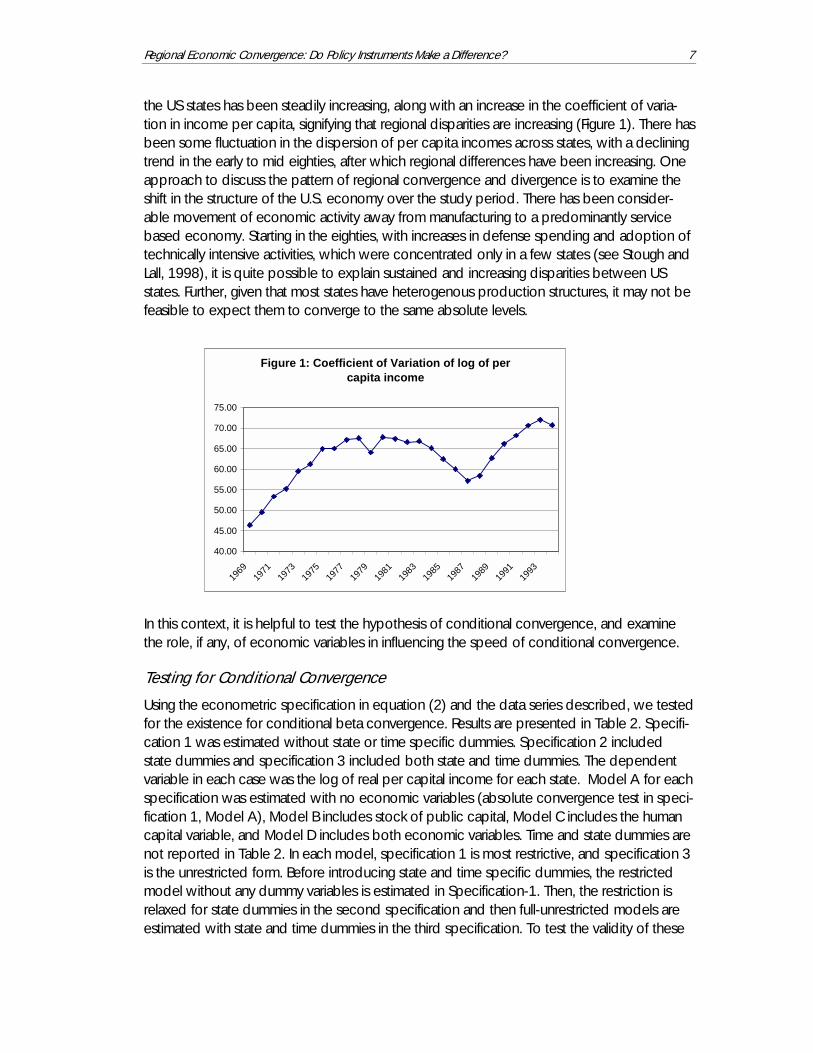
the US states has been steadily increasing, along with an increase in the coefficient of varia-tion in income per capita, signifying that regional disparities are increasing (Figure 1). There has been some fluctuation in the dispersion of per capita incomes across states, with a declining trend in the early to mid eighties, after which regional differences have been increasing. One approach to discuss the pattern of regional convergence and divergence is to examine the shift in the structure of the U.S. economy over the study period. There has been consider-able movement of economic activity away from manufacturing to a predominantly service based economy. Starting in the eighties, with increases in defense spending and adoption of technically intensive activities, which were concentrated only in a few states (see Stough and Lall, 1998), it is quite possible to explain sustained and increasing disparities between US states. Further, given that most states have heterogenous production structures, it may not be feasible to expect them to converge to the same absolute levels.
In this context, it is helpful to test the hypothesis of conditional convergence, and examine the role, if any, of economic variables in influencing the speed of conditional convergence.
Testing for Conditional Convergence
Using the econometric specification in equation (2) and the data series described, we tested for the existence for conditional beta convergence. Results are presented in Table 2. Specifi-cation 1 was estimated without state or time specific dummies. Specification 2 included state dummies and specification 3 included both state and time dummies. The dependent variable in each case was the log of real per capital income for each state. Model A for each specification was estimated with no economic variables (absolute convergence test in speci-fication 1, Model A), Model B includes stock of public capital, Model C includes the human capital variable, and Model D includes both economic variables. Time and state dummies are not reported in Table 2. In each model, specification 1 is most restrictive, and specification 3 is the unrestricted form. Before introducing state and time specific dummies, the restricted model without any dummy variables is estimated in Specification-1. Then, the restriction is relaxed for state dummies in the second specification and then full-unrestricted models are estimated with state and time dummies in the third specification. To test the validity of these
Figure 1: Coefficient of Variation of log of per capita income
40.00
45.00
50.00
55.00
60.00
65.00
70.00
75.00
1969
1971
1973
1975
1977
1979
1981
1983
1985
1987
1989
1991
1993
restrictions (i.e., if dummies should be introduced to the models), F tests have been per-formed. The computed F-statistics are given by Fr, n-k = [(SSEr- SSEu)/ r] / (SSEu/ n-k) where SSEr , SSEu, r, n, and k stand for sum of squared errors in the restricted specification and unrestricted specification, number of restrictions, number of observations, and number of estimated parameters, respectively. The computed F scores are presented in the Table 3. The F scores for each of the models are larger than the critical F value. Therefore we reject the null hypothesis that restricted and unrestricted specifications are the same and use state and time dummies in the regression estimations. In addition to testing for the significance of time and region effects, we tested if there were significant differences between Model A (no economic variables) and Model D (with both public and human capital). F- tests between these models show statistically significant differ-ences3 and the constraint of not including economic variables is not valid. The implied β-coefficients4 are presented in table 4 for all versions of specifications 1 and 3. In specification 3, they range from 0.12 to 0.16, which show much more rapid convergence than in the absolute convergence (specification 1) case where the parameter is close to 0.03. The other economic explanatory variables have mixed performance, with the coeffi-cient for human capital having a positive effect on growth rates. Public capital on the other hand switches from positive (correct sign) to being negative (or being statistically insignifi-cant). The time dummies are strongly significant as a group. This suggests that the evolution of state incomes is path dependent and possibly driven by the business cycle.
3 F test value is 8.243, which is greater than critical values at 0.05 significance level. 4 The formula that translates the estimated coefficient, b, into Barro’s ß is: ln (b).
Regional Economic Convergence: Do Policy Instruments Make a Difference? 9
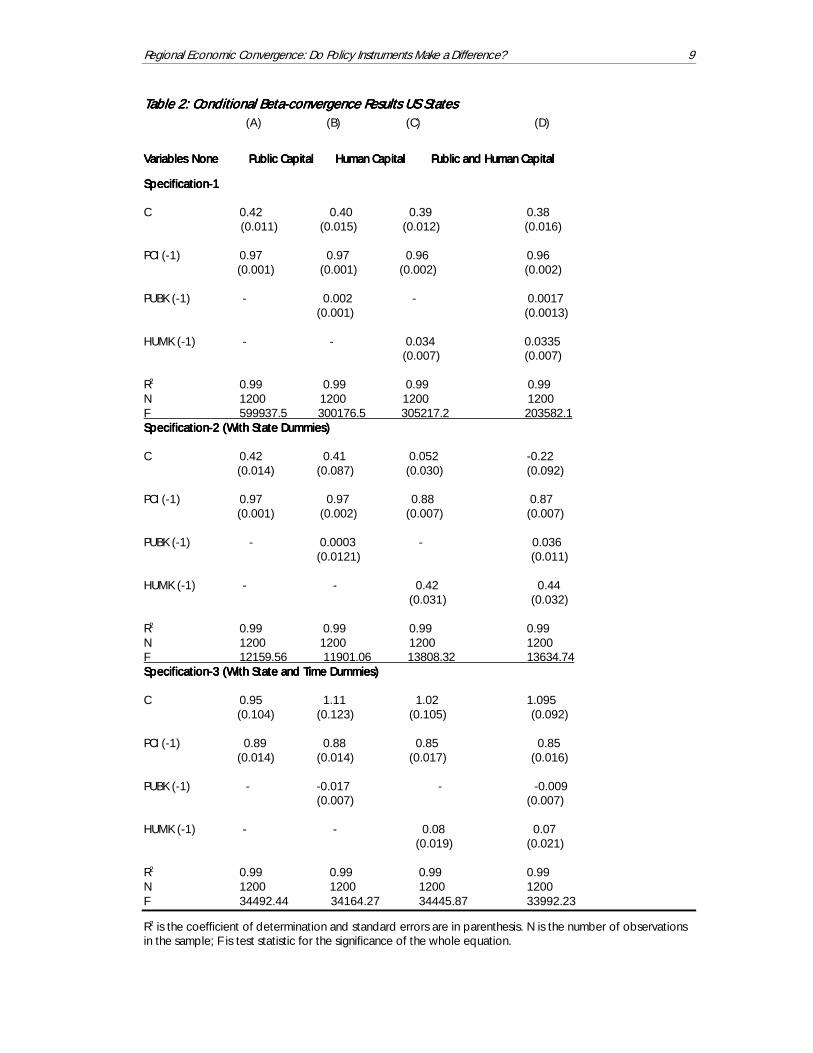
Table 2: Conditional BetaTable 2: Conditional BetaTable 2: Conditional BetaTable 2: Conditional Beta----convergence Resultsconvergence Resultsconvergence Resultsconvergence Results US States US States US States US States (A) (B) (C) (D)
VariablesVariablesVariablesVariables NoneNoneNoneNone Public Capital Public Capital Public Capital Public Capital Human Capital Human Capital Human Capital Human Capital Public and Human CapitalPublic and Human CapitalPublic and Human CapitalPublic and Human Capital
SpecificationSpecificationSpecificationSpecification----1111 C 0.42 0.40 0.39 0.38 (0.011) (0.015) (0.012) (0.016) PCI (-1) 0.97 0.97 0.96 0.96 (0.001) (0.001) (0.002) (0.002) PUBK (-1) - 0.002 - 0.0017 (0.001) (0.0013) HUMK (-1) - - 0.034 0.0335 (0.007) (0.007) R2 0.99 0.99 0.99 0.99 N 1200 1200 1200 1200 F 599937.5 300176.5 305217.2 203582.1 SpecificationSpecificationSpecificationSpecification----2 (With State Dummies)2 (With State Dummies)2 (With State Dummies)2 (With State Dummies) C 0.42 0.41 0.052 -0.22 (0.014) (0.087) (0.030) (0.092) PCI (-1) 0.97 0.97 0.88 0.87 (0.001) (0.002) (0.007) (0.007) PUBK (-1) - 0.0003 - 0.036 (0.0121) (0.011) HUMK (-1) - - 0.42 0.44 (0.031) (0.032) R2 0.99 0.99 0.99 0.99 N 1200 1200 1200 1200 F 12159.56 11901.06 13808.32 13634.74 SpecificationSpecificationSpecificationSpecification----3 (With State and Time Dummies)3 (With State and Time Dummies)3 (With State and Time Dummies)3 (With State and Time Dummies) C 0.95 1.11 1.02 1.095 (0.104) (0.123) (0.105) (0.092) PCI (-1) 0.89 0.88 0.85 0.85 (0.014) (0.014) (0.017) (0.016) PUBK (-1) - -0.017 - -0.009 (0.007) (0.007) HUMK (-1) - - 0.08 0.07 (0.019) (0.021) R2 0.99 0.99 0.99 0.99 N 1200 1200 1200 1200 F 34492.44 34164.27 34445.87 33992.23
R2 is the coefficient of determination and standard errors are in parenthesis. N is the number of observations in the sample; F is test statistic for the significance of the whole equation.
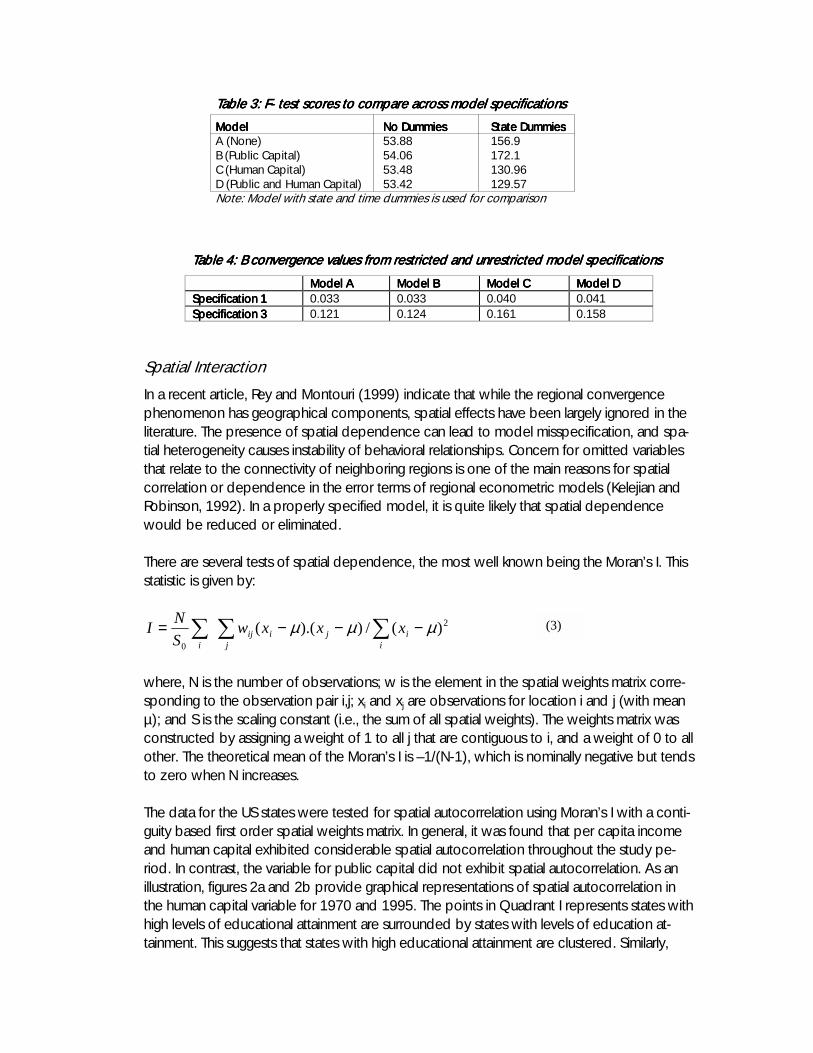
Table 3: FTable 3: FTable 3: FTable 3: F---- test scores to compare across model specifications test scores to compare across model specifications test scores to compare across model specifications test scores to compare across model specifications
ModelModelModelModel No Dummies No Dummies No Dummies No Dummies State Dummies State Dummies State Dummies State Dummies A (None) 53.88 156.9 B (Public Capital) 54.06 172.1 C (Human Capital) 53.48 130.96 D (Public and Human Capital) 53.42 129.57 Note: Model with state and time dummies is used for comparison
Table 4Table 4Table 4Table 4: B convergence values: B convergence values: B convergence values: B convergence values from restricted and unrestricted model specifications from restricted and unrestricted model specifications from restricted and unrestricted model specifications from restricted and unrestricted model specifications
Model AModel AModel AModel A Model BModel BModel BModel B Model CModel CModel CModel C Model DModel DModel DModel D Specification 1Specification 1Specification 1Specification 1 0.033 0.033 0.040 0.041 Specification 3Specification 3Specification 3Specification 3 0.121 0.124 0.161 0.158
Spatial Interaction
In a recent article, Rey and Montouri (1999) indicate that while the regional convergence phenomenon has geographical components, spatial effects have been largely ignored in the literature. The presence of spatial dependence can lead to model misspecification, and spa-tial heterogeneity causes instability of behavioral relationships. Concern for omitted variables that relate to the connectivity of neighboring regions is one of the main reasons for spatial correlation or dependence in the error terms of regional econometric models (Kelejian and Robinson, 1992). In a properly specified model, it is quite likely that spatial dependence would be reduced or eliminated. There are several tests of spatial dependence, the most well known being the Moran’s I. This statistic is given by:
∑ ∑∑ −−−=j i
ijiiji
xxxwSNI 2
0
)(/)).(( µµµ
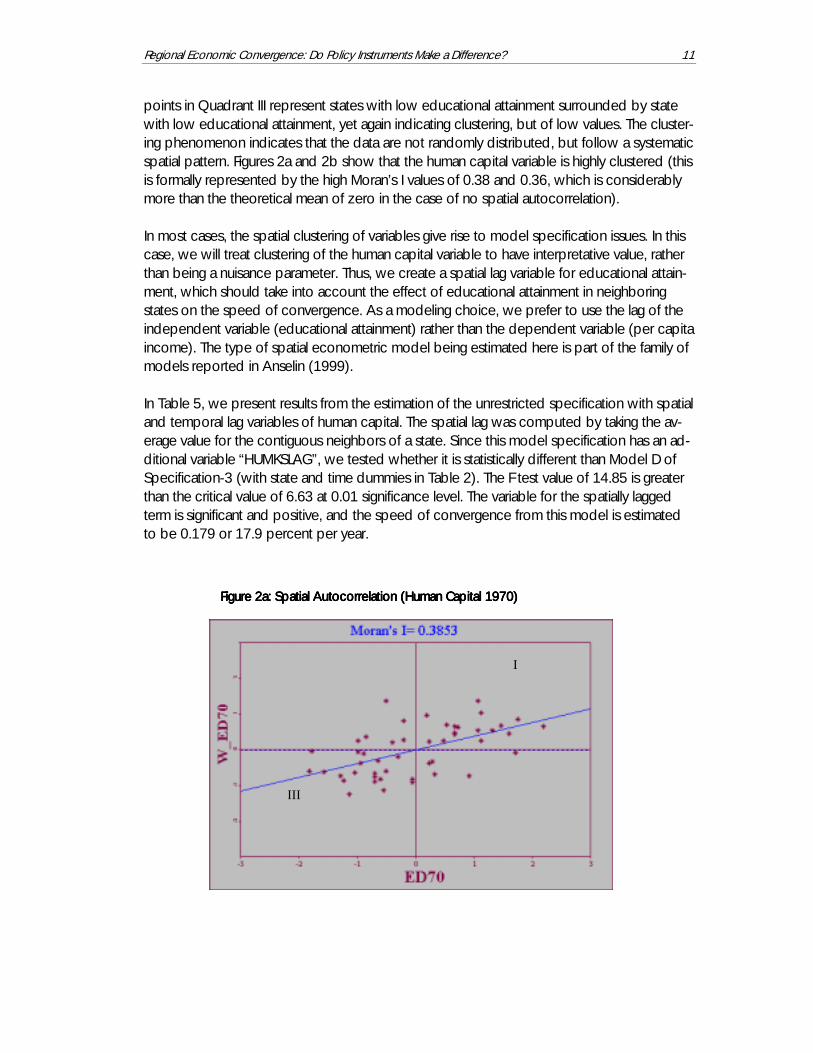
where, N is the number of observations; w is the element in the spatial weights matrix corre-sponding to the observation pair i,j; xi and xj are observations for location i and j (with mean µ); and S is the scaling constant (i.e., the sum of all spatial weights). The weights matrix was constructed by assigning a weight of 1 to all j that are contiguous to i, and a weight of 0 to all other. The theoretical mean of the Moran’s I is –1/(N-1), which is nominally negative but tends to zero when N increases. The data for the US states were tested for spatial autocorrelation using Moran’s I with a conti-guity based first order spatial weights matrix. In general, it was found that per capita income and human capital exhibited considerable spatial autocorrelation throughout the study pe-riod. In contrast, the variable for public capital did not exhibit spatial autocorrelation. As an illustration, figures 2a and 2b provide graphical representations of spatial autocorrelation in the human capital variable for 1970 and 1995. The points in Quadrant I represents states with high levels of educational attainment are surrounded by states with levels of education at-tainment. This suggests that states with high educational attainment are clustered. Similarly,
(3)
Regional Economic Convergence: Do Policy Instruments Make a Difference? 11
points in Quadrant III represent states with low educational attainment surrounded by state with low educational attainment, yet again indicating clustering, but of low values. The cluster-ing phenomenon indicates that the data are not randomly distributed, but follow a systematic spatial pattern. Figures 2a and 2b show that the human capital variable is highly clustered (this is formally represented by the high Moran’s I values of 0.38 and 0.36, which is considerably more than the theoretical mean of zero in the case of no spatial autocorrelation). In most cases, the spatial clustering of variables give rise to model specification issues. In this case, we will treat clustering of the human capital variable to have interpretative value, rather than being a nuisance parameter. Thus, we create a spatial lag variable for educational attain-ment, which should take into account the effect of educational attainment in neighboring states on the speed of convergence. As a modeling choice, we prefer to use the lag of the independent variable (educational attainment) rather than the dependent variable (per capita income). The type of spatial econometric model being estimated here is part of the family of models reported in Anselin (1999). In Table 5, we present results from the estimation of the unrestricted specification with spatial and temporal lag variables of human capital. The spatial lag was computed by taking the av-erage value for the contiguous neighbors of a state. Since this model specification has an ad-ditional variable “HUMKSLAG”, we tested whether it is statistically different than Model D of Specification-3 (with state and time dummies in Table 2). The F test value of 14.85 is greater than the critical value of 6.63 at 0.01 significance level. The variable for the spatially lagged term is significant and positive, and the speed of convergence from this model is estimated to be 0.179 or 17.9 percent per year.
Figure 2a: Spatial Autocorrelation (Human Capital 1970)Figure 2a: Spatial Autocorrelation (Human Capital 1970)Figure 2a: Spatial Autocorrelation (Human Capital 1970)Figure 2a: Spatial Autocorrelation (Human Capital 1970)
I
III
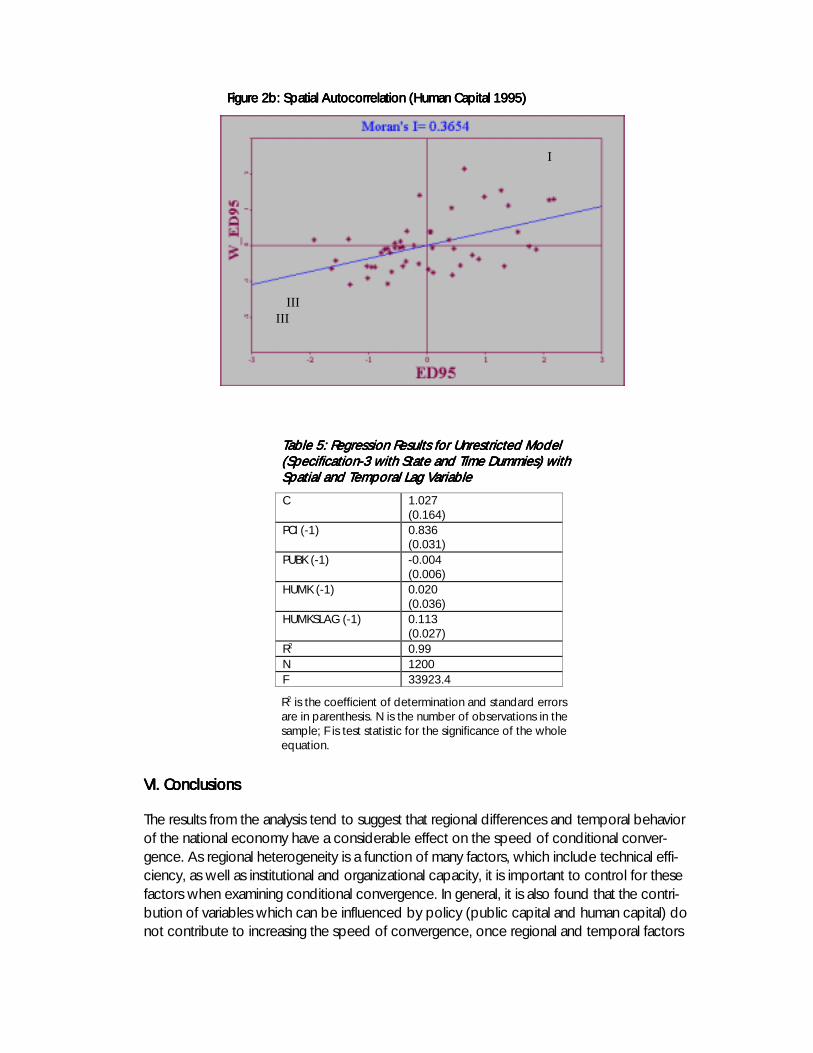
Table 5: Regression Results for Unrestricted Model Table 5: Regression Results for Unrestricted Model Table 5: Regression Results for Unrestricted Model Table 5: Regression Results for Unrestricted Model (Specification(Specification(Specification(Specification----3 with State and Time Dummies) with 3 with State and Time Dummies) with 3 with State and Time Dummies) with 3 with State and Time Dummies) with Spatial andSpatial andSpatial andSpatial and Temporal Lag Variable Temporal Lag Variable Temporal Lag Variable Temporal Lag Variable
C 1.027 (0.164)
PCI (-1) 0.836 (0.031)
PUBK (-1) -0.004 (0.006)
HUMK (-1) 0.020 (0.036)
HUMKSLAG (-1) 0.113 (0.027)
R2 0.99 N 1200 F 33923.4
R2 is the coefficient of determination and standard errors are in parenthesis. N is the number of observations in the sample; F is test statistic for the significance of the whole equation.
VI. ConclusionsVI. ConclusionsVI. ConclusionsVI. Conclusions
The results from the analysis tend to suggest that regional differences and temporal behavior of the national economy have a considerable effect on the speed of conditional conver-gence. As regional heterogeneity is a function of many factors, which include technical effi-ciency, as well as institutional and organizational capacity, it is important to control for these factors when examining conditional convergence. In general, it is also found that the contri-bution of variables which can be influenced by policy (public capital and human capital) do not contribute to increasing the speed of convergence, once regional and temporal factors
Figure 2b: Spatial AutocorrFigure 2b: Spatial AutocorrFigure 2b: Spatial AutocorrFigure 2b: Spatial Autocorrelation (Human Capital 1995)elation (Human Capital 1995)elation (Human Capital 1995)elation (Human Capital 1995)
I
III III
Regional Economic Convergence: Do Policy Instruments Make a Difference? 13
are considered. Results reported in Table 5 indicates that the spatial lag of the human capital variable has a significant influence of the speed of convergence. This means that per capita income in a region is positively influenced by the availability of skilled labor in its neighboring regions, which means that labor markets go beyond administratively defined regions. This finding also lends credibility to the argument that labor mobility is an important consideration for regional economic convergence. The implications for the use of policy instruments are not very clear. It appears that the effi-cient way to stimulate convergence would be to improve region specific characteristics, such as technical efficiency and organizational capacity, and also reduce the volatility of the regional economy to macroeconomic shocks. While investments in public capital are impor-tant, the diversity in its nature its impacts on the economy however, lends itself to decision making that could be efficient or not (Button, 1998). Policies which are aimed at reducing barriers to factor mobility, however, may be critical in increasing the speed of convergence. This shows up in the results through the positive influence of the availability of trained labor in neighboring regions on per capita incomes in a region. In general, public policies can acts as catalysts to overcome structural rigidities and reduce barriers to factor mobility, which will be critical in increasing the speed of convergence. Pub-lic interventions can be broadly classified into at least three categories. These are (1) topic specific national programs, (2) sector specific programs, and (3) spatially specific programs. The main drawback with topic and sector specific programs is that they have varying spatial incidence, thereby having disproportionate effects on some regions. It is therefore difficult to estimate the impact of these types of interventions on lagging or poorer states. While public policies can be viewed as important catalysts for convergence, the timing and spatial inci-dence of particular instruments need to be carefully examined.

15
References
Anselin, L. (1999). Spatial Econometrics. Mimeo. Balestra, P. (1996). Fixed Effect Models and Fixed Coefficient Models. in Laszlo Matyas and
Patrick Sevestre (eds.) The Econometrics of Panel Data. The Netherlands: Kluwer Academic Publishers.
Barro, R.J. (1991). Economic growth in a cross section of countries, Quarterly Journal of Eco-nomics, 106: 407-43.
Barro, R.J. and Sala-I-Martin, X. (1991). Convergence across states and regions. Brookings Pa-pers on Economic Activity, 1 107–82.
Barro, R.J. and Sala-i-Martin, X. (1992). Convergence. Journal of Political Economy, 100: 223-51.
Barro, R.J. and Sala-i-Martin, X. (1995). Economic Growth. New York: McGraw-Hill. Baumol, W.J. (1986) Productivity growth, convergence and welfare: what the long run data
show. American Economic Review, 76: 1075-85. Boarnet, M. (1998). Spillovers and the Location Effects of Public Infrastructure. Journal of
Regional Science, 38, (3) 381-400. Button, K., Arena, P. and Lall, S. (1998). Do Regional Economies Converge? And Does it Mat-
ter Anyway? Paper presented at the International Atlantic Economic Conference, Bos-ton. October 8-11.
Button, K.J. (1998). Infrastructure investment, endogenous growth, and economic convergence. Annals of Regional Science, 32, 145-162.
Canova, F. and Marcet, A. (1995). The poor stay poor: Non-convergence across countries and regions. Discussion paper 1265. London: Center for Economic Policy Research.
Chatterji, M. and Dewhurst, J.H.Ll. (1996). Convergence clubs and relative economics per-formance in Great Britain: 1977-1991. Regional Studies, 30: 31-40.
De la Fluente, A. and Vives, X. (1995). Infrastructure and education as instruments of regional policy: Evidence from Spain. European Policy: A European Forum (20). 11-40.
Dowrick, S. and Nguyen, D-T. (1989) OECD comparative economic growth 1950–85: catch-up and convergence. American Economic Review, 79: 1010–30.
Gramlich, E. M. (1994). Infrastructure Investment: A Review Essay. Journal of Economic Literature, 32,1176-96.
Hirschman, A. (1958). The Strategy of Economics Development. New Haven: Yale University Press.
Hsiao, C. (1986). Analysis of Panel Data. New York: Cambridge University Press Kelejian, H. H., & Robinson, D.R. (1997). Infrastructure Productivity Estimation and its Underlying
Econometric Specifications: A Sensitivity Analysis. Papers in Regional Science, 76, 1- 17.
Mankiw, N., Romer, D., and Weil, D. (1992). A contribution to the empirics of economic growth. Quarterly Journal of Economics, 107. 407-38.
Martin, R., and Sunley, P. (1998). Slow Convergence? The New Endogenous Growth Theory and Regional Development. Economic Geography, 74, (3). 201-227.
Munnell, A.H. (1990). Why has Productivity Growth Declined? New England Economic Review, Jan./Feb.3-22.
Nurske, R. (1952). Problems of Capital Formation in Underdeveloped Countries. Basil Blackwell. Pritchett, L. (1997). Divergence, Big Time. Journal of Economic Perspectives 11 (3).
Romer, D. (1996). Advanced Macroeconomics. New York: McGraw Hill. Quah, D. (1993). Empirical cross section dynamics in economic growth. European Economic
Review, 37: 427-43. Quah, D. (1996) Empirics for economic growth and convergence. European Economic Re-
view, 40: 1353-76. Rey, S and Montouri, B. (1999) US Regional Income Convergence:A Spatial Econometric Per-
spective. Regional Studies, 33: 143-156. Stough, R. and Lall, S. (1998). Infrastructure Led Technology Growth in U.S. Metropolitan Re-
gions. Presented at the Tinbergen Institute/NECTAR seminar on “Transport Infrastruc-ture, Space, and the Economy”, Amsterdam, February 6-7, 1998.
World Bank. (1986). Korea Spatial Strategy Review. World Bank Report 5868-KO. Washington DC: World Bank.
World Bank. (1994). World Development Report: Infrastructure for Development. New York: Oxford University Press.