Embed Size (px)
Citation preview

REGIONAL DYNAMICS IN ADDRESSING CHALLENGES AND OPPORTUNITIES
BUTLER SUMMER FUSIONMay 18, 2015

METROPOLIS OF INDIANAPOPULATION CHANGE 2010-2040

METROPOLIS OF INDIANAWORKFORCE CHANGE 2010-2040
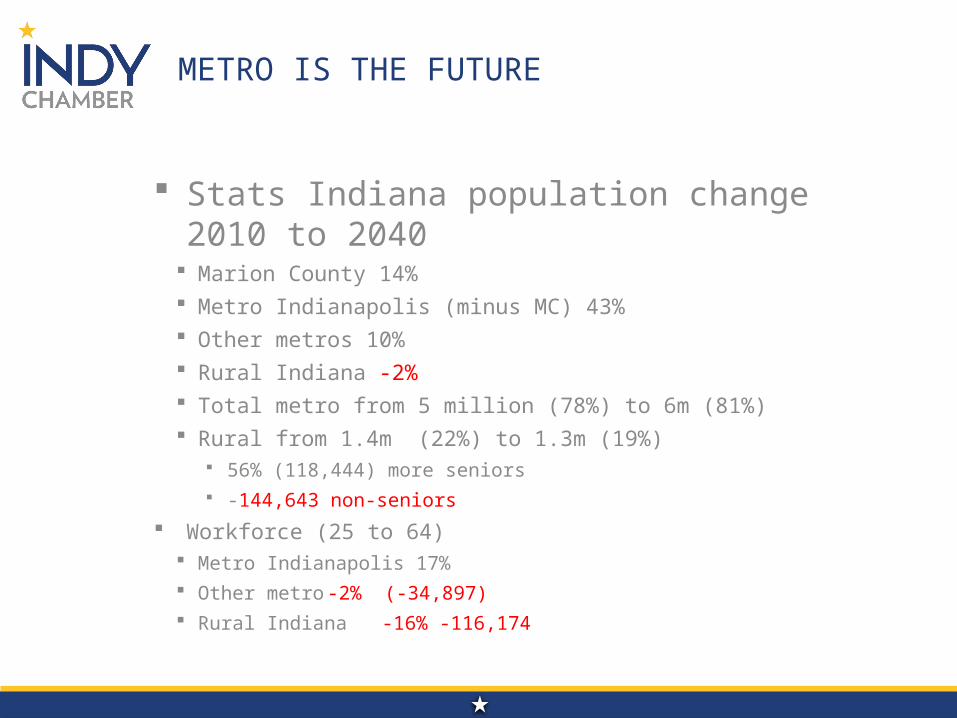
METRO IS THE FUTURE
Stats Indiana population change 2010 to 2040 Marion County 14% Metro Indianapolis (minus MC) 43% Other metros 10% Rural Indiana -2% Total metro from 5 million (78%) to 6m (81%) Rural from 1.4m (22%) to 1.3m (19%)
56% (118,444) more seniors -144,643 non-seniors
Workforce (25 to 64) Metro Indianapolis 17%
Other metro -2% (-34,897)
Rural Indiana -16% -116,174

METRO INDIANA IMPACT: EMPLOYMENT CENTERS
Marion County 18% of all Indiana jobs 24% of all wages Less than 2% of all land 14% of population
Metro Indiana (not Marion County) 63% of all jobs 59% of all wages Less than 49% of all land 64% of population

STRONG CORE = STRONG ECONOMY
Downtown Indianapolis:
4% of all Indiana jobs Central Indiana 31% Marion County 20%
$9.3 billion of investment since 1990 22 million visitors
1,187,147 convention room nights, $3.6 billion in spending
Trend changer - attracting out of state households / retaining in-state millennials

REGIONAL JOB GROWTH
• 2014: Regional Population: 50/50 splito Long-term demographic shifts
• 2000-2012: o Marion County lost 41,000 jobso Suburban counties gained 78,000
Marion County's regional job share fell from 73% to 65% 205,000 Commuters into Marion County
» #1 per capita for inflow migration of workers
• Source of Job Growth
• Skills Mismatcho Indianapolis MSA 46/50 for socio-economic mobilityo Early Childhood Educationo Typeo Geography
• Workforce Mobilityo Transit = Workforce Mobility

IMPACT OF CHANGES TO LOCAL TAXATION
• 1-2-3 Property Tax Capso My Slice of the Pie
Public Safety Schools
• Referenda Infrastructure Amenities
o Mix of Property Types Job Poaching
• Reliance on Income Taxeso Restrictions on Useso Equity in Revenues

REGIONAL COOPERATION:
• Threats: Tax Structure Understanding of Sources & Uses Acknowledge Interdependence
• Intra County Fights: Land-use (small/rural vs. growth)
• Competition (locally) & Collaboration (State/Nation)• Legislative Dynamics
Indianapolis “Gets Everything” Investments largely made by locals ROI for the State
Us vs. Them Rural/Urban Divide
» Suburban Dynamic Polarized Delegations
Border State Metros Media Markets