Embed Size (px)
Citation preview
Reference Number: 800.510-55.2016
Regional District of Central Kootenay Agricultural Land Use Inventory
Summer 2016
Strengthening Farming Program British Columbia Ministry of Agriculture
March 20, 2017
Regional District of Central Kootenay - Agricultural Land Use Inventory - Page i
AAcckknnoowwlleeddggmmeennttss This project was made possible by a partnership between the Regional District of Central Kootenay, the BC Ministry of Agriculture, and the Partnership for Water Sustainability in BC. All partners provided in-kind resources that enabled the success of the Agricultural Land Use Inventory. We would like to acknowledge the farmers and residents who stopped to talk to the survey crew about farming in the region. Funding for this project has been provided in part by Agriculture and Agri-Food Canada and the BC Ministry of Agriculture through the Canada-BC Agri-Innovation Program under Growing Forward 2, a federal-provincial territorial initiative. The program is delivered by the Investment Agriculture Foundation of BC. Additional project funding was provided by the Regional District of Central Kootenay and the Columbia Basin Trust.
Disclaimer: Agriculture and Agri-Food Canada (AAFC) is committed to working with industry partners. Opinions expressed in this document are those of the authors and not necessarily those of AAFC or the Investment Agriculture Foundation of BC. CCiittaattiioonn
BC Ministry of Agriculture. Agricultural Land Use Inventory: Regional District of Central Kootenay, Summer 2016. (Reference No. 800.510-55.2016).
CCoonnttaacctt IInnffoorrmmaattiioonn For further information on the content and development of this report please contact: Ministry of Agriculture Innovation & Adaptation Services Branch, Strengthening Farming Program 1767 Angus Campbell Rd, Abbotsford, BC V3G 2M3 (604) 556-3001 or 1-888-221-7141 (toll free)

Regional District of Central Kootenay - Agricultural Land Use Inventory - Page ii
TTaabbllee ooff CCoonntteennttss Acknowledgments........................................................................................................................................ i Citation ......................................................................................................................................................... i Contact Information ..................................................................................................................................... i Table of Contents .........................................................................................................................................ii Acronyms .................................................................................................................................................... iii Executive Summary ..................................................................................................................................... 1 Agrologist Comments .................................................................................................................................. 4 1. General Information .............................................................................................................................. 6
1.1 Overview ...................................................................................................................................................6 1.2 Agricultural Land Reserve .........................................................................................................................7 1.3 Inventory Area ..........................................................................................................................................9
2. Methodology ........................................................................................................................................ 10 2.1 Inventory Methodology ......................................................................................................................... 10 2.2 Description of the Data ......................................................................................................................... 11 2.3 Presentation of the Data ....................................................................................................................... 12
3. Land Cover and Farmed Area............................................................................................................... 13 3.1 Land Cover and Farmed Area ................................................................................................................ 13 3.2 Status of the Effective ALR .................................................................................................................... 17
4. Farming Activities ................................................................................................................................. 19 4.1 Cultivated Field Crops ............................................................................................................................ 19 4.2 Irrigation ................................................................................................................................................ 25 4.3 Livestock ................................................................................................................................................ 27
5. ALR Utilization ...................................................................................................................................... 31 5.1 Parcel Inclusion in the ALR .................................................................................................................... 31 5.2 Land Use and Farm Use ......................................................................................................................... 32 5.3 Farm Use & Parcel Size .......................................................................................................................... 34
6. ALR Availability for Farming ................................................................................................................. 37 6.1 ALR Parcel Availability Overview ........................................................................................................... 37 6.2 On Parcels Used For Farming ................................................................................................................ 38 6.3 On Parcels Available For Farming .......................................................................................................... 39 6.4 On Parcels Unavailable For Farming ...................................................................................................... 42
7. Land Use Outside the ALR .................................................................................................................... 43 7.1 Land Use and Farm Use Outside the ALR .............................................................................................. 43
Appendix A – Glossary .............................................................................................................................. 44

Regional District of Central Kootenay - Agricultural Land Use Inventory - Page iii
AAccrroonnyymmss AGRI BC Ministry of Agriculture ALR Agricultural Land Reserve ALUI Agricultural Land Use Inventory AUE Animal Unit Equivalent GIS Geographic Information Systems OCP Official Community Plan RDCK Regional District of Central Kootenay
Regional District of Central Kootenay - Agricultural Land Use Inventory - Page 1
EExxeeccuuttiivvee SSuummmmaarryy The Regional District of Central Kootenay (RDCK) is located in south eastern BC and is comprised of 11 electoral areas and 9 member municipalities. RDCK completed an Agricultural Area Plan in 2011 with an overarching goal of increasing the quantity and quality of agricultural production in the region1. In the summer of 2016, the BC Ministry of Agriculture and its partners conducted an Agricultural Land Use Inventory (ALUI) in RDCK. The ALUI was funded by RDCK, the Columbia Basin Trust, and Growing Forward 2, a federal-provincial territorial initiative. ALUIs can be used to understand the type and extent of agricultural activities within the Agricultural Land Reserve (ALR). The ALUI data quantifies how much land is currently used for agriculture, how much land is unavailable for agriculture, and how much land may have potential for agricultural expansion. The data provides baseline information that can be used to track trends in agricultural land use and to measure changes over time. The data also enables the estimation of agricultural water demand with the use of an irrigation water demand model. Highlights: Within RDCK: • 30% of the effective ALR was in farmed land cover that includes cultivated crops and barns. • There were 13,379 ha of cultivated crops in the ALR and 1,100 ha of crops outside the ALR. • Forage & pasture accounts for 76% of all crops, while cereals & oilseeds account for 17%. • Only 23% of the crops utilize irrigation. Most forage, pasture, cereals & oilseeds were not irrigated. • Equine and beef were the most common types of livestock. Equine had the greatest number of
estimated animal unit equivalents (6,340), followed by beef with 5,640 estimated animal unit equivalents.
• Most equine activities were small with < 25 animals, while beef activities were often much larger. • There were 10 large scale beef, 6 large scale dairy, and 1 large scale ostrich activity in RDCK (> 100
animal unit equivalents). • 23% of the ALR parcels were used for farming and 77% were not used for farming • Of the ALR parcels, 34% (1,761 parcels) are unavailable due to an existing land use or low
availability of suitable land, while 43% (2,258 parcels) may be available for farming.
Area of Interest and Methodology Included in the inventory were all parcels:
• completely or partially within the ALR, or • classified by BC Assessment as having “Farm” status for tax assessment, or • containing an active water licence for farming or irrigation purposes, or • zoned by local government bylaws to permit agriculture, and greater than 1 acre2 and showing
signs of agriculture on aerial photography The ALR in RDCK consists of 63,086 ha. Of this area:
• 70% or 44,192 ha met one of the inventory criteria and was included in the survey • 26% or 16,544 ha was outside of legally surveyed parcels in Crown land • 4% or 2,350 ha was in Indian reserves
1 Regional District of Central Kootenay Agriculture Area Plan, June 2011. 2 One acre is approximately 0.404 ha.
Regional District of Central Kootenay - Agricultural Land Use Inventory - Page 2
This report focuses on the 70% or 44,192 ha of the ALR that is within legally surveyed parcels. This land is considered the “effective ALR” as local and provincial governments may have an opportunities to influence land use decisions on these areas.
The ALUI was conducted using visual interpretation of aerial imagery combined with a drive-by “windshield” survey to capture a snapshot in time of land use and land cover. Land cover is defined as the biophysical material at the surface of the earth while land use is defined as how people utilize the land. Land Cover and Farming Activities In the ALR by land cover, 30% of the effective ALR was farmed (12,379 ha), 6% of the effective ALR (2,694 ha) was otherwise anthropogenically modified in vegetation, buildings, and roads, and 64% of the effective ALR (28,109 ha) was in a natural or semi-natural state. An additional 1,100 ha of land outside the ALR was farmed. Of the farmed land cover in RDCK, 53% occurs in Area C, 24% occurs in Area B, and 10% occurs in Area K. Area C had the largest proportion of its ALR area in farmed land cover (84%), followed by Area B with 50% and Nakusp with 43%. These jurisdictions are best utilizing their ALR for farming purposes. In 2016, there were 13,988 ha of cultivated field crops in RDCK (12,982 ha in the ALR and 1,006 ha outside the ALR). Forage & pasture was the most common crop accounting for 76% of all cultivated land. Cereals & oilseeds were the next most common with 17% of the cultivated land, followed by tree fruits with 2%. A total of 10,649 ha were used for forage & pasture in RDCK: 6,436 ha were used for forage (48% of all cultivated crops), 1,988 ha were used for pasture (14% of all cultivated crops), 1,926 ha were used for both forage & pasture, and 300 ha were unused or unmaintained. Of all forage and pasture crops, 45% were located in Area C, 25% were n Area B, and 13% are in Area K. A total of 2,370 ha cereals & oilseeds were recorded in RDCK. The top crops included barley (762 ha), wheat (689 ha), oats (552 ha), and canola (286 ha). Eighty-two percent (82%) of cereals & oilseeds were located in Area C. There were 338 ha of tree fruits with cherries being the most common (238 ha), followed by apples (45 ha), and mixed orchards (15 ha). Also recorded were vegetables (132 ha), nursery (115 ha), vines & berries (50 ha), Christmas trees (50 ha), turf (24 ha), nut trees (10 ha), and specialty and floriculture crops (5 ha). Irrigation use was captured by type of crop and type of irrigation system type to aid in developing a water demand model for agriculture. Irrigation is not overly common in RDCK with only 23% of the cultivated land utilizing irrigation. Less than one quarter (24%) of forage & pasture fields are irrigated and only 2% of cereal & oilseed fields are irrigated. Other crop types in RDCK (e.g. tree fruits, vegetables, nursery, etc.) typically have a much higher proportion of their total area using irrigation. Sprinkler and giant gun systems were the most common types of irrigation. Sprinkler systems include hand-line, wheel-line, solid set and micro-sprinkler irrigation.
Regional District of Central Kootenay - Agricultural Land Use Inventory - Page 3
Livestock Livestock activities were recorded, but were difficult to measure using a windshield survey. Livestock may not be visible if they are housed in barns, or are on another land parcel. The inventory data does not identify animal movement between parcels that make up a farm unit, but reports livestock at the parcel where the animals or related structures were observed. No livestock numbers were obtained through the survey, so the results are reported as a range of animal unit equivalents for each parcel. In RDCK, equine, beef, and dairy are the most abundant types of livestock. Equine accounts for 35% of the estimated animal unit equivalents (AUEs) while beef accounts for 31% of the AUEs and dairy accounts for 13%. Equines had the greatest number of individual occurrences, however, most equine operations had only a few animals. Intensive livestock activities utilize specialized structures for confined feeding at higher stocking densities. The majority of all dairy AUEs (85%) utilize intensive facilities. ALR Utilization Land use was applied on a parcel basis. To determine land use, the entire parcel was examined and a “Used for farming” or “Not used for farming” category was assigned based on the proportion of the parcel in cultivated crops, farm infrastructure, and/or the scale of livestock production. Refer to the glossary for the full “Used for farming” definition. In the ALR by land use, 23% of the parcels were “Used for farming” (1,202 parcels) and 77% of the parcels were “Not used for farming” (4,019 parcels). The average “Used for farming” parcel size was 13 ha while the average “Not used for farming” parcel size was 11 ha. ALR Availability Parcel availability for farming was assessed based on the compatibility and extent of existing land use and land cover for agriculture. Parcels considered “Not used for farming” were further categorized as available or unavailable for farming. “Unavailable for farming” parcels either had a land use that makes agricultural development improbable (e.g. golf course, school, etc.) or had little land with potential for farming. Of the ALR parcels:
• 1,202 parcels (23%) were used for farming • 2,258 parcels (43%) were available for farming • 1,761 parcels (34%) were unavailable for farming
A parcel is considered to be “Available for farming” if it is not already “Used for farming” and it has at least 50% of its area and at least 0.4 ha in land that has potential for farming. Ownership and land prices are not considered when assessing parcel availability. Of the available parcels:
• 704 parcels (31%) are less than 2 ha in size • 1,455 parcels (64%) are less than 4 ha in size • 803 parcels (36%) are greater than 4 ha in size • 152 parcels (7%) are greater than 16 ha in size
There is evidence that small parcels are less likely than larger parcels to be utilized for farming. In RDCK there are 1,178 ALR parcels less than 1 ha. Of these parcels, 5% (60 parcels) are “Used for farming”, 21% (243 parcels) are “Available for farming”, and 74% (875 parcels) are “Unavailable for farming”. Residential use accounts for the majority of the small and “Unavailable for farming” parcels.
Regional District of Central Kootenay - Agricultural Land Use Inventory - Page 4
AAggrroollooggiisstt CCoommmmeennttss Agriculture in the Regional District of Central Kootenay is as diverse as is the geography of the region itself. From the Creston area, Kootenay Lake, Naksup to Fauquier, Slocan Valley and all places in between, a range of agriculture enterprises and products are taking place. The first European settlers in the region were less interested in agriculture and were more focused on the minerals in the region which attracted a high degree attention. Mining was attracting the settlers, but when the lucrative earnings of the industry waned, the settlers turned to the productive valley bottoms and agriculture production in the area began in earnest. One of the most productive agricultural areas in the region is the Creston Valley, but contenting with the annual flooding of the Kootenay River made farming very difficult. The first dyking of the Creston flats started in 1893 but there were many setbacks as the River continued to flood and destroy the dykes. By 1935 all the dykes were built but there were breaches over the years. The construction of the Libby Dam in Montana in 1972 ensured there was no more flooding of the Creston flats. Another productive part of the region was the Arrow Lakes area. In the late 1960’s with the construction of a dam near Castlegar, two thirds of the arable land in the valley was flooded. Other smaller dams in the region have also impacted agriculture by flooding valuable arable land. Small scale operations are more common throughout the region, with larger commercial operations more prevalent in the Creston area. Creston has a diversity of agriculture businesses ranging from hay, grain, dairy, tree fruit, seed, poultry and beef operations. In the past, many agriculture producers were able to produce and sell their products to the local market. However, over time, the economy of scale made it more difficult for agriculture producers to compete and many farms stopped producing and became fallow. In the last few years, there is greater interest by the local population to purchase local food and to support local farm businesses. Agriculture in General In the RDCK, the Agriculture Land Reserve covers 63,086 hectares, which equates to 3% of the land area in the region. Agriculture is one of the many economic drivers in the region. Gross farm receipts have continually increased from $25,694,725 in 1996, to $34,353,451 in 2011, which is an increase of 34%. In that same time period, the number of farms dropped from 594 to 552 (- 7%) and farm size increased from 38.7 ha to 49.0 ha (+27%). Farm size in the RDCK is fairly large (49 ha) considering that there are many small lots in the region. Parcels less than 4 ha make up 62% of all parcels in the ALR. Only 592 parcels are greater than 16 ha. However, those larger parcels (592) in the ALR equate to a very large area of 27,878 ha, which by area is 66% of the inventoried ALR. Across the RDCK, forage and pasture crops were the most dominant with 10,649 ha. Cereal crops were the next most abundant with 2,370 ha. Tree fruits were next with 338 ha. In total, twelve different crop groups were recorded for the region.
Regional District of Central Kootenay - Agricultural Land Use Inventory - Page 5
Issues Facing Agriculture This report identifies 2,265 ALR parcels with 14,948 ha of ALR land that may be available for farming. This is 34% of the total ALR area in legally surveyed parcels in the RDCK. Even with this available land base, potential agricultural growth could be hampered by other issues and constraints. • Water
Without water for irrigation, the possibility of expanding agriculture will be limited. Even existing water rights and licenses for agriculture does not guarantee a stable water supply. With the continued expansion of the urban centers and rural subdivision in the Central Kootenay, water availability for agriculture is a concern.
• Recreational Development
The increase in recreational and second home development in the region has impacted the agriculture industry. The increased value of land has severely limited the ability of agriculture businesses to expand as the value of land is priced beyond what the commodity produced on it can pay. The increase in development has removed agriculture land from production and is slowly urbanizing rural farming areas.
The Future The Creston valley will continue to be the hub of agriculture in the region. Elsewhere in the region, small lots can constrain agriculture opportunities and limit the type and amount of production. However, one is never sure what the future will bring. Climate change, plant genetics, transportation costs and other factors could result in agriculture on land one never thought would flourish. Ensuring the ALR is left intact for future farming is essential to ensure land is available for agriculture in a changing future world.
Regional District of Central Kootenay - Agricultural Land Use Inventory - Page 6
11.. GGeenneerraall IInnffoorrmmaattiioonn 1.1 OVERVIEW
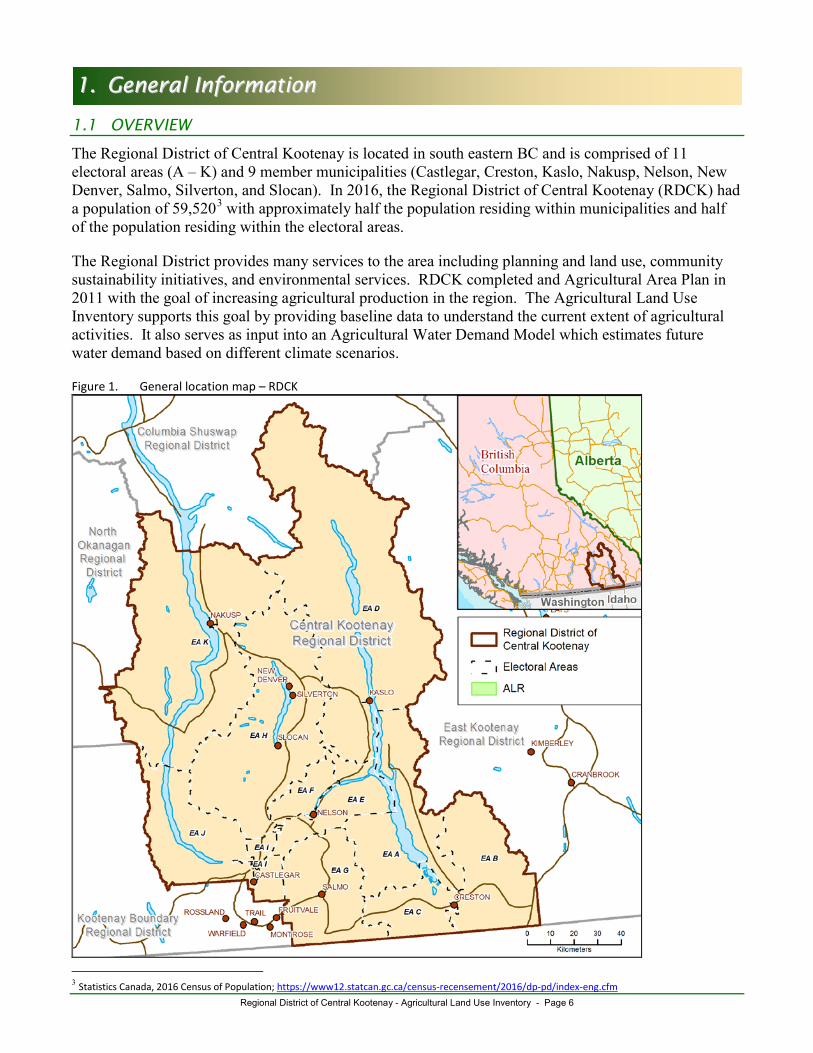
The Regional District of Central Kootenay is located in south eastern BC and is comprised of 11 electoral areas (A – K) and 9 member municipalities (Castlegar, Creston, Kaslo, Nakusp, Nelson, New Denver, Salmo, Silverton, and Slocan). In 2016, the Regional District of Central Kootenay (RDCK) had a population of 59,5203 with approximately half the population residing within municipalities and half of the population residing within the electoral areas.
The Regional District provides many services to the area including planning and land use, community sustainability initiatives, and environmental services. RDCK completed and Agricultural Area Plan in 2011 with the goal of increasing agricultural production in the region. The Agricultural Land Use Inventory supports this goal by providing baseline data to understand the current extent of agricultural activities. It also serves as input into an Agricultural Water Demand Model which estimates future water demand based on different climate scenarios.
Figure 1. General location map – RDCK
3 Statistics Canada, 2016 Census of Population; https://www12.statcan.gc.ca/census-recensement/2016/dp-pd/index-eng.cfm
Regional District of Central Kootenay - Agricultural Land Use Inventory - Page 7
1.2 AGRICULTURAL LAND RESERVE
The Agricultural Land Reserve (ALR) is a provincial land use zone that was designated in 1973 in which agriculture is recognized as the priority use. Within the ALR, farming is encouraged and non- agricultural uses are controlled.
There were 63,086 ha4 of ALR in RDCK in 2015 (see Figure 1). This is approximately 3% of the regional districts total land area (2,316,142 ha5) and 7.5% of the area in legally surveyed parcels (845,013 ha5).
The ALR area includes:
• 44,192 ha on inventoried parcels • 16,536 ha outside legally surveyed parcels (unsurveyed Crown land) • 2,350 ha on Indian reserves • 8 ha on parcels less than 500 m2, or with less than 500 m2 of ALR
The 44,192 ha of ALR on inventoried parcels is considered the ‘effective ALR’ as local and provincial governments may have the opportunity to influence land use decisions on these areas.
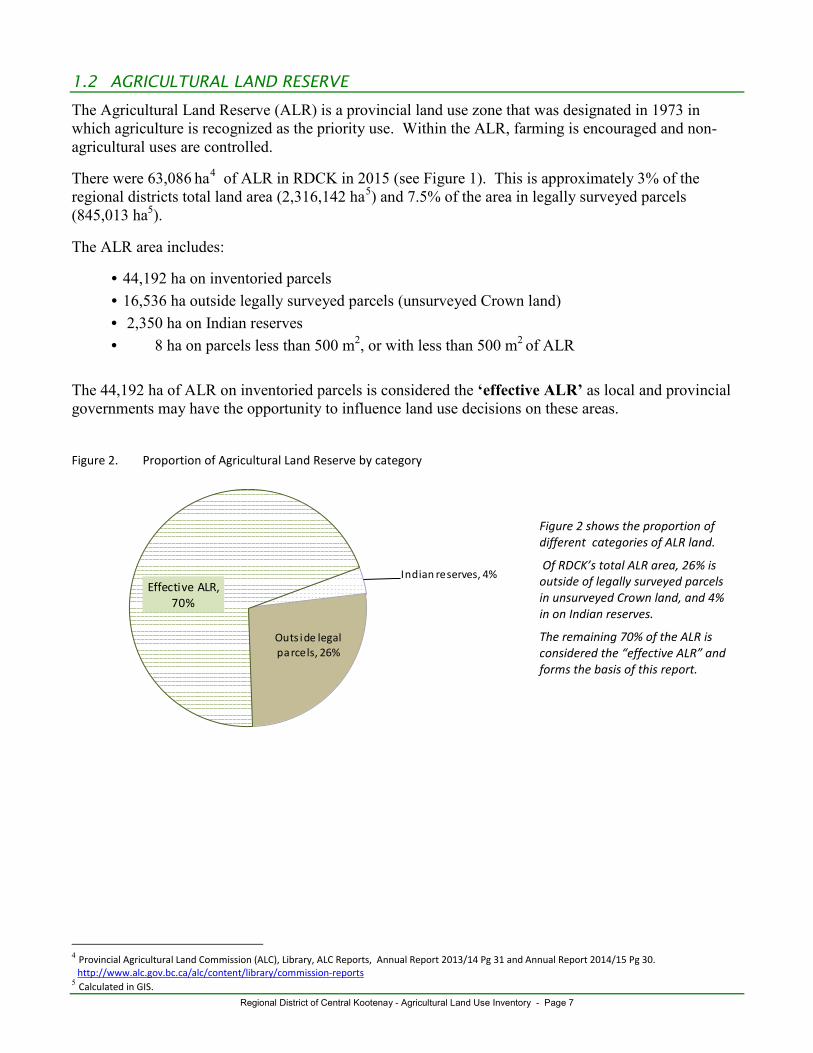
Figure 2. Proportion of Agricultural Land Reserve by category
Indian reserves, 4%
Outs ide legal parcels, 26%
Effective ALR, 70%
4 Provincial Agricultural Land Commission (ALC), Library, ALC Reports, Annual Report 2013/14 Pg 31 and Annual Report 2014/15 Pg 30.
http://www.alc.gov.bc.ca/alc/content/library/commission-reports 5 Calculated in GIS.
Figure 2 shows the proportion of different categories of ALR land.
Of RDCK’s total ALR area, 26% is outside of legally surveyed parcels in unsurveyed Crown land, and 4% in on Indian reserves.
The remaining 70% of the ALR is considered the “effective ALR” and forms the basis of this report.
Regional District of Central Kootenay - Agricultural Land Use Inventory - Page 8
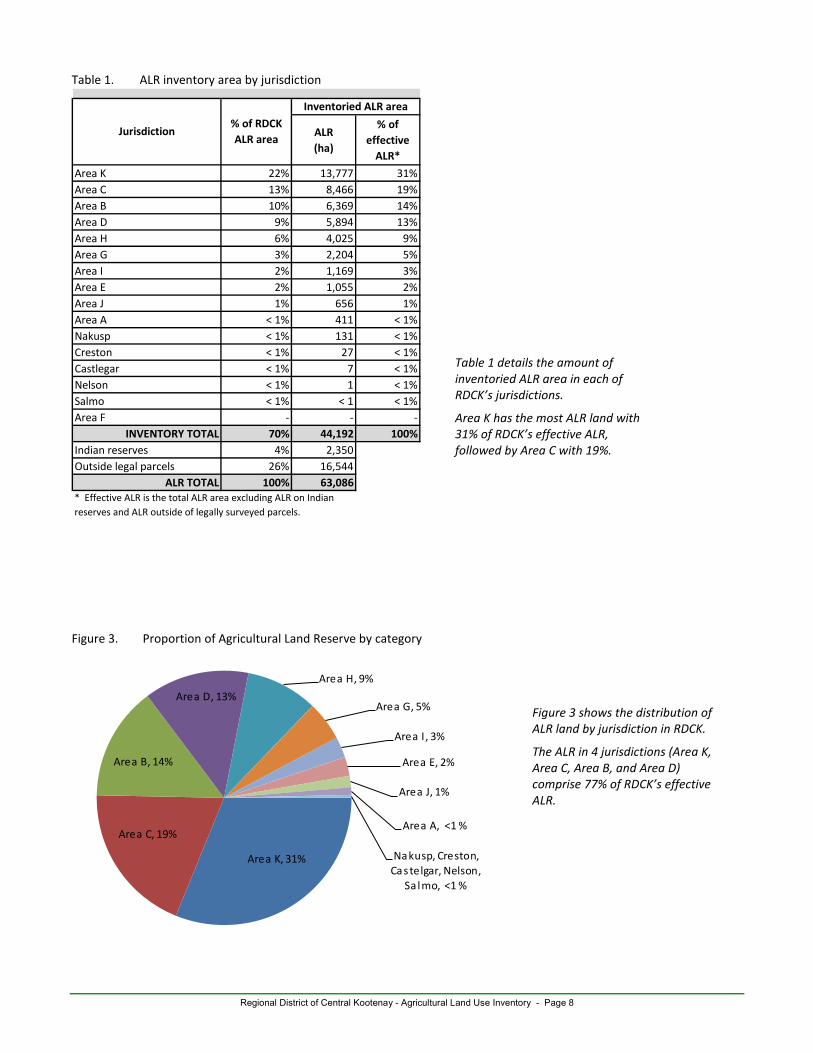
Table 1. ALR inventory area by jurisdiction
ALR (ha)
% of effective
ALR*
Area K 22% 13,777 31%Area C 13% 8,466 19%Area B 10% 6,369 14%Area D 9% 5,894 13%Area H 6% 4,025 9%Area G 3% 2,204 5%Area I 2% 1,169 3%Area E 2% 1,055 2%Area J 1% 656 1%Area A < 1% 411 < 1%Nakusp < 1% 131 < 1%Creston < 1% 27 < 1%Castlegar < 1% 7 < 1%Nelson < 1% 1 < 1%Salmo < 1% < 1 < 1%Area F - - -
INVENTORY TOTAL 70% 44,192 100%Indian reserves 4% 2,350Outside legal parcels 26% 16,544
ALR TOTAL 100% 63,086* Effective ALR is the total ALR area excluding ALR on Indian reserves and ALR outside of legally surveyed parcels.
Jurisdiction% of RDCK ALR area
Inventoried ALR area
Figure 3. Proportion of Agricultural Land Reserve by category
Area K, 31%
Area C, 19%
Area B, 14%
Area D, 13%Area H, 9%
Area G, 5%
Area I, 3%
Area E, 2%
Area J, 1%
Area A, <1 %
Nakusp, Creston, Castelgar, Nelson,
Sa lmo, <1 %
Table 1 details the amount of inventoried ALR area in each of RDCK’s jurisdictions.
Area K has the most ALR land with 31% of RDCK’s effective ALR, followed by Area C with 19%.
Figure 3 shows the distribution of ALR land by jurisdiction in RDCK.
The ALR in 4 jurisdictions (Area K, Area C, Area B, and Area D) comprise 77% of RDCK’s effective ALR.
Regional District of Central Kootenay - Agricultural Land Use Inventory - Page 9
1.3 INVENTORY AREA
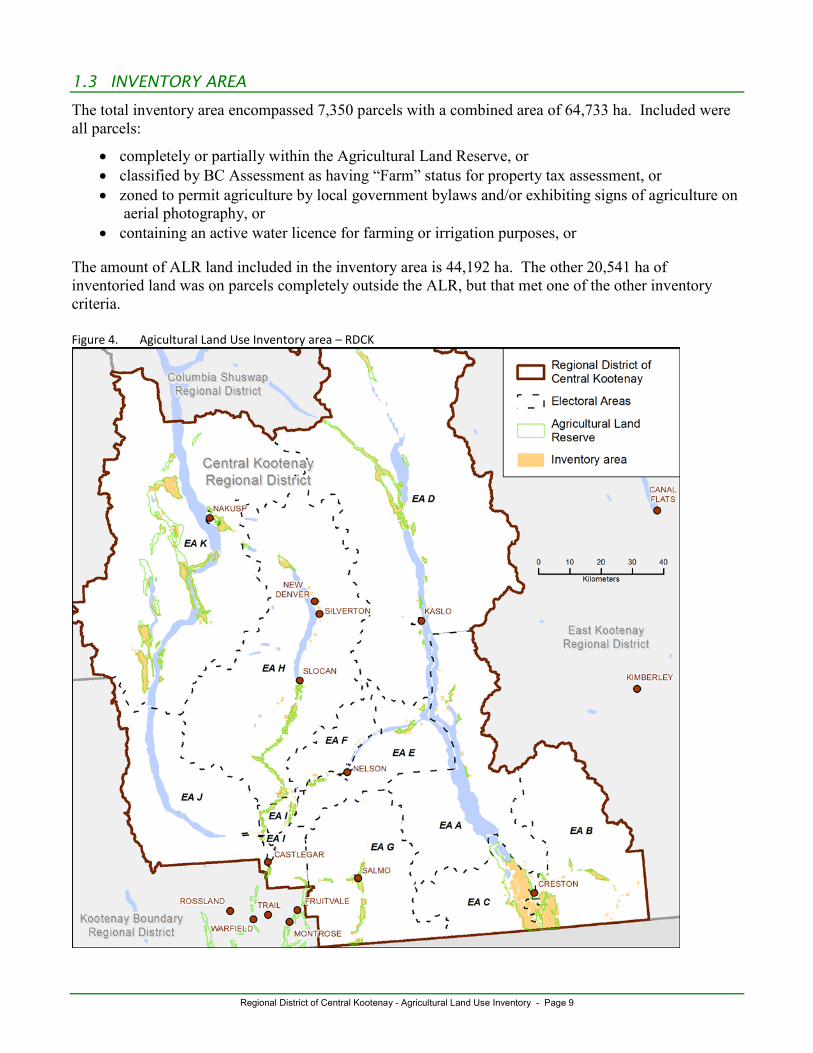
The total inventory area encompassed 7,350 parcels with a combined area of 64,733 ha. Included were all parcels:
• completely or partially within the Agricultural Land Reserve, or • classified by BC Assessment as having “Farm” status for property tax assessment, or • zoned to permit agriculture by local government bylaws and/or exhibiting signs of agriculture on
aerial photography, or • containing an active water licence for farming or irrigation purposes, or
The amount of ALR land included in the inventory area is 44,192 ha. The other 20,541 ha of inventoried land was on parcels completely outside the ALR, but that met one of the other inventory criteria. Figure 4. Agicultural Land Use Inventory area – RDCK
Regional District of Central Kootenay - Agricultural Land Use Inventory - Page 10
22.. MMeetthhooddoollooggyy 2.1 INVENTORY METHODOLOGY
AgFocus is an Agricultural Land Use Inventory System developed by BC Ministry of Agriculture’s Strengthening Farming Program. AgFocus employs a “windshield” survey method designed to capture a snapshot in time of land use and land cover on legal parcels. For more information on AgFocus, please refer to these documents available from the Strengthening Farming Program:
• AgFocus – A Surveyor’s Guide to Conducting an Agricultural Land Use Inventory • AgFocus – Field Guide to Conducting an Agricultural Land Use Inventory • AgFocus – A GIS Analyst’s Guide to Agricultural Land Use Inventory Data
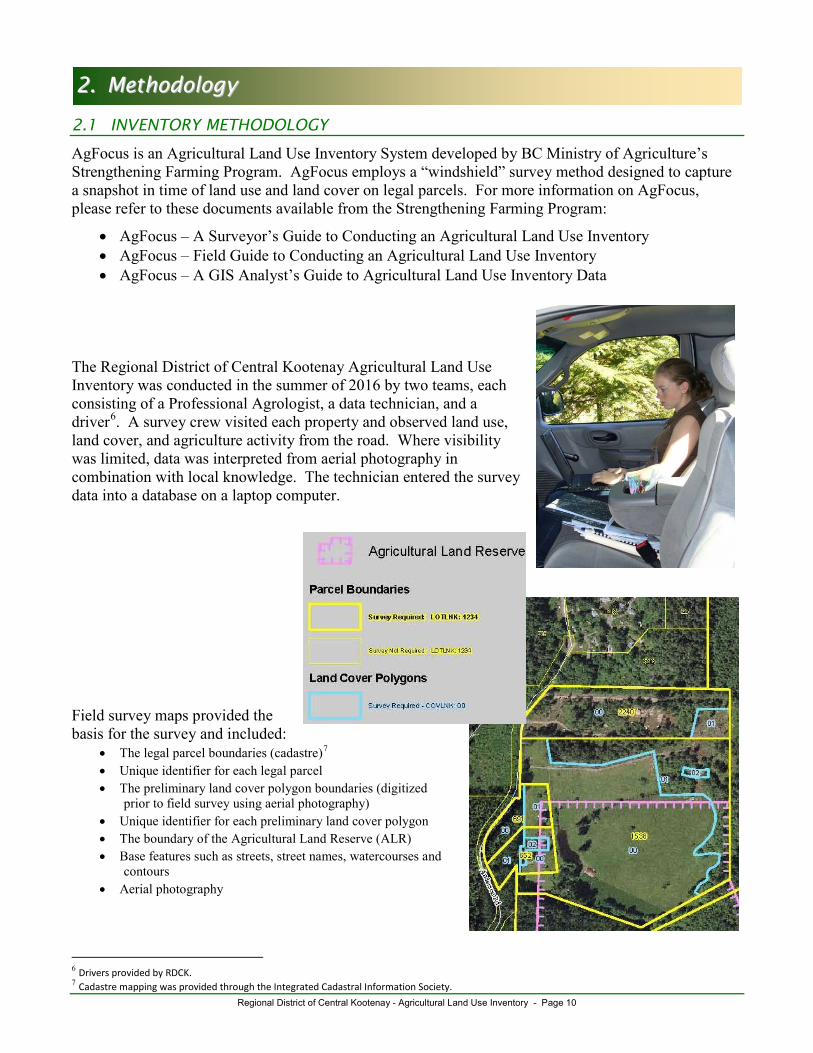
The Regional District of Central Kootenay Agricultural Land Use Inventory was conducted in the summer of 2016 by two teams, each consisting of a Professional Agrologist, a data technician, and a driver6. A survey crew visited each property and observed land use, land cover, and agriculture activity from the road. Where visibility was limited, data was interpreted from aerial photography in combination with local knowledge. The technician entered the survey data into a database on a laptop computer. Field survey maps provided the basis for the survey and included:
• The legal parcel boundaries (cadastre)7 • Unique identifier for each legal parcel • The preliminary land cover polygon boundaries (digitized
prior to field survey using aerial photography) • Unique identifier for each preliminary land cover polygon • The boundary of the Agricultural Land Reserve (ALR) • Base features such as streets, street names, watercourses and
contours • Aerial photography
6 Drivers provided by RDCK. 7 Cadastre mapping was provided through the Integrated Cadastral Information Society.
Regional District of Central Kootenay - Agricultural Land Use Inventory - Page 11
2.2 DESCRIPTION OF THE DATA
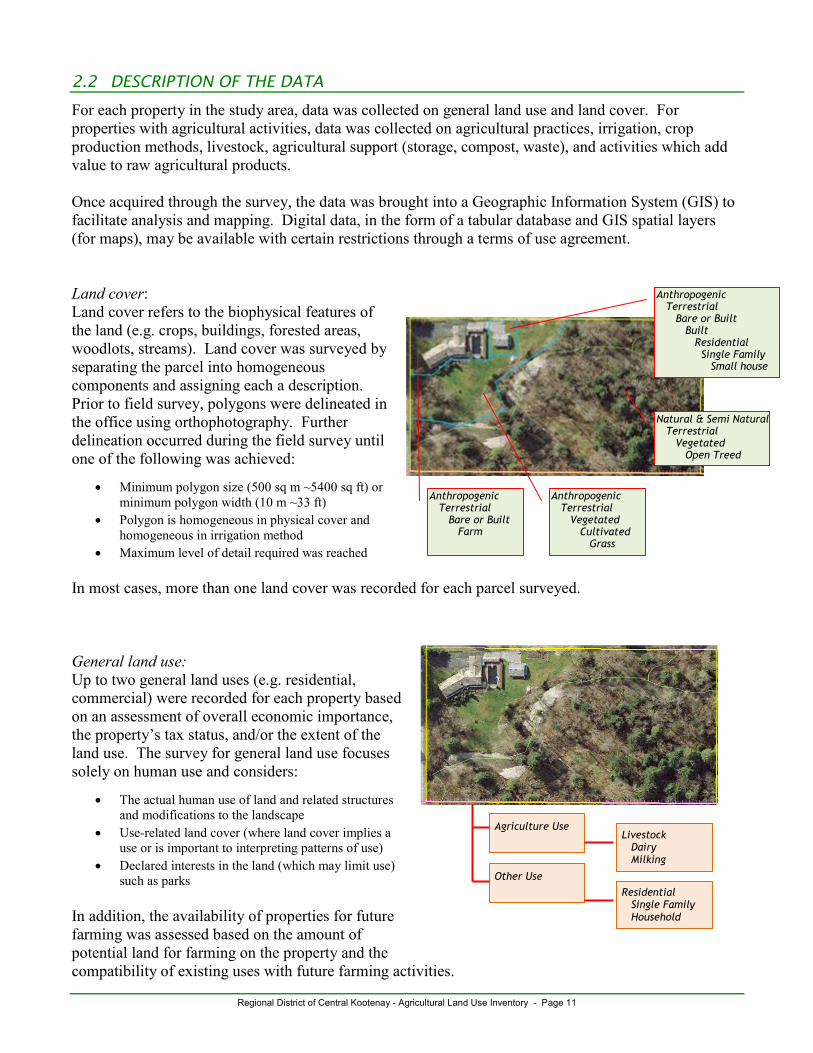
For each property in the study area, data was collected on general land use and land cover. For properties with agricultural activities, data was collected on agricultural practices, irrigation, crop production methods, livestock, agricultural support (storage, compost, waste), and activities which add value to raw agricultural products. Once acquired through the survey, the data was brought into a Geographic Information System (GIS) to facilitate analysis and mapping. Digital data, in the form of a tabular database and GIS spatial layers (for maps), may be available with certain restrictions through a terms of use agreement. Land cover: Land cover refers to the biophysical features of the land (e.g. crops, buildings, forested areas, woodlots, streams). Land cover was surveyed by separating the parcel into homogeneous components and assigning each a description. Prior to field survey, polygons were delineated in the office using orthophotography. Further delineation occurred during the field survey until one of the following was achieved:
• Minimum polygon size (500 sq m ~5400 sq ft) or minimum polygon width (10 m ~33 ft)
• Polygon is homogeneous in physical cover and homogeneous in irrigation method
• Maximum level of detail required was reached In most cases, more than one land cover was recorded for each parcel surveyed. General land use: Up to two general land uses (e.g. residential, commercial) were recorded for each property based on an assessment of overall economic importance, the property’s tax status, and/or the extent of the land use. The survey for general land use focuses solely on human use and considers:
• The actual human use of land and related structures and modifications to the landscape
• Use-related land cover (where land cover implies a use or is important to interpreting patterns of use)
• Declared interests in the land (which may limit use) such as parks
In addition, the availability of properties for future farming was assessed based on the amount of potential land for farming on the property and the compatibility of existing uses with future farming activities.
Agriculture Use Livestock Dairy Milking
Other Use Residential Single Family Household
Anthropogenic Terrestrial Bare or Built Farm
Natural & Semi Natural Terrestrial Vegetated Open Treed
Anthropogenic Terrestrial Vegetated Cultivated Grass
Anthropogenic Terrestrial Bare or Built Built Residential Single Family Small house
Regional District of Central Kootenay - Agricultural Land Use Inventory - Page 12
Livestock: Livestock operations and confinement methods along with the scale of the activity were estimated and recorded. Livestock not visible at the time of survey may have been inferred based on grazed pastures, manure storage, size of barn and other evidence. Agricultural practices: Surveyors recorded agricultural practices associated with crops or livestock activities. For example, if a forage crop was being harvested for hay, it was recorded. Irrigation was also recorded, including the type of system used. Agricultural crop production: Crop production and crop protection methods observed on the parcel were recorded such as wildlife scare devices, temperature or light control, or organic production. Organic production is not always visible and may have been recorded based on local knowledge or farmer interviews. Agricultural support: Ancillary agricultural activities, such as storage, compost or waste, supporting the production of a raw commodity on a farm unit were recorded. Agricultural value added: Activities that add value to a raw commodity where at least 50% of the raw commodity is produced on the farm unit were recorded. This value-added activity included processing, direct sales and agri-tourism activities. 2.3 PRESENTATION OF THE DATA
The data in this report is presented in the form of summarized tables and charts. In the final formatting of the tables and charts, data values are rounded to the nearest whole number. As a result, the data may not appear to add up correctly.
Regional District of Central Kootenay - Agricultural Land Use Inventory - Page 13
33.. LLaanndd CCoovveerr aanndd FFaarrmmeedd AArreeaa 3.1 LAND COVER AND FARMED AREA
Land cover describes the biophysical material at the surface of the earth and is distinct from land use which describes how people utilize the land. Refer to Section 5 for information on land use. Land cover is surveyed by separating the parcel into polygons of homogeneous components and assigning each a description such as landscape lawn, natural open treed, natural waterbody, blueberries, road, or small single family house. Most surveyed parcels have multiple land cover types with each describing a different area of the parcel. Land cover more closely approximates the actual area of land in agricultural production than land use, which is assigned on a parcel basis. Four land cover types are considered “Farmed”:
• Cultivated field crops: vegetation under cultivation for harvest or pasture including land temporarily set aside from farming and perennial crops that were not harvested or grazed in the current growing season
• Farm infrastructure: built structures associated with farming such as barns, stables, corrals, riding rings, and their associated yards
• Greenhouses: permanent enclosed glass or poly structures with or without climate control facilities for growing plants and vegetation under controlled environments
• Crop barns: permanent enclosed structures with non-translucent walls for growing crops such as mushrooms or bean sprouts
Forage and pasture field crops which have not been cut or grazed during the current growing season (unused), unmaintained field crops, and unmaintained greenhouses are considered “Farmed” land covers but are considered inactive. Natural pasture and rangeland are areas with uncultivated (not sown) natural or semi-natural grasses, herbs or shrubs used for grazing domestic livestock. These areas are considered “Grazed” and not “Farmed” although these areas are often extensions of more intensive farming areas. Land cover types which may support farming, such as farm residences, vegetative buffers and farm road access, are not considered “Farmed” land cover.

Regional District of Central Kootenay - Agricultural Land Use Inventory - Page 14
Table 2. Land cover and farmed area
Cultivated field crops 12,699 29% 961 13,660Farm infrastructure 386 1% 93 479Greenhouses & crop barns 11 < 1% 1 12Unmaintained field crops 283 < 1% 45 328
13,379 30% 1,100 14,479Managed vegetation 985 2%Residential footprint 952 2%Transportation 250 < 1%Utilities 143 < 1%Waterbodies 140 < 1%Non Built or Bare 98 < 1%Settlement 77 < 1%Built up - Other 47 < 1%
2,694 6%Vegetation 25,869 59%Natural pasture or rangeland 1,282 3%Wetlands & waterbodies 917 2%Natural bare areas 41 < 1%
28,109 64%Unknown 10 < 1%
44,192 100%* Refer to the glossary for terms used in this table.
Land cover*Outside ALR (ha)
Total area (ha)
Actively farmed
Inactively farmedFARMED SUBTOTAL
Anthropogenic(not farmed)
In ALR (ha)
% of effective
ALR*
Natural &Semi-natural
NATURAL & SEMI-NATURAL SUBTOTAL
TOTAL ALR INVENTORIED
ANTHROPOGENIC SUBTOTAL
Not surveyed
Figure 5. Land cover in the effective ALR
Actively farmed, 30%
Inactively farmed, <1%
Anthropogenic, 6%
Natura l & Semi-natural, 64%
Table 2 shows the extent of different land cover types across the effective ALR in RDCK.
In the ALR, there are 13,379 ha of “Farmed” land cover, which includes 283 ha of unmaintained field crops. An additional 1,100 ha of “Farmed” land cover was identified outside the ALR.
Figure 5 shows the proportion of different land cover categories across the effective ALR in RDCK.
Sixty-four percent (64%) is in “natural & semi-natural” while 30% is in actively farmed land cover.
Land used in support of farming such as farm residences, vegetative buffers or roadways is not included as farmed land cover.
Regional District of Central Kootenay - Agricultural Land Use Inventory - Page 15
Table 3. Land cover in the ALR by jurisdiction
In ALR (ha)
% of RDCK ALR area
In ALR (ha)
% of RDCK ALR area
In ALR (ha)
% of RDCK ALR area
In ALR (ha)
% of RDCK ALR area
Area C 7,132 16% 485 1% 849 2% 8,466 19%Area B 3,208 7% 609 1% 2,552 6% 6,369 14%Area K 1,373 3% 439 < 1% 11,956 27% 13,777 31%Area H 431 < 1% 458 1% 3,136 7% 4,025 9%Area D 401 < 1% 141 < 1% 5,352 12% 5,894 13%Area G 340 < 1% 154 < 1% 1,709 4% 2,204 5%Area E 211 < 1% 120 < 1% 723 2% 1,055 2%Area I 157 < 1% 159 < 1% 853 2% 1,169 3%Nakusp 56 < 1% 19 < 1% 56 < 1% 131 < 1%Area J 31 < 1% 20 < 1% 605 1% 656 1%Area A 29 < 1% 88 < 1% 294 < 1% 411 < 1%Creston 10 < 1% 2 < 1% 15 < 1% 27 < 1%Castlegar - - - - 7 < 1% 7 < 1%Nelson - - - - 1 < 1% 1 < 1%Salmo - - - - < 1 < 1% < 1 < 1%
TOTAL ALR 13,379 30% 2,694 6 % 28,109 64% 44,192 100%* Farmed – Land cover directly contributing to agricultural production (both actively farmed and inactively farmed). Includes land in Cultivated field crops, Farm infrastructure and Crop cover structures. Does not include natural pasture.
Jurisdiction
Land Cover Category
TotalFarmed *
Anthropogenic (not farmed)
Natural & Semi-natural
Figure 6. Farmed land cover in RDCK by jurisdiction
Area C, 53%
Area B, 24%
Area K, 10%
Area H, 3%
Area D, 3%
Area G, 3%
Area E, 2%
Area I, 1%
Nakusp, Area J, Area A, Creston,
1%
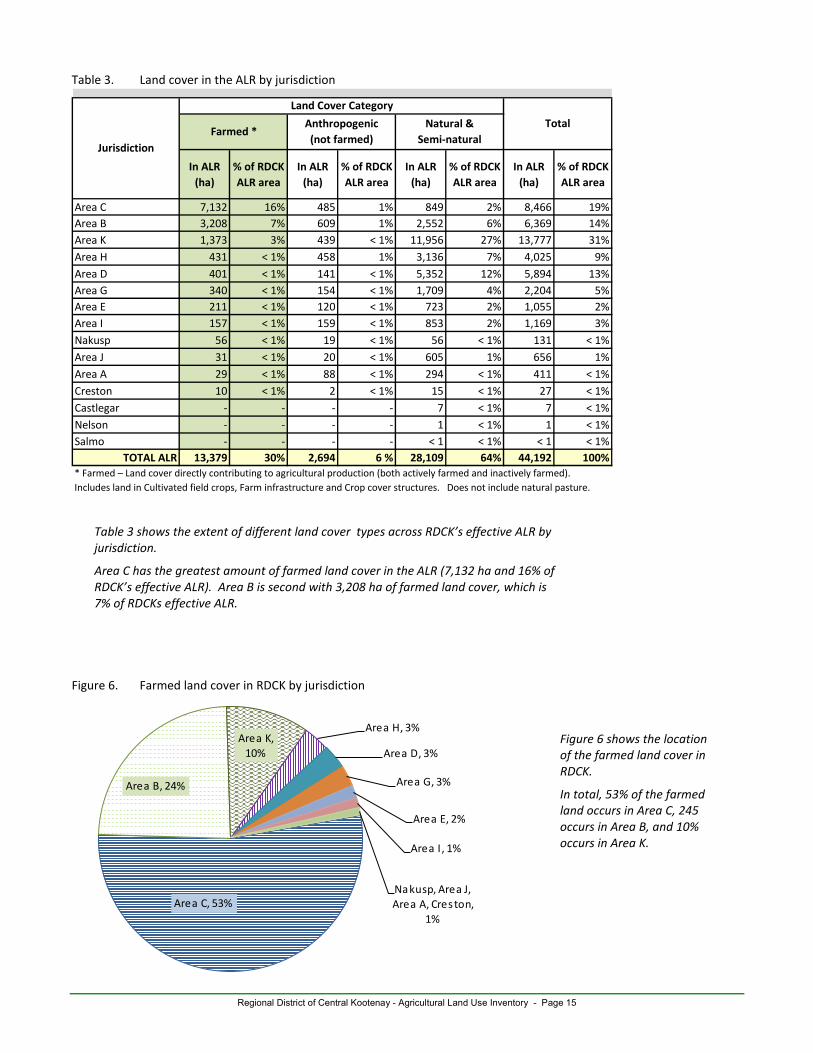
Table 3 shows the extent of different land cover types across RDCK’s effective ALR by jurisdiction.
Area C has the greatest amount of farmed land cover in the ALR (7,132 ha and 16% of RDCK’s effective ALR). Area B is second with 3,208 ha of farmed land cover, which is 7% of RDCKs effective ALR.
Figure 6 shows the location of the farmed land cover in RDCK.
In total, 53% of the farmed land occurs in Area C, 245 occurs in Area B, and 10% occurs in Area K.
Regional District of Central Kootenay - Agricultural Land Use Inventory - Page 16
Figure 7. ALR land cover utilisation by jurisdiction
5 %
7 %
7 %
10 %
11 %
13 %
15 %
20 %
36 %
43 %
50 %
84 %
0% 20% 40% 60% 80% 100%
Area J
Area D
Area A
Area K
Area H
Area I
Area G
Area E
Creston
Nakusp
Area B
Area C
% of Jurisdictional ALR area
Juri
sdic
tion
Farmed Anthropogenic (not farmed) Natural & Semi-natural
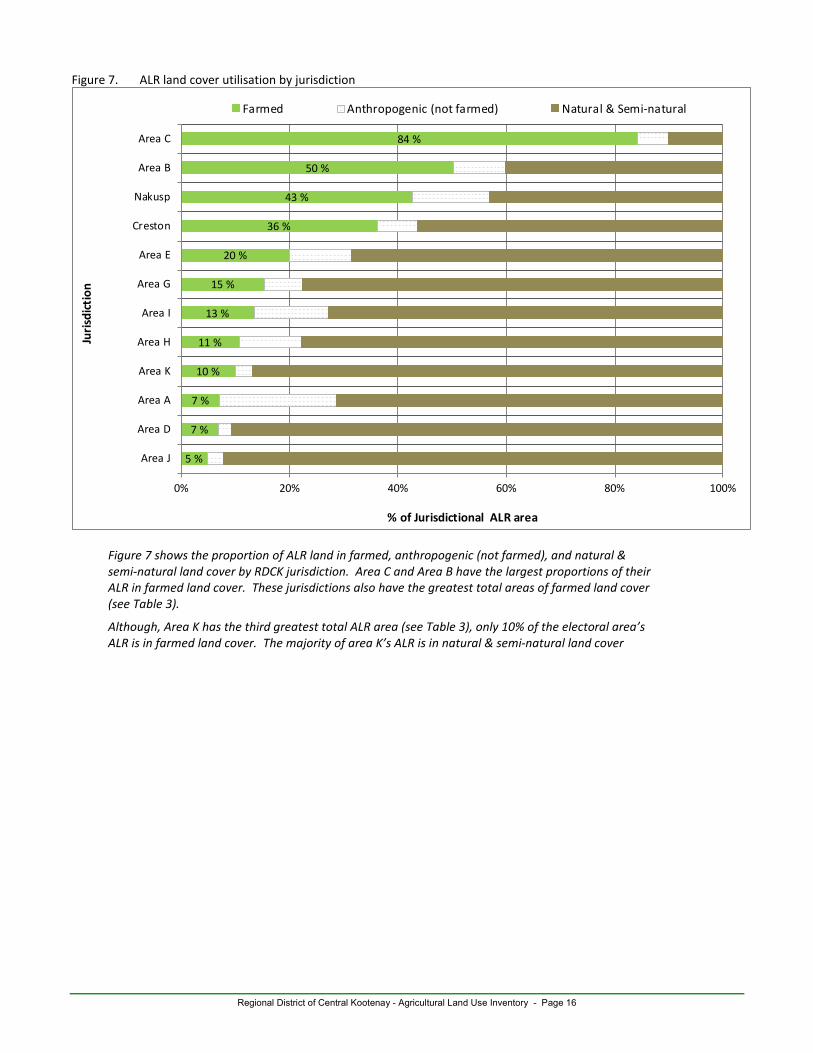
Figure 7 shows the proportion of ALR land in farmed, anthropogenic (not farmed), and natural & semi-natural land cover by RDCK jurisdiction. Area C and Area B have the largest proportions of their ALR in farmed land cover. These jurisdictions also have the greatest total areas of farmed land cover (see Table 3).
Although, Area K has the third greatest total ALR area (see Table 3), only 10% of the electoral area’s ALR is in farmed land cover. The majority of area K’s ALR is in natural & semi-natural land cover
Regional District of Central Kootenay - Agricultural Land Use Inventory - Page 17
3.2 STATUS OF THE EFFECTIVE ALR
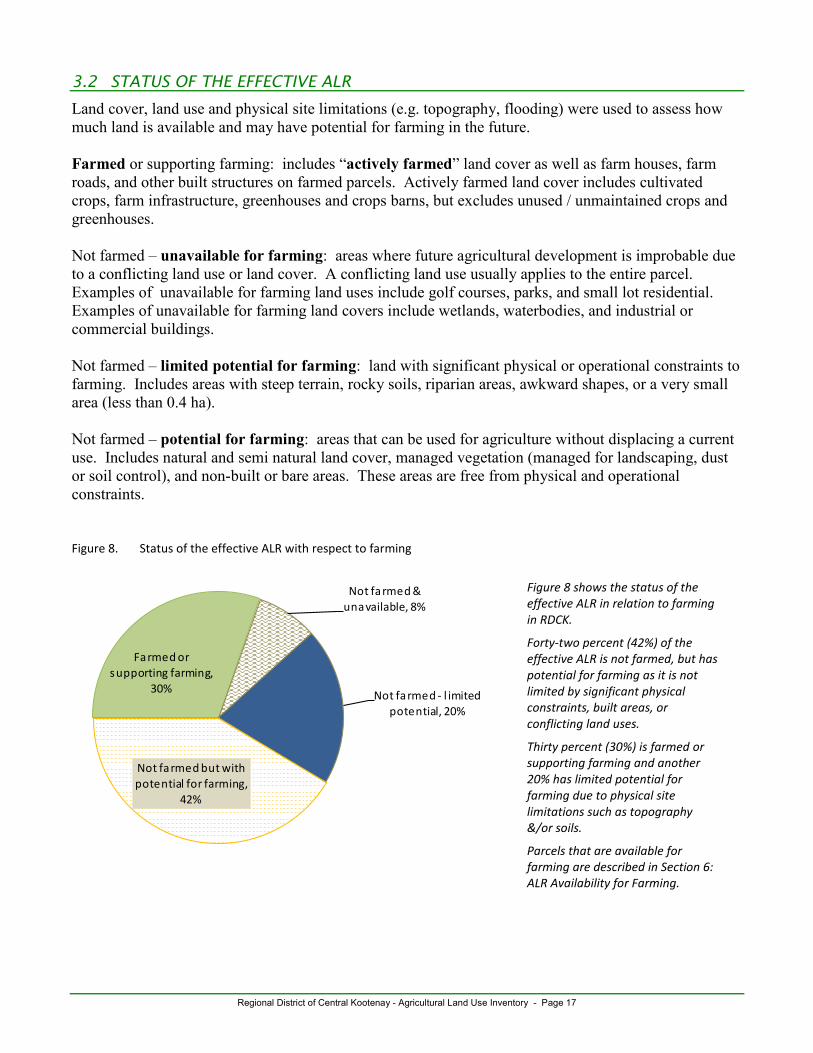
Land cover, land use and physical site limitations (e.g. topography, flooding) were used to assess how much land is available and may have potential for farming in the future. Farmed or supporting farming: includes “actively farmed” land cover as well as farm houses, farm roads, and other built structures on farmed parcels. Actively farmed land cover includes cultivated crops, farm infrastructure, greenhouses and crops barns, but excludes unused / unmaintained crops and greenhouses. Not farmed – unavailable for farming: areas where future agricultural development is improbable due to a conflicting land use or land cover. A conflicting land use usually applies to the entire parcel. Examples of unavailable for farming land uses include golf courses, parks, and small lot residential. Examples of unavailable for farming land covers include wetlands, waterbodies, and industrial or commercial buildings. Not farmed – limited potential for farming: land with significant physical or operational constraints to farming. Includes areas with steep terrain, rocky soils, riparian areas, awkward shapes, or a very small area (less than 0.4 ha). Not farmed – potential for farming: areas that can be used for agriculture without displacing a current use. Includes natural and semi natural land cover, managed vegetation (managed for landscaping, dust or soil control), and non-built or bare areas. These areas are free from physical and operational constraints. Figure 8. Status of the effective ALR with respect to farming
Farmed or supporting farming,
30%
Not farmed & unavailable, 8%
Not farmed - l imited potential, 20%
Not farmed but with potential for farming,
42%
Figure 8 shows the status of the effective ALR in relation to farming in RDCK.
Forty-two percent (42%) of the effective ALR is not farmed, but has potential for farming as it is not limited by significant physical constraints, built areas, or conflicting land uses.
Thirty percent (30%) is farmed or supporting farming and another 20% has limited potential for farming due to physical site limitations such as topography &/or soils.
Parcels that are available for farming are described in Section 6: ALR Availability for Farming.
Regional District of Central Kootenay - Agricultural Land Use Inventory - Page 18
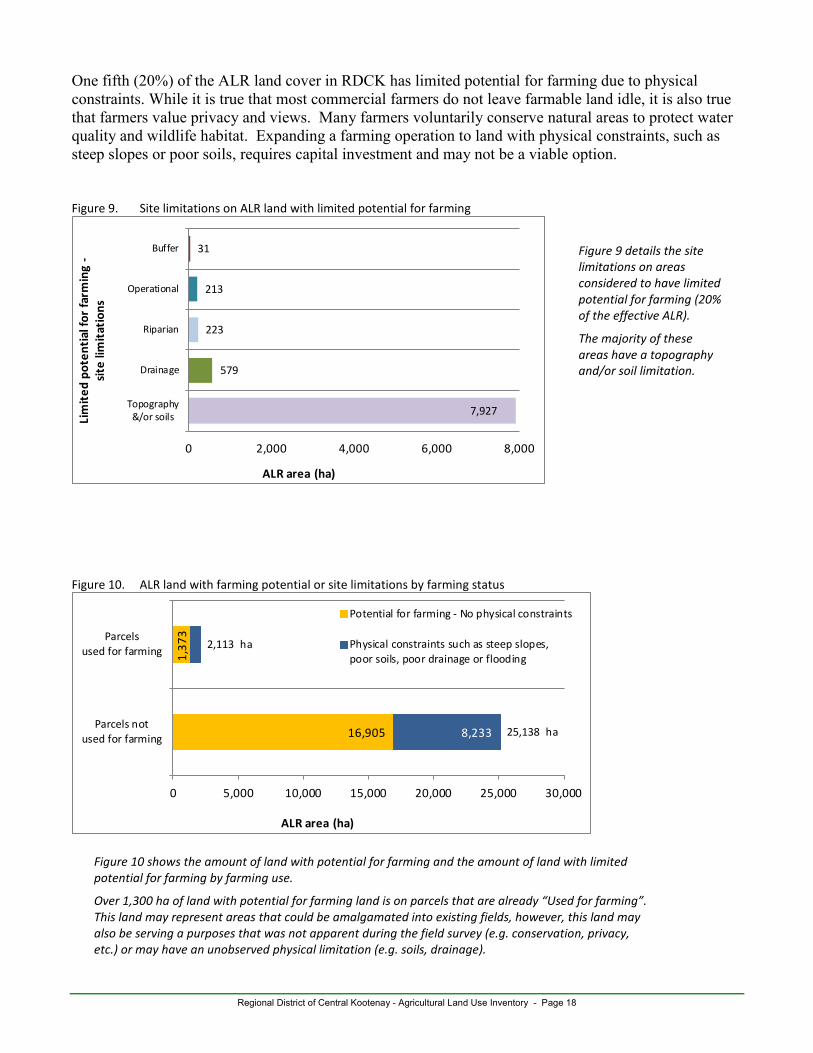
One fifth (20%) of the ALR land cover in RDCK has limited potential for farming due to physical constraints. While it is true that most commercial farmers do not leave farmable land idle, it is also true that farmers value privacy and views. Many farmers voluntarily conserve natural areas to protect water quality and wildlife habitat. Expanding a farming operation to land with physical constraints, such as steep slopes or poor soils, requires capital investment and may not be a viable option. Figure 9. Site limitations on ALR land with limited potential for farming
7,927
579
223
213
31
0 2,000 4,000 6,000 8,000
Topography&/or soils
Drainage
Riparian
Operational
Buffer
ALR area (ha)
Lim
ited
pot
enti
al fo
r fa
rmin
g -
site
lim
itat
ions
Figure 10. ALR land with farming potential or site limitations by farming status
16,905
1,37
3
8,233 25,138 ha
2,113 ha
0 5,000 10,000 15,000 20,000 25,000 30,000
Parcels notused for farming
Parcelsused for farming
ALR area (ha)
Potential for farming - No physical constraints
Physical constraints such as steep slopes,poor soils, poor drainage or flooding
Figure 9 details the site limitations on areas considered to have limited potential for farming (20% of the effective ALR).
The majority of these areas have a topography and/or soil limitation.
Figure 10 shows the amount of land with potential for farming and the amount of land with limited potential for farming by farming use.
Over 1,300 ha of land with potential for farming land is on parcels that are already “Used for farming”. This land may represent areas that could be amalgamated into existing fields, however, this land may also be serving a purposes that was not apparent during the field survey (e.g. conservation, privacy, etc.) or may have an unobserved physical limitation (e.g. soils, drainage).
Regional District of Central Kootenay - Agricultural Land Use Inventory - Page 19
44.. FFaarrmmiinngg AAccttiivviittiieess 4.1 CULTIVATED FIELD CROPS
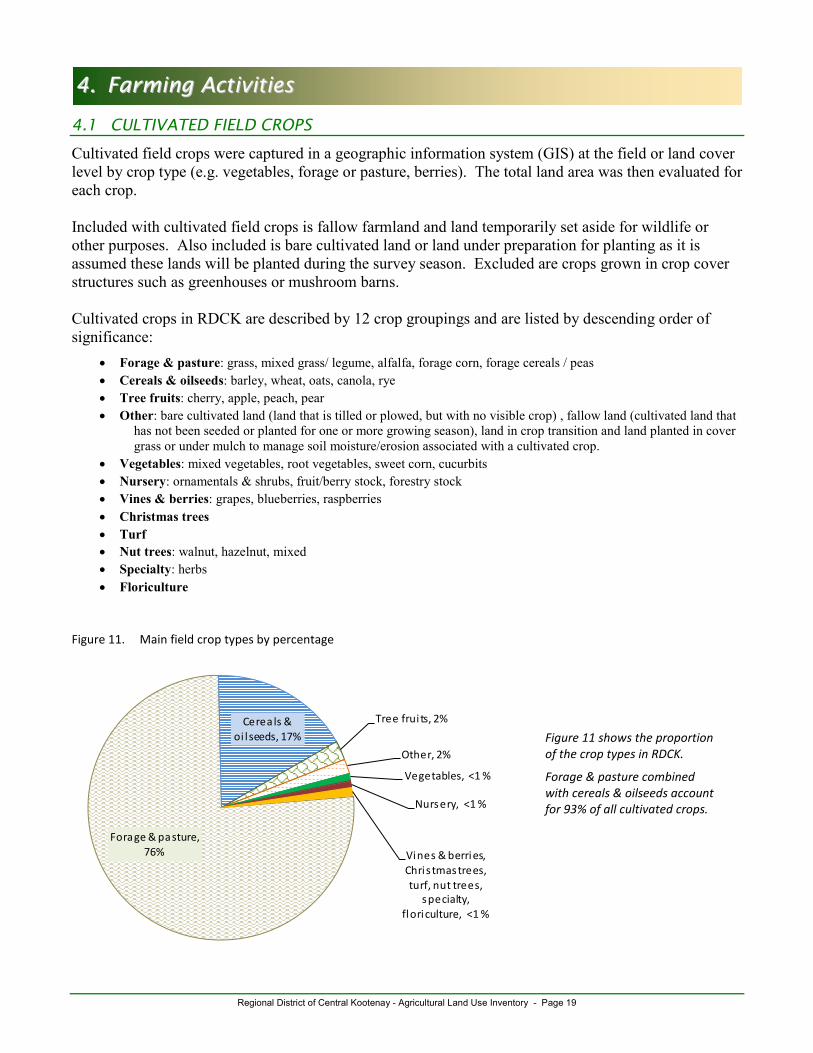
Cultivated field crops were captured in a geographic information system (GIS) at the field or land cover level by crop type (e.g. vegetables, forage or pasture, berries). The total land area was then evaluated for each crop. Included with cultivated field crops is fallow farmland and land temporarily set aside for wildlife or other purposes. Also included is bare cultivated land or land under preparation for planting as it is assumed these lands will be planted during the survey season. Excluded are crops grown in crop cover structures such as greenhouses or mushroom barns. Cultivated crops in RDCK are described by 12 crop groupings and are listed by descending order of significance:
• Forage & pasture: grass, mixed grass/ legume, alfalfa, forage corn, forage cereals / peas • Cereals & oilseeds: barley, wheat, oats, canola, rye • Tree fruits: cherry, apple, peach, pear • Other: bare cultivated land (land that is tilled or plowed, but with no visible crop) , fallow land (cultivated land that
has not been seeded or planted for one or more growing season), land in crop transition and land planted in cover grass or under mulch to manage soil moisture/erosion associated with a cultivated crop.
• Vegetables: mixed vegetables, root vegetables, sweet corn, cucurbits • Nursery: ornamentals & shrubs, fruit/berry stock, forestry stock • Vines & berries: grapes, blueberries, raspberries • Christmas trees • Turf • Nut trees: walnut, hazelnut, mixed • Specialty: herbs • Floriculture
Figure 11. Main field crop types by percentage
Forage & pasture, 76%
Cereals & oi l seeds, 17%
Tree frui ts, 2%
Other, 2%
Vegetables, <1 %
Nursery, <1 %
Vines & berries, Chris tmas trees, turf, nut trees,
specialty, floriculture, <1 %
Figure 11 shows the proportion of the crop types in RDCK.
Forage & pasture combined with cereals & oilseeds account for 93% of all cultivated crops.
Regional District of Central Kootenay - Agricultural Land Use Inventory - Page 20
Table 4. Cultivated crop area by jurisdiction
In ALR (ha)
Outside ALR (ha)
Total area (ha)
Area C 7,015 80 7,095 51 %Area B 3,076 346 3,423 24 %Area K 1,334 116 1,449 10 %Area H 397 175 572 4 %Area D 389 22 410 3 %Area G 316 71 387 3 %Area E 187 11 198 1 %Area I 150 39 190 1 %Area A 27 65 92 < 1%Area J 28 35 63 < 1%Nakusp 53 1 54 < 1%Creston 9 25 34 < 1%Area F - 22 22 < 1%
TOTAL 12,982 1,006 13,988 100 %
Jurisdiction
Cultivated crops (ha) % of cultivated
land in RDCK
Table 5. All crop types by jurisdiction
Fora
ge &
pa
stur
e
Cere
als
&
oils
eeds
Tree
frui
ts
Oth
er*
Veg
etab
les
Nur
sery
Vin
es &
be
rrie
s
Chri
stm
as
tree
s
Turf
Nut
tre
es
Spec
ialt
y
Flor
icul
ture
Area C 4,763 1,937 59 114 49 107 9 32 24 < 1 - - 7,095Area B 2,621 389 225 110 36 2 26 13 - < 1 - < 1 3,423Area K 1,413 4 7 8 6 - 2 < 1 - 7 2 - 1,449Area H 539 - 3 8 17 - 2 < 1 - - 2 < 1 572Area D 381 14 6 2 7 - < 1 - - - - - 410Area G 361 19 < 1 < 1 4 - 1 - - - - - 387Area E 179 - 7 < 1 4 6 1 < 1 - - - < 1 198Area I 177 - 3 3 6 - 1 - - - - - 190Area A 67 - 17 < 1 1 - 6 < 1 - - - < 1 92Area J 55 - 3 - < 1 - < 1 2 - 1 - - 63Nakusp 54 - < 1 < 1 < 1 - - - - - - - 54Creston 20 7 6 - < 1 - < 1 - - - - - 34Area F 19 - < 1 < 1 1 - < 1 - - - - - 22
TOTAL 10,649 2,370 338 246 132 115 50 50 24 10 4 1 13,988
Jurisdiction
Cultivated crops (ha)
Total Area (ha)
* Other. Includes bare cultivated land, fallow land (cultivated land that has not been seeded or planted for one or more growing season), land in crop transition, land planted in cover grass or under mulch to manage soil moisture/erosion associated with a cultivated crop.
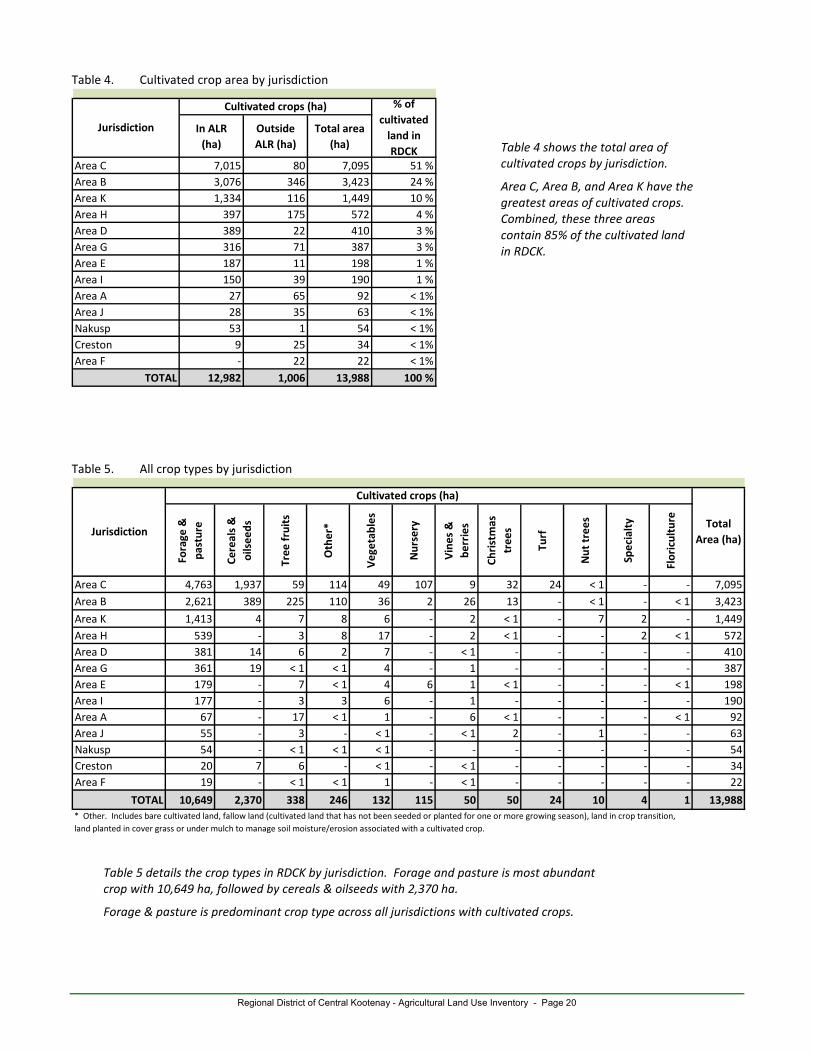
Table 4 shows the total area of cultivated crops by jurisdiction.
Area C, Area B, and Area K have the greatest areas of cultivated crops. Combined, these three areas contain 85% of the cultivated land in RDCK.
Table 5 details the crop types in RDCK by jurisdiction. Forage and pasture is most abundant crop with 10,649 ha, followed by cereals & oilseeds with 2,370 ha.
Forage & pasture is predominant crop type across all jurisdictions with cultivated crops.
Regional District of Central Kootenay - Agricultural Land Use Inventory - Page 21
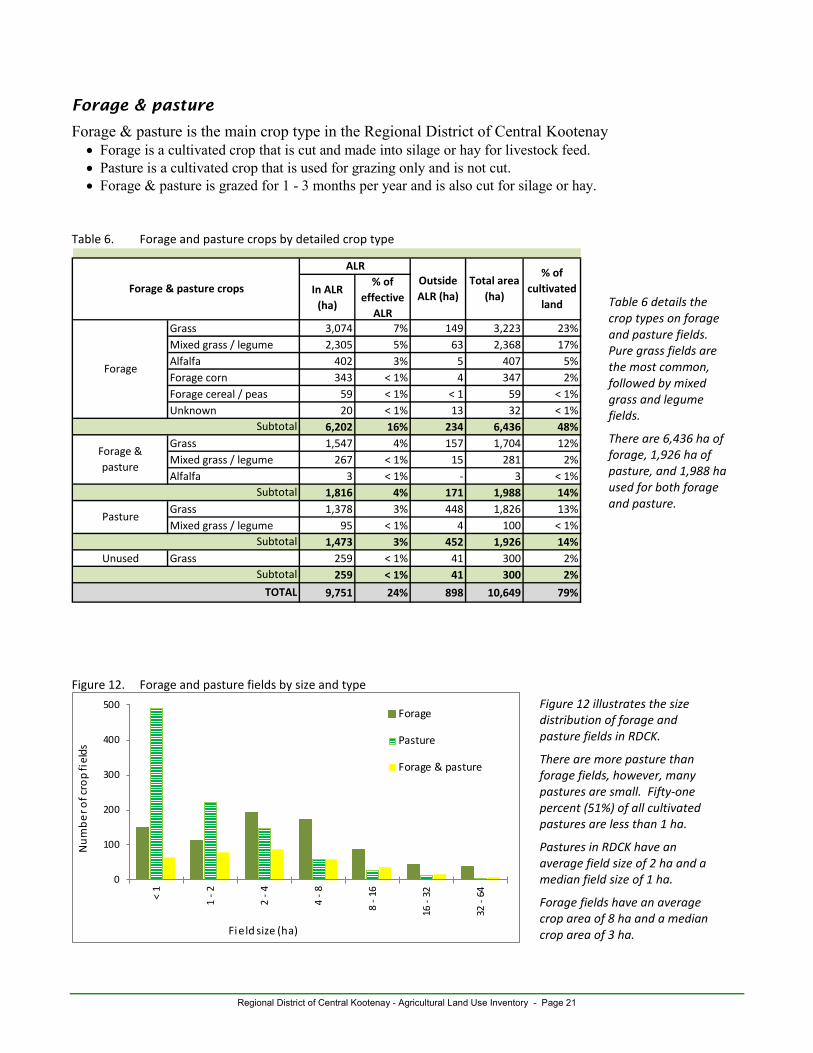
Forage & pasture
Forage & pasture is the main crop type in the Regional District of Central Kootenay • Forage is a cultivated crop that is cut and made into silage or hay for livestock feed. • Pasture is a cultivated crop that is used for grazing only and is not cut. • Forage & pasture is grazed for 1 - 3 months per year and is also cut for silage or hay.
Table 6. Forage and pasture crops by detailed crop type
In ALR (ha)
% of effective
ALRGrass 3,074 7% 149 3,223 23%Mixed grass / legume 2,305 5% 63 2,368 17%Alfalfa 402 3% 5 407 5%Forage corn 343 < 1% 4 347 2%Forage cereal / peas 59 < 1% < 1 59 < 1%Unknown 20 < 1% 13 32 < 1%
6,202 16% 234 6,436 48%Grass 1,547 4% 157 1,704 12%Mixed grass / legume 267 < 1% 15 281 2%Alfalfa 3 < 1% - 3 < 1%
1,816 4% 171 1,988 14%Grass 1,378 3% 448 1,826 13%Mixed grass / legume 95 < 1% 4 100 < 1%
1,473 3% 452 1,926 14%Unused Grass 259 < 1% 41 300 2%
259 < 1% 41 300 2%
9,751 24% 898 10,649 79%
Subtotal
Forage
Pasture
Subtotal
Forage & pasture
Forage & pasture crops
ALROutside ALR (ha)
Total area (ha)
% of cultivated
land
SubtotalTOTAL
Subtotal
Figure 12. Forage and pasture fields by size and type
0
100
200
300
400
500
< 1
1 - 2
2 - 4
4 - 8
8 - 1
6
16 -
32
32 -
64
Num
ber o
f cro
p fi
elds
Field size (ha)
Forage
Pasture
Forage & pasture
Table 6 details the crop types on forage and pasture fields. Pure grass fields are the most common, followed by mixed grass and legume fields.
There are 6,436 ha of forage, 1,926 ha of pasture, and 1,988 ha used for both forage and pasture.
Figure 12 illustrates the size distribution of forage and pasture fields in RDCK.
There are more pasture than forage fields, however, many pastures are small. Fifty-one percent (51%) of all cultivated pastures are less than 1 ha.
Pastures in RDCK have an average field size of 2 ha and a median field size of 1 ha.
Forage fields have an average crop area of 8 ha and a median crop area of 3 ha.
Regional District of Central Kootenay - Agricultural Land Use Inventory - Page 22
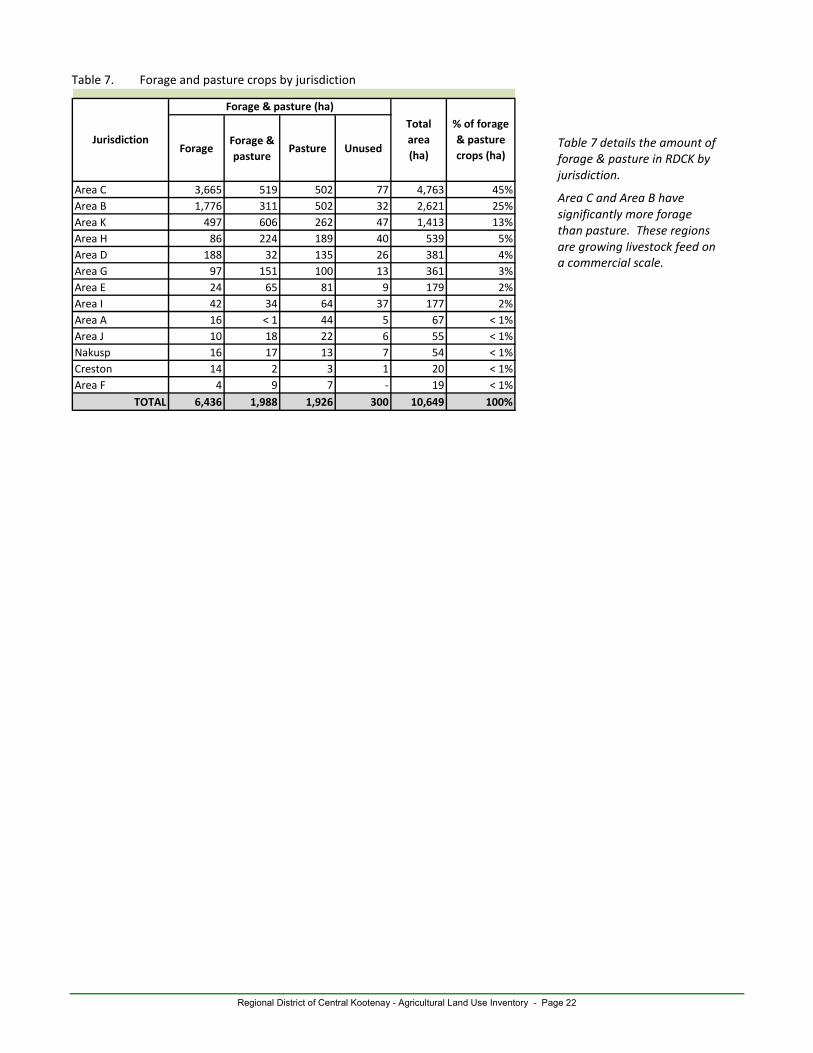
Table 7. Forage and pasture crops by jurisdiction
ForageForage & pasture
Pasture Unused
Area C 3,665 519 502 77 4,763 45%Area B 1,776 311 502 32 2,621 25%Area K 497 606 262 47 1,413 13%Area H 86 224 189 40 539 5%Area D 188 32 135 26 381 4%Area G 97 151 100 13 361 3%Area E 24 65 81 9 179 2%Area I 42 34 64 37 177 2%Area A 16 < 1 44 5 67 < 1%Area J 10 18 22 6 55 < 1%Nakusp 16 17 13 7 54 < 1%Creston 14 2 3 1 20 < 1%Area F 4 9 7 - 19 < 1%
TOTAL 6,436 1,988 1,926 300 10,649 100%
JurisdictionTotal area (ha)
% of forage & pasture crops (ha)
Forage & pasture (ha)
Table 7 details the amount of forage & pasture in RDCK by jurisdiction.
Area C and Area B have significantly more forage than pasture. These regions are growing livestock feed on a commercial scale.
Regional District of Central Kootenay - Agricultural Land Use Inventory - Page 23
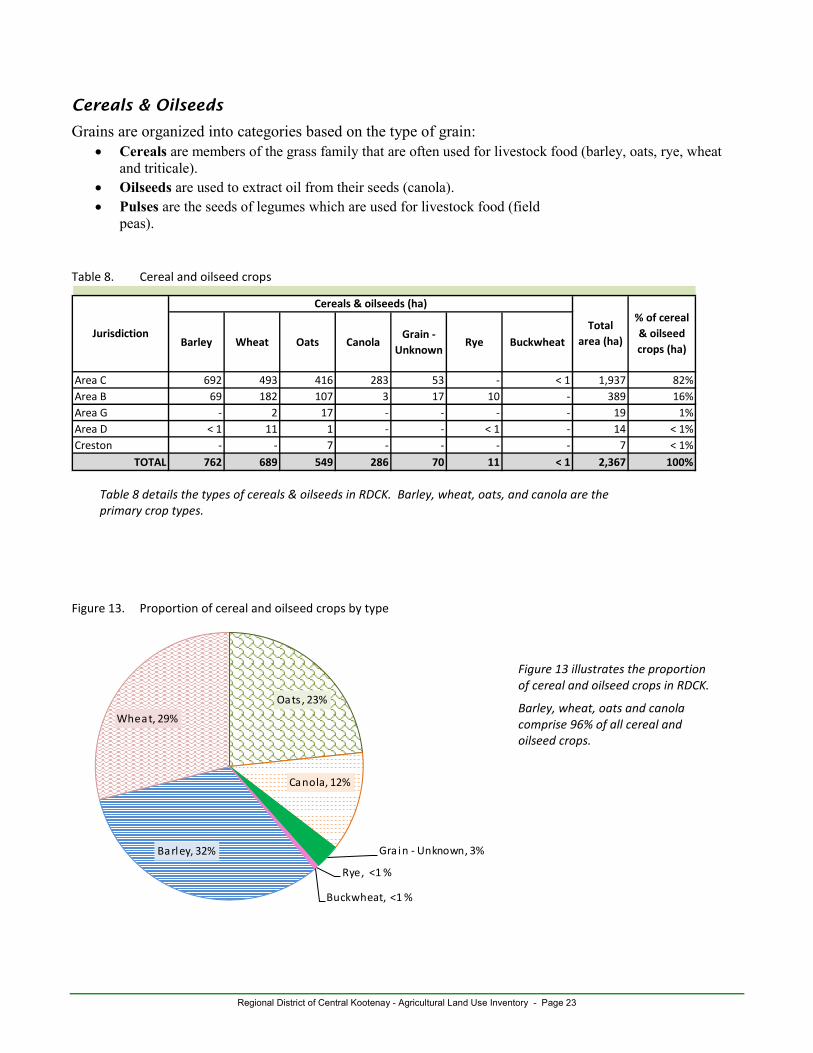
Cereals & Oilseeds
Grains are organized into categories based on the type of grain: • Cereals are members of the grass family that are often used for livestock food (barley, oats, rye, wheat
and triticale). • Oilseeds are used to extract oil from their seeds (canola). • Pulses are the seeds of legumes which are used for livestock food (field
peas). Table 8. Cereal and oilseed crops
Barley Wheat Oats CanolaGrain -
UnknownRye Buckwheat
Area C 692 493 416 283 53 - < 1 1,937 82%Area B 69 182 107 3 17 10 - 389 16%Area G - 2 17 - - - - 19 1%Area D < 1 11 1 - - < 1 - 14 < 1%Creston - - 7 - - - - 7 < 1%
TOTAL 762 689 549 286 70 11 < 1 2,367 100%
JurisdictionTotal
area (ha)
% of cereal & oilseed crops (ha)
Cereals & oilseeds (ha)
Figure 13. Proportion of cereal and oilseed crops by type
Barley, 32%
Wheat, 29%Oats , 23%
Canola, 12%
Grain - Unknown, 3%
Rye, <1 %
Buckwheat, <1 %
Table 8 details the types of cereals & oilseeds in RDCK. Barley, wheat, oats, and canola are the primary crop types.
Figure 13 illustrates the proportion of cereal and oilseed crops in RDCK.
Barley, wheat, oats and canola comprise 96% of all cereal and oilseed crops.

Regional District of Central Kootenay - Agricultural Land Use Inventory - Page 24
Top 20 Crops
Table 9. Top 20 crops by area
Forage 6,202 14% 234 6,436 46%Forage & pasture 1,816 4% 171 1,988 14%Pasture 1,473 3% 452 1,926 14%Barley 723 2% 39 762 5%Wheat 688 2% 1 689 5%Oats 552 1% < 1 552 4%Unused forage/pasture 259 < 1% 41 300 2%Canola 283 < 1% 3 286 2%Cherries 231 < 1% 7 238 2%Bare cultivated land 145 < 1% 1 146 1%Ornamentals and shrubs 102 < 1% < 1 103 1%Fallow land 74 < 1% 8 82 < 1%Cereals & oilseeds 68 < 1% 2 70 < 1%Mixed vegetables 55 < 1% 10 65 < 1%Apples 37 < 1% 8 45 < 1%Christmas trees 42 < 1% 3 45 < 1%Misc. vegetables 43 < 1% < 1 43 < 1%Grapes 22 < 1% 7 29 < 1%Turf 24 < 1% < 1 24 < 1%Crop transition 15 < 1% 1 16 < 1%
TOTAL 12,855 29% 990 13,845 99%
% of cultivated
landCultivated field crop
Total area (ha)
Outside ALR (ha)
In ALR (ha)
% of effective
ALR
Table 9 details the top 20 crops that account for 99% of the cultivated land in RDCK.
Regional District of Central Kootenay - Agricultural Land Use Inventory - Page 25
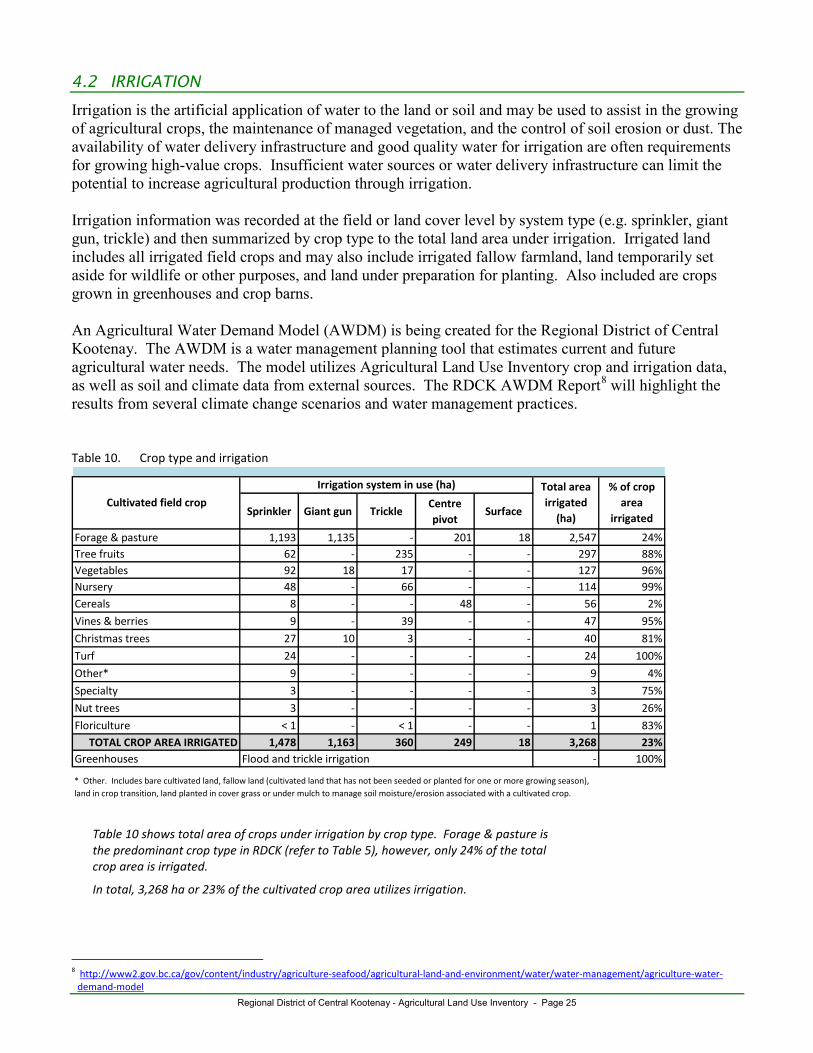
4.2 IRRIGATION
Irrigation is the artificial application of water to the land or soil and may be used to assist in the growing of agricultural crops, the maintenance of managed vegetation, and the control of soil erosion or dust. The availability of water delivery infrastructure and good quality water for irrigation are often requirements for growing high-value crops. Insufficient water sources or water delivery infrastructure can limit the potential to increase agricultural production through irrigation. Irrigation information was recorded at the field or land cover level by system type (e.g. sprinkler, giant gun, trickle) and then summarized by crop type to the total land area under irrigation. Irrigated land includes all irrigated field crops and may also include irrigated fallow farmland, land temporarily set aside for wildlife or other purposes, and land under preparation for planting. Also included are crops grown in greenhouses and crop barns. An Agricultural Water Demand Model (AWDM) is being created for the Regional District of Central Kootenay. The AWDM is a water management planning tool that estimates current and future agricultural water needs. The model utilizes Agricultural Land Use Inventory crop and irrigation data, as well as soil and climate data from external sources. The RDCK AWDM Report8 will highlight the results from several climate change scenarios and water management practices. Table 10. Crop type and irrigation
Sprinkler Giant gun TrickleCentre pivot
Surface
Forage & pasture 1,193 1,135 - 201 18 2,547 24%Tree fruits 62 - 235 - - 297 88%Vegetables 92 18 17 - - 127 96%Nursery 48 - 66 - - 114 99%Cereals 8 - - 48 - 56 2%Vines & berries 9 - 39 - - 47 95%Christmas trees 27 10 3 - - 40 81%Turf 24 - - - - 24 100%Other* 9 - - - - 9 4%Specialty 3 - - - - 3 75%Nut trees 3 - - - - 3 26%Floriculture < 1 - < 1 - - 1 83%
TOTAL CROP AREA IRRIGATED 1,478 1,163 360 249 18 3,268 23%Greenhouses Flood and trickle irrigation - 100%
Cultivated field cropTotal area irrigated
(ha)
% of crop area
irrigated
* Other. Includes bare cultivated land, fallow land (cultivated land that has not been seeded or planted for one or more growing season), land in crop transition, land planted in cover grass or under mulch to manage soil moisture/erosion associated with a cultivated crop.
Irrigation system in use (ha)
8 http://www2.gov.bc.ca/gov/content/industry/agriculture-seafood/agricultural-land-and-environment/water/water-management/agriculture-water-
demand-model
Table 10 shows total area of crops under irrigation by crop type. Forage & pasture is the predominant crop type in RDCK (refer to Table 5), however, only 24% of the total crop area is irrigated.
In total, 3,268 ha or 23% of the cultivated crop area utilizes irrigation.
Regional District of Central Kootenay - Agricultural Land Use Inventory - Page 26
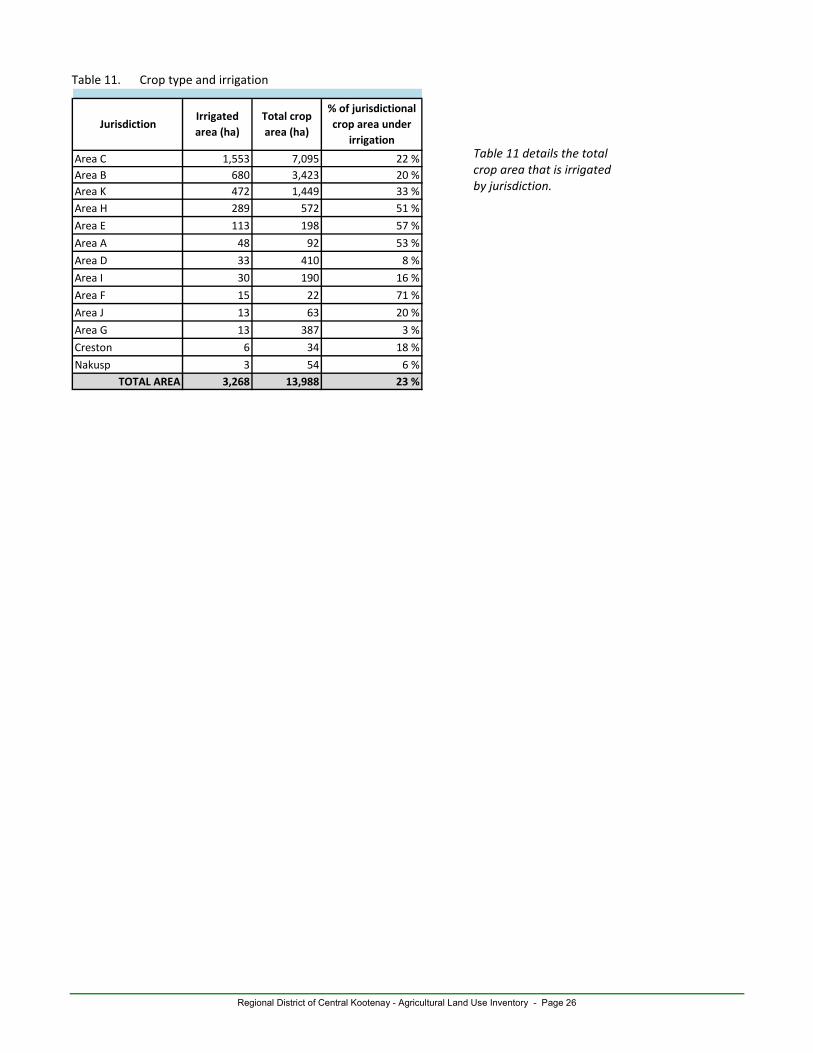
Table 11. Crop type and irrigation
Area C 1,553 7,095 22 %Area B 680 3,423 20 %Area K 472 1,449 33 %Area H 289 572 51 %Area E 113 198 57 %Area A 48 92 53 %Area D 33 410 8 %Area I 30 190 16 %Area F 15 22 71 %Area J 13 63 20 %Area G 13 387 3 %Creston 6 34 18 %Nakusp 3 54 6 %
TOTAL AREA 3,268 13,988 23 %
JurisdictionIrrigated area (ha)
Total crop area (ha)
% of jurisdictional crop area under
irrigation
Table 11 details the total crop area that is irrigated by jurisdiction.
Regional District of Central Kootenay - Agricultural Land Use Inventory - Page 27
4.3 LIVESTOCK
Livestock activities are challenging to measure using a windshield survey. Livestock are often confined to structures making it difficult to see the animals. Local knowledge and other indicators such as animal confinement type (barn type), feeder system type, manure handling system type, and other visible elements may be used to infer the type of livestock and scale of activity that exist on a parcel. In addition, livestock are mobile and may utilize more than one land parcel. This inventory reports on livestock homesites where the animals or related structures were observed.
Intensity "Intensive" livestock activities utilize specialized structures such as barns, feedlots and stockyards designed for confined feeding at higher stocking densities.
"Non-intensive" livestock activities allow animals to graze on a pasture and often utilize non-intensive barns and corrals/paddocks.
“Unknown livestock” refers to activities where non-specialized livestock related structures were present, the livestock were not visible, and the specific type of livestock could not be determined.
Homesite Homesite refers to the location of the main ranch or main barn of a livestock operation or farm unit9. Other types of farm infrastructure, such as corrals, paddocks, barns, and feeding/watering facilities, as well as the farm residence, are also often at this location. This is the primary location of the farm unit where most livestock management occurs.
Non Homesite refers to a location where livestock were observed, but the livestock do not permanently reside at the location. Non-homesites are often used only for pasturing and are secondary to an operation’s primary (or homesite) location.
Scale An animal unit equivalent (AUE) scale system is used to describe livestock operations. AUEs are a standard measure used to compare different livestock types. One animal unit equivalent is equal to approximately one adult cow or horse. The scale system includes 4 levels:
• “Very Small” Approximately 1 cow or horse or bison, 3 hogs, 5 goats, sheep or deer, 50 turkeys, 100 chickens (1 animal unit equivalent). Estimated AUE: 1
• “Small” LESS THAN 25 cows or horses or bison, 75 hogs, 125 goats, sheep or deer, 1250 turkeys, 2500 chickens (2 - 25 animal unit equivalents). Estimated AUE: 13
• “Medium” LESS THAN 100 cows or horses or bison, 300 hogs, 500 goats, sheep or deer, 5000 turkeys, 10,000 chickens (25 - 100 animal unit equivalents). Estimated AUE: 63
• “Large” MORE THAN 100 cows or horses or bison, 300 hogs, 500 goats, sheep or deer, 5000 turkeys, 10,000 chickens (over 100 animal unit equivalents). Estimated AUE: 150
Estimated animal unit equivalents are calculated using the midpoint of each scale range described above. This number enables the relative importance of each livestock type to be compared. The actual number of animals may be under estimated, especially for large operations.
Number of activities. Each occurrence of livestock on a parcel is counted as one activity. A small mixed farm with 1-2 cows and a large commercial milking operations are each counted as one activity. Additionally, if equine and beef are recorded on the same parcel, each is identified as a unique activity.
9 The farm unit includes all the property owned, rented, or leased by a farm and may incorporate more than one parcel.
Regional District of Central Kootenay - Agricultural Land Use Inventory - Page 28
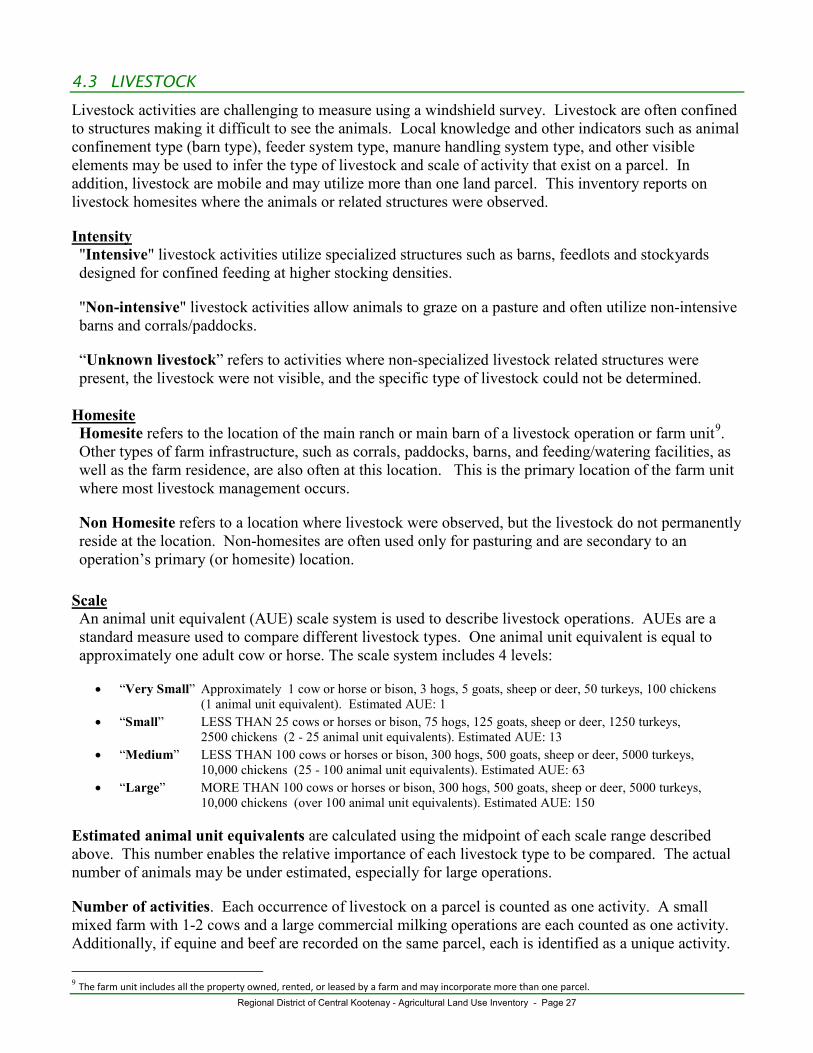
Table 12. Livestock activities
Equine 6,340 601Beef 5,640 207Dairy 2,330 39Unknown livestock 1,340 142Sheep / goat 1,340 135Poultry 510 232Llama / alpaca 260 29Swine 220 31Specialty livestock* 200 11
TOTAL 18,180 1,427
Count of activites
* In RDCK, specialty livestock includes guineafowl, ratites (ostrich & peacock), deer, bison, game birds and rabbits.
Livestock groupEstimated
animal unit equivalents
Estimated Animal Unit Equivalents (AUEs)
Figure 14. Proportion of livestock activities by estimated animal unit equivalents
Equine, 35%
Beef, 31% Dairy, 13%
Unknown l ivestock, 7%
Sheep / goat, 7%
Poultry, 3%
Llama / alpaca, swine, specialty,
4%
Table 12 details the number of estimated animal unit equivalents by livestock type.
Equine and beef activities have the highest estimated animal unit equivalents.
Although equine and beef have similar AUEs, equine activities occur on far more individual parcels.
Figure 14 illustrates the proportion of livestock in RDCK by estimated animal unit equivalents.
Of all estimated AUEs, 35% are equine, 31% are beef, and 13% are dairy.
Regional District of Central Kootenay - Agricultural Land Use Inventory - Page 29
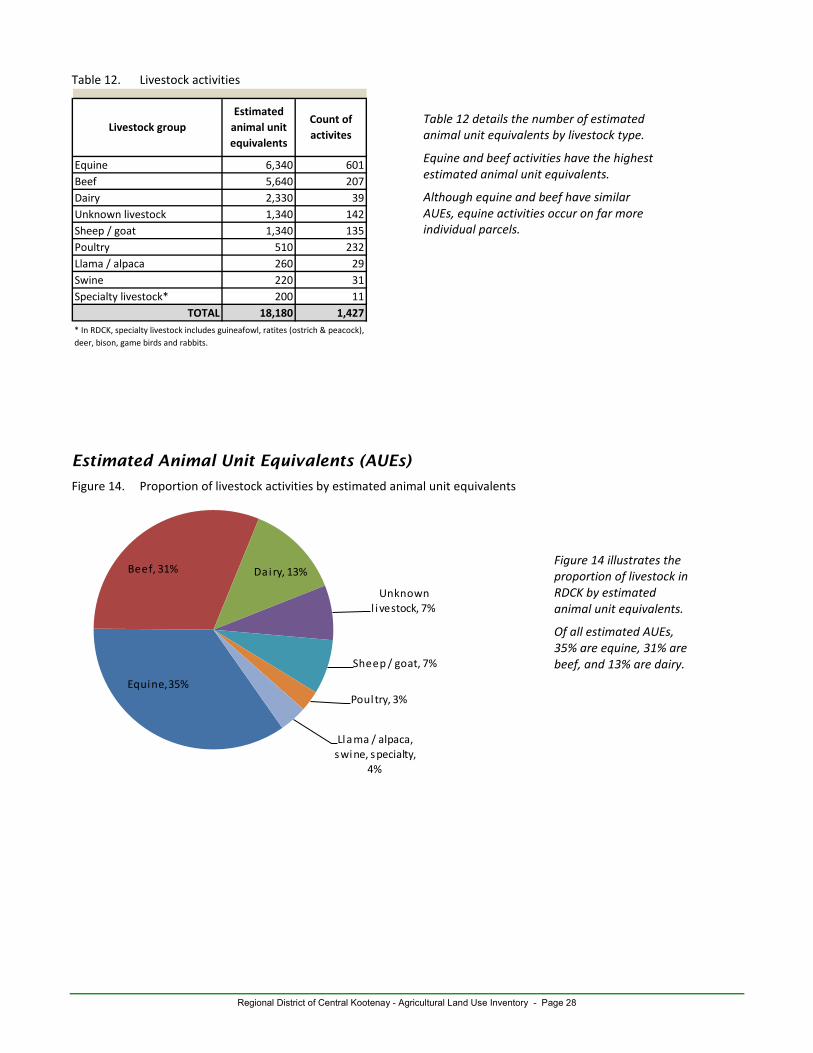
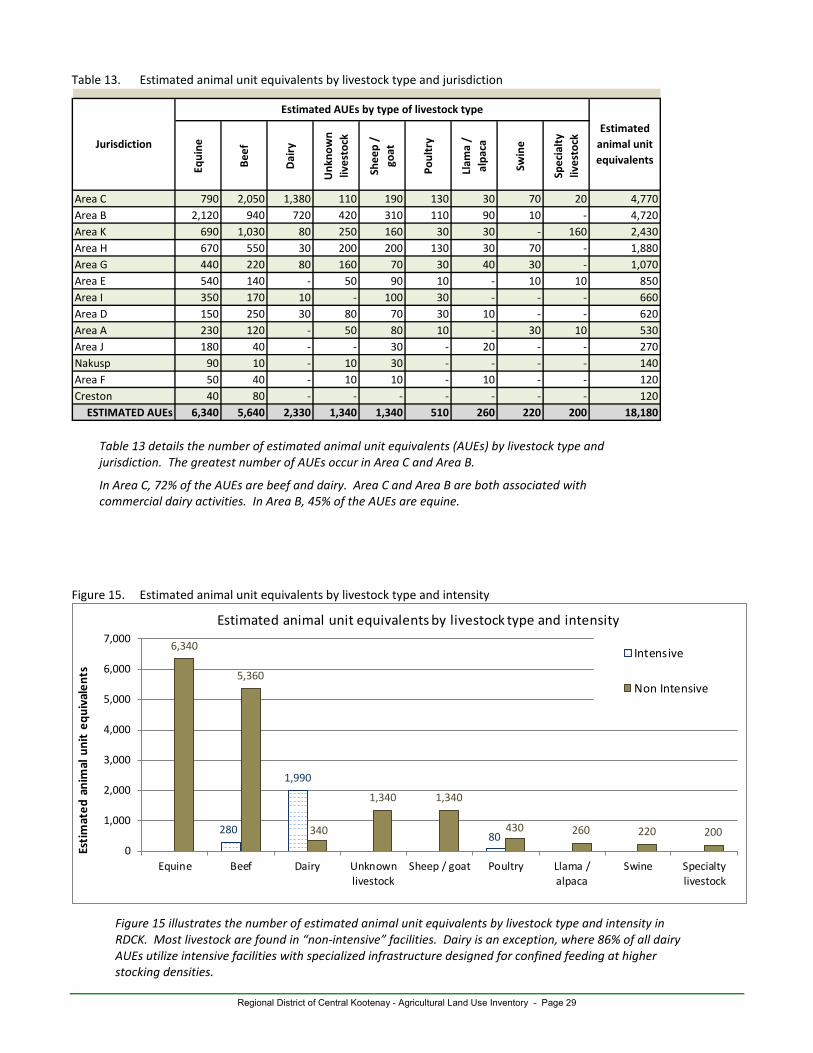
Table 13. Estimated animal unit equivalents by livestock type and jurisdiction
Equi
ne
Beef
Dai
ry
Unk
now
n liv
esto
ck
Shee
p /
go
at
Poul
try
Llam
a /
alpa
ca
Swin
e
Spec
ialt
y liv
esto
ck
Area C 790 2,050 1,380 110 190 130 30 70 20 4,770Area B 2,120 940 720 420 310 110 90 10 - 4,720Area K 690 1,030 80 250 160 30 30 - 160 2,430Area H 670 550 30 200 200 130 30 70 - 1,880Area G 440 220 80 160 70 30 40 30 - 1,070Area E 540 140 - 50 90 10 - 10 10 850Area I 350 170 10 - 100 30 - - - 660Area D 150 250 30 80 70 30 10 - - 620Area A 230 120 - 50 80 10 - 30 10 530Area J 180 40 - - 30 - 20 - - 270Nakusp 90 10 - 10 30 - - - - 140Area F 50 40 - 10 10 - 10 - - 120Creston 40 80 - - - - - - - 120
ESTIMATED AUEs 6,340 5,640 2,330 1,340 1,340 510 260 220 200 18,180
Jurisdiction
Estimated AUEs by type of livestock type
Estimated animal unit equivalents
Figure 15. Estimated animal unit equivalents by livestock type and intensity
280
1,990
80
6,340
5,360
340
1,340 1,340
430 260 220 2000
1,000
2,000
3,000
4,000
5,000
6,000
7,000
Equine Beef Dairy Unknownlivestock
Sheep / goat Poultry Llama /alpaca
Swine Specialtylivestock
Esti
mat
ed a
nim
al u
nit
equi
vale
nts
Estimated animal unit equivalents by livestock type and intensity
Intensive
Non Intensive
Figure 15 illustrates the number of estimated animal unit equivalents by livestock type and intensity in RDCK. Most livestock are found in “non-intensive” facilities. Dairy is an exception, where 86% of all dairy AUEs utilize intensive facilities with specialized infrastructure designed for confined feeding at higher stocking densities.
Table 13 details the number of estimated animal unit equivalents (AUEs) by livestock type and jurisdiction. The greatest number of AUEs occur in Area C and Area B.
In Area C, 72% of the AUEs are beef and dairy. Area C and Area B are both associated with commercial dairy activities. In Area B, 45% of the AUEs are equine.
Regional District of Central Kootenay - Agricultural Land Use Inventory - Page 30
Figure 16. Estimated animal unit equivalents by livestock type and scale
0
1000
2000
3000
4000
5000
6000
Equine Beef Dairy Unknownlivestock
Sheep / goat Poultry Llama /alpaca
Swine Specialtylivestock
Esti
mat
edan
imal
uni
t eq
uiva
lent
s
Type of activity
Estimated animal unit equivalents by livestock type & scale
Large scale
Medium scale
Small scale
Very small scale
Number of livestock activities (occurrences)
Figure 17. Number of livestock activities by livestock type and scale
0
50
100
150
200
250
300
350
400
450
Equine Beef Dairy Unknownlivestock
Sheep / goat Poultry Llama /alpaca
Swine Specialtylivestock
Num
ber
of a
ctiv
itie
s
Type of activity
Number of livestock activities by livestock type & scale
Large scale
Medium scale
Small scale
Very small scale
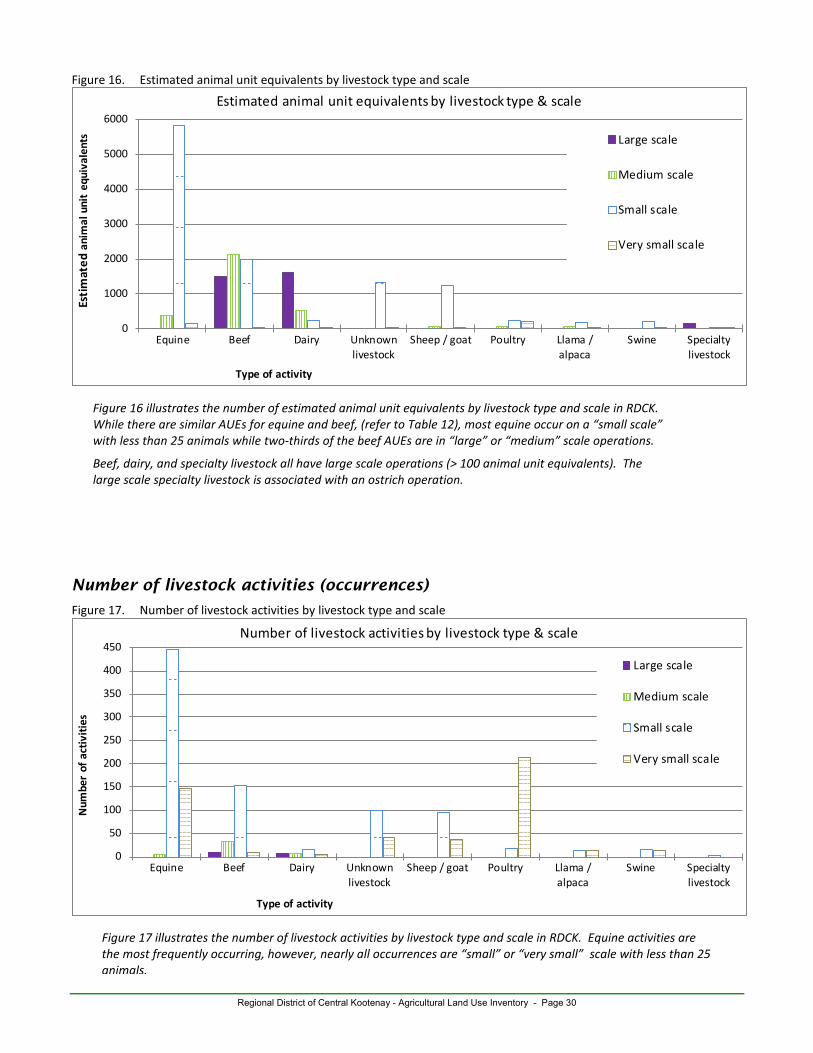
Figure 16 illustrates the number of estimated animal unit equivalents by livestock type and scale in RDCK. While there are similar AUEs for equine and beef, (refer to Table 12), most equine occur on a “small scale” with less than 25 animals while two-thirds of the beef AUEs are in “large” or “medium” scale operations.
Beef, dairy, and specialty livestock all have large scale operations (> 100 animal unit equivalents). The large scale specialty livestock is associated with an ostrich operation.
Figure 17 illustrates the number of livestock activities by livestock type and scale in RDCK. Equine activities are the most frequently occurring, however, nearly all occurrences are “small” or “very small” scale with less than 25 animals.
Regional District of Central Kootenay - Agricultural Land Use Inventory - Page 31
55.. AALLRR UUttiilliizzaattiioonn 5.1 PARCEL INCLUSION IN THE ALR
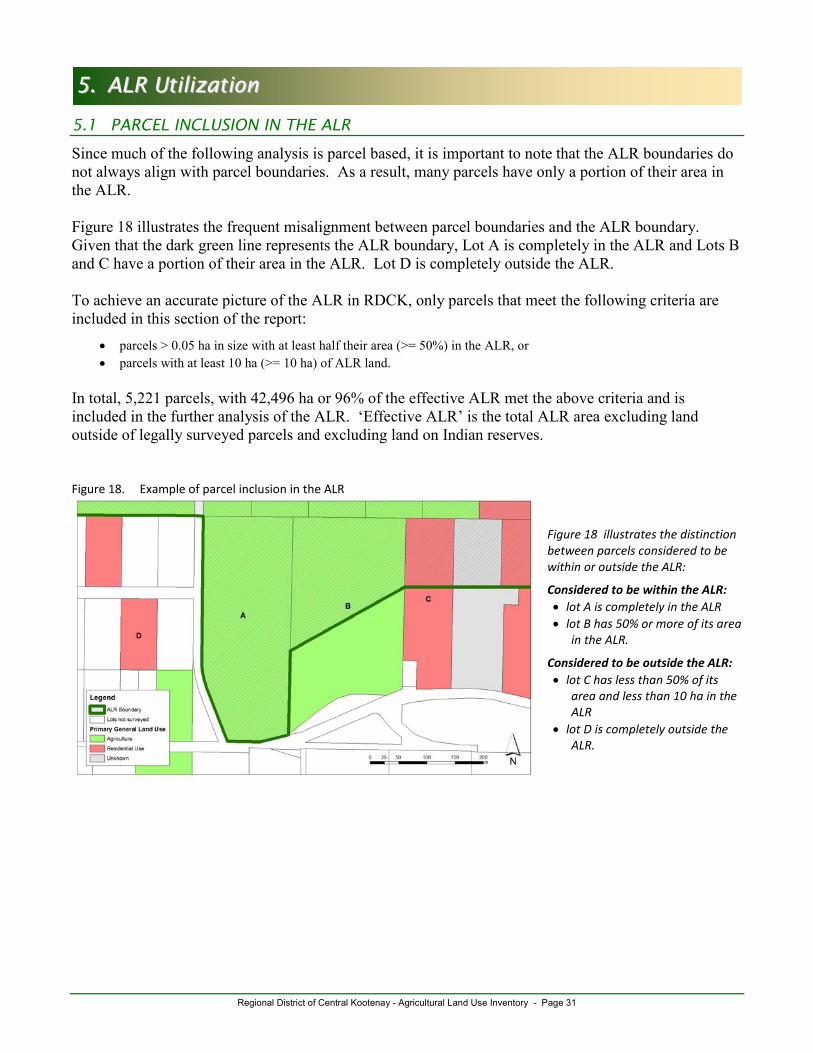
Since much of the following analysis is parcel based, it is important to note that the ALR boundaries do not always align with parcel boundaries. As a result, many parcels have only a portion of their area in the ALR. Figure 18 illustrates the frequent misalignment between parcel boundaries and the ALR boundary. Given that the dark green line represents the ALR boundary, Lot A is completely in the ALR and Lots B and C have a portion of their area in the ALR. Lot D is completely outside the ALR. To achieve an accurate picture of the ALR in RDCK, only parcels that meet the following criteria are included in this section of the report:
• parcels > 0.05 ha in size with at least half their area (>= 50%) in the ALR, or • parcels with at least 10 ha (>= 10 ha) of ALR land.
In total, 5,221 parcels, with 42,496 ha or 96% of the effective ALR met the above criteria and is included in the further analysis of the ALR. ‘Effective ALR’ is the total ALR area excluding land outside of legally surveyed parcels and excluding land on Indian reserves. Figure 18. Example of parcel inclusion in the ALR
Figure 18 illustrates the distinction between parcels considered to be within or outside the ALR:
Considered to be within the ALR: • lot A is completely in the ALR • lot B has 50% or more of its area
in the ALR.
Considered to be outside the ALR: • lot C has less than 50% of its
area and less than 10 ha in the ALR
• lot D is completely outside the ALR.
Regional District of Central Kootenay - Agricultural Land Use Inventory - Page 32
5.2 LAND USE AND FARM USE
Land use focuses solely on human use and describes the economic function or type of establishment using the parcel. A parcel can have a variety of activities on the land, yet serve a single use. For example, two parcels are said to be “Used for farming”, even if one is a dairy farm and the other is in blueberries. Another example is commercial land use; if one parcel is a hotel, another is a retail store, and a third is a gas station, all are considered to have commercial land use.
Up to two general land uses (e.g. residential, commercial, protected area) are recorded for each parcel. Evaluation of land uses are based on the overall economic importance and/or the extent of the land use.
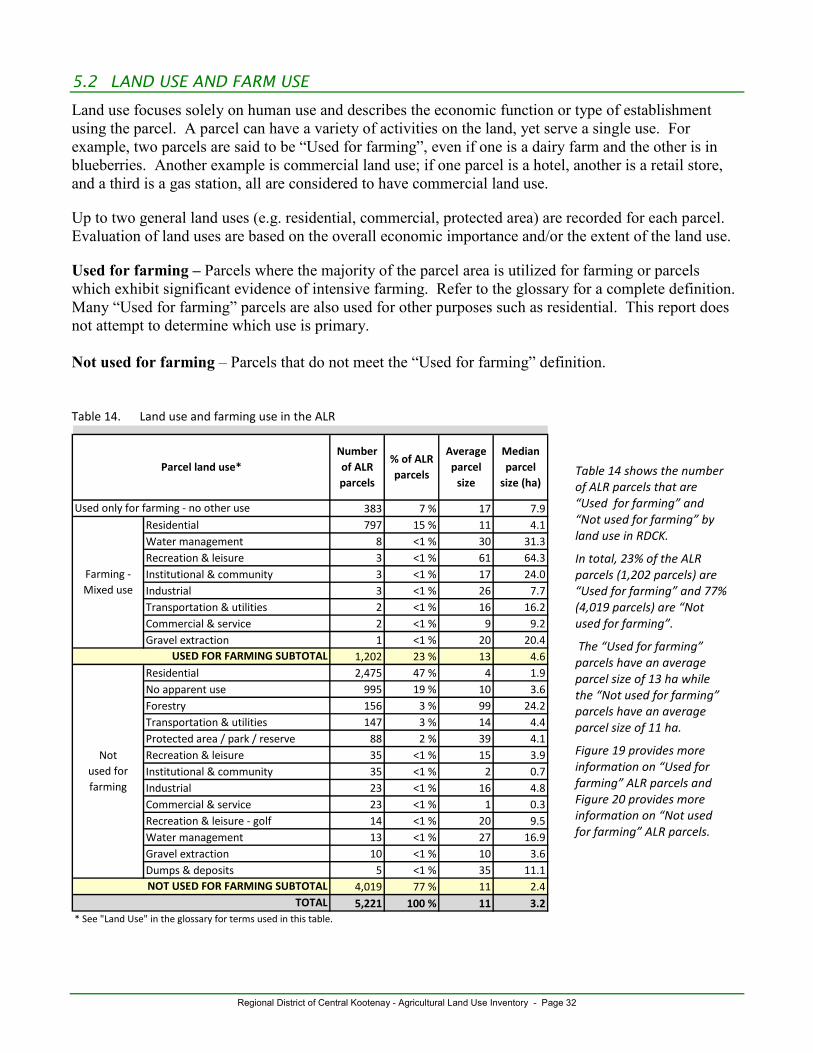
Used for farming – Parcels where the majority of the parcel area is utilized for farming or parcels which exhibit significant evidence of intensive farming. Refer to the glossary for a complete definition. Many “Used for farming” parcels are also used for other purposes such as residential. This report does not attempt to determine which use is primary. Not used for farming – Parcels that do not meet the “Used for farming” definition. Table 14. Land use and farming use in the ALR
383 7 % 17 7.9Residential 797 15 % 11 4.1Water management 8 <1 % 30 31.3Recreation & leisure 3 <1 % 61 64.3Institutional & community 3 <1 % 17 24.0Industrial 3 <1 % 26 7.7Transportation & utilities 2 <1 % 16 16.2Commercial & service 2 <1 % 9 9.2Gravel extraction 1 <1 % 20 20.4
1,202 23 % 13 4.6Residential 2,475 47 % 4 1.9No apparent use 995 19 % 10 3.6Forestry 156 3 % 99 24.2Transportation & utilities 147 3 % 14 4.4Protected area / park / reserve 88 2 % 39 4.1Recreation & leisure 35 <1 % 15 3.9Institutional & community 35 <1 % 2 0.7Industrial 23 <1 % 16 4.8Commercial & service 23 <1 % 1 0.3Recreation & leisure - golf 14 <1 % 20 9.5Water management 13 <1 % 27 16.9Gravel extraction 10 <1 % 10 3.6Dumps & deposits 5 <1 % 35 11.1
4,019 77 % 11 2.45,221 100 % 11 3.2
Median parcel
size (ha)
Used only for farming - no other use
NOT USED FOR FARMING SUBTOTAL
Parcel land use*Number of ALR parcels
% of ALR parcels
Average parcel
size
Farming - Mixed use
USED FOR FARMING SUBTOTAL
Not used for farming
TOTAL* See "Land Use" in the glossary for terms used in this table.
Table 14 shows the number of ALR parcels that are “Used for farming” and “Not used for farming” by land use in RDCK.
In total, 23% of the ALR parcels (1,202 parcels) are “Used for farming” and 77% (4,019 parcels) are “Not used for farming”.
The “Used for farming” parcels have an average parcel size of 13 ha while the “Not used for farming” parcels have an average parcel size of 11 ha.
Figure 19 provides more information on “Used for farming” ALR parcels and Figure 20 provides more information on “Not used for farming” ALR parcels.
Regional District of Central Kootenay - Agricultural Land Use Inventory - Page 33
Figure 19. Land use on “Used for farming” ALR parcels
Used for farming &
residential66%
Used for farming only
32%
Other activities 2%
Used for farming &residential: 797 parcels
Used for farming only:383 parcels
Used for farming &other activities: 22parcels
Total number of used for farming ALR parcels: 1202 parcels
Figure 20. Land use on “Not used for farming” ALR parcels
Residential, 61%
25%
4%
4%
2%
4%
Residential
No apparent use
Forestry
Transportation &utilitiesProtected area / park /reserveOther
Total number of notused for farming ALR parcels: 4019 parcels
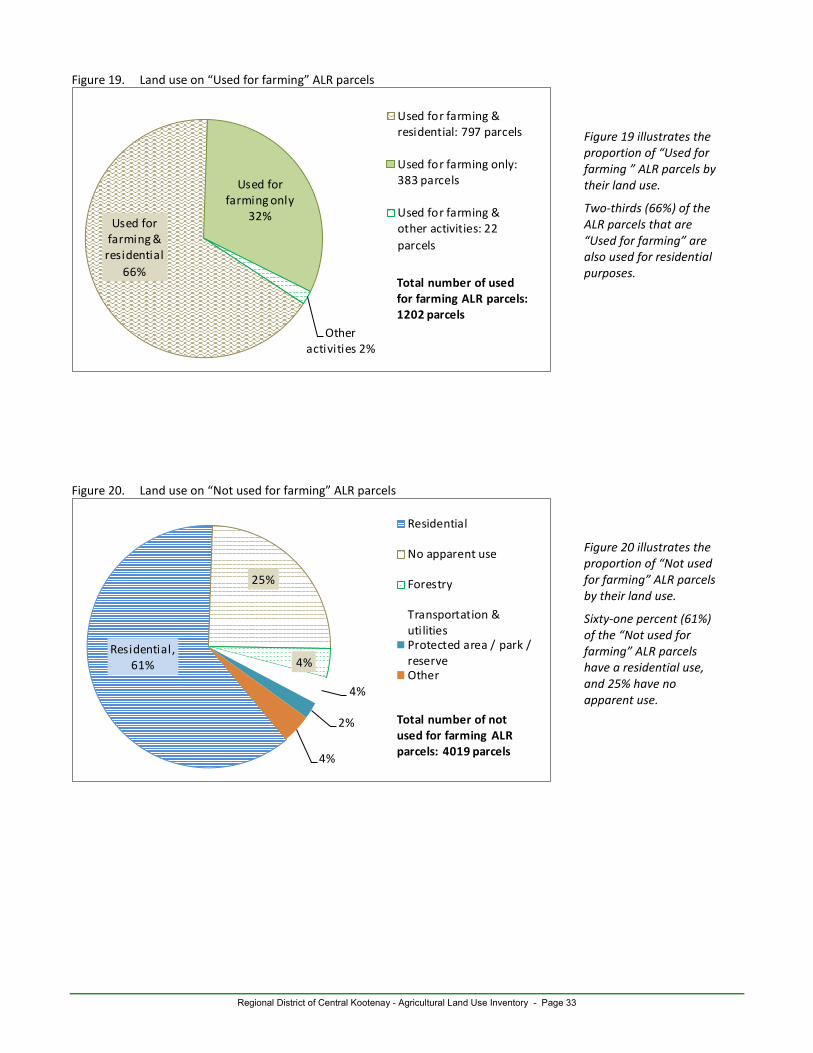
Figure 20 illustrates the proportion of “Not used for farming” ALR parcels by their land use.
Sixty-one percent (61%) of the “Not used for farming” ALR parcels have a residential use, and 25% have no apparent use.
Figure 19 illustrates the proportion of “Used for farming ” ALR parcels by their land use.
Two-thirds (66%) of the ALR parcels that are “Used for farming” are also used for residential purposes.
Regional District of Central Kootenay - Agricultural Land Use Inventory - Page 34
5.3 FARM USE & PARCEL SIZE
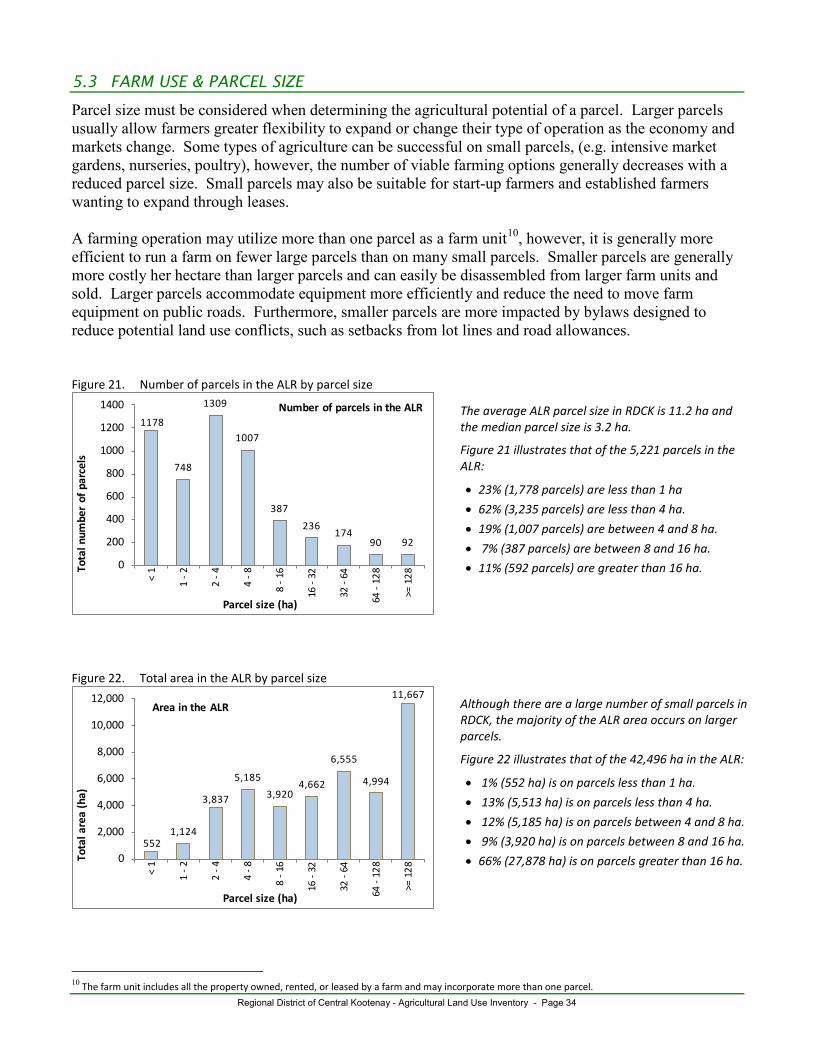
Parcel size must be considered when determining the agricultural potential of a parcel. Larger parcels usually allow farmers greater flexibility to expand or change their type of operation as the economy and markets change. Some types of agriculture can be successful on small parcels, (e.g. intensive market gardens, nurseries, poultry), however, the number of viable farming options generally decreases with a reduced parcel size. Small parcels may also be suitable for start-up farmers and established farmers wanting to expand through leases. A farming operation may utilize more than one parcel as a farm unit10, however, it is generally more efficient to run a farm on fewer large parcels than on many small parcels. Smaller parcels are generally more costly her hectare than larger parcels and can easily be disassembled from larger farm units and sold. Larger parcels accommodate equipment more efficiently and reduce the need to move farm equipment on public roads. Furthermore, smaller parcels are more impacted by bylaws designed to reduce potential land use conflicts, such as setbacks from lot lines and road allowances. Figure 21. Number of parcels in the ALR by parcel size
1178
748
1309
1007
387236
17490 92
0
200
400
600
800
1000
1200
1400
< 1
1 - 2
2 - 4
4 - 8
8 - 1
6
16 -
32
32 -
64
64 -
128
>= 12
8Tota
l num
ber
of p
arce
ls
Parcel size (ha)
Number of parcels in the ALR
Figure 22. Total area in the ALR by parcel size
5521,124
3,837
5,1853,920
4,662
6,555
4,994
11,667
0
2,000
4,000
6,000
8,000
10,000
12,000
< 1
1 - 2
2 - 4
4 - 8
8 - 1
6
16 -
32
32 -
64
64 -
128
>= 12
8Tota
l are
a (h
a)
Parcel size (ha)
Area in the ALR
10 The farm unit includes all the property owned, rented, or leased by a farm and may incorporate more than one parcel.
Although there are a large number of small parcels in RDCK, the majority of the ALR area occurs on larger parcels.
Figure 22 illustrates that of the 42,496 ha in the ALR:
• 1% (552 ha) is on parcels less than 1 ha. • 13% (5,513 ha) is on parcels less than 4 ha. • 12% (5,185 ha) is on parcels between 4 and 8 ha. • 9% (3,920 ha) is on parcels between 8 and 16 ha. • 66% (27,878 ha) is on parcels greater than 16 ha.
The average ALR parcel size in RDCK is 11.2 ha and the median parcel size is 3.2 ha.
Figure 21 illustrates that of the 5,221 parcels in the ALR:
• 23% (1,778 parcels) are less than 1 ha • 62% (3,235 parcels) are less than 4 ha. • 19% (1,007 parcels) are between 4 and 8 ha. • 7% (387 parcels) are between 8 and 16 ha. • 11% (592 parcels) are greater than 16 ha.
Regional District of Central Kootenay - Agricultural Land Use Inventory - Page 35
Table 15. Number of parcels in the ALR by farming status
Used for farming 1,202 23 %Not used for farming 4,019 77 %
TOTAL 5,221 100 %
Parcel status with respect to farming
Number of
parcels
% of parcels in the ALR
Figure 23. Number of parcels in the ALR by farming status and parcel size
60119
327 316
15399 81
36 11
1118
629
982
691
234
13793 54 81
0
200
400
600
800
1000
1200
< 1
1 - 2
2 - 4
4 - 8
8 - 1
6
16 -
32
32 -
64
64 -
128
>= 12
8
Num
ber
of p
arce
ls in
the
ALR
Parcel Size (ha)
Used for farming
Not used for farming
Figure 24. Proportion of parcels in the ALR by farming status and parcel size
0% 20% 40% 60% 80% 100%
< 1
1 - 2
2 - 4
4 - 8
8 - 16
16 - 32
32 - 64
64 - 128
>= 128
Parcels in the ALR
Parc
el s
ize
(ha)
Used for farming Not used for farming
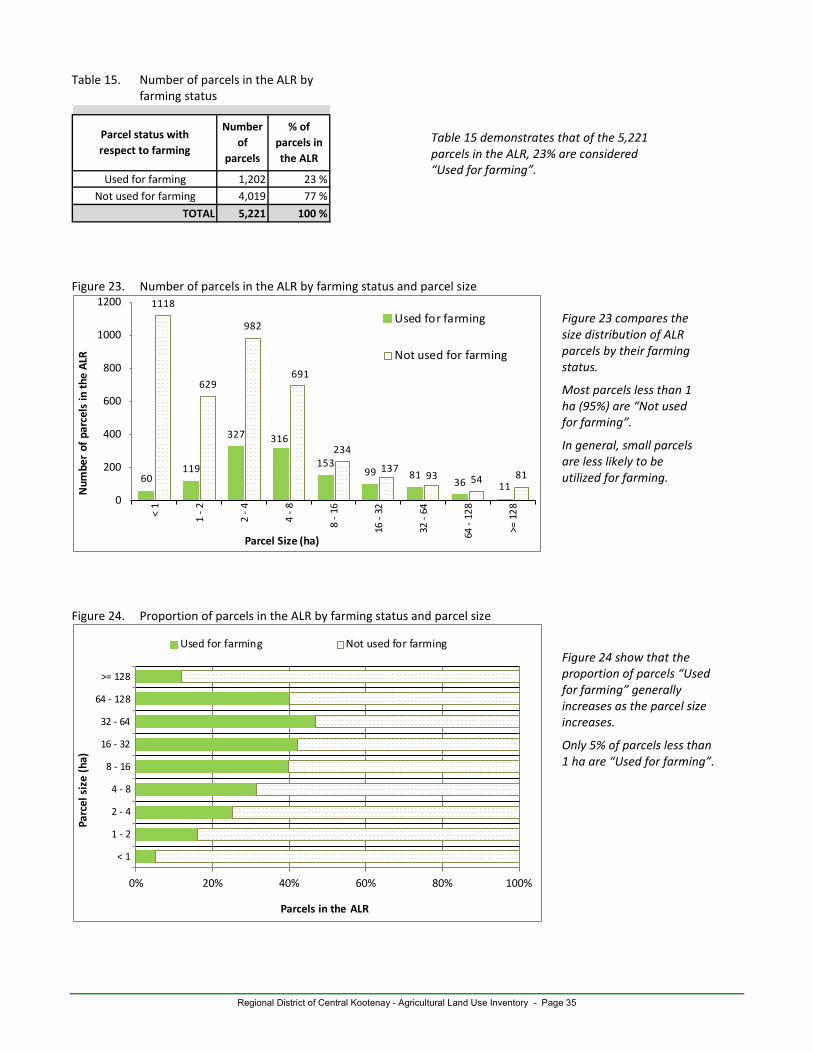
Figure 23 compares the size distribution of ALR parcels by their farming status.
Most parcels less than 1 ha (95%) are “Not used for farming”.
In general, small parcels are less likely to be utilized for farming.
Figure 24 show that the proportion of parcels “Used for farming” generally increases as the parcel size increases.
Only 5% of parcels less than 1 ha are “Used for farming”.
Table 15 demonstrates that of the 5,221 parcels in the ALR, 23% are considered “Used for farming”.
Regional District of Central Kootenay - Agricultural Land Use Inventory - Page 36
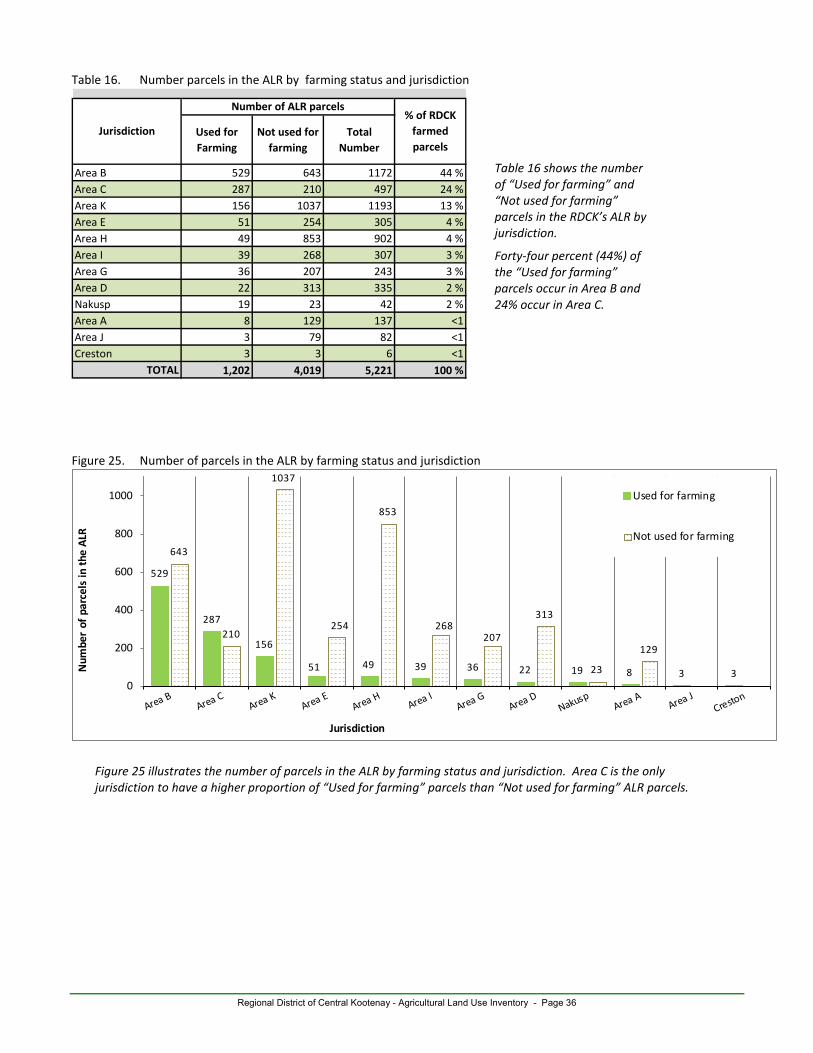
Table 16. Number parcels in the ALR by farming status and jurisdiction
Used for Farming
Not used for farming
Total Number
Area B 529 643 1172 44 %Area C 287 210 497 24 %Area K 156 1037 1193 13 %Area E 51 254 305 4 %Area H 49 853 902 4 %Area I 39 268 307 3 %Area G 36 207 243 3 %Area D 22 313 335 2 %Nakusp 19 23 42 2 %Area A 8 129 137 <1Area J 3 79 82 <1Creston 3 3 6 <1
TOTAL 1,202 4,019 5,221 100 %
Jurisdiction
Number of ALR parcels% of RDCK
farmed parcels
Figure 25. Number of parcels in the ALR by farming status and jurisdiction
529
287
156
51 49 39 36 22 19 8 3 3
643
210
1037
254
853
268207
313
23
129
0
200
400
600
800
1000
Num
ber
of p
arce
ls in
the
ALR
Jurisdiction
Used for farming
Not used for farming
Table 16 shows the number of “Used for farming” and “Not used for farming” parcels in the RDCK’s ALR by jurisdiction.
Forty-four percent (44%) of the “Used for farming” parcels occur in Area B and 24% occur in Area C.
Figure 25 illustrates the number of parcels in the ALR by farming status and jurisdiction. Area C is the only jurisdiction to have a higher proportion of “Used for farming” parcels than “Not used for farming” ALR parcels.
Regional District of Central Kootenay - Agricultural Land Use Inventory - Page 37
66.. AALLRR AAvvaaiillaabbiilliittyy ffoorr FFaarrmmiinngg 6.1 ALR PARCEL AVAILABILITY OVERVIEW
There is a strong demand for agricultural products produced in British Columbia. This demand is expected to increase with population growth11. An available agricultural land base will be important to help meet this demand. The analysis in this section examines the characteristics of parcels that are used for farming, available for farming, and unavailable for farming.
Used for farming – Parcels where the majority of the parcel area is utilized for farming or parcels which exhibit significant evidence of intensive farming. Refer to the glossary for a complete definition. Not used for farming – Parcels that do not meet the “Used for farming” definition. Includes parcels that are available and unavailable for farming. Unavailable for farming – Parcels “not used for farming” where future agricultural development is improbable because of a conflicting land use or land cover that utilizes the majority of the parcel. E.g. land uses such as golf courses, schools, and small residential lots are considered incompatible with agriculture. These properties may be altered in a way that is incompatible with agriculture, may have little land available, and/or tend to have very high land values. It is usually uneconomical for a farmer to acquire and convert these properties to farmland given the limited potential for farming. Also, if there is insufficient land available on a parcel with an existing non-farm use, it will not likely be considered for lease by farmers. Available for farming – Parcels “Not used for farming” that either have some small scale agricultural activity, no apparent land use, or an existing land use that is compatible with agriculture, such as residential. Available for farming parcels must have 0.4 ha and at least 50% of the parcel area in land cover that has potential for farming. Areas considered to have potential for farming include:
• natural and semi-natural vegetation without physical or operational constraints • areas in managed vegetation (managed for landscaping, dust or soil control), and • non-built or bare areas
Areas considered to have no potential for farming include:
• built structures (excluding farm buildings) • fill piles • wetlands and waterbodies
It is assumed that areas with no potential would not likely be removed or filled in to create land with cultivation potential. In addition, areas with steep slopes, rocky soils or operational constraints such as a very small size are considered to have limited potential for farming and are excluded from the available land cover. It is assumed that any existing non-farm land uses will not be displaced by agriculture expansion.
11 In BC, the regulated marketing system requires that over 95% of our milk, eggs, chicken and turkey be produced in BC. The need to produce these
products increases in direct proportion to the population growth.
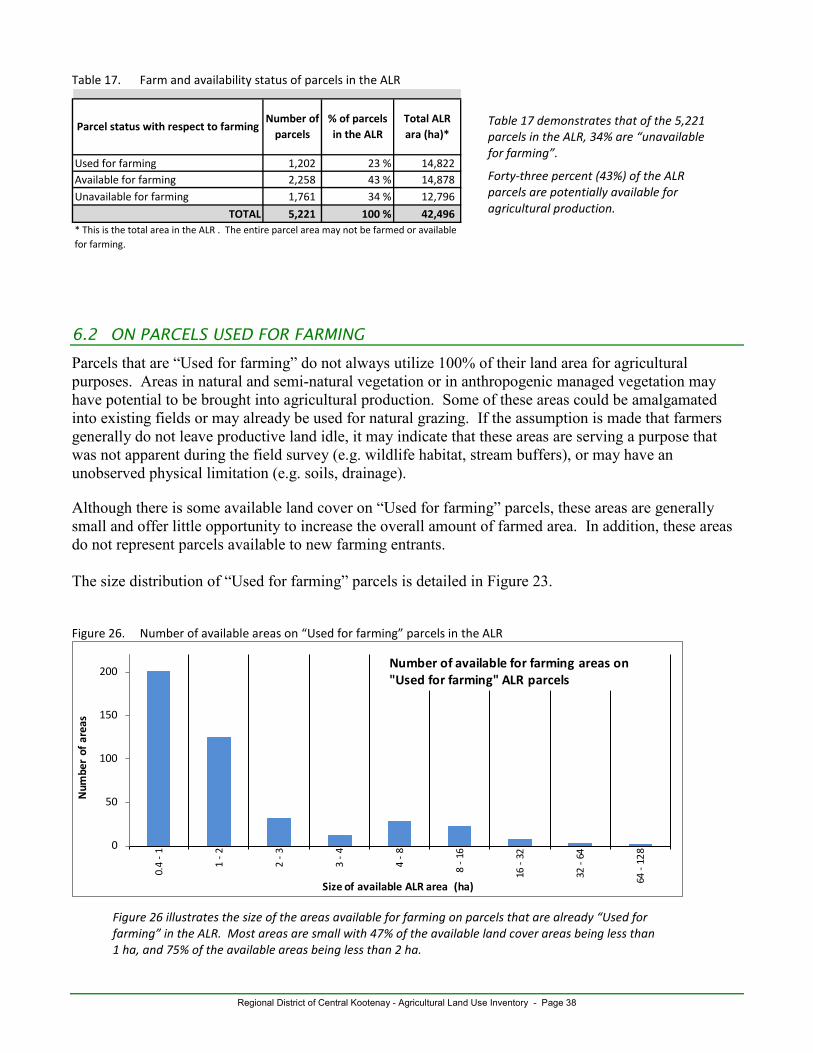
Regional District of Central Kootenay - Agricultural Land Use Inventory - Page 38
Table 17. Farm and availability status of parcels in the ALR
Used for farming 1,202 23 % 14,822 Available for farming 2,258 43 % 14,878 Unavailable for farming 1,761 34 % 12,796
TOTAL 5,221 100 % 42,496
Parcel status with respect to farmingNumber of
parcels% of parcels in the ALR
Total ALR ara (ha)*
* This is the total area in the ALR . The entire parcel area may not be farmed or available for farming. 6.2 ON PARCELS USED FOR FARMING
Parcels that are “Used for farming” do not always utilize 100% of their land area for agricultural purposes. Areas in natural and semi-natural vegetation or in anthropogenic managed vegetation may have potential to be brought into agricultural production. Some of these areas could be amalgamated into existing fields or may already be used for natural grazing. If the assumption is made that farmers generally do not leave productive land idle, it may indicate that these areas are serving a purpose that was not apparent during the field survey (e.g. wildlife habitat, stream buffers), or may have an unobserved physical limitation (e.g. soils, drainage). Although there is some available land cover on “Used for farming” parcels, these areas are generally small and offer little opportunity to increase the overall amount of farmed area. In addition, these areas do not represent parcels available to new farming entrants. The size distribution of “Used for farming” parcels is detailed in Figure 23. Figure 26. Number of available areas on “Used for farming” parcels in the ALR
0
50
100
150
200
0.4
- 1
1 - 2
2 - 3
3 - 4
4 - 8
8 - 1
6
16 -
32
32 -
64
64 -
128
Num
ber
of a
reas
Size of available ALR area (ha)
Number of available for farming areas on "Used for farming" ALR parcels
Table 17 demonstrates that of the 5,221 parcels in the ALR, 34% are “unavailable for farming”.
Forty-three percent (43%) of the ALR parcels are potentially available for agricultural production.
Figure 26 illustrates the size of the areas available for farming on parcels that are already “Used for farming” in the ALR. Most areas are small with 47% of the available land cover areas being less than 1 ha, and 75% of the available areas being less than 2 ha.
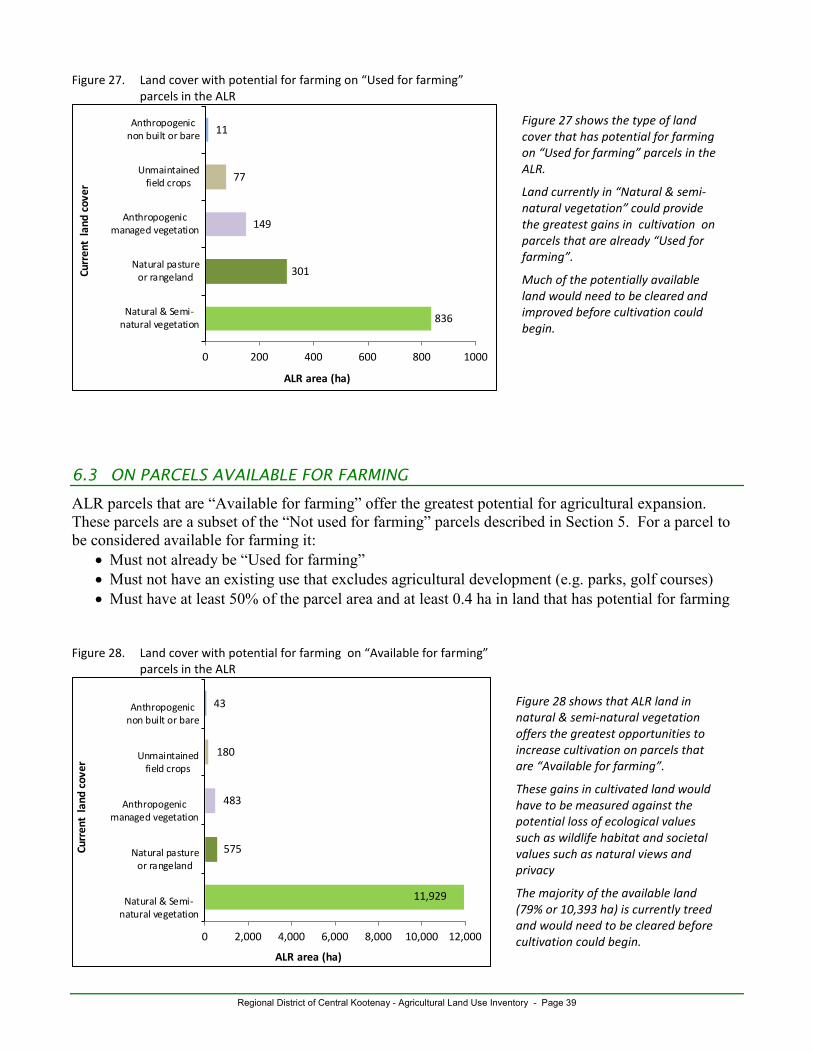
Regional District of Central Kootenay - Agricultural Land Use Inventory - Page 39
Figure 27. Land cover with potential for farming on “Used for farming” parcels in the ALR
836
301
149
77
11
0 200 400 600 800 1000
Natural & Semi-natural vegetation
Natural pastureor rangeland
Anthropogenicmanaged vegetation
Unmaintainedfield crops
Anthropogenicnon built or bare
ALR area (ha)
Curr
ent
land
cov
er
6.3 ON PARCELS AVAILABLE FOR FARMING
ALR parcels that are “Available for farming” offer the greatest potential for agricultural expansion. These parcels are a subset of the “Not used for farming” parcels described in Section 5. For a parcel to be considered available for farming it:
• Must not already be “Used for farming” • Must not have an existing use that excludes agricultural development (e.g. parks, golf courses) • Must have at least 50% of the parcel area and at least 0.4 ha in land that has potential for farming
Figure 28. Land cover with potential for farming on “Available for farming”
parcels in the ALR
11,929
575
483
180
43
0 2,000 4,000 6,000 8,000 10,000 12,000
Natural & Semi-natural vegetation
Natural pastureor rangeland
Anthropogenicmanaged vegetation
Unmaintainedfield crops
Anthropogenicnon built or bare
ALR area (ha)
Curr
ent
land
cov
er
Figure 27 shows the type of land cover that has potential for farming on “Used for farming” parcels in the ALR.
Land currently in “Natural & semi-natural vegetation” could provide the greatest gains in cultivation on parcels that are already “Used for farming”.
Much of the potentially available land would need to be cleared and improved before cultivation could begin.
Figure 28 shows that ALR land in natural & semi-natural vegetation offers the greatest opportunities to increase cultivation on parcels that are “Available for farming”.
These gains in cultivated land would have to be measured against the potential loss of ecological values such as wildlife habitat and societal values such as natural views and privacy
The majority of the available land (79% or 10,393 ha) is currently treed and would need to be cleared before cultivation could begin.
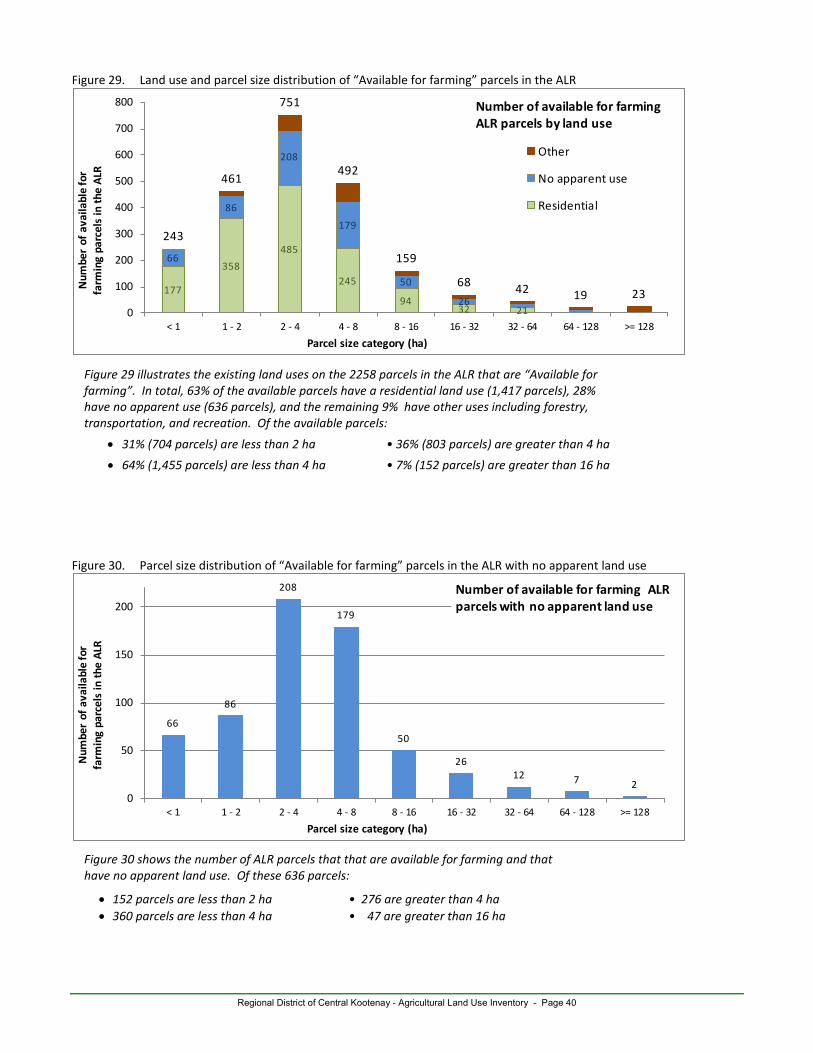
Regional District of Central Kootenay - Agricultural Land Use Inventory - Page 40
Figure 29. Land use and parcel size distribution of “Available for farming” parcels in the ALR
177
358485
245
9432 21
66
86
208
179
50
26
243
461
751
492
159
68 42 19 230
100
200
300
400
500
600
700
800
< 1 1 - 2 2 - 4 4 - 8 8 - 16 16 - 32 32 - 64 64 - 128 >= 128
Num
ber
of a
vaila
ble
for
farm
ing
parc
els
in t
he A
LR
Parcel size category (ha)
Other
No apparent use
Residential
Number of available for farming ALR parcels by land use
Figure 30. Parcel size distribution of “Available for farming” parcels in the ALR with no apparent land use
66
86
208
179
50
2612 7 2
0
50
100
150
200
< 1 1 - 2 2 - 4 4 - 8 8 - 16 16 - 32 32 - 64 64 - 128 >= 128
Num
ber
of a
vaila
ble
for
farm
ing
parc
els
in t
he A
LR
Parcel size category (ha)
Number of available for farming ALR parcels with no apparent land use
Figure 30 shows the number of ALR parcels that that are available for farming and that have no apparent land use. Of these 636 parcels:
• 152 parcels are less than 2 ha • 276 are greater than 4 ha • 360 parcels are less than 4 ha • 47 are greater than 16 ha
Figure 29 illustrates the existing land uses on the 2258 parcels in the ALR that are “Available for farming”. In total, 63% of the available parcels have a residential land use (1,417 parcels), 28% have no apparent use (636 parcels), and the remaining 9% have other uses including forestry, transportation, and recreation. Of the available parcels:
• 31% (704 parcels) are less than 2 ha • 36% (803 parcels) are greater than 4 ha • 64% (1,455 parcels) are less than 4 ha • 7% (152 parcels) are greater than 16 ha
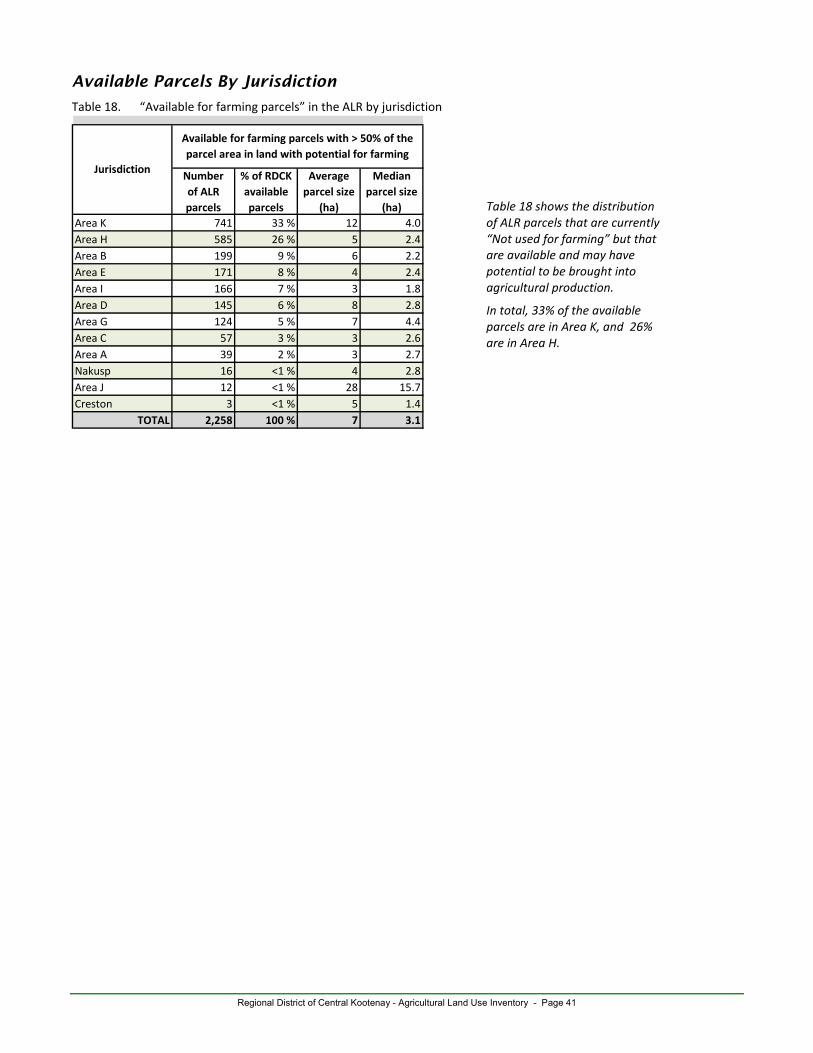
Regional District of Central Kootenay - Agricultural Land Use Inventory - Page 41
Available Parcels By Jurisdiction
Table 18. “Available for farming parcels” in the ALR by jurisdiction
Number of ALR parcels
% of RDCK available parcels
Average parcel size
(ha)
Median parcel size
(ha)Area K 741 33 % 12 4.0Area H 585 26 % 5 2.4Area B 199 9 % 6 2.2Area E 171 8 % 4 2.4Area I 166 7 % 3 1.8Area D 145 6 % 8 2.8Area G 124 5 % 7 4.4Area C 57 3 % 3 2.6Area A 39 2 % 3 2.7Nakusp 16 <1 % 4 2.8Area J 12 <1 % 28 15.7Creston 3 <1 % 5 1.4
TOTAL 2,258 100 % 7 3.1
Jurisdiction
Available for farming parcels with > 50% of the parcel area in land with potential for farming
Table 18 shows the distribution of ALR parcels that are currently “Not used for farming” but that are available and may have potential to be brought into agricultural production.
In total, 33% of the available parcels are in Area K, and 26% are in Area H.
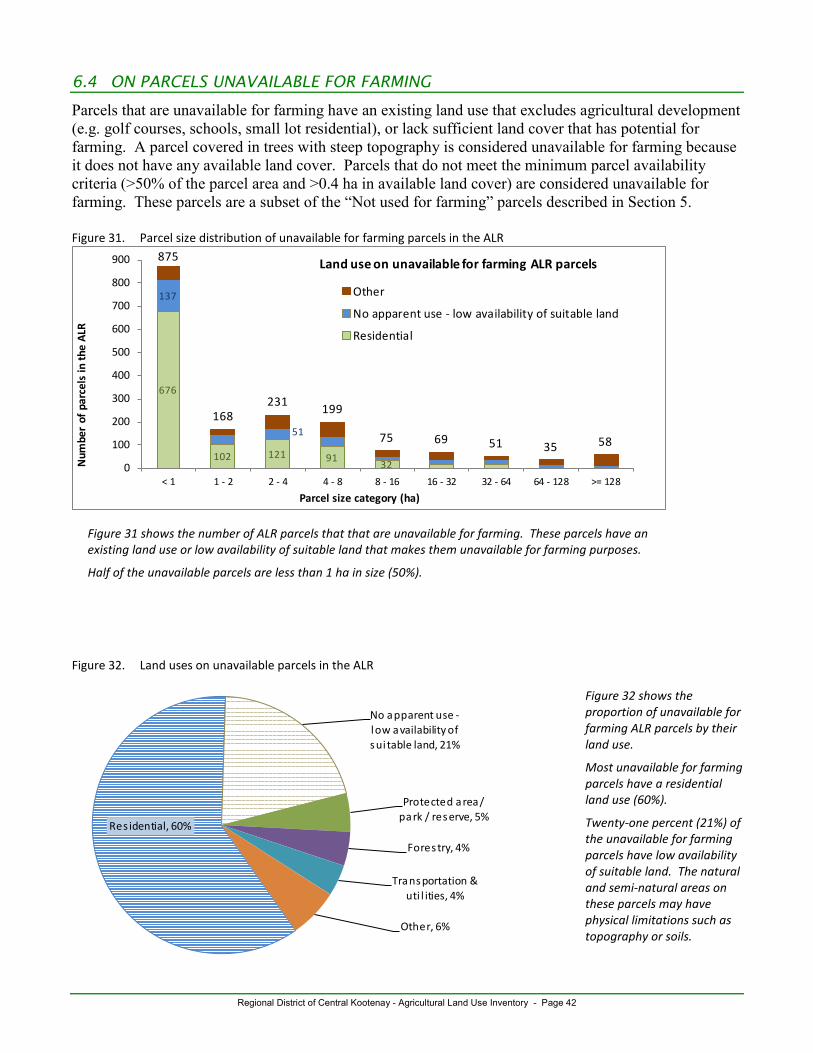
Regional District of Central Kootenay - Agricultural Land Use Inventory - Page 42
6.4 ON PARCELS UNAVAILABLE FOR FARMING
Parcels that are unavailable for farming have an existing land use that excludes agricultural development (e.g. golf courses, schools, small lot residential), or lack sufficient land cover that has potential for farming. A parcel covered in trees with steep topography is considered unavailable for farming because it does not have any available land cover. Parcels that do not meet the minimum parcel availability criteria (>50% of the parcel area and >0.4 ha in available land cover) are considered unavailable for farming. These parcels are a subset of the “Not used for farming” parcels described in Section 5. Figure 31. Parcel size distribution of unavailable for farming parcels in the ALR
676
102 121 91 32
137
51
875
168231 199
75 69 51 35 58
0
100
200
300
400
500
600
700
800
900
< 1 1 - 2 2 - 4 4 - 8 8 - 16 16 - 32 32 - 64 64 - 128 >= 128
Num
ber
of p
arce
ls in
the
ALR
Parcel size category (ha)
Other
No apparent use - low availability of suitable land
Residential
Land use on unavailable for farming ALR parcels
Figure 32. Land uses on unavailable parcels in the ALR
Res idential, 60%
No apparent use -low availability of sui table land, 21%
Protected area / park / reserve, 5%
Forestry, 4%
Transportation & uti l ities, 4%
Other, 6%
Figure 31 shows the number of ALR parcels that that are unavailable for farming. These parcels have an existing land use or low availability of suitable land that makes them unavailable for farming purposes.
Half of the unavailable parcels are less than 1 ha in size (50%).
Figure 32 shows the proportion of unavailable for farming ALR parcels by their land use.
Most unavailable for farming parcels have a residential land use (60%).
Twenty-one percent (21%) of the unavailable for farming parcels have low availability of suitable land. The natural and semi-natural areas on these parcels may have physical limitations such as topography or soils.
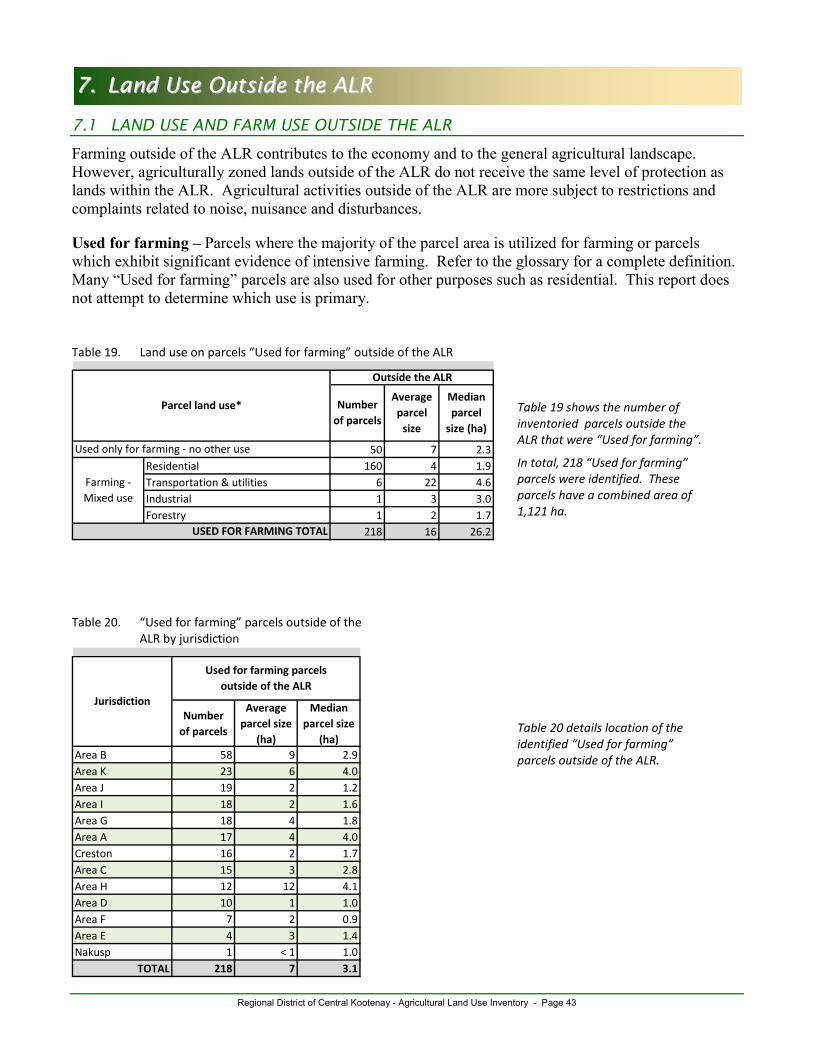
Regional District of Central Kootenay - Agricultural Land Use Inventory - Page 43
77.. LLaanndd UUssee OOuuttssiiddee tthhee AALLRR 7.1 LAND USE AND FARM USE OUTSIDE THE ALR
Farming outside of the ALR contributes to the economy and to the general agricultural landscape. However, agriculturally zoned lands outside of the ALR do not receive the same level of protection as lands within the ALR. Agricultural activities outside of the ALR are more subject to restrictions and complaints related to noise, nuisance and disturbances.
Used for farming – Parcels where the majority of the parcel area is utilized for farming or parcels which exhibit significant evidence of intensive farming. Refer to the glossary for a complete definition. Many “Used for farming” parcels are also used for other purposes such as residential. This report does not attempt to determine which use is primary. Table 19. Land use on parcels “Used for farming” outside of the ALR
50 7 2.3Residential 160 4 1.9Transportation & utilities 6 22 4.6Industrial 1 3 3.0Forestry 1 2 1.7
218 16 26.2
Farming - Mixed use
USED FOR FARMING TOTAL
Outside the ALR
Parcel land use* Number of parcels
Average parcel
size
Median parcel
size (ha)
Used only for farming - no other use
Table 20. “Used for farming” parcels outside of the
ALR by jurisdiction
Number of parcels
Average parcel size
(ha)
Median parcel size
(ha)Area B 58 9 2.9Area K 23 6 4.0Area J 19 2 1.2Area I 18 2 1.6Area G 18 4 1.8Area A 17 4 4.0Creston 16 2 1.7Area C 15 3 2.8Area H 12 12 4.1Area D 10 1 1.0Area F 7 2 0.9Area E 4 3 1.4Nakusp 1 < 1 1.0
TOTAL 218 7 3.1
Jurisdiction
Used for farming parcels outside of the ALR
Table 19 shows the number of inventoried parcels outside the ALR that were “Used for farming”.
In total, 218 “Used for farming” parcels were identified. These parcels have a combined area of 1,121 ha.
Table 20 details location of the identified “Used for farming” parcels outside of the ALR.
Regional District of Central Kootenay - Agricultural Land Use Inventory - Page 44
AAppppeennddiixx AA –– GGlloossssaarryy
Actively farmed – Land cover considered Farmed but excludes unused / unmaintained field crops, and unmaintained greenhouses. Does not include natural pasture or rangeland.
Agricultural Land Reserve (ALR) – A provincial zone in which agriculture is recognized as the priority use. Farming is encouraged and non-agricultural uses are controlled.
Animal Unit Equivalent – A standard measure used to compare different livestock types. One animal unit equivalent is approximately equal to one adult cow or horse.
Anthropogenic – The term anthropogenic describes an effect or object resulting from human activity. In this report, the term anthropogenic refers to land cover originating and maintained by human actions but excludes farmed land cover; cultivated field crops, farm infrastructure, and crop cover structures.
Anthropogenic – Built up - Other – Lands covered by various unused or unmaintained built objects (structures) and associated yards that are not directly used for farming.
Anthropogenic – Managed vegetation – Lands seeded or planted for landscaping, dust or soil control but not cultivated for harvest or pasture. Includes parklands, golf courses, landscaping, lawns, vegetated enclosures, remediation areas.
Anthropogenic – Non Built or Bare – Human created bare areas such as extraction or disposal sites. Includes piles, pits, fill dumps, dirt parking or storage areas.
Anthropogenic – Residential – Lands covered by built objects (structures) and their associated auxiliary buildings, yards, roads, and parking. Includes single family dwellings, multifamily dwellings, and mobile homes.
Anthropogenic – Residential footprint – Includes the main residence plus its associated yard, driveway, parking and any auxiliary buildings or structures. When two residences are on a property, areas associated to both (such as shared driveways, parking or yard), are assigned to the closest residence.
Anthropogenic – Settlement – Lands covered by built objects (structures) and their associated yards, roads, and parking. Includes institutional, commercial, industrial, sports / recreation, military, non linear utility areas and storage / parking.
Anthropogenic – Transportation – Lands covered by built objects (structures). Includes roads, railways, airports and associated buffers and yards.
Anthropogenic – Utilities – Lands covered by built objects (structures). Includes linear features such as pipelines or transmission lines.
Anthropogenic Waterbodies – Areas covered by water, snow or ice due to human construction. Includes reservoirs, canals, ditches, and artificial lakes - with or without non cultivated vegetation.
Available for farming – Parcels that can be used for agricultural purposes without displacing a current use. Includes all parcels that do not meet the “Unavailable for farming” criteria.
BC Assessment – The Crown corporation which produces annual, uniform property assessments that are used to calculate local and provincial taxation. The database purchased from BC Assessment
Regional District of Central Kootenay - Agricultural Land Use Inventory - Page 45
contains information about property ownership, land use, and farm classification, which is useful for land use surveys.
Cadastre – The GIS layer containing parcel boundaries, i.e. legal lot lines.
Crop cover structures – Land covered with built objects including permanent enclosed glass or poly structures (greenhouses) with or without climate control facilities for growing plants and vegetation under controlled environments, and barns used for growing crops such as mushrooms. Excludes non- permanent structures such as hoop or tunnel covers.
Crown ownership – Crown ownership includes parcels which are owned by provincial or federal governments. Parcel ownership is determined by the Integrated Cadastre Fabric maintained by the Parcel Fabric Section of the BC Government.
Cultivated field crops - Land under cultivation for harvest or pasture. Includes crop land, fallow farmland, unused forage or pasture, un-housed container crops and crops under temporary covers. Excludes natural pasture, rangeland, greenhouses, mushroom barns and other crop houses.
Effective ALR – The Agricultural Land Reserve area that is in legally surveyed parcels and under the jurisdiction of the area of interest. The effective ALR is the total ALR area excluding ALR on Indian reserves and ALR outside of legally surveyed parcels. Effective ALR can be used to compare land cover categories across different jurisdictions.
Farm classification for tax assessment – Applies to parcels producing the minimum dollar amount to be classified as a farm by BC Assessment. Local governments apply a tax rate to farmland which is usually lower than for other land. To receive and maintain the farm classification, the land must generate annual income from agricultural production.
Farm infrastructure – Land covered by farm related built objects (structures) and their associated yards, roads, parking. Includes barns, storage structures, paddocks, corrals, riding rings, farm equipment storage, and specialized farm buildings such as hatcheries. Excludes greenhouses, mushroom barns and other crop houses.
Farm Unit – An area of land used for a farm operation consisting of one or more contiguous or non-contiguous parcels, that may be owned, rented or leased, which form and are managed as a single farm.
Farmed – Land cover directly contributing to agricultural production (both actively farmed and inactively farmed) and intentionally planted or built. Includes land in Cultivated field crops, Farm infrastructure and Crop cover structures (see individual definitions). Does not include natural pasture or rangeland.
Grazed – Land in natural pasture or rangeland that is used for grazing domestic livestock. These areas are considered separate from Farmed land cover.
Greenhouses – See Crop cover structures.
Homesite (livestock) – The homesite is the primary location of a farm unit or livestock operation where most livestock management occurs. It is the location of the main ranch or main barn of a farm unit.
Inactively farmed – Land cover considered “Farmed” but is currently inactive. Includes unused / unmaintained forage and pasture, unmaintained field crops, and unmaintained greenhouses or crop barns. Does not include natural pasture or rangeland.
Regional District of Central Kootenay - Agricultural Land Use Inventory - Page 46
Intensive livestock – Intensive livestock have specialized structures such as barns, feedlots, or stockyards designed for confined feeding at high stocking densities.
Land use – Dumps & deposits – Parcels with landfills, green waste, or outdoor composting facilities. Also includes parcels with significant fill deposits.
Land use – First Nations – Parcels designated for ceremonial use, food & material harvesting, or cultural landforms. These parcels are outside of federally designated Indian reserves.
Land use – Institutional & community – Parcels with churches, cemeteries, hospitals, medical centers, education facilities, correctional facilities, or government and First Nation administration.
Land use – Land in transition – Parcels with developed land in transition. Includes construction sites, large scale tree removal, and demolished buildings.
Land use – No apparent use – Parcel with no apparent human use; natural areas, long term fallow land, cleared land not in production, abandoned or neglected land, abandoned or unused structures.
Land use – Protected area / park / reserve – Includes provincial parks, other parks, and ecological reserves. Areas may have passive recreation such as hiking, nature viewing, or camping.
Land use – Recreation & leisure – Parcels with intensive recreation (such as zoos, rinks, courts, walking/biking trails), or extensive recreation (such as horseback riding, wilderness camping sites, fishing, hunting, skiing, etc.). Golf course are reported separately.
Land use – Water management – Areas used to actively or inactively manage water. Includes reservoirs, managed wetlands, dykes and land which provides natural flood/erosion protection (land outside dyke).
Land use – Wildlife management – Areas used to actively or inactively manage wildlife. Includes wildlife reserves, breeding areas, fishing areas, and fish ladders/hatcheries.
Limited potential for farming – See potential for farming.
Livestock operation scale – See Scale of livestock operations.
Natural and Semi-natural – Land cover which has not originated from human activities or is not being maintained by human actions. See descriptions below. Includes regenerating lands, and old farm fields.
Natural and Semi-natural – Grass – Land cover dominated by naturally occurring grasses with some sedges or rushes. May include non-native naturalized species. If greater than 50% cover is grass, the land is categorized as grass.
Natural and Semi-natural – Herbaceous – Land cover dominated by low, non woody plants such as ferns, grasses, horsetails, clovers and dwarf woody plants. If greater than 10% crown cover is trees, the land is categorized as treed.
Natural and Semi-natural – Natural bare areas – Includes bare rock areas, sands and deserts.
Natural and Semi-natural – Natural pasture – Smaller fenced areas usually on private land with uncultivated (not sown) natural or semi-natural grasses, herbs or shrubs used for grazing domestic livestock.
Regional District of Central Kootenay - Agricultural Land Use Inventory - Page 47
Natural and Semi-natural – Rangeland – Larger areas usually on Crown land with uncultivated (not sown) natural or semi-natural vegetation used for grazing domestic livestock.
Natural and Semi-natural – Shrubs – Land where less than 10% crown cover is native trees and at least 20% crown cover is multi-stemmed woody perennial plants, both evergreen and deciduous.
Natural and Semi-natural – Treed - closed – Land where between 60 and 100% of crown cover is native trees.
Natural and Semi-natural – Treed - open – Land where between 10 and 60% of crown cover is native trees.
Natural and Semi-natural – Vegetatation – Land covered by Natural and Semi-natural vegetation including, grasses, herbs, shrubs, and trees. Natural pasture or rangeland is reported separately.
Natural pasture or rangeland – Land with uncultivated (not sown) natural or semi-natural vegetation used for grazing domestic livestock. This land cover is considered “Used for grazing” and “Not used for farming” although these areas are usually extensions of more intensive farming areas.
Non homesite (livestock) – A location where livestock are present, but related infrastructure is minimal. Non homesites are used for pasturing and are secondary to the farm units primary (homesite) location.
Non intensive livestock – Non intensive livestock have the ability to graze on pasture and often utilize non intensive barns and corrals/paddocks.
Not used for farming – Parcels that do not meet the “Used for farming” criteria.
Not used for farming but available – Parcels that do not meet the “Used for farming” criteria but can be used for agricultural purposes without displacing a current use.
Scale of livestock operations – The scale system used in this report to describe livestock operations includes 4 levels:
• “Very Small Approximately 1 cow or horse or bison, 3 hogs, 5 goats or deer, 10 sheep, 50 turkeys, 100 chickens (1 animal unit equivalent)
• “Small” LESS THAN 25 cows or horses or bison, 75 hogs, 125 goats or deer, 250 sheep, 1250 turkeys, 2500 chickens (2 - 25 animal unit equivalents)
• “Medium” LESS THAN 100 cows or horses or bison, 300 hogs, 500 goats or deer, 1000 sheep, 5,000 turkeys, 10,000 chickens (25 - 100 animal unit equivalents)
• “Large” MORE THAN 100 cows or horses or bison, 300 hogs, 500 goats or deer, 1000 sheep, 5,000 turkeys, 10,000 chickens (over 100 animal unit equivalents)
Potential for farming – Land without significant topographical, physical or operational constraints to farming such as steep terrain, land under water, or built structures. For example, land with little slope, sufficient soils and exhibiting a natural treed land cover would be considered as having potential for farming. Areas less than 1 acre in size are considered to have limited potential for farming.
Unavailable for farming – “Not used for farming” parcels where future agricultural development is improbable because of a conflicting land use or land cover that utilizes the majority of the parcel area. For example, most residential parcels are considered unavailable for farming if the parcel size is less than 0.4 hectares (approximately 1 acre) since most of the parcel is covered by built structures, pavement and landscaping.
Regional District of Central Kootenay - Agricultural Land Use Inventory - Page 48
Unmaintained field crops – Land under cultivation for field crops which has not been maintained for several years and probably would not warrant harvest.
Unmaintained forage or pasture – Land under cultivation for forage or pasture which has not been cut or grazed during the current growing season and has not been maintained for several years.
Unused forage or pasture – Land under cultivation for forage or pasture which has not been cut or grazed during the current growing season.
Used for farming – See final page of glossary.
Used for grazing – Parcels “Not used for farming” with a significant portion of their area in natural pasture or rangeland and evidence of active grazing domestic livestock.
Used for farming – Parcels where the majority of the parcel area is farmed OR parcels which exhibit significant intensity of farming are considered “Used for farming”. Specifically, parcels that meet at least one of the following criteria:
• medium or large scale livestock, apiculture or aquaculture operations • at least 45% parcel area in cultivated field crops (excluding unused forage or pasture) • at least 50% parcel area built up with farm infrastructure • at least 25% parcel area built up with crop cover structures (excluding unmaintained structures) • at least 40% parcel area in cultivated field crops (excluding unused forage or pasture) or farm infrastructure and
small scale livestock, apiculture or aquaculture operations • at least 33% parcel area in cultivated field crops (excluding unused forage or pasture) and at least 55% parcel area in
cultivated field crops (excluding unused forage or pasture) or farm infrastructure • at least 10% parcel area in crop cover structures (excluding unmaintained structures) and at least 40% parcel area in
cultivated field crops (excluding unused forage or pasture) or farm infrastructure • at least 20% parcel area and at least 20 ha in cultivated field crops (excluding unused forage or pasture) • at least 25% parcel area and at least 10 ha in cultivated field crops (excluding unused forage or pasture) • at least 30% parcel area and at least 5 ha in cultivated field crops (excluding unused forage or pasture) • at least 10% parcel area and at least 2 ha built up with crop cover structures (excluding unmaintained structures) • at least 20% parcel area and at least 1 ha built up with crop cover structures (excluding unmaintained structures)