Embed Size (px)
Citation preview
SEE APPENDIX I FOR IMPORTANT DISCLOSURES AND ANALYST CERTIFICATIONS
18 Jul 2012
Regional
Daily
Top Views MK: Oil & Gas Wong Chew Hann 3 2H 2012: An Action-Packed Time Ahead | Overweight - We expect news and contract flows to be strong. We foresee 3 strong
themes featuring prominently in 2H. They are: (i) a strong pipeline of offshore fabrication awards; (ii) contract flows for floating solutions and (iii) continuous awards for marginal/ rejuvenation projects.
- We estimate up to MYR7b worth of jobs to be awarded over the next 18 months. We assess that up to five FPSOs are required for Malaysian waters. Following two RSC project awards in 2011, we have identified several projects - Angsi EOR, St Joseph EOR, Tanjung Bram EPS for 2012.
- We see exciting prospects for the offshore fabricators. MMHE and SapuraKencana. Bumi Armada, Perisai and Yinson are the primary plays in the floating solutions space. Bumi Armada, Dialog and SapuraKencana are the likeliest candidates to clinch PETRONAS’ marginal field RSC and EOR projects. We expect investor interest to return to the sector which has underperformed the KLCI in 1H 2012.
1Q12 REVIEW Mcap USD3.9b ADTV USD8.6m SG: Ascendas REIT (AREIT SP) Ong Kian Lin 4 REITs | A-REIT delivers again | BUY | Upside 14% - 1Q12 revenue at SGD142m, was 28% of ours and 26% of consensus
estimate. 1Q12 DPU at 3.53 SG-cts (up 0.9% QoQ and 10.3% YoY) was 26% of our forecast and consensus estimate. Occupancy rate for the portfolio and multi-tenanted buildings (MTB) improved to 94.6% and 90.1% respectively from 94.3% and 89.5% a quarter ago. Positive rental reversion on renewal range between 10%-21% throughout all segments of the portfolio.
- We raise our FY12-14F revenue and DPU by 1.1%-3.6% and 1.2%-4.8% respectively in view of better-than-expected rental reversions.
- We continue to like A-REIT for its stable DPU yield, healthy lease expiry and debt maturity profile, underpinned by a diverse portfolio. Importantly, A-REIT is also less vulnerable to asset erosion, with its defensive properties located primarily in Singapore. The stock currently trades at 6.4% FY12F yield and 1.1x P/BV. Reiterate BUY with a DDM-derived target price of SGD2.34 (prev. SGD2.23)
2Q12 PREVIEW Mcap USD24.7b ADTV USD12.4m SG: United Overseas Bank (UOB SP) Desmond Ch’ng 5 Financials | A softer 2Q expected | SELL | Downside 21% - 2Q12 results, due Aug 7, are likely to be softer QoQ, in our view. Some
features that we expect include a) stable loan expansion, b) a normalization of trading income and c) QoQ NIM contraction.
- The stock has outperformed its peers YTD (+22% vs 20% for DBS, 12% for OCBC). However, valuations are no longer cheap, in our view, with the stock trading at a 2012 P/BV of 1.4x for an ROE of 11.5% vs 1.1x for DBS (10.8% ROE) and 1.4x for OCBC (12.2% ROE).
- Our TP of SGD15.50 (P/BV 1.1x) is maintained.
P K BASU [email protected] (65) 6432 1821 ONG Seng Yeow [email protected] (852) 2268 0644 Jeremy TAN [email protected] (852) 2268 0635
Today’s Content… Country Malaysia Oil & Gas Sector Singapore Ascendas REIT Singapore United Overseas Bank Philippines Alliance Global Group Inc Singapore Non-Oil domestic Exports June 2012
Top Buys… Company Ticker Spot Target Upside (%) Vinamilk VNM VN 86500 118000 36.4 Philex Mining Corp PX PM 22.75 30.61 34.5 LICHF LICHF IN 262.65 332.00 26.4 SembMarine SMM SP 4.960 6.200 25.0 Yes Bank YES IN 350.25 434.00 23.9 First Philippine Holdings
FPH PM 79.00 97.80 23.8
Venture Corp VMS SP 7.900 9.650 22.2 B. Armada BAB MK 4.01 4.88 21.7 AAPICO Hitech AH TB 15.20 18.00 18.4 SapuraKencana SAKP MK 2.30 2.68 16.5 P. Chem PCHEM MK 6.60 7.50 13.6 Asian Property Development
AP TB 7.50 8.50 13.3
Top Sells… Company Ticker Spot Target Downside (%) Jai Prakash Associates JPA IN 77.05 47.00 -39.0 GMA Network Inc GMAP PM 10 6.90 -32.4 Uni-President 220 HK 8.00 5.60 -30.0 Ayala Land ALI PM 20.80 15.00 -27.9
Maybank-KE Events Date Event Location 18 Jul Malaysia Head of Research & Chief
Economist, and Regional Strategist marketing
KL
18-20 Jul Singapore HoR & REIT analyst marketing SG 18 Jul Hock Seng Lee NDR KL 19-20 Jul Regional Head, Research & Economics
marketing HK
23-24 Jul Malaysia Head of Research & Chief Economist, and Regional Strategist marketing
SG
24-25 Jul Malaysia Oil & Gas, and Petrochem analysts marketing
SG
26 – 27 Jul Malaysia Oil & Gas, and Petrochem analysts marketing
HK
18 July 2012
Regional Daily
Company Notes VISIT NOTE Mcap USD2.9b ADTV USD6.2m PH: Alliance Global Group Inc (AGI) Kenneth Nerecina 6 Conglomerates | Travellers vs aspiring gaming operators | HOLD | Downside 2.4% - We estimate what the market is implying the value of AGI’s Travellers
International Hotel Group Inc by taking the current market caps of AGI, Megaworld Corp (MEG) and Global-Estates Resorts Inc (GERI) and considering our estimated values for Emperador Distillers Inc and Golden Arches Development Corp.
- The market’s implied value of Travellers is PHP135b, which translates to a PER of 20x on 2012 projected earnings and PBV of 7x on 2011 book value
- Would-be casino operators Bloomberry Resorts Corp (BLOOM), Belle Corp (BEL) and Leisure & Resorts World Corp (LR) have PBVs of 13.6x, 3.3x and 3.2x, respectively.
- Meanwhile, initial indication from AGI is that 2Q12 gaming revenues may not be strong. We maintain our HOLD rating on AGI given our NAV-based target price of PHP11.60/sh
Economics
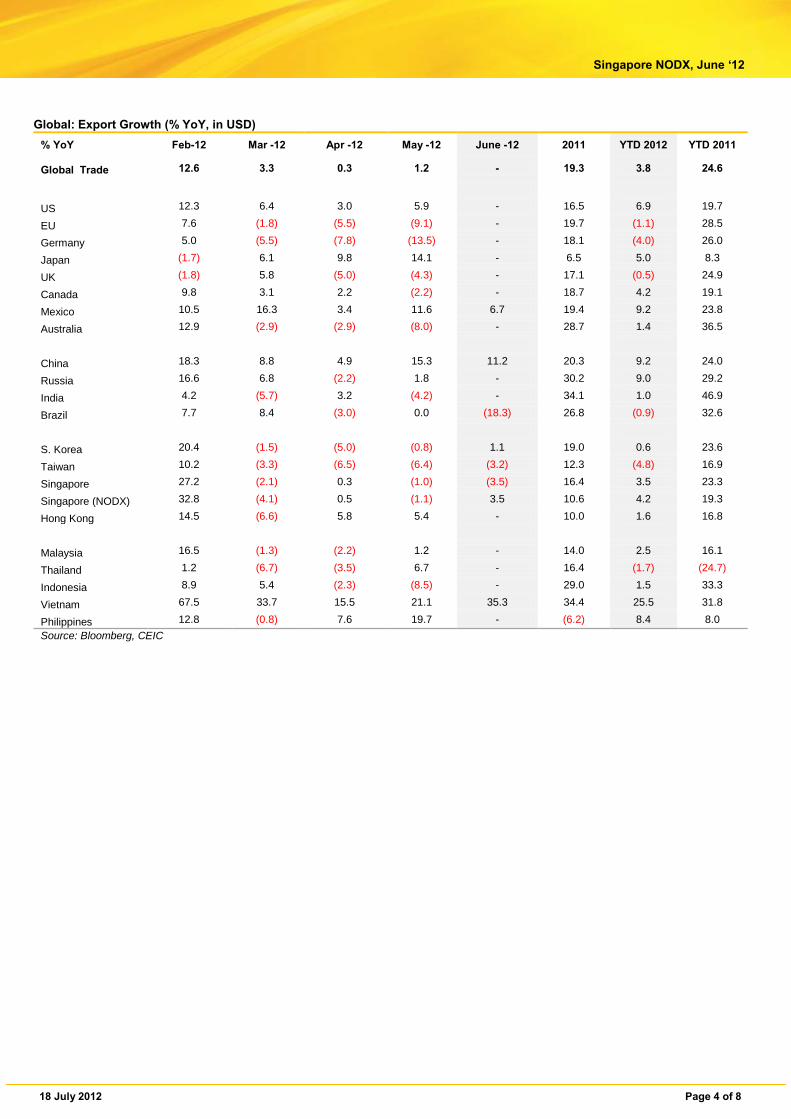
SG: Non-Oil Domestic Exports, June 2012 Suhaimi Ilias 7 Lift From Pharmaceuticals - NODX growth picked up the pace in Jun 2012 to +6.8% YoY (May 2012:
+3.2% YoY; Consensus: +2.0% YoY) largely thanks to the increased shipments of pharmaceuticals. From the previous month, the seasonally adjusted NODX expanded by +6.7% (May 2012: -2.0% MoM). However, growth slowed in 2Q 2012 to +3.9% YoY from +6.1% YoY in 1Q 2012, reflecting deteriorating global economic – and hence external demand / trade conditions – amid worsening Eurozone crisis, US growth deceleration and China’s slowdown. For the first six months of this year, NODX was up by +5.0% YoY (1H 2011: +6.8% YoY).
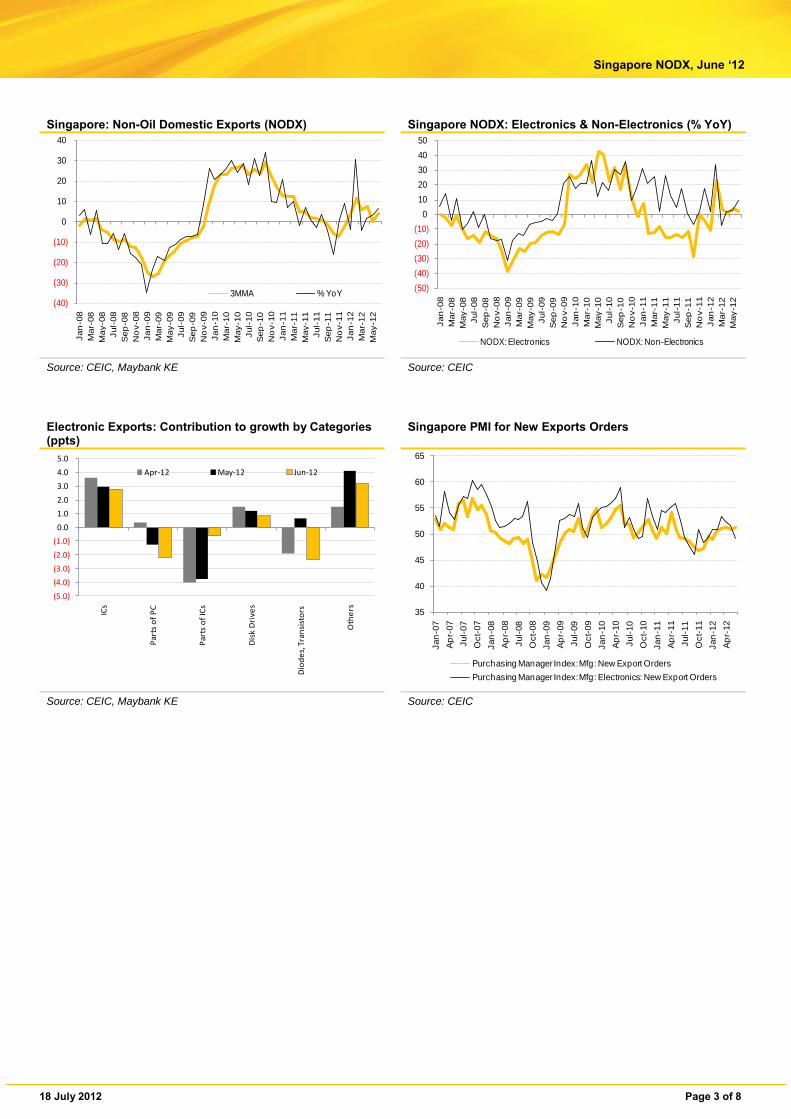
- Short-term leading export indicators suggest sustained growth in NODX, supported by non-electronics exports amid volatile electronics shipments as the PMI new manufacturing new export orders edged up to 51.1 in Jun 2012 from 50.8 in May 2012, while the sub-index for new electronics export orders dipped to 49.2 from 51.6 over the same period.
- Therefore, we maintained our projection of continued low single-digit NODX growth of +3.8% in 2012 (2011: +2.2%). International Enterprise (IE) Singapore forecasts NODX growth to be between 3% and 5% in 2012.
SEE APPENDIX I FOR IMPORTANT DISCLOSURES AND ANALYST CERTIFICATIONS
Sector Update 18 July 2012
PP16832/01/2013 (031128)
Malaysia
Oil & Gas 2H 2012: An Action-Packed Time Ahead
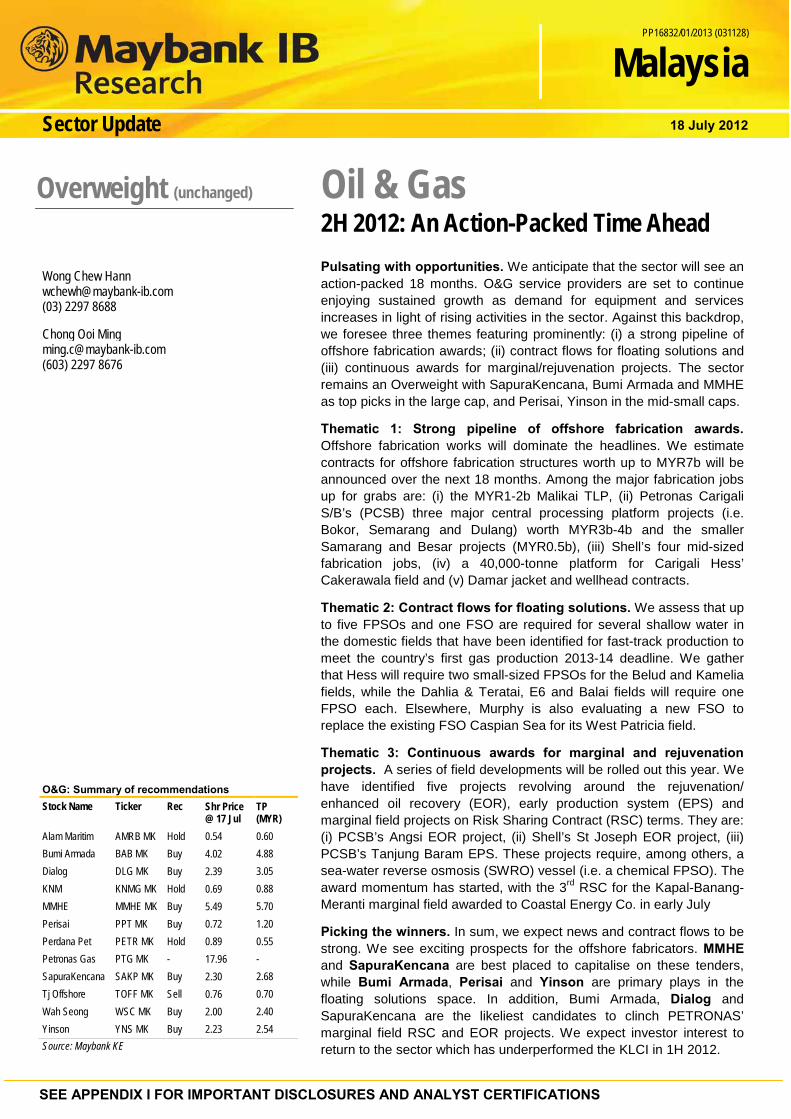
Pulsating with opportunities. We anticipate that the sector will see an action-packed 18 months. O&G service providers are set to continue enjoying sustained growth as demand for equipment and services increases in light of rising activities in the sector. Against this backdrop, we foresee three themes featuring prominently: (i) a strong pipeline of offshore fabrication awards; (ii) contract flows for floating solutions and (iii) continuous awards for marginal/rejuvenation projects. The sector remains an Overweight with SapuraKencana, Bumi Armada and MMHE as top picks in the large cap, and Perisai, Yinson in the mid-small caps.
Thematic 1: Strong pipeline of offshore fabrication awards. Offshore fabrication works will dominate the headlines. We estimate contracts for offshore fabrication structures worth up to MYR7b will be announced over the next 18 months. Among the major fabrication jobs up for grabs are: (i) the MYR1-2b Malikai TLP, (ii) Petronas Carigali S/B’s (PCSB) three major central processing platform projects (i.e. Bokor, Semarang and Dulang) worth MYR3b-4b and the smaller Samarang and Besar projects (MYR0.5b), (iii) Shell’s four mid-sized fabrication jobs, (iv) a 40,000-tonne platform for Carigali Hess’ Cakerawala field and (v) Damar jacket and wellhead contracts.
Thematic 2: Contract flows for floating solutions. We assess that up to five FPSOs and one FSO are required for several shallow water in the domestic fields that have been identified for fast-track production to meet the country’s first gas production 2013-14 deadline. We gather that Hess will require two small-sized FPSOs for the Belud and Kamelia fields, while the Dahlia & Teratai, E6 and Balai fields will require one FPSO each. Elsewhere, Murphy is also evaluating a new FSO to replace the existing FSO Caspian Sea for its West Patricia field.
Thematic 3: Continuous awards for marginal and rejuvenation projects. A series of field developments will be rolled out this year. We have identified five projects revolving around the rejuvenation/ enhanced oil recovery (EOR), early production system (EPS) and marginal field projects on Risk Sharing Contract (RSC) terms. They are: (i) PCSB’s Angsi EOR project, (ii) Shell’s St Joseph EOR project, (iii) PCSB’s Tanjung Baram EPS. These projects require, among others, a sea-water reverse osmosis (SWRO) vessel (i.e. a chemical FPSO). The award momentum has started, with the 3rd RSC for the Kapal-Banang-Meranti marginal field awarded to Coastal Energy Co. in early July
Picking the winners. In sum, we expect news and contract flows to be strong. We see exciting prospects for the offshore fabricators. MMHE and SapuraKencana are best placed to capitalise on these tenders, while Bumi Armada, Perisai and Yinson are primary plays in the floating solutions space. In addition, Bumi Armada, Dialog and SapuraKencana are the likeliest candidates to clinch PETRONAS’ marginal field RSC and EOR projects. We expect investor interest to return to the sector which has underperformed the KLCI in 1H 2012.
Overweight (unchanged) Wong Chew Hann [email protected] (03) 2297 8688 Chong Ooi Ming [email protected] (603) 2297 8676
O&G: Summary of recommendations Stock Name Ticker Rec Shr Price
@ 17 Jul TP (MYR)
Alam Maritim AMRB MK Hold 0.54 0.60 Bumi Armada BAB MK Buy 4.02 4.88 Dialog DLG MK Buy 2.39 3.05 KNM KNMG MK Hold 0.69 0.88 MMHE MMHE MK Buy 5.49 5.70 Perisai PPT MK Buy 0.72 1.20 Perdana Pet PETR MK Hold 0.89 0.55 Petronas Gas PTG MK - 17.96 - SapuraKencana SAKP MK Buy 2.30 2.68 Tj Offshore TOFF MK Sell 0.76 0.70 Wah Seong WSC MK Buy 2.00 2.40 Yinson YNS MK Buy 2.23 2.54 Source: Maybank KE
SEE APPENDIX I FOR IMPORTANT DISCLOSURES AND ANALYST CERTIFICATIONS
Results Review 18 July 2012
Singapore
Co. Reg No: 198700034E MICA (P) : 099/03/2012
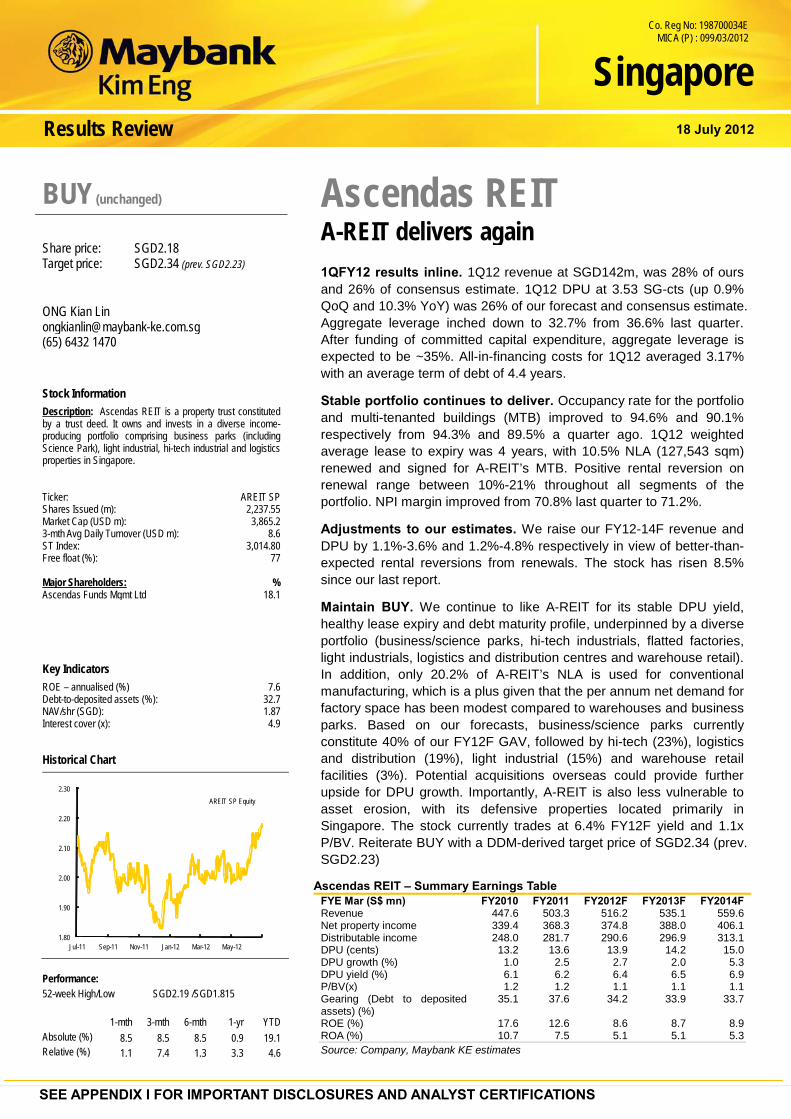
Ascendas REIT A-REIT delivers again
1QFY12 results inline. 1Q12 revenue at SGD142m, was 28% of ours and 26% of consensus estimate. 1Q12 DPU at 3.53 SG-cts (up 0.9% QoQ and 10.3% YoY) was 26% of our forecast and consensus estimate. Aggregate leverage inched down to 32.7% from 36.6% last quarter. After funding of committed capital expenditure, aggregate leverage is expected to be ~35%. All-in-financing costs for 1Q12 averaged 3.17% with an average term of debt of 4.4 years.
Stable portfolio continues to deliver. Occupancy rate for the portfolio and multi-tenanted buildings (MTB) improved to 94.6% and 90.1% respectively from 94.3% and 89.5% a quarter ago. 1Q12 weighted average lease to expiry was 4 years, with 10.5% NLA (127,543 sqm) renewed and signed for A-REIT’s MTB. Positive rental reversion on renewal range between 10%-21% throughout all segments of the portfolio. NPI margin improved from 70.8% last quarter to 71.2%.
Adjustments to our estimates. We raise our FY12-14F revenue and DPU by 1.1%-3.6% and 1.2%-4.8% respectively in view of better-than-expected rental reversions from renewals. The stock has risen 8.5% since our last report.
Maintain BUY. We continue to like A-REIT for its stable DPU yield, healthy lease expiry and debt maturity profile, underpinned by a diverse portfolio (business/science parks, hi-tech industrials, flatted factories, light industrials, logistics and distribution centres and warehouse retail). In addition, only 20.2% of A-REIT’s NLA is used for conventional manufacturing, which is a plus given that the per annum net demand for factory space has been modest compared to warehouses and business parks. Based on our forecasts, business/science parks currently constitute 40% of our FY12F GAV, followed by hi-tech (23%), logistics and distribution (19%), light industrial (15%) and warehouse retail facilities (3%). Potential acquisitions overseas could provide further upside for DPU growth. Importantly, A-REIT is also less vulnerable to asset erosion, with its defensive properties located primarily in Singapore. The stock currently trades at 6.4% FY12F yield and 1.1x P/BV. Reiterate BUY with a DDM-derived target price of SGD2.34 (prev. SGD2.23)
Ascendas REIT – Summary Earnings Table FYE Mar (S$ mn) FY2010 FY2011 FY2012F FY2013F FY2014F Revenue 447.6 503.3 516.2 535.1 559.6 Net property income 339.4 368.3 374.8 388.0 406.1 Distributable income 248.0 281.7 290.6 296.9 313.1 DPU (cents) 13.2 13.6 13.9 14.2 15.0 DPU growth (%) 1.0 2.5 2.7 2.0 5.3 DPU yield (%) 6.1 6.2 6.4 6.5 6.9 P/BV(x) 1.2 1.2 1.1 1.1 1.1 Gearing (Debt to deposited assets) (%)
35.1 37.6 34.2 33.9 33.7
ROE (%) 17.6 12.6 8.6 8.7 8.9 ROA (%) 10.7 7.5 5.1 5.1 5.3 Source: Company, Maybank KE estimates
BUY (unchanged) Share price: SGD2.18 Target price: SGD2.34 (prev. SGD2.23) ONG Kian Lin [email protected] (65) 6432 1470 Stock Information Description: Ascendas REIT is a property trust constituted by a trust deed. It owns and invests in a diverse income-producing portfolio comprising business parks (including Science Park), light industrial, hi-tech industrial and logistics properties in Singapore. Ticker: AREIT SP Shares Issued (m): 2,237.55 Market Cap (USD m): 3,865.2 3-mth Avg Daily Turnover (USD m): 8.6 ST Index: 3,014.80 Free float (%): 77 Major Shareholders: % Ascendas Funds Mgmt Ltd 18.1 Key Indicators ROE – annualised (%) 7.6 Debt-to-deposited assets (%): 32.7 NAV/shr (SGD): 1.87 Interest cover (x): 4.9
Historical Chart
1.80
1.90
2.00
2.10
2.20
2.30
Jul-11 Sep-11 Nov-11 Jan-12 Mar-12 May-12
AREIT SP Equity
Performance: 52-week High/Low SGD2.19 /SGD1.815 1-mth 3-mth 6-mth 1-yr YTD Absolute (%) 8.5 8.5 8.5 0.9 19.1 Relative (%) 1.1 7.4 1.3 3.3 4.6
SEE APPENDIX I FOR IMPORTANT DISCLOSURES AND ANALYST CERTIFICATIONS
Company Update 18 July 2012
Singapore
Co. Reg No: 198700034E MICA (P) : 099/03/2012
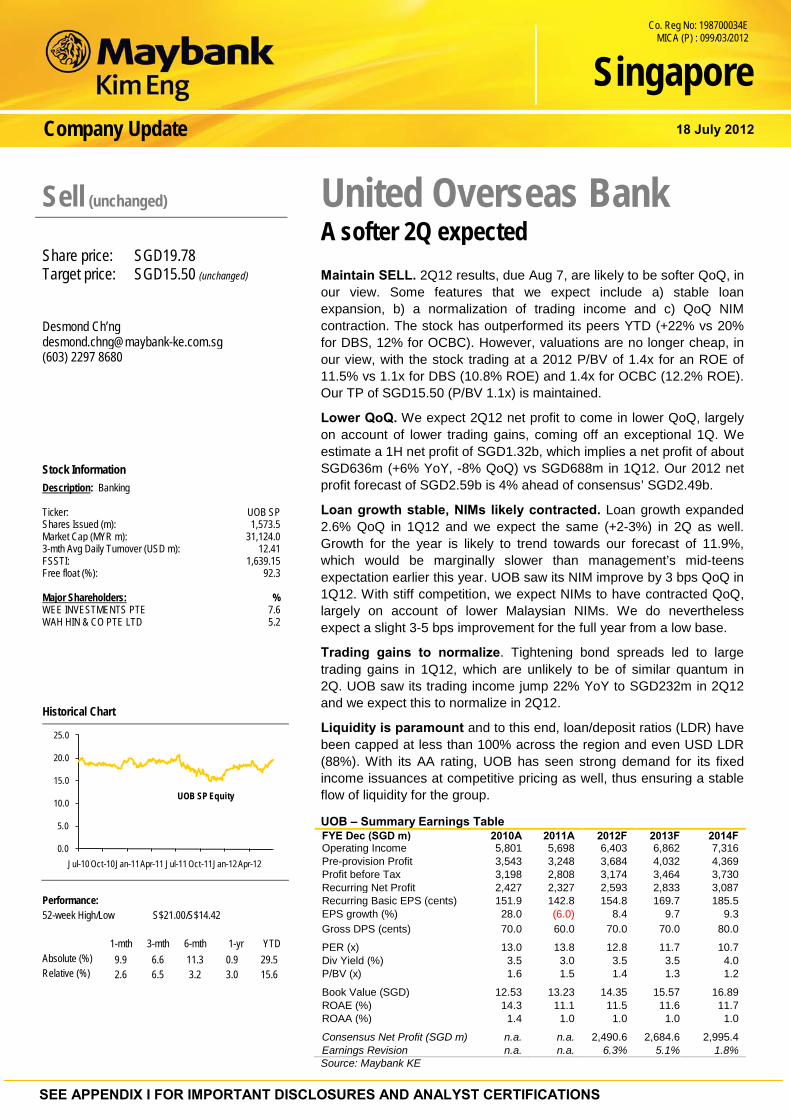
United Overseas Bank A softer 2Q expected
Maintain SELL. 2Q12 results, due Aug 7, are likely to be softer QoQ, in our view. Some features that we expect include a) stable loan expansion, b) a normalization of trading income and c) QoQ NIM contraction. The stock has outperformed its peers YTD (+22% vs 20% for DBS, 12% for OCBC). However, valuations are no longer cheap, in our view, with the stock trading at a 2012 P/BV of 1.4x for an ROE of 11.5% vs 1.1x for DBS (10.8% ROE) and 1.4x for OCBC (12.2% ROE). Our TP of SGD15.50 (P/BV 1.1x) is maintained.
Lower QoQ. We expect 2Q12 net profit to come in lower QoQ, largely on account of lower trading gains, coming off an exceptional 1Q. We estimate a 1H net profit of SGD1.32b, which implies a net profit of about SGD636m (+6% YoY, -8% QoQ) vs SGD688m in 1Q12. Our 2012 net profit forecast of SGD2.59b is 4% ahead of consensus’ SGD2.49b.
Loan growth stable, NIMs likely contracted. Loan growth expanded 2.6% QoQ in 1Q12 and we expect the same (+2-3%) in 2Q as well. Growth for the year is likely to trend towards our forecast of 11.9%, which would be marginally slower than management’s mid-teens expectation earlier this year. UOB saw its NIM improve by 3 bps QoQ in 1Q12. With stiff competition, we expect NIMs to have contracted QoQ, largely on account of lower Malaysian NIMs. We do nevertheless expect a slight 3-5 bps improvement for the full year from a low base.
Trading gains to normalize. Tightening bond spreads led to large trading gains in 1Q12, which are unlikely to be of similar quantum in 2Q. UOB saw its trading income jump 22% YoY to SGD232m in 2Q12 and we expect this to normalize in 2Q12.
Liquidity is paramount and to this end, loan/deposit ratios (LDR) have been capped at less than 100% across the region and even USD LDR (88%). With its AA rating, UOB has seen strong demand for its fixed income issuances at competitive pricing as well, thus ensuring a stable flow of liquidity for the group.
UOB – Summary Earnings Table FYE Dec (SGD m) 2010A 2011A 2012F 2013F 2014F Operating Income 5,801 5,698 6,403 6,862 7,316 Pre-provision Profit 3,543 3,248 3,684 4,032 4,369 Profit before Tax 3,198 2,808 3,174 3,464 3,730 Recurring Net Profit 2,427 2,327 2,593 2,833 3,087 Recurring Basic EPS (cents) 151.9 142.8 154.8 169.7 185.5 EPS growth (%) 28.0 (6.0) 8.4 9.7 9.3 Gross DPS (cents) 70.0 60.0 70.0 70.0 80.0 PER (x) 13.0 13.8 12.8 11.7 10.7 Div Yield (%) 3.5 3.0 3.5 3.5 4.0 P/BV (x) 1.6 1.5 1.4 1.3 1.2 Book Value (SGD) 12.53 13.23 14.35 15.57 16.89 ROAE (%) 14.3 11.1 11.5 11.6 11.7 ROAA (%) 1.4 1.0 1.0 1.0 1.0 Consensus Net Profit (SGD m) n.a. n.a. 2,490.6 2,684.6 2,995.4 Earnings Revision n.a. n.a. 6.3% 5.1% 1.8% Source: Maybank KE
Sell (unchanged) Share price: SGD19.78 Target price: SGD15.50 (unchanged) Desmond Ch’ng [email protected] (603) 2297 8680 Stock Information Description: Banking Ticker: UOB SP Shares Issued (m): 1,573.5 Market Cap (MYR m): 31,124.0 3-mth Avg Daily Turnover (USD m): 12.41 FSSTI: 1,639.15 Free float (%): 92.3 Major Shareholders: % WEE INVESTMENTS PTE 7.6 WAH HIN & CO PTE LTD 5.2
Historical Chart
Performance: 52-week High/Low S$21.00/S$14.42 1-mth 3-mth 6-mth 1-yr YTD Absolute (%) 9.9 6.6 11.3 0.9 29.5 Relative (%) 2.6 6.5 3.2 3.0 15.6
0.0
5.0
10.0
15.0
20.0
25.0
Jul-10 Oct-10Jan-11Apr-11 Jul-11 Oct-11Jan-12Apr-12
UOB SP Equity
SEE APPENDIX I FOR IMPORTANT DISCLOSURES AND ANALYST CERTIFICATIONS
Philippines Company update 18 July 2012
Alliance Global Group Travellers vs aspiring gaming operators
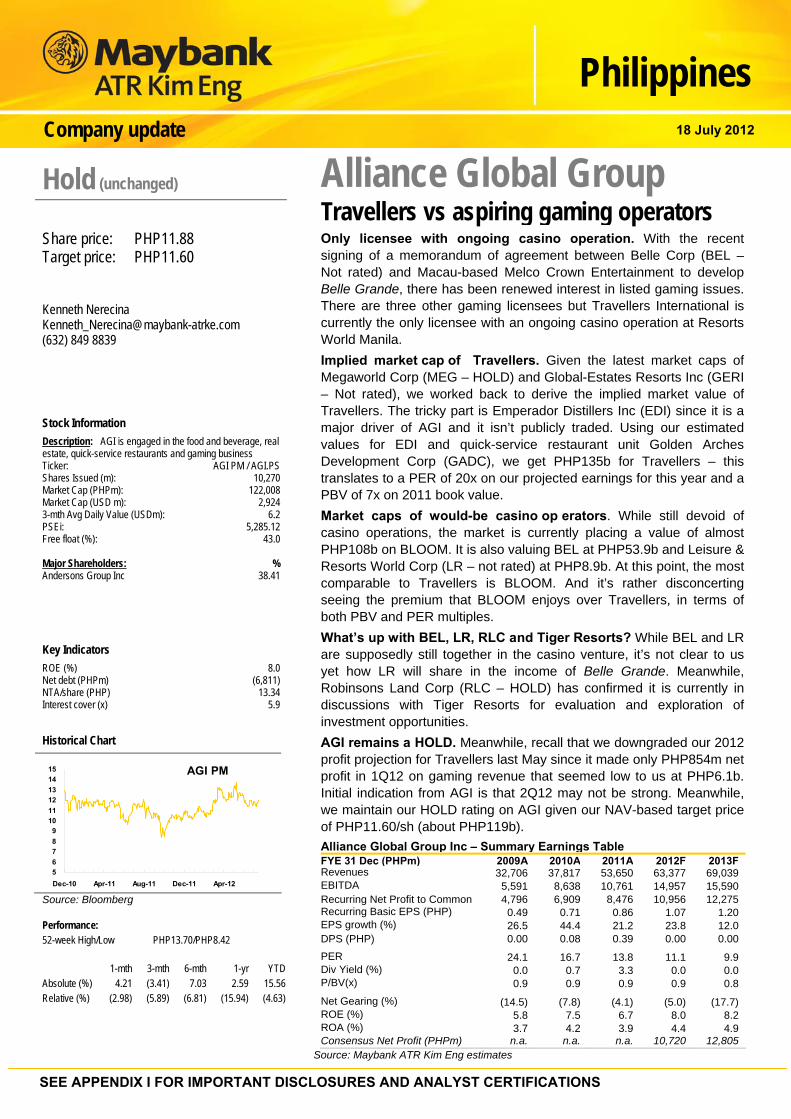
Only licensee with ongoing casino operation. With the recent signing of a memorandum of agreement between Belle Corp (BEL – Not rated) and Macau-based Melco Crown Entertainment to develop Belle Grande, there has been renewed interest in listed gaming issues. There are three other gaming licensees but Travellers International is currently the only licensee with an ongoing casino operation at Resorts World Manila. Implied market cap of Travellers. Given the latest market caps of Megaworld Corp (MEG – HOLD) and Global-Estates Resorts Inc (GERI – Not rated), we worked back to derive the implied market value of Travellers. The tricky part is Emperador Distillers Inc (EDI) since it is a major driver of AGI and it isn’t publicly traded. Using our estimated values for EDI and quick-service restaurant unit Golden Arches Development Corp (GADC), we get PHP135b for Travellers – this translates to a PER of 20x on our projected earnings for this year and a PBV of 7x on 2011 book value. Market caps of would-be casino op erators. While still devoid of casino operations, the market is currently placing a value of almost PHP108b on BLOOM. It is also valuing BEL at PHP53.9b and Leisure & Resorts World Corp (LR – not rated) at PHP8.9b. At this point, the most comparable to Travellers is BLOOM. And it’s rather disconcerting seeing the premium that BLOOM enjoys over Travellers, in terms of both PBV and PER multiples. What’s up with BEL, LR, RLC and Tiger Resorts? While BEL and LR are supposedly still together in the casino venture, it’s not clear to us yet how LR will share in the income of Belle Grande. Meanwhile, Robinsons Land Corp (RLC – HOLD) has confirmed it is currently in discussions with Tiger Resorts for evaluation and exploration of investment opportunities. AGI remains a HOLD. Meanwhile, recall that we downgraded our 2012 profit projection for Travellers last May since it made only PHP854m net profit in 1Q12 on gaming revenue that seemed low to us at PHP6.1b. Initial indication from AGI is that 2Q12 may not be strong. Meanwhile, we maintain our HOLD rating on AGI given our NAV-based target price of PHP11.60/sh (about PHP119b). Alliance Global Group Inc – Summary Earnings Table FYE 31 Dec (PHPm) 2009A 2010A 2011A 2012F 2013FRevenues 32,706 37,817 53,650 63,377 69,039 EBITDA 5,591 8,638 10,761 14,957 15,590 Recurring Net Profit to Common 4,796 6,909 8,476 10,956 12,275 Recurring Basic EPS (PHP) 0.49 0.71 0.86 1.07 1.20 EPS growth (%) 26.5 44.4 21.2 23.8 12.0 DPS (PHP) 0.00 0.08 0.39 0.00 0.00 PER 24.1 16.7 13.8 11.1 9.9 Div Yield (%) 0.0 0.7 3.3 0.0 0.0 P/BV(x) 0.9 0.9 0.9 0.9 0.8 Net Gearing (%) (14.5) (7.8) (4.1) (5.0) (17.7) ROE (%) 5.8 7.5 6.7 8.0 8.2 ROA (%) 3.7 4.2 3.9 4.4 4.9 Consensus Net Profit (PHPm) n.a. n.a. n.a. 10,720 12,805
Source: Maybank ATR Kim Eng estimates
Hold (unchanged) Share price: PHP11.88 Target price: PHP11.60 Kenneth Nerecina [email protected] (632) 849 8839
Stock Information Description: AGI is engaged in the food and beverage, real estate, quick-service restaurants and gaming business Ticker: AGI PM / AGI.PS Shares Issued (m): 10,270 Market Cap (PHPm): 122,008 Market Cap (USD m): 2,924 3-mth Avg Daily Value (USDm): 6.2 PSEi: 5,285.12 Free float (%): 43.0 Major Shareholders: % Andersons Group Inc 38.41 Key Indicators
ROE (%) 8.0 Net debt (PHPm) (6,811) NTA/share (PHP) 13.34 Interest cover (x) 5.9
Historical Chart
AGI PM
56789
101112131415
Dec-10 Apr-11 Aug-11 Dec-11 Apr-12 Source: Bloomberg Performance: 52-week High/Low PHP13.70/PHP8.42 1-mth 3-mth 6-mth 1-yr YTD Absolute (%) 4.21 (3.41) 7.03 2.59 15.56 Relative (%) (2.98) (5.89) (6.81) (15.94) (4.63)
SEE APPENDIX I FOR IMPORTANT DISCLOSURES AND ANALYST CERTIFICATIONS
Economics 18 July 2012
PP16832/01/2013 (031128)
Singapore
Lift from pharmaceuticals NODX growth picked up the pace in Jun 2012 to +6.8% YoY (May 2012: +3.2% YoY; Consensus: +2.0% YoY) largely thanks to the increased shipments of pharmaceuticals. From the previous month, the seasonally adjusted NODX expanded by +6.7% (May 2012: -2.0% MoM). However, growth slowed in 2Q 2012 to +3.9% YoY from +6.1% YoY in 1Q 2012, reflecting deteriorating global economic – and hence external demand / trade conditions – amid worsening Eurozone crisis, US growth deceleration and China’s slowdown. For the first six months of this year, NODX was up by +5.0% YoY (1H 2011: +6.8% YoY).
Chemicals exports growth hits double digits on “drugs”. Growth within the segment came in at +10.0% YoY in Jun 2012 (May 2012: +3.7% YoY) led by its biggest component, Pharmaceuticals which jumped to +24.5% YoY (May 2012: +0.2% YoY). Petrochemicals on the other hand fell -7.8% YoY (May 2012: +6.7% YoY) amid weaker global economic growth. In 1H 2012, Pharmaceutical exports were up by +19.9% YoY (1H 2011: +21.4% YoY) while shipments of Petrochemicals were down by -5.9% YoY (1H 2011: +9.2% YoY).
Electronics exports continued to register growth albeit at a slower pace. Shipments of Electronic products gained by +1.6% YoY in Jun 2012 compared to +3.9% YoY recorded a month earlier. Within the electronics segment, there was a surge in growth for PC’s (Jun 2012: +51.3% YoY; May 2012: +15.7% YoY), Other Computer Peripherals (Jun 2012: +40.5% YoY; May 2012: +6.5% YoY) and Resistors (Jun 2012: +36.7% YoY; May 2012: +9.8% YoY) which countered the lower shipments of Printers (Jun 2012: -53.6% YoY; May 2012: -66.6% YoY) and Office Machines (Jun 2012: -40.1% YoY; May 2012: -38.4% YoY).
Breakdown by markets yielded a m ixed bag. Export destinations that recorded faster growth in June 2012 included HK, Indonesia, EU, India and Taiwan. Shipments to Hong Kong surged by +41.4% YoY (May 2012: +22.6% YoY) on higher exports of IC’s (+26.0% YoY), specialized machinery (+154% YoY) and PC’s (+345% YoY). Despite the problems in the Eurozone, exports to the EU which had been weak over the preceding three months picked up to +17.0% YoY (May 2012: +1.5% YoY), propelled by increased shipments of Pharmaceuticals (+45% YoY), measuring instruments (+80% YoY) and PC’s (+133% YoY). NODX to Indonesia sustained its double-digit growth (Jun 2012: +19.7% YoY; May 2012: +15.8% YoY), reflecting strong domestic demand in terms of consumer and business spending as per the higher demand for ships, boats & motorcycles (+640% YoY) and specialized machinery (+72% YoY). Exports to India and Taiwan accelerated to +6.7% YoY and +12.5% YoY last month respectively from +0.7% YoY and +5.5% YoY in May 2012.
However, NODX to several key markets were down, namely China (Jun 2012: -3.2% YoY; May 2012: -0.8% YoY) which posted the sixth month of contractions over the past eight months, and US (Jun 2012: -2.0% YoY; May 2012: -11.4% YoY) which recorded the third straight month of decline.
Non-Oil Domestic Exports (NODX) Suhaimi Ilias [email protected] (603) 2297 8682 Ramesh Lankanathan [email protected] (603) 2297 8685 William Poh [email protected] (603) 2297 8683
18 July 2012 Page 2 of 8
Singapore NODX, June ‘12
Meanwhile, exports to South Korea has decelerated sharply to just 5.1% YoY from 15.1% YoY in May 2012 and the average of 39% YoY in Jan-Apr 2012 amid volatile trends in exports to Japan (Jun 2012: +7.8% YoY; May 2012: -5.7% YoY) and Malaysia (Jun 2012: 0% YoY; May 2012: +4.8% YoY).
Maintain our 2012 NODX growth forecast of +3.8%. The aforementioned mixed – rather than clear-cut positive or negative – trends in NODX to the key trading partners suggest that growth this year is likely to moderate rather than contract amid a more challenging global economic environment. Meanwhile, short-term leading export indicators suggest sustained growth in NODX, supported by non-electronics exports amid volatile electronics shipments as the PMI new manufacturing new export orders edged up to 51.1 in Jun 2012 from 50.8 in May 2012, while the sub-index for new electronics export orders dipped to 49.2 from 51.6 over the same period. Therefore, we maintained our projection of continued low single-digit NODX growth of +3.8% in 2012 (2011: +2.2%). International Enterprise (IE) Singapore forecasts NODX growth to be between 3% and 5% in 2012.
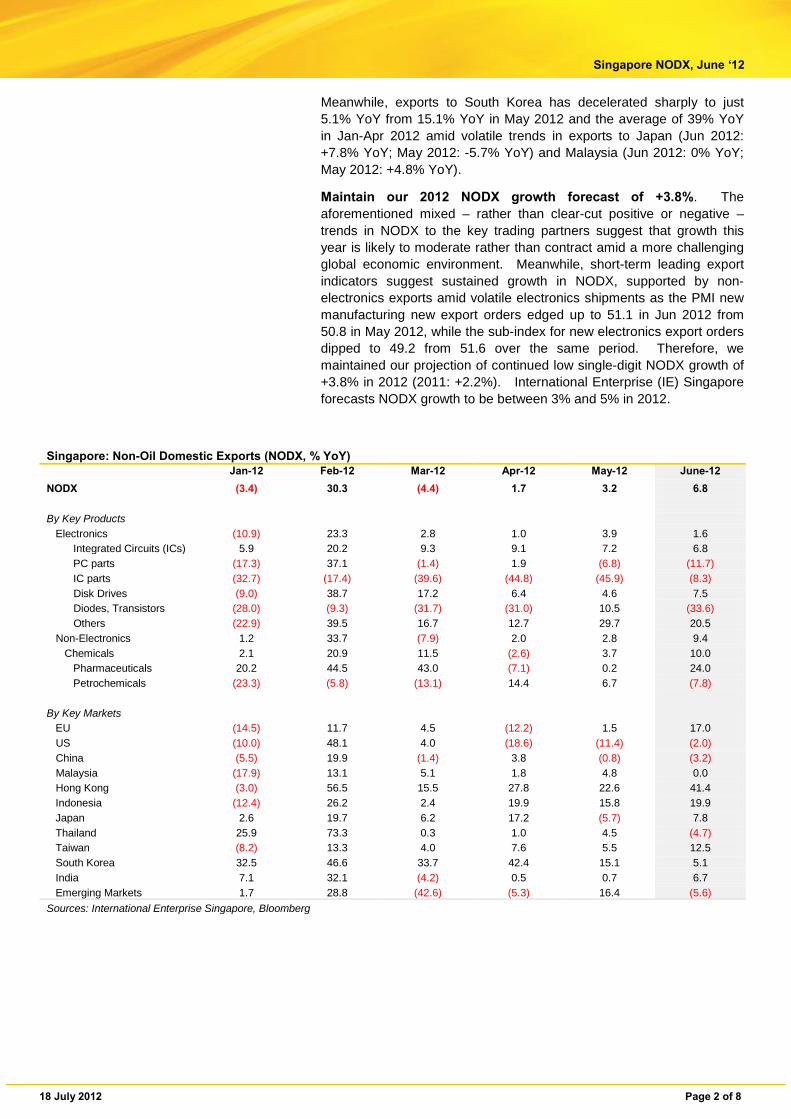
Singapore: Non-Oil Domestic Exports (NODX, % YoY) Jan-12 Feb-12 Mar-12 Apr-12 May-12 June-12
NODX (3.4) 30.3 (4.4) 1.7 3.2 6.8 By Key Products Electronics (10.9) 23.3 2.8 1.0 3.9 1.6 Integrated Circuits (ICs) 5.9 20.2 9.3 9.1 7.2 6.8 PC parts (17.3) 37.1 (1.4) 1.9 (6.8) (11.7) IC parts (32.7) (17.4) (39.6) (44.8) (45.9) (8.3) Disk Drives (9.0) 38.7 17.2 6.4 4.6 7.5 Diodes, Transistors (28.0) (9.3) (31.7) (31.0) 10.5 (33.6) Others (22.9) 39.5 16.7 12.7 29.7 20.5 Non-Electronics 1.2 33.7 (7.9) 2.0 2.8 9.4 Chemicals 2.1 20.9 11.5 (2.6) 3.7 10.0 Pharmaceuticals 20.2 44.5 43.0 (7.1) 0.2 24.0 Petrochemicals (23.3) (5.8) (13.1) 14.4 6.7 (7.8) By Key Markets EU (14.5) 11.7 4.5 (12.2) 1.5 17.0 US (10.0) 48.1 4.0 (18.6) (11.4) (2.0) China (5.5) 19.9 (1.4) 3.8 (0.8) (3.2) Malaysia (17.9) 13.1 5.1 1.8 4.8 0.0 Hong Kong (3.0) 56.5 15.5 27.8 22.6 41.4 Indonesia (12.4) 26.2 2.4 19.9 15.8 19.9 Japan 2.6 19.7 6.2 17.2 (5.7) 7.8 Thailand 25.9 73.3 0.3 1.0 4.5 (4.7) Taiwan (8.2) 13.3 4.0 7.6 5.5 12.5 South Korea 32.5 46.6 33.7 42.4 15.1 5.1 India 7.1 32.1 (4.2) 0.5 0.7 6.7 Emerging Markets 1.7 28.8 (42.6) (5.3) 16.4 (5.6) Sources: International Enterprise Singapore, Bloomberg
18 July 2012 Page 3 of 8
Singapore NODX, June ‘12
Singapore: Non-Oil Domestic Exports (NODX) Singapore NODX: Electronics & Non-Electronics (% YoY)
(40)
(30)
(20)
(10)
0
10
20
30
40
Jan
-08
Mar
-08
May
-08
Jul -
08S
ep-0
8N
ov-
08Ja
n-0
9M
ar-0
9M
ay-0
9Ju
l-09
Sep
-09
No
v-09
Jan
-10
Mar
-10
May
-10
Jul-
10S
ep-1
0N
ov-
10Ja
n-1
1M
ar-1
1M
ay-1
1Ju
l-11
Sep
-11
No
v-11
Jan
-12
Mar
-12
May
-12
3MMA % YoY
(50)(40)(30)(20)(10)
0 10 20 30 40 50
Jan
-08
Mar
-08
May
-08
Jul-
08S
ep-0
8N
ov-
08Ja
n-0
9M
ar-0
9M
ay-0
9Ju
l-09
Sep
-09
No
v-09
Jan
-10
Mar
-10
May
-10
Jul-
10S
ep-1
0N
ov-
10Ja
n-1
1M
ar-1
1M
ay-1
1Ju
l-11
Sep
-11
No
v-11
Jan
-12
Mar
-12
May
-12
NODX: Electronics NODX: Non-Electronics Source: CEIC, Maybank KE Source: CEIC
Electronic Exports: Contribution to growth by Categories (ppts)
Singapore PMI for New Exports Orders
(5.0)(4.0)(3.0)(2.0)(1.0)0.0 1.0 2.0 3.0 4.0 5.0
ICs
Part
s of
PC
Part
s of
ICs
Dis
k D
rive
s
Dio
des,
Tra
nsis
tors
Oth
ers
Apr-12 May-12 Jun-12
35
40
45
50
55
60
65
Jan-
07Ap
r-07
Jul-0
7O
ct-0
7Ja
n-08
Apr-
08Ju
l-08
Oct
-08
Jan-
09Ap
r-09
Jul-0
9O
ct-0
9Ja
n-10
Apr-
10Ju
l-10
Oct
-10
Jan-
11Ap
r-11
Jul-1
1O
ct-1
1Ja
n-12
Apr-
12
Purchasing Manager Index: Mfg: New Export OrdersPurchasing Manager Index: Mfg: Electronics: New Export Orders
Source: CEIC, Maybank KE Source: CEIC
18 July 2012 Page 4 of 8
Singapore NODX, June ‘12
Global: Export Growth (% YoY, in USD)
% YoY Feb-12 Mar -12 Apr -12 May -12 June -12 2011 YTD 2012 YTD 2011
Global Trade 12.6 3.3 0.3 1.2 - 19.3 3.8 24.6
US 12.3 6.4 3.0 5.9 - 16.5 6.9 19.7
EU 7.6 (1.8) (5.5) (9.1) - 19.7 (1.1) 28.5
Germany 5.0 (5.5) (7.8) (13.5) - 18.1 (4.0) 26.0
Japan (1.7) 6.1 9.8 14.1 - 6.5 5.0 8.3
UK (1.8) 5.8 (5.0) (4.3) - 17.1 (0.5) 24.9
Canada 9.8 3.1 2.2 (2.2) - 18.7 4.2 19.1
Mexico 10.5 16.3 3.4 11.6 6.7 19.4 9.2 23.8
Australia 12.9 (2.9) (2.9) (8.0) - 28.7 1.4 36.5
China 18.3 8.8 4.9 15.3 11.2 20.3 9.2 24.0
Russia 16.6 6.8 (2.2) 1.8 - 30.2 9.0 29.2
India 4.2 (5.7) 3.2 (4.2) - 34.1 1.0 46.9
Brazil 7.7 8.4 (3.0) 0.0 (18.3) 26.8 (0.9) 32.6
S. Korea 20.4 (1.5) (5.0) (0.8) 1.1 19.0 0.6 23.6
Taiwan 10.2 (3.3) (6.5) (6.4) (3.2) 12.3 (4.8) 16.9
Singapore 27.2 (2.1) 0.3 (1.0) (3.5) 16.4 3.5 23.3
Singapore (NODX) 32.8 (4.1) 0.5 (1.1) 3.5 10.6 4.2 19.3
Hong Kong 14.5 (6.6) 5.8 5.4 - 10.0 1.6 16.8
Malaysia 16.5 (1.3) (2.2) 1.2 - 14.0 2.5 16.1
Thailand 1.2 (6.7) (3.5) 6.7 - 16.4 (1.7) (24.7)
Indonesia 8.9 5.4 (2.3) (8.5) - 29.0 1.5 33.3
Vietnam 67.5 33.7 15.5 21.1 35.3 34.4 25.5 31.8
Philippines 12.8 (0.8) 7.6 19.7 - (6.2) 8.4 8.0 Source: Bloomberg, CEIC
18 July 2012
Regional Daily
RESEARCH OFFICES REGIONAL
P K BASU Regional Head, Research & Economics (65) 6432 1821 [email protected]
WONG Chew Hann, CA Acting Regional Head of Institutional Research (603) 2297 8686 [email protected]
THAM Mun Hon Regional Strategist (852) 2268 0630 [email protected]
ONG Seng Yeow Regional Products & Planning (852) 2268 0644 [email protected]
ECONOMICS Suhaimi ILIAS Chief Economist Singapore | Malaysia (603) 2297 8682 [email protected]
Luz LORENZO Economist Philippines | Indonesia (63) 2 849 8836 [email protected]
MALAYSIA WONG Chew Hann, CA Head of Research (603) 2297 8686 [email protected] Strategy Construction & Infrastructure Desmond CH’NG, ACA (603) 2297 8680 [email protected] Banking - Regional LIAW Thong Jung (603) 2297 8688 [email protected] Oil & Gas Automotive Shipping ONG Chee Ting (603) 2297 8678 [email protected] Plantations Mohshin AZIZ (603) 2297 8692 [email protected] Aviation Petrochem Power YIN Shao Yang, CPA (603) 2297 8916 [email protected] Gaming – Regional Media Power WONG Wei Sum, CFA (603) 2297 8679 [email protected] Property & REITs LEE Yen Ling (603) 2297 8691 [email protected] Building Materials Manufacturing Technology
LEE Cheng Hooi Head of Retail [email protected] Technicals
HONG KONG / CHINA Edward FUNG Head of Research (852) 2268 0632 [email protected] Construction Ivan CHEUNG (852) 2268 0634 [email protected] Property Industrial Ivan LI (852) 2268 0641 [email protected] Banking & Finance Jacqueline KO (852) 2268 0633 [email protected] Consumer Staples Andy POON (852) 2268 0645 [email protected] Telecom & equipment Alex YEUNG (852) 2268 0636 [email protected] Industrial Jacky WONG, CFA (852) 2268 0107 [email protected] Special Situations Quants Anita HWANG, CFA (852) 2268 0142 [email protected] Consumer Discretionaries Special Situations
INDIA Jigar SHAH Head of Research (91) 22 6623 2601 [email protected] Oil & Gas Automobile Cement Anubhav GUPTA (91) 22 6623 2605 [email protected] Metal & Mining Capital goods Property Haripreet BATRA (91) 226623 2606 [email protected] Software Media Ganesh RAM (91) 226623 2607 [email protected] Telecom Contractor Darpin SHAH (91) 226623 2610 [email protected] Banking & Financial Services Gagan KWATRA (91 )226623 2612 [email protected] Small Cap
SINGAPORE Stephanie WONG Head of Research (65) 6432 1451 [email protected] Strategy Small & Mid Caps Gregory YAP (65) 6432 1450 [email protected] Technology & Manufacturing Telcos - Regional Wilson LIEW (65) 6432 1454 [email protected] Hotel & Resort Property & Construction James KOH (65) 6432 1431 [email protected] Logistics Resources Consumer Small & Mid Caps YEAK Chee Keong, CFA (65) 6433 5730 [email protected] Healthcare Offshore & Marine Alison FOK (65) 6433 5745 [email protected] Services S-chips Bernard CHIN (65) 6433 5726 [email protected] Transport (Land, Shipping & Aviation) ONG Kian Lin (65) 6432 1470 [email protected] REITs / Property WeiBin (65) 6432 1455 [email protected] S-chips Small & Mid Caps
INDONESIA Katarina SETIAWAN Head of Research (62) 21 2557 1125 [email protected] Consumer Strategy Telcos Lucky ARIESANDI, CFA (62) 21 2557 1127 [email protected] Base metals Coal Oil & Gas Rahmi MARINA (62) 21 2557 1128 [email protected] Banking Multifinance Pandu ANUGRAH (62) 21 2557 1137 [email protected] Auto Heavy equipment Plantation Toll road Adi N. WICAKSONO (62) 21 2557 1130 [email protected] Generalist Anthony YUNUS (62) 21 2557 1134 [email protected] Cement Infrastructure Property Arwani PRANADJAYA (62) 21 2557 1129 [email protected] Technicals
PHILIPPINES Luz LORENZO Head of Research +63 2 849 8836 [email protected] Strategy Laura DY-LIACCO (63) 2 849 8840 [email protected] Utilities Conglomerates Telcos Lovell SARREAL (63) 2 849 8841 [email protected] Consumer Media Cement Mining Kenneth NERECINA (63) 2 849 8839 [email protected] Conglomerates Property Ports/ Logistics Katherine TAN (63) 2 849 8843 [email protected] Banks Construction Ramon ADVIENTO (63) 2 849 8842 [email protected] Mining
THAILAND Mayuree CHOWVIKRAN Head of Research (66) 2658 6300 ext 1440 [email protected] Strategy
Maria BRENDA SANCHEZ LAPIZ Co-Head of Research Dir (66) 2257 0250 | (66) 2658 6300 ext 1399 [email protected]
Andrew STOTZ Strategist (66) 2658 6300 ext 5091 [email protected]
Suttatip PEERASUB (66) 2658 6300 ext 1430 [email protected] Media Commerce Sutthichai KUMWORACHAI (66) 2658 6300 ext 1400 [email protected] Energy Petrochem Termporn TANTIVIVAT (66) 2658 6300 ext 1520 [email protected] Property Woraphon WIROONSRI (66) 2658 6300 ext 1560 [email protected] Banking & Finance Jaroonpan WATTANAWONG (66) 2658 6300 ext 1404 [email protected] Transportation Small cap. Suchot THIRAWANNARAT (66) 2658 6300 ext 1550 [email protected] Automotive Construction Materials Soft commodity
VIETNAM Michael KOKALARI, CFA Head of Research +84 838 38 66 47 [email protected] Strategy Nguyen Thi Ngan Tuyen +84 844 55 58 88 x 8081 [email protected] Food and Beverage Oil and Gas Ngo Bich Van +84 844 55 58 88 x 8084 [email protected] Banking Nguyen Quang Duy +84 844 55 58 88 x 8082 [email protected] Rubber Dang Thi Kim Thoa +84 844 55 58 88 x 8083 [email protected] Consumer Nguyen Trung Hoa +84 844 55 58 88 x 8088 [email protected] Steel Sugar Macro
18 July 2012
Regional Daily
APPENDIX I: TERMS FOR PROVISION OF REPORT, DISCLAIMERS AND DISCLOSURES DISCLAIMERS This research report is prepared for general circulation and for information purposes only and under no circumstances should it be considered or intended as an offer to sell or a solicitation of an offer to buy the securities referred to herein. Investors should note that values of such securities, if any, may fluctuate and that each security’s price or value may rise or fall. Opinions or recommendations contained herein are in form of technical ratings and fundamental ratings. Technical ratings may differ from fundamental ratings as technical valuations apply different methodologies and are purely based on price and volume-related information extracted from the relevant jurisdiction’s stock exchange in the equity analysis. Accordingly, investors’ returns may be less than the original sum invested. Past performance is not necessarily a guide to future performance. This report is not intended to provide personal investment advice and does not take into account the specific investment objectives, the financial situation and the particular needs of persons who may receive or read this report. Investors should therefore seek financial, legal and other advice regarding the appropriateness of investing in any securities or the investment strategies discussed or recommended in this report. The information contained herein has been obtained from sources believed to be reliable but such sources have not been independently verified by Maybank Investment Bank Berhad, its subsidiary and affiliates (collectively, “MKE”) and consequently no representation is made as to the accuracy or completeness of this report by MKE and it should not be relied upon as such. Accordingly, MKE and its officers, directors, associates, connected parties and/or employees (collectively, “Representatives”) shall not be liable for any direct, indirect or consequential losses or damages that may arise from the use or reliance of this report. Any information, opinions or recommendations contained herein are subject to change at any time, without prior notice. This report may contain forward looking statements which are often but not always identified by the use of words such as “anticipate”, “believe”, “estimate”, “intend”, “plan”, “expect”, “forecast”, “predict” and “project” and statements that an event or result “may”, “will”, “can”, “should”, “could” or “might” occur or be achieved and other similar expressions. Such forward looking statements are based on assumptions made and information currently available to us and are subject to certain risks and uncertainties that could cause the actual results to differ materially from those expressed in any forward looking statements. Readers are cautioned not to place undue relevance on these forward-looking statements. MKE expressly disclaims any obligation to update or revise any such forward looking statements to reflect new information, events or circumstances after the date of this publication or to reflect the occurrence of unanticipated events. MKE and its officers, directors and employees, including persons involved in the preparation or issuance of this report, may, to the extent permitted by law, from time to time participate or invest in financing transactions with the issuer(s) of the securities mentioned in this report, perform services for or solicit business from such issuers, and/or have a position or holding, or other material interest, or effect transactions, in such securities or options thereon, or other investments related thereto. In addition, it may make markets in the securities mentioned in the material presented in this report. MKE may, to the extent permitted by law, act upon or use the information presented herein, or the research or analysis on which they are based, before the material is published. One or more directors, officers and/or employees of MKE may be a director of the issuers of the securities mentioned in this report. This report is prepared for the use of MKE’s clients and may not be reproduced, altered in any way, transmitted to, copied or distributed to any other party in whole or in part in any form or manner without the prior express written consent of MKE and MKE and its Representatives accepts no liability whatsoever for the actions of third parties in this respect. This report is not directed to or intended for distribution to or use by any person or entity who is a citizen or resident of or located in any locality, state, country or other jurisdiction where such distribution, publication, availability or use would be contrary to law or regulation. This report is for distribution only under such circumstances as may be permitted by applicable law. The securities described herein may not be eligible for sale in all jurisdictions or to certain categories of investors. Without prejudice to the foregoing, the reader is to note that additional disclaimers, warnings or qualifications may apply based on geographical location of the person or entity receiving this report. Malaysia Opinions or recommendations contained herein are in the form of technical ratings and fundamental ratings. Technical ratings may differ from fundamental ratings as technical valuations apply different methodologies and are purely based on price and volume-related information extracted from Bursa Malaysia Securities Berhad in the equity analysis. Singapore
This report has been produced as of the date hereof and the information herein may be subject to change. Maybank Kim Eng Research Pte. Ltd. (“Maybank KERPL”) in Singapore has no obligation to update such information for any recipient. For distribution in Singapore, recipients of this report are to contact Maybank KERPL in Singapore in respect of any matters arising from, or in connection with, this report. If the recipient of this report is not an accredited investor, expert investor or institutional investor (as defined under Section 4A of the Singapore Securities and Futures Act), Maybank KERPL shall be legally liable for the contents of this report, with such liability being limited to the extent (if any) as permitted by law. Thailand The disclosure of the survey result of the Thai Institute of Directors Association (“IOD”) regarding corporate governance is made pursuant to the policy of the Office of the Securities and Exchange Commission. The survey of the IOD is based on the information of a company listed on the Stock Exchange of Thailand and the market for Alternative Investment disclosed to the public and able to be accessed by a general public investor. The result, therefore, is from the perspective of a third party. It is not an evaluation of operation and is not based on inside information. The survey result is as of the date appearing in the Corporate Governance Report of Thai Listed Companies. As a result, the survey may be changed after that date. Maybank Kim Eng Securities (Thailand) Public Company Limited (“MBKET”) does not confirm nor certify the accuracy of such survey result. Except as specifically permitted, no part of this presentation may be reproduced or distributed in any manner without the prior written permission of MBKET. MBKET accepts no liability whatsoever for the actions of third parties in this respect. US
This research report prepared by MKE is distributed in the United States (“US”) to Major US Institutional Investors (as defined in Rule 15a-6 under the Securities Exchange Act of 1934, as amended) only by Maybank Kim Eng Securities USA Inc (“Maybank KESUSA”), a broker-dealer registered in the US (registered under Section 15 of the Securities Exchange Act of 1934, as amended). All responsibility for the distribution of this report by Maybank KESUSA in the US shall be borne by Maybank KESUSA. All resulting transactions by a US person or entity should be effected through a registered broker-dealer in the US. This report is not directed at you if MKE is prohibited or restricted by any legislation or regulation in any jurisdiction from making it available to you. You should satisfy yourself before reading it that Maybank KESUSA is permitted to provide research material concerning investments to you under relevant legislation and regulations. UK This document is being distributed by Maybank Kim Eng Securities (London) Ltd (“Maybank KESL”) which is authorized and regulated, by the Financial Services Authority and is for Informational Purposes only. This document is not intended for distribution to anyone defined as a Retail Client under the Financial Services and Markets Act 2000 within the UK. Any inclusion of a third party link is for the recipients convenience only, and that the firm does not take any responsibility for its comments or accuracy, and that access to such links is at the individuals own risk. Nothing in this report should be considered as constituting legal, accounting or tax advice, and that for accurate guidance recipients should consult with their own independent tax advisers.
18 July 2012
Regional Daily
DISCLOSURES Legal Entities Disclosures Malaysia: This report is issued and distributed in Malaysia by Maybank Investment Bank Berhad (15938-H) which is a Participating Organization of Bursa Malaysia Berhad and a holder of Capital Markets and Services License issued by the Securities Commission in Malaysia. Singapore: This material is issued and distributed in Singapore by Maybank KERPL (Co. Reg No 197201256N) which is regulated by the Monetary Authority of Singapore. Indonesia: PT Kim Eng Securities (“PTKES”) (Reg. No. KEP-251/PM/1992) is a member of the Indonesia Stock Exchange and is regulated by the BAPEPAM LK. Thailand: MBKET (Reg. No.0107545000314) is a member of the Stock Exchange of Thailand and is regulated by the Ministry of Finance and the Securities and Exchange Commission. Philippines: MATRKES (Reg. No.01-2004-00019) is a member of the Philippines Stock Exchange and is regulated by the Securities and Exchange Commission. Vietnam: Kim Eng Vietnam Securities Company (“KEVS”) (License Number: 71/UBCK-GP) is licensed under the State Securities Commission of Vietnam. Hong Kong: KESHK (Central Entity No AAD284) is regulated by the Securities and Futures Commission. India: Kim Eng Securities India Private Limited (“KESI”) is a participant of the National Stock Exchange of India Limited (Reg No: INF/INB 231452435) and the Bombay Stock Exchange (Reg. No. INF/INB 011452431) and is regulated by Securities and Exchange Board of India. KESI is also registered with SEBI as Category 1 Merchant Banker (Reg. No. INM 000011708) US: Maybank KESUSA is a member of/ and is authorized and regulated by the FINRA – Broker ID 27861. UK: Maybank KESL (Reg No 2377538) is authorized and regulated by the Financial Services Authority. Disclosure of Interest Malaysia: MKE and its Representatives may from time to time have positions or be materially interested in the securities referred to herein and may further act as market maker or may have assumed an underwriting commitment or deal with such securities and may also perform or seek to perform investment banking services, advisory and other services for or relating to those companies. Singapore: As of 18 July 2012, Maybank KERPL and the covering analyst do not have any interest in any companies recommended in this research report. Thailand: MBKET may have a business relationship with or may possibly be an issuer of derivative warrants on the securities /companies mentioned in the research report. Therefore, Investors should exercise their own judgment before making any investment decisions. MBKET, its associates, directors, connected parties and/or employees may from time to time have interests and/or underwriting commitments in the securities mentioned in this report. Hong Kong: KESHK may have financial interests in relation to an issuer or a new listing applicant referred to as defined by the requirements under Paragraph 16.5(a) of the Hong Kong Code of Conduct for Persons Licensed by or Registered with the Securities and Futures Commission.
As of 18 July 2012, KESHK and the authoring analyst do not have any interest in any companies recommended in this research report.
MKE may have, within the last three years, served as manager or co-manager of a public offering of securities for, or currently may make a primary market in issues of, any or all of the entities mentioned in this report or may be providing, or have provided within the previous 12 months, significant advice or investment services in relation to the investment concerned or a related investment. OTHERS Analyst Certification of Independence The views expressed in this research report accurately reflect the analyst’s personal views about any and all of the subject securities or issuers; and no part of the research analyst’s compensation was, is or will be, directly or indirectly, related to the specific recommendations or views expressed in the report. Reminder Structured securities are complex instruments, typically involve a high degree of risk and are intended for sale only to sophisticated investors who are capable of understanding and assuming the risks involved. The market value of any structured security may be affected by changes in economic, financial and political factors (including, but not limited to, spot and forward interest and exchange rates), time to maturity, market conditions and volatility and the credit quality of any issuer or reference issuer. Any investor interested in purchasing a structured product should conduct its own analysis of the product and consult with its own professional advisers as to the risks involved in making such a purchase. No part of this material may be copied, photocopied or duplicated in any form by any means or redistributed without the prior consent of MKE.
Definition of Ratings Maybank Kim Eng Research uses the following rating system: BUY Total return is expected to be above 15% in the next 12 months HOLD Total return is expected to be between -15% to +15% in the next 12 months SELL Total return is expected to be below -15% in the next 12 months
Applicability of Ratings The respective analyst maintains a coverage universe of stocks, the list of which may be adjusted according to needs. Investment ratings are only applicable to the stocks which form part of the coverage universe. Reports on companies which are not part of the coverage do not carry investment ratings as we do not actively follow developments in these companies.
Some common terms abbreviated in this report (where they appear): Adex = Advertising Expenditure FCF = Free Cashflow PE = Price Earnings BV = Book Value FV = Fair Value PEG = PE Ratio To Growth CAGR = Compounded Annual Growth Rate FY = Financial Year PER = PE Ratio Capex = Capital Expenditure FYE = Financial Year End QoQ = Quarter-On-Quarter CY = Calendar Year MoM = Month-On-Month ROA = Return On Asset DCF = Discounted Cashflow NAV = Net Asset Value ROE = Return On Equity DPS = Dividend Per Share
NTA = Net Tangible Asset ROSF = Return On Shareholders’ Funds EBIT = Earnings Before Interest And Tax P = Price WACC = Weighted Average Cost Of Capital EBITDA = EBIT, Depreciation And Amortisation P.A. = Per Annum YoY = Year-On-Year EPS = Earnings Per Share PAT = Profit After Tax YTD = Year-To-Date EV = Enterprise Value PBT = Profit Before Tax
18 July 2012
Regional Daily
Malaysia Maybank Investment Bank Berhad (A Participating Organisation of Bursa Malaysia Securities Berhad) 33rd Floor, Menara Maybank, 100 Jalan Tun Perak, 50050 Kuala Lumpur Tel: (603) 2059 1888; Fax: (603) 2078 4194
Singapore Maybank Kim Eng Securities Pte Ltd Maybank Kim Eng Research Pte Ltd 9 Temasek Boulevard #39-00 Suntec Tower 2 Singapore 038989 Tel: (65) 6336 9090 Fax: (65) 6339 6003
London Maybank Kim Eng Securities (London) Ltd 6/F, 20 St. Dunstan’s Hill London EC3R 8HY, UK Tel: (44) 20 7621 9298 Dealers’ Tel: (44) 20 7626 2828 Fax: (44) 20 7283 6674
New York Maybank Kim Eng Securities USA Inc 777 Third Avenue, 21st Floor New York, NY 10017, U.S.A. Tel: (212) 688 8886 Fax: (212) 688 3500
Stockbroking Business: Level 8, Tower C, Dataran Maybank, No.1, Jalan Maarof 59000 Kuala Lumpur Tel: (603) 2297 8888 Fax: (603) 2282 5136
Hong Kong Kim Eng Securities (HK) Ltd Level 30, Three Pacific Place, 1 Queen’s Road East, Hong Kong Tel: (852) 2268 0800 Fax: (852) 2877 0104
Indonesia PT Kim Eng Securities Plaza Bapindo Citibank Tower 17th Floor Jl Jend. Sudirman Kav. 54-55 Jakarta 12190, Indonesia
Tel: (62) 21 2557 1188 Fax: (62) 21 2557 1189
India Kim Eng Securities India Pvt Ltd 2nd Floor, The International 16, Maharishi Karve Road, Churchgate Station, Mumbai City - 400 020, India Tel: (91).22.6623.2600 Fax: (91).22.6623.2604
Philippines Maybank ATR Kim Eng Securities Inc. 17/F, Tower One & Exchange Plaza Ayala Triangle, Ayala Avenue Makati City, Philippines 1200 Tel: (63) 2 849 8888 Fax: (63) 2 848 5738
Thailand Maybank Kim Eng Securities (Thailand) Public Company Limited 999/9 The Offices at Central World, 20th - 21st Floor, Rama 1 Road Pathumwan, Bangkok 10330, Thailand Tel: (66) 2 658 6817 (sales) Tel: (66) 2 658 6801 (research)
Vietnam In association with Kim Eng Vietnam Securities Company 1st Floor, 255 Tran Hung Dao St. District 1 Ho Chi Minh City, Vietnam Tel : (84) 838 38 66 36 Fax : (84) 838 38 66 39
Saudi Arabia In association with Anfaal Capital Villa 47, Tujjar Jeddah Prince Mohammed bin Abdulaziz Street P.O. Box 126575 Jeddah 21352 Tel: (966) 2 6068686 Fax: (966) 26068787
South Asia Sales Trading Connie TAN [email protected] Tel: (65) 6333 5775 US Toll Free: 1 866 406 7447
North Asia Sales Trading Eddie LAU [email protected] Tel: (852) 2268 0800 US Toll Free: 1 866 598 2267
www.maybank-ke.com | www.kimengresearch.com