Embed Size (px)
Citation preview

Elizabeth Whitaker, AICPTransportation Planner III
North Central Texas Council of Governments
Regional Coordination Committee April 18, 2011

Regional Perspective Fourth Largest Metropolitan Area in the United States
Ranked 3rd in Population Growth between 1990-2000 Adding Over 1 Million Persons
Current Growth Trend: Added 1,200,000 Persons between 2000 and 2010
#1 for Population Growth among US Metropolitan Areas during 2008
Larger than 38 States (including Puerto Rico and the District of Columbia) in Population and 9 in Land Area
Represents Over 34 Percent of the State’s Economy, 19th Largest Economy in the World
6.5 Million Persons in Year 2010, Growing to Nearly 10 Million Persons by the Year 2035

Regional Transportation Issues
Dramatic Growth in Single Occupant Vehicles (SOV)
Increased Travel Time and Costs
Nonattainment Area for the Pollutant Ozone
No “Regional” Transit
Suburban Sprawl
Lack of Coordination in Land Use and Transportation Investments

What is the Metropolitan Transportation Plan?
Represents a Blueprint for a Multimodal Transportation System
Responds to Goals
Identifies Policies, Programs, and Projects for Continued Development
Guides Expenditures for Federal and State Funds
Mobility Quality of Life
System Sustainability
Implementation

Metropolitan Transportation Plan
Major Policy Objectives
Needs Exceed Available Revenue
Can’t Build Our Way Out of Congestion
Maximize Existing System
Use Sustainable Development Strategies to:
Reduce demand on transportation system
Provide multimodal options
Emphasis on Environmental Aspects and Quality of Life Issues of Programs and Projects
Invest Strategically in Infrastructure

Prioritization of Improvements
Infrastructure Maintenance• Maintain & Operate Existing Facilities• Bridge Replacements
Management and Operations• (ITS, TSM, TDM, Bicycle & Pedestrian)• Improve Efficiency & Remove Trips from System
Growth, Development, and Land Use Strategies
More Efficient Land Use & Transportation Balance
Rail and BusInduce Switch to Transit
HOV/Managed LanesIncrease Auto Occupancy
Policy Discussions• Intermodal Planning
Efforts•System Safety•System Security•Environmental Justice•Environmental
Stewardship
Air Quality Impacts
Considered Throughout the Process
Financial Constraints
Maxim
ize E
xis
ting S
yste
m
Str
ate
gic
Infr
astr
uctu
re
Investm
ent
Freeways/Toll Roads and ArterialsAdditional Vehicle Capacity

Revenue Sources
Costs are adjusted for “total project cost” and “year of expenditure” consistent with SAFETEA-LU planning requirements. “Actual Dollars” reflects the effect of inflation over time.
$0
$20
$40
$60
$80
$100
$120
Bill
ion
s
Increase in Mobility Improvement Fee (Vehicle Registration Fee)
Increase inState and Federal Gas Tax Indexing of State Gas Tax
AdditionalToll Roads and
Managed Lanes
$101.1 B
CurrentState and Federal Gas Taxes
Current Sales Tax from Transit
Authorities
Current Locally Collected Revenue

Mobility 2035 Financial Scenarios (Actual $)
Funding Strategies Existing Enhanced + Local Option
State Fuel Tax
(per gallon)
$0.20
(existing)
+$0.05 in 2020 &
+$0.05 in 2030
State Fuel Tax Indexing - To Fuel Efficiency by 2015
Federal Fuel Tax
(per gallon)
$0.184
(existing)
+$0.05 in 2020 &
+$0.05 in 2030
Mobility Improvement Fee (Vehicle Registration )
$60
(existing)
+$10 in 2015 &
+$10 in 2025
Toll Roads, Managed
Lanes, CDA, and PPP
Currently Funded
FacilitiesAdditional Facilities
Other Assumptions
-Regional Partners
Continue to Implement
Projects
-Reliance on Local
Entities to Fund Projects
Locally
Same as Existing plus:
-End 80% of Diversions Incrementally by
2025
-Maintenance: TxDOT Addresses Pavement
Conditions; MPO Funds Bridge
Replacements
Total Revenue ($B) $74.9 $101.1
Additional Revenue from Status Quo ($B) +$26.2Updated: 12/6/2010

Mobility 2035 Revenue Enhancements
2010 2015 2020 2025 2030 2035
Mobility 2035 Scenario: Federal, State, and Local Option Revenues
Status Quo Scenario: Federal and State Revenues
2020: 5 cent Federal and State Fuel Tax Increases
2015: $10 Vehicle Registration Fee Increase
2030: 5 cent Federal and State Fuel Tax Increases
2015: Begin Indexing Fuel Tax to Fuel Efficiency
2013: Begin Eliminating 80% of Diversions by 2025
2025: $10 VehicleRegistration Fee Increase
Source: TRENDS Financial Model
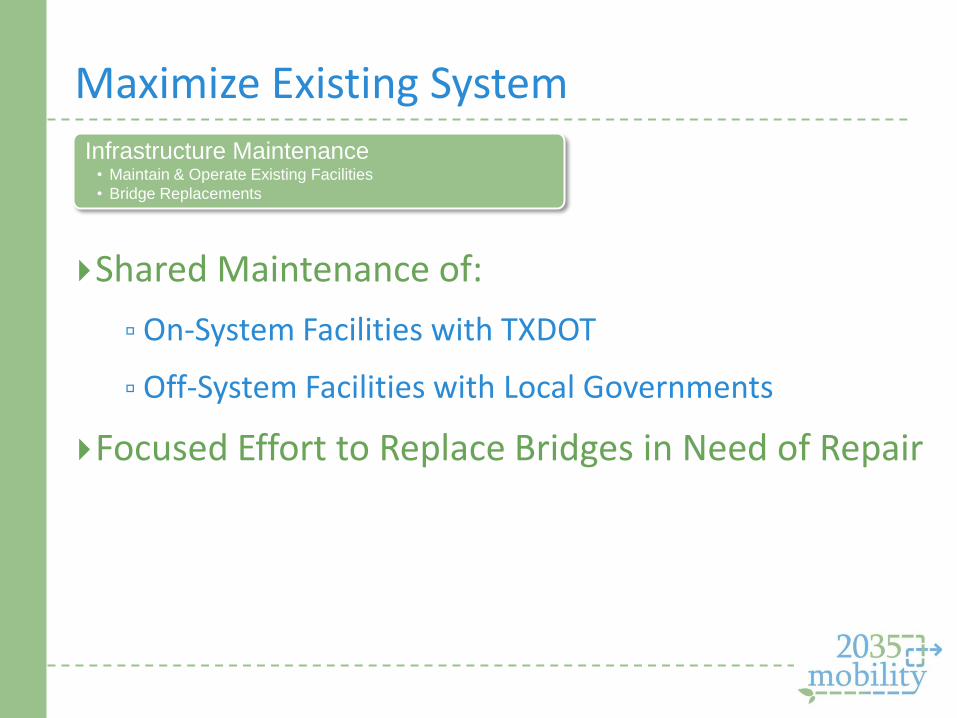
Maximize Existing System
Shared Maintenance of:
On-System Facilities with TXDOT
Off-System Facilities with Local Governments
Focused Effort to Replace Bridges in Need of Repair
Infrastructure Maintenance• Maintain & Operate Existing Facilities
• Bridge Replacements

Maximize Existing System
System Management Intersection Improvements Traffic Signal Improvements Freeway and Arterial Bottleneck Removal Work Zone and Special Events Management
Demand Management Employer Trip Reduction Program Vanpool, Park-and-Ride Facilities, and Transportation Management
Associations
Safety Freeway Incident Management Program Regional Mobility Assistance Patrol Program
Management and Operations• (ITS, TSM, TDM, Bicycle & Pedestrian)
• Improve Efficiency & Remove Trips from System

Maximize Existing System
Management and Operations• (ITS, TSM, TDM, Bicycle & Pedestrian)
• Improve Efficiency & Remove Trips from System

Maximize Existing System
Sustainability Sustainable Development Funding Program
Sustainable Growth Management and Development Tools
Transit-Oriented Development Implementation Program
NCTCOG Brownfield Revolving Loan Fund Program
Land Use Alternative Future Program
Land Use-Transportation (LUTR) Connection
Livability and Transportation
Center for Development Excellence Program
Growth, Development, and Land
Use StrategiesMore Efficient Land Use & Transportation Balance

Strategic Infrastructure Investment
Rail and BusInduce Switch to Transit

Strategic Infrastructure Investment
HOV/Managed LanesIncrease Auto Occupancy Freeways/Toll Roads and Arterials
Additional Vehicle Capacity

Impacts of Financial Constraint

2012 Congestion Levels
2035 Future Congestion Levels
Cost of Congestion $4.5 Billion Annually
Cost of Congestion $10.1 Billion Annually

RCC in Mobility 2035

RCC Focus Area
Focus Area Performance Measures
2012 2035 % Change
Population 190,189 274,155 44%
Employment 100,492 135,910 35%
Vehicle Miles of Travel (Daily)
3,298,279 5,049,367 53%
Vehicle Hours of Travel (Daily)
88,805 159,558 80%
Increase in Travel Time Due to Congestion*
25% 47% n/a
Focus Area Performance Measures
20122035 No
Build% Change
Population 190,189 274,155 44%
Employment 100,492 135,910 35%
Vehicle Miles of Travel (Daily)
3,298,279 5,017,559 52%
Vehicle Hours of Travel (Daily)
88,805 172,563 94%
Increase in Travel Time Due to Congestion*
25% 60% n/a
With Planned Improvements:
Without Planned Improvements:
* Congestion LevelsNo Congestion – 0% - 19%Light Congestion – 20% - 34%
Moderate Congestion – 35% - 49%Severe Congestion – 50% or greater
Contact Information
To find out more about Mobility 2035, please visit us at:
www.nctcog.org/mobility2035 or
e-mail: [email protected]
Dan Lamers, P.E., Senior Program Manager
817.695.9263 or [email protected]
Chad Edwards, Program Manager
817.608.2358 or [email protected]
Elizabeth Whitaker, AICP, Transportation Planner III
817.608.2324 or [email protected]

Captain T.D. Smyers
Commanding Officer, NAS Fort Worth JRB
Regional Coordination Committee
NAS Fort Worth JRB Update
April 18, 2011

Family Housing and Community Inventory
Housing Market Area is projected to remain the same
Personnel at NAS Fort Worth JRB will continue to increase
Base Housing has a deficit and cannot support the increase of incoming personnel
Partnership with the community is vital to provide the housing needs of our relocating service members and their families

Family Housing and Community Inventory
83 Government Quarters Available
40 units with 2 bedrooms
28 units with 3 bedrooms
15 units with 4 bedrooms
Known Demand
1,708 in 2009
2,061 by 2014
Growth of 353 units in five years!
Source: Housing Market Analysis Final Report, Dated March 2010.

Personnel at NAS Fort Worth JRB
Who are Entitled to On-Base Housing Services
0
500
1000
1500
2000
2500
3000
3500
4000
4500
2009 2010 2011 2014
Current Wait List:
44 Families
Peak Wait List:
58 Families

Housing Partnerships
Existing:
Rental Partnership Program (RPP)
• Connect military renters with available housing stock
• Provide property referrals and landlord/tenant mediation
• Automatically pay rent check each month
• Rental agreement is 5% off market value
Available:
Pre-Construction Agreements
• Allows base to enter into agreements with developers for future housing stock that may meet military needs
• Intended to provide risk mitigation
Preferred within close proximity to the installation

Retail in the Current Master Plan
MASTER PLAN NAVAL AIR
STATION FORT WORTH JOINT RESERVE BASE
9.1
9.29.3
9.49.5
H
ADP Project Number Project Description Term
9.1 Aviation Museum Near
9.2 Commissary Near
9.3 Retail Services Mid
9.4 Renovate Pass and ID Office Mid
9.5 Upgrade and Renovation of Utility Fence Mid
AREA DEVELOPMENT PLANS
AREA 9 LONG TERM DEVELOPMENT

Military Retail: Example Case Study #1
NAS Oceana, Virginia
NEX located on Navy property, separately
fenced, and entry prior to main gate
Commissary located on fenced land, separate from main installation
fenceline
Installation fencelinesshown in red and
maroon

Military Retail: Example Case Study #2
NAS Whiting Field, Florida
NEX Mini-Mart
8.5 miles south of NAS Whiting Field
Co-located with Whiting Pines (off-base
military housing complex)

Local Military Retail Preferences
On federal land
Co-located with one another
Mini-mart can be co-located with off-base
housing

12 Community Locations
Sky Ranger Distribution
2 elected officials’ offices
1 county facility
2 neighborhood associations
1 YMCA
2 public libraries
3 community centers
1 local business


NAS Fort Worth, JRB Regional Coordination Committee
April 18, 2011
Item 6
Administrative Updates

Development Review Update on Projects
Project #018
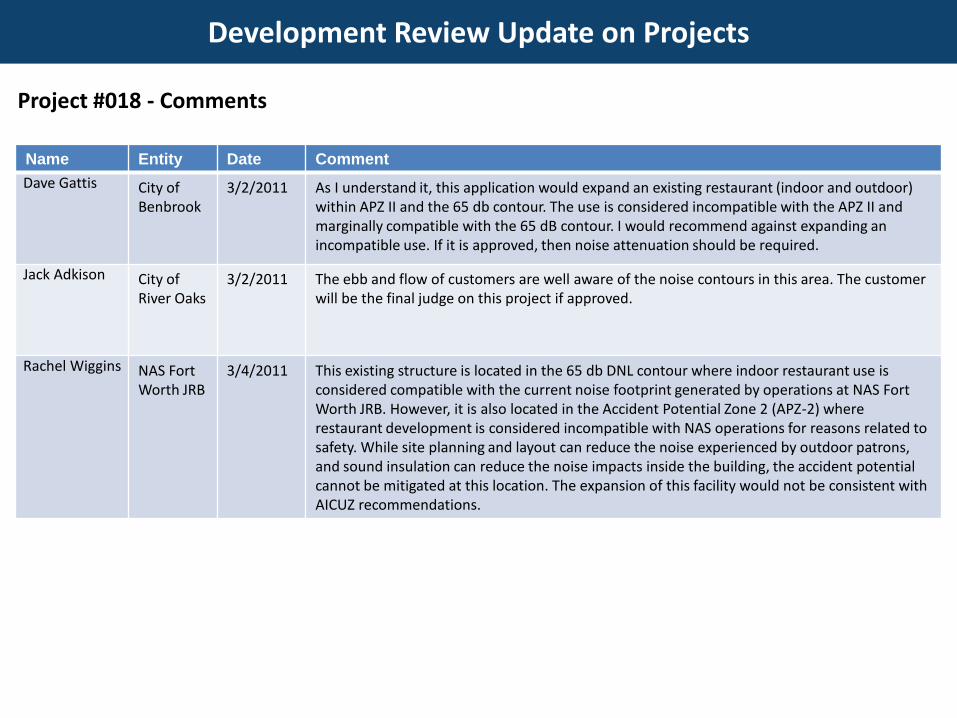
Development Review Update on Projects
Project #018 - Comments
Name Entity Date Comment
Dave Gattis City of Benbrook
3/2/2011 As I understand it, this application would expand an existing restaurant (indoor and outdoor) within APZ II and the 65 db contour. The use is considered incompatible with the APZ II and marginally compatible with the 65 dB contour. I would recommend against expanding an incompatible use. If it is approved, then noise attenuation should be required.
Jack Adkison City of River Oaks
3/2/2011 The ebb and flow of customers are well aware of the noise contours in this area. The customer will be the final judge on this project if approved.
Rachel Wiggins NAS Fort Worth JRB
3/4/2011 This existing structure is located in the 65 db DNL contour where indoor restaurant use is considered compatible with the current noise footprint generated by operations at NAS Fort Worth JRB. However, it is also located in the Accident Potential Zone 2 (APZ-2) where restaurant development is considered incompatible with NAS operations for reasons related to safety. While site planning and layout can reduce the noise experienced by outdoor patrons, and sound insulation can reduce the noise impacts inside the building, the accident potential cannot be mitigated at this location. The expansion of this facility would not be consistent with AICUZ recommendations.

Development Review Update on Projects
Project #019

Development Review Update on Projects
Name Entity Date Comment
Dave Gattis City of Benbrook
3/2/2011 This appears to be outside of the 65 dB contour, and therefore I have no objection.
Jack Adkison City of River Oaks
3/2/2011 I see no problem with this project.
Randy Skinner Tarrant County
3/4/2011 No objections.
Rachel Wiggins NAS Fort Worth JRB
3/4/2011 This project is located outside of the current noise and safety footprint of NAS Fort Worth JRB. For that reason, this project is compatible with operations at the installation and represents development that is consistent with AICUZ recommendations and JLUS principles adopted by the cities surrounding the installation.
Project #019 - Comments

Development Review Update on Projects
Project #020

Development Review Update on Projects
Name Entity Date Comment
Dave Gattis City of Benbrook
3/2/2011 As I understand it, this is a follow-up approval for the same project (No. 15) that was considered in December. Since this is simply a replat to combine lots, and the uses have been approved previously, I have no objection.
Jack Adkison City of River Oaks
3/2/2011 I have no problem with this project.
Randy Skinner Tarrant County
3/4/2011 I have no objections.
Project #020 - Comments

Development Review Update on Projects
Project #021

Development Review Update on Projects
Name Entity Date Comment
Dave Gattis City of Benbrook
3/2/2011 A dental office is incompatible with both the APZ I and 75 dB contour, but since the zoning is already in place and the use allowed by right, I would recommend that noise attenuation be required as part of the site plan approval (if allowable under your zoning ordinance.)
Jack Adkison City of River Oaks
3/2/2011 I see no problem for this.
Rachel Wiggins NAS Fort Worth JRB
3/4/2011 This site is located inside of APZ-1 and straddles the 80 db DNL contour. The proposed dental office use is incompatible in both the APZ and in the subject noise zone. Even if noise at the site were mitigated through sound attenuation, the use of this land as a dental office is not consistent with AICUZ recommendations or JLUS principles adopted by the cities surrounding the installation.
Project #021 - Comments

Development Review Update on Projects
Project #022

Development Review Update on Projects
Name Entity Date Comment
Jocelyn Murphy City of Fort Worth
3/22/2011 This case includes the entire NAS FW JRB within the city limits of Fort Worth - the system only accepted one parcel when entered - but does not include Lockheed at this time. As a federal property, the base and Lockheed are of course not regulated by zoning, but the rezoning will reflect the past, current, and future activity on the property. It is currently zoned single family and will be rezoned to Planned Development based on "I" Light Industrial to include aviation uses and exclude some uses.
Dave Gattis City of Benbrook
3/22/2011 I agree that rezoning the base to light industrial is more appropriate than leaving it as A-5 single family. Industrial (or aircraft transportation) is the more appropriate use given the noise contours present on the base.
Rachel Wiggins NAS Fort Worth JRB
3/23/2011 This change will administratively update zoning to accurately reflect activities that take place on the installation. As a part of the City of Fort Worth's package of initiatives to promote compatible development and appropriate zoning near the base, we are in support of this zoning case.
Joe Crews City of River Oaks
3/23/2011 I see no problems with the rezoning.
Randy Skinner Tarrant County
3/24/2011 This does appear to be an appropriate zoning change for this property.
Project #022 - Comments

HUD Community Challenge Grant Update
Staff decision not to pursue In-Kind Match from cities.
Held city meetings to review HUD Tasks.
Submitting “Final HUD Work Plan” to HUD on April 22.
Coordinate additional meetings with cities as needed.
First Task: • Housing Study • Continuation of Current Transportation Study
Draft Transportation Assessment Document –Summer 2011

Next MeetingJuly 11, 2011
1:30 p.m.Westworth Village City Hall