Embed Size (px)
Citation preview
Regional carbon dynamics in monsoon Asia and its implications for
the global carbon cycle
Hanqin Tiana,b,*, Jerry M. Melilloc, David W. Kicklighterc, Shufen Pand, Jiyuan Liub,A. David McGuiree, Berrien Moore IIIf
aDepartment of Ecology and Evolutionary Biology, The University of Kansas, Lawrence, KS 66045, USAb Institute of Geographical Sciences and Natural Resources Research, Chinese Academy of Sciences, Beijing 100101, China
cThe Ecosystems Center, Marine Biological Laboratory, Woods Hole, MA 02543, USAdKansas Applied Remote Sensing Program, The University of Kansas, Lawrence, KS 66045, USA
eUSGS, Alaska Cooperative Fish and Wildlife Research Unit, University of Alaska, Fairbanks, AK 99775, USAf Institute for the Study of Earth, Oceans and Space, University of New Hampshire, Durham, NH 03824, USA
Accepted 25 July 2002
Abstract
Data on three major determinants of the carbon storage in terrestrial ecosystems are used with the process-based Terrestrial
Ecosystem Model (TEM) to simulate the combined effect of climate variability, increasing atmospheric CO2 concentration, and
cropland establishment and abandonment on the exchange of CO2 between the atmosphere and monsoon Asian ecosystems.
During 1860–1990, modeled results suggest that monsoon Asia as a whole released 29.0 Pg C, which represents 50% of the
global carbon release for this period. Carbon release varied across three subregions: East Asia (4.3 Pg C), South Asia (6.6 Pg C),
and Southeast Asia (18.1 Pg C). For the entire region, the simulations indicate that land-use change alone has led to a loss of
42.6 Pg C. However, increasing CO2 and climate variability have added carbon to terrestrial ecosystems to compensate for 23%
and 8% of the losses due to land-use change, respectively. During 1980–1989, monsoon Asia as a whole acted as a source of
carbon to the atmosphere, releasing an average of 0.158 Pg C per year. Two of the subregions acted as net carbon source and
one acted as a net carbon sink. Southeast Asia and South Asia were sources of 0.288 and 0.02 Pg C per year, respectively, while
East Asia was a sink of 0.149 Pg C per year. Substantial interannual and decadal variations occur in the annual net carbon
storage estimated by TEM due to comparable variations in summer precipitation and its effect on net primary production (NPP).
At longer time scales, land-use change appears to be the important control on carbon dynamics in this region.
D 2003 Elsevier Science B.V. All rights reserved.
Keywords: carbon cycle; climate variability; CO2 fertilization; land use; monsoon Asia; terrestrial ecosystems
1. Introduction
Monsoon Asia refers to the portion of the Asian
continent where a significant seasonal shift of wind
patterns occurs throughout the entire area. The region
includes the Indian subcontinent, Southeast Asia, and
0921-8181/03/$ - see front matter D 2003 Elsevier Science B.V. All rights reserved.
doi:10.1016/S0921-8181(02)00205-9
* Corresponding author. Department of Ecology and Evolu-
tionary Biology, The University of Kansas, Lawrence, KS 66045,
USA. Tel.: +1-785-864-5703; fax: +1-785-864-5321.
E-mail address: [email protected] (H. Tian).
www.elsevier.com/locate/gloplacha
Global and Planetary Change 37 (2003) 201–217
China. The total area of land ecosystems in monsoon
Asia is 21.4� 106 km2, about 16% of earth’s land
surface. Monsoon Asia is home to more than half of
the world population (United Nations Population
Division (UNPD), 1998). This region is covered by
a range of ecosystems from tropical forests in South-
east Asia to boreal forests in the northern Asia and
from temperate forests in eastern Asia to deserts in
western Asia and tundra in the Himalayan Mountains.
These ecosystems account for about 20% of the
potential global terrestrial net primary productivity
and for a similar fraction of the carbon stored in land
ecosystems (Melillo et al., 1993; McGuire et al.,
2001). Clearly, monsoon Asia is of critical importance
to the understanding of how changing climates and
human impacts interact to influence the structure and
functioning of ecosystems and the biosphere (Hirose
and Walker, 1995; Galloway and Melillo, 1998; Tian
et al., 2000a).
Monsoon climate and land use have been sug-
gested as two major factors that control net primary
production (NPP) and carbon storage in the ecosys-
tems of monsoon Asia. For example, Fu and Wen
(1999) showed a strong correlation between the
strength of monsoons in East Asia and net primary
production estimated by remote sensing. The land
ecosystems in monsoon Asia have been intensively
disturbed or managed by human activities for many
centuries and are now involved in rapid economic,
social, and environmental changes. Previous studies
have suggested that tropical Asia acted as an impor-
tant source of carbon to the atmosphere, ranging
from 25% (Esser, 1995) to 31% (Houghton and
Hackler, 1999) of the global carbon emissions
released from land ecosystems since the middle of
the 18th century. Recent estimates have indicated
that, for the 1980s, tropical deforestation in South
and Southeast Asia released from one-third (Fearn-
side, 2000) to more than half (Houghton, 1999) of
the carbon lost from land-use change across the
globe. On the other hand, other recent analyses based
on atmospheric transport models and CO2 observa-
tions suggest that the northern portion of monsoon
Asia has acted as a carbon sink (Bousquet et al.,
1999). The resolution of the uncertainty in the
magnitude of the carbon source or sink in monsoon
Asia, clearly, is a key to balancing the global carbon
budget.
The complexity of the interactions and feedbacks
among ecosystem, climate, and human activities
requires the use of process-based ecosystem models
to study regional carbon dynamics (Melillo et al.,
1996; Prentice et al., 2001). A rapidly increasing
literature indicates that spatially explicit models of
ecosystem processes have become a key tool for the
evaluation of the response of large-scale terrestrial
ecosystems to changing climate and changing human
impact (e.g., Melillo et al., 1993; Ji, 1995; VEMAP
Members, 1995; Post et al., 1997; Cao and Wood-
ward, 1998; Cramer et al., 1999; Kicklighter et al.,
1999; Tian et al., 1998, 1999; Prentice et al., 2000;
McGuire et al., 2000, 2001; Schimel et al., 2000). For
monsoon Asia, previous modeling studies have inves-
tigated net primary production under contemporary
conditions and/or its responses to elevated atmos-
pheric CO2 concentration and projected climate
change assuming equilibrium conditions (e.g., Peng
and Apps, 1997; Xiao et al., 1998; Gao et al., 2000;
Ni et al., 2000; Pan et al., 2000). To better understand
carbon dynamics in this region, we need to also
simulate how ecosystem processes change over time
in response to variations in monsoon climate and to
disturbances caused by human activities. Such a
modeling effort, however, requires the development
of both dynamic ecosystem models and transient
input data such as climate and land-use history.
Recent progress in ecosystem modeling (e.g., Tian
et al., 1999; Prentice et al., 2000; Schimel et al., 2000;
McGuire et al., 2001) and data set development (e.g.,
Hulme, 1995; Jones, 1994; Liu, 1996; Ramankutty
and Foley, 1998, 1999) has made it possible to
estimate transient changes in carbon storage at the
regional or global scale by quantifying the mecha-
nisms controlling ecosystem carbon storage. In this
study, we investigate how historical climate variabil-
ity, increasing CO2, and cropland establishment and
abandonment have affected carbon storage in mon-
soon Asia for the period from 1860 to 1990 by using
a new version of the Terrestrial Ecosystem Model
(TEM 4.2) in conjunction with newly developed
spatially explicit data sets (McGuire et al., 2001).
We also identify gaps and limitations in existing
information that need to be investigated in the future
to improve our understanding of carbon dynamics and
our ability to estimate terrestrial carbon fluxes in this
region.
H. Tian et al. / Global and Planetary Change 37 (2003) 201–217202
2. Methods and data
2.1. Overview
The annual net carbon exchange (NCE) of the
terrestrial biosphere with the atmosphere can be
described by the equation:
NCE ¼ NPP� RH � ENAD � EAD � EP ð1Þ
where NPP is net primary production, RH is hetero-
trophic respiration (i.e., decomposition), ENAD repre-
sents emissions associated with nonanthropogenic
disturbance (e.g., lightning fires, insect infestations),
EAD represents emissions from anthropogenic disturb-
ance, and EP represents the decomposition of products
harvested from ecosystems for use by humans and
associated livestock. A negative NCE indicates that
terrestrial ecosystems are sources of atmospheric CO2,
whereas a positive NCE indicates a terrestrial sink.
The NCE as used here is the same carbon flux as the
net carbon exchange described by McGuire et al.
(2001), but has the opposite sign as it describes this
flux from the perspective of terrestrial ecosystems
rather than the atmosphere.
The fluxes NPP and RH are influenced by spatial
and temporal variations in natural environmental
conditions such as atmospheric CO2 concentration,
climate, and nitrogen availability. Human activities
modify these fluxes further by: (1) influencing the
availability of water and nitrogen to the plants, (2)
breaking up soil aggregates during cultivation or
construction to expose more soil organic matter to
oxidation, (3) managing the community composition
and amount of biomass present on a site, and (4)
introducing air pollutants that can either enhance (e.g.,
CO2, N deposition) or reduce (e.g., ozone) plant
growth. In addition, NPP and RH of a site will change
with time as vegetation regrows after a human or
natural disturbance.
The magnitude of the carbon loss from a disturb-
ance (i.e., ENAD, EAD) depends on the intensity and
frequency of the disturbance. Disturbances are episo-
dic events that cause immediate carbon losses from an
ecosystem, but may also change environmental con-
ditions at a site so that additional carbon is lost from
the ecosystem over a longer time period. The intensity
and frequency of disturbances depend on the environ-
mental conditions at the disturbed site, although eco-
nomic and/or social forces also have a large influence
on the intensity and frequency of human disturbances.
Human activities also directly influence terrestrial
carbon storage by the production and redistribution of
agricultural, paper, and other wood products. The
carbon stored in these products is returned to the
atmosphere at a variety of rates that are related to the
consumption of food, the burning and decomposition
of trash, and the deterioration of wooden structures in
buildings, bridges, etc. As a result of trade, many of
these products may decompose or deteriorate in places
far removed from the site where the biomass was
created. Thus, regional terrestrial carbon sinks may
be overestimated if this product flux (EP) of carbon
back to the atmospheric is not considered properly.
2.2. Simulation approach
In this study, we have modified version 4.1 of the
Terrestrial Ecosystem Model (TEM 4.1, Tian et al.,
1999) to better estimate monthly fluxes of NPP and
RH of contemporary vegetation. The new version of
TEM (TEM 4.2) is able to simulate changes in carbon
storage during three stages of disturbance: (1) con-
version from natural vegetation to cultivation, (2)
production and harvest on cultivated land, and (3)
abandonment of cultivated land. The modeled esti-
mates of carbon storage in vegetation and soils before
disturbance are influenced by the spatial and temporal
variations in environmental conditions from 1860 to
1992 as prescribed by the historical spatially explicit
climate data sets of Jones (1994) and Hulme (1995).
These environmental variations influence the simu-
lated rates of terrestrial carbon gain or loss in both
disturbed and undisturbed ecosystems by affecting
simulated NPP and RH. The timing and location of
human disturbance associated with row crop agricul-
ture are prescribed for the period 1860–1992 by the
historical agricultural data set of Ramankutty and
Foley (1998, 1999).
To simulate the effects of biomass harvest and
associated conversion fluxes, we have incorpora-
ted algorithms from the Terrestrial Carbon Model
(Houghton et al., 1983; Melillo et al., 1988) into
TEM 4.2 as described in McGuire et al. (2001).
Biomass harvested from land as a result of conversion
to agriculture (i.e., products) is placed into two
H. Tian et al. / Global and Planetary Change 37 (2003) 201–217 203
product pools with different residence times: a 10-year
pool that represents paper and paper products and a
100-year product pool that represents lumber and
long-lasting products. Annual releases of CO2 from
these two product pools are calculated as a linear
decay of the initial carbon inputs into these pools over
10 and 100 years, respectively. The conversion flux
(i.e., EAD) is the simulated release of CO2 associated
with the clearing of land for agriculture (i.e., burning
of slash and fuelwood).
For cultivated ecosystems, crop NPP estimates are
based on the relative agricultural production approach
of Esser (1995), using the NPP estimate of potential
vegetation developed by TEM. Forty percent of
annual crop NPP is assumed to be harvested for
human and livestock consumption. The harvested
NPP is placed into an agricultural products pool,
which is assumed to have a 1-year residence time
(see Fig. 1). The biomass resulting from the annual
NPP that is not harvested (i.e., residue) is transferred
to the reactive soil organic carbon pool. The sum of
the carbon fluxes released to the atmosphere from the
three product pools are collectively referred to as the
total product flux (EP).
After abandonment, the rate of regrowth of poten-
tial vegetation of the site is again based on the relative
rates of NPP and RH as influenced by the environ-
mental conditions at the site. We do not currently have
the capability to simulate the carbon dynamics asso-
ciated with ENAD in this region. Thus, for this study,
we estimate NCE by modifying Eq. (1) to be:
NCE ¼ NPP� RH � EAD � EP ð2Þ
2.3. Modifications to the Terrestrial Ecosystem Model
In TEM, net primary production is calculated as
the difference between gross primary production
(GPP) and plant respiration (RA). Gross primary
production represents the uptake of atmospheric
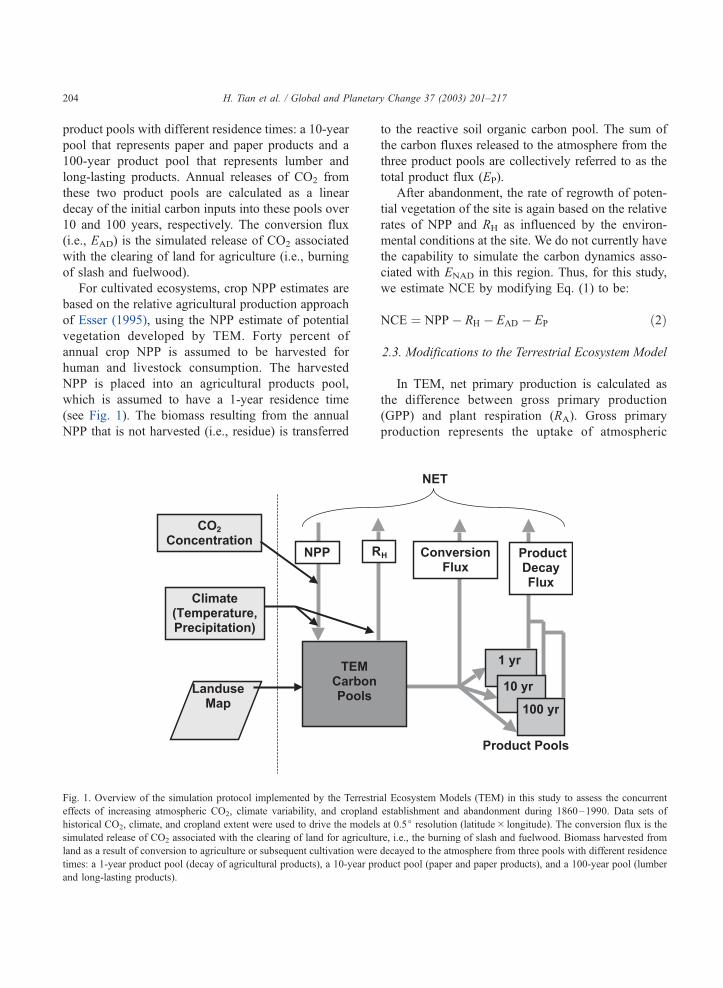
Fig. 1. Overview of the simulation protocol implemented by the Terrestrial Ecosystem Models (TEM) in this study to assess the concurrent
effects of increasing atmospheric CO2, climate variability, and cropland establishment and abandonment during 1860–1990. Data sets of
historical CO2, climate, and cropland extent were used to drive the models at 0.5j resolution (latitude� longitude). The conversion flux is the
simulated release of CO2 associated with the clearing of land for agriculture, i.e., the burning of slash and fuelwood. Biomass harvested from
land as a result of conversion to agriculture or subsequent cultivation were decayed to the atmosphere from three pools with different residence
times: a 1-year product pool (decay of agricultural products), a 10-year product pool (paper and paper products), and a 100-year pool (lumber
and long-lasting products).
H. Tian et al. / Global and Planetary Change 37 (2003) 201–217204
CO2 during photosynthesis and is influenced by light
availability, atmospheric CO2 concentration, temper-
ature, and the availability of water and nitrogen.
Plant respiration includes both maintenance and
construction respiration and is calculated as a func-
tion of temperature and vegetation carbon. To simu-
late the effects of canopy development on NPP in
TEM 4.2, we modified the GPP equation in TEM 4.1
(Tian et al., 1999) by adding an additional scalar,
f(CANOPY):
GPP ¼ Cmaxf ðPARÞf ðCANOPYÞf ðLEAFÞ� f ðTÞf ðCa; GvÞf ðNAÞ ð3Þ
where Cmax is the maximum rate of C assimilation,
PAR is photosynthetically active radiation, f(CAN-
OPY) describes the effect of canopy development on
the vegetation capacity to assimilate CO2 and is
relative to the maximum amount of leaf biomass that
would be found in a fully developed canopy, f(LEAF)
describes seasonal changes of the vegetation capacity
to assimilate CO2 and is relative to maximum leaf area
during a particular year, T is air temperature, Ca is
atmospheric CO2 concentration, Gv is relative canopy
conductance, and NA is nitrogen availability. To cal-
culate f(CANOPY), the amount of leaf biomass is
assumed to be related to the total amount of carbon
stored in vegetation biomass using the following
logistic relationship:
f ðCANOPYÞ ¼ 1
1:0þ ðAeðB�CvÞÞ ð4Þ
where Cv is the state variable for carbon in the
vegetation and A and B are parameters. Parameter A
was set to 1.6662 for all vegetation types, while
parameter B varies among vegetation types from
� 0.000227 for tropical forests to � 0.016209 for
grasslands. Thus, parameter B is implicitly responsible
for the pattern of allocating biomass to leaves during
stand development.
The flux RH represents microbially mediated
decomposition of organic matter in an ecosystem
and is influenced by the amount of reactive soil
organic carbon, temperature, and soil moisture. Addi-
tional details on how TEM estimates terrestrial eco-
system processes may be found in Tian et al. (1999).
Although no algorithms have been changed to simu-
late RH in TEM 4.2, changes in litterfall, caused by the
model modifications described above, influence RH by
affecting the amount of soil organic matter available
to decomposers.
2.3.1. Regional extrapolation
For regional extrapolations with TEM, we use
spatially explicit input data sets of vegetation, eleva-
tion, soil texture, mean monthly temperature, monthly
precipitation, and mean monthly solar radiation (Tian
et al., 1999). The input data sets are gridded at a
resolution of 0.5j latitude by 0.5j longitude. In addi-
tion to the input data sets, TEM also requires soil- and
vegetation-specific parameters appropriate to a grid
cell. Although many of the parameters in the model are
defined from published information, some of the
vegetation-specific parameters are determined by cal-
ibrating the model to the fluxes and pool sizes of an
intensively studied field site. The data used to calibrate
the model for different vegetation types are docu-
mented in previous work (Raich et al., 1991; McGuire
et al., 1992, 1995; Tian et al., 1999). To apply TEM to
a transient scenario of atmospheric CO2 and/or cli-
mate, it is first necessary to run the model to equili-
brium with a long-term baseline climate appropriate to
the initial year of the simulation. Detailed documenta-
tion on the development, parameterization, and cali-
bration of the dynamic version of TEM has also been
published in previous work (Tian et al., 1999; McGuire
et al., 2000).
2.4. Study area and data sets
2.4.1. Study area
In this study, we divide monsoon Asia into three
subregions: East Asia, South Asia, and Southeast
Asia. East Asia includes four countries: China, Japan,
Korea, and Mongolia, and covers an area of about
11.7� 106 m2. The East Asia summer monsoon
brings most of the annual precipitation to this sub-
region (Fu and Wen, 1999). South Asia includes
seven countries: Afghanistan, Bangladesh, Bhutan,
India, Nepal, Pakistan, and Sri Lanka, and covers an
area of about 5.0� 106 m2. Land ecosystems in
South Asia depend on the Indian monsoon, which
brings 80% of the annual precipitation to this region
(Parthasarathy et al., 1992). Southeast Asia includes
nine countries: Brunei, Burma, Indonesia, Cambodia,
H. Tian et al. / Global and Planetary Change 37 (2003) 201–217 205
Laos, Malaysia, Philippines, Thailand, and Vietnam,
and covers an area of about 4.7� 106 m2. Most of
the tropical rainforests in Asia are located in South-
east Asia. Ecosystems in Southeast Asia also depend
on rainfall brought by the East Asia summer mon-
soon.
2.4.2. Data sets
In this study, soil, elevation, and cloudiness are
assumed not to vary from year to year, so we use the
same input data sets as in previous equilibrium studies
with TEM (e.g., McGuire et al., 1997). The elevation
data represent a 0.5j aggregation of the 10V NCAR/
Navy (1984) data. Soil texture is based on the FAO/
CSRC digitization of the FAO-UNESCO (1971) soil
map. Mean monthly cloudiness in this study is from
the global data set of Cramer and Leemans (Wolfgang
Cramer, personal communication), which is a major
update of Leemans and Cramer (1991). Monthly
percent cloudiness is calculated as 100 minus monthly
percent sunshine duration in the Cramer and Leemans
database. We use our potential vegetation data set
(Melillo et al., 1993) to generate baseline conditions
in the equilibrium portion of the simulations and to
represent natural vegetation in the transient portion of
the simulations.
Historical changes in other environmental factors
from 1860 to 1990 are prescribed with transient input
data sets in this study. The transient input data
include: (1) historical mean atmospheric CO2 concen-
tration (Etheridge et al., 1996; Keeling et al., 1995,
updated), (2) gridded historical monthly data for air
temperature and precipitation (Jones, 1994, updated;
Hulme, 1995, updated), and (3) gridded historical
yearly data for cropland area (Ramankutty and Foley,
1998, 1999).
2.5. Simulation experiments
To determine the relative effects of climate varia-
bility, CO2 increase, and land-use change on the
carbon storage in monsoon Asia, we conducted four
simulations. To determine the effect of climate varia-
bility alone, we ran TEM using the gridded historical
monthly data for air temperature and precipitation, but
kept atmospheric CO2 concentration constant at the
level observed in 1860 (286 ppmv) and represented
land cover with our potential vegetation data set over
the entire study period. To determine the effect of CO2
fertilization alone, we ran TEM using the historical
atmospheric CO2 concentrations, but used a long-term
mean monthly climate and represented again land
cover with potential vegetation. To determine the
effect of land-use change alone, we ran TEM using
the gridded cropland data set, the long-term mean
monthly climate, and a constant atmospheric CO2
concentration of 286 ppmv. Finally, we examined the
combined effects of these factors on terrestrial carbon
storage by running TEM with the gridded historical
monthly data for air temperature and precipitation, the
historical atmospheric CO2 concentration data, and
gridded historical cropland data sets. This last simu-
lation was also used to analyze the carbon budget of
monsoon Asia and each of the subregions. To relate
this regional carbon budget to the global carbon
budget, we also ran TEM with the historical atmos-
pheric CO2 concentration data set and our global
gridded data sets for soil, elevation, cloudiness, poten-
tial vegetation, historical air temperature, historical
precipitation, and historical cropland distribution.
For each simulation, we first ran TEM in equili-
brium mode to generate an initial condition for
transient runs, using gridded input data of vegetation,
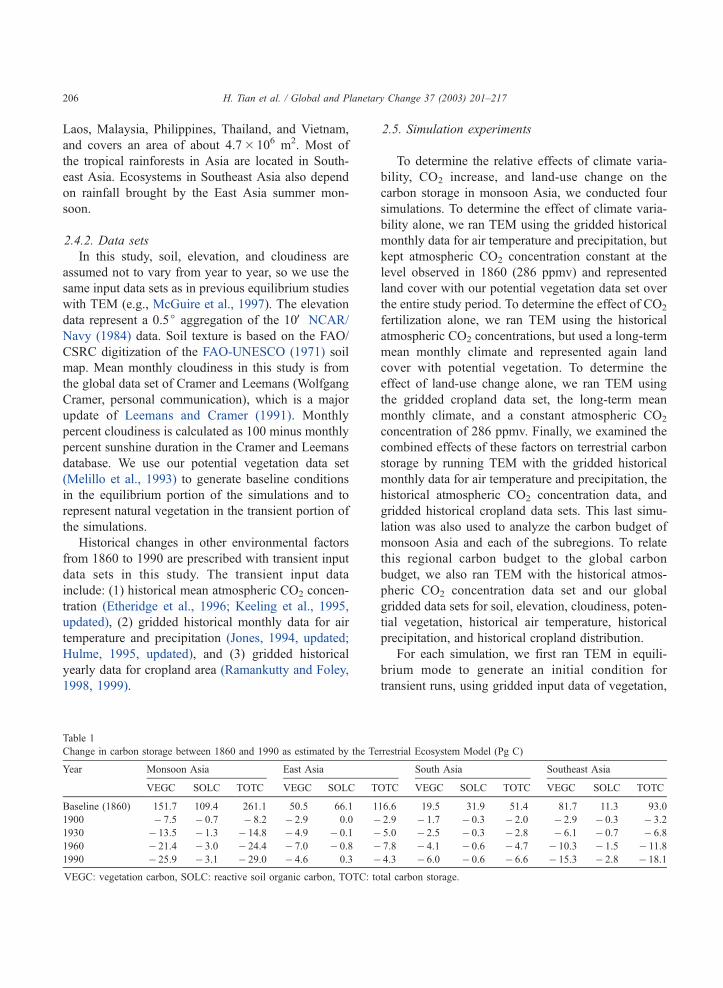
Table 1
Change in carbon storage between 1860 and 1990 as estimated by the Terrestrial Ecosystem Model (Pg C)
Year Monsoon Asia East Asia South Asia Southeast Asia
VEGC SOLC TOTC VEGC SOLC TOTC VEGC SOLC TOTC VEGC SOLC TOTC
Baseline (1860) 151.7 109.4 261.1 50.5 66.1 116.6 19.5 31.9 51.4 81.7 11.3 93.0
1900 � 7.5 � 0.7 � 8.2 � 2.9 0.0 � 2.9 � 1.7 � 0.3 � 2.0 � 2.9 � 0.3 � 3.2
1930 � 13.5 � 1.3 � 14.8 � 4.9 � 0.1 � 5.0 � 2.5 � 0.3 � 2.8 � 6.1 � 0.7 � 6.8
1960 � 21.4 � 3.0 � 24.4 � 7.0 � 0.8 � 7.8 � 4.1 � 0.6 � 4.7 � 10.3 � 1.5 � 11.8
1990 � 25.9 � 3.1 � 29.0 � 4.6 0.3 � 4.3 � 6.0 � 0.6 � 6.6 � 15.3 � 2.8 � 18.1
VEGC: vegetation carbon, SOLC: reactive soil organic carbon, TOTC: total carbon storage.
H. Tian et al. / Global and Planetary Change 37 (2003) 201–217206
soil, elevation, the long-term means of monthly tem-
perature, monthly precipitation and monthly cloudi-
ness, and the level of atmospheric CO2 concentration
in the year of 1860. Then we ran TEM in transient
mode using the appropriate historical input data from
1860 to 1990 as described above.
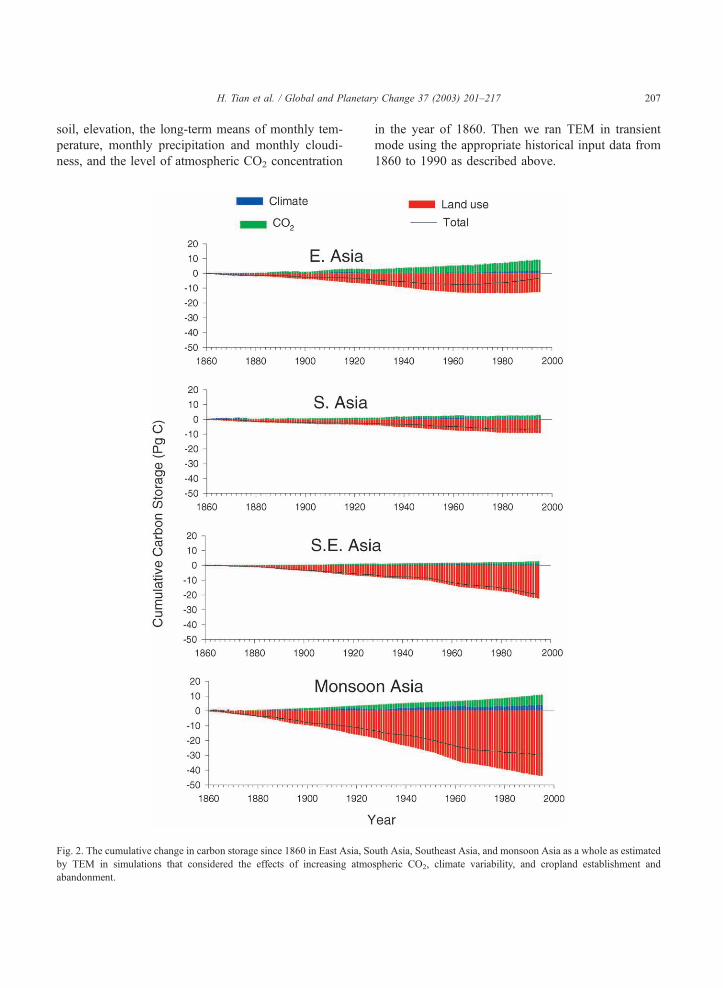
Fig. 2. The cumulative change in carbon storage since 1860 in East Asia, South Asia, Southeast Asia, and monsoon Asia as a whole as estimated
by TEM in simulations that considered the effects of increasing atmospheric CO2, climate variability, and cropland establishment and
abandonment.
H. Tian et al. / Global and Planetary Change 37 (2003) 201–217 207
3. Results and analyses
3.1. Historical change in carbon storage since 1860
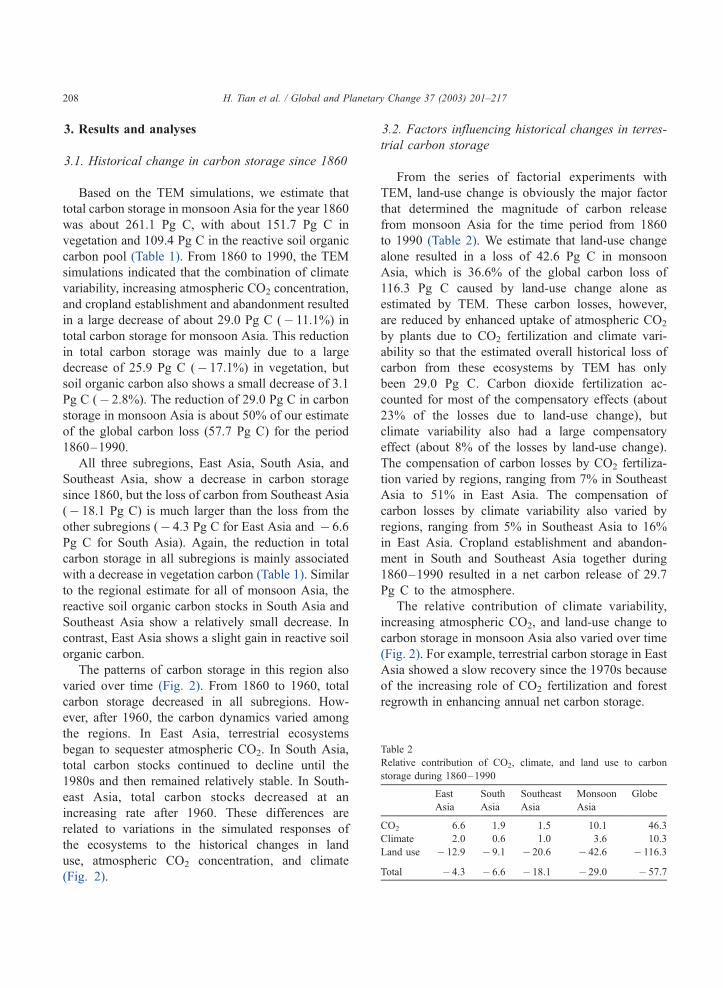
Based on the TEM simulations, we estimate that
total carbon storage in monsoon Asia for the year 1860
was about 261.1 Pg C, with about 151.7 Pg C in
vegetation and 109.4 Pg C in the reactive soil organic
carbon pool (Table 1). From 1860 to 1990, the TEM
simulations indicated that the combination of climate
variability, increasing atmospheric CO2 concentration,
and cropland establishment and abandonment resulted
in a large decrease of about 29.0 Pg C (� 11.1%) in
total carbon storage for monsoon Asia. This reduction
in total carbon storage was mainly due to a large
decrease of 25.9 Pg C (� 17.1%) in vegetation, but
soil organic carbon also shows a small decrease of 3.1
Pg C (� 2.8%). The reduction of 29.0 Pg C in carbon
storage in monsoon Asia is about 50% of our estimate
of the global carbon loss (57.7 Pg C) for the period
1860–1990.
All three subregions, East Asia, South Asia, and
Southeast Asia, show a decrease in carbon storage
since 1860, but the loss of carbon from Southeast Asia
(� 18.1 Pg C) is much larger than the loss from the
other subregions (� 4.3 Pg C for East Asia and � 6.6
Pg C for South Asia). Again, the reduction in total
carbon storage in all subregions is mainly associated
with a decrease in vegetation carbon (Table 1). Similar
to the regional estimate for all of monsoon Asia, the
reactive soil organic carbon stocks in South Asia and
Southeast Asia show a relatively small decrease. In
contrast, East Asia shows a slight gain in reactive soil
organic carbon.
The patterns of carbon storage in this region also
varied over time (Fig. 2). From 1860 to 1960, total
carbon storage decreased in all subregions. How-
ever, after 1960, the carbon dynamics varied among
the regions. In East Asia, terrestrial ecosystems
began to sequester atmospheric CO2. In South Asia,
total carbon stocks continued to decline until the
1980s and then remained relatively stable. In South-
east Asia, total carbon stocks decreased at an
increasing rate after 1960. These differences are
related to variations in the simulated responses of
the ecosystems to the historical changes in land
use, atmospheric CO2 concentration, and climate
(Fig. 2).
3.2. Factors influencing historical changes in terres-
trial carbon storage
From the series of factorial experiments with
TEM, land-use change is obviously the major factor
that determined the magnitude of carbon release
from monsoon Asia for the time period from 1860
to 1990 (Table 2). We estimate that land-use change
alone resulted in a loss of 42.6 Pg C in monsoon
Asia, which is 36.6% of the global carbon loss of
116.3 Pg C caused by land-use change alone as
estimated by TEM. These carbon losses, however,
are reduced by enhanced uptake of atmospheric CO2
by plants due to CO2 fertilization and climate vari-
ability so that the estimated overall historical loss of
carbon from these ecosystems by TEM has only
been 29.0 Pg C. Carbon dioxide fertilization ac-
counted for most of the compensatory effects (about
23% of the losses due to land-use change), but
climate variability also had a large compensatory
effect (about 8% of the losses by land-use change).
The compensation of carbon losses by CO2 fertiliza-
tion varied by regions, ranging from 7% in Southeast
Asia to 51% in East Asia. The compensation of
carbon losses by climate variability also varied by
regions, ranging from 5% in Southeast Asia to 16%
in East Asia. Cropland establishment and abandon-
ment in South and Southeast Asia together during
1860–1990 resulted in a net carbon release of 29.7
Pg C to the atmosphere.
The relative contribution of climate variability,
increasing atmospheric CO2, and land-use change to
carbon storage in monsoon Asia also varied over time
(Fig. 2). For example, terrestrial carbon storage in East
Asia showed a slow recovery since the 1970s because
of the increasing role of CO2 fertilization and forest
regrowth in enhancing annual net carbon storage.
Table 2
Relative contribution of CO2, climate, and land use to carbon
storage during 1860–1990
East
Asia
South
Asia
Southeast
Asia
Monsoon
Asia
Globe
CO2 6.6 1.9 1.5 10.1 46.3
Climate 2.0 0.6 1.0 3.6 10.3
Land use � 12.9 � 9.1 � 20.6 � 42.6 � 116.3
Total � 4.3 � 6.6 � 18.1 � 29.0 � 57.7
H. Tian et al. / Global and Planetary Change 37 (2003) 201–217208
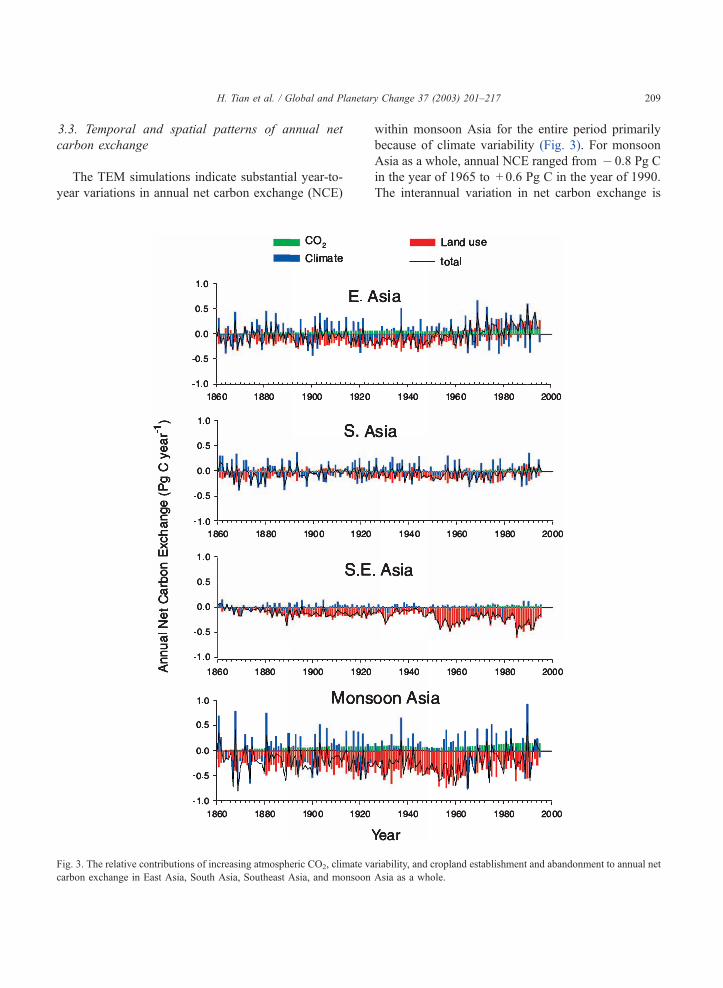
3.3. Temporal and spatial patterns of annual net
carbon exchange
The TEM simulations indicate substantial year-to-
year variations in annual net carbon exchange (NCE)
within monsoon Asia for the entire period primarily
because of climate variability (Fig. 3). For monsoon
Asia as a whole, annual NCE ranged from � 0.8 Pg C
in the year of 1965 to + 0.6 Pg C in the year of 1990.
The interannual variation in net carbon exchange is
Fig. 3. The relative contributions of increasing atmospheric CO2, climate variability, and cropland establishment and abandonment to annual net
carbon exchange in East Asia, South Asia, Southeast Asia, and monsoon Asia as a whole.
H. Tian et al. / Global and Planetary Change 37 (2003) 201–217 209
different from region to region. East Asia showed the
largest variation in annual NCE, ranging from � 0.3
Pg C in the year of 1944 to + 0.6 Pg C in the year of
1990. For South Asia, annual NCE ranged from � 0.2
Pg C in the year of 1965 to + 0.2 Pg C in the year of
1990. For Southeast Asia, annual NCE ranged from
� 0.5 Pg C in the year of 1985 to + 0.04 Pg C in the
year of 1904. The relative role of climate variability
on NCE for all subregions also showed large year-to-
year variations (Fig. 3). In a specific year, the effect of
drought or wet climate on carbon storage could be
much larger than that of either increasing CO2 or land-
use change. The effects of land-use change on NCE
showed small interannual variations, but large decadal
variations, especially in Southeast Asia.
Interannual variations in net carbon exchange are
coupled to variations in climate. Annual NCE for
monsoon Asia was significantly correlated with an-
nual precipitation (r= 0.66, P < 0.01). A closer analy-
sis of the monthly simulation results reveals that the
amount of precipitation in summer (June, July, and
August) and fall (September, October, and November)
mainly control annual NPP. Our analyses show that
annual NPP was not correlated with temperature, but
annual RH was significantly correlated with temper-
ature (r = 0.61, P < 0.05). Annual NCE was coupled to
annual NPP (r = 0.72, P < 0.01). Change in annual RH
was relatively small for the study period. Thus,
temperature-induced change in RH did not have a
significant effect on NCE for this study period. The
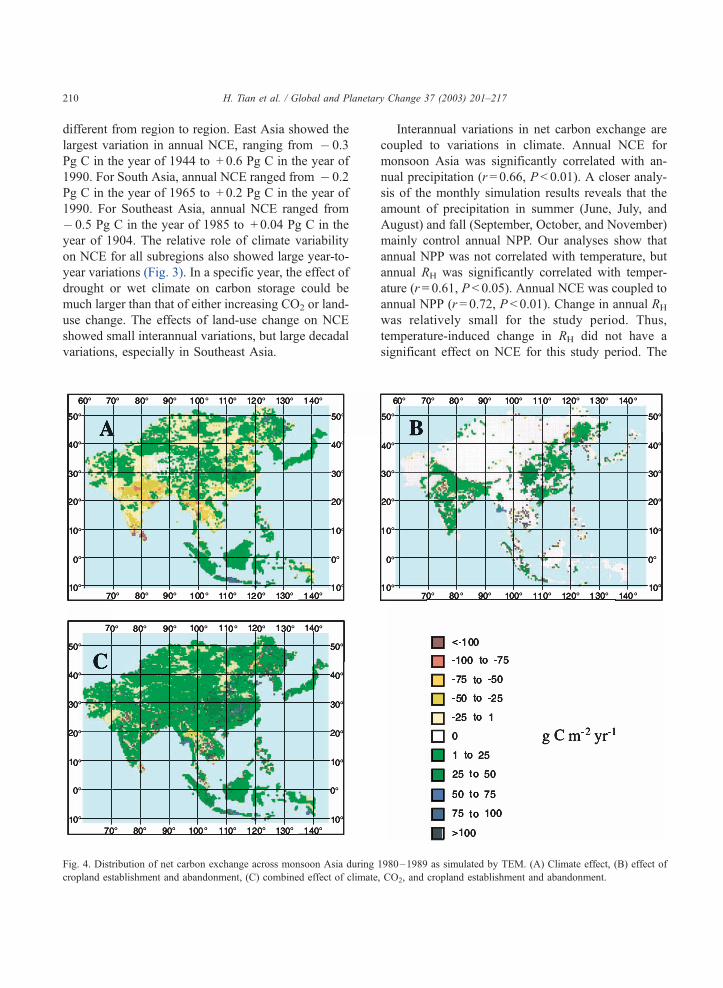
Fig. 4. Distribution of net carbon exchange across monsoon Asia during 1980–1989 as simulated by TEM. (A) Climate effect, (B) effect of
cropland establishment and abandonment, (C) combined effect of climate, CO2, and cropland establishment and abandonment.
H. Tian et al. / Global and Planetary Change 37 (2003) 201–217210
precipitation effect on annual NPP, however, deter-
mined the magnitude of interannual variation in NCE
for monsoon Asia.
The TEM simulations indicate that climate varia-
bility and land-use change led to substantial spatial
variations in net carbon exchange (Fig. 4). For the
1980s, climate variability caused much of south Asia to
act as a carbon source to the atmosphere. Land-use
change in India and eastern China resulted in carbon
accumulation, while deforestation in some regions of
Southeast Asia led to carbon release to the atmosphere.
Year-to-year changes in the spatial pattern of net carbon
exchange are mostly caused by changes in the spatial
pattern of precipitation, which can change dramatically
with monsoon events. In strong monsoon years, which
bring rainfall to much of monsoon region, most eco-
systems act as a sink of carbon from the atmosphere.
Conversely, in weak monsoon years, which bring hot,
dry weather to much of monsoon Asia, most ecosys-
tems act as sources of carbon to the atmosphere.
However, increasing atmospheric CO2 generally leads
to increased carbon storage over entire region.
3.4. Regional carbon budget in the 1980s
The TEM simulations indicate that, for the decade
of 1980–1989, the combination of climate variability,
increasing atmospheric CO2, and cropland establish-
ment and abandonment could result in a mean carbon
sink of about 0.149 Pg C per year in East Asia, but a
mean source of about 0.021 Pg C per year in South
Asia and a mean source of 0.288 Pg C per year in
Southeast Asia (Table 3). Monsoon Asia as a whole
acted as a mean source of 0.158 Pg C per year for the
period 1980–1989. The relative contribution of CO2,
climate, and land use to the simulated carbon storage
varied among three subregions. All three factors, CO2,
climate, and land use, led to a carbon sequestration by
ecosystems in East Asia (Table 3). In South Asia,
however, climate and land use resulted in carbon
release to the atmosphere. Increasing atmospheric
CO2 concentration partially compensated for the car-
bon loss associated with tropical deforestation. For
tropical Asia (South plus Southeast Asia), our analysis
indicated that cropland establishment and abandon-
ment alone resulted in a net release of 0.346 Pg C per
year to the atmosphere during 1980–1989. While
accounting for the combined effect of climate, CO2,
cropland establishment and abandonment, TEM sim-
ulations suggest that tropical Asia acted as a net
carbon source of 0.308 Pg C per year for the period
1980–1990.
4. Discussion
Our study indicates that land-use change has a
dominant influence on terrestrial carbon storage in
monsoon Asia. During 1860–1990, land ecosystems
in monsoon Asia acted as a major source of carbon to
the atmosphere. This is because land ecosystems in
monsoon Asia have been intensively disturbed and
managed by human activities (Brown et al., 1993;
Richards and Flint, 1994; Liu and Buheaosier, 2000).
Our results are comparable to other estimates derived
from bookkeeping models (Houghton et al., 1983;
Houghton, 1999) that balance deforestation and forest
regrowth over time, assuming generic time-dependent
functions for carbon gains and losses in different
ecosystem types. According to the analysis by
Houghton (1999), global land-use change for the
period 1850–1990 resulted in a loss of 124 Pg C,
with 38.6 Pg C from land-use change in tropical Asia.
Of the land-use changes considered in an analysis by
Houghton (1999), cropland establishment/abandon-
ment was responsible for 68% of the net land-use
Table 3
Relative contribution of CO2, climate, and land-use to carbon storage during 1980–1989
East Asia South Asia Southeast Asia Monsoon Asia
Mean (Pg C) Percentage Mean (Pg C) Percentage Mean (Pg C) Percentage Mean (Pg C) Percentage
CO2 0.088 59 0.029 � 138 0.030 � 10 0.147 � 93
Climate 0.031 21 � 0.034 162 0.012 � 4 0.010 � 6
Land use 0.030 20 � 0.016 76 � 0.330 115 � 0.315 199
Total 0.149 100 � 0.021 100 � 0.288 100 � 0.158 100
H. Tian et al. / Global and Planetary Change 37 (2003) 201–217 211
flux, while harvest of wood, conversion of forests to
pastures, and shifting cultivation accounted for 16%,
13%, and 4% of the net flux, respectively. Our
estimates indicate that cropland establishment and
abandonment alone led to a loss of 116.3 Pg C at
the global scale, with 29.7 Pg C from tropical Asia
(Table 2). Thus cropland establishment and abandon-
ment for the past one and a half century was respon-
sible for most of the losses in carbon caused by land-
use change at global scale as well as monsoon Asia,
assuming that Houghton’s estimate is correct.
For the time period 1980–1989, we estimate that
cropland establishment and abandonment in tropical
Asia resulted in a loss of 0.35 Pg C (Table 3). Our
estimate is much lower than the loss of 1.08 Pg C per
year as estimated by Houghton (1999) or the loss of
0.66 Pg C per year as estimated by Fearnside (2000).
Recent reviews of the global carbon budget indicate
that, during 1980–1989, global land-use change
caused a release of 1.7 Pg C from land to the
atmosphere (Prentice et al., 2001). This magnitude
of carbon released from land-use change includes a
loss of 1.08 Pg C from tropical Asia. If our estimate of
carbon release from tropical Asia is correct, it would
not require a terrestrial carbon sink as large as 1.9 Pg
C per year to balance the global carbon budget, as
reported by Intergovernmental Panel of Climate
Change (Prentice et al., 2001).
Our estimates of carbon sequestration during the
1980s in East Asia (0.149 Pg C per year), based on the
combined effects of climate variability, CO2 fertiliza-
tion, and land-use change, are similar to estimates that
we developed for ecosystems in the United States
(0.136 Pg C per year) using TEM. Both sets of
estimates are consistent with the results of inverse
modeling studies that suggest a ‘‘missing’’ terrestrial
sink exists in the northern hemisphere (Tans et al.,
1990; Bousquet et al., 1999), but disagree with the
magnitude of these sinks as suggested by some studies
(Fan et al., 1998). Our analyses indicate that carbon is
sequestered in both vegetation and soils in East Asia
as a result of both CO2 fertilization and the regrowth
of vegetation on abandoned croplands. The accumu-
lation of 10 Pg C in monsoon Asia between 1860 and
1990, as a result of CO2 fertilization, corresponds to a
concurrent increase in NPP of 4%. This simulated
NPP response is consistent but less than the 25% NPP
response observed in a young loblolly pine forest
stand by Delucia et al. (1999). However, other anal-
yses based on forest inventories (Casperson et al.,
2000) have suggested that CO2 fertilization has a
minor effect on carbon sequestration in forests. Infor-
mation from field studies that examine the ecosystem
response to enhanced atmospheric CO2 concentration,
such as the free-air CO2 exchange (FACE) experi-
ments, need to be obtained for the monsoon Asia
region before the response to CO2 fertilization as
simulated by TEM can be fully evaluated for this
region.
Our modeled results show that carbon dynamics in
terrestrial ecosystems of monsoon Asia exhibit sub-
stantial interannual, decadal, and spatial variations.
These variations are related to the magnitude and
spatial distribution of rainfall that also show substan-
tial temporal variations at various scales from seasonal
to decadal (Fu and Wen, 1999). The sensitivity of
annual carbon storage to precipitation drawn from our
modeled results is consistent with the empirical studies
that indicate a significant correlation between interan-
nual changes in precipitation and atmospheric CO2
growth rate (Yang and Wang, 2000). Our analysis did
not show a temperature control on interannual varia-
tions in carbon storage in monsoon Asia. This result is
inconsistent with the analysis of Braswell et al. (1997),
who indicated that temperature is an important control
on interannual variations in ecosystem production for
land ecosystems at the global scale. However, a con-
tinual increase in temperature in the future could
change the relative importance of these two climatic
factors on the carbon dynamics of these ecosystems in
a significant way (Yan et al., 2000). The year-to-year
variations in temperature and precipitation also influ-
enced the effect of CO2 fertilization on net carbon
storage in monsoon Asia. The response to CO2 fertil-
ization tends to be larger during a weak monsoon year
when water availability is more limited.
The relationship between net carbon exchange and
precipitation in monsoon Asia also generally agrees
with our findings for the tropical ecosystems of the
Amazon Basin (Tian et al., 1998, 2000b). In these
studies, the interannual variations in net carbon stor-
age within the Amazon Basin are found to be corre-
lated with year-to-year variations in precipitation that
are associated with ENSO events. For monsoon Asia,
an El Nino event is often connected to a weak
monsoon, which results in very dry climate condition
H. Tian et al. / Global and Planetary Change 37 (2003) 201–217212
in South and Southeast Asia (Kumar et al., 1999).
Thus, an El Nino event linked with a weak monsoon
can cause a large carbon release from tropical ecosys-
tems, but an El Nino event also often brings heavy
rainfall to East Asia. In contrast, a La Nina event
brings dry weather to the northern parts of monsoon
Asia, which leads to a loss of carbon to the atmos-
phere from this region. The interactive effects of
ENSO and monsoon on carbon dynamics remains
unclear and deserve more attention.
In this study, we have shown the importance of
considering spatial and temporal variability in the
effects of land-use change, CO2 fertilization, and
climate variability on carbon dynamics in monsoon
Asia. However, our analysis has been limited by
uncertainties related to the representation of environ-
mental factors by our spatially explicit data sets and by
our current inability to simulate the effects of some
potentially important factors on the regional carbon
budget of monsoon Asia. For example, there are large
discrepancies among estimates on cropland area in
China (Table 4). Cropland area in China varies from
950� 103 km2 as estimated by State Statistical Bureau
(1994) to 2445� 103 km2 as estimated by this study
based on the cropland data set of McGuire et al.
(2001). The best estimate is based on Landsat TM
data and indicates that cropland area in the early 1990s
was about 1373� 103 km2 (Liu, 1996; Liu and
Buheaosier, 2000). This uncertainty in cropland area
influences our estimate of regional carbon fluxes in
this region. The construction of reliable data sets of
historical distribution of croplands, therefore, is essen-
tial for better estimation of regional carbon budgets.
The land-use analysis presented here is incomplete
because it only considered the effects on the regional
carbon budget associated with row crop agriculture. It
did not consider: (1) the conversion of forests to
pastures, (2) possible changes in harvest and regrowth
cycles within managed forests, and (3) urbanization
and desertification. To address these issues, spatially
explicit data sets of the historical distribution of
pastures, forest harvest, urban areas, and the extent
of desertification need to be developed to improve
estimates of regional carbon budgets. In addition, more
information from field studies is required to develop
algorithms that better simulate the effect of these other
land-use changes on the regional carbon budget.
In this study, we assumed that cropland abandon-
ment always led to carbon sequestration associated
with the regrowth of natural vegetation. However,
many croplands in this region are instead being
converted to other uses. The fate of cleared lands is
an important factor that affects carbon fluxes and
storage (Melillo et al., 1988; Hall et al., 1995;
Houghton, 1999). While reforestation and plantation
establishment can lead to carbon sequestration (Fang
et al., 1998; Lal and Singh, 2000) as simulated in our
study, urbanization, desertification, and other land
degradation could cause long-term carbon loss to the
atmosphere. In China, preliminary analyses of land-
cover changes detected using both satellite imagery
and aerial photography indicate a number of interest-
ing trends in various regions of China in recent
decades. These trends include changes (both gains
and losses) in cropland area, urban expansion, and
increased desertification. For example, Liu Jiyuan’s
research team found an increase in cropland area in
the five provinces of northern China (Inner Mongolia,
Liaoning, Jilin, Heilongjiang, and Xinjiang) of about
64� 106 km2 during the 1980s to 1990s. The new
cropland areas in northern China were converted from
forests, grasslands, and wetlands. In contrast, in the 12
provinces or regions of eastern China (Beijing, Tian-
jin, Hebei, Shanghai, Zhejiang, Fujian, Shandong,
Henan, Hunan, Guangdong, Guangxi, and Hainan),
Table 4
China’s cropland area in early 1990s as estimated by different
investigators
Sources Area
(103 km2)
Percentage relative to the
estimate of Liu (1996)
SSB 950 � 31
SLA 1225 � 11
FAO 1236 � 10
IGBP-DIS (pure) 1402 2
IGBP-DIS (mixed) 1941 41
CCMLP 2445 56
Landsat TM based
(Liu, 1996)
1373 0
SSB: State Statistical Bureau (1994), SLA: State Land Admin-
istration, FAO: Food and Agricultural Organization (1998), IGBP-
DIS (pure): include only pixels classified as pure cropland in IGBP
Discover land cover data set derived from AVHRR satellite data for
the period of 1992–1993, IGBP–DIS (mixed): include pure pixels
plus half the area of the pixels classified as cropland and natural
vegetation mosaic (Loveland and Belward, 1997; Frolking et al.,
1999), CCMLP: Carbon Cycle Model Linkage Project (McGuire et
al., 2001).
H. Tian et al. / Global and Planetary Change 37 (2003) 201–217 213
cropland area decreased by about 52� 106 km2 dur-
ing the 1980s and 1990s. This reduction in cropland
area is in part due to urbanization in eastern China.
For example, the urban areas in Pear River Delta
region from 1980s to 1990s, increased by 987 km2.
Urbanization in Asia has become an important factor
that could lead to carbon loss to the atmosphere due to
increasing human population.
Desertification is also emerging as a dominant
process in western China (Liu, 1996). The area of
desert in this region has increased markedly in the past
decades. In the Yezi county of the Ningxia province,
for example, the area of desert increased by 156%
over three decades, from 1501 km2 in 1961 to 3836
km2 in 1993. In addition, the degradation of grassland
occurred in most parts of the county. In this study, we
have been able to simulate some of the effects of land
degradation (e.g., loss of soil carbon and nitrogen)
associated with the long-term removal of biomass in
agricultural products, but have not been able to
address other issues related to desertification. To
reduce uncertainty in regional carbon budgets, clearly,
more work needs to be done to better account for
these factors in future studies.
Besides CO2 fertilization, recent reviews of the
global carbon budget also indicate that terrestrial
carbon storage could also be affected by nitrogen
deposition and other changes in atmospheric chem-
istry (Melillo et al., 1996; Prentice et al., 2001) not
considered in this study. In recent decades, the rapid
industrialization in monsoon Asia has resulted in
increased anthropogenic N deposition and tropo-
spheric ozone levels. Nitrogen inputs, such as N
deposition, should enhance terrestrial carbon storage
(Melillo and Gosz, 1983; Galloway et al., 1995;
Townsend et al., 1996; Holland et al., 1997), but it
is also possible that chronic high inputs of nitrogen
may cause terrestrial ecosystems to lose carbon (Aber
et al., 1993). Anthropogenic nitrogen deposition may
be contributing approximately 0.2–0.5 Pg C per year
to global carbon storage (Townsend et al., 1996;
Holland et al., 1997; Nadelhoffer et al., 1999). A
large amount of nitrogen deposition from fertilizer use
and fossil fuel burning occurs in East Asia. This
nitrogen deposition may have substantial interactions
with increasing atmospheric CO2 on the regrowth of
forests after cropland abandonment to influence car-
bon sequestration in terrestrial ecosystems. On the
other hand, both field and modeling studies have
shown that ozone decreases crop yield (Chameides
et al., 1999a) and forest productivity (Ollinger et al.,
1997; Mclaughlin and Percy, 2000). In addition,
atmospheric aerosols and regional haze may also
reduce crop productivity (Chameides et al., 1999b).
The responses of TEM to increasing atmospheric CO2
indicate that nitrogen availability represents a major
constraint on the ability of terrestrial ecosystems to
incorporate elevated CO2 into production (Melillo et
al., 1993; McGuire et al., 1995, 1997; Kicklighter et
al., 1999; Tian et al., 1998, 1999). To better under-
stand the carbon dynamics in monsoon Asia, future
studies should take these atmospheric chemistry fac-
tors into account. To include these factors into eco-
system models, however, will require the development
of spatially explicit historical data sets of nitrogen
deposition, ozone and other pollutants.
Our results have shown the importance of consid-
ering spatial and temporal variability in the effects of
land-use change, climate variability, and CO2 fertil-
ization on regional carbon budget for monsoon Asia.
To improve our ability in estimating regional carbon
budget for monsoon Asia, the effects of rotational
forestry, pasture, urbanization, desertification, and air
pollution should be incorporated in future analyses.
Acknowledgements
This study is supported by Earth Observing System
of the National Aeronautics and Space Administra-
tion, MIT Joint Program for the Science and Policy of
Global Change, and EPRI and National Science
Foundation of China (40128005).
References
Aber, J.D., Magill, A., Boone, R., Melillo, J.M., Steudler, P.A.,
Bowden, R., 1993. Plant and soil responses to chronic nitrogen
additions at the Harvard Forest, Massachusetts. Ecological Ap-
plications 3, 156–166.
Bousquet, P., Ciais, P., Peylin, P., Ramonet, M., Monfray, P., 1999.
Inverse modeling of annual atmospheric CO2 sources and sinks:
1. Method and control inversion. Journal of Geophysical Re-
search 104 (D21), 26161–26178.
Braswell, B.H., Schimel, D.S., Linder, E., Moore III, B., 1997. The
response of global terrestrial ecosystems to interannual temper-
ature variability. Science 278, 870–872.
H. Tian et al. / Global and Planetary Change 37 (2003) 201–217214
Brown, S., Hall, C.S., Knabe, W., et al., 1993. Tropical forests: their
past, present, and potential future role in the terrestrial carbon
budget. Water, Air and Soil Pollution 70, 71–94.
Cao, M., Woodward, F.I., 1998. Dynamic responses of terrestrial
ecosystem carbon cycling to global climate change. Nature 393,
249–252.
Caspersen, J.P., Pacala, S.W., Jenkins, J.C., Hurtt, G.C., Moor-
croft, P.R., Birdsey, R.A., 2000. Contributions of land-use his-
tory to carbon accumulation in U.S. Forests. Science 290,
1148–1151.
Chameides, W.L., Li, X., Tang, X., Zhou, X., Luo, C., Kiang, C.S.,
St. John, J., Saylor, R.D., Liu, S.C., Lam, K.S., Wang, T., Gior-
gi, F., 1999a. Is ozone pollution affecting crop yields in China?
Geophysical Research Letters 26, 867–870.
Chameides, W.L., Hu, H., Liu, S.C., Bergin, M., Zhou, X., Mearns,
L., Wang, G., Kiang, C.S., Saylor, R.D., Luo, C., Huang, Y.,
Steiner, A., Giorgi, F., 1999b. Case study of the effects of at-
mospheric aerosols and reagional haze on agriculture: an oppor-
tunity to enhance crop yields in China through emission
controls? PNAS 24, 13626–13633.
Cramer, W., Kicklighter, D.W., Bondeau, A., Moore III, B., Chur-
kina, G., Nemry, B., Ruimy, A., Schloss, A., the Participants of
the Postdam NPP Model Intercomparison, 1999. Comparing
global models of terrestrial net primary productivity (NPP):
overview and key results. Global Change Biology 5 (Suppl.
1), 1–15.
Delucia, E.H., Hamilton, J.G., Naidu, S.L., Thomas, R.B., An-
drews, J.A., Finzi, A., Lavine, M., Matamala, R., Mohan, J.E.,
Hendrey, G.R., Schlesinger, W.H., 1999. Net primary produc-
tion of a forest ecosystem with experimental CO2 enrichment.
Science 284, 1177–1179.
Esser, G., 1995. Contribution of Monsoon Asia to the carbon
budget of the biosphere, past and future. Vegetatio 121,
175–188.
Etheridge, D.M., Steele, L.P., Langenfelds, R.L., Francey, R.J.,
Barnola, J.M., Morgan, V.I., 1996. Natural and anthropogenic
changes in atmospheric CO2 over the last 1000 years from air in
antarctic ice and firn. Journal of Geophysical Research 101
(D2), 4115–4128.
Fan, S.M., Gloor, M., Malhlman, J., Pacala, S., Sarmiento, J., Ta-
kahashi, T., Tans, P., 1998. A large terrestrial carbon sink in
North America implied by atmospheric and oceanic CO2 data
and models. Science 282, 442–446.
Fang, J.Y., Wang, G.G., Liu, G.H., Xu, S.L., 1998. Forest biomass
of China: an estimate based on the biomass–volume relation-
ship. Ecological Applications 8, 1084–1091.
Fearnside, P.M., 2000. Global warming and tropical land-use
change: greenhouse gas emissions from biomass burning, de-
composition and soils in forest conversion, shifting cultivation
and secondary vegetation. Climatic Change 46, 115–158.
Food and Agriculture Organization Statistics (FAOSTAT), 1998.
Statistical Database of the Food and Agricultural Organization
of the United Nations, available on the World Wide Web at,
http://apps.fao.org.
Food and Agriculture Organization-United Nations Educational,
Scientific Organization (FAO-UNESCO), 1971. Soil map of
the world, 1:5,000,000, Paris.
Frolking, S., Xiao, X., Zhuang, Y., Sals, W., Li, C., 1999. Agricul-
tural land-use in China: a comparison of area estimates from
ground-based census and satellite-borne remote sensing. Global
Ecology and Biogeography 8, 407–416.
Fu, C., Wen, W.G., 1999. Variation of ecosystems over East Asia in
association with seasonal, interannual and decadal monsoon cli-
mate variability. Climatic Change 43, 477–494.
Galloway, J., Melillo, J.M. (Eds.), 1998. Asian Change in the Con-
text of Global Change: Impact of Natural and Anthropogenic
Changes in Asia on Global Biogeochemical Cycles. Cambridge
Univ. Press, UK. 364 pp.
Galloway, J., Schlesinger, W., Levy II, H., Michaels, A.,
Schnoor, J., 1995. Nitrogen fixation: anthropogenic enhance-
ment environmental response. Global Biogeochemical Cycles 9,
235–252.
Gao, Q., Yu, M., Yang, X., 2000. An analysis on sensitivity of
terrestrial ecosystems in China to climate change using spatial
simulation. Climatic Change 47, 373–400.
Hall, C.A.S., Tian, H., Qi, Y., Pontius, G., Cornell, J., 1995. Mod-
eling spatial and temporal pattern of tropical land use change.
Journal of Biogeography 22, 753–757.
Hirose, T., Walker, B.H. (Eds.), 1995. Global Change and Terres-
trial Ecosystems in Monsoon Asia. Kluwer Academic Publish-
ing, Dordrecht, The Netherlands.
Holland, E., Braswell, B., Lamarque, J.-F., Townsend, A., Sulzman,
J., Muller, J.-F., Dentener, F., Brasseur, G., Levy II, H., Penner,
J.E., Roelofs, G.-J., 1997. Variations in the predicted spatial
distribution of atmospheric nitrogen deposition and their impact
on carbon uptake by terrestrial ecosystems. Journal of Geophys-
ical Research 102 (D13), 15849–15866.
Houghton, R.A., 1999. The annual net flux of carbon to the at-
mosphere from changes in land use 1850–1990. Tellus 51B,
298–313.
Houghton, R.A., Hackler, J.L., 1999. Emission of carbon from
forestry and land-use change in tropical Asia. Global Change
Biology 5, 481–492.
Houghton, R.A., Hobbie, J.E., Melillo, J.M., Moore III, B., Peter-
son, B.J., Shaver, G.R., Woodwell, G.M., 1983. Changes in the
carbon content of terrestrial biota and soils between 1860 and
1980: a net release of CO2 to the atmosphere. Ecological Mono-
graphs 53, 235–262.
Hulme, M., 1995. A historical monthly precipitation data for global
land areas from 1900 to 1994, gridded at 3.75� 2.5 resolution.
Constructed at climate research Unit, University of East Anglia,
Norwich, UK.
Keeling, C.D., Whorf, T.P., Wahlen, M., Pilcht, M., 1980. Interan-
nual extremes in the rate of rise of atmospheric carbon dioxide
since 1980. Nature 375, 666–670.
Kicklighter, D.W., Bruno, M., Donges, S., Esser, G., Heimann, M.,
Helfrich, J., Ift, F., Joos, F., Kaduk, J.W., Kohlmaier, G.H.,
McGuire, A.D., Melillo, J.M., Meyer, R., Moore, B., Nadler,
A., Prentice, I.C., Sauf, W., Schloss, A., Sitch, S., Wittenberg,
U., Wurth, G., 1999. A first order analysis of the potential of
CO2 fertilization to affect the global carbon budget: an inter-
comparison study of four terrestrial biosphere models. Tellus
51B, 343–366.
Kumar, K.K., Rajagopalan, B., Cane, M.A., 1999. On the weaken-
H. Tian et al. / Global and Planetary Change 37 (2003) 201–217 215
ing relationship between the indian monsoon and ENSO. Sci-
ence 284, 2156–2159.
Ji, J.J., 1995. A climate–vegetation interaction model: simulating
physical and biological processes at the surface. Journal of Bio-
geography 22, 445–451.
Jones, P.D., 1994. Hemispheric surface air temperature variations:
a reanalysis and an update to 1993. Journal of Climate 7,
1794–1802.
Lal, M., Singh, R., 2000. Carbon sequestration potential of In-
dian Forests. Environmental Monitoring and Assessment 60,
315–327.
Leemans, R., Cramer, W., 1991. The IIASA database for mean
monthly values of temperature, precipitation and cloudiness of
a global terrestrial grid. International Institute for Applied Sys-
tems Analysis (RR-91-18).
Liu, J., 1996. Macro-Scale Survey and Dynamic Study of Natural
Resources and Environment of China by Remote Sensing. Chi-
na Science and Technology Publishing House, Beijing.
Liu, J., Buheaosier, B., 2000. Study on spatial-temporal feature of
modern land-use change in China: remote sensing technique.
Quaternary Science 3, 229–239.
Loveland, T.R., Belward, A.S., 1997. The IGBP-DIS global 1 km
land cover data set, DISCover: first results. International Journal
of Remote Sensing 18, 3289–3295.
McGuire, A.D., Melillo, J.M., Joyce, L.A., Kicklighter, D.W.,
Grace, A.L., Moore III, B., Vorosmarty, C.J., 1992. Interactions
between carbon and nitrogen dynamics in estimating net pri-
mary productivity for potential vegetation in North America.
Global Biogeochemical Cycles 6, 101–124.
McGuire, A.D., Melillo, J.M., Kicklighter, D.W., Joyce, L., 1995.
Equilibrium responses of soil carbon to climate change: empiri-
cal and process-based estimates. Journal of Biogeography 22,
785–796.
McGuire, A.D., Melillo, J.M., Kicklighter, D.W., Pan, Y., Xiao, X.,
Helfrich, J., Moore III, B., Vorosmarty, C.J., Schloss, A.L.,
1997. Equilibrium response of global primary production and
carbon storage to doubled atmospheric carbon dioxide: sensitiv-
ity to changes in vegetation nitrogen concentration. Global Bio-
geochemical Cycles 11, 173–189.
McGuire, A.D., Clein, J.S., Melillo, J.M., Kicklighter, D.W., Meier,
R.A., Vorosmarty, C.J., Serreze, M.C., 2000. Modeling carbon
responses of tundra ecosystems to historical and projected cli-
mate: Sensitivity of pan-arctic carbon storage to temporal and
spatial variation in climate. Global Change Biology 6 (Suppl. 1),
141–159.
McGuire, A.D., Sitch, S., Clein, J.S., Dargaville, R., Esser, G.,
Foley, J., Heimann, M., Joos, F., Kaplan, J., Kicklighter,
D.W., Meier, R.A., Melillo, J.M., Moore III, B., Prentice, I.C.,
Ramankutty, N., Reichenau, T., Schloss, A., Tian, H., Williams,
L.J., Wittenberg, U., 2001. Carbon balance of the terrestrial
biosphere in the twentieth century: analyses of CO2, climate
and land-use effects with four process-based ecosystem models.
Global Biogeochemical Cycles 15 (1), 183–206.
Mclaughlin, S., Percy, K., 2000. Forest health in North Ame-
rica: some perspectives on actual and potential roles of cli-
mate and air pollution. Water, Air and Soil Pollution 116,
151–197.
Melillo, J.M., Gosz, J., 1983. Interactions of biogeochemical cycles
in forest ecosystems. In: Bolin, B., Cook, R.B. (Eds.), The
Major Biogeochemical Cycles and Their Interactions. Wiley,
New York, pp. 177–222.
Melillo, J.M., Fruce, J.R., Houghton, R.A., Moore, B., Skole, D.L.,
1988. Land-use change in the Soviet Union between 1850 and
1980: causes of a net release of CO2 to the atmosphere. Tellus
40B, 116–128.
Melillo, J.M., McGuire, A.D., Kicklighter, D.W., Moore III, B.,
Vorosmarty, C.J., Schloss, A.L., 1993. Global climate
change and terrestrial net primary production. Nature 363,
234–240.
Melillo, J.M., Prentice, I.C., Farquhar, G.D., Schulze, E.-D., Sala,
O.E., 1996. Terrestrial biotic responses to environmental change
and feedbacks to climate. In: Houghton, J.T., Meira Filho, L.J.,
Callander, B.A., Harris, N., Kattenberg, A., Maskell, K. (Eds.),
Climate Change 1995: The Science of Climate Change. Cam-
bridge Univ. Press, New York, pp. 444–481.
Nadelhoffer, K.J., Emmett, B.A., Gundersen, P., Kjonaas, O.J.,
Koopmans, C.J., Schleppi, P., Tietema, A., Wright, R.F., 1999.
Nitrogen deposition makes a minor contribution to carbon se-
questration in temperate forests. Nature 398, 145–148.
NCAR/Navy, 1984. Global 10-minute elevation data. Digital tape
available through National Ocean and Atmospheric Adminis-
tration, National Geophysical Data Center, Boulder, CO,
USA.
Ni, J., Sykes, M.T., Prentice, I.C., Cramer, W., 2000. Modeling the
vegetation of China using the process-based equilibrium terres-
trial biosphere model BIOME3. Global Ecology and Biogeog-
raphy 9, 463–479.
Ollinger, S.V., Aber, J.S., Reich, P.B., 1997. Simulating ozone
effects on forest productivity: interactions among leaf-, cano-
py-, and stand-level processes. Ecological Applications 7,
1237–1251.
Pan, Y., Melillo, J.M., Kicklighter, D.W., Xiao, X., McGuire, A.D.,
2000. Modeling structural and functional responses of terrestrial
ecosystems in China to changes in climate and atmospheric
CO2. Acta Phytoecologica Sinica 24, 513–526.
Parthasarathy, B., Kumar, K.R., Kothawale, D.R, 1992. Indian sum-
mer monsoon rainfall indices:1871–1990. Meteorological Mag-
azine 121, 174–186.
Peng, C.H., Apps, M.J., 1997. Contribution of China to the global
carbon cycle since Last Glacial Maximum: reconstruction from
paleovegetation maps and an empirical biosphere model. Tellus
49B, 393–408.
Post, W.M., King, A., Wullschleger, S., 1997. Historical variations
in terrestrial biospheric carbon storage. Global Biogeochemical
Cycles 11, 99–109.
Prentice, I.C., Heimann, M., Sitch, S., 2000. The carbon balance of
the terrestrial biosphere: ecosystem models and atmospheric
observation. Ecological Applications 10 (6), 1553–1573.
Prentice, I.C., Farquhar, G.D., Fasham, M.J.R., Goulden, M.L.,
Hermann, M., Jaramillo, V.J., Kheshgi, H.S., Le Quere, C.,
Scholes, R.J., Wallace, D.W.R., 2001. The Carbon Cycle and
Atmospheric CO2 (Chapter 3). The Third Assessment Report of
Intergovernmental Panel on Climate Change (IPCC). Cambridge
Univ. Press, New York (in press).
H. Tian et al. / Global and Planetary Change 37 (2003) 201–217216
Raich, J.W., Rastetter, E.B., Melillo, J.M., Kicklighter, D.W.,
Steudler, P.A., Peterson, B.J., Grace, A.L., Moore III, B., Vor-
osmarty, C.J., 1991. Potential net primary productivity in South
America: application of a global model. Ecological Applications
1, 399–429.
Ramankutty, N., Foley, J.A., 1998. Characterizing patterns of global
land use: an analysis of global croplands data. Global Biogeo-
chemical Cycles 12, 667–685.
Ramankutty, N., Foley, J.A., 1999. Estimating historical changes in
global land cover: croplands from 1700 to 1992. Global Bio-
geochemical Cycles 13, 997–1027.
Richards, J.F., Flint, E.P., 1994. A century of land use change in
South and Southeast Asia. In: Dale, V.H. (Ed.), Effect of Land-
Use Change on Atmospheric CO2 Concentrations: South and
Southeast Asia as a Case Study. Springer-Verlag, New York,
pp. 15–66.
Schimel, D., Melillo, J., Tian, H., McGuire, D., Kicklighter, D.,
Kittel, T., Rosenbloom, N., Running, S., Thornton, P., Ojima,
D., Parton, W., Kelly, R., Sykes, M., Neilson, R., Rizzo, B.,
2000. Contribution of increasing CO2 and climate to carbon
storage by ecosystems in the United States. Science 287,
2004–2006.
State Statistical Bureau (SSB), 1994. Statistical Yearbook of China
1994. China Statistical Publisher House, Beijing, p. 795.
Tans, P., Fung, I., Takahashi, T., 1990. Observational constraints on
the global atmospheric carbon dioxide budget. Science 247,
1431–1438.
Tian, H., Melillo, J.M., Kicklighter, D.W., McGuire, A.D., Helfrich,
J., Moore III, B., Vorosmarty, C.J., 1998. Effect of interannual
climate variability on carbon storage in Amazonian ecosystems.
Nature 396, 664–667.
Tian, H., Melillo, J.M., Kicklighter, D.W., McGuire, A.D., Helfrich,
J., 1999. The sensitivity of terrestrial carbon storage to historical
climate variability and atmospheric CO2 in the United States.
Tellus 51B, 414–452.
Tian, H., Hall, C.A.S., Qi, Y., 2000a. Increased biotic metabolism
of the biosphere inferred from observed data and model. Science
in China. Series B 43 (1), 58–68.
Tian, H., Melillo, J.M., Kicklighter, D.W., McGuire, A.D., Helfrich,
J., Moore III, B., Vorosmarty, C.J., 2000b. Climatic and biotic
controls on annual carbon storage in Amazonian ecosystems.
Global Ecology and Biogeography 9, 315–336.
Townsend, A.R., Braswell, B., Holland, E., Penner, J., 1996. Spatial
and temporal patterns in terrestrial carbon storage due to deposi-
tion of fossil fuel nitrogen. Ecological Applications 6, 806–814.
United Nations Population Division (UNPD), 1998. World Popula-
tion Prospects: The 1998 Revision.
VEMAP Members, 1995. Vegetation/Ecosystem Modeling and
Analysis Project (VEMAP): a comparison of biogeography
and biogeochemistry models in the context of global climate
change. Global Biogeochemical Cycles 9 (4), 407–437.
Xiao, X., Melillo, J.M., Kicklighter, D.W., Pan, Y., McGuire, A.D.,
Helfrich, J., 1998. Net primary production of terrestrial ecosys-
tems in China and its equilibrium responses to changes in cli-
mate and atmospheric CO2 concentration. Acta Phytoecologica
Sinica 22 (2), 97–118.
Yan, X.D., Fu, C.B., Shugart, H.H., 2000. Simulating the effects of
climate change on Xiaoxing’an Mountain forests. Acta Phytoe-
cologica Sinica 24 (3), 312–319.
Yang, X., Wang, M., 2000. Monsoon ecosystem control on atmos-
pheric CO2 interannual variability: inferred from a significant
positive correlation between year-to-year changes in land pre-
cipipitation and atmospheric CO2 growth rate. Geophysical Re-
search Letters 27 (11), 1671–1674.
H. Tian et al. / Global and Planetary Change 37 (2003) 201–217 217