Embed Size (px)
Citation preview
Regional Benchmarking of the fruit and vegetable supply chains in the context of the Euro-Mediterranean free trade area
Jean-Louis Rastoin1, Nassima Ayadi
1 and Jean-Claude Montigaud
2
1Agro. Montpellier, UMR Moisa, France
2INRA, UMR Moisa, France
Paper prepared for presentation at the 98th EAAE Seminar ‘Marketing Dynamics within the Global Trading System: New Perspectives’, Chania, Crete,
Greece as in: 29 June – 2 July, 2006 Copyright 2006 by [Jean-Louis Rastoin, Nassima Ayadi and Jean-Claude Montigaud]. All rights reserved. Readers may make verbatim copies of this document for non-commercial purposes by any means, provided that this copyright notice appears on all such copies.
1
98th EAAE Seminar Marketing Dynamics within the Global Trading System: New Perspectives
Chania, 29-30th June, 2006
Regional Benchmarking of the Fruit and Vegetable Supply Chains in the Context of
the Euro-Mediterranean Free Trade Area
Jean-Louis Rastoin*, Nassima Ayadi* and Jean-Claude Montigaud** *Agro.Montpellier, UMR Moisa, ** Inra, UMR Moisa
Abstract: This paper deals with the economic impact of agricultural trade liberalization on the fruit and vegetable marketing chains of five EU Mediterranean countries. The theoretical tools of this research are based on industrial organization (Scherer, 1973), strategic analysis (Wernerfelt, 1984), global commodity chain concept (Gereffi, 1994) and A. Sen’s capabilities approach (Sen, 1985, 1993). A “synthetic regional vulnerability index” (SRVI) is built through an inter-regional benchmarking. The SRVI itself is calculated from a range of indicators taking into account the following aspects: concentration and production specialization in fresh and processed fruit and vegetable supply chain, different forms of organization and public incentives, average period dynamics, economic and firm performances, sector-based and macroeconomic environmental constraints. The SRVI aggregates 4 linear functions. An impact simulation, combining 4 scenarios suggests a typology with 3 groups of euro-Mediterranean regions: strong vulnerability (10 regions), average and low vulnerability (10 regions for each category), highly linked with GDP/capita. Keywords: Supply chain analysis, Fruit and Vegetable Sector, International Benchmarking, Actor’s strategies The issue dealt with in this text is based on the hypothesis of international trade liberalisation of agricultural and agri-business products within the framework of the future Euro-Mediterranean free trade area which should be created by the 2010-2015 time horizon. This liberalisation will certainly affect the sectors concerned, both within the European Union and in the southern and eastern Mediterranean countries (SEMC), with the risk of abandonment of activity (and therefore increased unemployment) and, in certain cases, urban densification detrimental to the environment (Radwan and Reiffers, 2003). The aim of this research, pursued in the framework of a European programme1, is to evaluate these impacts and to propose public policy measures aimed at reducing the negative shocks. We have endeavoured here to characterise an important sector in 5 Mediterranean countries within the European Union (Spain, France, Greece, Italy, Portugal), i.e. the fresh and processed fruit and vegetables supply chain, and then to measure the “vulnerability” of the regions concerned in these countries to an intensification of competition from the SEMC. This evaluation leads us to undertake a comparative inter-regional benchmarking, identifying the strengths and weaknesses of those European regions, which are highly specialised in the fruit and vegetable sector. The research lie primarily in the theories of industrial organisation (Market structure analysis, Scherer, 1973), resources, competencies and capabilities (Wernerfelt, 1984, Sen, 1985) and global value chains (Gereffi, 1994). These theoretical models lend themselves very well to the analysis of agri-business supply chains (Montigaud, 1992). The EU is the leading world market for fruit and vegetables, with an apparent consumption per capita of almost 300 kg in 2001-2003, with the global average lying at 183kg. In light of the recommendations of nutritionists, who stress the considerable health benefits of consuming fruit and vegetables, we might conclude that the growth prospects of this market are favourable. Some years ago, in high-income countries, the traditional trend towards a more rapid development of processed fruit and vegetables was reversed. At present, it is fresh produce, including the 4th range, which is progressing more quickly.
1 EU-Sixth Framework Programme Priority 8.1, Policy-oriented research, Integrating and Strengthening the European Research Area, FP6-2002-SSP-, Impacts of Agricultural Trade Liberalization Between the EU and Mediterranean Countris, n° 502457, coordinated by par Florence Jacquet, Scientific administrator at Ciheam-Iam of Montpellier.
2
The EU is the second world producer of fruit and vegetables, accounting for 9% of total tonnage in 2003-05, a long way behind China (37%). The EU has suffered a certain amount of erosion due to slow growth (6% between 1994 and 2004, compared to 124% in China and 42% in India). With around 50
million tonnes, the 5 Mediterranean countries of the EU (Spain, France, Greece, Italy and Portugal) represent 72% of the total production of fruit and vegetables of the 15 member states. The southern and eastern Mediterranean countries (SEMC), with a total of 30 million tonnes, have experienced rapid growth (+34% in the past 10 years compared to +9% in the EU-15 and the 5 Mediterranean countries). In 2002, the European fruit and vegetable processing industry (EU-25) counted a little more than 8,000 companies with a total turnover of approx. 48 billion euros and 264,000 employees (Eurostat, 2005). In 2001, the main actors were Germany, Italy, France and the United Kingdom, each accounting for roughly 15% of the production of the EU-25, with Spain in 5th position accounting for 10%. Greece was in 9th position (3%) and Portugal 16th (1%). Between the end of the 1990s and 2002, Spain and Italy experienced an increase in turnover of about 50%, i.e. twice that of Portugal and France.
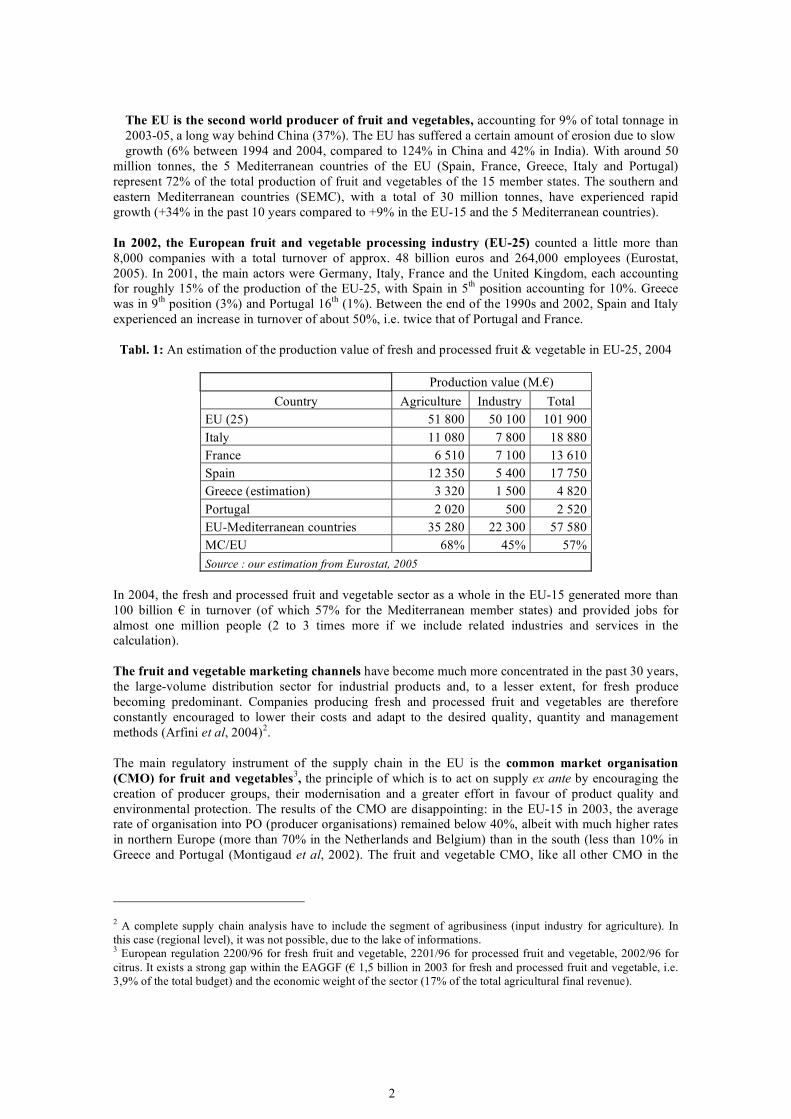
Tabl. 1: An estimation of the production value of fresh and processed fruit & vegetable in EU-25, 2004
Production value (M.€)
Country Agriculture Industry Total EU (25) 51 800 50 100 101 900 Italy 11 080 7 800 18 880 France 6 510 7 100 13 610 Spain 12 350 5 400 17 750 Greece (estimation) 3 320 1 500 4 820 Portugal 2 020 500 2 520 EU-Mediterranean countries 35 280 22 300 57 580 MC/EU 68% 45% 57% Source : our estimation from Eurostat, 2005
In 2004, the fresh and processed fruit and vegetable sector as a whole in the EU-15 generated more than 100 billion € in turnover (of which 57% for the Mediterranean member states) and provided jobs for almost one million people (2 to 3 times more if we include related industries and services in the calculation).
The fruit and vegetable marketing channels have become much more concentrated in the past 30 years, the large-volume distribution sector for industrial products and, to a lesser extent, for fresh produce becoming predominant. Companies producing fresh and processed fruit and vegetables are therefore constantly encouraged to lower their costs and adapt to the desired quality, quantity and management methods (Arfini et al, 2004)2. The main regulatory instrument of the supply chain in the EU is the common market organisation (CMO) for fruit and vegetables3, the principle of which is to act on supply ex ante by encouraging the creation of producer groups, their modernisation and a greater effort in favour of product quality and environmental protection. The results of the CMO are disappointing: in the EU-15 in 2003, the average rate of organisation into PO (producer organisations) remained below 40%, albeit with much higher rates in northern Europe (more than 70% in the Netherlands and Belgium) than in the south (less than 10% in Greece and Portugal (Montigaud et al, 2002). The fruit and vegetable CMO, like all other CMO in the
2 A complete supply chain analysis have to include the segment of agribusiness (input industry for agriculture). In this case (regional level), it was not possible, due to the lake of informations. 3 European regulation 2200/96 for fresh fruit and vegetable, 2201/96 for processed fruit and vegetable, 2002/96 for citrus. It exists a strong gap within the EAGGF (€ 1,5 billion in 2003 for fresh and processed fruit and vegetable, i.e. 3,9% of the total budget) and the economic weight of the sector (17% of the total agricultural final revenue).
3
CAP, should be reformed through the elimination of export subsidies, a decoupling of aid in relation to volumes produced, a single payment per farm and the introduction of eco-conditionalities.
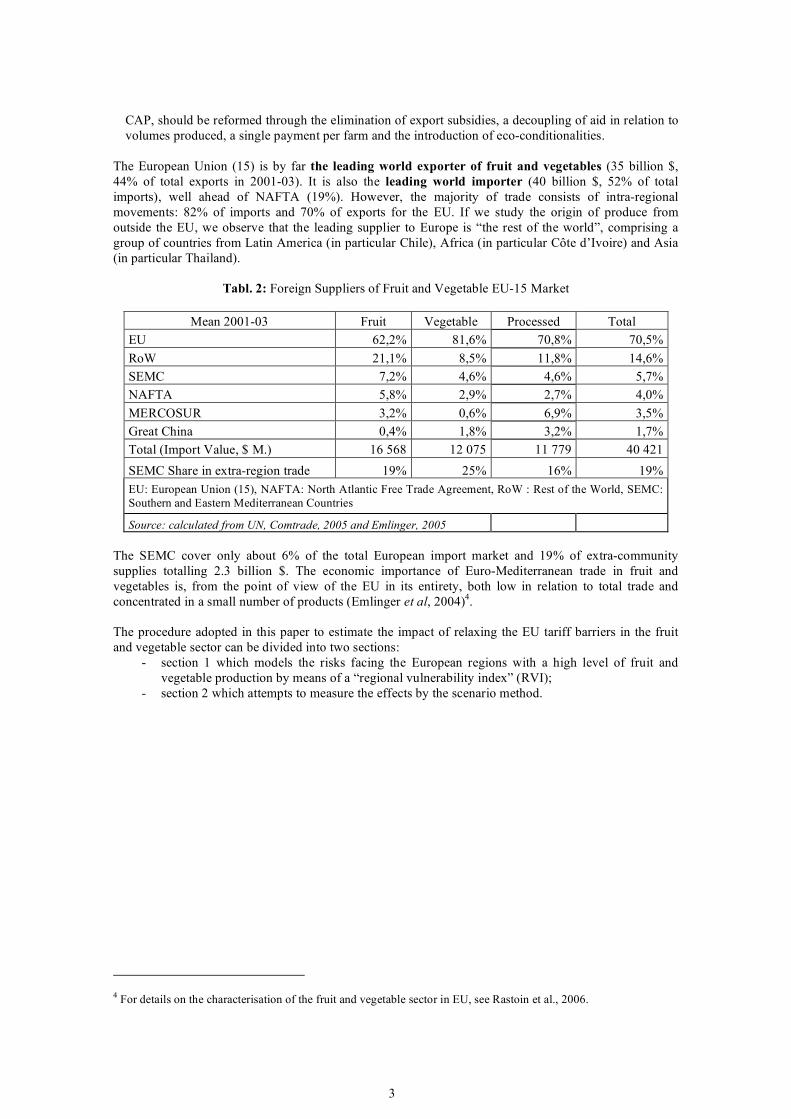
The European Union (15) is by far the leading world exporter of fruit and vegetables (35 billion $, 44% of total exports in 2001-03). It is also the leading world importer (40 billion $, 52% of total imports), well ahead of NAFTA (19%). However, the majority of trade consists of intra-regional movements: 82% of imports and 70% of exports for the EU. If we study the origin of produce from outside the EU, we observe that the leading supplier to Europe is “the rest of the world”, comprising a group of countries from Latin America (in particular Chile), Africa (in particular Côte d’Ivoire) and Asia (in particular Thailand).
Tabl. 2: Foreign Suppliers of Fruit and Vegetable EU-15 Market
Mean 2001-03 Fruit Vegetable Processed Total EU 62,2% 81,6% 70,8% 70,5% RoW 21,1% 8,5% 11,8% 14,6% SEMC 7,2% 4,6% 4,6% 5,7% NAFTA 5,8% 2,9% 2,7% 4,0% MERCOSUR 3,2% 0,6% 6,9% 3,5% Great China 0,4% 1,8% 3,2% 1,7% Total (Import Value, $ M.) 16 568 12 075 11 779 40 421
SEMC Share in extra-region trade 19% 25% 16% 19% EU: European Union (15), NAFTA: North Atlantic Free Trade Agreement, RoW : Rest of the World, SEMC: Southern and Eastern Mediterranean Countries
Source: calculated from UN, Comtrade, 2005 and Emlinger, 2005 The SEMC cover only about 6% of the total European import market and 19% of extra-community supplies totalling 2.3 billion $. The economic importance of Euro-Mediterranean trade in fruit and vegetables is, from the point of view of the EU in its entirety, both low in relation to total trade and concentrated in a small number of products (Emlinger et al, 2004)4. The procedure adopted in this paper to estimate the impact of relaxing the EU tariff barriers in the fruit and vegetable sector can be divided into two sections:
- section 1 which models the risks facing the European regions with a high level of fruit and vegetable production by means of a “regional vulnerability index” (RVI);
- section 2 which attempts to measure the effects by the scenario method.
4 For details on the characterisation of the fruit and vegetable sector in EU, see Rastoin et al., 2006.
4
1 - VULNERABILITY OF THE MEDITERRANEAN REGIONS OF THE EU WHICH PRODUCE FRESH AND PROCESSED FRUIT AND VEGETABLES
The European fruit and vegetables sector displays considerable diversity, depending on the supply sub-chains, the countries and the regions. The interactivity of the different factors, which determine how the supply chains work, creates multiple configurations specific to the regions. The importance of the fruit and vegetable activity in the regional economy, the level of economic development, the structure and dynamics of the companies which form the productive fabric, the efficiency of the public or professional institutions and the natural endowments of the regions (climate, soil quality, water resources, etc.) result in heterogeneous performances in the fruit and vegetable sector. The effects of commercial liberalisation are thus felt differently from one region to another. The aim of this section is to attempt, using a synthetic indicator called the RVI (Regional Vulnerability Index) to define the levels of vulnerability of the regions specialising in the production of fruit and vegetables in Spain, France, Greece, Italy and Portugal according to the current potentialities and constraints as well as the prospects for opening Euro-Mediterranean trade. 1.1. – Theoretical foundations of the RVI In the literature devoted to the impact of international trade liberalisation on the countries concerned, the neo-classical school uses so-called “computable general equilibrium” models to measure variations in welfare (generally estimated using the variation in GDP) based on hypotheses concerning the price elasticities of supply and demand. Several models have been devoted to Euro-Mediterranean trade liberalisation (cf. for example Augier and Gasoriek, 2001; Bchir et al, 2003). These models can be criticised for the numerous restrictive hypotheses which enable them to be built and the mechanical and stylised nature of the illustrations they provide of reality, as well as the major uncertainty vis-à-vis the quality and representativeness of the numerous parameters used (Cling and Ould Aoudia, 2003). These models nevertheless permit the questions and situations to be formalised. In the current context of economic tools, they remain an essential element and should be perceived as a basis for analysis, provided that they are completed by means of a critical examination of the results, in particular in light of the unorthodox theoretical currents such as those resulting from institutional economics. This is precisely the procedure adopted here, which consists not of estimating an impact using simulations on a global or sector-based mathematical model which limits have been stipulated, but of identifying the levels of risk involved. Institutionalist (Nelson and Winter, 1982) and strategic (Wernerfelt, 1984) theories suggest identifying the factors of performance and, a contrario, of the weakening (or even vulnerability) of the European regions which produce fruit and vegetables in a context of increased competition. The concept of vulnerability Vulnerability can be defined as “the degree of loss suffered by an element (or a group of elements) exposed to a risk and which is attributable to a given unforeseen event of given severity” (UNDP, 1991). This definition takes into account the vulnerability linked to damage caused by natural catastrophes (earthquake or collapse of a building for example), climatic or economic events. Several studies by USAID (Downing, 1991) have considered the question of evaluating the vulnerability of social groups to famine, lack of water or the reduction in aid and financial credits, etc. The FAO explains that vulnerability is a relationship between three factors: risks, the resulting crises and resilience5. The risks/crises couple affects the well-being of the populations (example of food hazards) whereas resilience concerns all strategies deployed to avoid the impact of the crises. Vulnerability, therefore, demonstrates a positive correlation with the impact of the crises and a negative correlation with resilience.
5 The resilience is a physics concept witch expresses the resistance to an shock. By extension, this term refers, in biology and social sciences, to the capability to resist to external stresses (cf. Downing, 1991). In some ways, resilience may be understood as adaptability.
5
In other words, individuals are not unarmed vis-à-vis risks. Some of them possess capacities for reaction which allow them to overcome the constraints generated by external crises. Douglas North explains this interactive dynamics between the actors and the context in which they live by means of
institutional change (North, 1990). This considers the capacity of the actors to adapt to the changes applied to the institutions (economic, financial, social rules) by means of strategic behaviour. The most dynamic actors will succeed in transforming the probable changes into to fertile potentialities for their well-being (they are resilient), while others will be incapable of confronting these changes (they are vulnerable). Other authors, following Sen, define the capacity of individuals to manage the risks generated by unforeseen events to their own advantage by the term capabilities. The actors draw on their resources (human, material and social), seize the opportunities offered by their environment and transform the set of these resources into capabilities (Sen, 1985). Management sciences have developed a theory called the Resource-Based View (RBV). This theory states that, in an environment of increasing competitive intensity, the strategic advantages (and, a contrario, the risks) of the organisations depend on 3 groups of factors: resources, competencies and capabilities. The resources consist of specific assets such as natural resources, technology and equipment and human resources. Competencies comprise the knowledge and know-how of company employees. Capabilities result from the ability to organise and combine the resources and competencies that the companies are in a position to mobilise (Wernerfelt, 1984). If the actors possess a significant capabilities potential, their level of vulnerability is low. Vulnerability, however, increases with the insufficiency of capability levels. The level of vulnerability is thus inversely proportional to the capability level. The procedure aimed at assessing the capacity of actors or organisations to confront future risks is in keeping with a preventive reasoning. Euro-Mediterranean trade liberalisation in the agricultural sector undoubtedly causes disruption in the existing equilibria. The impacts of this institutional change would be felt differently depending on the country, region and product. To understand the complexity of the supply chains and the frailness of certain fruit and vegetable-producing regions, we have developed a composite regional vulnerability index (RVI). Calculating the RVI The RVI is composed of both qualitative and quantitative variables, but the unavailability of certain information or the lack of quality caused us to limit their number. The variables retained have been grouped into four components: agricultural production, wholesalers, territories and regional environment (cf. table 3). The benchmarking procedure is introduced here to provide a comparative evaluation of the vulnerability of the European fruit and vegetable-producing regions. This involves calculating a score for each component of the RVI according to the weighting of its constituent variables (each component is the result of a sum of indicators weighted in relation to the average of the 5 countries studied) and then using this to undertake inter-regional comparisons. The interest of this type of approach is twofold: on the one hand, the RVI is a multiple indicator enabling us to understand the agricultural and agri-business sector in its systemic environment, and on the other the RVI provides a SWOT diagnostic6 with recommendations. It also allows us to develop a simulation of the impact of liberalisation on European supply by combining it with scenarios for the development exporters’ market share. Finally, the RVI is an initial approach to the definition of regional and sector-based policies in the European Union with a view to Euro-Mediterranean agricultural trade liberalisation. In previous works (Ayadi et al, 2005, 2006), we calculated a RVI for fresh fruit (23 European regions located in 5 Mediterranean countries in the EU), fresh vegetables (24 regions), fresh fruit and vegetables (34 regions), processed fruit and vegetables (63 regions). The regions included in the RVI calculation are those with the highest average annual turnover at the start of the new millennium.
6 SWOT: strenght, weaknesses, opportunities, threats
6
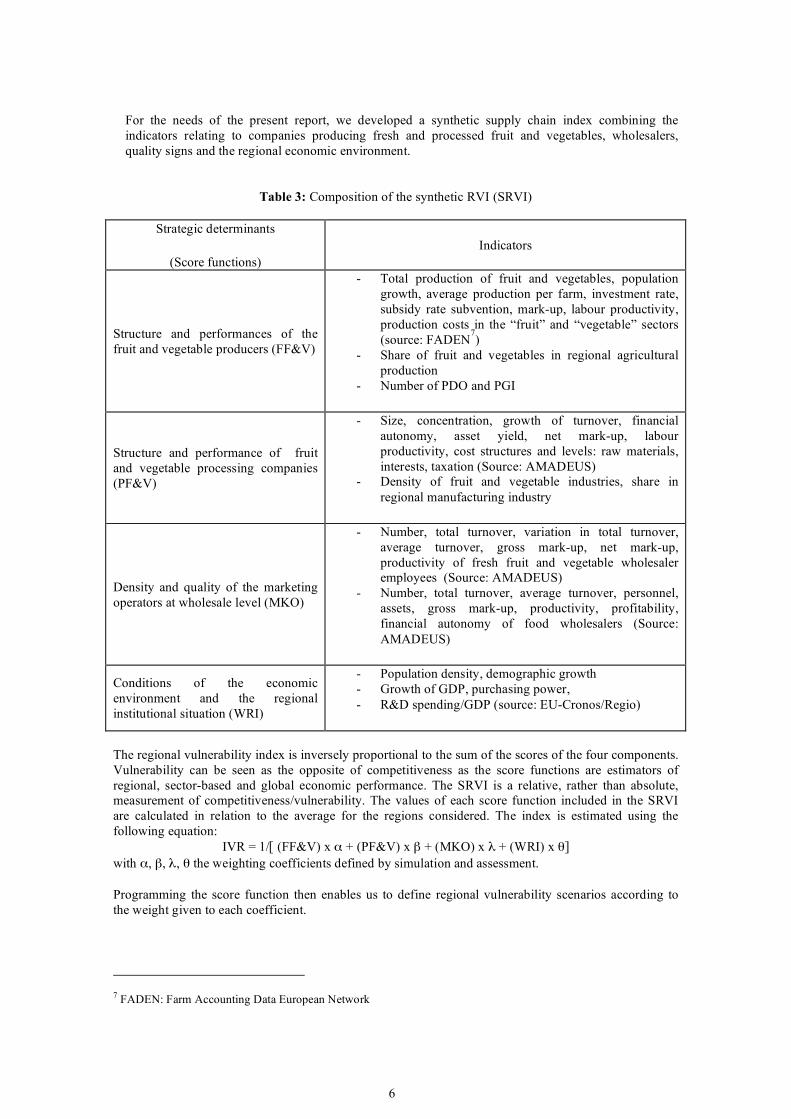
For the needs of the present report, we developed a synthetic supply chain index combining the indicators relating to companies producing fresh and processed fruit and vegetables, wholesalers, quality signs and the regional economic environment.
Table 3: Composition of the synthetic RVI (SRVI)
Strategic determinants
(Score functions) Indicators
Structure and performances of the fruit and vegetable producers (FF&V)
- Total production of fruit and vegetables, population growth, average production per farm, investment rate, subsidy rate subvention, mark-up, labour productivity, production costs in the “fruit” and “vegetable” sectors (source: FADEN
7)
- Share of fruit and vegetables in regional agricultural production
- Number of PDO and PGI
Structure and performance of fruit and vegetable processing companies (PF&V)
- Size, concentration, growth of turnover, financial autonomy, asset yield, net mark-up, labour productivity, cost structures and levels: raw materials, interests, taxation (Source: AMADEUS)
- Density of fruit and vegetable industries, share in regional manufacturing industry
Density and quality of the marketing operators at wholesale level (MKO)
- Number, total turnover, variation in total turnover, average turnover, gross mark-up, net mark-up, productivity of fresh fruit and vegetable wholesaler employees (Source: AMADEUS)
- Number, total turnover, average turnover, personnel, assets, gross mark-up, productivity, profitability, financial autonomy of food wholesalers (Source: AMADEUS)
Conditions of the economic environment and the regional institutional situation (WRI)
- Population density, demographic growth - Growth of GDP, purchasing power, - R&D spending/GDP (source: EU-Cronos/Regio)
The regional vulnerability index is inversely proportional to the sum of the scores of the four components. Vulnerability can be seen as the opposite of competitiveness as the score functions are estimators of regional, sector-based and global economic performance. The SRVI is a relative, rather than absolute, measurement of competitiveness/vulnerability. The values of each score function included in the SRVI are calculated in relation to the average for the regions considered. The index is estimated using the following equation:
IVR = 1/[ (FF&V) x α + (PF&V) x β + (MKO) x λ + (WRI) x θ] with α, β, λ, θ the weighting coefficients defined by simulation and assessment. Programming the score function then enables us to define regional vulnerability scenarios according to the weight given to each coefficient.
7 FADEN: Farm Accounting Data European Network
7
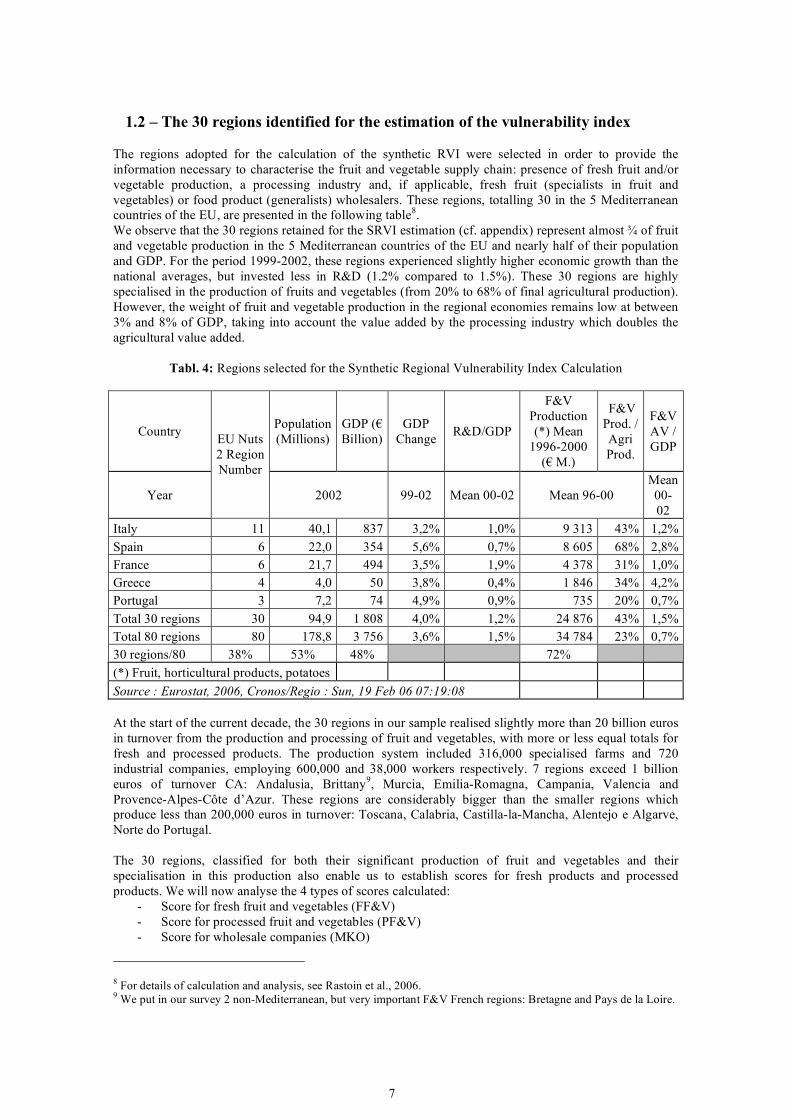
1.2 – The 30 regions identified for the estimation of the vulnerability index
The regions adopted for the calculation of the synthetic RVI were selected in order to provide the information necessary to characterise the fruit and vegetable supply chain: presence of fresh fruit and/or vegetable production, a processing industry and, if applicable, fresh fruit (specialists in fruit and vegetables) or food product (generalists) wholesalers. These regions, totalling 30 in the 5 Mediterranean countries of the EU, are presented in the following table8. We observe that the 30 regions retained for the SRVI estimation (cf. appendix) represent almost ¾ of fruit and vegetable production in the 5 Mediterranean countries of the EU and nearly half of their population and GDP. For the period 1999-2002, these regions experienced slightly higher economic growth than the national averages, but invested less in R&D (1.2% compared to 1.5%). These 30 regions are highly specialised in the production of fruits and vegetables (from 20% to 68% of final agricultural production). However, the weight of fruit and vegetable production in the regional economies remains low at between 3% and 8% of GDP, taking into account the value added by the processing industry which doubles the agricultural value added.
Tabl. 4: Regions selected for the Synthetic Regional Vulnerability Index Calculation
Country Population (Millions)
GDP (€ Billion)
GDP Change R&D/GDP
F&V Production (*) Mean
1996-2000 (€ M.)
F&V Prod. / Agri Prod.
F&V AV / GDP
Year
EU Nuts 2 Region Number
2002 99-02 Mean 00-02 Mean 96-00 Mean 00-02
Italy 11 40,1 837 3,2% 1,0% 9 313 43% 1,2% Spain 6 22,0 354 5,6% 0,7% 8 605 68% 2,8% France 6 21,7 494 3,5% 1,9% 4 378 31% 1,0% Greece 4 4,0 50 3,8% 0,4% 1 846 34% 4,2% Portugal 3 7,2 74 4,9% 0,9% 735 20% 0,7% Total 30 regions 30 94,9 1 808 4,0% 1,2% 24 876 43% 1,5% Total 80 regions 80 178,8 3 756 3,6% 1,5% 34 784 23% 0,7% 30 regions/80 38% 53% 48% 72% (*) Fruit, horticultural products, potatoes Source : Eurostat, 2006, Cronos/Regio : Sun, 19 Feb 06 07:19:08 At the start of the current decade, the 30 regions in our sample realised slightly more than 20 billion euros in turnover from the production and processing of fruit and vegetables, with more or less equal totals for fresh and processed products. The production system included 316,000 specialised farms and 720 industrial companies, employing 600,000 and 38,000 workers respectively. 7 regions exceed 1 billion euros of turnover CA: Andalusia, Brittany9, Murcia, Emilia-Romagna, Campania, Valencia and Provence-Alpes-Côte d’Azur. These regions are considerably bigger than the smaller regions which produce less than 200,000 euros in turnover: Toscana, Calabria, Castilla-la-Mancha, Alentejo e Algarve, Norte do Portugal. The 30 regions, classified for both their significant production of fruit and vegetables and their specialisation in this production also enable us to establish scores for fresh products and processed products. We will now analyse the 4 types of scores calculated:
- Score for fresh fruit and vegetables (FF&V) - Score for processed fruit and vegetables (PF&V) - Score for wholesale companies (MKO)
8 For details of calculation and analysis, see Rastoin et al., 2006. 9 We put in our survey 2 non-Mediterranean, but very important F&V French regions: Bretagne and Pays de la Loire.
8
- Score for degree of regional wealth (WRI) It is important to stress that the sector-based data used in calculating the RVI scores are taken from
company databases (FADEN for agriculture, Amadeus for the food-processing and commerce). These databases are not exhaustive and are subject to differences in the accounting rules, which vary greatly from one country to the next and from one company to the next. The interest of these databases is that they compensate for the deficiencies of the sector-based statistics and reflect the micro-economic realities. The IRR and regional specialisation indices are drawn from Eurostat statistics (Regions database). Let us recall that each of these scores is a linear function of several performance indicators presented in table 12. Each basic indicator consists of a ratio between a regional value and an inter-regional average, in order to position the regions among themselves (benchmarking). 1.3 – The score functions The score for the fresh fruits and vegetables sector This function combines the economic indicators of sector dynamics, the performance of farms oriented towards fruit or vegetable production, the presence of geographic labels of origin and specialisation of regional agriculture (cf. table 3). The fresh fruit and vegetables score displays considerable disparities between the regions10, both at European level and within each country (difference of 1 to 30 between the last and the first position). Hence, regions in Greece are either at the top (Ipiros-Peloponissos) or the bottom (Anatoliki, Thessalia) of the ranking. The major Spanish (Andalusia, Valencia, Murcia) and Italian (Emilia-Romagna, Campania) regions present good performances. The size of the farms represents an advantage: with the exception of Ipiros-Peloponissos, La Huerta de Valencia and Centro-Ribatejo, the average turnover achieved for fruit and vegetable production is high (more than 100,000 €). The good position of Languedoc Roussillon (no.2) can be explained by the restructuring of farms and the economies of scale achieved. Finally, the regions more highly specialised in fruit and vegetables would seem to hold an advantage: among the leading regions, the proportion of fruit and vegetables in total agricultural production is greater than 30%. The score for the processed fruits and vegetables sector This score combines indicators of an economic dimension with performance (margins) and cost ratios. These different ratios are combined in a linear manner to provide a regional score for the fruit and vegetable processing industry (cf. table 5). The global score for the processed fruit and vegetable industry sees 4 French regions at the top of the table: Brittany, a strong agri-business region with 21 companies totalling 1.6 billion € in turnover, Rhône-Alpes, Pays de la Loire and Languedoc-Roussillon, which is smaller in size. The major Spanish (Murcia and Andalusia) and Greek (Ipiros-Peloponissos and Sterea Ellias) regions are also well placed. The lower-placed regions demonstrate a small turnover (Norte, Alentejo-Algarve, Aragon, Anatoliki Makedonia and Calabria), with the exception of Emilia-Romagna. The scores can primarily be explained by growth differentials (scale of 1 to 11) and more importantly performance differentials (from -2 to 13). Three of the bottom four regions in the table recorded losses. The specialisation indicator, which falls between 1 and 5, is less determinant than for fresh fruit and vegetables, as is the costs indicator which only varies by a factor of 2.5 (from 3 to 7). The cost indicator is calculated by retaining 5 components in a linear relationship: total cost (turnover – net earnings), financial costs (interests/turnover), taxation (taxes/turnover), agricultural raw materials (ARM/turnover) and investment (depreciation/turnover). The relative counter-performance of certain 10 The 30 selected regions for the SRVI calculation 2 important region in terms of F&V production: Central Macedonia and Aquitaine. In those 2 regions, the wholesale sector was not identifiable.
9
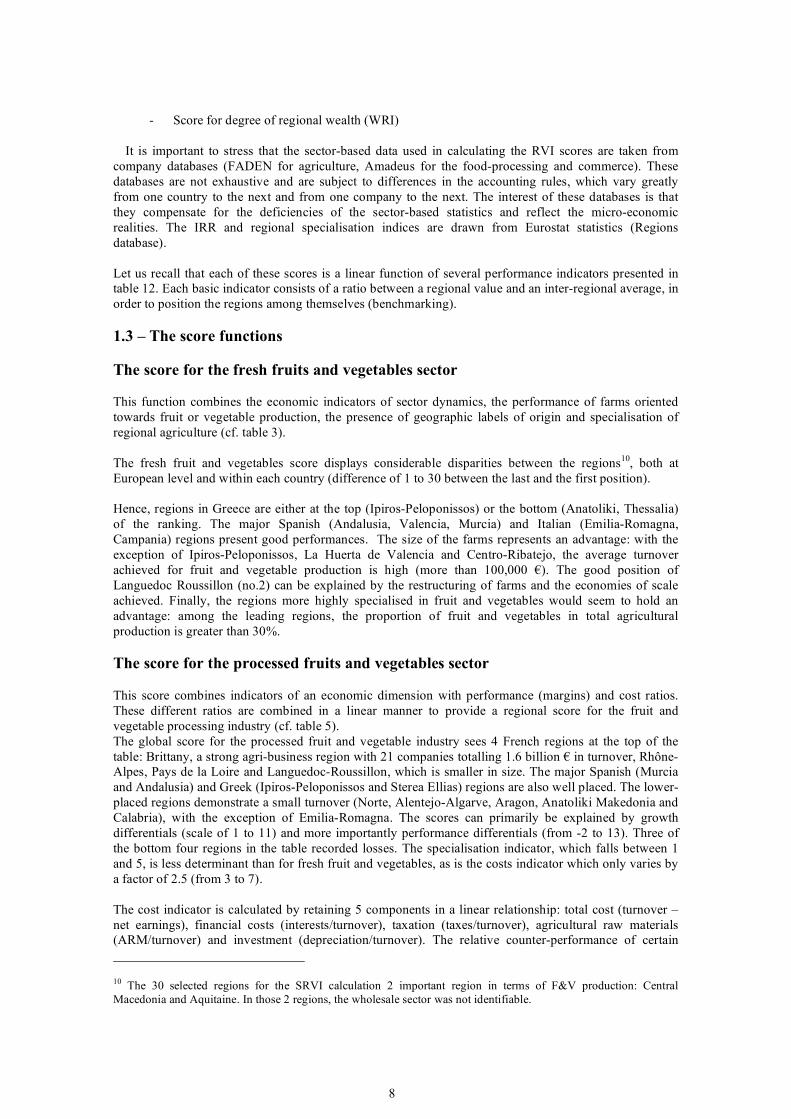
countries (Spain and Italy) can be explained by the weight of the financial costs and taxation. Labour costs, which are not measurable for Greek companies, are not taken into account when calculating the processed fruit and vegetables score. To clarify this analysis, the following table presents the costs
structures in the 5 Mediterranean countries of the EU (national averages calculated for a sample of 63 European regions), including the wages for 4 of the 5 countries being studied. Our preliminary observation is that the net mark-up is very low in this industry (3 to 4%) and that there is not a great difference between the countries with respect to this criterion. However, breaking down the costs to arrive at a global index of partial cost (sub-total of the previous table), we observe relatively large differences between countries, which would explain the deviation noted for the cost index in the next figure.
Tabl. 5: Cost Structure in the F&V Manufacturing Industry, 5 countries, 2000-2004
Raw Material
Wages &
Salaries Amortization Financial
Cost Taxes Sub-Total Country (63 Regions) Number of
enterprises (in % of Total Cost)
France 165 45,6% 11,8% 3,2% 1,2% 1,0% 62,7% Greece 286 55,6% NA 4,3% 2,4% 0,7% NA Italy 299 65,8% 10,9% 3,9% 2,2% 1,1% 84,0% Portugal 25 48,1% 10,5% 5,2% 1,4% 1,1% 66,2% Spain 271 61,7% 11,6% 3,7% 2,0% 0,9% 79,8% 5 countries, mean 1 046 55,4% 11,2% 4,1% 1,8% 1,0% 73,4% Gap between extreme values 44% 12% 62% 103% 62% 34%
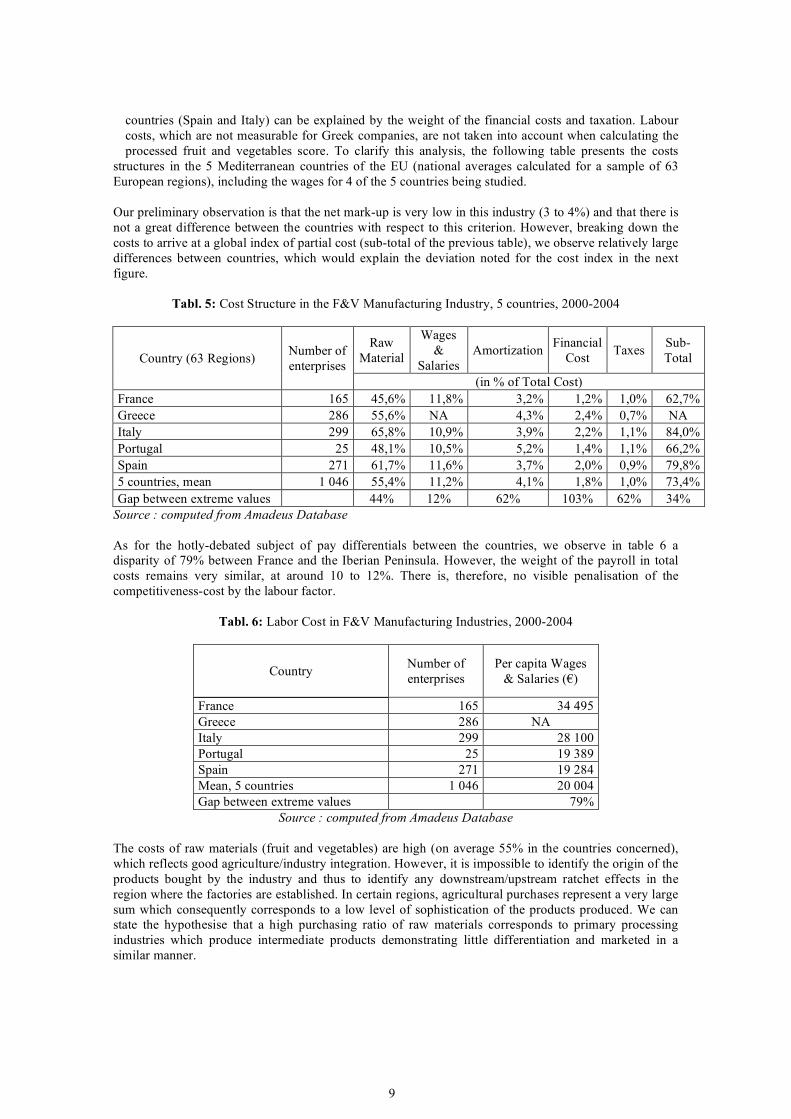
Source : computed from Amadeus Database As for the hotly-debated subject of pay differentials between the countries, we observe in table 6 a disparity of 79% between France and the Iberian Peninsula. However, the weight of the payroll in total costs remains very similar, at around 10 to 12%. There is, therefore, no visible penalisation of the competitiveness-cost by the labour factor.
Tabl. 6: Labor Cost in F&V Manufacturing Industries, 2000-2004
Country Number of enterprises
Per capita Wages & Salaries (€)
France 165 34 495 Greece 286 NA Italy 299 28 100 Portugal 25 19 389 Spain 271 19 284 Mean, 5 countries 1 046 20 004 Gap between extreme values 79%
Source : computed from Amadeus Database The costs of raw materials (fruit and vegetables) are high (on average 55% in the countries concerned), which reflects good agriculture/industry integration. However, it is impossible to identify the origin of the products bought by the industry and thus to identify any downstream/upstream ratchet effects in the region where the factories are established. In certain regions, agricultural purchases represent a very large sum which consequently corresponds to a low level of sophistication of the products produced. We can state the hypothesise that a high purchasing ratio of raw materials corresponds to primary processing industries which produce intermediate products demonstrating little differentiation and marketed in a similar manner.
10
Depreciation appears in the operating account in small amounts (approx. 4 to 5%), which reflects an industry which is non capital-intense and material investments which are probably insufficient in a context of international competition.
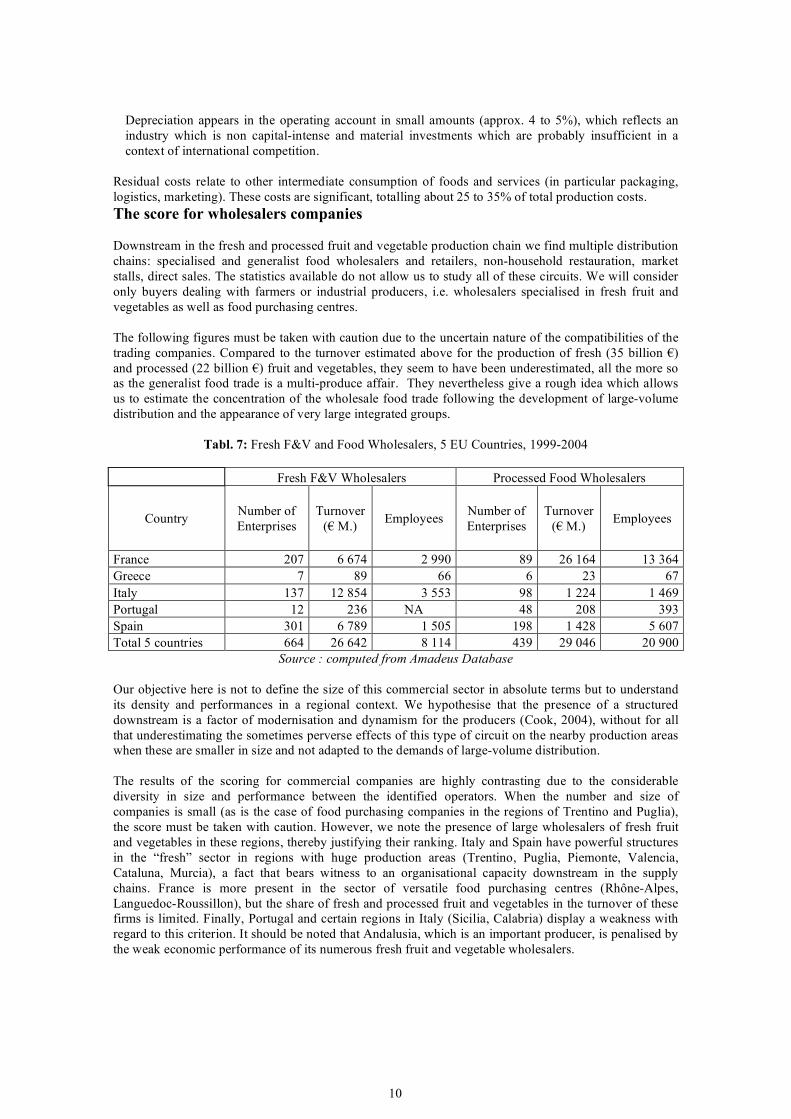
Residual costs relate to other intermediate consumption of foods and services (in particular packaging, logistics, marketing). These costs are significant, totalling about 25 to 35% of total production costs. The score for wholesalers companies Downstream in the fresh and processed fruit and vegetable production chain we find multiple distribution chains: specialised and generalist food wholesalers and retailers, non-household restauration, market stalls, direct sales. The statistics available do not allow us to study all of these circuits. We will consider only buyers dealing with farmers or industrial producers, i.e. wholesalers specialised in fresh fruit and vegetables as well as food purchasing centres. The following figures must be taken with caution due to the uncertain nature of the compatibilities of the trading companies. Compared to the turnover estimated above for the production of fresh (35 billion €) and processed (22 billion €) fruit and vegetables, they seem to have been underestimated, all the more so as the generalist food trade is a multi-produce affair. They nevertheless give a rough idea which allows us to estimate the concentration of the wholesale food trade following the development of large-volume distribution and the appearance of very large integrated groups.
Tabl. 7: Fresh F&V and Food Wholesalers, 5 EU Countries, 1999-2004 Fresh F&V Wholesalers Processed Food Wholesalers
Country Number of Enterprises
Turnover (€ M.) Employees Number of
Enterprises Turnover
(€ M.) Employees
France 207 6 674 2 990 89 26 164 13 364 Greece 7 89 66 6 23 67 Italy 137 12 854 3 553 98 1 224 1 469 Portugal 12 236 NA 48 208 393 Spain 301 6 789 1 505 198 1 428 5 607 Total 5 countries 664 26 642 8 114 439 29 046 20 900
Source : computed from Amadeus Database Our objective here is not to define the size of this commercial sector in absolute terms but to understand its density and performances in a regional context. We hypothesise that the presence of a structured downstream is a factor of modernisation and dynamism for the producers (Cook, 2004), without for all that underestimating the sometimes perverse effects of this type of circuit on the nearby production areas when these are smaller in size and not adapted to the demands of large-volume distribution. The results of the scoring for commercial companies are highly contrasting due to the considerable diversity in size and performance between the identified operators. When the number and size of companies is small (as is the case of food purchasing companies in the regions of Trentino and Puglia), the score must be taken with caution. However, we note the presence of large wholesalers of fresh fruit and vegetables in these regions, thereby justifying their ranking. Italy and Spain have powerful structures in the “fresh” sector in regions with huge production areas (Trentino, Puglia, Piemonte, Valencia, Cataluna, Murcia), a fact that bears witness to an organisational capacity downstream in the supply chains. France is more present in the sector of versatile food purchasing centres (Rhône-Alpes, Languedoc-Roussillon), but the share of fresh and processed fruit and vegetables in the turnover of these firms is limited. Finally, Portugal and certain regions in Italy (Sicilia, Calabria) display a weakness with regard to this criterion. It should be noted that Andalusia, which is an important producer, is penalised by the weak economic performance of its numerous fresh fruit and vegetable wholesalers.
11
The score for regional wealth
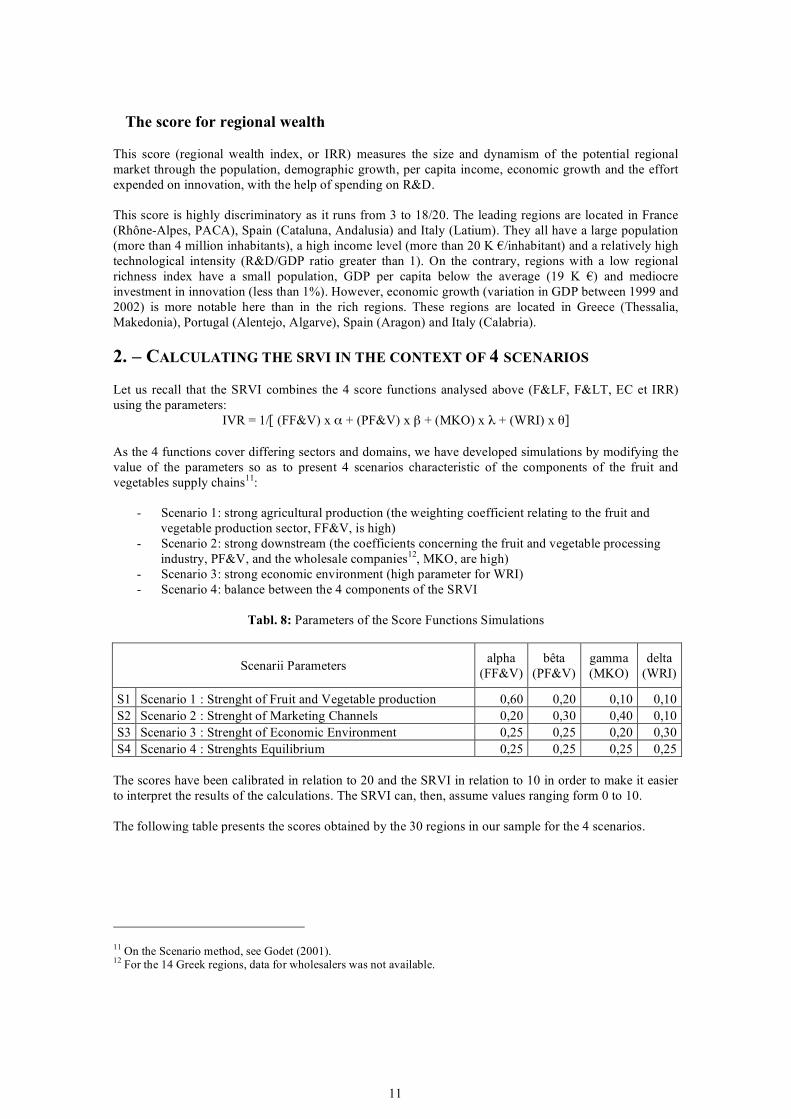
This score (regional wealth index, or IRR) measures the size and dynamism of the potential regional market through the population, demographic growth, per capita income, economic growth and the effort expended on innovation, with the help of spending on R&D. This score is highly discriminatory as it runs from 3 to 18/20. The leading regions are located in France (Rhône-Alpes, PACA), Spain (Cataluna, Andalusia) and Italy (Latium). They all have a large population (more than 4 million inhabitants), a high income level (more than 20 K €/inhabitant) and a relatively high technological intensity (R&D/GDP ratio greater than 1). On the contrary, regions with a low regional richness index have a small population, GDP per capita below the average (19 K €) and mediocre investment in innovation (less than 1%). However, economic growth (variation in GDP between 1999 and 2002) is more notable here than in the rich regions. These regions are located in Greece (Thessalia, Makedonia), Portugal (Alentejo, Algarve), Spain (Aragon) and Italy (Calabria). 2. – CALCULATING THE SRVI IN THE CONTEXT OF 4 SCENARIOS Let us recall that the SRVI combines the 4 score functions analysed above (F&LF, F<, EC et IRR) using the parameters:
IVR = 1/[ (FF&V) x α + (PF&V) x β + (MKO) x λ + (WRI) x θ] As the 4 functions cover differing sectors and domains, we have developed simulations by modifying the value of the parameters so as to present 4 scenarios characteristic of the components of the fruit and vegetables supply chains11:
- Scenario 1: strong agricultural production (the weighting coefficient relating to the fruit and vegetable production sector, FF&V, is high)
- Scenario 2: strong downstream (the coefficients concerning the fruit and vegetable processing industry, PF&V, and the wholesale companies12, MKO, are high)
- Scenario 3: strong economic environment (high parameter for WRI) - Scenario 4: balance between the 4 components of the SRVI
Tabl. 8: Parameters of the Score Functions Simulations
Scenarii Parameters alpha (FF&V)
bêta (PF&V)
gamma (MKO)
delta (WRI)
S1 Scenario 1 : Strenght of Fruit and Vegetable production 0,60 0,20 0,10 0,10 S2 Scenario 2 : Strenght of Marketing Channels 0,20 0,30 0,40 0,10 S3 Scenario 3 : Strenght of Economic Environment 0,25 0,25 0,20 0,30 S4 Scenario 4 : Strenghts Equilibrium 0,25 0,25 0,25 0,25
The scores have been calibrated in relation to 20 and the SRVI in relation to 10 in order to make it easier to interpret the results of the calculations. The SRVI can, then, assume values ranging form 0 to 10. The following table presents the scores obtained by the 30 regions in our sample for the 4 scenarios.
11 On the Scenario method, see Godet (2001). 12 For the 14 Greek regions, data for wholesalers was not available.
12
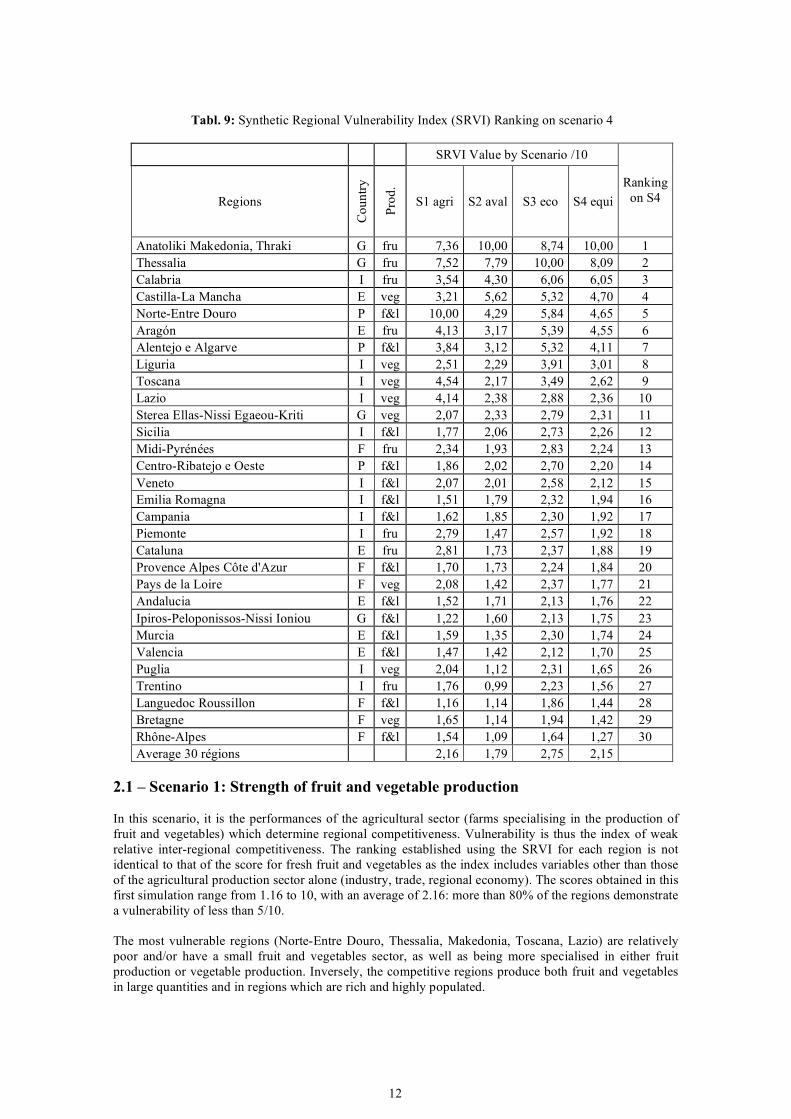
Tabl. 9: Synthetic Regional Vulnerability Index (SRVI) Ranking on scenario 4
SRVI Value by Scenario /10
Regions
Cou
ntry
Prod
.
S1 agri S2 aval S3 eco S4 equi Ranking
on S4
Anatoliki Makedonia, Thraki G fru 7,36 10,00 8,74 10,00 1 Thessalia G fru 7,52 7,79 10,00 8,09 2 Calabria I fru 3,54 4,30 6,06 6,05 3 Castilla-La Mancha E veg 3,21 5,62 5,32 4,70 4 Norte-Entre Douro P f&l 10,00 4,29 5,84 4,65 5 Aragón E fru 4,13 3,17 5,39 4,55 6 Alentejo e Algarve P f&l 3,84 3,12 5,32 4,11 7 Liguria I veg 2,51 2,29 3,91 3,01 8 Toscana I veg 4,54 2,17 3,49 2,62 9 Lazio I veg 4,14 2,38 2,88 2,36 10 Sterea Ellas-Nissi Egaeou-Kriti G veg 2,07 2,33 2,79 2,31 11 Sicilia I f&l 1,77 2,06 2,73 2,26 12 Midi-Pyrénées F fru 2,34 1,93 2,83 2,24 13 Centro-Ribatejo e Oeste P f&l 1,86 2,02 2,70 2,20 14 Veneto I f&l 2,07 2,01 2,58 2,12 15 Emilia Romagna I f&l 1,51 1,79 2,32 1,94 16 Campania I f&l 1,62 1,85 2,30 1,92 17 Piemonte I fru 2,79 1,47 2,57 1,92 18 Cataluna E fru 2,81 1,73 2,37 1,88 19 Provence Alpes Côte d'Azur F f&l 1,70 1,73 2,24 1,84 20 Pays de la Loire F veg 2,08 1,42 2,37 1,77 21 Andalucia E f&l 1,52 1,71 2,13 1,76 22 Ipiros-Peloponissos-Nissi Ioniou G f&l 1,22 1,60 2,13 1,75 23 Murcia E f&l 1,59 1,35 2,30 1,74 24 Valencia E f&l 1,47 1,42 2,12 1,70 25 Puglia I veg 2,04 1,12 2,31 1,65 26 Trentino I fru 1,76 0,99 2,23 1,56 27 Languedoc Roussillon F f&l 1,16 1,14 1,86 1,44 28 Bretagne F veg 1,65 1,14 1,94 1,42 29 Rhône-Alpes F f&l 1,54 1,09 1,64 1,27 30 Average 30 régions 2,16 1,79 2,75 2,15
2.1 – Scenario 1: Strength of fruit and vegetable production In this scenario, it is the performances of the agricultural sector (farms specialising in the production of fruit and vegetables) which determine regional competitiveness. Vulnerability is thus the index of weak relative inter-regional competitiveness. The ranking established using the SRVI for each region is not identical to that of the score for fresh fruit and vegetables as the index includes variables other than those of the agricultural production sector alone (industry, trade, regional economy). The scores obtained in this first simulation range from 1.16 to 10, with an average of 2.16: more than 80% of the regions demonstrate a vulnerability of less than 5/10. The most vulnerable regions (Norte-Entre Douro, Thessalia, Makedonia, Toscana, Lazio) are relatively poor and/or have a small fruit and vegetables sector, as well as being more specialised in either fruit production or vegetable production. Inversely, the competitive regions produce both fruit and vegetables in large quantities and in regions which are rich and highly populated.
13
2.2 – Scenario 2: Strength of downstream structures in the fruit and vegetables
supply chains Scenario 2 accords considerable weight to the downstream structures of the supply chains (20% of the index on industrial fruit and vegetable processing companies and 40% on fruit and vegetable wholesale companies and food purchasing centres). In this scenario, the average vulnerability of the 30 regions is lower, falling from 2.2 to 1.8 (on a scale from 1 to 10). This tends to indicate an increase in the competitiveness of the regions from their downstream structures. The results of the previous ranking change little: the same regions appear at the top and bottom of the table, albeit in a slightly different order. Thus, in the 10 most vulnerable regions as identified in this scenario (S2), only Calabria (8th to 4th), Castilla (9th to 3rd) and Toscana (12th to 10th) appear to be weakened by downstream insufficiency. Inversely, 2 relatively non-vulnerable regions (ranked in the last 10 positions) benefit from a consistent downstream and improve their ranking: Pays de la Loire (14th in S1 to 23rd in S2) and Puglia (17th to 28th). 2.3 – Scenario 3: Strength of the economic environment Scenario 3 accords preponderance to the regions’ income level (30%) and the production (25%) and transformation (25%) sectors. The scores range from 1.6 to 10, around a higher average: 2.8. The regions’ sensitivity to the criterion of macro-economic wealth (income) and R&D is therefore globally significant. The 10 regions ranked as being the most vulnerable remains unchanged, but for a few permutations. Campania improves its position (from 16th to 22nd compared to S2). Les Pays de la Loire falls from 23rd to 18th position. The rest of the list of non-vulnerable regions remains identical, but for a few permutations. 2.4 – Scenario 4: Balance of strengths This simulation accords equal weight to the actors in production, transformation and distribution as well as to the macro-economic parameters (25% each). The scores range from 1.27 to 10, with an average of 2.15, a fall which confirms the importance of the economic environment to the level of vulnerability of the fruit and vegetables supply chains. The positions in this ranking are very similar to those seen in scenario 2, which gave a high weighting to the downstream structures of the supply chains (transformation and distribution). According to this synthetic indicator, the 3 Portuguese regions, 3 Greek regions out of 4, 6 Italian regions our of 11, 2 Spanish regions out of 6 and 1 French region out of 6 would be vulnerable to an intensification of competition in the fruit and vegetables sector. 3. – DISCUSSION OF THE RESULTS In general terms, the estimation of a synthetic regional vulnerability index provides results validated by observations in the field and underlines the impact of the economic environment on the performances of the fruit and vegetable supply chains. Nevertheless, it is necessary to highlight a number of essential points which should be kept in mind to ensure a correct interpretation of the regional rankings carried out. First of all, the general ranking produced is the result of a composite index which takes into account not only the actors in the fruit and vegetable supply chains but also sector-based (the supply chain) and general (the economic situation and regional infrastructures) environmental factors.
14
Second, the statistical database is less complete and less refined for processed fruit and vegetables that for fresh fruit and vegetables. Furthermore, in the case of fresh fruit and vegetables, the RICA sampling poses a number of problems of representativeness in the small production regions. We do not possess a
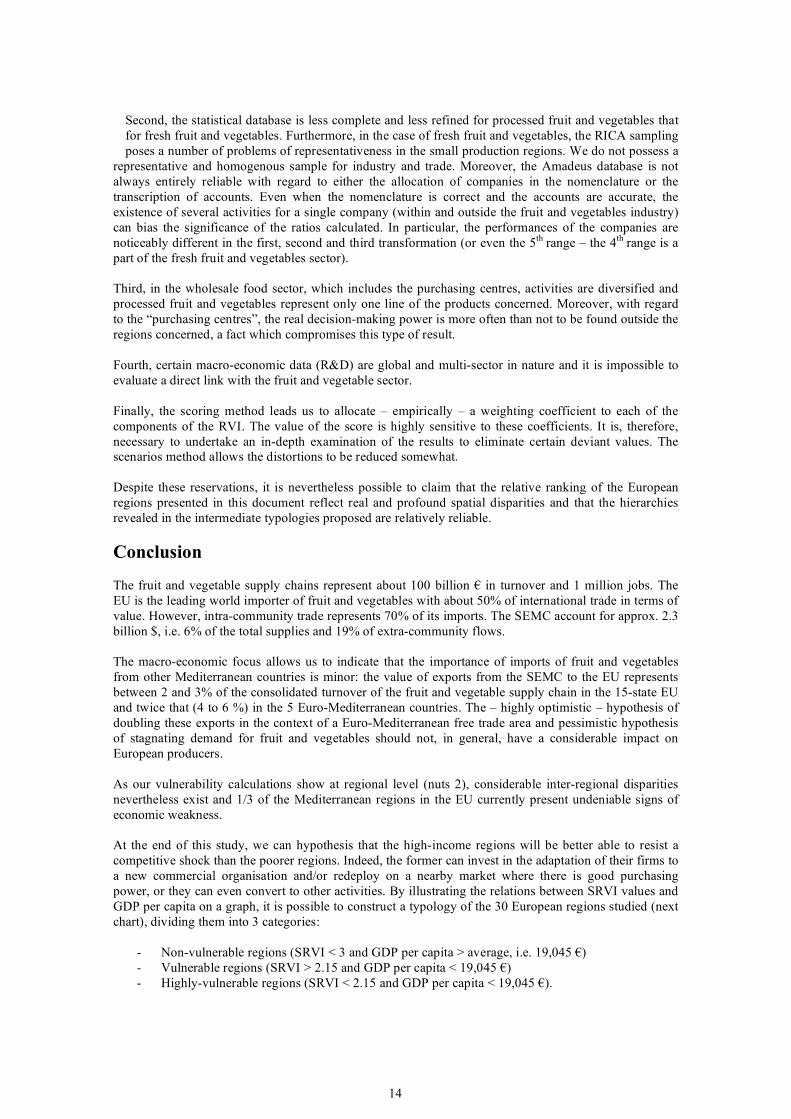
representative and homogenous sample for industry and trade. Moreover, the Amadeus database is not always entirely reliable with regard to either the allocation of companies in the nomenclature or the transcription of accounts. Even when the nomenclature is correct and the accounts are accurate, the existence of several activities for a single company (within and outside the fruit and vegetables industry) can bias the significance of the ratios calculated. In particular, the performances of the companies are noticeably different in the first, second and third transformation (or even the 5th range – the 4th range is a part of the fresh fruit and vegetables sector). Third, in the wholesale food sector, which includes the purchasing centres, activities are diversified and processed fruit and vegetables represent only one line of the products concerned. Moreover, with regard to the “purchasing centres”, the real decision-making power is more often than not to be found outside the regions concerned, a fact which compromises this type of result. Fourth, certain macro-economic data (R&D) are global and multi-sector in nature and it is impossible to evaluate a direct link with the fruit and vegetable sector. Finally, the scoring method leads us to allocate – empirically – a weighting coefficient to each of the components of the RVI. The value of the score is highly sensitive to these coefficients. It is, therefore, necessary to undertake an in-depth examination of the results to eliminate certain deviant values. The scenarios method allows the distortions to be reduced somewhat. Despite these reservations, it is nevertheless possible to claim that the relative ranking of the European regions presented in this document reflect real and profound spatial disparities and that the hierarchies revealed in the intermediate typologies proposed are relatively reliable. Conclusion The fruit and vegetable supply chains represent about 100 billion € in turnover and 1 million jobs. The EU is the leading world importer of fruit and vegetables with about 50% of international trade in terms of value. However, intra-community trade represents 70% of its imports. The SEMC account for approx. 2.3 billion $, i.e. 6% of the total supplies and 19% of extra-community flows. The macro-economic focus allows us to indicate that the importance of imports of fruit and vegetables from other Mediterranean countries is minor: the value of exports from the SEMC to the EU represents between 2 and 3% of the consolidated turnover of the fruit and vegetable supply chain in the 15-state EU and twice that (4 to 6 %) in the 5 Euro-Mediterranean countries. The – highly optimistic – hypothesis of doubling these exports in the context of a Euro-Mediterranean free trade area and pessimistic hypothesis of stagnating demand for fruit and vegetables should not, in general, have a considerable impact on European producers. As our vulnerability calculations show at regional level (nuts 2), considerable inter-regional disparities nevertheless exist and 1/3 of the Mediterranean regions in the EU currently present undeniable signs of economic weakness. At the end of this study, we can hypothesis that the high-income regions will be better able to resist a competitive shock than the poorer regions. Indeed, the former can invest in the adaptation of their firms to a new commercial organisation and/or redeploy on a nearby market where there is good purchasing power, or they can even convert to other activities. By illustrating the relations between SRVI values and GDP per capita on a graph, it is possible to construct a typology of the 30 European regions studied (next chart), dividing them into 3 categories:
- Non-vulnerable regions (SRVI < 3 and GDP per capita > average, i.e. 19,045 €) - Vulnerable regions (SRVI > 2.15 and GDP per capita < 19,045 €) - Highly-vulnerable regions (SRVI < 2.15 and GDP per capita < 19,045 €).
15
The “highly-vulnerable regions” category includes (in decreasing order of vulnerability): Anatoliki-Makedonia, Thessalia, Calabria, Castilla-la-Mancha , Norte-Douro, Aragon, Alentejo-Agarve, Sterea Ellas, Sicilia and Centro-Ribatejo, i.e. primarily Greek, Portuguese and southern Italian regions (10
regions). The “vulnerable” regions are: Liguria, Toscana, Sicilia, Midi-Pyrénées, Campania, Andalusia, Ipiros-Peloponissos, Murcia, Valencia and Puglia (10 regions from central Italy, southern Spain and southern France). Finally, there are 10 regions which are “not vulnerable”: Veneto, Emilia-Romagna, Piemonte, Cataluna, Provence-Alpes, Côte d’Azur, Pays de la Loire, Trentino, Languedoc-Roussillon, Brittany and Rhône-Alpes. These are regions located in northern Italy, regions in western France and the French Mediterranean and one region from northern Spain.
All in all, it would seem that a positive relation exists between regional wealth, investment in innovation and the performances of the fruit and vegetable supply chains. From the agro-climatic point of view, complementarities between the production schedule and the quality ranges exist from the south to the north of the Mediterranean basin. In the ever more certain context of the creation of a Euro-Mediterranean area (Barcelona conferences, 1995 and 2005) we could, then, envisage specific support for the development of economic partnerships between professionals in the Mediterranean countries. These partnerships could also assume a strategic aspect, by confronting extra-regional competition (Australia, Argentina, Chile, United States) in the conquest of the global market of Mediterranean productions (Rastoin, 2005; Regmi et al., 2005).
16
References
Arfini, F., C. Giacomini et M.-C. Mancini (2004), « Effets probables de la mise en place par la Grande Distribution de nouvelles normes de certification sur le marché des produits agro-alimentaires », communication au colloque AIEA2, Québec, 14p. Augier, P. et M. Gasiorek (2001), « Les effets de la libéralisation entre l’Union européenne et les pays partenaires méditerranéens », dans J.L. Reiffers (dir.), Méditerranée: vingt ans pour réussir, Marseille: Institut de la Méditerranée, p.359-382. Ayadi, N., J.C. Montigaud et J.L. Rastoin (2005), “La vulnérabilité des régions européennes productrices de fruits et légumes frais dans un contexte de libéralisation commerciale”, Eu-Med Agpol, European Research Programme 6th FPR SSPE-CT-2004-502457, WP2, UMR Moisa, Montpellier, 108p.+Annexes. Ayadi N., Montigaud J.C., Rastoin J.L., Tozanli S. (2006), La vulnérabilité des régions européennes productrices de fruits et légumes transformés dans un contexte de libéralisation internationale, Programme de recherche européen Eu-Med Agpol, European Research Programme 6th FPR – SSPE-CT-2004-502457, WP2, UMR Moisa, Montpellier Bchir, M.H., Y. Decreux et M. Fouquin (2003), « L'élargissement: vers un renforcement des relations entre l'Europe et les pays méditerranéens? », Economies et Statistiques, n°363-364-365, Paris: INSEE, p.267-294. BVD (2005), Amadeus, base de données sur les entreprises européennes, Bruxelles Cling, J.P. et J. Ould Aoudia (2003), « Le partenariat euro-méditerranéen: l’intégration en trompe-l’oeil? », Économies et Statistiques, n°363-364-365, Paris: INSEE, p.295-301. Cook, R.L. (2004), « Supermarkets Challenges and Opportunities for Fresh Fruit and Vegetable Producers and Shippers: Lessons from the US Experience », Proceedings of the Conference on Supermarkets and Agricultural Development in China, Shangai, may, 7p. Downing, T.E. (1991),« Evaluation de la vulnérabilité socio-économique à la famine: structures, concepts et applications », Famine Early Warning System Project/USAID. Emlinger, C., F. Jacquet et M. Petit (2004), « Les enjeux de la libéralisation agricole dans la zone méditerranéenne », communication au séminaire GDRI CNRS EMMA – CIHEAM-IAMM, Montpellier. FAO (2004), « Food Insecurity and Vulnerability in Vietnam: Profiles of Four Vulnerable Groups », Working Paper, n°04-11, Food Security and Agricultural Projects Analysis Service (ESAF), may, 55p. FAO (2004, 2005), FAOSTAT, Database, Roma, 2004. Gereffi, G. et M. Korzeniewicz (ed..) (1994), « Commodity Chains and Global Capitalism », Westport: Greenwood Press. Godet, M. (2001), Manuel de prospective stratégique, Dunod, Paris, 2 tomes. Montigaud, J.C. (1992), « L’analyse des filières agroalimentaires: méthodes et premiers résultats », Economies et Sociétés, Cahiers de l’Ismea, série Développement agroalimentaire, AG, n°21, Tome XXVI, n°6, juin. Montigaud, J.C., P. Rio et R. Martinez (2002), « L’OCM fruits et légumes dans le sud-est de la France: une tentative de bilan », série Etudes, UMR MOISA, n° 02, 65p. Nelson, R. et S. Winter (1982), An evolutionary theory of economic change, Cambridge: University Press. North, D. (1990), « Institutions, institutional change and economic performance », Cambridge University Press, 152p.
17
Nussbaum, M.C. et A. Sen (éd..), The Quality of Life, Oxford: Clarendon Press, 1993, p.30-53. PNUD, (1991), « Evaluation de la vulnérabilité et des risques », Programme de Formation à la gestion
des catastrophes, 70p. Radwan, S. et J.L. Reiffers (2003), « L’impact de la libéralisation dans le contexte du partenariat euro-méditerranéen », Rapport Femise, Marseille: Institut de la Méditerranée, 27p. + Annexes. Rastoin, J.L. (2005), « Vers un modèle agroalimentaire méditerranéen, une lecture perrouxienne », Revue Sociétal, n°48, p.4-19. Rastoin, J.L., Ayadi, N., Montigaud, J.M. (2006), “Vulnérabilité des regions euro-méditerranéennes productrices de fruits et legumes frais et transformés dans un contexte de libéralisation internationale”, Eu-Med Agpol, European Research Programme 6th FPR SSPE-CT-2004-502457, WP2, UMR Moisa, 2006, Montpellier, 33 p. Regmi, A., N. Ballenger et J. Putnam (2004), « Globalisation and Income Growth Promote the Mediterranean Diet », Public Health Nutrition, vol.7, n°7, October, p.977-983. Scherer, F.M. (1973), Industrial Market Structure and Economic Performance, Chicago: Rand Mc Nelly. Sen, A. (1993), « Capability and Well-Being », in M.C. Nussbaum et A. Sen (ed..), The Quality of Life, Oxford: Clarendon Press, p.30-53. Sen, A. (1985), The Standard of Living, Cambridge University Press. United Nation Statistics Division (2004, 2005), COMTRADE, Database. Wernerfelt, B. (1984), « A Resource-Based View of the Firm », Strategic Management Journal, vol.5, April-June, p.171-180.