Embed Size (px)
Citation preview

Regional and National Water and Sewer Rate Trends
Brian F. Goetz
Project Manger Tighe & Bond

Regional and National Water and Sewer Rate Trends
Environmental Business Council of New England
New Hampshire Chapter Meeting
February 12, 2013
Manchester, New Hampshire
Brian F. Goetz
Project Manager
Portsmouth, NH

Water and Sewer Systems Generally Rely on Metered Use for Revenue
Water
Meter

• Water and sewer are set on a zero sum basis
► Reductions in revenues due to decreased usage, rate structure changes or other factors result in the need for rate increases
Principals of Rate Setting
Typical Rate Designs based on Customer’s Metered Usage
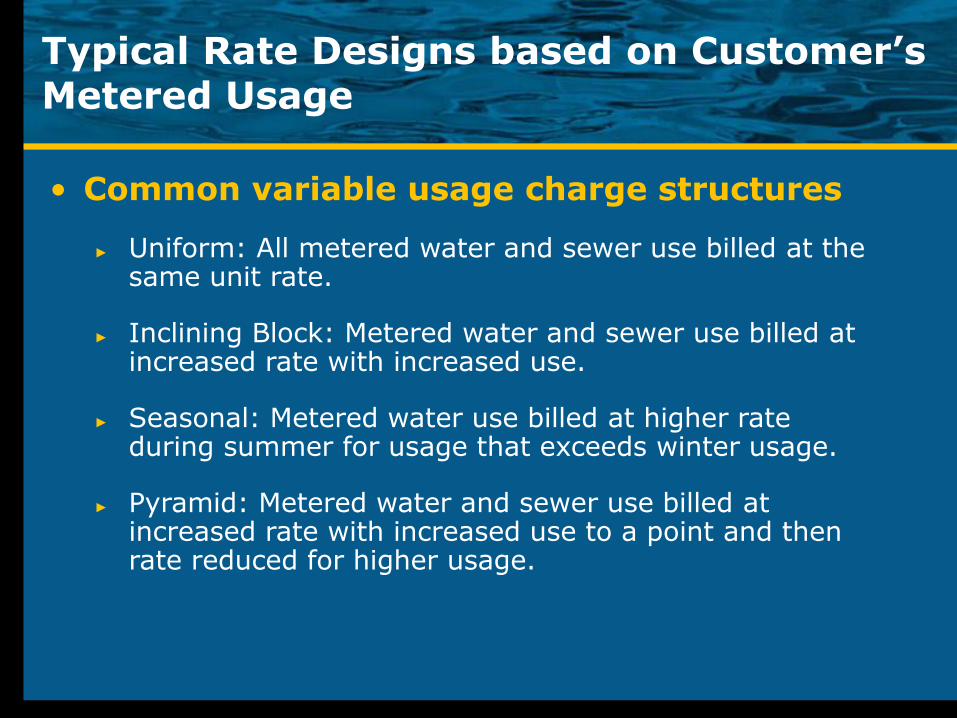
• Common variable usage charge structures
► Uniform: All metered water and sewer use billed at the same unit rate.
► Inclining Block: Metered water and sewer use billed at increased rate with increased use.
► Seasonal: Metered water use billed at higher rate during summer for usage that exceeds winter usage.
► Pyramid: Metered water and sewer use billed at increased rate with increased use to a point and then rate reduced for higher usage.

Typical Rate Setting Components
Financial Model
Technical Evaluation
of Data
Water & Sewer System Costs
Capital Costs and Financing
Customer Allocations Develop
Alternatives
Regional and
National Trends
Policy Factors

Regional Rate Comparison for City of Portsmouth, NH
1. New Hampshire Systems
2. Systems with Similar Demographics
3. Coastal Communities

Rate Comparison - Water
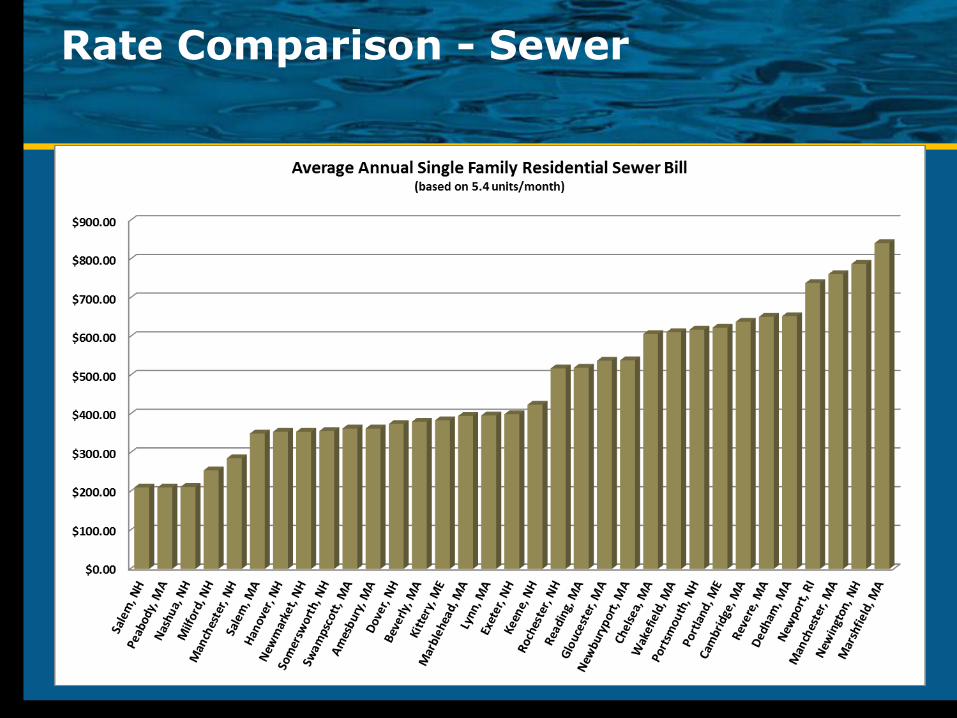
Rate Comparison - Sewer

Rate Comparison - Combined

Rate Comparison – Sewer Bill Offsets
• Some Systems Utilize General Funds to offset capital and/or operating costs:
• Peabody, MA:
• 20% of sewer costs are paid for by the General Fund
• Wolfeboro, NH:
• All sewer capital projects are financed through the General Fund (43% of overall sewer costs)

Sewer Billing based on a % of Water Consumption
■ Attleboro – Sewer uses 90% of water consumption for billing
■ Clinton – Sewer uses 75% of water consumption for billing
■ Concord – Sewer uses 77% of water consumption for billing, only during summer months
■ Dighton – Sewer uses 80% of water consumption for billing
■ Huntington – Sewer use is based on 80% of water consumption
■ Mansfield – Sewer use is based on 85% of water consumption
■ Melrose – Sewer use is based on 90% of water consumption
■ North Brookfield – Sewer use is based on 90% of water consumption
■ Northbridge – Uses winter average consumption for residential sewer bills year round
■ Norwood – Sewer use is based on 60% of water consumption
■ Plainfield – Sewer use is based on 85% of water consumption, only for residential customers
■ Walpole – Sewer use if based on 80% of water consumption
■ Westborough – Sewer use is based on 80% of water consumption
■ Worcester – Sewer use is based on 80% of water consumption for 5/8” metered services (residential)

Sewer - Flat Fee Structures
■ Bourne – Flat fee of $734/year which includes 45,000 gallons of consumption. $0.10/gallon after that.
■ Raynham – Flat fee of $228/year
■ Dalton – Flat fee of $110/dwelling unit, 2x/year
■ Dracut – Flat fee of $460/year
■ Tyngsborough – Flat fee of $496/year
■ Woburn – Flat fee of $328/year
■ Montague – Unmetered customers pay flat fee of $334/year
■ South Hadley – Flat fee of $265/year for residential customers
■ Granby - $183.50/Equivalent Dwelling Unit, 2x year
■ Ludlow – Well accounts are billed $50.00/person living in household
■ Stoughton – Well accounts pay $242/private home, $161/condominium

Sewer - Seasonal Rates
■ Chatham – Seasonal rates: Summer is 2x winter rate

Sewer - Early Payment Discounts
■ Mansfield – Early payment discount of 10%
■ Wakefield – Early discount of 10%

Stormwater and Infiltration Fees
■ Fall River – Stormwater fee of $140/year assessed to each customer
■ Rutland – Infiltration and inflow fee of $32.00/quarter to each customer ($128/year)

Rate Increases – Regionally 10 Year Percentages
Community Period Water Increase
Sewer Increase
Manchester, NH 2001-2010 53% 105%
Boston, MA 2001-2010 122% 56%
South Burlington, VT 2001-2010 67% 108%

Tighe & Bond’s Water and Sewer Rate Surveys

Typical Annual Homeowner’s Cost in Massachusetts
$271 $290 $321
$363
$426 $470
$323 $357
$408
$485
$584 $638
2000 2002 2004 2006 2009 2010
Average Annual Cost
Water Sewer
Note: Based on 120 HCF/90,000 gallons per year (247 gpd).
$5
.32
/ H
CF
$3
.92
/ H
CF
Water – 73% Increase Sewer – 98% Increase
Reference: Tighe & Bond Water and Sewer Rate Surveys

Results - Typical Annual Homeowner’s Cost in CT
$265 $278 $285
$331 $355
$415
$200 $211
$261
$305
$364 $369
2001 2003 2005 2007 2009 2011
Average Annual Cost
Water Sewer
Note: Based on 96 HCF/72,000 gallons per year (197 gpd).
$3
.84
/ H
CF
$4
.32
/ H
CF
Water – 57% Increase Sewer – 85% Increase
Reference: Tighe & Bond Water and Sewer Rate Surveys

National Trends - Rates
■ Overall United States Water and Sewer Rates Increased 53% from 2001 to 2009
– Black & Veach 2009/2010 Water/Wastewater Rate Survey

Combined Water and Sewer Rate Increases 2000 to 2010 (70% to 89%) 2010 Water and Wastewater Rate Survey
American Water Works Association

Combined Water and Sewer Rate Increases 2000 to 2010 (80% to 129%) 2010 Water and Wastewater Rate Survey
American Water Works Association
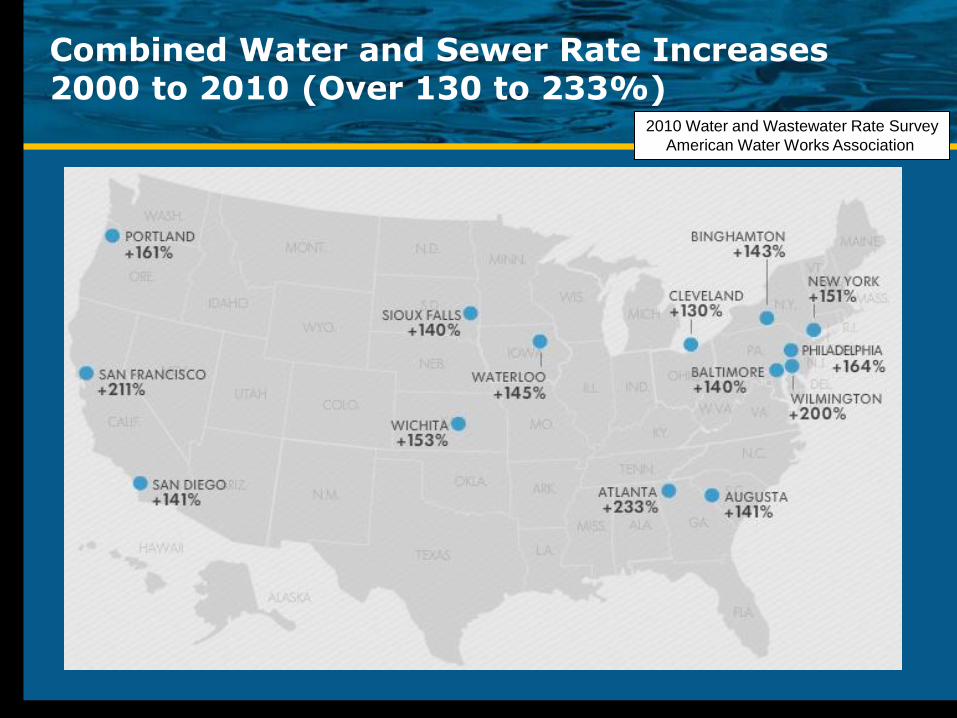
Combined Water and Sewer Rate Increases 2000 to 2010 (Over 130 to 233%)
2010 Water and Wastewater Rate Survey
American Water Works Association
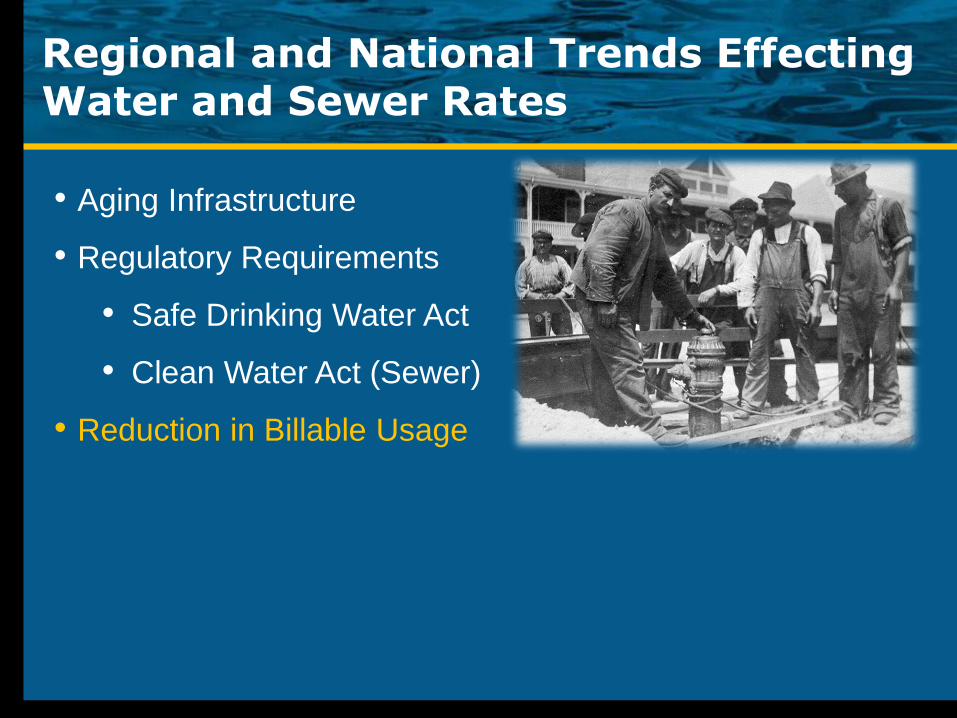
Regional and National Trends Effecting Water and Sewer Rates
• Aging Infrastructure
• Regulatory Requirements
• Safe Drinking Water Act
• Clean Water Act (Sewer)
• Reduction in Billable Usage

Usage Trends – Regionally Vermont
■ Champlain Water District – 18% Decrease from 2001 to 2010
– Champlain Water District - “2010-2011 Annual Report”

Usage Trends – Regionally Maine
Source: Maine Public Utilities Commission – Annual Reports of Portland Water District
0
20,000
40,000
60,000
80,000
100,000
120,000
140,000
160,000
2005 2006 2007 2008 2009 2010 2011
Ave
rage
An
nu
al W
ate
r U
se (
Gal
lon
s p
er
Cu
sto
me
r)
Portland Water District - Annual Use Per Customer

Usage Trends – Regionally Massachusetts
0
50
100
150
200
250
2002 2003 2004 2005 2006 2007 2008 2009 2010 2011
Massachusetts Water Resources Authority Average Daily Delivery – Million Gallons
Source: Summary Report of MWRA’s Demand Management Program for Fiscal Year 2012

Usage Trends – Regionally Connecticut
Source: Connecticut DPUC Annual Reports
0
5,000,000
10,000,000
15,000,000
20,000,000
25,000,000
30,000,000
2005 2006 2007 2008 2009 2010 2011
Tota
l An
nu
al W
ate
r Sa
les
(Gal
lon
s)
Aquarion Water Co., of Connecticut - Total Annual Water Sales

0.00
1.00
2.00
3.00
4.00
5.00
6.00
Million Gallons per Day and 5 Year Rolling Average
Usage Trends – New Hampshire
Portsmouth, NH Water Division
Source: Portsmouth Water System Master Plan (2012 draft) – Tighe & Bond
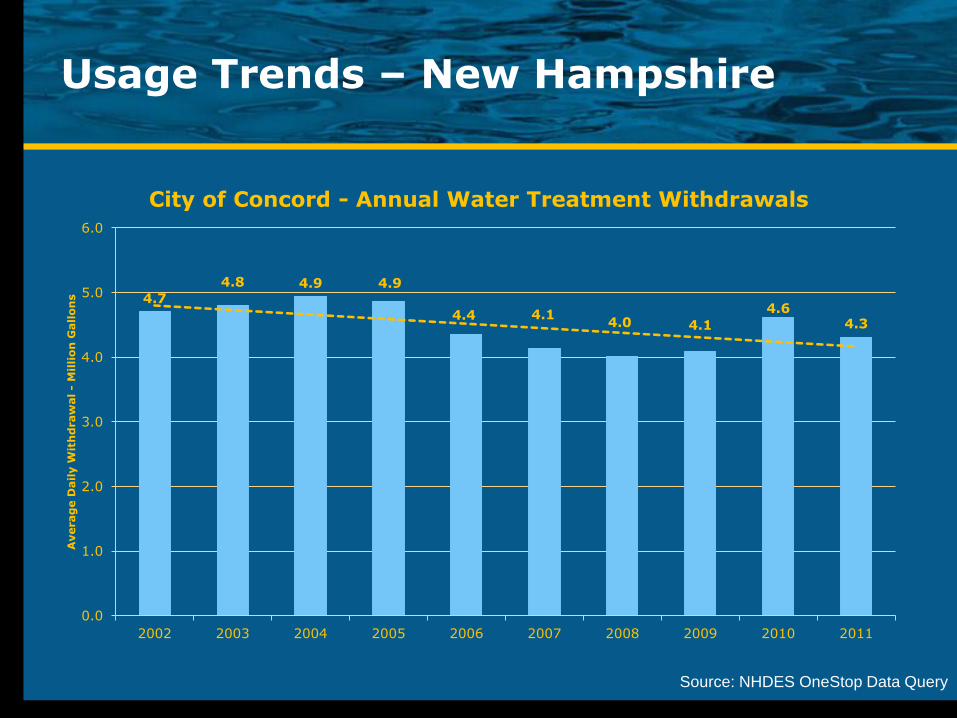
4.7
4.8 4.9 4.9
4.4 4.1 4.0 4.1
4.6 4.3
0.0
1.0
2.0
3.0
4.0
5.0
6.0
2002 2003 2004 2005 2006 2007 2008 2009 2010 2011
Averag
e D
ail
y W
ith
draw
al -
Mil
lio
n G
all
on
s
City of Concord - Annual Water Treatment Withdrawals
Usage Trends – New Hampshire
Source: NHDES OneStop Data Query

Usage Trends – New Hampshire
Source: NHDES OneStop Data Query
12.3 11.5
9.9
11.3
10.2 10.9
0.0
2.0
4.0
6.0
8.0
10.0
12.0
14.0
2007 2008 2009 2010 2011 2012
Ave
rage
Dai
ly W
ith
dra
wal
- M
illio
n G
allo
ns
Pennichuck Water (Nashua) - Water Treatment Flows
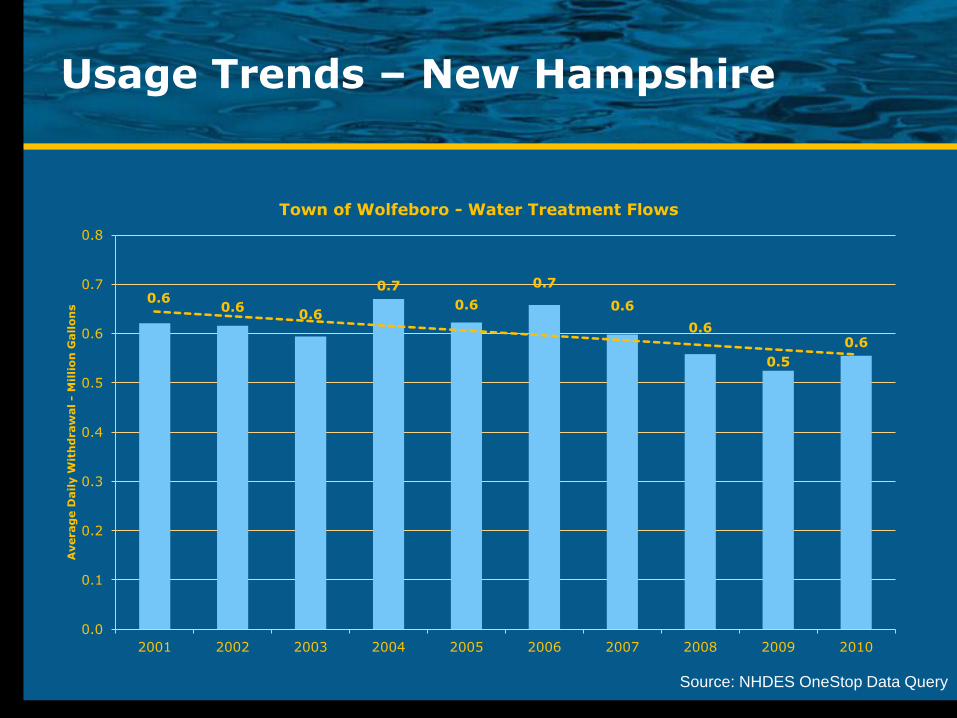
Usage Trends – New Hampshire
Source: NHDES OneStop Data Query
0.6 0.6
0.6
0.7
0.6
0.7
0.6
0.6
0.5
0.6
0.0
0.1
0.2
0.3
0.4
0.5
0.6
0.7
0.8
2001 2002 2003 2004 2005 2006 2007 2008 2009 2010
Averag
e D
ail
y W
ith
draw
al -
Mil
lio
n G
all
on
s
Town of Wolfeboro - Water Treatment Flows

Usage Trends – New Hampshire
0
5,000
10,000
15,000
20,000
25,000
30,000
35,000
40,000
45,000
50,000
2007 2008 2009 2010 2011
Aquarion Water Company of NH Average Residential Customer Annual Use (Gallons)
Source: Attachment MAN-5 NHPUC DW 12-085 Docket

■ Milwaukee, Wisconsin: 46% reduction in Residential Use since 1975
– AWWA Streamlines, August 23, 2012
■ Seattle, Washington: 30% reduction in Total Use since 1995
– AWWA Streamlines, August 23, 2012
■ Louisville, Kentucky: 20% reduction in Total Use from 1975 to 2000
– AWWA Journal, February 2011
■ “When the price of residential water increases by one percent, the quantity demanded falls by 0.41%”
– USEPA: The Importance of Water to the U.S. Economy, September 2012 Public Review Draft
Usage Trends – Nationally

Faucets – 16%
Showers – 17%
Clothes Washers – 22%
Toilet Flushing – 27%
Typical Indoor Water Use – 1990’s

SHOWER HEADS:
Typical Shower
Heads use 2.5
gallons-per-minute,
Higher Efficient
Shower Heads use
2.0 gallons-per-
minute or less.
Most full-sized High
Efficiency washers
use 13 gallons of water
per load, compared to
the 27 gallons used by
standard top loading
machines.
20 Years Later –
More Efficient Plumbing
HIGH EFFICIENCY
TOILETS:
• 1.28 to 1.6 Gallons per
Flush versus older
models that used 3.5
to 5.0 Gallons per flush

Tampa Water Study:
49% Reduction of Indoor Use after Retrofit with
High Efficiency Plumbing Fixtures

Water Efficient Appliances are Mainstream

Declining Water Use – Mark Naylor, New Hampshire Public Utilities Commission - testimony on January 11, 2013
■ “Declining water use is a national trend and the reasons are many. Among these reasons are changing attitudes toward conservation, greater use of low flow appliances, changing demographics including smaller households, economic conditions, greater use of bottled water, and customer response to the rising cost of water resulting in part from regulatory requiremtns such as the Safe Drinking Water Act.”
■ The resulting reduction in sales columes creates upward pressure on customer rates.

More frequent water billing
■ More frequent billing can result in a reduction of water use, as consumers feel the immediate impact of high water use on their bill, and are more likely to adjust for it during the next month.
■ Helps identify leaks quickly as water consumption is compared to prior month or yearly use.

Large Customers Cutting Back
■ Between 2000 to 2009 IBM cut it’s water use by 29%
■ “IBM discovered, the measuring of its water use alone created a change in behavior – just like when you keep track of every calorie you eat, you start cutting back”
– “The Big Thirst” by Charles Fishman, Free Press (2011)
IBM – Burlington, Vermont:

Large Customers Cutting Back:

Usage trends are critical to other systems:

Usage trends are critical to other systems:

Usage trends are critical to other systems:

The Car Analogy
■ 1976 Volkswagen Rabbit
■ 24 MPG
■ 2012 Honda Civic
■ 34 MPG

The Car Analogy
■ 1976 Volkswagen Rabbit ■ 2012 Honda Civic
Year Car MPG Annual Miles
Annual Gallons Change
% Change
Gasoline Cost Gal
Change in Cost
% Change in Cost
Annual Cost
Annual Cost
Change
% Annual Change in
Cost
1980 1976 Volkswagen Rabbit 24 12,000 500 $1.00 $500
2012 2012 Honda Civic 34 12,000 353 -147 -29% $3.50 $2.50 250% $1,235 $735 147%

The Car Analogy – Another Way to Look at it… Still driving the Rabbit
■ 1976 Volkswagen Rabbit
Year Car MPG Annual Miles
Annual Gallons Change
% Change
Gasoline Cost Gal
Change in Cost
% Change in Cost
Annual Cost
Annual Cost
Change
% Annual Change in
Cost
1980 1976 Volkswagen Rabbit 24 12,000 500 $1.00 $500
2012 1976 Volkswagen Rabbit 24 12,000 500 0 0% $3.50 $2.50 250% $1,750 $1,250 250%

![Sewer Processes and Design - SKYSCRAPERS · 2018-09-02 · SANITARY SEWER SYSTEM [Foul Sewer] I. Storm Sewer System STORM SEWER is designed to drain excess rainfall and groundwater](https://img.pdfslide.us/doc/110x75/5e9b180035942256b30ec806/sewer-processes-and-design-skyscrapers-2018-09-02-sanitary-sewer-system-foul.jpg)