Embed Size (px)
Citation preview

1
Region VI Phase I Housing Findings
Presented to: South Central Dakota Regional Council
Presented by: Maxfield Research Inc.
February 15, 2013
Agenda │ Processes
• Maxfield Research Overview
• Project Scope
• Phase I & Phase II Overview
• Methodology and Sources Used
• Demographic Findings
• Employment
• Housing Characteristics
• For‐Sale Housing
• Rental Housing
• Senior Housing
• Phase I Demand Summary
• Housing Affordability
• Challenges
• Opportunities
• Next Steps
• Questions
Agenda | Processes

2
• 30 years of experience
• Market experts in all real estate/land
use types
• Diverse clientele
• Work closely with governmental
agencies
• Customized work programs
• Detailed recommendations
• Objective analysis
Real Estate
Research & Consulting
Maxfield Research Inc.
Objective
Custom‐built studies based on the needs of Region VI
Provide custom comprehensive housing study
ApproachIdentify current & future housing needs for residents in Region VI and provide framework for meeting housing needs
OutcomeResearch and analysis will provide decision makers with an objective overview of housing conditions for existing and future residents
Key Recommendations• Short and long-term housing needs• Recommendations guiding future housing development• Tools/policies to implement the plan
Deliverables
Key study checkpoints• Phase I complete (January 2013)• Phase II ongoing• Final: TBD
Project Scope

3
Phase I Phase II
Phase I & Phase II
• High‐level assessment
• Review of 2012 ND Statewide Housing Needs Assessment
• Initial Findings based on:• Demographic/economic
projections• Household characteristics• Building permits, etc.
• Demand by housing type to 2020
• Refine Phase I findings
• In progress (Spring 2013)
• Field work & Interviews, Interviews, Interviews…
• Detailed recommendations by County/Submarket• Product types, pricing,
absorption, target markets, etc.
• Challenges & Opportunities
Methodology
Census Bureau• Baseline 2010
2012 ND Statewide Housing Needs Assessment• Model 1: Historic trends• Model 2: Future growth
based on recent changes
American Community Survey• On‐going survey• Data collected ‘07‐’11• Samples diminish in rural
areas• Margin of error varies
ESRI• Nat’l demographic provider• Estimates per July 2012• Multiple data sources
Maxfield Research• Projections adjusted based
on local data & our methodologies
Data Sources:

4
North Dakota Planning Regions
Demographic Findings
Region VI population declined between 1990 & 2010 (‐15% | ‐9,931 people)
Population (2010) Region VI: 56,363 (8.4% of ND) Stutsman: 37.4% Barnes: 19.6%
Projected population growth in Region VI 2010‐2020: +1,924 (+3.4%)
Most Region VI growth in Stutsman & Barnes
Baby boomers driving growth‐3.2
‐5.7
1.4
‐5.5
‐10.1
9.1
27.5
5.6
‐20.0 ‐10.0 0.0 10.0 20.0 30.0 40.0
19 & under
20 to 24
25 to 34
35 to 44
45 to 54
55 to 64
65 to 74
75+
Percent
Age
Projected Population Growth by AgeNorth Dakota Region VI (2010‐2017)
0
10,000
20,000
30,000
40,000
50,000
60,000
70,000
1990 2000 2010 2020 2030
Region VI Population: 1990 to 2030

5
Demographic Findings
‐
5,000
10,000
15,000
20,000
25,000
30,000
1990 2000 2010 2020 2030
Region VI Households1990‐2030
Wells Co.
Stutsman Co.
McIntosh Co.
Logan Co.
LaMoure Co.
Griggs Co.
Foster Co.
Dickey Co.
Barnes Co.
2.55
2.42
2.30 2.29 2.28
2.65
2.50
2.392.35 2.34
2.00
2.25
2.50
2.75
3.00
1990 2000 2010 2020 2030
Average Household Size
Region VI
North Dakota
Average household size has decreased steadily over the years… • 2.55 in 1990• 2.30 in 2010 (‐9.6%)
Household sizes throughout North Dakota are somewhat larger, but experienced a similar drop… • 2.65 in 1990 • 2.39 in 2010 (‐9.7%)
This trend is an indication of an aging household base
By 2020, the Region is expected to add +934 households
Demographic Findings
About 72% of all households owned their housing in 2010• 65.4% statewide
Estimated 19,350 households (79%) in 2012 are income‐qualified for rental housing (based on the median gross rent of $470)
By 2020, the total income‐qualified population is projected to increase +4.0%
‐
500
1,000
1,500
2,000
2,500
3,000
3,500
4,000
4,500
<25 25‐34 35‐44 45‐54 55‐64 65‐74 75+
Households
Region VI Households Income‐Qualified for Rental Housing
2012
2017
69.0
72.1
74.4
76.5
81.3
83.6
79.3
66.7
78.8
71.9
65.4
31.0
27.9
25.6
23.5
18.7
16.4
20.7
33.3
21.2
28.1
34.6
0% 20% 40% 60% 80% 100%
Barnes
Dickey
Foster
Griggs
LaMoure
Logan
McIntosh
Stutsman
Wells
Region VI
North Dakota
2010 Household Tenure
Owner
Renter

6
Demographic Findings
Married couple households with children declining • ‐26.1% (2000‐2010)
Non‐family households with roommates increased +27.2% (+315 households) and single‐person households increased by +264 (+3.3%)
An increase in the percentage of these households indicates a shift in housing needs that favors rental development
‐17.1%
‐26.1%
13.4%
‐1.1%
19.8%
2.1%
17.4%
3.3%
28.2% 27.2%
‐40.0%
‐30.0%
‐20.0%
‐10.0%
0.0%
10.0%
20.0%
30.0%
40.0%
North Dakota Region VI
Household Type2000 ‐ 2010 Percent Change
Married w/ Child Married w/o Child Other Fam Living Alone Roommates
‐50.0%
‐30.0%
‐10.0%
10.0%
30.0%
50.0%
Household Type by County2000 ‐ 2010 Percent Change
Married w/ Child Married w/o Child Other Fam Living Alone Roommates
Region VI employment grew 6%
Region 67.7%
Region 19.1%
Region 213.5%
Region 34.9%
Region 415.1%
Region 536.5%
Region 723.1%
Region 87.0%
2011 Average Employment by Region% of State Total
North
Dakota Region 1 Region 2 Region 3 Region 4 Region 5 Region 6 Region 7 Region 8
% Growth '00‐'12q2 34% 260% 41% 4% 11% 26% 6% 26% 81%
Avg. Annual Growth 1.9% 12.7% 2.1% 0.1% 0.7% 1.7% 0.2% 1.8% 4.2%
AVERAGE EMPLOYMENT
NORTH DAKOTA PLANNING REGION COMPARISON
2000 ‐ 2012 Q2
‐
20,000
40,000
60,000
80,000
100,000
120,000
140,000
Average Employment by Region
Region 6
Region 1
Region 2
Region 3
Region 4
Region 5
Region 7
Region 8
7
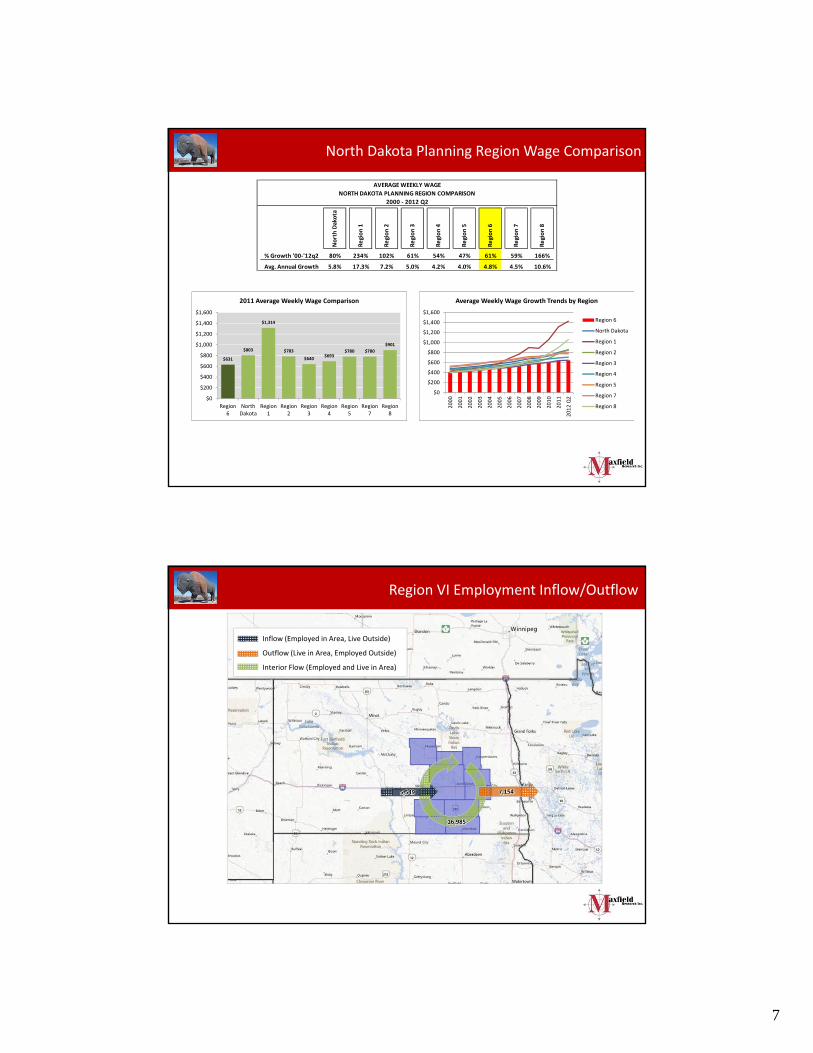
North Dakota Planning Region Wage Comparison
$0
$200
$400
$600
$800
$1,000
$1,200
$1,400
$1,600
2000
2001
2002
2003
2004
2005
2006
2007
2008
2009
2010
2011
2012 Q2
Average Weekly Wage Growth Trends by Region
Region 6
North Dakota
Region 1
Region 2
Region 3
Region 4
Region 5
Region 7
Region 8
North Dakota
Region 1
Region 2
Region 3
Region 4
Region 5
Region 6
Region 7
Region 8
% Growth '00‐'12q2 80% 234% 102% 61% 54% 47% 61% 59% 166%
Avg. Annual Growth 5.8% 17.3% 7.2% 5.0% 4.2% 4.0% 4.8% 4.5% 10.6%
AVERAGE WEEKLY WAGE
NORTH DAKOTA PLANNING REGION COMPARISON
2000 ‐ 2012 Q2
$631
$803
$1,314
$783
$640$693
$780 $780
$901
$0
$200
$400
$600
$800
$1,000
$1,200
$1,400
$1,600
Region6
NorthDakota
Region1
Region2
Region3
Region4
Region5
Region7
Region8
2011 Average Weekly Wage Comparison
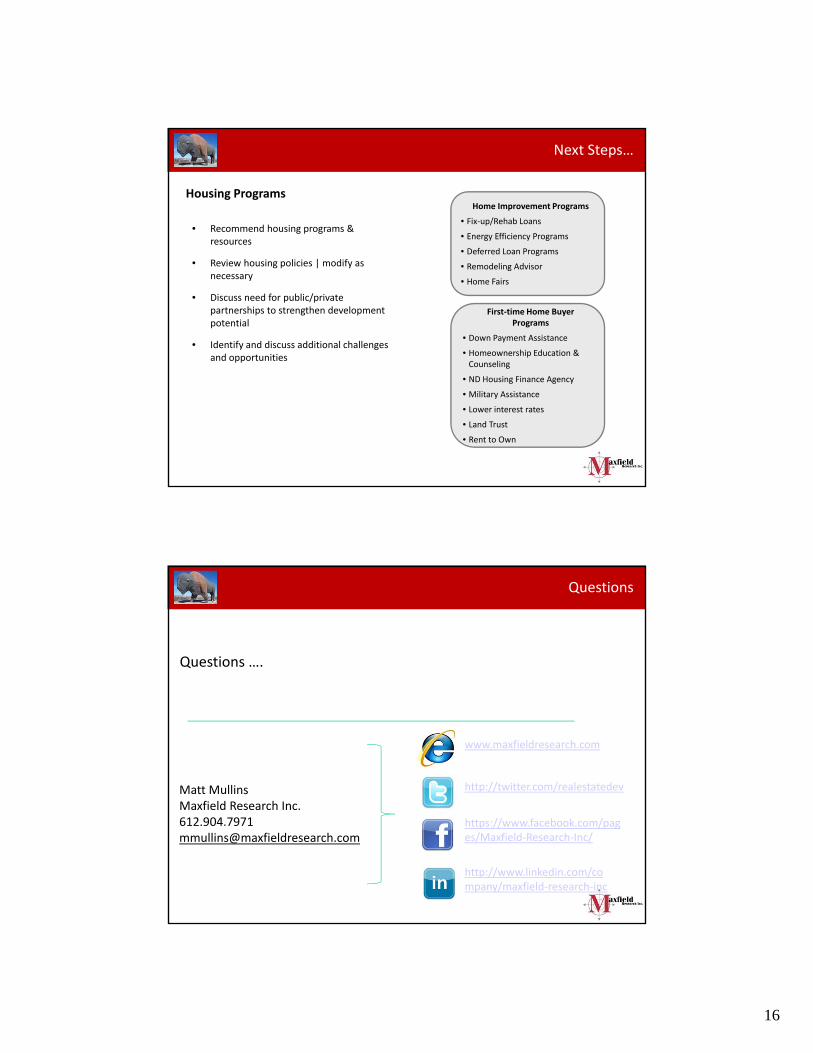
Region VI Employment Inflow/Outflow
Inflow (Employed in Area, Live Outside)
Outflow (Live in Area, Employed Outside)
Interior Flow (Employed and Live in Area)
16,985

8
1,912
515
587
314
524
182
297
2,983
418
‐1,904
‐854
‐632
‐443
‐828
‐373
‐332
‐3,301
‐670
8
‐339
‐45
‐129
‐304
‐191
‐35
‐318
‐252
‐4,000 ‐3,000 ‐2,000 ‐1,000 0 1,000 2,000 3,000 4,000
Barnes
Dickey
Foster
Griggs
LaMoure
Logan
McIntosh
Stutsman
Wells
North Dakota Region VI Employment Inflow/Outflow by County
Inflow
Outflow
Net
Region VI Employment Inflow/Outflow by County
----- Worker Outflow----- -----Worker Inflow-----
Region VI Employment Inflow/Outflow by Metropolitan/Micropolitan Area
Inflow (Employed in Area, Live Outside)
Outflow (Live in Area, Employed Outside)
Minot
Bismarck 1,290 workers
Aberdeen
Fargo2,567 workers
Grand Forks
Wahpeton
Region VI687 workers
1,226 workers

9
Housing Characteristics
Housing stock is predominantly single‐family homes, ranging from 68.7% in Stutsman County to 92.5% in McIntosh County
Barnes and Stutsman Counties had the greatest portion of large multifamily structures (20+ units)
For‐Sale Housing
40,000
50,000
60,000
70,000
80,000
90,000
100,000
Median Value
County
Region VI Owner‐Occupied Housing Values (2011)For‐Sale Housing Stock (per ACS)
17,600+ owner‐occupied units
Median value of $77,000
• $49,700 (McIntosh)
• $92,800 (Stutsman)
52% of housing stock located in Stutsman & Barnes
31% of owner‐occupied homes in Region VI valued <$50,000

10
For‐Sale Housing
New Construction
Newer subdivisions
• Avg. lot cost w/services: $30k+
• Home value w/lot: $175k+
• Mostly build‐to‐suit, few spec
Lot availability
Premium for new construction ($140 PSF+)
Infrastructure costs – risk to builders/developers
Active Listings (Feb. 2013)
Limited inventory
Lack of centralized MLS
Median List price:
• Jamestown: $135,000
• Valley City: $130,000
• Dickinson: $294,000
• Williston: $241,610
• State: $180,000
Rental Housing
0
500
1,000
1,500
2,000
2,500
3,000
Units
County
Rental Units by County ‐ 2011
1, 33.9%
2 to 4, 20.6%5 to 9, 13.8%
10 to 19, 16.2%
20+, 13.0%
Other, 2.5%
Rental Units by Size of Structure
Region VI Rental Stock (per ACS)
6,500 rental units
64% of rental units in Stutsman and Barnes Counties
Most rentals are single‐family (34%)
30% of rental stock in 10+ unit buildings
Median contract rent averaged $397/mo. • $304 (Griggs) • $433 (Stutsman)

11
Rental Housing(All Ages General‐Occupancy Bldgs. 4+ Units)
Housing Stock• Older rental housing stock• Avg. rent per square foot well under $1.00/PSF
Vacancy factor • Affordable – higher vacancies than market rate
No. of Properties• Maxfield surveyed 99 properties | 53 responses | 1,175 units
• Ongoing
Typical Market Rate Rents • 1BR ‐ $420• 2BR ‐ $505• 3BR ‐ $670
454
138
105
52
119
63
108
509
112
0 100 200 300 400 500
Barnes
Dickey
Foster
Griggs
LaMoure
Logan
McIntosh
Stutsman
Wells
Units
County
Region VI Rental Units by County
Senior Housing
Inventory • 700+ units• 53% of units AL or AL/Basic Care
• 58% of product in Stutsman & Barnes Counties
• Nearly all rental units (6 units are for‐sale)
• 27 properties contacted | 18 responses | 485 units
146
104
194 190
82
0
50
100
150
200
250
Active Adult Congregate Assisted Living AL/Basic Care Memory Care
Region VI Senior Units
193
59
3626
6051 55
220
16
0
50
100
150
200
250
Senior Units by County

12
Phase I Demand Summary
Demand Drivers
• Demographics
• Economy & Job Growth
• Consumer Choice | Preferences
• Turnover
• Supply (i.e. Existing Hsg. Stock)
• Replacement need (i.e. functionally /physically obsolete)
• Financing
Phase I Demand
Household growth & tenure
Turnover
Percent capturable by county
Phase II Demand
Refined based on market findings
Income‐qualified households
Demand by product type | Preferences
Percent capturable by submarket
Phase I Demand Summary
Total
Demand
General‐Occ.
Total
For‐Sale
Housing
Market
Rate Rental
Senior Housing
Total Active Adult Congregate
Assisted
Living
Memory
Care
Region VI 2,676 1,723 670 1,053 953 335 251 176 191
Barnes County 500 409 157 252 91 6 60 ‐5 30
Dickey County 230 117 40 77 113 53 30 21 10
Foster County 171 91 32 59 80 17 25 21 18
Griggs County 106 40 17 23 66 19 10 22 15
LaMoure County 156 62 32 30 94 42 17 21 14
Logan County 68 24 14 10 44 21 14 ‐2 10
McIntosh County 111 40 19 21 71 19 17 15 20
Stutsman County 1,131 871 331 541 260 106 59 47 48
Wells County 204 69 29 41 135 53 20 36 26
Source: Maxfield Research, Inc.
General‐Occupancy Housing Excess Market Rate Senior Housing Demand
2012 ‐ 2020 2017
TABLE F‐1
HOUSING DEMAND SUMMARY BY COUNTY
NORTH DAKOTA REGION VI
January 2013
Demand for over 2,600 housing units through 2020

13
Phase I Demand Summary
0
200
400
600
800
1,000
1,200
Barnes Dickey Foster Griggs LaMoure Logan McIntosh Stutsman Wells
Units
County
Region VI Demand Summary
Senior GO Rental For‐Sale
670
1,053
953
0 200 400 600 800 1,000 1,200
For‐Sale
GORental
Senior
Units
Region VI Demand by Product Type
Rental housing = 60% of total general‐occupancy demand
Senior housing accounts for 36% of total demand
Active adult (few services) has highest senior demand
Stronger senior demand in more rural counties
42% of all demand in Stutsman County
Housing Affordability
For‐Sale (Assumes 10% down payment and good credit)
Entry‐Level Move‐Up Executive Entry‐Level Move‐Up Exec/Det.Price of House $50,000 $125,000 $200,000 $75,000 $100,000 $200,000Pct. Down Payment 10.0% 10.0% 10.0% 10.0% 10.0% 10.0%Total Down Payment Amt. $5,000 $12,500 $20,000 $7,500 $10,000 $20,000Cost of Loan $45,000 $112,500 $180,000 $67,500 $90,000 $180,000
Interest Rate 3.750% 3.750% 3.750% 3.750% 3.750% 3.750%Number of Pmts. 360 360 360 360 360 360Monthly Payment (P & I) ‐$208 ‐$521 ‐$834 ‐$313 ‐$417 ‐$834(plus) Prop. Tax ‐$75 ‐$188 ‐$300 ‐$113 ‐$150 ‐$300(plus) HO/Assoc. Fee for TH ‐$17 ‐$42 ‐$67 ‐$125 ‐$125 ‐$125(plus) PMI/MIP (less than 20%) ‐$20 ‐$49 ‐$78 ‐$29 ‐$39 ‐$78
Subtotal monthly costs ‐$320 ‐$799 ‐$1,278 ‐$579 ‐$731 ‐$1,337
Housing Costs as % of Income 30% 30% 30% 30% 30% 30%
Minimum Income Required $12,783 $31,957 $51,131 $23,174 $29,232 $53,464
Pct. of Region VI Housholds 85.6% 63.0% 24.9% 61.7% 66.3% 24.9%
Rental
1BR 2BR 3BR 1BR 2BR 3BRMonthly Rent $420 $505 $670 $675 $900 $1,000Annual Rent $5,040 $6,060 $8,040 $8,100 $10,800 $12,000
Housing Costs as % of Income 30% 30% 30% 30% 30% 30%
Minimum Income Required $16,800 $20,200 $26,800 $27,000 $36,000 $40,000
Pct. of Region VI Housholds 81.2% 77.1% 69.1% 67.7% 58.9% 54.3%
REGION VI HOUSING AFFORDABILITY ‐ BASED ON HOUSEHOLD INCOME
Single‐Family Townhome
Existing Rental New Rental
• Majority of HHDS. can afford housing in Region VI
• Older properties are indirectly meeting the needs of households who need affordable housing

14
Challenges
Development Cost/Price Sensitivity
• Financially difficult to plat new lots
i.e. raw land costs, entitlements, infrastructure, financing, etc.
• Developers sensitive to carrying costs of unsold lots
• Lot‐to‐home ratio % low in Region VI
• Nationally 18% to 25%
• Region VI <15%
Multifamily Development Costs
• Difficult to cash‐flow given achievable rents/development costs
Challenges
• Competition for labor in oil patch
• Lack of workers & housing could hinder economic development
• Where do new employees working in the region live?
• Wages are lower than other North Dakota regions
• Land & construction costs up
• Loss of housing stock from flood buy‐outs
• Older housing stock
• Housing development talk…but no action
• Rural water dispute | Infrastructure costs
• Financing/Lenders
• Others…

15
Opportunities…
• Housing costs are affordable & lower than most ND submarkets
• Capitalize on other markets with housing shortages (i.e. oil patch, Bismarck, Fargo,
Aberdeen, etc.)
• Rising cost of housing in oil patch driving existing residents elsewhere
• “Bakken spillover” from the oil patch to Region VI
• Capitalize on new employment growth opportunities
• Private/public partnerships
• Access and Transportation
• Upgrade and diversity housing stock in the Region
• Temporary housing
• Public relations campaign
• Others…
Next Steps…
• Quantify demand for all housing products (By submarkets)
• Identify untapped market niches for target markets for new housing
• Recommend specific housing concepts
• Product type
• Units/type/mix/amenities, etc.
• Pricing/timing
• Discuss need for public/private partnerships to strengthen development potential
• Identify and discuss additional challenges and opportunities for Region VI communities
Provide Critical Recommendations to Guide Future Housing Development in Region VI
16
• Recommend housing programs & resources
• Review housing policies | modify as necessary
• Discuss need for public/private partnerships to strengthen development potential
• Identify and discuss additional challenges and opportunities
Home Improvement Programs
• Fix‐up/Rehab Loans
• Energy Efficiency Programs
• Deferred Loan Programs
• Remodeling Advisor
• Home Fairs
First‐time Home Buyer Programs
• Down Payment Assistance
• Homeownership Education & Counseling
• ND Housing Finance Agency
• Military Assistance
• Lower interest rates
• Land Trust
• Rent to Own
Housing Programs
Next Steps…
Matt Mullins Maxfield Research Inc. [email protected]
www.maxfieldresearch.com
http://twitter.com/realestatedev
https://www.facebook.com/pages/Maxfield‐Research‐Inc/
http://www.linkedin.com/company/maxfield‐research‐inc
Questions ….
Questions