Embed Size (px)
Citation preview
Regents Review #2
Functionsf(x) = 2x – 5
g(x) = (½
)x
y =
¾x
f(x) = 1.5(4)x
Linear & Exponential
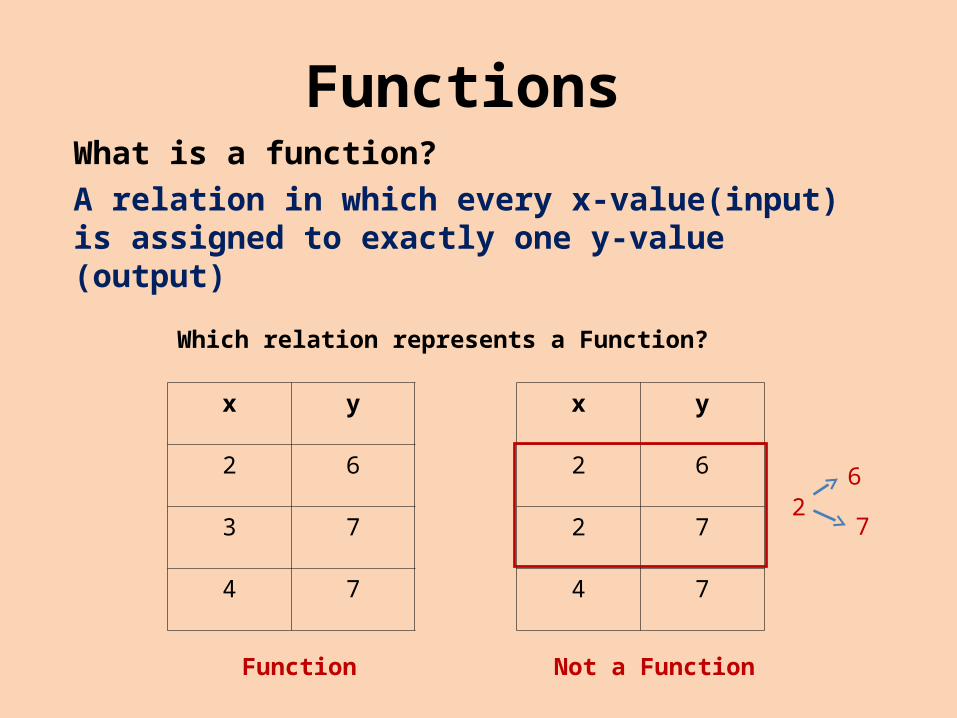
FunctionsWhat is a function?A relation in which every x-value(input) is assigned to exactly one y-value (output)
Which relation represents a Function?
x y
2 6
3 7
4 7
x y
2 6
2 7
4 7
Function Not a Function
26
7
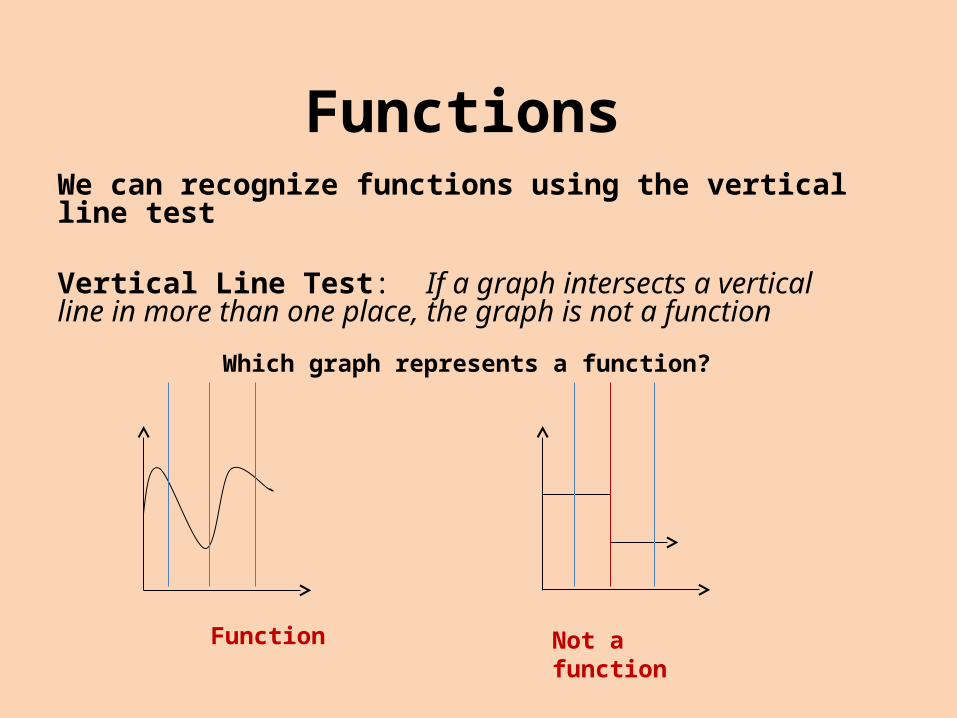
FunctionsWe can recognize functions using the vertical line test
Vertical Line Test: If a graph intersects a vertical line in more than one place, the graph is not a function
Which graph represents a function?
Function Not a function
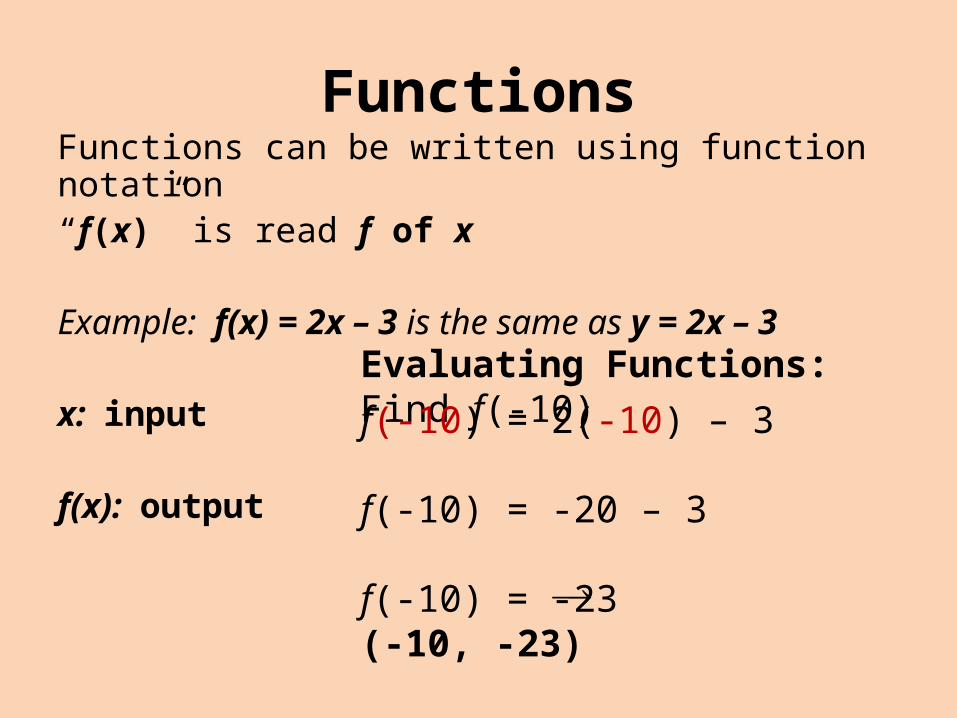
FunctionsFunctions can be written using function notation “f(x)” is read f of x
Example: f(x) = 2x – 3 is the same as y = 2x – 3
x: input
f(x): output
Evaluating Functions: Find f(-10)
f(-10) = 2(-10) – 3
f(-10) = -20 – 3
f(-10) = -23 (-10, -23)
Linear Functions
Linear Functions “y = mx +b”
The easiest ways to graph a linear function are…
1)Table of Values
2) Slope-Intercept Method
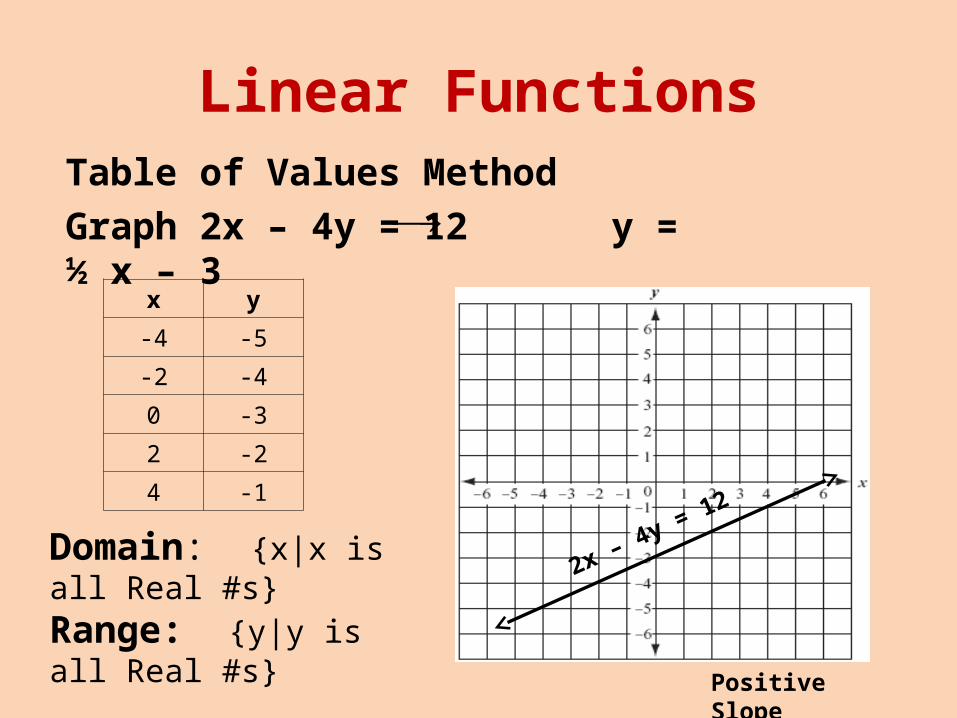
Linear FunctionsTable of Values MethodGraph 2x – 4y = 12 y = ½ x – 3
x y
-4 -5
-2 -4
0 -3
2 -2
4 -1
2x – 4y = 12Domain: {x|x is all Real #s}Range: {y|y is all Real #s}
Positive Slope
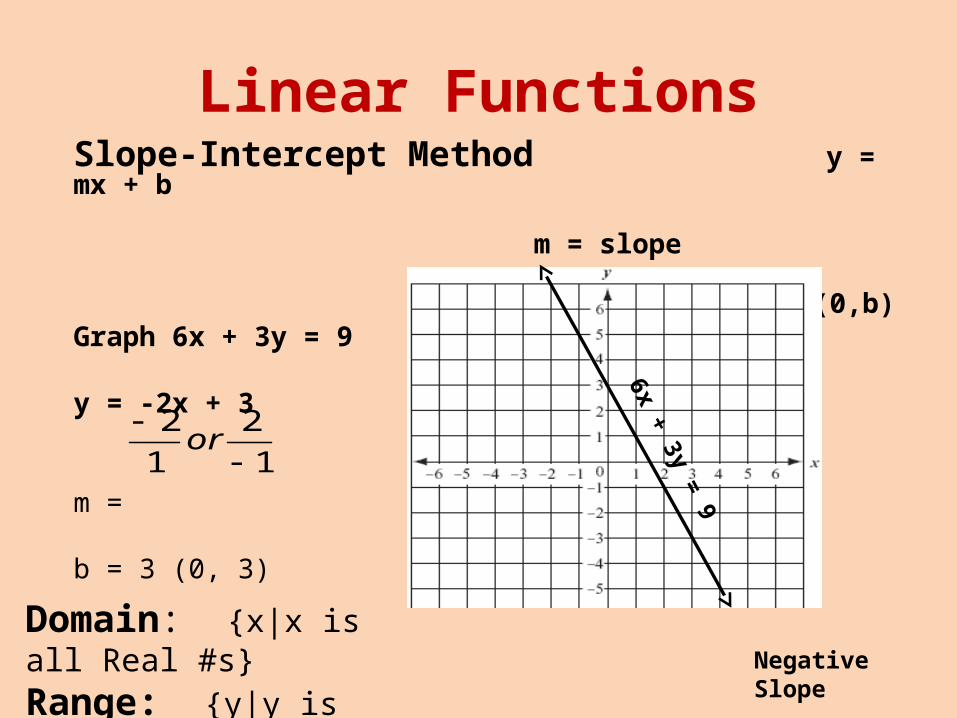
Linear FunctionsSlope-Intercept Method y = mx + b m = slope b = y –intercept (0,b)Graph 6x + 3y = 9
y = -2x + 3
m =
b = 3 (0, 3)
1
2
1
2
or
6x + 3y = 9
Negative Slope
Domain: {x|x is all Real #s}Range: {y|y is all Real #s}
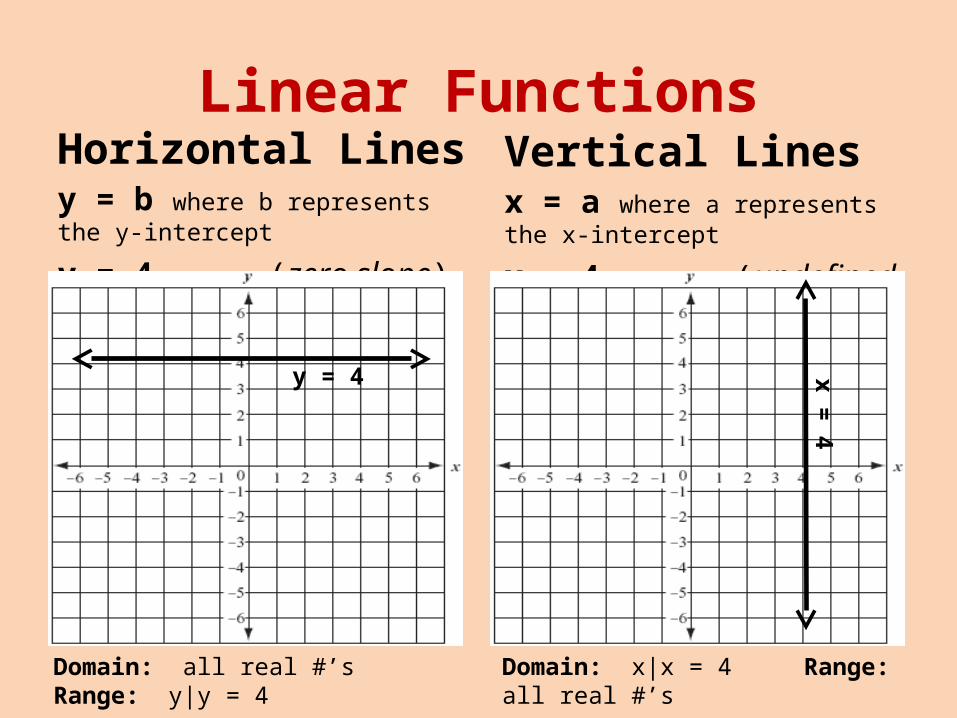
Linear FunctionsHorizontal Linesy = b where b represents the y-intercept
y = 4 (zero slope)
Vertical Linesx = a where a represents the x-intercept
x = 4 (undefined slope)
y = 4 x = 4
Domain: all real #’s Range: y|y = 4 Domain: x|x = 4 Range: all real #’s
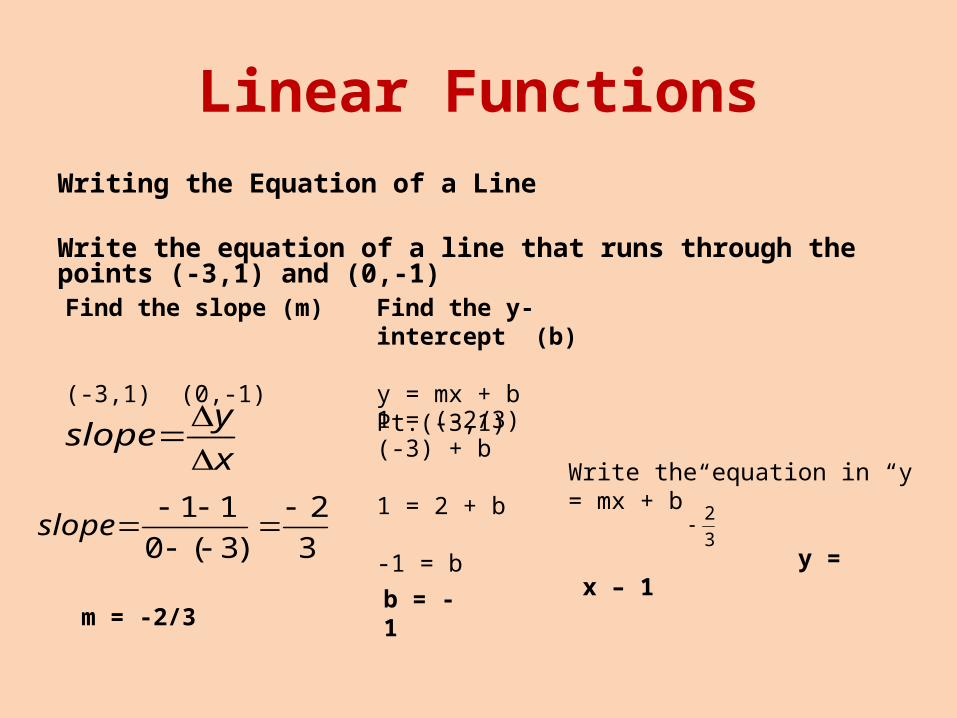
Linear FunctionsWriting the Equation of a Line
Write the equation of a line that runs through the points (-3,1) and (0,-1)
Find the slope (m)
(-3,1) (0,-1)
x
yslope
3
2
)3(0
11
slope
Find the y-intercept (b)
y = mx + b Pt.(-3,1)
Write the equation in “y = mx + b”
y = x – 1 3
2
m = -2/3
1 = (-2/3)(-3) + b
1 = 2 + b
-1 = b
b = -1
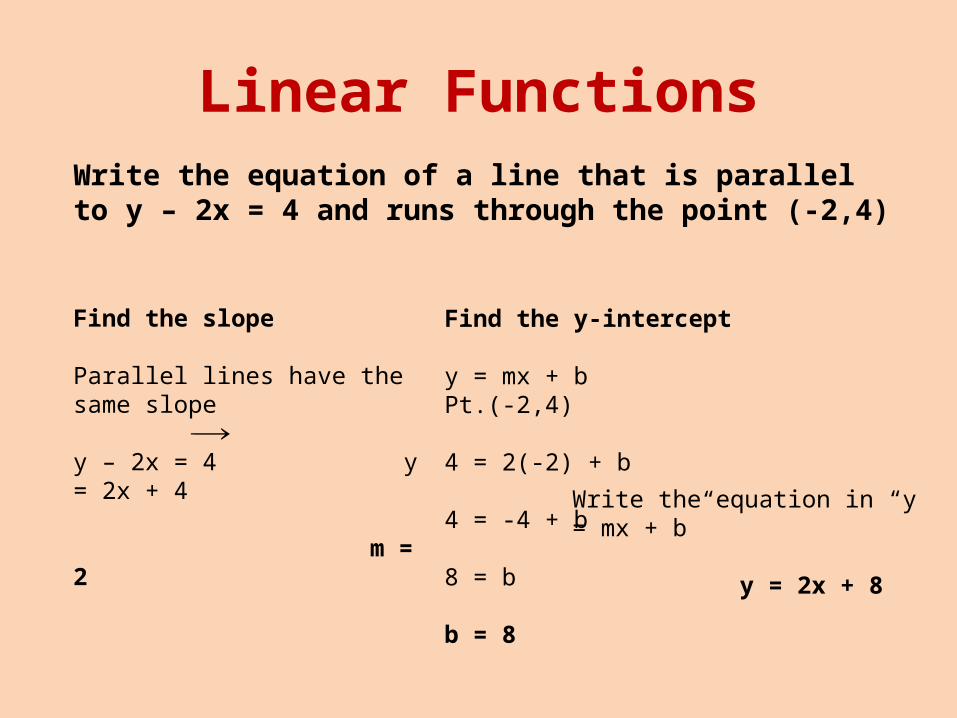
Linear FunctionsWrite the equation of a line that is parallel to y – 2x = 4 and runs through the point (-2,4)
Find the slope
Parallel lines have the same slope
y – 2x = 4 y = 2x + 4
m = 2
Find the y-intercept
y = mx + b Pt.(-2,4)
4 = 2(-2) + b
4 = -4 + b
8 = b
b = 8
Write the equation in “y = mx + b”
y = 2x + 8
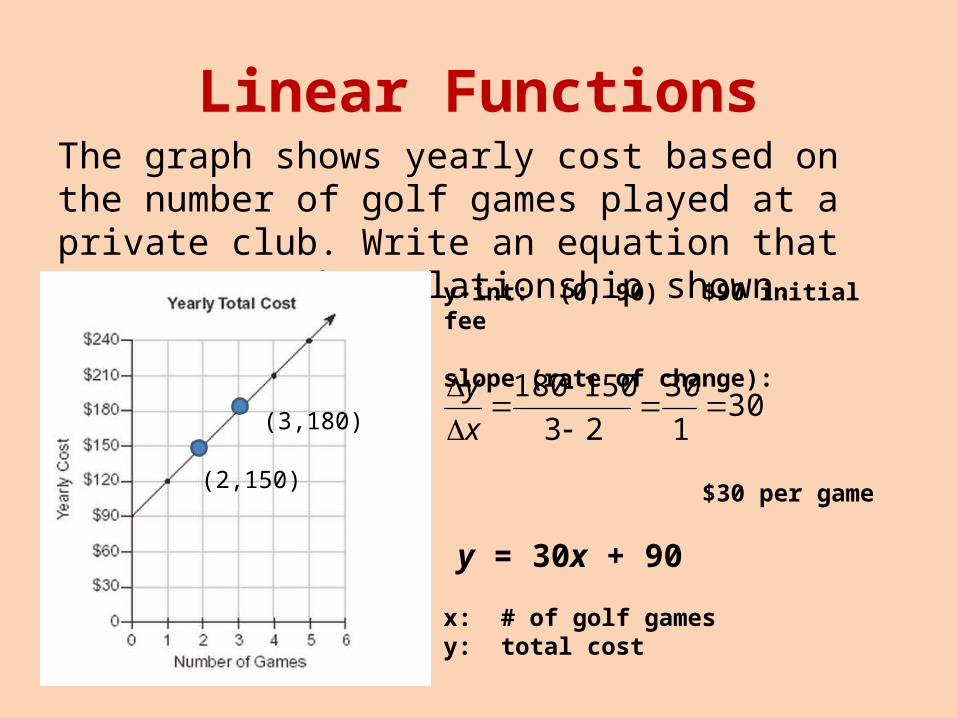
Linear FunctionsThe graph shows yearly cost based on the number of golf games played at a private club. Write an equation that represents the relationship shown.
y-int: (0, 90) $90 initial fee
slope (rate of change):
$30 per game
y = 30x + 90
x: # of golf gamesy: total cost
301
30
23
150180
x
y
(2,150)
(3,180)
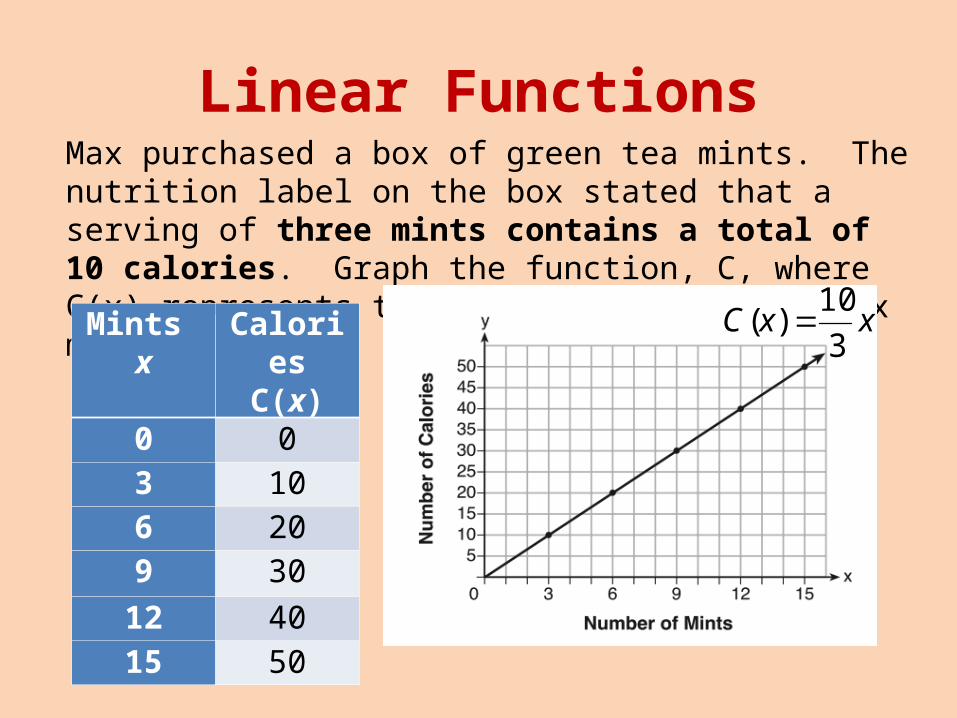
Linear FunctionsMax purchased a box of green tea mints. The nutrition label on the box stated that a serving of three mints contains a total of 10 calories. Graph the function, C, where C(x) represents the number of calories in x mints.
Mints x
CaloriesC(x)
0 03 106 209 30
12 4015 50
xxC3
10)(
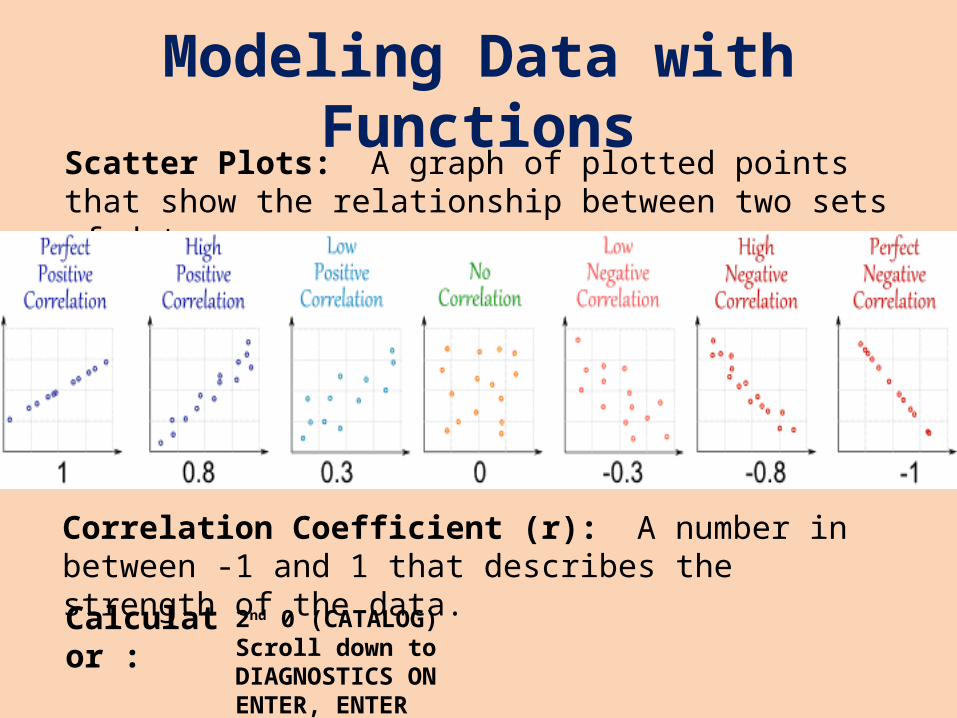
Modeling Data with FunctionsScatter Plots: A graph of plotted points that show the relationship between two sets of data.
Correlation Coefficient (r): A number in between -1 and 1 that describes the strength of the data.
2nd 0 (CATALOG)Scroll down to DIAGNOSTICS ONENTER, ENTER
Calculator :
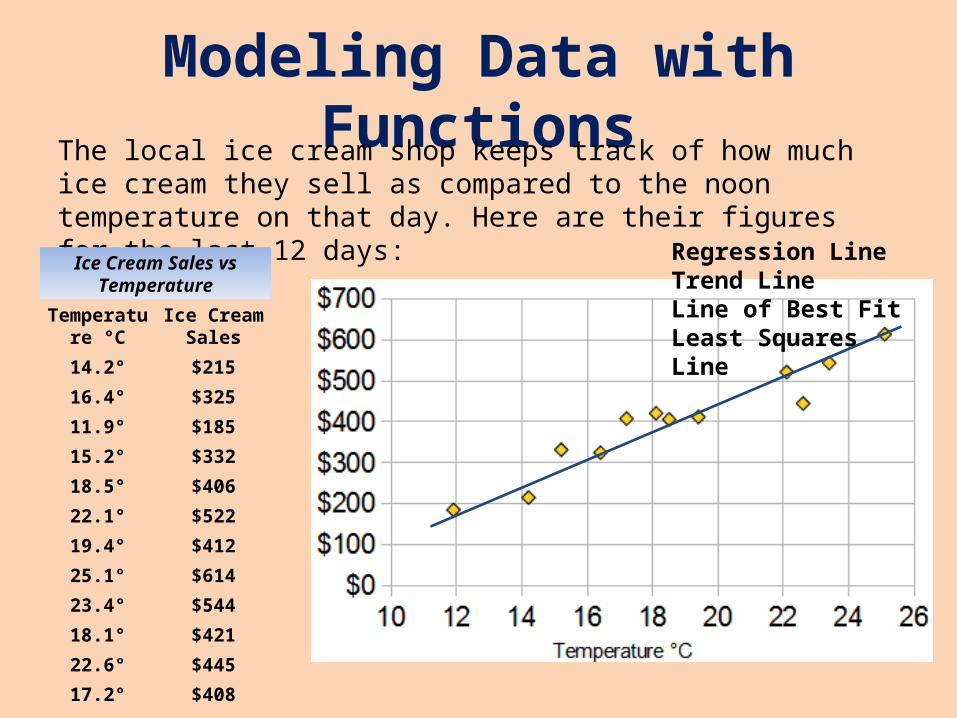
Modeling Data with FunctionsThe local ice cream shop keeps track of how much ice cream they sell as compared to the noon temperature on that day. Here are their figures for the last 12 days:
Ice Cream Sales vs Temperature
Temperature °C
Ice Cream Sales
14.2° $215
16.4° $325
11.9° $185
15.2° $332
18.5° $406
22.1° $522
19.4° $412
25.1° $614
23.4° $544
18.1° $421
22.6° $445
17.2° $408
Regression LineTrend LineLine of Best FitLeast Squares Line
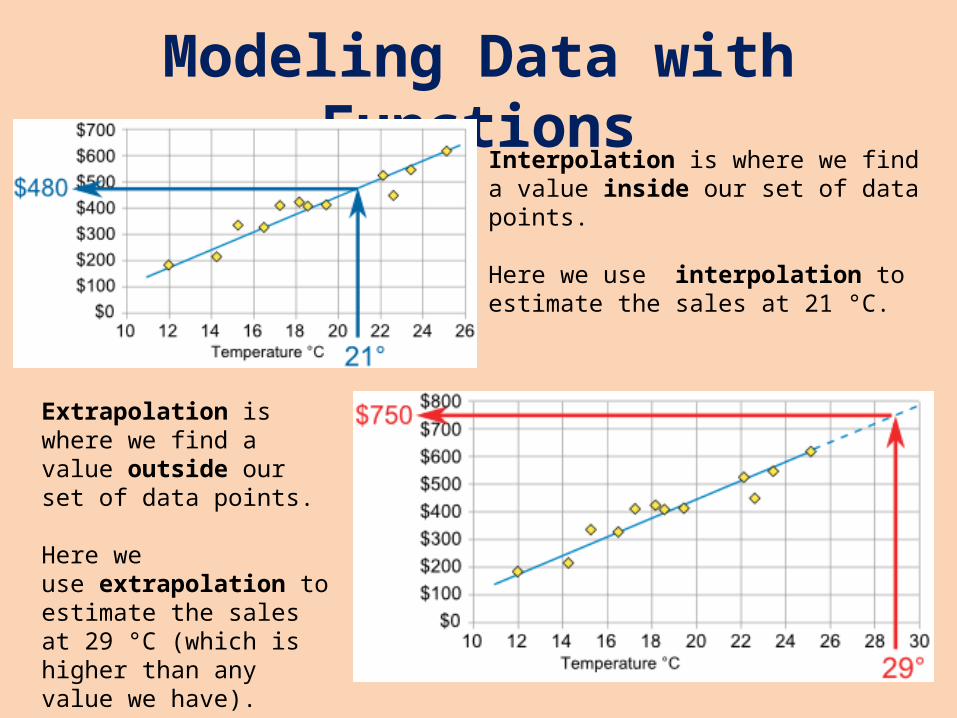
Modeling Data with FunctionsInterpolation is where we find a value inside our set of data points.
Here we use interpolation to estimate the sales at 21 °C.
Extrapolation is where we find a value outside our set of data points.
Here we use extrapolation to estimate the sales at 29 °C (which is higher than any value we have).
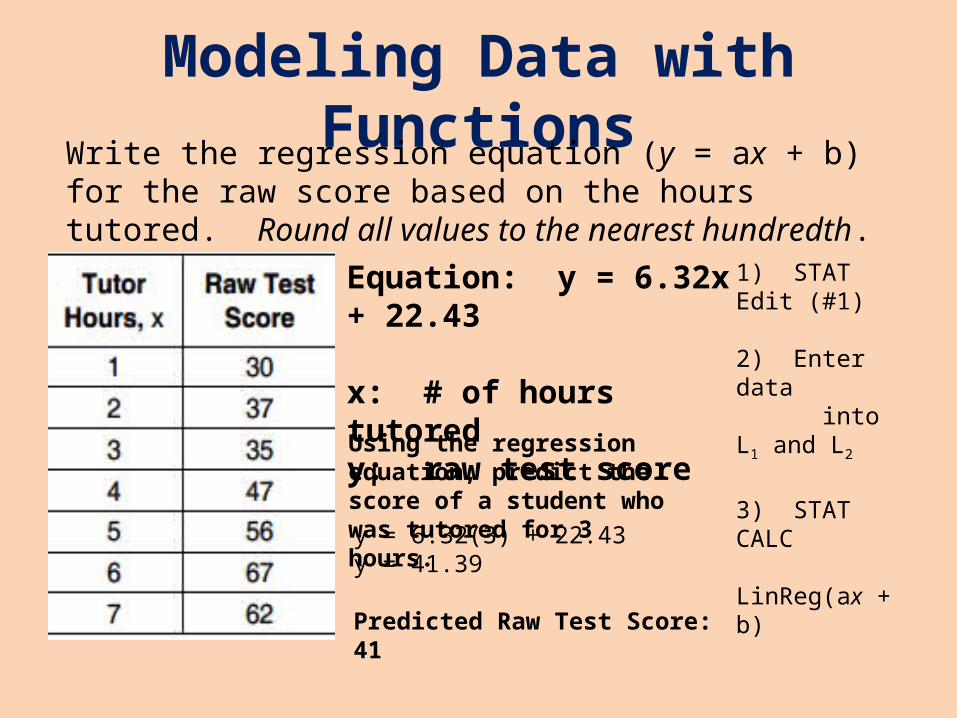
Modeling Data with FunctionsWrite the regression equation (y = ax + b) for the raw score based on the hours tutored. Round all values to the nearest hundredth.
Equation: y = 6.32x + 22.43
x: # of hours tutoredy: raw test scoreUsing the regression equation, predict the score of a student who was tutored for 3 hours. y = 6.32(3) + 22.43y = 41.39 Predicted Raw Test Score: 41
1) STAT Edit (#1) 2) Enter data into L1 and L2
3) STAT CALC LinReg(ax + b)
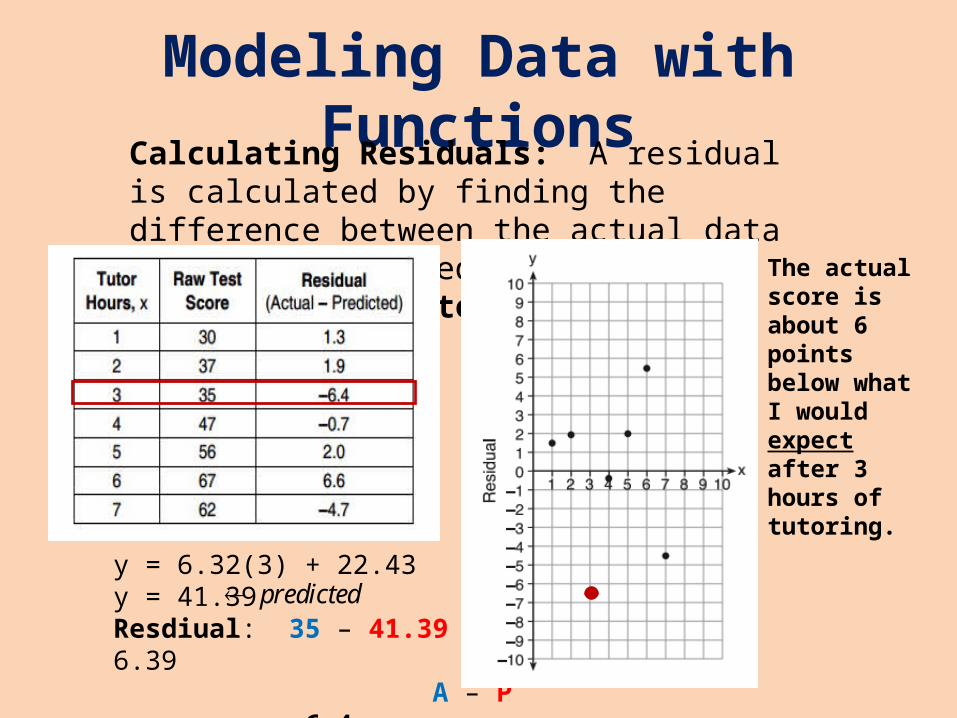
Modeling Data with FunctionsCalculating Residuals: A residual is calculated by finding the difference between the actual data value and the predicted value (Actual – Predicted).
y = 6.32(3) + 22.43y = 41.39 Resdiual: 35 – 41.39 = -6.39 A – P = – 6.4
predicted
The actual score is about 6 points below what I would expect after 3 hours of tutoring.
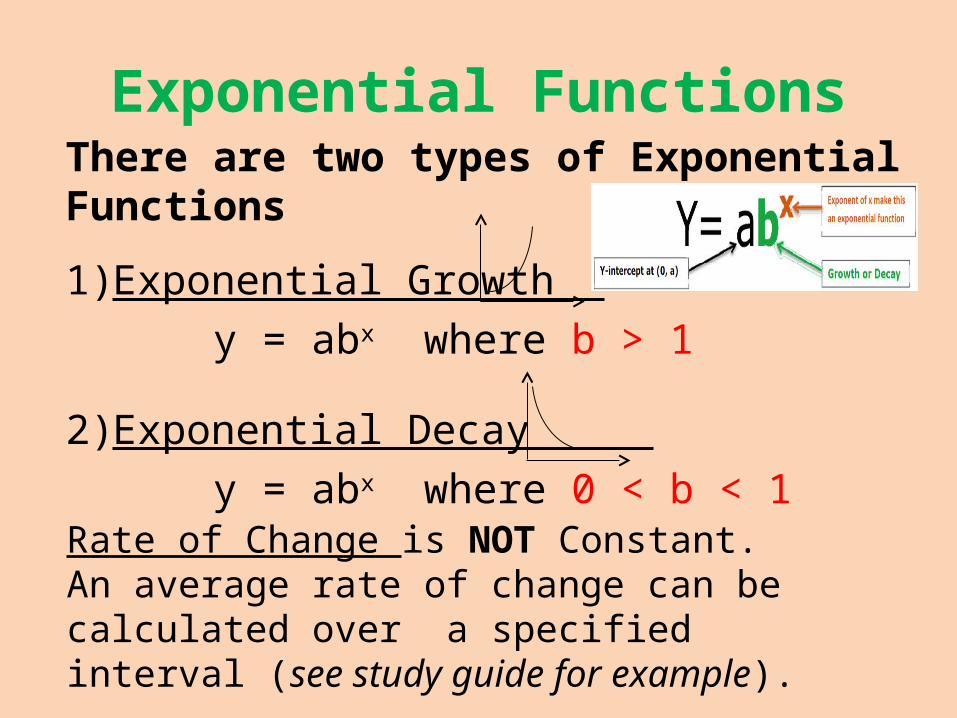
Exponential FunctionsThere are two types of Exponential Functions
1)Exponential Growth y = abx where b > 1
2)Exponential Decay y = abx where 0 < b < 1
Rate of Change is NOT Constant.An average rate of change can be calculated over a specified interval (see study guide for example).
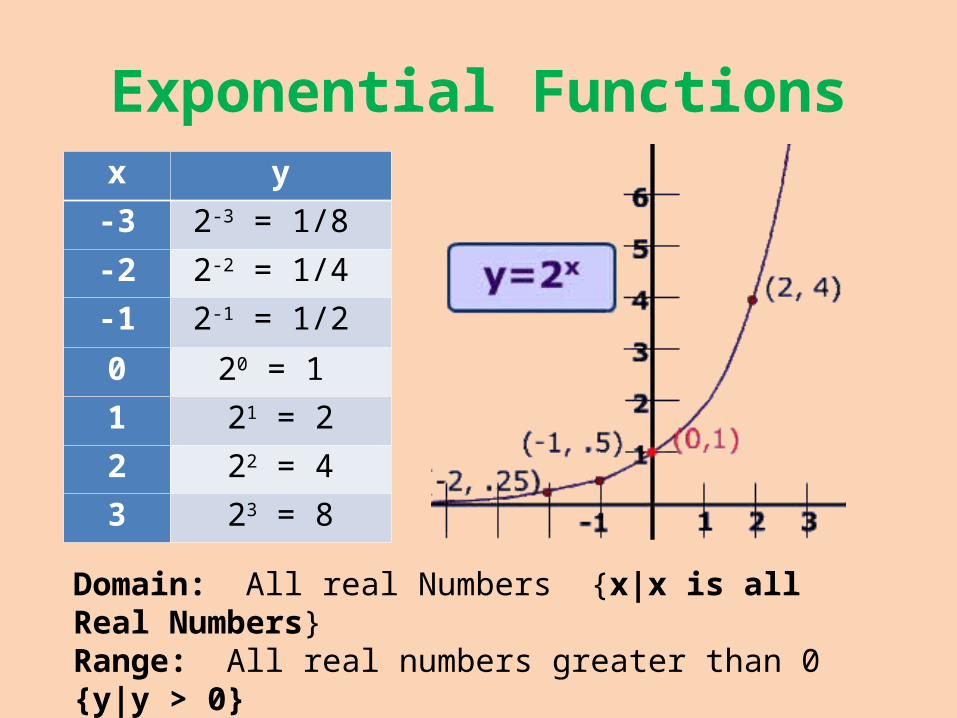
Exponential Functionsx y
-3 2-3 = 1/8
-2 2-2 = 1/4 -1 2-1 = 1/2
0 20 = 1 1 21 = 2
2 22 = 43 23 = 8
Domain: All real Numbers {x|x is all Real Numbers}Range: All real numbers greater than 0 {y|y > 0}The function is increasing (x and y both increase)
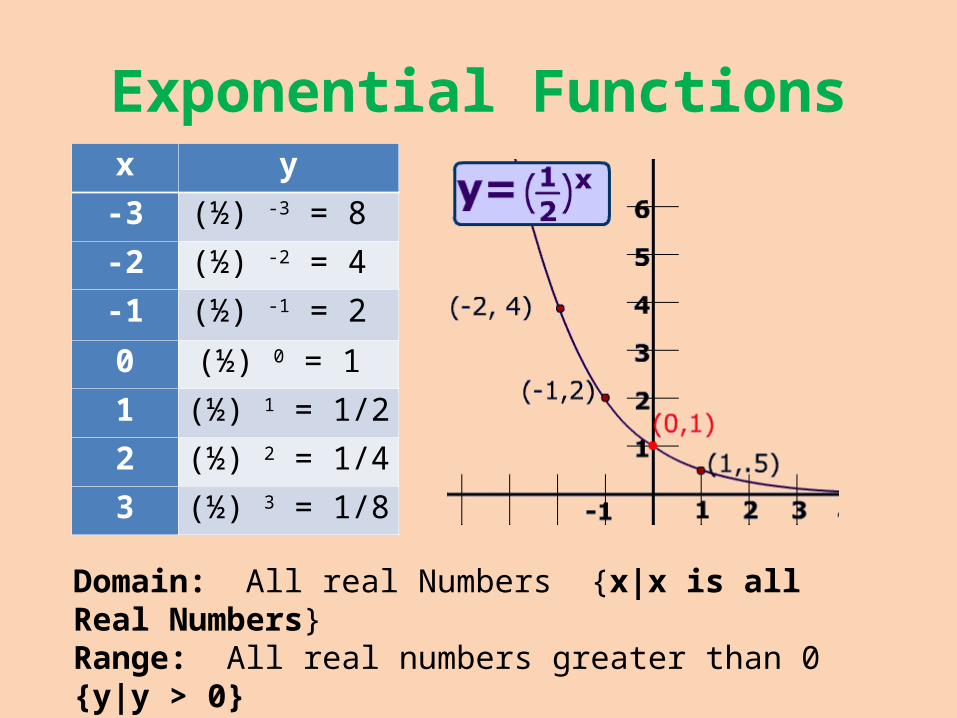
Exponential Functionsx y
-3 (½) -3 = 8
-2 (½) -2 = 4
-1 (½) -1 = 2
0 (½) 0 = 1
1 (½) 1 = 1/2
2 (½) 2 = 1/4
3 (½) 3 = 1/8
Domain: All real Numbers {x|x is all Real Numbers}Range: All real numbers greater than 0 {y|y > 0}The function is decreasing (x increases and y decreases)
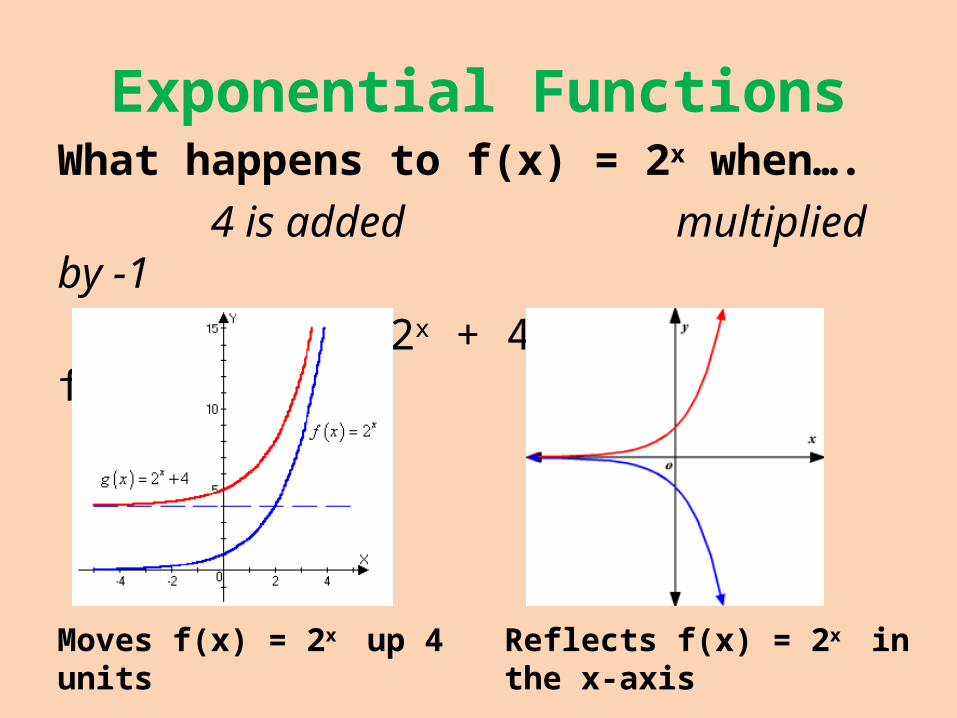
Exponential FunctionsWhat happens to f(x) = 2x when…. 4 is added multiplied by -1 f(x) = 2x + 4 f(x) = -2x
Moves f(x) = 2x up 4 units
Reflects f(x) = 2x in the x-axis
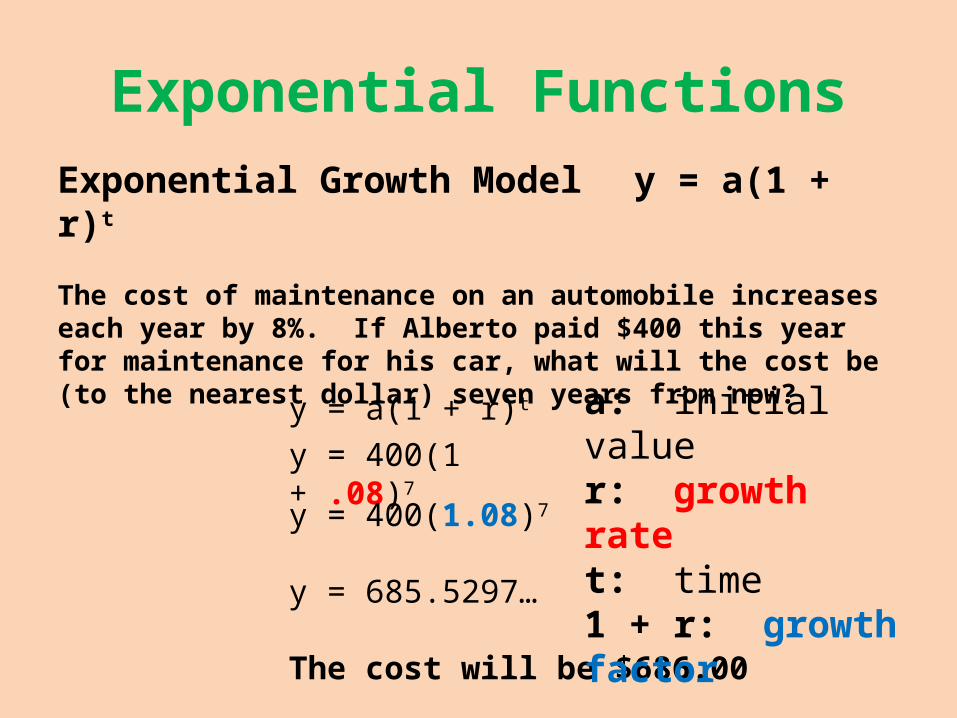
Exponential FunctionsExponential Growth Model y = a(1 + r)t
The cost of maintenance on an automobile increases each year by 8%. If Alberto paid $400 this year for maintenance for his car, what will the cost be (to the nearest dollar) seven years from now?
y = a(1 + r)t
y = 400(1 + .08)7
y = 400(1.08)7
y = 685.5297…
The cost will be $686.00
a: initial valuer: growth ratet: time1 + r: growth factor
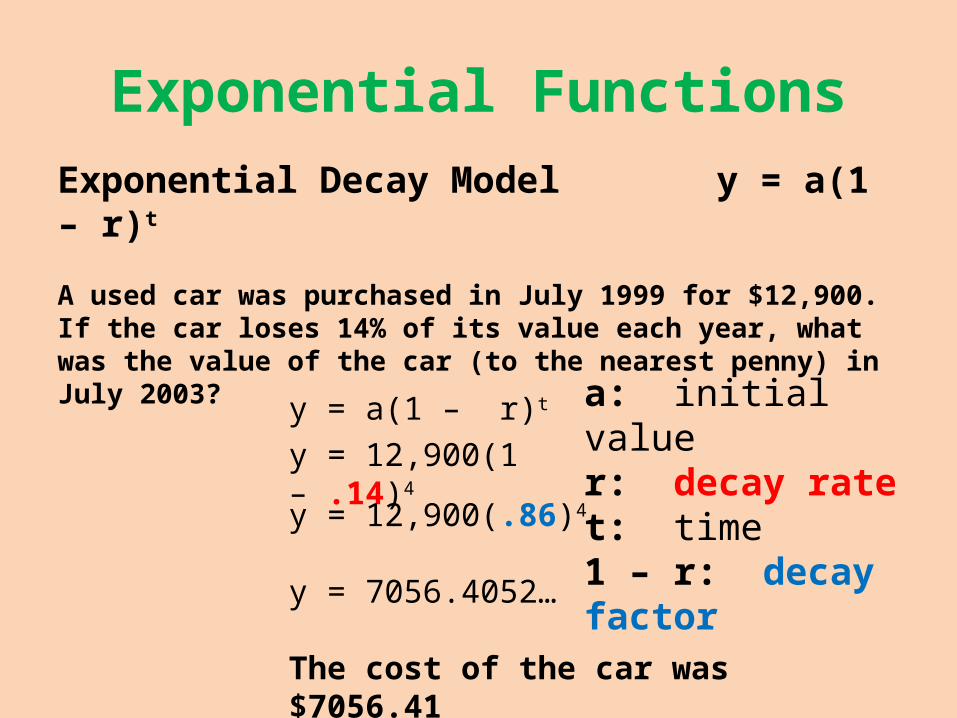
Exponential FunctionsExponential Decay Model y = a(1 – r)t
A used car was purchased in July 1999 for $12,900. If the car loses 14% of its value each year, what was the value of the car (to the nearest penny) in July 2003?
y = a(1 – r)t
y = 12,900(1 – .14)4
y = 12,900(.86)4
y = 7056.4052…
The cost of the car was $7056.41
a: initial valuer: decay ratet: time1 – r: decay factor
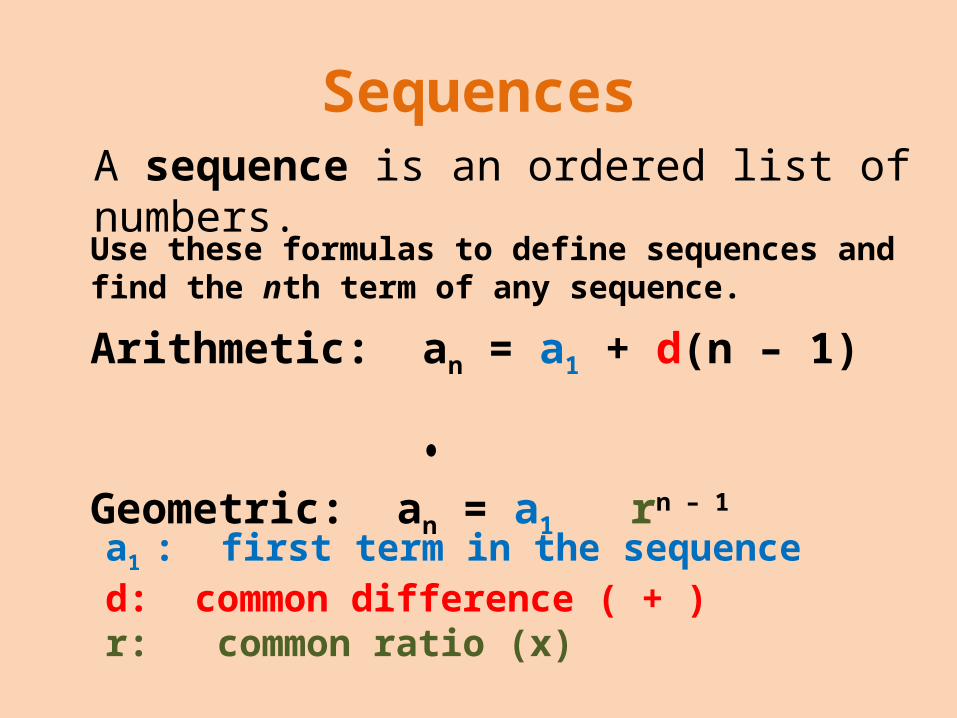
Sequences
Use these formulas to define sequences and find the nth term of any sequence.
Arithmetic: an = a1 + d(n – 1)
Geometric: an = a1 rn – 1
A sequence is an ordered list of numbers.
a1 : first term in the sequenced: common difference ( + )r: common ratio (x)
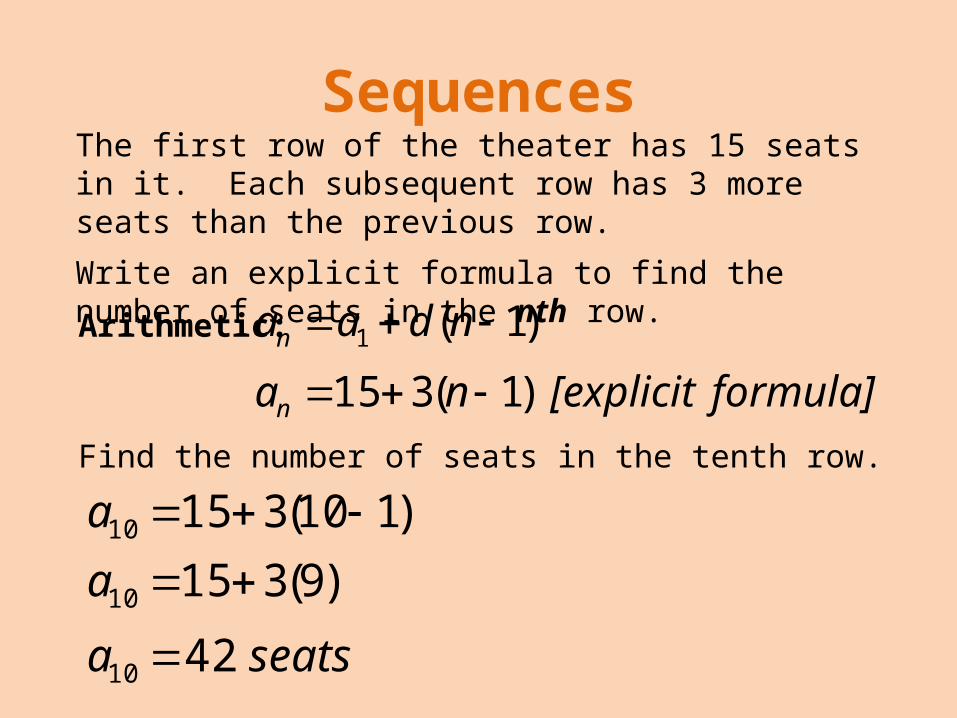
SequencesThe first row of the theater has 15 seats in it. Each subsequent row has 3 more seats than the previous row.
Write an explicit formula to find the number of seats in the nth row.
Arithmetic:
formula][explicit)1(315
)1(1
na
ndaa
n
n
seatsa
a
a
42
)9(315
)110(315
10
10
10
Find the number of seats in the tenth row.
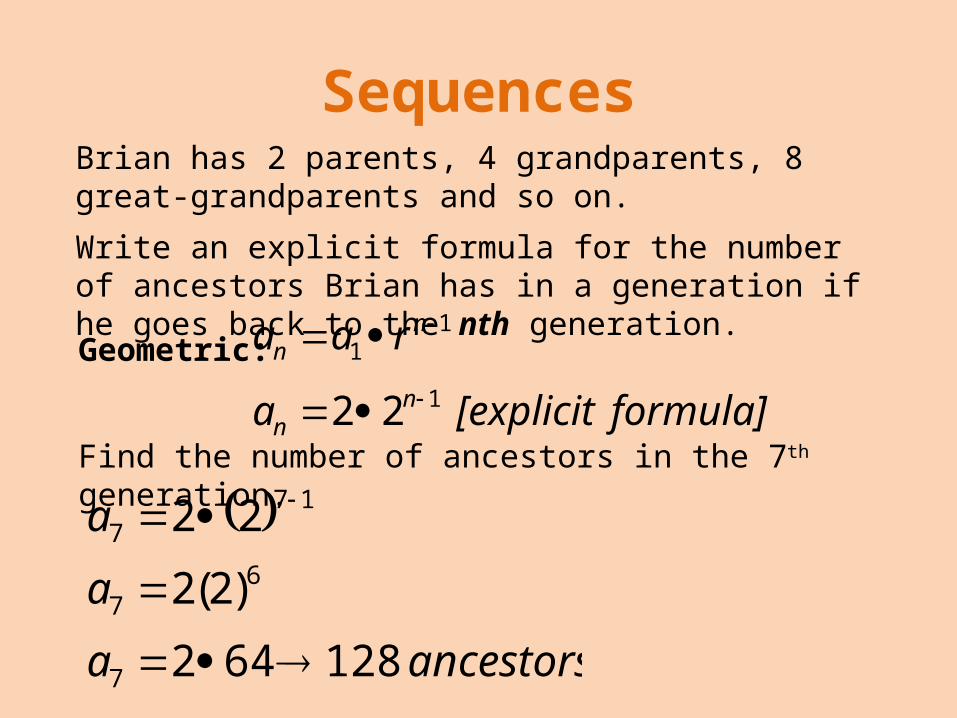
SequencesBrian has 2 parents, 4 grandparents, 8 great-grandparents and so on.
Write an explicit formula for the number of ancestors Brian has in a generation if he goes back to the nth generation.
Geometric:
Find the number of ancestors in the 7th generation.formula][explicit1
11
22
n
n
nn
a
raa
ancestorsa
a
a
128642
)2(2
22
7
67
177

Now it’s your turn to review on your own!
Using the information presented today and the study guide posted on halgebra.org,
complete the practice problem set.
Regents Review #3 Friday, May 16th
BE THERE!

![STAT509 Continuous Probability Distributions Recall: P(a < X < b) = = F(b) – F(a) F (a) = μ = E[X] = 2 = E[X 2 ] – μ 2 f(x) x x F(x)](https://img.pdfslide.us/doc/110x75/56649d255503460f949fc217/stat509-continuous-probability-distributions-recall-pa-x-b-fb.jpg)


![7 o f , ] Ì X < µ X< } X < µ µ u f f < } µ f v f z º l º](https://img.pdfslide.us/doc/110x75/624eb863cc46354fb3067cdb/7-o-f-x-lt-xlt-x-lt-u-f.jpg)


![cdn.buddy4study.comcdn.buddy4study.com/notes/12-pcm-nstse-2010-paper_0.pdfCLASS : If f(x) = , then f(x + y) . MATHEMATICS f(x — Y) [f (2x) + f (2y)] [f (x) — f (2y)] is : 2. 4](https://img.pdfslide.us/doc/110x75/5f0e4b497e708231d43e8aa3/cdn-class-if-fx-then-fx-y-mathematics-fx-a-y-f-2x-f-2y.jpg)