Embed Size (px)
Citation preview
RegenOx for ISCO:
1. Daniel Nunez, Regenesis 2. RegenOx two part complex:
1. Sodium percarbonate, sodium silicate and silica gel (<1%). (RegenOx Part A ‐ Oxidizer Complex)
2. Sodium silicate solution, silica gel and ferrous sulfate (RegenOx Part B ‐ Activator Complex):
3. MSDS & Technical Data Sheet ‐ Attached 4. Number of Field‐scale Applications to Date: 300+ sites 5. Case Studies – Attached 6. RegenOx has been on the market since 2008. It’s a two part complex consisting of a silicate iron
complex activator and sodium percarbonate/carbonate oxidizer complex. This product has proven to be effective in the destruction of a various range of contaminants both in petroleum and volatile organic compounds such as; hydrocarbons, chlorinated ethenes, oxygenates, and chlorinated ethanes. This product is safe to use around sensitive underground infrastructure with no negative health and safety adverse effects of corrosion of tooling or underground lines. This product has been approved on the general WDR permit.
RegenOx® – Part A (Oxidizer Complex)
Material Safety Data Sheet (MSDS) Last Revised: September 27, 2013
Section 1 – Supplier Information and Material Identification
Supplier:
1011 Calle Sombra San Clemente, CA 92673 Telephone: 949.366.8000 Fax: 949.366.8090 E-mail: [email protected]
Chemical Description: A mixture of sodium percarbonate [2Na2CO3·3H2O2], sodium carbonate [Na2CO3], sodium silicate and silica gel.
Chemical Family: Inorganic Chemicals
Trade Name: RegenOx® – Part A (Oxidizer Complex)
Product Use: Used to remediate contaminated soil and groundwater (environmental applications)
Section 2 – Chemical Information/Other Designations
UCAS No. UChemical UPercentage 15630-89-4 Sodium Percarbonate 60 -100 % 7699-11-6 Silicic Acid < 1 % 63231-67-4 Silica Gel < 1 %
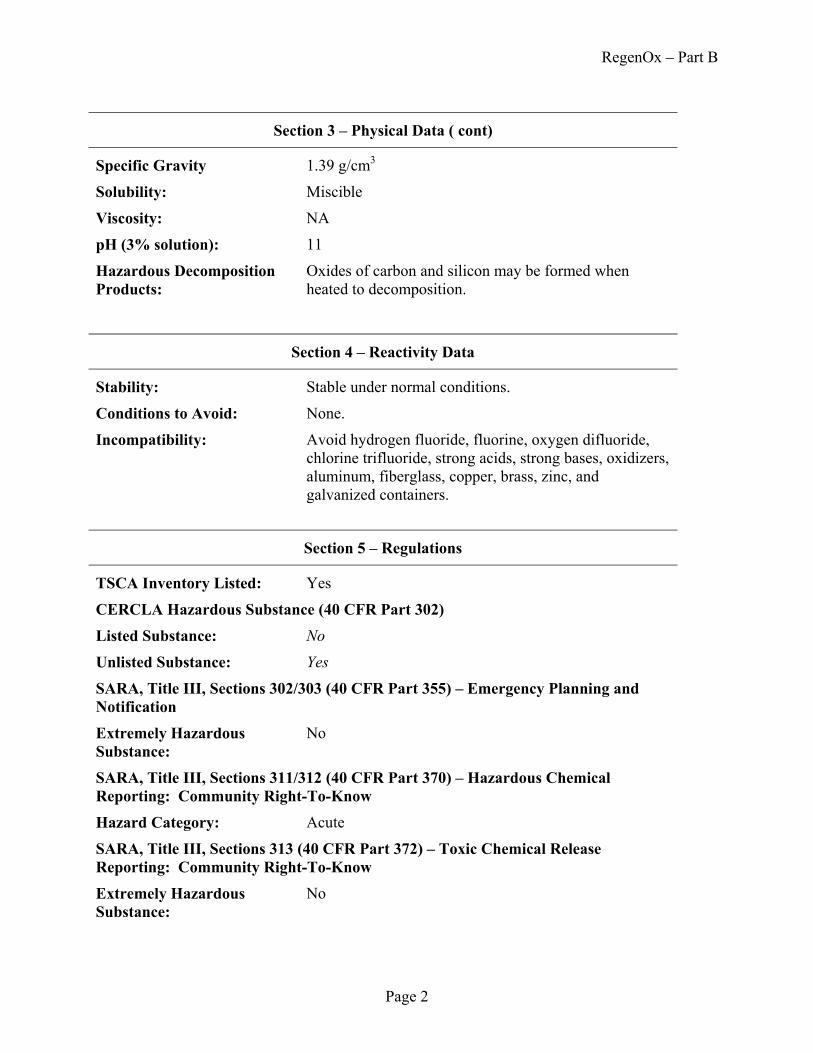
Section 3 – Physical Data
Form: Powder
Color: White
Odor: Odorless
Melting Point: NA
Boiling Point: NA
RegenOx – Part A
J:\Operations\MSDS\Regenox Page 2
Section 3 – Physical Data (cont)
Flammability/Flash Point: NA
Vapor Pressure: NA
Bulk Density: 0.9 – 1.2 g/cm3
Solubility: Min 14.5g/100g water @ 20 ºC
Viscosity: NA
pH (3% solution): ≈ 10.5
Decomposition Temperature:
Self-accelerating decomposition with oxygen release starts at 50 ºC.
Section 4 – Reactivity Data
Stability: Stable under normal conditions
Conditions to Avoid/Incompatibility:
Acids, bases, salts of heavy metals, reducing agents, and flammable substances
Hazardous Decomposition Products:
Oxygen. Contamination with many substances will cause decomposition. The rate of decomposition increases with increasing temperature and may be very vigorous with rapid generation of oxygen and steam.
Section 5 – Regulations
TSCA Inventory Listed: Yes
CERCLA Hazardous Substance (40 CFR Part 302)
Listed Substance: No
Unlisted Substance: Yes
SARA, Title III, Sections 313 (40 CFR Part 372) – Toxic Chemical Release Reporting: Community Right-To-Know
Extremely Hazardous Substance:
No
WHMIS Classification: C, D2B
Canadian Domestic Substance List:
Appears
RegenOx – Part A
J:\Operations\MSDS\Regenox Page 3
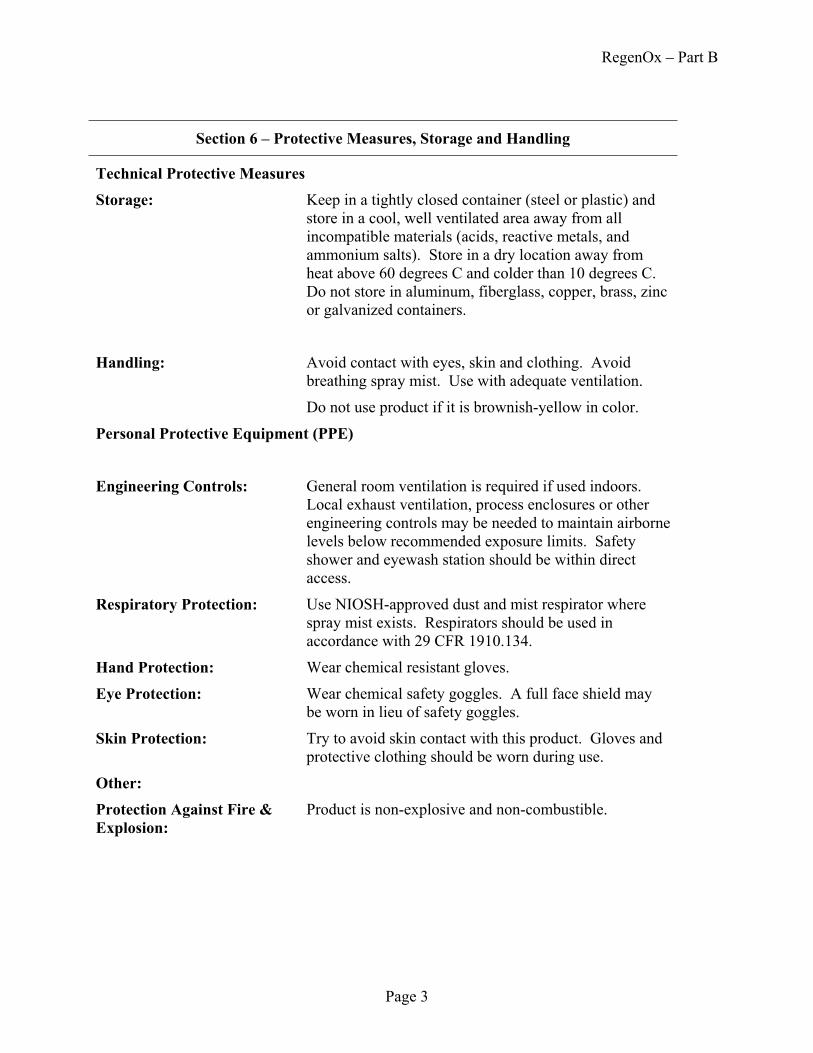
Section 6 – Protective Measures, Storage and Handling
Technical Protective Measures
Storage: Oxidizer. Store in a cool, well ventilated area away from all sources of ignition and out of the direct sunlight. Store in a dry location away from heat and in temperatures less than 40 ◦C.
Keep away from incompatible materials and keep lids tightly closed. Do not store in improperly labeled containers.
Protect from moisture. Do not store near combustible materials. Keep containers well sealed.
Store separately from reducing materials. Avoid contamination which may lead to decomposition.
Handling: Avoid contact with eyes, skin and clothing. Use with adequate ventilation.
Do not swallow. Avoid breathing vapors, mists or dust. Do not eat, drink or smoke in the work area.
Label containers and keep them tightly closed when not in use.
Wash hands thoroughly after handling.
Personal Protective Equipment (PPE)
Engineering Controls: General room ventilation is required if used indoors. Local exhaust ventilation, process enclosures or other engineering controls may be needed to maintain airborne levels below recommended exposure limits. Avoid creating dust or mists. Maintain adequate ventilation at all times. Do not use in confined areas. Keep levels below recommended exposure limits. To determine actual exposure limits, monitoring should be performed on a routine basis.
Respiratory Protection: For many conditions, no respiratory protection is necessary; however, in dusty or unknown conditions or when exposures exceed limit values a NIOSH approved respirator should be used.
Hand Protection: Wear chemical resistant gloves (neoprene, rubber, or PVC).
RegenOx – Part A
J:\Operations\MSDS\Regenox Page 4
Section 6 – Protective Measures, Storage and Handling (cont)
Eye Protection: Wear chemical safety goggles. A full face shield may be worn in lieu of safety goggles.
Skin Protection: Try to avoid skin contact with this product. Chemical resistant gloves (neoprene, PVC or rubber) and protective clothing should be worn during use.
Other: Eye wash station.
Protection Against Fire & Explosion:
Product is non-explosive. In case of fire, evacuate all non-essential personnel, wear protective clothing and a self-contained breathing apparatus, stay upwind of fire, and use water to spray cool fire-exposed containers.
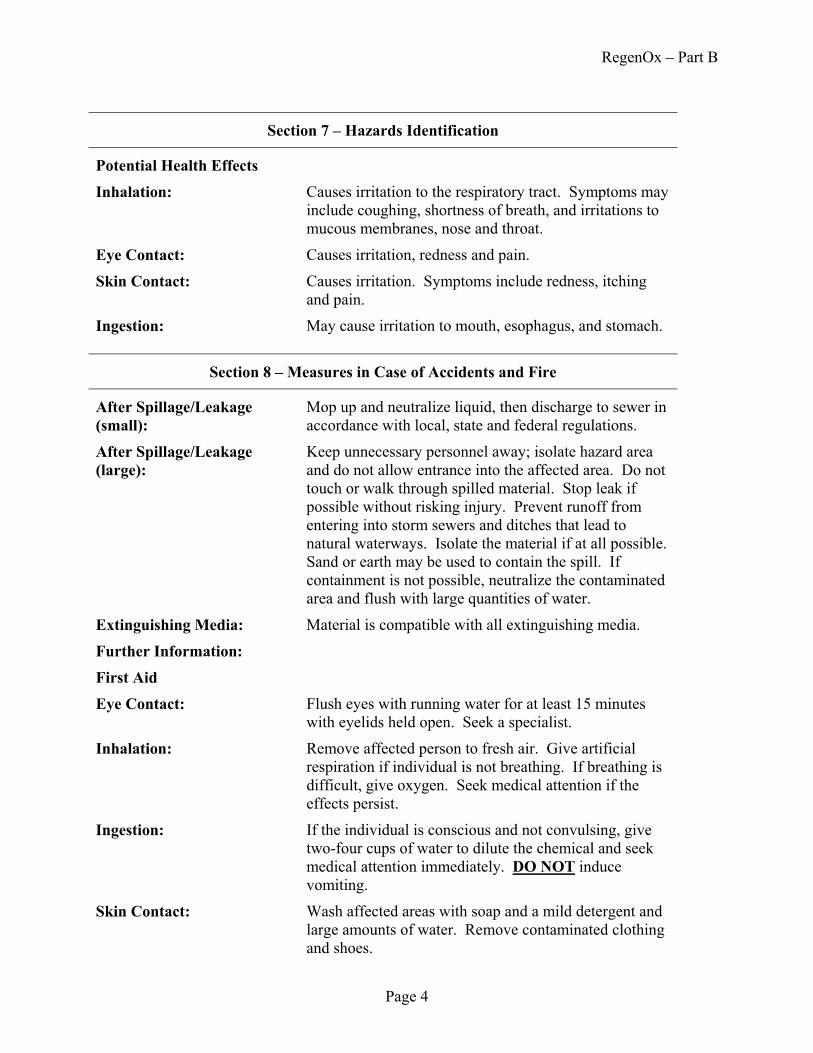
Section 7 – Hazards Identification
Potential Health Effects
Inhalation: Causes irritation to the respiratory tract. Symptoms may include coughing, shortness of breath, and irritations to mucous membranes, nose and throat.
Eye Contact: Causes irritation, redness and pain.
Skin Contact: Causes slight irritation.
Ingestion: May be harmful if swallowed (vomiting and diarrhea).
Section 8 – Measures in Case of Accidents and Fire
After Spillage/Leakage: Eliminate all ignition sources. Evacuate unprotected personnel and never exceed any occupational exposure limit. Shovel or sweep spilt material into plastic bags or vented containers for disposal. Do not return spilled or contaminated material to the inventory.
Extinguishing Media: Water
First Aid
Eye Contact: Flush eyes with running water for at least 15 minutes with eyelids held open. Seek a specialist.
Inhalation: Remove affected person to fresh air. Seek medical attention if the effects persist.
Ingestion: If the individual is conscious and not convulsing, give two-four cups of water to dilute the chemical and seek medical attention immediately. UDo NotU induce vomiting.
RegenOx – Part A
J:\Operations\MSDS\Regenox Page 5
Section 8 – Measures in Case of Accidents and Fire (cont)
Skin Contact: Wash affected areas with soap and a mild detergent and large amounts of water.
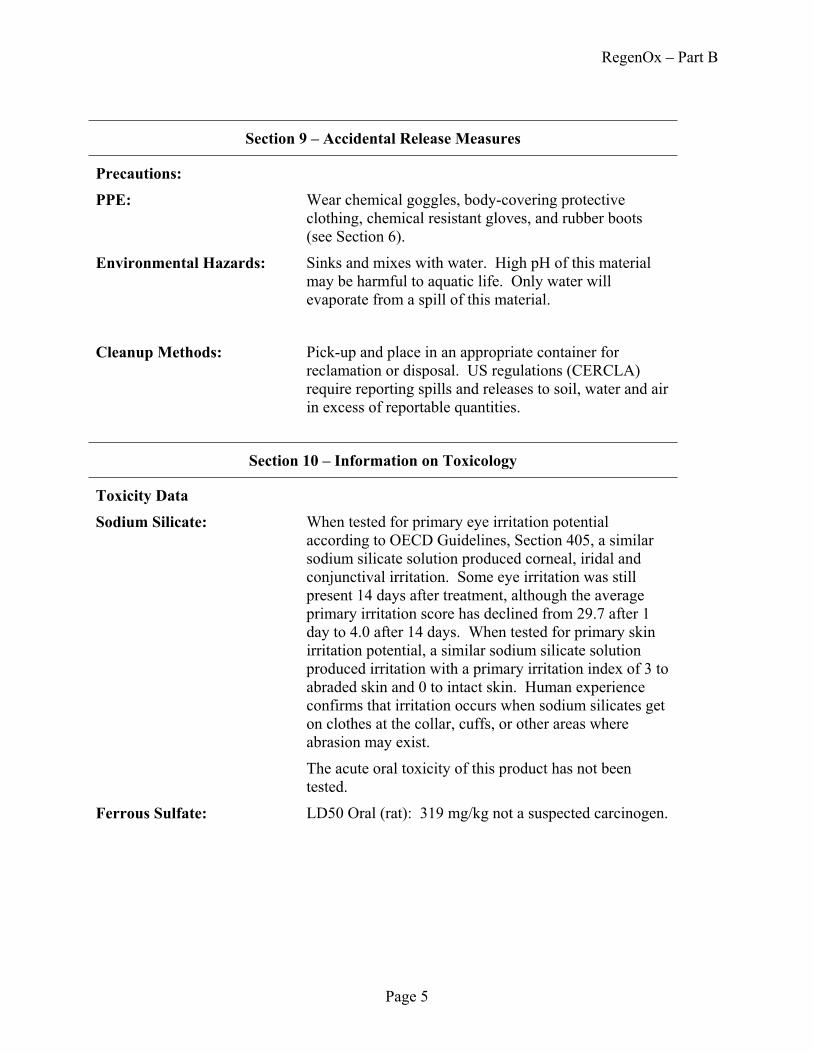
Section 9 – Accidental Release Measures
Precautions:
Cleanup Methods: Shovel or sweep spilt material into plastic bags or vented containers for disposal. Do not return spilled or contaminated material to the inventory.
Section 10 – Information on Toxicology
Toxicity Data
LD50 Oral (rat): 2,400 mg/kg
LD50 Dermal (rabbit): Min 2,000 mg/kg
LD50 Inhalation (rat): Min 4,580 mg/kg
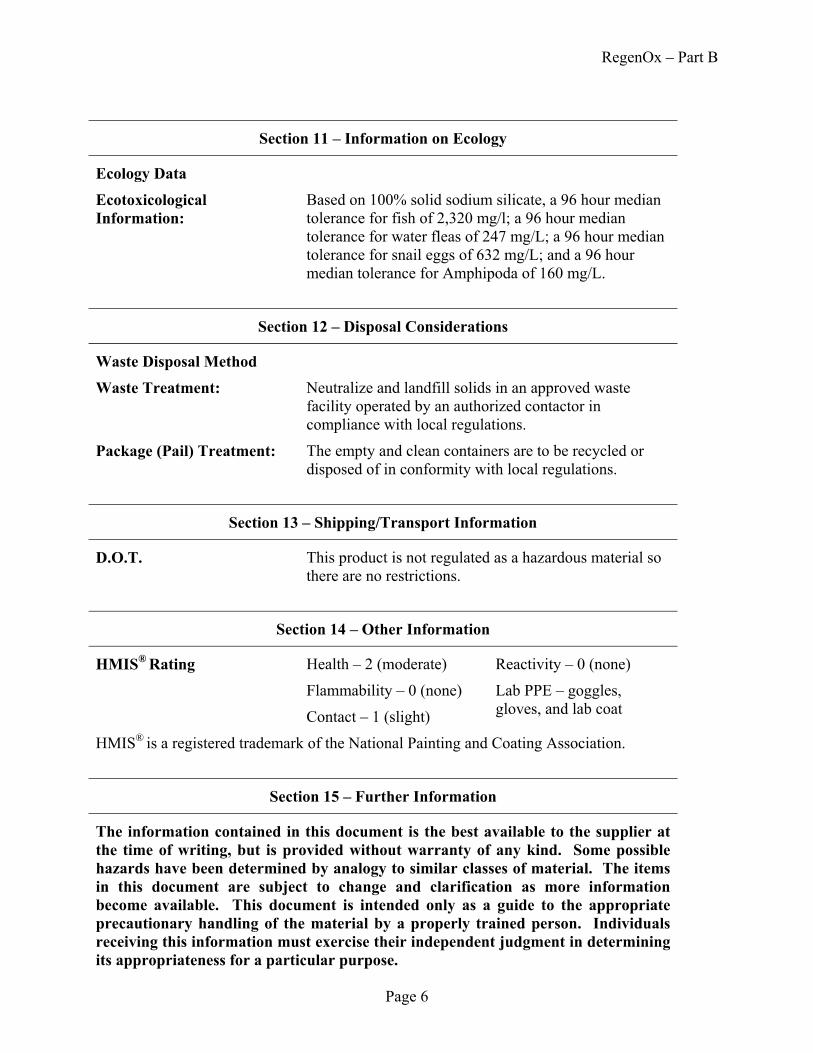
Section 11 – Information on Ecology
Ecology Data
Ecotoxicological Information:
NA
Section 12 – Disposal Considerations
Waste Disposal Method
Waste Treatment: Dispose of in an approved waste facility operated by an authorized contactor in compliance with local regulations.
Package (Pail) Treatment: The empty and clean containers are to be recycled or disposed of in conformity with local regulations.
RegenOx – Part A
J:\Operations\MSDS\Regenox Page 6
Section 13 – Shipping/Transport Information
D.O.T. Shipping Name: Oxidizing Solid, N.O.S. [A mixture of sodium percarbonate [2Na2CO3·3H2O2], sodium carbonate [Na2CO3], sodium silicate and silica gel.]
UN Number: 1479
Hazard Class: 5.1
Labels: 5.1 (Oxidizer)
Packaging Group: III
Section 14 – Other Information
HMIS® Rating Health – 1 (slight) Reactivity – 1 (slight)
Flammability – 0 (none) Lab PPE – goggles, gloves, and lab coat
HMIS® is a registered trademark of the National Painting and Coating Association.
Section 15 – Further Information
The information contained in this document is the best available to the supplier at the time of writing, but is provided without warranty of any kind. Some possible hazards have been determined by analogy to similar classes of material. The items in this document are subject to change and clarification as more information become available. This document is intended only as a guide to the appropriate precautionary handling of the material by a properly trained person. Individuals receiving this information must exercise their independent judgment in determining its appropriateness for a particular purpose.
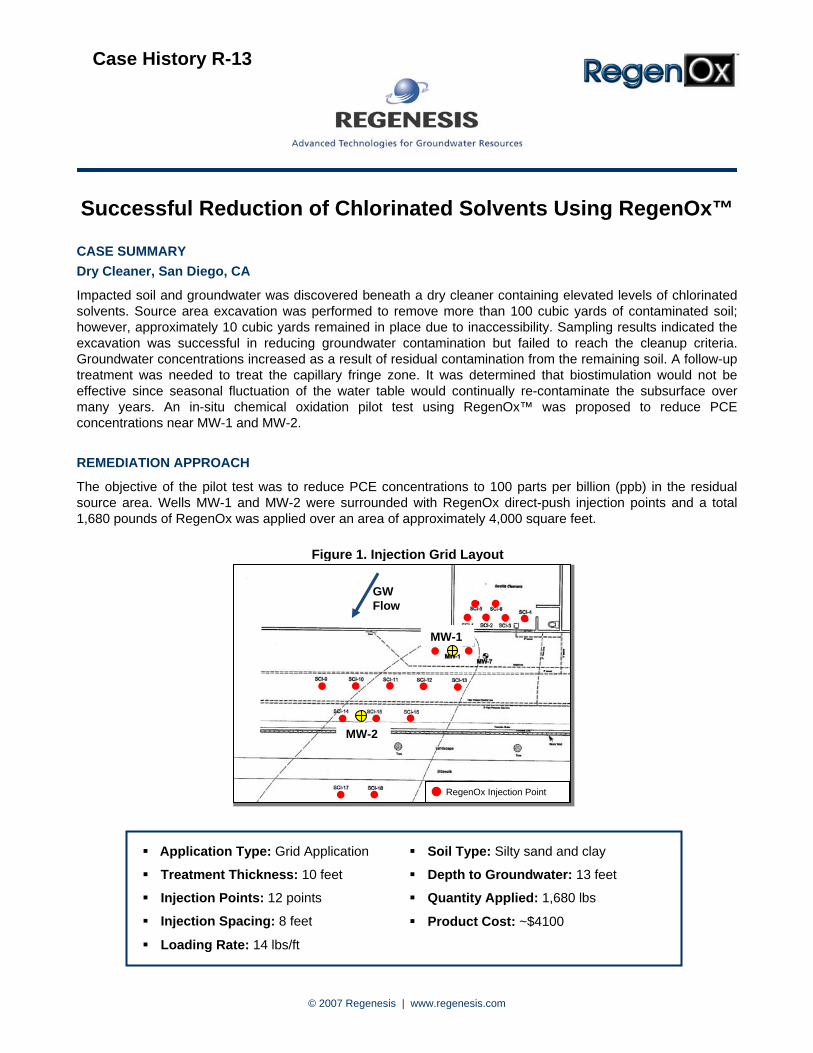
Case History R-13
© 2007 Regenesis | www.regenesis.com
Successful Reduction of Chlorinated Solvents Using RegenOx™
CASE SUMMARY Dry Cleaner, San Diego, CA
Impacted soil and groundwater was discovered beneath a dry cleaner containing elevated levels of chlorinated solvents. Source area excavation was performed to remove more than 100 cubic yards of contaminated soil; however, approximately 10 cubic yards remained in place due to inaccessibility. Sampling results indicated the excavation was successful in reducing groundwater contamination but failed to reach the cleanup criteria. Groundwater concentrations increased as a result of residual contamination from the remaining soil. A follow-up treatment was needed to treat the capillary fringe zone. It was determined that biostimulation would not be effective since seasonal fluctuation of the water table would continually re-contaminate the subsurface over many years. An in-situ chemical oxidation pilot test using RegenOx™ was proposed to reduce PCE concentrations near MW-1 and MW-2.
REMEDIATION APPROACH
The objective of the pilot test was to reduce PCE concentrations to 100 parts per billion (ppb) in the residual source area. Wells MW-1 and MW-2 were surrounded with RegenOx direct-push injection points and a total 1,680 pounds of RegenOx was applied over an area of approximately 4,000 square feet.
Soil Type: Silty sand and clay
Depth to Groundwater: 13 feet
Quantity Applied: 1,680 lbs
Product Cost: ~$4100
Application Type: Grid Application
Treatment Thickness: 10 feet
Injection Points: 12 points
Injection Spacing: 8 feet
Loading Rate: 14 lbs/ft
Figure 1. Injection Grid Layout
RegenOx Injection Point
MW-2
MW-1
GW Flow
© 2007 Regenesis | www.regenesis.com 092007
RESULTS
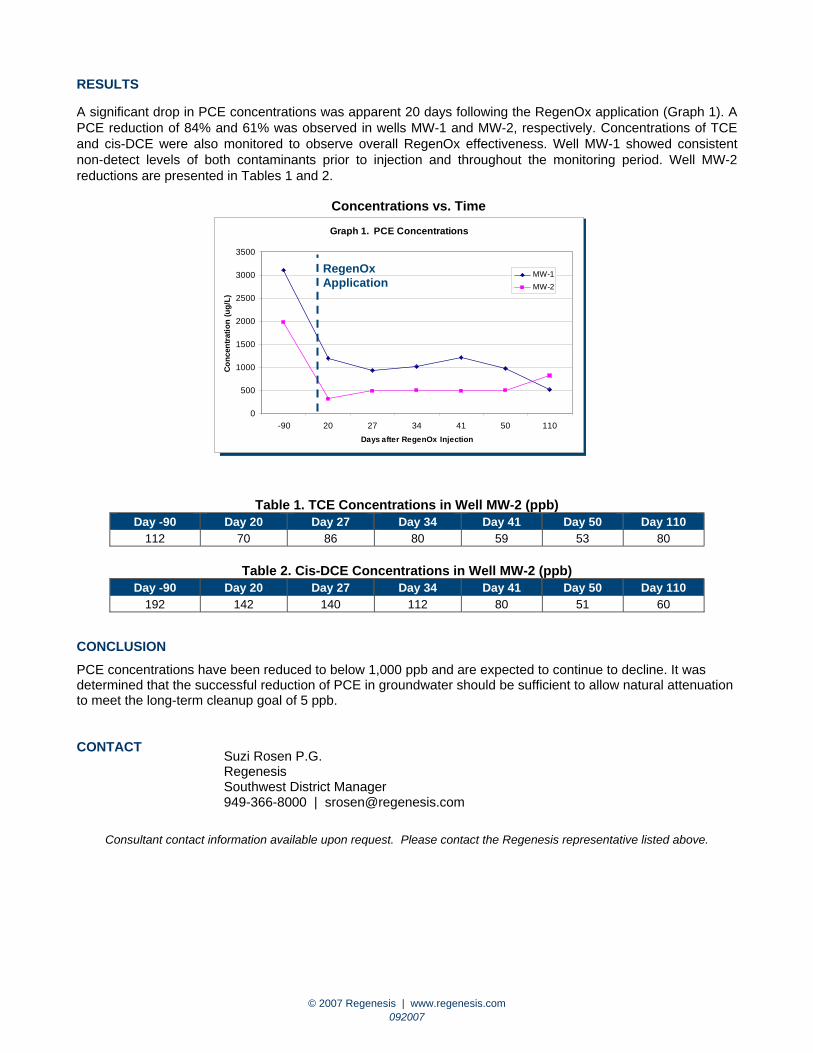
A significant drop in PCE concentrations was apparent 20 days following the RegenOx application (Graph 1). A PCE reduction of 84% and 61% was observed in wells MW-1 and MW-2, respectively. Concentrations of TCE and cis-DCE were also monitored to observe overall RegenOx effectiveness. Well MW-1 showed consistent non-detect levels of both contaminants prior to injection and throughout the monitoring period. Well MW-2 reductions are presented in Tables 1 and 2.
CONCLUSION
PCE concentrations have been reduced to below 1,000 ppb and are expected to continue to decline. It was determined that the successful reduction of PCE in groundwater should be sufficient to allow natural attenuation to meet the long-term cleanup goal of 5 ppb.
CONTACT
Consultant contact information available upon request. Please contact the Regenesis representative listed above.
Table 1. TCE Concentrations in Well MW-2 (ppb) Day -90 Day 20 Day 27 Day 34 Day 41 Day 50 Day 110
112 70 86 80 59 53 80
Table 2. Cis-DCE Concentrations in Well MW-2 (ppb) Day -90 Day 20 Day 27 Day 34 Day 41 Day 50 Day 110
192 142 140 112 80 51 60
HRC Application
Suzi Rosen P.G. Regenesis Southwest District Manager 949-366-8000 | [email protected]
Concentrations vs. Time
Graph 1. PCE Concentrations
0
500
1000
1500
2000
2500
3000
3500
-90 20 27 34 41 50 110
Days after RegenOx Injection
Con
cent
ratio
n (u
g/L)
MW-1
MW-2
RegenOx Application
The Reynolds Group / 520 West First Street, Tustin, CA 92780 / Ph. (714) 730-5397 F. (714) 730-6476
RegenOx™ Application Treats TPHg, BTEX and MTBE
and achieves NFA from LA RWQCB
Figure 2. Pilot Test Well EW1 Located within a Former LUST Area
Figure 1. RegenOx Material On-Site
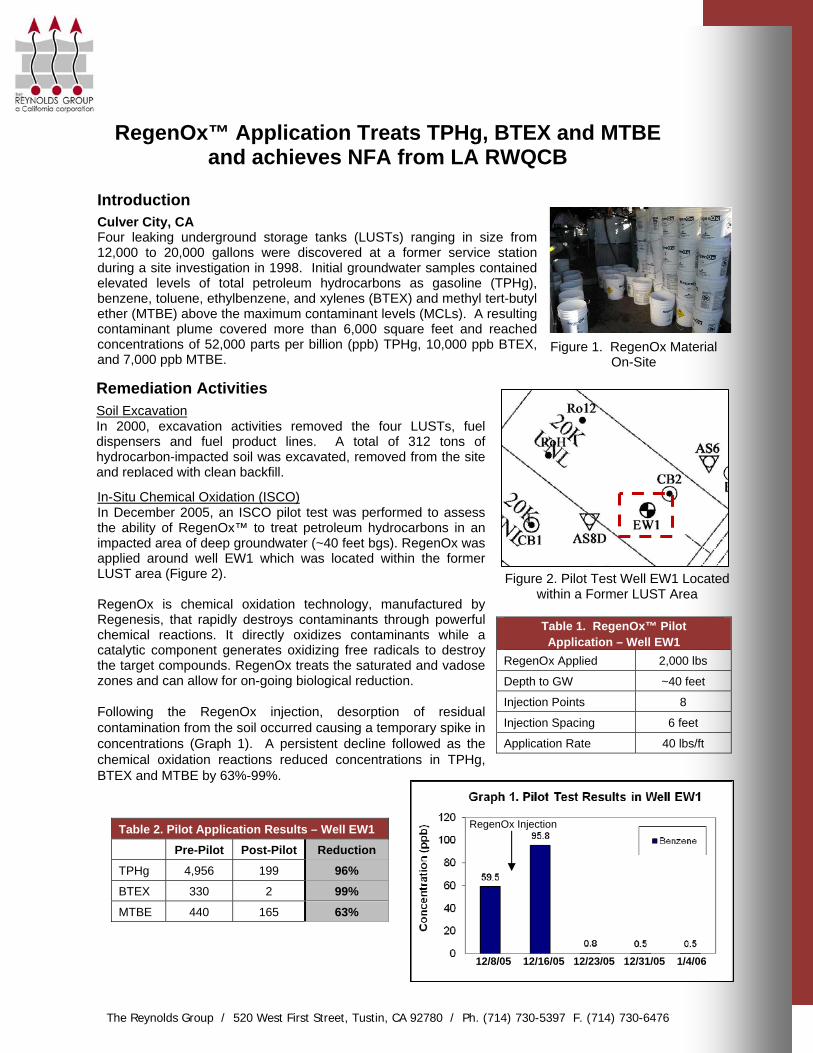
Introduction Culver City, CA Four leaking underground storage tanks (LUSTs) ranging in size from 12,000 to 20,000 gallons were discovered at a former service station during a site investigation in 1998. Initial groundwater samples contained elevated levels of total petroleum hydrocarbons as gasoline (TPHg), benzene, toluene, ethylbenzene, and xylenes (BTEX) and methyl tert-butyl ether (MTBE) above the maximum contaminant levels (MCLs). A resulting contaminant plume covered more than 6,000 square feet and reached concentrations of 52,000 parts per billion (ppb) TPHg, 10,000 ppb BTEX, and 7,000 ppb MTBE.
In-Situ Chemical Oxidation (ISCO) In December 2005, an ISCO pilot test was performed to assess the ability of RegenOx™ to treat petroleum hydrocarbons in an impacted area of deep groundwater (~40 feet bgs). RegenOx was applied around well EW1 which was located within the former LUST area (Figure 2). RegenOx is chemical oxidation technology, manufactured by Regenesis, that rapidly destroys contaminants through powerful chemical reactions. It directly oxidizes contaminants while a catalytic component generates oxidizing free radicals to destroy the target compounds. RegenOx treats the saturated and vadose zones and can allow for on-going biological reduction. Following the RegenOx injection, desorption of residual contamination from the soil occurred causing a temporary spike in concentrations (Graph 1). A persistent decline followed as the chemical oxidation reactions reduced concentrations in TPHg, BTEX and MTBE by 63%-99%.
Remediation Activities Soil Excavation In 2000, excavation activities removed the four LUSTs, fuel dispensers and fuel product lines. A total of 312 tons of hydrocarbon-impacted soil was excavated, removed from the site and replaced with clean backfill.
Table 1. RegenOx™ Pilot Application – Well EW1
RegenOx Applied 2,000 lbs
Depth to GW ~40 feet
Injection Points 8
Injection Spacing 6 feet
Application Rate 40 lbs/ft
Table 2. Pilot Application Results – Well EW1 Pre-Pilot Post-Pilot Reduction TPHg 4,956 199 96% BTEX 330 2 99%
MTBE 440 165 63%
RegenOx Injection
12/8/05 12/16/05 12/23/05 12/31/05 1/4/06
The Reynolds Group / 520 West First Street, Tustin, CA 92780 / Ph. (714) 730-5397 F. (714) 730-6476
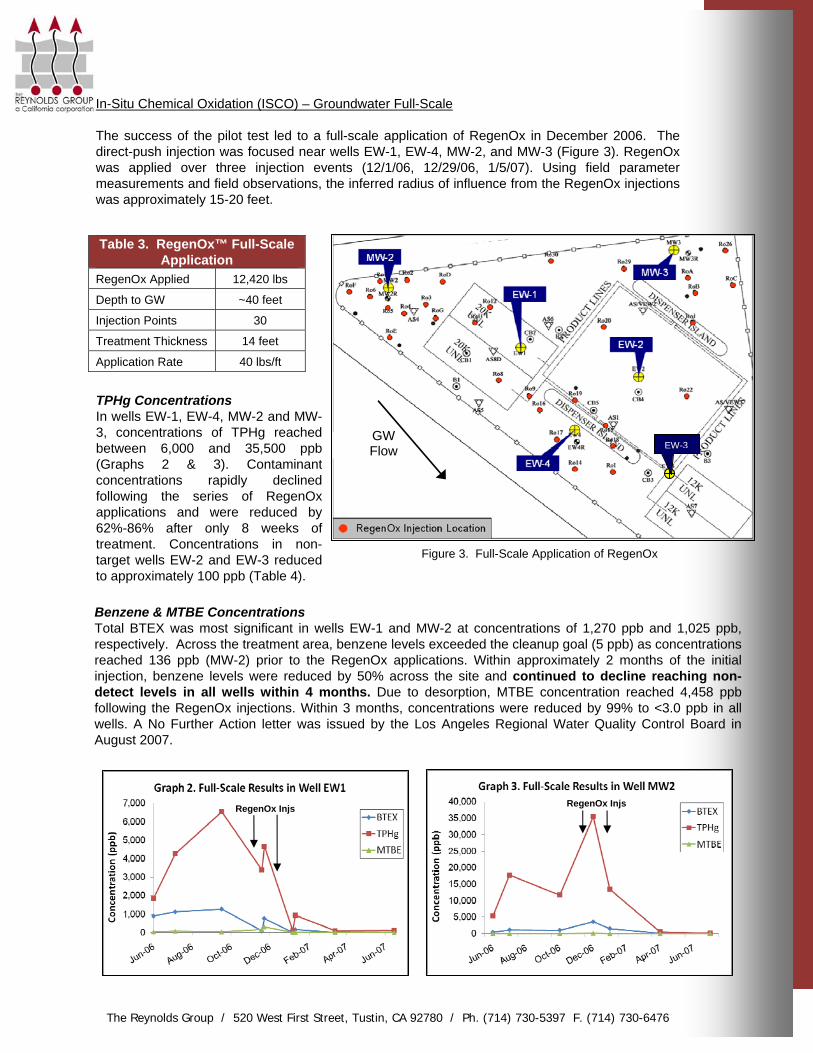
In-Situ Chemical Oxidation (ISCO) – Groundwater Full-Scale The success of the pilot test led to a full-scale application of RegenOx in December 2006. The direct-push injection was focused near wells EW-1, EW-4, MW-2, and MW-3 (Figure 3). RegenOx was applied over three injection events (12/1/06, 12/29/06, 1/5/07). Using field parameter measurements and field observations, the inferred radius of influence from the RegenOx injections was approximately 15-20 feet.
Table 3. RegenOx™ Full-Scale Application
RegenOx Applied 12,420 lbs
Depth to GW ~40 feet
Injection Points 30
Treatment Thickness 14 feet
Application Rate 40 lbs/ft
Figure 3. Full-Scale Application of RegenOx
GW Flow
Benzene & MTBE Concentrations Total BTEX was most significant in wells EW-1 and MW-2 at concentrations of 1,270 ppb and 1,025 ppb, respectively. Across the treatment area, benzene levels exceeded the cleanup goal (5 ppb) as concentrations reached 136 ppb (MW-2) prior to the RegenOx applications. Within approximately 2 months of the initial injection, benzene levels were reduced by 50% across the site and continued to decline reaching non-detect levels in all wells within 4 months. Due to desorption, MTBE concentration reached 4,458 ppb following the RegenOx injections. Within 3 months, concentrations were reduced by 99% to <3.0 ppb in all wells. A No Further Action letter was issued by the Los Angeles Regional Water Quality Control Board in August 2007.
RegenOx Injs
TPHg Concentrations In wells EW-1, EW-4, MW-2 and MW-3, concentrations of TPHg reached between 6,000 and 35,500 ppb (Graphs 2 & 3). Contaminant concentrations rapidly declined following the series of RegenOx applications and were reduced by 62%-86% after only 8 weeks of treatment. Concentrations in non-target wells EW-2 and EW-3 reduced to approximately 100 ppb (Table 4).
RegenOx Injs
EW-3
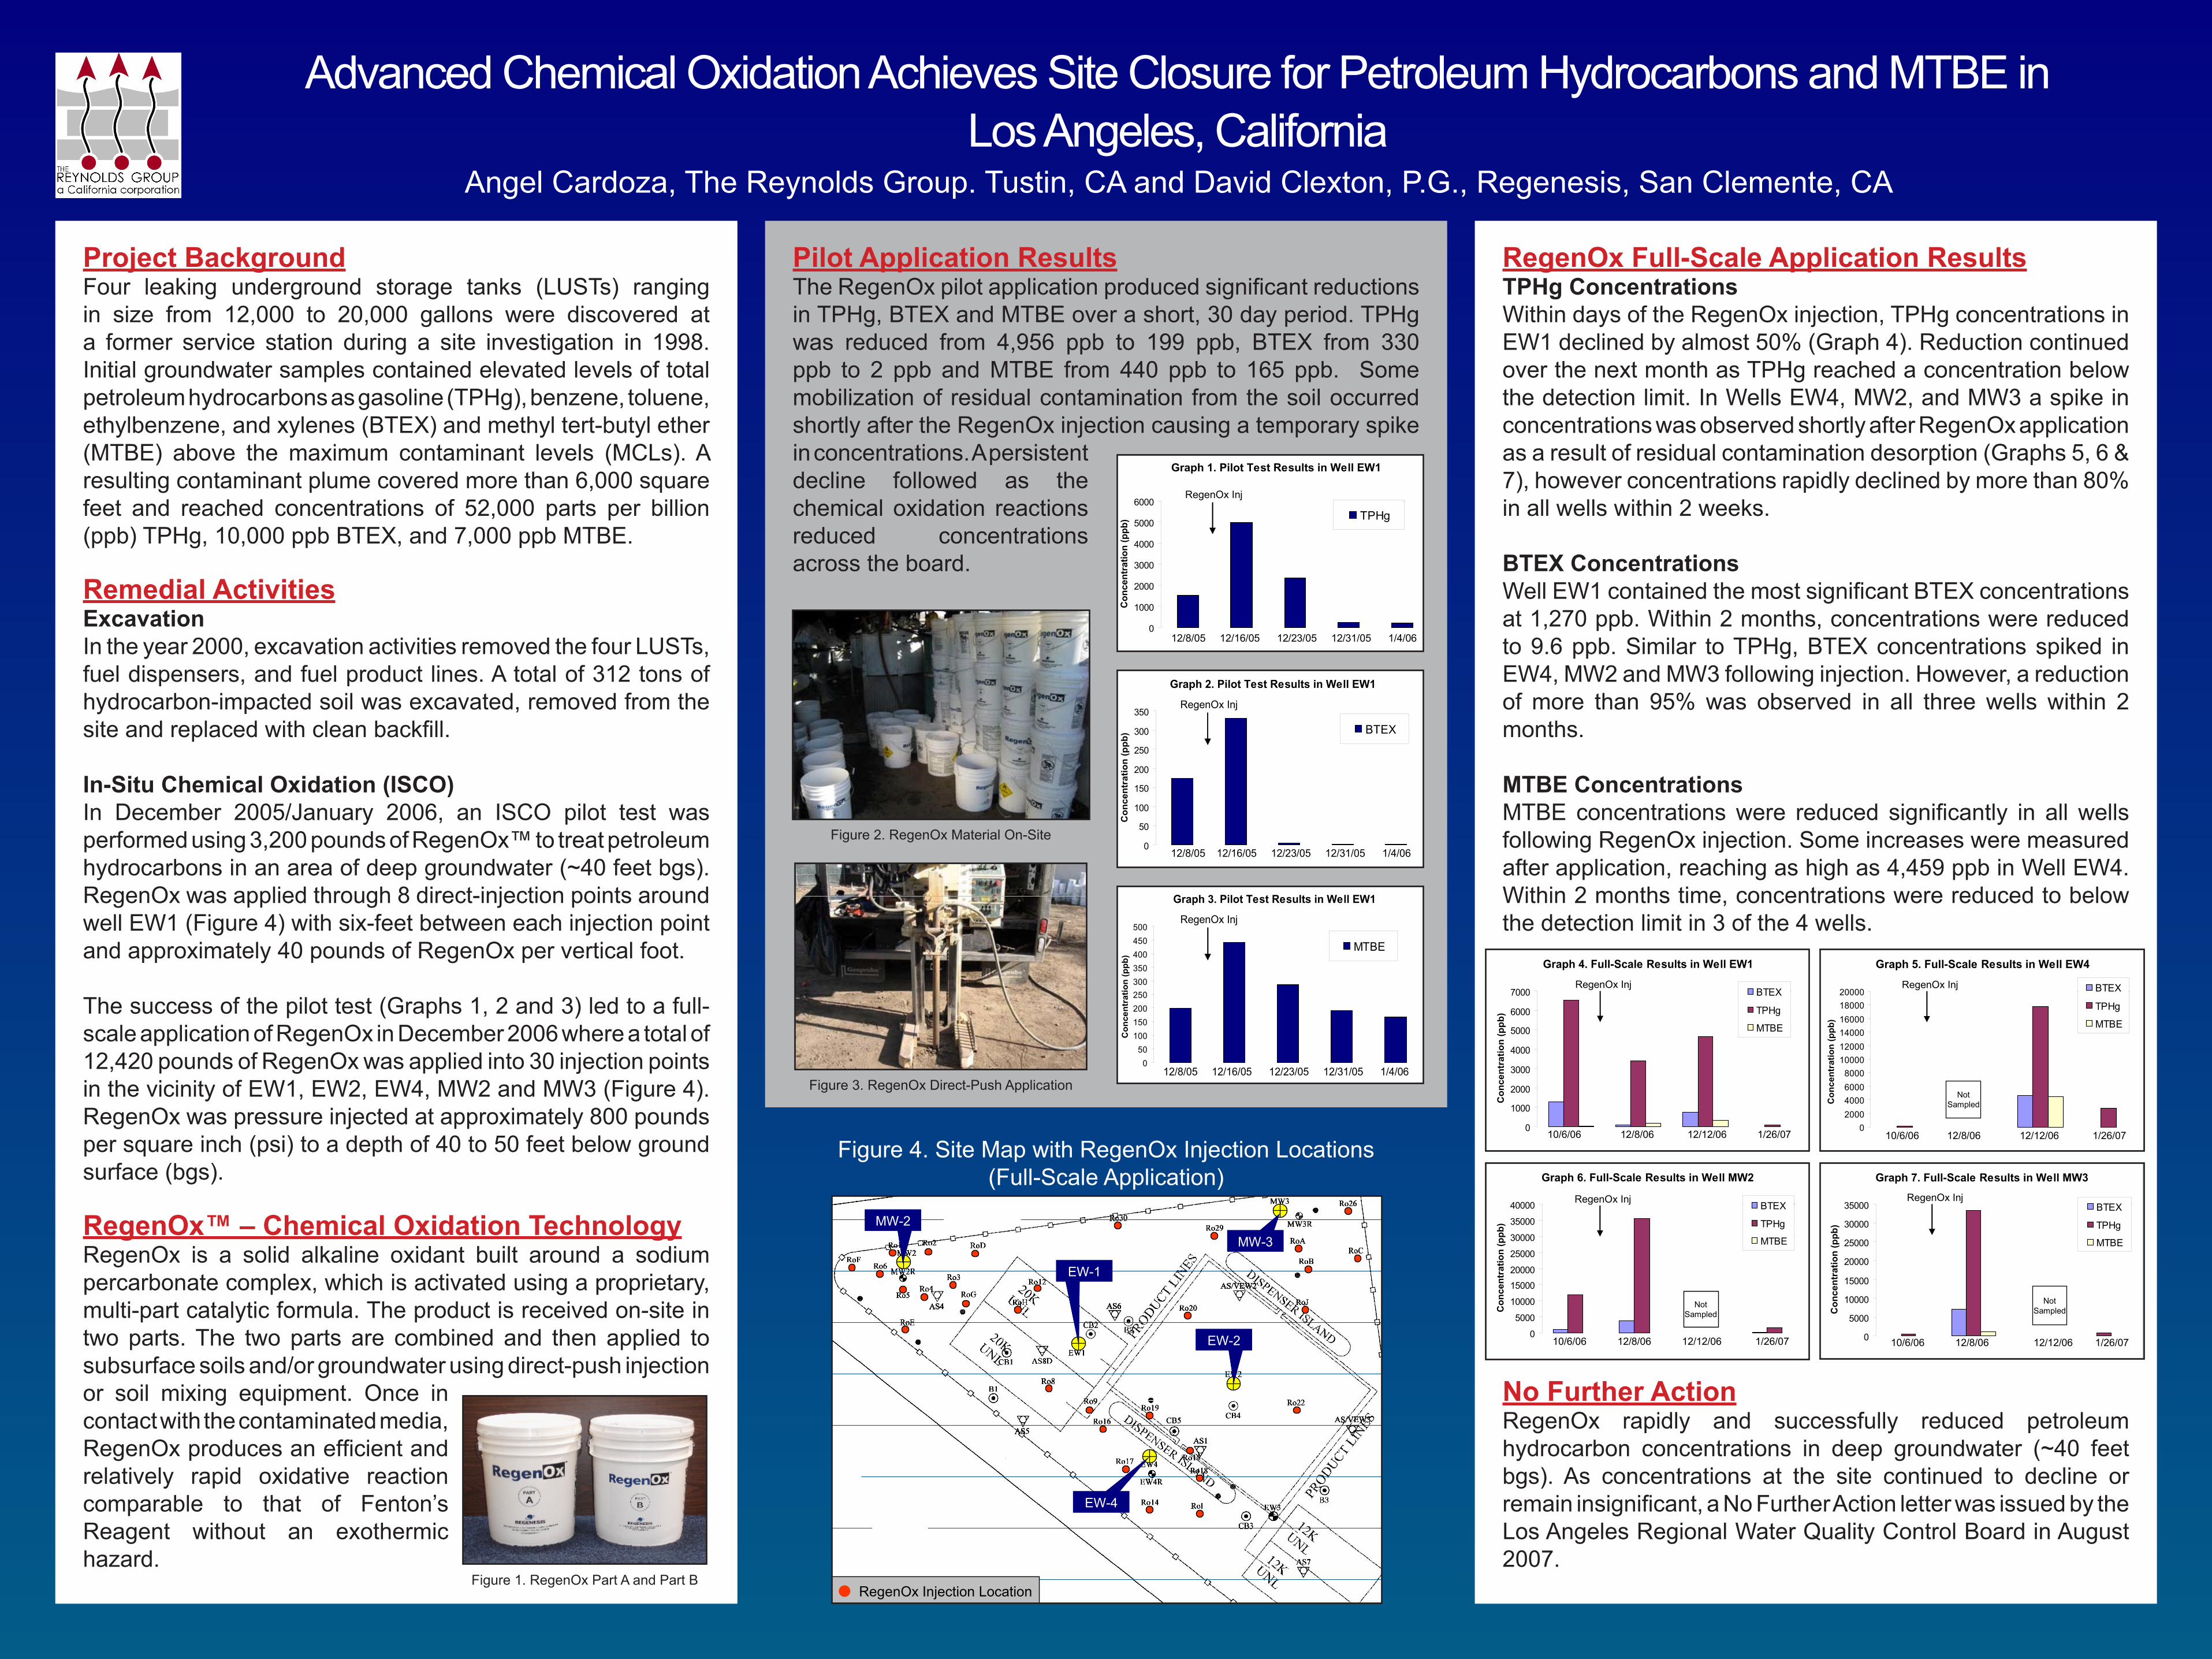
Project BackgroundFour leaking underground storage tanks (LUSTs) ranging in size from 12,000 to 20,000 gallons were discovered at a former service station during a site investigation in 1998. Initial groundwater samples contained elevated levels of total petroleum hydrocarbons as gasoline (TPHg), benzene, toluene, ethylbenzene, and xylenes (BTEX) and methyl tert-butyl ether (MTBE) above the maximum contaminant levels (MCLs). A resulting contaminant plume covered more than 6,000 square feet and reached concentrations of 52,000 parts per billion (ppb) TPHg, 10,000 ppb BTEX, and 7,000 ppb MTBE.
Remedial ActivitiesExcavationIn the year 2000, excavation activities removed the four LUSTs, fuel dispensers, and fuel product lines. A total of 312 tons of hydrocarbon-impacted soil was excavated, removed from the site and replaced with clean backfill.
In-Situ Chemical Oxidation (ISCO)In December 2005/January 2006, an ISCO pilot test was performed using 3,200 pounds of RegenOx™ to treat petroleum hydrocarbons in an area of deep groundwater (~40 feet bgs). RegenOx was applied through 8 direct-injection points around well EW1 (Figure 4) with six-feet between each injection point and approximately 40 pounds of RegenOx per vertical foot.
The success of the pilot test (Graphs 1, 2 and 3) led to a full-scale application of RegenOx in December 2006 where a total of 12,420 pounds of RegenOx was applied into 30 injection points in the vicinity of EW1, EW2, EW4, MW2 and MW3 (Figure 4). RegenOx was pressure injected at approximately 800 pounds per square inch (psi) to a depth of 40 to 50 feet below ground surface (bgs).
RegenOx™ – Chemical Oxidation TechnologyRegenOx is a solid alkaline oxidant built around a sodium percarbonate complex, which is activated using a proprietary, multi-part catalytic formula. The product is received on-site in two parts. The two parts are combined and then applied to subsurface soils and/or groundwater using direct-push injection or soil mixing equipment. Once in contact with the contaminated media, RegenOx produces an efficient and relatively rapid oxidative reaction comparable to that of Fenton’s Reagent without an exothermic hazard.
Pilot Application ResultsThe RegenOx pilot application produced significant reductions in TPHg, BTEX and MTBE over a short, 30 day period. TPHg was reduced from 4,956 ppb to 199 ppb, BTEX from 330 ppb to 2 ppb and MTBE from 440 ppb to 165 ppb. Some mobilization of residual contamination from the soil occurred shortly after the RegenOx injection causing a temporary spike in concentrations. A persistent decline followed as the chemical oxidation reactions reduced concentrations across the board.
RegenOx Full-Scale Application ResultsTPHg ConcentrationsWithin days of the RegenOx injection, TPHg concentrations in EW1 declined by almost 50% (Graph 4). Reduction continued over the next month as TPHg reached a concentration below the detection limit. In Wells EW4, MW2, and MW3 a spike in concentrations was observed shortly after RegenOx application as a result of residual contamination desorption (Graphs 5, 6 & 7), however concentrations rapidly declined by more than 80% in all wells within 2 weeks.
BTEX ConcentrationsWell EW1 contained the most significant BTEX concentrations at 1,270 ppb. Within 2 months, concentrations were reduced to 9.6 ppb. Similar to TPHg, BTEX concentrations spiked in EW4, MW2 and MW3 following injection. However, a reduction of more than 95% was observed in all three wells within 2 months.
MTBE ConcentrationsMTBE concentrations were reduced significantly in all wells following RegenOx injection. Some increases were measured after application, reaching as high as 4,459 ppb in Well EW4. Within 2 months time, concentrations were reduced to below the detection limit in 3 of the 4 wells.
No Further ActionRegenOx rapidly and successfully reduced petroleum hydrocarbon concentrations in deep groundwater (~40 feet bgs). As concentrations at the site continued to decline or remain insignificant, a No Further Action letter was issued by the Los Angeles Regional Water Quality Control Board in August 2007.
Graph 1. Pilot Test Results in Well EW1
0
1000
2000
3000
4000
5000
6000
Con
cent
ratio
n (p
pb) TPHg
RegenOx Inj
12/8/05 12/16/05 12/23/05 12/31/05 1/4/06
Graph 1. Pilot Test Results in Well EW1
0
1000
2000
3000
4000
5000
6000
Con
cent
ratio
n (p
pb) TPHg
RegenOx Inj
12/8/05 12/16/05 12/23/05 12/31/05 1/4/06
Graph 2. Pilot Test Results in Well EW1
0
50
100
150
200
250
300
350
Con
cent
ratio
n (p
pb) BTEX
RegenOx Inj
12/8/05 12/16/05 12/23/05 12/31/05 1/4/06
Graph 2. Pilot Test Results in Well EW1
0
50
100
150
200
250
300
350
Con
cent
ratio
n (p
pb) BTEX
RegenOx Inj
12/8/05 12/16/05 12/23/05 12/31/05 1/4/06
Graph 3. Pilot Test Results in Well EW1
050
100150200250300350400450500
Con
cent
ratio
n (p
pb)
MTBE
RegenOx Inj
12/8/05 12/16/05 12/23/05 12/31/05 1/4/06
Graph 3. Pilot Test Results in Well EW1
050
100150200250300350400450500
Con
cent
ratio
n (p
pb)
MTBE
RegenOx Inj
12/8/05 12/16/05 12/23/05 12/31/05 1/4/06
Graph 1. Pilot Test Results in Well EW1
0
1000
2000
3000
4000
5000
6000
Con
cent
ratio
n (p
pb) TPHg
RegenOx Inj
12/8/05 12/16/05 12/23/05 12/31/05 1/4/06
Graph 1. Pilot Test Results in Well EW1
0
1000
2000
3000
4000
5000
6000
Con
cent
ratio
n (p
pb) TPHg
RegenOx Inj
12/8/05 12/16/05 12/23/05 12/31/05 1/4/06
Graph 2. Pilot Test Results in Well EW1
0
50
100
150
200
250
300
350
Con
cent
ratio
n (p
pb) BTEX
RegenOx Inj
12/8/05 12/16/05 12/23/05 12/31/05 1/4/06
Graph 2. Pilot Test Results in Well EW1
0
50
100
150
200
250
300
350
Con
cent
ratio
n (p
pb) BTEX
RegenOx Inj
12/8/05 12/16/05 12/23/05 12/31/05 1/4/06
Graph 3. Pilot Test Results in Well EW1
050
100150200250300350400450500
Con
cent
ratio
n (p
pb)
MTBE
RegenOx Inj
12/8/05 12/16/05 12/23/05 12/31/05 1/4/06
Graph 3. Pilot Test Results in Well EW1
050
100150200250300350400450500
Con
cent
ratio
n (p
pb)
MTBE
RegenOx Inj
12/8/05 12/16/05 12/23/05 12/31/05 1/4/06
Graph 1. Pilot Test Results in Well EW1
0
1000
2000
3000
4000
5000
6000
Con
cent
ratio
n (p
pb) TPHg
RegenOx Inj
12/8/05 12/16/05 12/23/05 12/31/05 1/4/06
Graph 1. Pilot Test Results in Well EW1
0
1000
2000
3000
4000
5000
6000
Con
cent
ratio
n (p
pb) TPHg
RegenOx Inj
12/8/05 12/16/05 12/23/05 12/31/05 1/4/06
Graph 2. Pilot Test Results in Well EW1
0
50
100
150
200
250
300
350
Con
cent
ratio
n (p
pb) BTEX
RegenOx Inj
12/8/05 12/16/05 12/23/05 12/31/05 1/4/06
Graph 2. Pilot Test Results in Well EW1
0
50
100
150
200
250
300
350
Con
cent
ratio
n (p
pb) BTEX
RegenOx Inj
12/8/05 12/16/05 12/23/05 12/31/05 1/4/06
Graph 3. Pilot Test Results in Well EW1
050
100150200250300350400450500
Con
cent
ratio
n (p
pb)
MTBE
RegenOx Inj
12/8/05 12/16/05 12/23/05 12/31/05 1/4/06
Graph 3. Pilot Test Results in Well EW1
050
100150200250300350400450500
Con
cent
ratio
n (p
pb)
MTBE
RegenOx Inj
12/8/05 12/16/05 12/23/05 12/31/05 1/4/06
MW-2
EW-1
MW-3
EW-4
EW-2
RegenOx Injection Location
MW-2
EW-1
MW-3
EW-4
EW-2
MW-2
EW-1
MW-3
EW-4
EW-2
MW-2
EW-1
MW-3
EW-4
EW-2
RegenOx Injection LocationRegenOx Injection Location
Graph 4. Full-Scale Results in Well EW1
0
1000
2000
3000
4000
5000
6000
7000
Con
cent
ratio
n (p
pb)
BTEX
TPHg
MTBE
10/6/06 12/8/06 12/12/06 1/26/07
RegenOx Inj
Graph 4. Full-Scale Results in Well EW1
0
1000
2000
3000
4000
5000
6000
7000
Con
cent
ratio
n (p
pb)
BTEX
TPHg
MTBE
10/6/06 12/8/06 12/12/06 1/26/07
RegenOx Inj
Graph 5. Full-Scale Results in Well EW4
02000400060008000
100001200014000160001800020000
Con
cent
ratio
n (p
pb)
BTEX
TPHg
MTBE
10/6/06 12/8/06 12/12/06 1/26/07
RegenOx Inj
NotSampled
Graph 5. Full-Scale Results in Well EW4
02000400060008000
100001200014000160001800020000
Con
cent
ratio
n (p
pb)
BTEX
TPHg
MTBE
10/6/06 12/8/06 12/12/06 1/26/07
RegenOx Inj
NotSampled
Graph 7. Full-Scale Results in Well MW3
0
5000
10000
15000
20000
25000
30000
35000
Con
cent
ratio
n (p
pb)
BTEX
TPHg
MTBE
RegenOx Inj
NotSampled
10/6/06 12/8/06 12/12/06 1/26/07
Graph 7. Full-Scale Results in Well MW3
0
5000
10000
15000
20000
25000
30000
35000
Con
cent
ratio
n (p
pb)
BTEX
TPHg
MTBE
RegenOx Inj
NotSampled
10/6/06 12/8/06 12/12/06 1/26/07
Graph 6. Full-Scale Results in Well MW2
0
5000
10000
15000
20000
25000
30000
35000
40000
Con
cent
ratio
n (p
pb)
BTEX
TPHg
MTBE
10/6/06 12/8/06 12/12/06 1/26/07
RegenOx Inj
NotSampled
Graph 6. Full-Scale Results in Well MW2
0
5000
10000
15000
20000
25000
30000
35000
40000
Con
cent
ratio
n (p
pb)
BTEX
TPHg
MTBE
10/6/06 12/8/06 12/12/06 1/26/07
RegenOx Inj
NotSampled
Graph 4. Full-Scale Results in Well EW1
0
1000
2000
3000
4000
5000
6000
7000
Con
cent
ratio
n (p
pb)
BTEX
TPHg
MTBE
10/6/06 12/8/06 12/12/06 1/26/07
RegenOx Inj
Graph 4. Full-Scale Results in Well EW1
0
1000
2000
3000
4000
5000
6000
7000
Con
cent
ratio
n (p
pb)
BTEX
TPHg
MTBE
10/6/06 12/8/06 12/12/06 1/26/07
RegenOx Inj
Graph 5. Full-Scale Results in Well EW4
02000400060008000
100001200014000160001800020000
Con
cent
ratio
n (p
pb)
BTEX
TPHg
MTBE
10/6/06 12/8/06 12/12/06 1/26/07
RegenOx Inj
NotSampled
Graph 5. Full-Scale Results in Well EW4
02000400060008000
100001200014000160001800020000
Con
cent
ratio
n (p
pb)
BTEX
TPHg
MTBE
10/6/06 12/8/06 12/12/06 1/26/07
RegenOx Inj
NotSampled
Graph 7. Full-Scale Results in Well MW3
0
5000
10000
15000
20000
25000
30000
35000
Con
cent
ratio
n (p
pb)
BTEX
TPHg
MTBE
RegenOx Inj
NotSampled
10/6/06 12/8/06 12/12/06 1/26/07
Graph 7. Full-Scale Results in Well MW3
0
5000
10000
15000
20000
25000
30000
35000
Con
cent
ratio
n (p
pb)
BTEX
TPHg
MTBE
RegenOx Inj
NotSampled
10/6/06 12/8/06 12/12/06 1/26/07
Graph 6. Full-Scale Results in Well MW2
0
5000
10000
15000
20000
25000
30000
35000
40000
Con
cent
ratio
n (p
pb)
BTEX
TPHg
MTBE
10/6/06 12/8/06 12/12/06 1/26/07
RegenOx Inj
NotSampled
Graph 6. Full-Scale Results in Well MW2
0
5000
10000
15000
20000
25000
30000
35000
40000
Con
cent
ratio
n (p
pb)
BTEX
TPHg
MTBE
10/6/06 12/8/06 12/12/06 1/26/07
RegenOx Inj
NotSampled
Graph 4. Full-Scale Results in Well EW1
0
1000
2000
3000
4000
5000
6000
7000
Con
cent
ratio
n (p
pb)
BTEX
TPHg
MTBE
10/6/06 12/8/06 12/12/06 1/26/07
RegenOx Inj
Graph 4. Full-Scale Results in Well EW1
0
1000
2000
3000
4000
5000
6000
7000
Con
cent
ratio
n (p
pb)
BTEX
TPHg
MTBE
10/6/06 12/8/06 12/12/06 1/26/07
RegenOx Inj
Graph 5. Full-Scale Results in Well EW4
02000400060008000
100001200014000160001800020000
Con
cent
ratio
n (p
pb)
BTEX
TPHg
MTBE
10/6/06 12/8/06 12/12/06 1/26/07
RegenOx Inj
NotSampled
Graph 5. Full-Scale Results in Well EW4
02000400060008000
100001200014000160001800020000
Con
cent
ratio
n (p
pb)
BTEX
TPHg
MTBE
10/6/06 12/8/06 12/12/06 1/26/07
RegenOx Inj
NotSampled
Graph 7. Full-Scale Results in Well MW3
0
5000
10000
15000
20000
25000
30000
35000
Con
cent
ratio
n (p
pb)
BTEX
TPHg
MTBE
RegenOx Inj
NotSampled
10/6/06 12/8/06 12/12/06 1/26/07
Graph 7. Full-Scale Results in Well MW3
0
5000
10000
15000
20000
25000
30000
35000
Con
cent
ratio
n (p
pb)
BTEX
TPHg
MTBE
RegenOx Inj
NotSampled
10/6/06 12/8/06 12/12/06 1/26/07
Graph 6. Full-Scale Results in Well MW2
0
5000
10000
15000
20000
25000
30000
35000
40000
Con
cent
ratio
n (p
pb)
BTEX
TPHg
MTBE
10/6/06 12/8/06 12/12/06 1/26/07
RegenOx Inj
NotSampled
Graph 6. Full-Scale Results in Well MW2
0
5000
10000
15000
20000
25000
30000
35000
40000
Con
cent
ratio
n (p
pb)
BTEX
TPHg
MTBE
10/6/06 12/8/06 12/12/06 1/26/07
RegenOx Inj
NotSampled
Graph 4. Full-Scale Results in Well EW1
0
1000
2000
3000
4000
5000
6000
7000
Con
cent
ratio
n (p
pb)
BTEX
TPHg
MTBE
10/6/06 12/8/06 12/12/06 1/26/07
RegenOx Inj
Graph 4. Full-Scale Results in Well EW1
0
1000
2000
3000
4000
5000
6000
7000
Con
cent
ratio
n (p
pb)
BTEX
TPHg
MTBE
10/6/06 12/8/06 12/12/06 1/26/07
RegenOx Inj
Graph 5. Full-Scale Results in Well EW4
02000400060008000
100001200014000160001800020000
Con
cent
ratio
n (p
pb)
BTEX
TPHg
MTBE
10/6/06 12/8/06 12/12/06 1/26/07
RegenOx Inj
NotSampled
Graph 5. Full-Scale Results in Well EW4
02000400060008000
100001200014000160001800020000
Con
cent
ratio
n (p
pb)
BTEX
TPHg
MTBE
10/6/06 12/8/06 12/12/06 1/26/07
RegenOx Inj
NotSampled
Graph 7. Full-Scale Results in Well MW3
0
5000
10000
15000
20000
25000
30000
35000
Con
cent
ratio
n (p
pb)
BTEX
TPHg
MTBE
RegenOx Inj
NotSampled
10/6/06 12/8/06 12/12/06 1/26/07
Graph 7. Full-Scale Results in Well MW3
0
5000
10000
15000
20000
25000
30000
35000
Con
cent
ratio
n (p
pb)
BTEX
TPHg
MTBE
RegenOx Inj
NotSampled
10/6/06 12/8/06 12/12/06 1/26/07
Graph 6. Full-Scale Results in Well MW2
0
5000
10000
15000
20000
25000
30000
35000
40000
Con
cent
ratio
n (p
pb)
BTEX
TPHg
MTBE
10/6/06 12/8/06 12/12/06 1/26/07
RegenOx Inj
NotSampled
Graph 6. Full-Scale Results in Well MW2
0
5000
10000
15000
20000
25000
30000
35000
40000
Con
cent
ratio
n (p
pb)
BTEX
TPHg
MTBE
10/6/06 12/8/06 12/12/06 1/26/07
RegenOx Inj
NotSampled
Advanced Chemical Oxidation Achieves Site Closure for Petroleum Hydrocarbons and MTBE in Los Angeles, California
Angel Cardoza, The Reynolds Group. Tustin, CA and David Clexton, P.G., Regenesis, San Clemente, CA
Figure 4. Site Map with RegenOx Injection Locations (Full-Scale Application)
Figure 3. RegenOx Direct-Push Application
Figure 1. RegenOx Part A and Part B
Figure 2. RegenOx Material On-Site
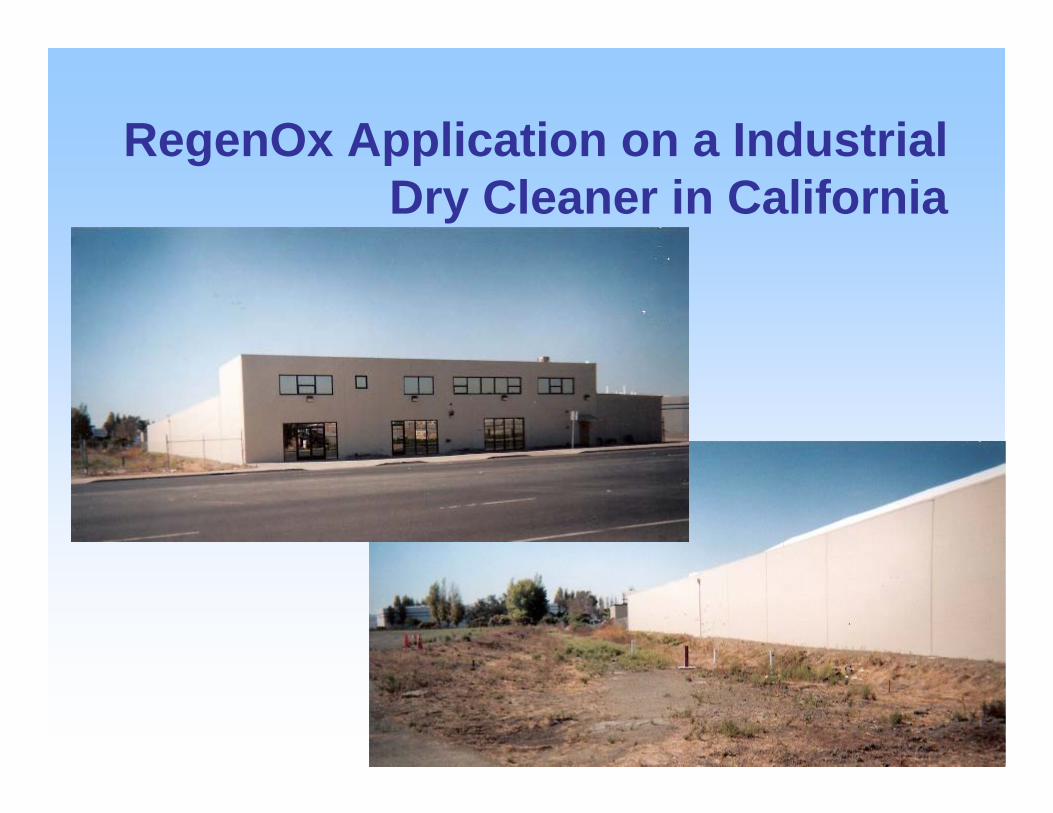
RegenOx Application on a Industrial Dry Cleaner in California
RegenOxRegenOx: California dry cleaner: California dry cleaner
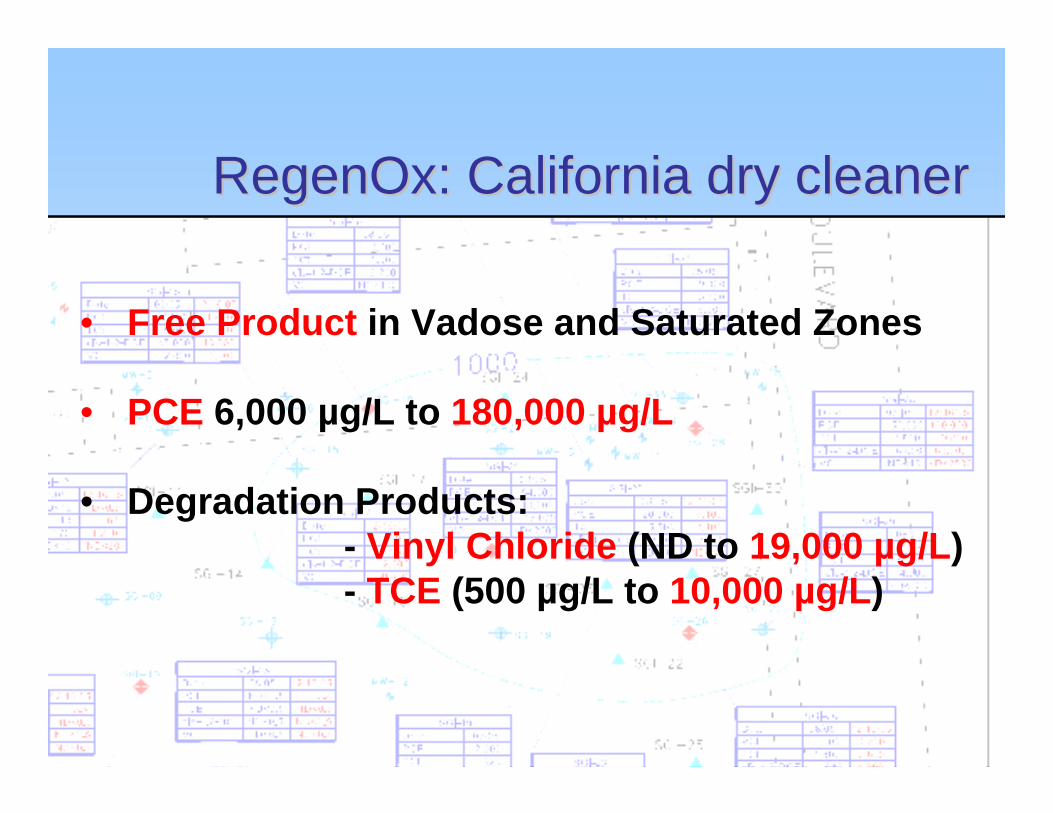
• Free Product in Vadose and Saturated Zones
• PCE 6,000 µg/L to 180,000 µg/L
• Degradation Products:- Vinyl Chloride (ND to 19,000 µg/L)- TCE (500 µg/L to 10,000 µg/L)
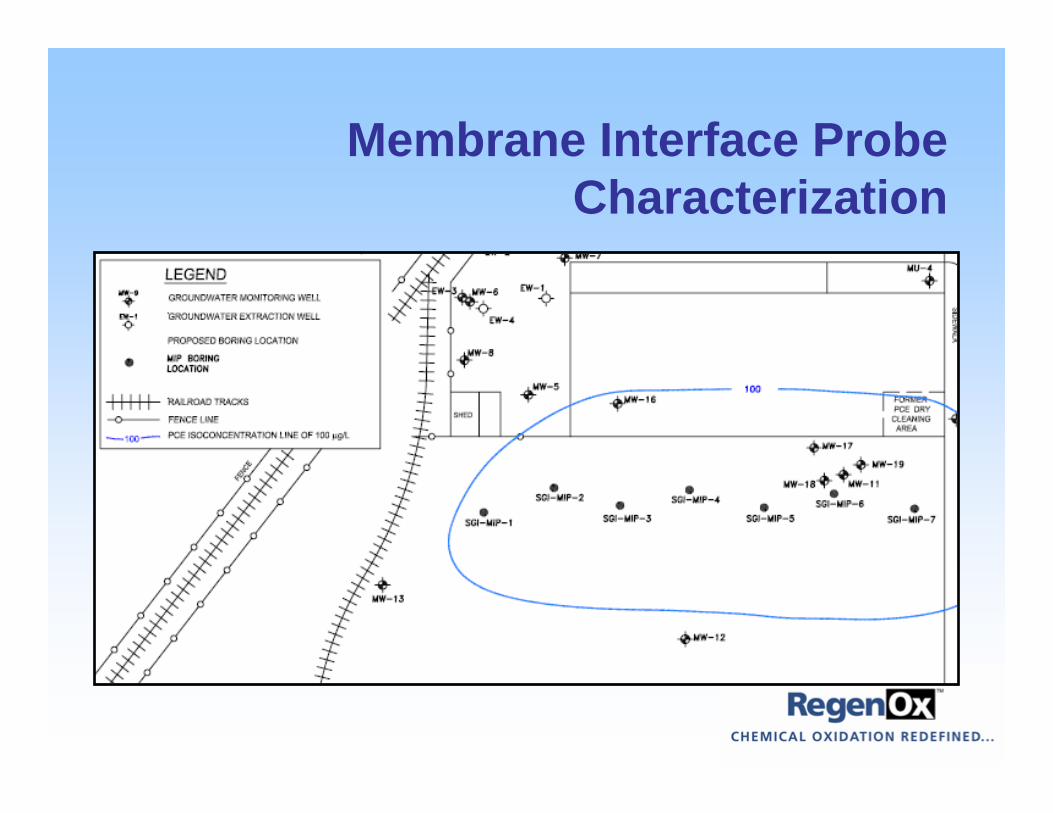
Membrane Interface Probe Characterization
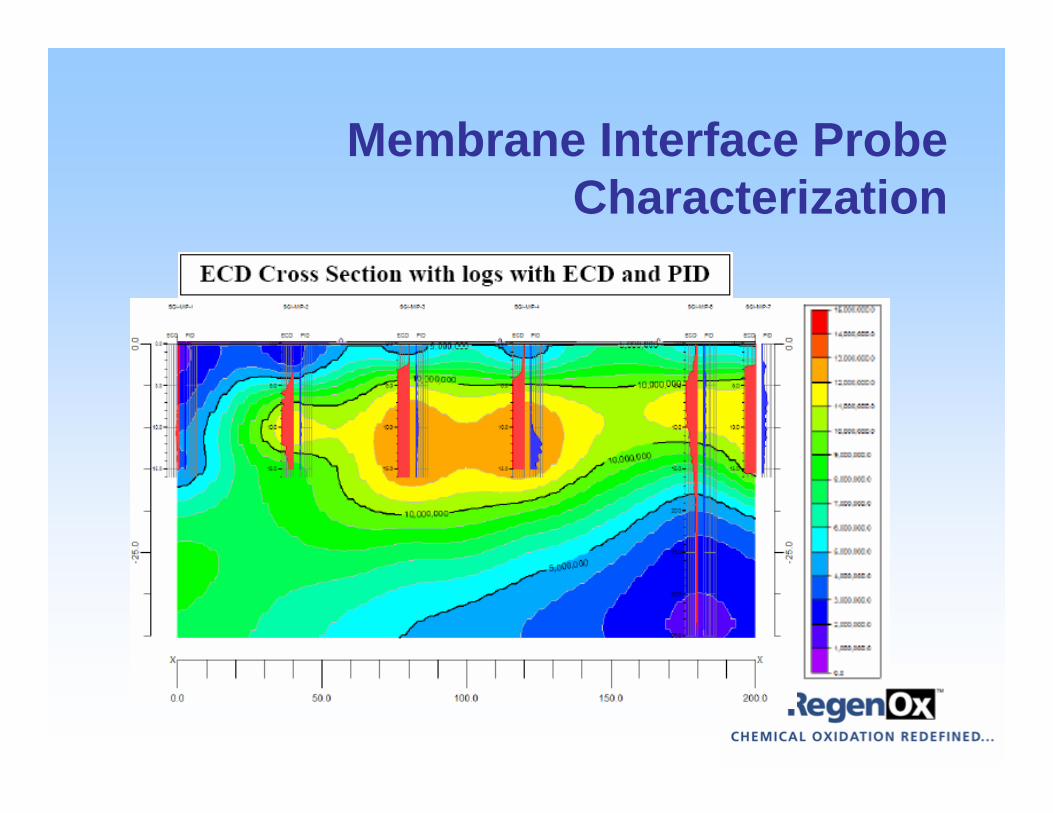
Membrane Interface Probe Characterization
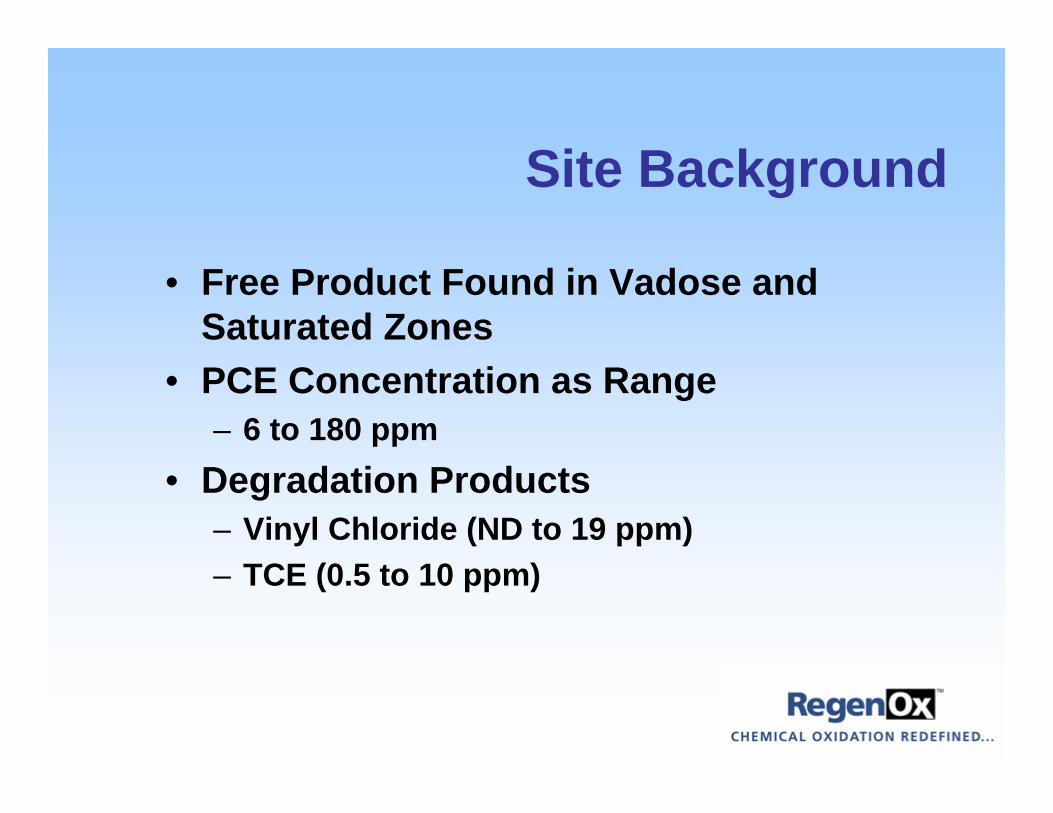
Site Background
• Free Product Found in Vadose and Saturated Zones
• PCE Concentration as Range– 6 to 180 ppm
• Degradation Products– Vinyl Chloride (ND to 19 ppm)– TCE (0.5 to 10 ppm)
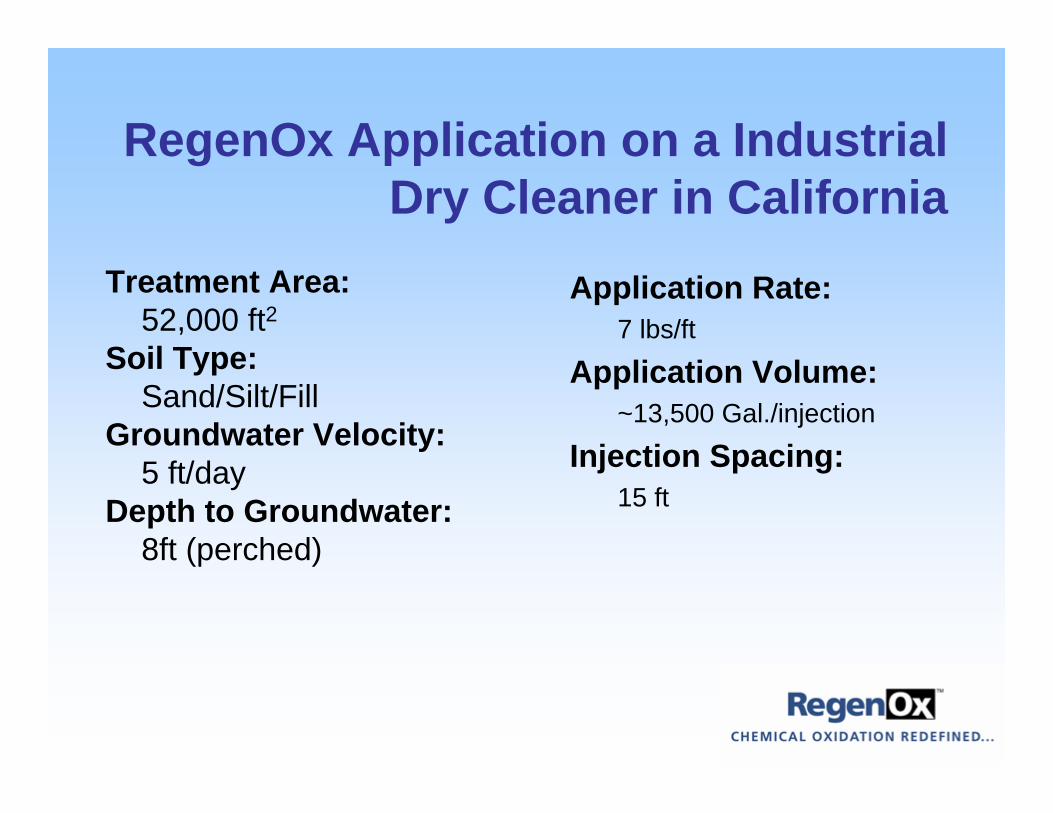
Treatment Area: 52,000 ft2
Soil Type: Sand/Silt/Fill
Groundwater Velocity: 5 ft/day
Depth to Groundwater: 8ft (perched)
Application Rate: 7 lbs/ft
Application Volume:~13,500 Gal./injection
Injection Spacing: 15 ft
RegenOx Application on a Industrial Dry Cleaner in California
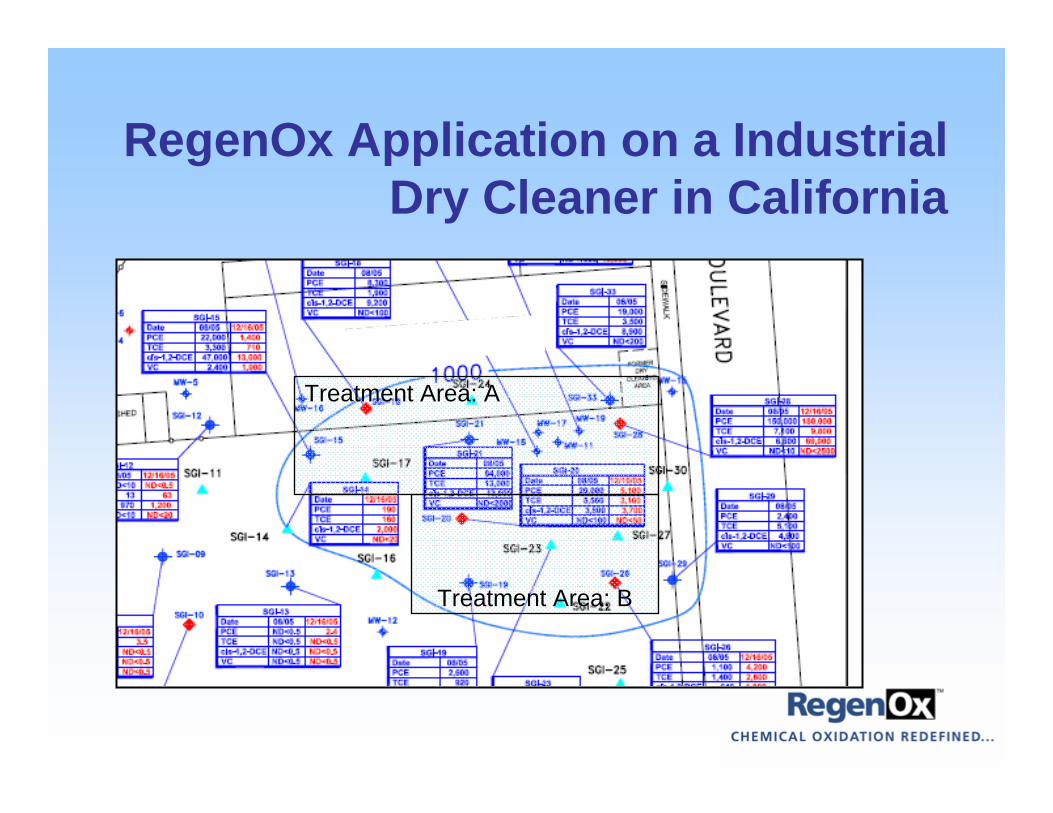
RegenOx Application on a Industrial Dry Cleaner in California
Treatment Area: A
Treatment Area: B
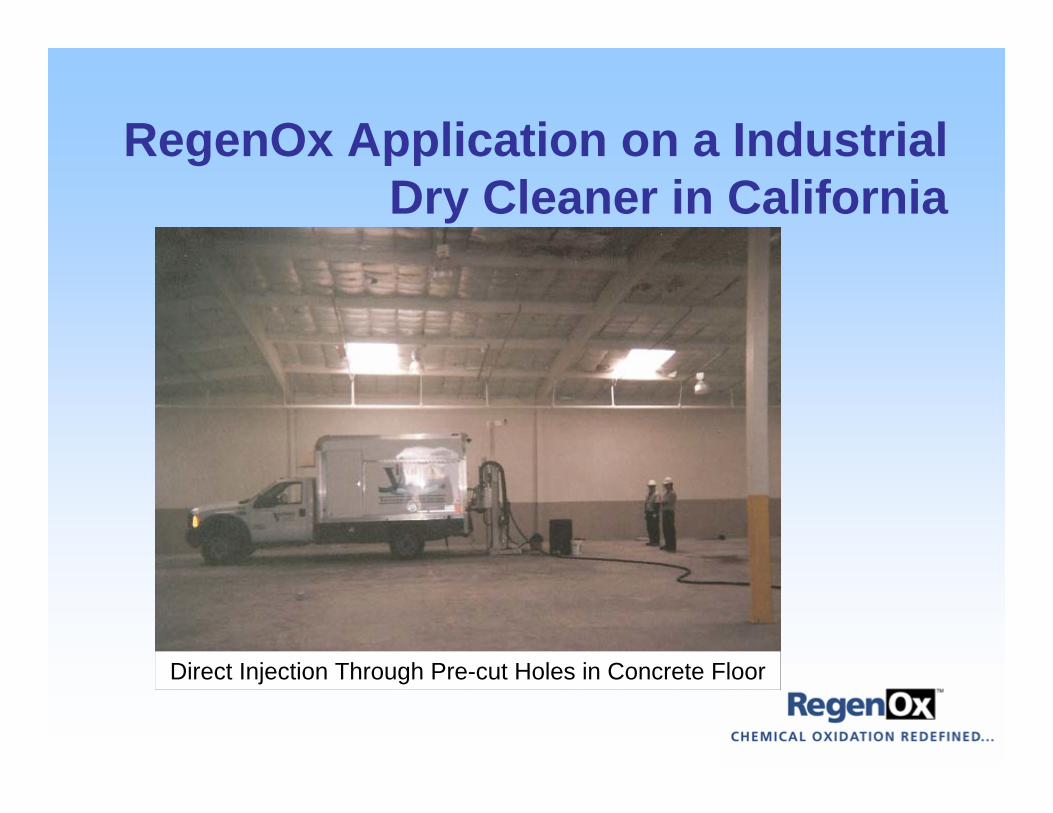
RegenOx Application on a Industrial Dry Cleaner in California
Direct Injection Through Pre-cut Holes in Concrete Floor
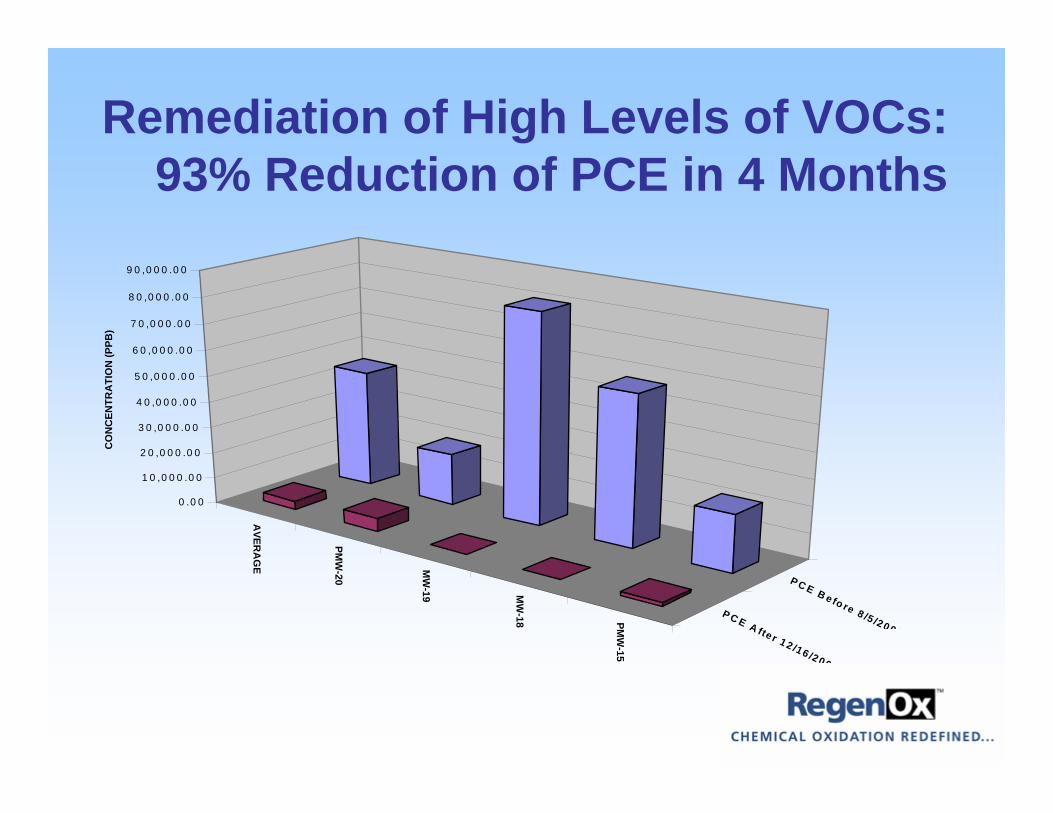
Remediation of High Levels of VOCs:93% Reduction of PCE in 4 Months
PMW
-15
MW
-18
MW
-19
PMW
-20
AVER
AG
E
P C E B e fo re 8 /5 /2005
P C E A fte r 1 2 /16 /2005
0 .0 0
1 0 ,0 0 0 .0 0
2 0 ,0 0 0 .0 0
3 0 ,0 0 0 .0 0
4 0 ,0 0 0 .0 0
5 0 ,0 0 0 .0 0
6 0 ,0 0 0 .0 0
7 0 ,0 0 0 .0 0
8 0 ,0 0 0 .0 0
9 0 ,0 0 0 .0 0
CO
NC
ENTR
ATI
ON
(PPB
)
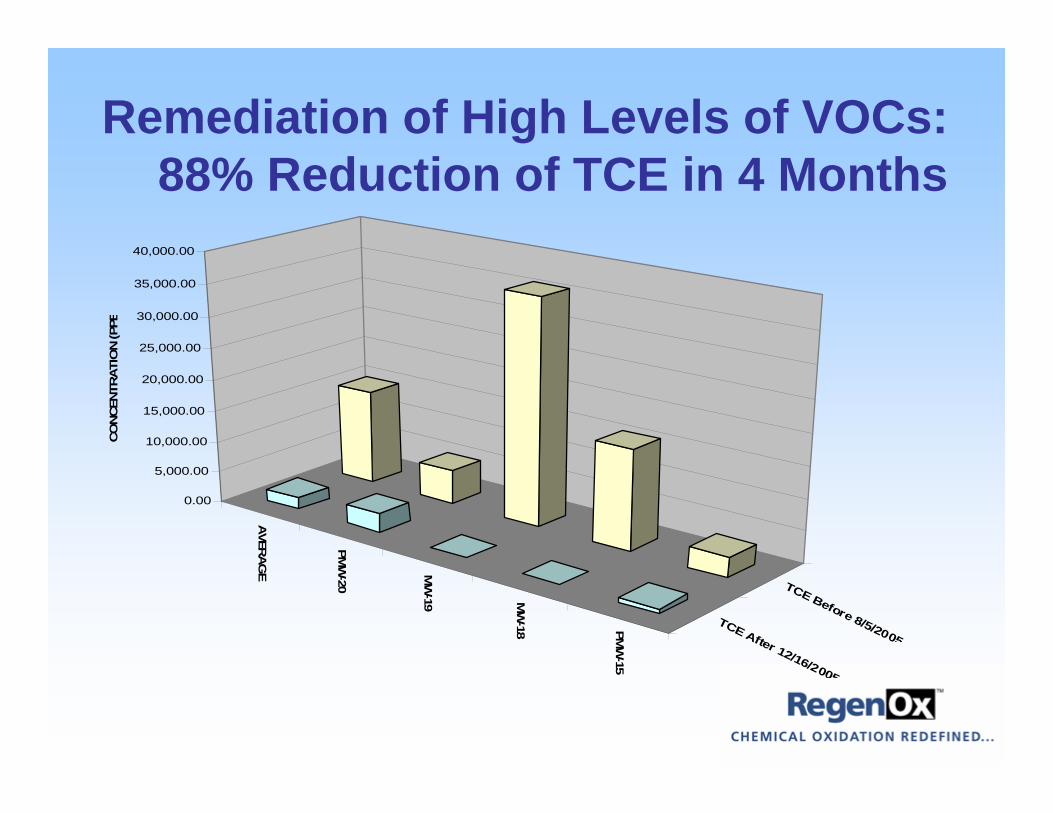
Remediation of High Levels of VOCs:88% Reduction of TCE in 4 Months
PMW
-15
MW
-18
MW
-19
PMW
-20
AVER
AG
E
TCE Before 8/5/2005TCE After 12/16/2005
0.00
5,000.00
10,000.00
15,000.00
20,000.00
25,000.00
30,000.00
35,000.00
40,000.00
CO
NC
ENTR
ATI
ON
(PPB
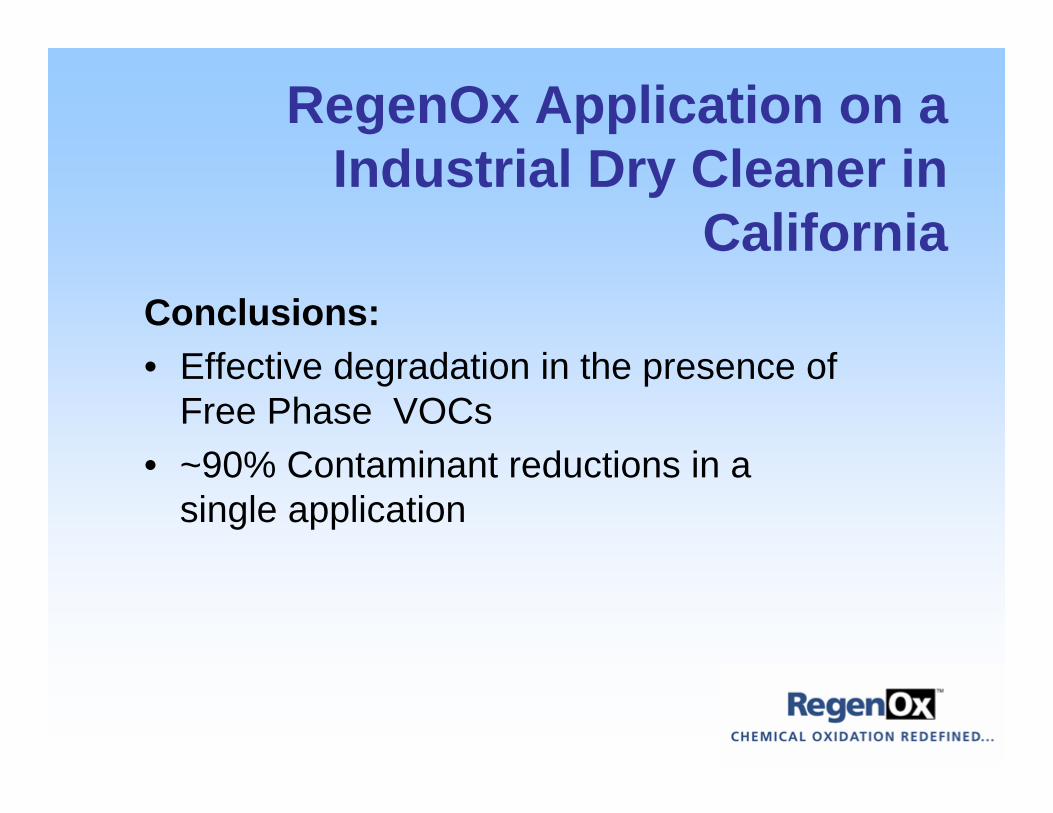
Conclusions: • Effective degradation in the presence of
Free Phase VOCs
• ~90% Contaminant reductions in a single application
RegenOx Application on a Industrial Dry Cleaner in
California
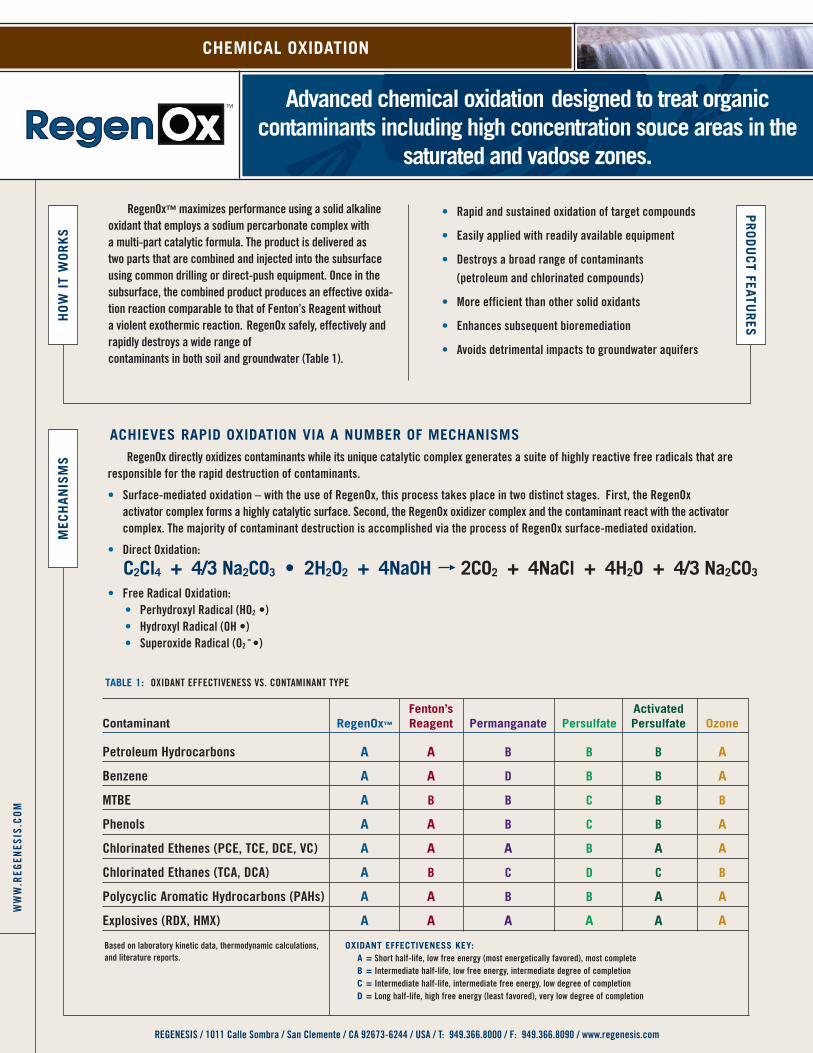
Fenton’s Activated Contaminant RegenOx™ Reagent Permanganate Persulfate Persulfate Ozone
Petroleum Hydrocarbons A A B B B A
Benzene A A D B B A
MTBE A B B C B B
Phenols A A B C B A
Chlorinated Ethenes (PCE, TCE, DCE, VC) A A A B A A
Chlorinated Ethanes (TCA, DCA) A B C D C B
Polycyclic Aromatic Hydrocarbons (PAHs) A A B B A A
Explosives (RDX, HMX) A A A A A A
OxidAnt EFFECtivEnEss KEy: A = Short half-life, low free energy (most energetically favored), most complete B = Intermediate half-life, low free energy, intermediate degree of completion C = Intermediate half-life, intermediate free energy, low degree of completion d = Long half-life, high free energy (least favored), very low degree of completion
tABlE 1: OXIDAnT EffECTIVEnESS VS. COnTAMInAnT TyPE
Based on laboratory kinetic data, thermodynamic calculations, and literature reports.
HO
w i
t w
OR
Ks
PR
Od
uC
t FEAtuR
EsM
ECH
An
isM
s
RegenOx™ maximizes performance using a solid alkaline oxidant that employs a sodium percarbonate complex with a multi-part catalytic formula. The product is delivered as two parts that are combined and injected into the subsurface using common drilling or direct-push equipment. Once in the subsurface, the combined product produces an effective oxida-tion reaction comparable to that of fenton’s Reagent without a violent exothermic reaction. RegenOx safely, effectively and rapidly destroys a wide range of contaminants in both soil and groundwater (Table 1).
• Rapid and sustained oxidation of target compounds
• Easily applied with readily available equipment
• Destroys a broad range of contaminants (petroleum and chlorinated compounds)
• More efficient than other solid oxidants
• Enhances subsequent bioremediation
• Avoids detrimental impacts to groundwater aquifers
ACHiEvEs RAPid OxidAtiOn viA A nuMBER OF MECHAnisMs RegenOx directly oxidizes contaminants while its unique catalytic complex generates a suite of highly reactive free radicals that are
responsible for the rapid destruction of contaminants.
• Surface-mediated oxidation – with the use of RegenOx, this process takes place in two distinct stages. first, the RegenOx activator complex forms a highly catalytic surface. Second, the RegenOx oxidizer complex and the contaminant react with the activator complex. The majority of contaminant destruction is accomplished via the process of RegenOx surface-mediated oxidation.
• Direct Oxidation:
C2Cl4 + 4/3 na2CO3 • 2H2O2 + 4naOH 2CO2 + 4naCl + 4H2O + 4/3 na2CO3
• free Radical Oxidation: • Perhydroxyl Radical (HO2
•) • Hydroxyl Radical (OH •) • Superoxide Radical (O2 -•)
Advanced chemical oxidation designed to treat organiccontaminants including high concentration souce areas in the
saturated and vadose zones.
CHEMiCAl OxidAtiOn
REGEnESIS / 1011 Calle Sombra / San Clemente / CA 92673-6244 / USA / T: 949.366.8000 / f: 949.366.8090 / www.regenesis.com
WW
W.R
EGEn
ESIS
.CO
M
sA
FEtyA
PP
liC
AtiO
nC
OM
PAti
Bil
ity
lOn
gEv
ity
sAFEty:
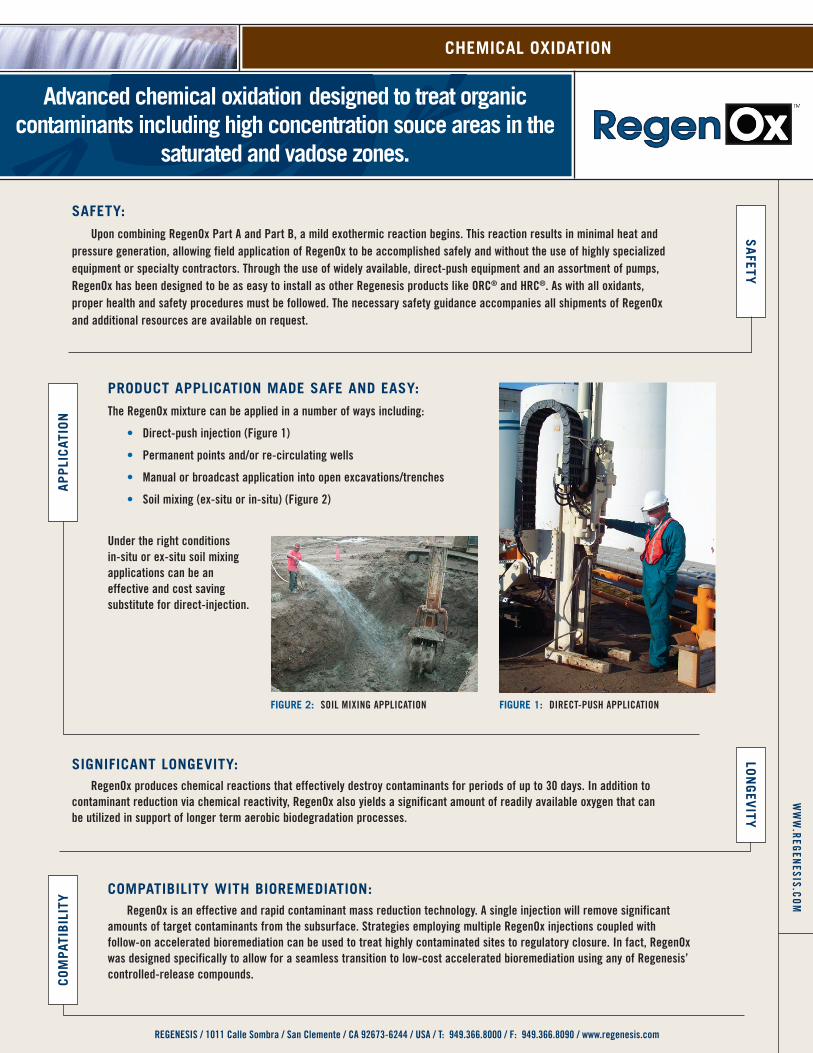
Upon combining RegenOx Part A and Part B, a mild exothermic reaction begins. This reaction results in minimal heat and pressure generation, allowing field application of RegenOx to be accomplished safely and without the use of highly specialized equipment or specialty contractors. Through the use of widely available, direct-push equipment and an assortment of pumps, RegenOx has been designed to be as easy to install as other Regenesis products like ORC® and HRC®. As with all oxidants, proper health and safety procedures must be followed. The necessary safety guidance accompanies all shipments of RegenOx and additional resources are available on request.
COMPAtiBility witH BiOREMEdiAtiOn: RegenOx is an effective and rapid contaminant mass reduction technology. A single injection will remove significant
amounts of target contaminants from the subsurface. Strategies employing multiple RegenOx injections coupled with follow-on accelerated bioremediation can be used to treat highly contaminated sites to regulatory closure. In fact, RegenOx was designed specifically to allow for a seamless transition to low-cost accelerated bioremediation using any of Regenesis’ controlled-release compounds.
signiFiCAnt lOngEvity: RegenOx produces chemical reactions that effectively destroy contaminants for periods of up to 30 days. In addition to
contaminant reduction via chemical reactivity, RegenOx also yields a significant amount of readily available oxygen that can be utilized in support of longer term aerobic biodegradation processes.
PROduCt APPliCAtiOn MAdE sAFE And EAsy:
The RegenOx mixture can be applied in a number of ways including:
• Direct-push injection (figure 1)
• Permanent points and/or re-circulating wells
• Manual or broadcast application into open excavations/trenches
• Soil mixing (ex-situ or in-situ) (figure 2)
Under the right conditions in-situ or ex-situ soil mixing applications can be an effective and cost saving substitute for direct-injection.
FiguRE 1: DIRECT-PUSH APPLICATIOnFiguRE 2: SOIL MIXInG APPLICATIOn
REGEnESIS / 1011 Calle Sombra / San Clemente / CA 92673-6244 / USA / T: 949.366.8000 / f: 949.366.8090 / www.regenesis.com
CHEMiCAl OxidAtiOn
Advanced chemical oxidation designed to treat organiccontaminants including high concentration souce areas in the
saturated and vadose zones.
WW
W.REGEnESIS.COM