Embed Size (px)
Citation preview

Loughborough UniversityInstitutional Repository
Regeneration of activatedcarbon by photocatalysisusing titanium dioxide
This item was submitted to Loughborough University's Institutional Repositoryby the/an author.
Additional Information:
• A Doctoral Thesis. Submitted in partial fulfilment of the requirementsfor the award of Doctor of Philosophy of Loughborough University.
Metadata Record: https://dspace.lboro.ac.uk/2134/19065
Publisher: c© M. Ara Carballo Meil�an
Rights: This work is made available according to the conditions of the Cre-ative Commons Attribution-NonCommercial-NoDerivatives 4.0 International(CC BY-NC-ND 4.0) licence. Full details of this licence are available at:https://creativecommons.org/licenses/by-nc-nd/4.0/
Please cite the published version.

Regeneration of Activated Carbon by
Photocatalysis using Titanium Dioxide
by
María Ara Carballo Meilán
A Doctoral Thesis submitted in partial fulfilment of the requirements
for the award of the degree of Doctor of Philosophy in Chemical
Engineering of Loughborough University
March, 2015
©M. Ara Carballo Meilán (2015)

Abstract
i
ABSTRACT
The adsorption of methylene blue onto two types of commercial activated carbons, a mesoporous
type (Norit CA1) and microporous type (207C) was analysed. Powdered TiO2 was mixed with the
carbon and added to the dye solution to determine the influence of the photocatalyst during the
adsorption process. Equilibrium and kinetics experiments were done with and without any addition
of photocatalytic titanium dioxide (TiO2). Changes in capacity, heterogeneity, and heat of adsorption
were detected and related to changes in the quantity of TiO2 added by evaluating the equilibrium
parameter from 13 isotherm models. The influence of TiO2 on the adsorption kinetics of the dye was
correlated using simplified kinetic-type model as well as mass transfer parameters. Using a formal
design of experiments approach responses such as the removal of the dye, variation of pH, external
mass transfer rate (KF) and intraparticle rate constant (Ki) were evaluated. Results indicated that
TiO2 increased the uptake of methylene blue onto CA1, increased Ki and CA1-TiO2 interactions had
electrostatic nature. In contrast, TiO2 was seen to inhibit the equilibrium adsorption for 207C by
reducing its capacity. The 207C-TiO2 interaction was attributed to a specific adsorption of TiO2 on the
coconut-based adsorbent, as zeta potential and pH measurements seemed to suggest.
The regeneration of activated carbon using UV-C/TiO2 heterogeneous photocatalysis in a novel bell
photocatalytic reactor, and in a standard-type coiled-tube photoreactor was also studied. Initially,
response surface methodology was applied to finding the optimum conditions for the mineralization
of methylene blue in both reactors using methylene blue as model compound and TiO2 as
photocatalyst performing direct photocatalytic decolourization. Methylene blue concentration, TiO2
concentration and pH were the variables under study. Complete mineralization of the dye was
achieved in the coiled-tube reactor using 3.07 mg/L of methylene blue at pH 6.5 with 0.4149 g/L
TiO2. The regeneration experiments in the coiled-tube photoreactor were done using One Variable
at Time (OVAT) method. The effect of the mass of TiO2 was the only studied variable. The study
indicated an increase in regeneration of CA1 and a decrease in the pH during the oxidation step at
higher concentration of the photocatalyst. In the case of the regeneration of 207C, the addition of
TiO2 lowered the regeneration and made the suspension more basic during the photocatalytic step.
However these results were not statistically significant. Experiments using the bell photoreactor
were performed applying the same response surface method used in direct photocatalytic
decolourization (control). The variables under study were pH, concentration of dye-saturated carbon
and TiO2 concentration. The regeneration percentage was the chosen response. Low regeneration
percentages were achieved (maximum 63%), and significant differences (95% confidence interval)
were found between the regeneration of the activated carbons, being higher in the case of
powdered CA1 as compared with granular 207C.

Acknowledgements
ii
ACKNOWLEDGEMENTS
I would like to give my special thanks to the following people who have helped me to undertake this rigorous academic program during my 4 years at Loughborough. This thesis would have remained a dream had it not been for them. I would like, first and foremost, to express my sincere appreciation to my supervisor, Dr. Gilbert Shama, for his enduring commitment to quality education and engineering research. Without his guidance and persistent help this thesis would not have been possible. I also want to express my indebtedness to him for giving me the opportunity to do this PhD. I share the credit of my work with Graham Moody for his frequent technical help and advice during day to day operations. It was a pleasure to work with him. I am also deeply grateful to Jim Muddimer for his commitment to this project. Special thanks go to Dave Smith and Monika Pietrzak for their insightful comments and suggestions. I cannot find words to express my gratitude to Rob Bentham, always willing to help, without a doubt a key part in my research. I owe thanks to Sean Creedon and Kim Robertshaw; their assistance during laboratory work of this project is also appreciated. I must also thank to the mechanical workshop technicians, Steve and Mark. Other people who were an important part of this project include Ali Saleemi who spent long hours supporting me. Lastly, I owe thanks to the Chemical Engineering Department of Loughborough University for its financial support. I am forever grateful for the knowledge learned and friendships gained and wish best of luck to all the people who were involved at some point during my PhD in their future endeavours.

iii
This thesis is dedicated to my grandmother for all the inspiration and support

Table of Contents
iv
TABLE OF CONTENTS
Abstract .................................................................................................................................................... i
Acknowledgements ................................................................................................................................. ii
Table of Contents ................................................................................................................................... iv
List of Figures ....................................................................................................................................... viii
List of Tables .........................................................................................................................................xiv
List of Appendix Figures ....................................................................................................................... xvii
List of Appendix Tables ....................................................................................................................... xviii
1 INTRODUCTION ............................................................................................................................... 1
1.1 Background ............................................................................................................................. 1
1.2 Research Aims and Objectives ................................................................................................ 2
1.3 Research Methodology ........................................................................................................... 3
1.4 Structure of the Thesis ............................................................................................................ 3
2 LITERATURE REVIEW ....................................................................................................................... 6
2.1 Activated carbon adsorption and traditional regeneration methods .................................... 6
2.1.1 Thermal swing regeneration process .............................................................................. 9
2.1.2 Financial and environmental cost of carbon adsorption and regeneration ................. 12
2.1.3 Alternative regeneration methods ............................................................................... 14
2.2 Regeneration by Advanced Oxidation Technologies ............................................................ 15
2.2.1 Advanced Oxidation Technologies ................................................................................ 15
2.2.2 Photocatalytic reactors ................................................................................................. 17
2.2.3 Regeneration by UV/TiO2 heterogeneous photocatalysis ............................................ 25
2.2.4 Factors that contribute to desorption of the pollutant ................................................ 31
2.3 Adsorption Process ............................................................................................................... 32
2.3.1 Structure of an activated carbon .................................................................................. 32
2.3.2 Adsorption Equilibrium ................................................................................................. 33
2.3.3 Adsorption kinetics ....................................................................................................... 44

Table of Contents
v
2.4 Summary ............................................................................................................................... 49
3 MATERIALS AND METHODS .......................................................................................................... 51
3.1 Materials ............................................................................................................................... 51
3.2 Analytical Instrumentation ................................................................................................... 51
3.3 Adsorption Experiments ....................................................................................................... 52
3.3.1 Adsorption Isotherms ................................................................................................... 52
3.3.2 Surface charge ............................................................................................................... 54
3.3.3 Adsorption Kinetics ....................................................................................................... 56
3.3.4 Statistical analysis ......................................................................................................... 59
3.4 Regeneration of Activated Carbon in a Bell Photocatalytic Reactor .................................... 59
3.4.1 The bell photocatalytic reactor ..................................................................................... 59
3.4.2 Regeneration process ................................................................................................... 63
3.5 Regeneration of Activated Carbon in a Coiled-Tube Photocatalytic Reactor ....................... 64
3.5.1 The coiled-tube photocatalytic reactor ........................................................................ 64
3.5.2 Regeneration process ................................................................................................... 66
3.6 Carbon characterization ........................................................................................................ 66
3.7 Summary ............................................................................................................................... 67
4 CHARACTERIZATION OF ACTIVATED CARBON .............................................................................. 69
4.1 Calibration curve ................................................................................................................... 69
4.2 Surface Area and Porous Structure ....................................................................................... 73
4.3 Particle size distribution ........................................................................................................ 76
4.4 Surface chemistry by ATR ..................................................................................................... 78
4.5 Summary ............................................................................................................................... 84
5 ADSORPTION EQUILIBRIUM OF METHYLENE BLUE ONTO ACTIVATED CARBON AND ONTO TiO2-
ACTIVATED CARBON MIXTURE ............................................................................................................. 85
5.1 Introduction .......................................................................................................................... 85
5.2 Results and Discussion .......................................................................................................... 85
5.2.1 Eureqa versus Solver ..................................................................................................... 86

Table of Contents
vi
5.2.2 Equilibrium versus pseudo-equilibrium conditions ...................................................... 86
5.2.3 Model fit ........................................................................................................................ 88
5.2.4 Influence of TiO2 on the adsorption of methylene blue onto TiO2-Activated carbon
mixture under pseudo-equilibrium conditions ........................................................................... 100
5.3 Summary ............................................................................................................................. 128
6 ADSORPTION KINETICS OF METHYLENE BLUE ONTO TiO2-ACTIVATED CARBON MIXTURE ....... 130
6.1 Introduction ........................................................................................................................ 130
6.2 Results and Discussion ........................................................................................................ 130
6.2.1 Power and sample size ................................................................................................ 130
6.2.2 Fractional factorial design ........................................................................................... 134
6.2.3 Full factorial design ..................................................................................................... 140
6.3 Summary ............................................................................................................................. 154
7 REGENERATION OF ACTIVATED CARBON IN A PHOTOCATALYTIC REACTOR ............................. 156
7.1 Introduction ........................................................................................................................ 156
7.2 Results ................................................................................................................................. 156
7.2.1 Performance of the coiled-tube and bell photocatalytic reactors ............................. 156
7.2.2 Regeneration of activated carbon using TiO2 photocatalysis ..................................... 171
7.3 Performance Comparison between control and regeneration experiments: Does a synergy
exist between carbon and semiconductor during the photocatalytic process? ............................ 176
7.4 ATR analysis of the regenerated carbon ............................................................................. 179
7.5 Summary ............................................................................................................................. 188
8 CONCLUSIONS AND FUTURE WORK ........................................................................................... 190
8.1 Discussion of the principal findings .................................................................................... 190
8.2 Limitations of the study ...................................................................................................... 194
8.3 Recommendations for future work .................................................................................... 195
References .......................................................................................................................................... 197
Appendix A BIBLIOGRAPHIC MAPPING STUDY ............................................................................... 215
Appendix A.1 Introduction ........................................................................................................ 215

Table of Contents
vii
Appendix A.2 Document Citation Network ............................................................................... 216
Appendix A.2.1 Network centrality measures ......................................................................... 217
Appendix A.3 Document Co-citation Network .......................................................................... 218
Appendix A.3.1 Clusters level 1 (resolution 1.5) ...................................................................... 221
Appendix A.3.2 Clusters level 1 (resolution 1.0) ...................................................................... 222
Appendix A.3.3 MST pathfinder ............................................................................................... 226
Appendix B ADDITIONAL TABLES ................................................................................................... 229

List of Figures
viii
LIST OF FIGURES
Figure 2-1 Types of intermolecular forces or van der Waals forces: (a) Polar molecules orient toward
cation (Ion-dipole forces), (b) Polar molecules attract one another (dipole-dipole forces), (c)
Nonpolar molecules attract one another as a result of short-lived dipoles (London dispersion forces),
and (d) Hydrogen bond. Adapted from McMurry and Fay (2004) ......................................................... 7
Figure 2-2 Basic configuration of a thermal swing regeneration process, simplified drawing from
Thomas and Crittenden (1998) ............................................................................................................. 11
Figure 2-3 Effect of activation and reactivation on precursor and spent activated carbon respectively,
from McLaughlin (2005) ........................................................................................................................ 12
Figure 2-4 Band gap model mechanism ................................................................................................ 16
Figure 2-5 Slurry annular photocatalytic reactor, redrawn from Oppenländer (2003), Lasa et al.
(2005) .................................................................................................................................................... 20
Figure 2-6 Slurry photocatalytic membrane reactor, redrawn from Mozia (2010), Mendret et al.
(2013) .................................................................................................................................................... 21
Figure 2-7 Swirl flow photocatalytic reactor, redrawn from Ray and Beenackers (1997) .................... 22
Figure 2-8 Fluidized bed photocatalytic reactor, redrawn from Imoberdorf et al. (2008), McCullagh et
al. (2011) ............................................................................................................................................... 22
Figure 2-9 Packed bed photocatalytic reactor with TiO2 supported on SiO2 beads, redrawn from Ida
et al. (2014) ........................................................................................................................................... 23
Figure 2-10 Inclined flat bed photocatalytic reactor, redrawn from Fathinia and Khataee (2013) ..... 24
Figure 2-11 Tube light photocatalytic reactor, redrawn from Mukherjee and Ray (1999) .................. 25
Figure 2-12 Document Citation Network at Resolution = 1.0 showing three major cluster: TiO2/AC,
Fenton/AC and Ozonation/AC, where AC denotes activated carbon ................................................... 26
Figure 2-13 (A) Single graphene layer, non-planar, with vacancies, and with five- and seven-
membered rings; and (B) one of the most general accepted models of the structure of an activated
carbon, with curved graphene layers, and empty space known as porosity filled with methylene blue
(MB) molecules, adapted from Marsh and Rodríguez-Reinoso (2006) ................................................ 33
Figure 2-14 Diagram of molecules of difference sizes adsorbed onto the pore system of the carbon
material (left), and a three layer molecules (N=3) on the carbon surface (right), adapted from
Bandosz (2006)...................................................................................................................................... 34
Figure 2-15 Schematic representation of a flat adsorbed specie (left) and a vertically oriented specie
(right) on the adsorbent surface ........................................................................................................... 42
Figure 2-16 Types of adsorption isotherms, redrawn from Bansal and Goyal (2005) .......................... 43

List of Figures
ix
Figure 3-1 Effect of the filter on the methylene blue initial concentration (mg/L) during sample
filtration ................................................................................................................................................ 53
Figure 3-2 Replicated isotherm region from adsorption equilibrium experiments .............................. 54
Figure 3-3 Image of water bell. ............................................................................................................. 60
Figure 3-4 Nozzle from the bell photocatalytic reactor used to generate the water bell. Reprinted
from Shama (1992) ............................................................................................................................... 60
Figure 3-5 Process flow diagram of bell photocatalytic reactor in batch configuration ...................... 61
Figure 3-6 Schematic of coiled-tube photocatalytic reactor ................................................................ 65
Figure 4-1 UV-Vis spectrum of pure methylene blue aqueous solution from 0 to 160 mg/L between
450 and 750 nm. The response of the instrument saturates at high concentration range ................. 71
Figure 4-2 Residuals randomly distributed about zero in the low concentration range calibration
model. ................................................................................................................................................... 72
Figure 4-3 Residuals randomly distributed about zero in the high concentration range calibration
model .................................................................................................................................................... 73
Figure 4-4 N2 adsorption-desorption isotherm at 77 K on (A) Norit CA1 and (B) 207C activated
carbons .................................................................................................................................................. 75
Figure 4-5 Incremental pore size distribution of (A), (B) Norit CA1 and (C), (D) 207C activated carbons
calculated from BJH model. .................................................................................................................. 75
Figure 4-6 Porous texture characteristics of TiO2 photocatalyst: (A) N2 adsorption-desorption
isotherm at 77 K on TiO2, (B) Pore area distribution by BJH model and (C) Pore volume distribution by
BJH model ............................................................................................................................................. 76
Figure 4-7 Particle size distribution curves of aqueous aggregates size for samples 207C, CA1 and
TiO2 as obtained by laser scattering ..................................................................................................... 77
Figure 4-8 pH at the point of zero charge (pHPZC) of the surface for activated carbons and TiO2
photocatalyst ........................................................................................................................................ 78
Figure 4-9 Acid (carboxyl, phenol, lactol, lactone) and basic (chromene, ketone, pyrone) groups in an
activated carbon, redrawn from Newcombe and Dixon (2006) ........................................................... 80
Figure 4-10 ATR spectra of (A) CA1 and (B) 207C between the range 4000 to 440 cm-1 .................... 81
Figure 4-11 Molecular structure of methylene blue ............................................................................. 82
Figure 4-12 ATR spectra of methylene blue (MB) and TiO2 between the range 4000 to 2400 cm-1 .... 83
Figure 4-13 ATR spectra of methylene blue (MB) and TiO2 between the range 1800 to 440 cm-1 ...... 83
Figure 5-1 Isotherm under pseudo-equilibrium conditions (60 min) for CA1 and 207C; Ce is the
equilibrium liquid phase concentration of methylene blue (mg/L) and Qe is the amount of dye in the
activated carbon at equilibrium (mg/g) ................................................................................................ 87

List of Figures
x
Figure 5-2 Isotherm under equilibrium conditions (18 hours) for 207C and CA1; Ce is the equilibrium
liquid phase concentration of methylene blue (mg/L) and Qe is the amount of dye in the activated
carbon at equilibrium (mg/g) ................................................................................................................ 87
Figure 5-3 Adsorption isotherms of methylene blue on 207C and CA1: comparison of the equilibrium
isotherm obtained after 18 h contact with pseudo-equilibrium isotherm at 1 h contact time; Ce is the
equilibrium liquid phase concentration of methylene blue (mg/L) and Qe is the amount of dye in the
activated carbon at equilibrium (mg/g) ................................................................................................ 88
Figure 5-4 BET-2, Redlich-Peterson and Radke-Prausnitz isotherm fit (carbon-dye case) ................... 95
Figure 5-5 Dubinin-Astakhov, Hill and Koble-Corrigan isotherm fit (carbon-dye case) ........................ 95
Figure 5-6 BET-2, Redlich-Peterson and Radke-Prausnitz isotherm fit (TiO2-CA1-dye case) ................ 96
Figure 5-7 Dubinin-Astakhov, Hill and Koble-Corrigan isotherm fit (TiO2-CA1-dye case) ..................... 96
Figure 5-8 BET-2, Redlich-Peterson and Radke-Prausnitz isotherm fit (TiO2-207C-dye case) .............. 97
Figure 5-9 Dubinin-Astakhov, Hill and Koble-Corrigan isotherm fit (TiO2-207C-dye case) ................... 97
Figure 5-10 Equilibrium versus pseudo-equilibrium parameters comparison from Dubinin-Astakhov
and BET-2 models (CA1) ........................................................................................................................ 98
Figure 5-11 Equilibrium versus pseudo-equilibrium parameters comparison from Dubinin-Astakhov
and BET-2 models (207C) ...................................................................................................................... 98
Figure 5-12 Comparison of Hill and Koble-Corrigan isotherm parameters from pseudo-equilibrium
and equilibrium (CA1) ........................................................................................................................... 99
Figure 5-13 Comparison of Hill and Koble-Corrigan isotherm parameters from pseudo-equilibrium
and equilibrium (207C) ......................................................................................................................... 99
Figure 5-14 Adsorption capacity changes with a mass ratio (R) TiO2/adsorbent of 0.0, 0.25, 0.50, 1.0
and 1.75 from BET-2, Freundlich, Radke-Prausnitz and Redlich-Peterson isotherm models ............. 104
Figure 5-15 (A) Variation of the adsorption potential A with the coverage, and (B) Characteristic
energy E as a function of R (i.e., the mass ratio TiO2 /adsorbent), calculated from the Dubinin-
Astakhov isotherm .............................................................................................................................. 108
Figure 5-16 Influence of TiO2 in the heat of adsorption using the dimensionless parameter K (KS/KL)
from BET-2 isotherm. R is the mass ratio TiO2 /adsorbent ................................................................. 108
Figure 5-17 Heterogeneity parameter from Koble-Corrigan isotherm versus mass of TiO2 (R is the
mass ratio TiO2/adsorbent) ................................................................................................................. 110
Figure 5-18 Dubinin-Astakhov parameters changes with TIO2 mass (CA1). R is the mass ratio TiO2
/CA1 .................................................................................................................................................... 111
Figure 5-19 Dubinin-Astakhov parameters changes with TIO2 mass (207C). R is the mass ratio TiO2
/207C ................................................................................................................................................... 111

List of Figures
xi
Figure 5-20 Hill parameter changes with the addition of TiO2 (CA1) , R is the mass ratio TiO2 /CA1. 112
Figure 5-21 Hill parameter changes with the addition of TiO2 (207C), R is the mass ratio between TiO2
/207C ................................................................................................................................................... 112
Figure 5-22 Scatterplot C0 versus zeta at different mass of TiO2 ........................................................ 115
Figure 5-23 Scatterplot R (TiO2/carbon mass ratio) versus pH and mean particle size at different C0
(CA1) .................................................................................................................................................... 115
Figure 5-24 Scatterplot R (TiO2/carbon mass ratio) versus pH and mean particle size at different C0
(207C) .................................................................................................................................................. 116
Figure 5-25 Surface charge of adsorbate (Methylene blue, MB), adsorbents (CA1, 207C) and
photocatalyst (TiO2) during equilibrium adsorption experiments, based on the point of zero charge
(pHPZC) of the carbons, and pKa of the dye .......................................................................................... 116
Figure 5-26 Power curve for 2-level factorial design in Var-pH CA1 adsorption analysis (MB =
methylene blue) .................................................................................................................................. 119
Figure 5-27 Power curve for 2-level factorial design in Var-pH 207C adsorption analysis (MB =
methylene blue) .................................................................................................................................. 119
Figure 5-28 Pareto charts of the standardized effects for both carbons ........................................... 120
Figure 5-29 Contour plot of Var-pH for both carbons in response surface analysis .......................... 120
Figure 5-30 Main effects and interaction plots for Var-pH in full factorial analysis ........................... 121
Figure 5-31 Surface charge of CA1 and 207C adsorbents, and TiO2 photocatalyst during Carbon-TiO2
experiments, based on the point of zero charge (pHPZC) of TiO2 and both carbons ........................... 123
Figure 5-32 Zeta and pH variations of TiO2-carbon mixture as a function of R (i.e., the TiO2/adsorbent
mass ratio) and classified by the type of carbon at natural pH carbon (View I) ................................. 124
Figure 5-33 Zeta and pH variations of TiO2-carbon mixture as a function of R (i.e., the TiO2/adsorbent
mass ratio) and classified by the type of carbon at natural pH (View II) ............................................ 124
Figure 5-34 Zeata potential and mean particle size variations as a function of the mass of TiO2 (R =
TiO2/carbon) in CA1 analysis ............................................................................................................... 126
Figure 5-35 PSD (from left to right) of raw CA1, various TiO2-CA1 mixtures and raw TiO2 suspension in
deionized water .................................................................................................................................. 126
Figure 6-1 Power curves from (A) Decolouration response in Fractional Factorial, (B) Decolouration
response in Full Factorial 207C, (C) Decolouration response in Full Factorial CA1, (D) pH variation in
Full Factorial 207C (MB = methylene blue) ......................................................................................... 132
Figure 6-2 Power curves from (E) Kf response in Full Factorial CA1, (F) Kf response in Full Factorial
207C, (G) Ki response in Full Factorial CA1, (H) Ki response in Full Factorial 207C (MB = methylene
blue) .................................................................................................................................................... 133

List of Figures
xii
Figure 6-3 Residual plot from response % Decolouration (Fractional Factorial) ................................ 136
Figure 6-4 Normal plot of the standardized effects in % Decolouration study (Fractional Factorial) 136
Figure 6-5 Pareto chart of the standardized effects in % Decolouration study (Fractional Factorial) 137
Figure 6-6 Main effect plot for % Decolouration response (Fractional Factorial) .............................. 138
Figure 6-7 Interaction plot for % Decolouration response (Fractional Factorial) ............................... 139
Figure 6-8 Normal plot of the standardized effects (Full factorial CA1 and 207C) ............................. 142
Figure 6-9 Pareto chart of the standardized effects (Full factorial CA1 and 207C) ............................ 142
Figure 6-10 Main effect plots for Johnson_Decoloration in CA1 (Full Factorial) ................................ 143
Figure 6-11 Interaction plots for Johnson_Decoloration in CA1 (Full Factorial)................................. 143
Figure 6-12 Main effect plots for Johnson_Decoloration in 207C (Full Factorial) .............................. 144
Figure 6-13 Interaction plots for Johnson_Decoloration in 207C (Full Factorial) ............................... 144
Figure 6-14 Normal and Pareto plot of the standardized effects in pH variation response (207C) ... 146
Figure 6-15 Main effects plot for pH variation in 207C ...................................................................... 146
Figure 6-16 Interaction plot for pH variation in 207C ......................................................................... 147
Figure 6-17 Normal and Pareto plots from Kf response in CA1 and 207C .......................................... 149
Figure 6-18 Main effects and interaction plots from Kf response in CA1 and 207C........................... 150
Figure 6-19 Full Factorial Ki response in CA1 ...................................................................................... 152
Figure 6-20 Full Factorial Ki response in 207C .................................................................................... 153
Figure 7-1 Power curve for 2-level factorial design in bell TiO2-dye photocatalysis factorial design . 157
Figure 7-2 Power curve for 2-level factorial design in coiled-tube TiO2-dye photocatalysis factorial
design .................................................................................................................................................. 157
Figure 7-3 Residuals plots for methylene blue Mineralization in the coiled-tube photoreactor ....... 159
Figure 7-4 Contour and surface plots of methylene blue mineralization in the coiled-tube
photoreactor ....................................................................................................................................... 160
Figure 7-5 Residual plot for JonnsonMineralization in TiO2-dye photocatalysis (bell photoreactor) 161
Figure 7-6 Probability distribution plot of mineralization data in the coiled-tube photoreactor ...... 163
Figure 7-7 Probability distribution plot of mineralization data in the bell photoreactor ................... 163
Figure 7-8 Pie chart of area (%) from probability distribution plot results ........................................ 164
Figure 7-9 Probability plot of mineralization data from the bell photoreactor .................................. 165
Figure 7-10 Run sequence plot of mineralization response from bell and coiled-tube photoreactors
............................................................................................................................................................ 165
Figure 7-11 Summary report of two-Sample t-test for the mean of bell and coiled-tube photoreactors
............................................................................................................................................................ 167

List of Figures
xiii
Figure 7-12 Summary report of two-sample standard deviation test based on Levene/Brown-
Forsythe test for bell and coiled-tube photoreactors......................................................................... 168
Figure 7-13 AFDM summary output: (A) Scatterplot of factor 1 versus factor 2 labelled by
photoreactor type, (B) Correlation scatterplot of factor 1 versus factor 2 showing the quantitative
variables, (C) Squared correlation table and (D) the correlation table with the quantitative variables.
............................................................................................................................................................ 170
Figure 7-14 Pareto chart of the standardized effects from Full factorial of the CA1 regeneration in
bell photocatalytic reactor .................................................................................................................. 172
Figure 7-15 Contour plot of CA1 regeneration in the bell photoreactor ............................................ 173
Figure 7-16 Contour plot of Var-pH in 207C regeneration using the bell reactor .............................. 174
Figure 7-17 Surface plot of Var-pH in 207C regeneration using the bell reactor ............................... 174
Figure 7-18 Scatterplot of Regeneration (%) and changes in pH during irradiation at a pH = 5.75 in the
coiled-tube photoreactor. Each point represents the average value of two repetitions. .................. 175
Figure 7-19 Interval plot (95 % CI for the Mean) for (A) Mineralization comparison in both
photoreactors, (B) 𝑚𝑔 𝑀𝐵𝑔 𝑇𝑖𝑂2 comparison in both photoreactors, (C) Regeneration (%)
comparison in the bell photoreactor, (D) Activated carbon regeneration comparison in terms of
𝑚𝑔 𝑀𝐵𝑔 𝑇𝑖𝑂2 from the bell photoreactor at pH=5.75, (E) Regeneration (%) comparison in the
coiled-tube photoreactor (pH=5.75), (F) Activated carbon regeneration comparison in terms of
𝑚𝑔 𝑀𝐵𝑔 𝑇𝑖𝑂2 in the coiled-tube photoreactor (pH=5.75). .............................................................. 176
Figure 7-20 Interval plot of CA1 and 207C regeneration at different pHs .......................................... 178
Figure 7-21 Regenerated CA1 (with TiO2) in Coiled-tube (R=0.5 and 1.75) and Bell reactors (R=62.85)
at pH=5.75 ........................................................................................................................................... 181
Figure 7-22 Regenerated 207C (with TiO2) in Coiled-tube reactor at pH=5.75 .................................. 183
Figure 7-23 Regenerated 207C (with TiO2) in Bell reactor at pH=5. ................................................... 183
Figure 7-24 Regenerated 207C (with TiO2) in Bell reactor at pH=8.5 ................................................. 184
Figure 7-25 Regenerated 207C (with TiO2) in Bell reactor at R=10.0 ................................................. 184
Figure 7-26 Regenerated CA1 (with TiO2) in Bell reactor at pH=8.5 between 4000 and 2400 cm-1 ... 185
Figure 7-27 Regenerated CA1 (with TiO2) in Bell reactor at pH=8.5 between 1800 and 900 cm-1 ..... 185
Figure 7-28 Regenerated CA1 (with TiO2) in Bell reactor at R=10.0 between 4000 and 2400 cm-1 ... 186
Figure 7-29 Regenerated CA1 (with TiO2) in Bell reactor at R=10.0 between 1800 and 900 cm-1 ..... 186
Figure 7-30 CA1 and TiO2 mixture and comparison with raw solids between 4000 and 2400 cm-1 .. 187
Figure 7-31 CA1 and TiO2 mixture and comparison with raw solids between 1800 and 440 cm-1 .... 187

List of Tables
xiv
LIST OF TABLES
Table 2-1. Comparison of the three main kinds of photocatalitic reactor configurations. Summarized
from Chong et al. (2010), Mozia (2010) ................................................................................................ 19
Table 2-2 Summary of experimental conditions (oxidation step) from literature. Activated carbon
regeneration including number of cycles and regeneration percentage (“Reg.”) using Fenton,
H2O2/UV and Na2S2O8/H2O2 .................................................................................................................. 28
Table 2-3 Summary of experimental conditions (oxidation step) from literature. Activated carbon
regeneration including number of cycles and regeneration percentage (“Reg.”) using TiO2/UV ........ 29
Table 2-4 Classification of methylene blue equilibrium adsorption experiments using activated
carbon (AC) ........................................................................................................................................... 36
Table 2-5 Simplified kinetic models (Kannan and Sundaram, 2001; Yuh-Shan, 2004) ......................... 45
Table 2-6 Principal diffusion equations ................................................................................................ 46
Table 3-1 Experimental variables for the analysis of pH and surface charge where Var-pH denotes the
change in pH before and after adsorption, and D[4,3] is the mean diameter by volume ................... 54
Table 3-2 Experimental factors in coded and uncoded units from central composite design (Rotatable
design) with Var-pH as response .......................................................................................................... 55
Table 3-3 Detail of assigned level values in each variable from DOE 1 ................................................ 57
Table 3-4 Detail of assigned level values in each variable from DOE 2 and 3 ...................................... 58
Table 3-5 Detail of assigned level values in each variable from DOE 4 and 5 ...................................... 58
Table 3-6 Experimental domain and levels from central composite design in TiO2-dye photocatalysis
from bell photoreactor (mineralization as response) ........................................................................... 62
Table 3-7 Experimental domain and levels from central composite design in activated carbon
regeneration by UV-C/TiO2 photocatalysis (Rotatable design), Response: Regeneration ................... 63
Table 3-8 Experimental domain and levels from central composite design in TiO2-dye photocatalysis
from coiled-tube photoreactor (mineralization as response) .............................................................. 65
Table 4-1 Regression coefficients and optimization criteria of the multiple linear regression model
(std = standard deviation, [MB] = methylene blue concentration and PC = Principal component) ..... 70
Table 4-2 IUPAC classification of pore sizes in a porous material ........................................................ 73
Table 4-3 Pore characteristics of CA1 and 207C as obtained by N2 adsorption/desorption studies .... 74
Table 4-4 Volume mean diameter (D[4, 3]), volume median diameter (D50) and percentile distribution
values D10 and D90 in µm units .............................................................................................................. 77
Table 4-5 Norit CA1 and 207C characteristics....................................................................................... 79
Table 4-6 Peak position and interpretation for activated carbon ........................................................ 82

List of Tables
xv
Table 5-1 Ranking of the best fit model (comparison across isotherms). Threshold criteria was based
on MAE and R2 values ........................................................................................................................... 89
Table 5-2 Hill, Koble-Corrigan and Redlich-Peterson model parameters, R2 and MAE for the
equilibrium adsorption for the equilibrium and pseudo-equilibrium adsorption of methylene blue
onto Norit CA1 and onto 207C activated carbons ................................................................................ 90
Table 5-3 BET-2, Dubinin-Astakhov and Radke-Prausnitz model parameters, R2 and MAE for the
equilibrium adsorption for the equilibrium and pseudo-equilibrium adsorption of methylene blue
onto Norit CA1 and onto 207C activated carbons ................................................................................ 92
Table 5-4 Parameters from Dubinin-Astakhov isotherm model found in the literature for the
adsorption of several adsorbates onto activated carbon (AC) ............................................................. 93
Table 5-5 Hill model parameters, R2 and MAE for the pseudo-equilibrium adsorption of methylene
blue onto CA1 and onto 207C under the influence of TiO2 ................................................................ 100
Table 5-6 BET-2 model parameters, R2 and MAE for the pseudo-equilibrium adsorption of methylene
blue onto CA1 and onto 207C under the influence of TiO2 ................................................................ 101
Table 5-7 Koble-Corrigan model parameters, R2 and MAE for the pseudo-equilibrium adsorption of
methylene blue onto CA1 and onto 207C under the influence of TiO2 .............................................. 101
Table 5-8 Dubinin-Astakhov model parameters, R2 and MAE for the pseudo-equilibrium adsorption
of methylene blue onto CA1 and onto 207C under the influence of TiO2 .......................................... 102
Table 5-9 Redlich-Peterson model parameters, R2 and MAE for the pseudo-equilibrium adsorption of
methylene blue onto CA1 and onto 207C under the influence of TiO2 .............................................. 102
Table 5-10 Radke-Prausnitz model parameters, R2 and MAE for the pseudo-equilibrium adsorption of
methylene blue onto CA1 and onto 207C under the influence of TiO2 .............................................. 103
Table 5-11 Surface area covered by methylene blue based on several dye molecule orientations (flat,
edge-on, end-on, inclined and aggregated). Case of CA1 adsorption, adapted from Qi et al. (2011)105
Table 5-12 Surface area covered by methylene blue based on several dye molecule orientations (flat,
edge-on, end-on, inclined and aggregated). Case of 207C adsorption, adapted from Qi et al. (2011)
............................................................................................................................................................ 105
Table 5-13 Adsorption capacity from BET-2 isotherm model of CA1 and 207C, R is the TiO2/adsorbent
mass ratio ............................................................................................................................................ 106
Table 5-14 BET surface area from porosimetry analysis .................................................................... 106
Table 5-15 Correlation Matrix for 207C from pseudo-equilibrium experiments (MB-carbon-TiO2) .. 113
Table 5-16 Correlation Matrix for CA1 from pseudo-equilibrium experiments (MB-carbon-TiO2) .... 113
Table 5-17 VarClus analysis for pseudo-equilibrium data .................................................................. 114
Table 5-18 Power in 2-level full factorial design. Response: Var-pH .................................................. 117

List of Tables
xvi
Table 6-1 Model reduction results in fractional factorial design. Response: Decolouration ............. 135
Table 6-2 Comparison of best setting across design in exploratory analysis ..................................... 140
Table 6-3 Model reduction results in full factorial design (best fit in italic). Response: Decolouration
............................................................................................................................................................ 141
Table 6-4 External mass transfer coefficients examples of several dye-carbon systems ................... 148
Table 6-5 Ki values from literature for several dyes and adsorbents ................................................. 154
Table 7-1 T-test (unequal variance) for bell and coiled-tube photoreactors ..................................... 169

List of Appendix Figures
xvii
LIST OF APPENDIX FIGURES
Figure A-1 Document citation representation .................................................................................... 215
Figure A-2 Document Citation Network showing only nodes with out-degree higher than zero
(Resolution = 1.0) ................................................................................................................................ 217
Figure A-3 Size Distribution in community detection from document co-citation (DCC) network
(Resolution = 1.5) ................................................................................................................................ 219
Figure A-4 Size Distribution in community detection from document co-citation (DCC) network
(Resolution = 1.0) ................................................................................................................................ 221
Figure A-5 Cluster 1 (Level 1) with resolution = 1.5 from document co-citation (DCC) network ....... 222
Figure A-6 Cluster 1 (Level 1) with resolution = 1.0 from document co-citation (DCC) network ....... 223
Figure A-7 Cluster 1 (Level 2) with resolution = 1.0 from document co-citation (DCC) network ....... 224
Figure A-8 Cluster 2 (Level 2) with resolution = 1.0 from document co-citation (DCC) network ....... 225
Figure A-9 Cluster 3 (Level 2) with resolution = 1.0 from document co-citation (DCC) network ....... 225
Figure A-10 Cluster 4 (Level 2) with resolution = 1.0 from document co-citation (DCC) network ..... 225
Figure A-11 Cluster 5 (Level 2) with resolution = 1.0 from document co-citation (DCC) network ..... 226
Figure A-12 Cluster 6 (Level 2) with resolution = 1.0 from document co-citation (DCC) network ..... 226
Figure A-13 Document Co-citation network pruned by pathfinder network scaling algorithm ........ 227

List of Appendix Tables
xviii
LIST OF APPENDIX TABLES
Table A-1 Network centrality measures in document citation network ............................................ 218
Table A-2 General characteristics from document citation (DC) and document co-citation (DCC)
networks and their pruning graphs .................................................................................................... 219
Table A-3 Output data clusterization from document co-citation (DCC) network (Level 1). AC stands
for Activated Carbon ........................................................................................................................... 220
Table A-4 Ten most relevant articles based on the overall document co-citation (DCC) network .... 228
Table B-1 Session window output from Minitab of full factorial design. Response: Var-pH ............. 229
Table B-2 Session output from Minitab of the response surface regression. Response: Var-pH ....... 230
Table B-3 Session window output from experimental design and power calculation in (A)
Decolouration response Fractional Factorial, (B) Decolouration response Full Factorial 207C, (C)
Decolouration response Full Factorial CA1, (D) pH variation Full Factorial 207C ............................... 231
Table B-4 Session window output from experimental design and power calculation in (E) Kf response
Full Factorial CA1, (F) Kf response Full Factorial 207C, (G) Ki response Full Factorial CA1, (H) Ki
response Full Factorial 207C ............................................................................................................... 232
Table B-5 Full model fit in the fractional factorial design. Response: Decolouration ........................ 233
Table B-6 Session window output from Minitab of the best reduced model in the fractional factorial
design. Response: Decolouration ....................................................................................................... 234
Table B-7 Session window output from Minitab of the best reduced model in the full factorial design
of CA1 and 207C. Response: Decolouration ....................................................................................... 235
Table B-8 Session window output from Minitab of the best reduced model in full factorial. Response:
Var-pH ................................................................................................................................................. 236
Table B-9 Session window output from Minitab of the best reduced model in full factorial. Response:
Kf ......................................................................................................................................................... 237
Table B-10 Session window output from Minitab of the best reduced model in full factorial.
Response: Ki ........................................................................................................................................ 238
Table B-11 Summary of the main findings from Fractional Factorial Design in Chapter 6 ................. 239
Table B-12 Summary of the main findings from Full Factorial Design in Chapter 6 ........................... 240
Table B-13 Power and sample size of the factorial design in (A) bell TiO2-dye photocatalysis and (B)
coiled-tube TiO2-dye photocatalysis ................................................................................................... 241
Table B-14 Response surface regression from TiO2-dye photocatalysis in the coiled-tube
photoreactor ....................................................................................................................................... 241
Table B-15 Session window output from Minitab in response surface regression. Response:
Transformed mineralization response (Johnson transformation) in the bell photoreactor .............. 242

List of Appendix Tables
xix
Table B-16 Distribution identification for mineralization in the coiled-tube photoreactor ............... 243
Table B-17 Distribution identification for mineralization in the bell photoreactor............................ 244
Table B-18 Reduced linear model of CA1 regeneration in the bell photoreactor .............................. 245
Table B-19 Session output window of the response surface regression from CA1 regeneration in the
bell reactor. Response: Var-pH ........................................................................................................... 245
Table B-20 Session output window of the response surface regression from 207C regeneration in the
bell reactor. Response: Var-pH ........................................................................................................... 246

Chapter 1. Introduction
1
1 INTRODUCTION
1.1 Background
Adsorption process is a key separation tool, ideally suited for purification applications as well as
difficult separations (Yang, 2003). Regeneration of spent (exhausted) adsorbents is part of the
technology of the use of these carbons (Marsh and Rodríguez-Reinoso, 2006). It is the most difficult
and expensive part of adsorption technology (accounting for about 75% of total operating and
maintenance cost) (Inglezakis and Poulopoulos, 2006). Some of the most commonly used processes
to regenerate activated carbon were mentioned by (Gómez-Serrano et al., 1995) as: desorption by
low pressure steam, at high temperature, by changing affinity between adsorbate and adsorbent by
chemical reagent, by extraction of adsorbate with strong solvent, and by thermal/biochemical
decomposition. Among them, thermal regeneration is the most widely used technology in the
regeneration of activated carbon (Wang et al., 2012). The main disadvantages of adsorption
processes are listed as follows (Inglezakis and Poulopoulos, 2006) (Carp, 2004; Gupta et al., 2011):
Firstly, adsorbents deteriorate in capacity gradually. Secondly, high content of macromolecular
compounds decreases efficiency and may cause irreversible blockage of active sites. And thirdly,
spent adsorbent has to be thermally regenerated (expensive, may destroy the carbon by burning or
attrition, some molecules such as organochloro compounds are not efficiently destroyed, and may
induce pollution problems) or disposal (causing waste).
Furthermore, this regeneration is almost exclusively carried out with granular activated carbon
because powdered activated carbon is difficult to regenerate (Bandosz, 2006).
Photocatalysis is one of the so called Advanced oxidation processes (AOPs) and it is based on the
generation of hydroxyl radicals using UV-Vis radiation (Gogate and Pandit, 2004; Chong et al., 2010).
A recent review (Chong et al., 2010) named catalyst and photocatalytic operation improvements as
the two main constraints in photocatalytic systems. Catalyst improvement is desirable not only for
high photo-efficiency that can utilize wider solar spectra, but also better catalyst immobilization
strategy to provide a cost-effective disinfection. Photocatalytic operation needs new hybrid systems
and improvements of reactor design to reduce electricity cost associated. In general, solutions to
enhance photocatalysis have been mostly focused on catalyst improvement (Gogate and Pandit,
2004). One of the proposed methods for the modification of titanium dioxide is the combination of
this photocatalyst with activated carbon (Leary and Westwood, 2011; Lim, Yap and Srinivasan,
2011). The synergistic effect between adsorption and AOPs has already been reported (Araña,
2003a, 2003b; da Silva and Faria, 2003) and could diminish effectively the main constraints of these
technologies when applied individually. AOPs were described as a promising alternative to current

Chapter 1. Introduction
2
activated carbon regeneration technologies (Mourand et al., 1995; Huling et al., 2005). In this
regard, simple mixing of the TiO2 with the carbon is the preferred method because of simplicity and
low cost (Lim, Yap and Srinivasan, 2011).
Dyes are an increasing source of hazard contaminants emitted into the environment from packaging,
inks and textile industry. Their poor biodegradability in conventional wastewater treatment
(Lachheb et al., 2002) and, in some cases, their toxic or mutagenic effects (Sabnis, 2010) have
already been investigated (i.e., retarding photosynthesis and biota growth by interfering with light
and lower vital oxygen levels in water (Benadjemia et al., 2011)). Among them, methylene blue may
be considered a typical representative of basic dyes for further research (Lang, 2008). Methylene
blue is a cationic dye with delocalized charge and high colour strength classified into the group of
the thiazine dyes which are ring-closed azadiphenylmethane or azine dyes (Hunger, 2007). The
characteristic colour of methylene blue is caused by the strong absorption band in the 550-700 nm
regions (Tardivo et al., 2005). Common names that by which methylene blue is known are: basic blue
9, basic lake blue or chromosmon (Sabnis, 2010). This dye is mostly used for blood, eye lens,
mammary tissues and nucleic acids staining applications, biological application such as detecting
microorganisms and skin diseases, other industrial applications are thin films, inks and packaging
materials (Sabnis, 2010) .
The methods that have generally been used for the removal of dyes from wastewater are
flocculation and coagulation using metallic compounds (large quantity of sludge and introduction of
metallic impurities) (Bansal and Goyal, 2005) and biological oxidation (only effective at high solute
concentrations) (Zhi-yuan and Yang, 2008). On other hand, the use of AOPs as removal technology
for dyes is currently economically unfeasible and has technical constraints (Lang, 2008). But, up to
now, there is no single and economically attractive method for decolourisation of textile
wastewaters (Lang, 2008). Activated carbon is considered a highly effective adsorbent to treat
wastewater dyes (Benadjemia et al., 2011).
1.2 Research Aims and Objectives
The main aims and objectives of the work undertaken are as follows:
I. To investigate the suitability of UV-C/TiO2 for the simultaneous mineralization of methylene
blue adsorbed on activated carbon and regeneration of the spent adsorbent
II. To determine the feasibility of combining adsorption and photocatalysis oxidation as an
integrated treatment for methylene blue.
III. To evaluate the reproducibility of the photocatalytic regeneration using two different
activated carbons

Chapter 1. Introduction
3
IV. To evaluate a novel bell photoreactor for the photocatalytic process and to compare its
efficiency with a more standard design
V. To identify possible interactions between activated carbon and TiO2 during the adsorption
equilibrium and kinetics
VI. To identify relationships between the adsorption behaviour of carbon in the presence of
TiO2 and its ability to be regenerated by the semiconductor
VII. To explore the regeneration of powdered activated carbon
VIII. To determine quantitatively and qualitatively any synergistic effects between TiO2 and
activated carbon during the regeneration process
IX. To examine emerging research areas and field evolution in the regeneration of carbon by
AOPs using graph theory concepts and network analysis tools.
1.3 Research Methodology
The analytical tools used in the current work for process monitoring were UV-Vis spectroscopy, Total
Organic Carbon (TOC) analysis, Attenuated Total Reflectance Infrared (ATR-IR) spectroscopy, pH and
temperature measurements. Characterization of reagents was performed by Porosimetry analysis,
Zeta Potential, particle size distribution analysis and ATR-IR spectroscopy.
Several different chemometric aspects were used in this work, these include: literature review
analysis using network analysis methodology, calibration model development and assessment using
Principal Component Analysis (PCA) and Multiple Linear Regression (MLR) according to the ordinary
Least Squares principle, surface charge analysis using VarClus analysis and response surface
regression, mass transfer parameters determination in kinetics adsorption study by piecewise linear
regression. Design of experiments (DOE) was also used to perform experiments in a systematic and
optimal way for adsorption kinetics, photocatalysis and regeneration model development.
Two types of photocatalytic reactors, a coiled-tube photoreactor and a more elaborate designed bell
reactor were developed, used and compared.
1.4 Structure of the Thesis
The thesis comprises of 8 chapters which are presented in the following order:
Chapter 1 introduces the adsorption and regeneration of activated carbon, including the
most commonly used processes to regenerate activated carbon and the main disadvantages
of the adsorption technology. It briefly discusses the environmental issues posed by dye
effluents and describes the typical methods for the removal of dyes from wastewater, the
use of adsorption and AOPs as separate technologies in the removal of dyes from water,
their problems and the possible benefits of the combination of both technologies. Following

Chapter 1. Introduction
4
the introductory background information, this chapter describes the aim and objectives of
this work, and analyses the research method followed.
Chapter 2 reviews the relevant literature of the regeneration of activated carbon by
photocatalysis. Emerging research areas, tendencies in the field of the regeneration using
AOPs, and relevant research articles are discussed from the point of view of a systematic
network analysis. Concepts on photocatalysis and photocatalytic reactors, as well as
adsorption equilibrium and kinetics are explained later in the same chapter.
Chapter 3 presents the materials and experimental methodology used; this includes the
description of a comprehensive data analysis procedure, model development techniques
and validation.
Chapter 4 describes the calibration model and the characterization of raw materials TiO2
photocatalyst, wood-based CA1 activated carbon, coconut-based 207C activated carbon and
methylene blue; this includes porosimetry study, particle size distribution and surface
chemistry analysis.
Chapter 5 analyses and compares the adsorption isotherm of methylene blue onto activated
carbon, and the adsorption isotherm of methylene blue onto TiO2-carbon mixture. The
results of a detailed comparison between dye-carbon and dye-TiO2-carbon pseudo-
equilibrium systems in terms of capacity, surface coverage, heat of adsorption,
heterogeneity, cooperativity and surface charge are presented in this chapter. The text
includes three independent studies of the influence of the semiconductor in pH and zeta
potential changes during adsorption. A statistical study of surface charge changes in
isotherm experiment (dye-TiO2-carbon), a response surface methodology of pH changes
during adsorption and a surface charge analysis of a TiO2-carbon mixture in suspension. The
discussion of the possible relationships between the observed surface changes and the
interpretations from the isotherm are discussed as well and compared between carbons.
Chapter 6 explains the effect of TiO2 photocatalyst in the adsorption kinetics of methylene
blue onto activated carbon; this includes a fractional screening design to identify critical
process variables, and several full factorial designs to determine the effects of TiO2 in the
decay of methylene blue, in the external mass transfer rate and in the intraparticle diffusion
rate from both adsorbents. The likely regenerability of the carbons based on the current
finding is also commented upon.
Chapter 7 is divided in three sections. In the first part response surface method is utilized to
find the optimum photocatalytic conditions in the coiled-tube and bell photo-reactors. The
second part of the chapter proposes the same response surface analysis to determine the

Chapter 1. Introduction
5
photocatalytic ability of TiO2 to regenerate activated carbon in both photo-reactors.
Synergistic effects between the photocatalyst and the adsorbents, as well as comparison
between photo-reactors are also included in this chapter. Spectroscopic data analysis from
TiO2-carbon mixture before and after regeneration constitutes the third and final part of the
chapter.
Chapter 8 concludes the work presented and recommendations for future work are
discussed.

Chapter 2. Literature Review
6
2 LITERATURE REVIEW
This literature review has been divided into three main sections as follows: firstly an introductory
section where carbon adsorption and thermal regeneration are presented, including definitions,
historical background, water treatment applications, powdered and granular carbon regenerations,
thermal swing adsorption, main regeneration issues, financial and environmental costs of carbon
adsorption and regeneration, and alternative regeneration methods to traditional thermal
treatment. Secondly the UV/TiO2 heterogeneous advanced oxidation process, photocatalytic
reactors, the regeneration of activated carbon by photocatalysis, and important factors relating to
the desorption of pollutants during regeneration are explained. Lastly the adsorption process is
briefly reviewed, including mechanism, adsorption isotherms models, and adsorption diffusion and
simplified kinetic type models.
2.1 Activated carbon adsorption and traditional regeneration
methods
Adsorption is defined as the process by which molecules from a liquid become concentrated onto
the surface of a solid as a result of London and electrostatic forces acting between the atoms and
molecules that form the solid (Cheremisinoff, 2002; Bansal and Goyal, 2005). These intermolecular
forces are strong enough to attract other compounds in their vicinity and produce the surface effect
denominated adsorption. London dispersion force is a type of intermolecular force (i.e.,
intermolecular forces are also referred as van der Waals forces) which results from the motion of
electrons in nonpolar molecules (McMurry and Fay, 2004). As easier the motion of electrons,
stronger the dispersion force will be. London dispersion forces are smaller in smaller molecules
because the molecule's electrons are more rigidly retained by the nucleus, while larger molecules
has many electrons, some of which are less close to the nucleus. The other types of van der Waals
forces include dipole-dipole forces, hydrogen bonds and ion-dipole forces. Figure 2-1 illustrate the
different types of intermolecular forces. Ion-dipole forces are the result of electrical interactions
between an ion and the partial charges on a polar solvent , dipole-dipole forces arise from electrical
interactions among dipoles on neighbouring molecules (i.e., polar molecules), and an hydrogen bond
is an attractive interaction between molecules with O-H, N-H, and F-H bonds.

Chapter 2. Literature Review
7
Figure 2-1 Types of intermolecular forces or van der Waals forces: (a) Polar molecules orient toward cation (Ion-dipole forces), (b) Polar molecules attract one another (dipole-dipole forces), (c) Nonpolar molecules attract one another as a result of short-lived dipoles (London dispersion forces), and (d) Hydrogen bond. Adapted from McMurry and Fay (2004)
Regeneration is the process of reversing adsorption and returns the spent adsorbent to the virgin
structure (McLaughlin, 2005). Historically, the treatment of drinking water with charcoal was the
first application of adsorption in environmental affairs around 460 B.C. by the Phoenicians (Bandosz,
2006; Inglezakis and Poulopoulos, 2006). Activated carbon was used for the first time on an
industrial scale in England (1794) to decolorize sugar; this application also initiated research with
activated carbon in liquid phase adsorption (Bandosz, 2006). There is agreement across the
literature that activated carbon was greatly developed during World War I, for use in gas masks
(Thomas and Crittenden, 1998; Yang, 2003; Bansal and Goyal, 2005; Bandosz, 2006). The first filter
for water treatment was installed in Europe in 1929 (Inglezakis and Poulopoulos, 2006). Air
purification and solvent recovery from vapour streams were the major uses of activated carbons
during the first third of the 20th century (Thomas and Crittenden, 1998). Nowadays, adsorption has
been pointed out as the most reliable technique for both the minimization of contaminants from
water when biological treatment is unsuitable and the elimination of VOCs and inorganics from gas
streams (Inglezakis and Poulopoulos, 2006).
The complexity and versatility of activated carbons as solids used in adsorption process has been
attributed to their structure and chemical nature (Duong, 1998). Nowadays, carbons are extensively
employed for the adsorption of organics to decolorize sugar, personnel protection, hydrogen
purification, water purification, solvent recovery systems, adsorption of gasoline vapours in cars and
as well as adsorbent in air purification systems (Ruthven, 1984; Thomas and Crittenden, 1998). In
2002 the total production of activated carbon was estimated to be 750,000 ton/year (Bandosz,
2006), and almost 80% of this (powdered and granular form) is used in liquid-phase applications

Chapter 2. Literature Review
8
(Bansal and Goyal, 2005). The capacity of the operations that regenerate activated carbon
throughout the world is estimated at over 100,000 ton/year, and is forecasted to diminish as a result
of falling prices due to over-capacity of some markets (Bandosz, 2006). The worldwide requirements
for virgin activated carbon are predicted to attain 2.3 million tons by 2017 from air purification
applications (Shah, Pre and Alappat, 2014).
In water purification, activated carbons are typically applied to remove phenols, halogenated
compounds, pesticides, caprolactam, and chlorine (Thomas and Crittenden, 1998). In general, the
carbon adsorption technology is recommended in water treatment in the following cases (Inglezakis
and Poulopoulos, 2006): (1) if the compounds are not biodegradable, (2) if the molecules contain
branched chains, have large molecular weights or low polarity, (3) to eliminate solids at
concentrations lower than 50 mg/L, (4) to remove oil at concentrations lower than 10 mg/L, (5) and
to remove organics and inorganics to concentrations lower than 5000 and 1000 mg/L respectively.
Generally speaking its use has been recommended for the following compounds: synthetic organic
compounds (oil, detergents, aromatic solvents, chlorinated aromatics, phenols and chlorophenols,
polynuclear aromatics, pesticides and herbicides, chlorinated non-aromatics, and surfactants),
inorganic compounds (chlorine, bromine, iodine, arsenic, chromium, mercury, cobalt), natural
organic matter that imparts bad taste and odours, and by-products of chemical water treatment
(trihalomethanes produced by disinfection of water with chlorine). These compounds are commonly
removed by activated carbon in water treatment due to their strong adsorption to carbon (Marsh
and Rodríguez-Reinoso, 2006). Depending on the initial characteristics of the waste, the following
are the possible applications in a wastewater treatment plant for activated carbon technology
(Marsh and Rodríguez-Reinoso, 2006): firstly as an adsorbent after primary and secondary biological
processes, secondly as an independent physico-chemical treatment, or thirdly it can be added to
biological aeration tanks and used as part of secondary biological treatment. In the treatment of
industrial waste water it could be used either as the sole treatment before biological treatment, or
as a tertiary process after biological treatment.
Powdered activated carbon is currently more used in liquid phase applications compared to granular
activated carbon due to its lower cost (Ledesma et al., 2014), although this trend is expected to
reverse in the future due to the higher regeneration capability of the latter. Granular activated
carbon, primarily due to its high cost (Bansal and Goyal, 2005; Bandosz, 2006), is removed from the
process equipment to be regenerated and reactivated in special furnaces such as rotary kilns,
multiple hearths, fluidized beds, microwave furnaces, etc., and heated at high temperatures (700-
1000 °C) (Thomas and Crittenden, 1998; Sheintuch and Matatov-Meytal, 1999; Bandosz, 2006).
Because adsorption is an exothermic process, the increase in temperature favours desorption. The

Chapter 2. Literature Review
9
higher the heat of adsorption, the more strongly adsorbed the species and the higher the
temperature needed for desorption. Therefore the removal of heavily-adsorbed species in the pore
system demands very high temperatures (Bandosz, 2006). Such severe conditions not only remove
the compounds but also deteriorate the adsorbent. Two main steps are involved in these furnaces: a
pyrolitic stage that consists of heating the spent carbon to remove moisture (≤ 200 °C) and volatile
compounds (200-500 °C) at temperatures up to 800 °C under inert conditions, followed by an
oxidative stage in which gasification of the pyrolysed carbon with steam or carbon dioxide to
eliminate the char residue at temperatures between 800 and 1000 °C occurs (San Miguel et al.,
2002; Cheng, Yang and Hsieh, 2007; Guo and Du, 2012). Activated carbon usually requires lower
temperature for regeneration than other adsorbents such as zeolites (Yang, 2003). In powdered
form, activated carbon can be used directly, normally in batch mode, but it is difficult to recover for
regeneration (there are two possibilities: filtration and subsequent regeneration, or disposal of the
sludge) (Thomas and Crittenden, 1998). The fact that disposal methods are inexpensive coupled with
a low initial cost have made until now the use of fresh powdered carbon the preferred choice
(Bandosz, 2006). Broadly speaking, adsorbent regeneration is technically or economically not viable
if the adsorption was irreversible, or if the carbon was loaded with radioactive substances, PCBs,
dioxins or heavy metals (Inglezakis and Poulopoulos, 2006). Because in most applications, it is not
economical to dispose of the adsorbent as waste, regeneration is carried out either in situ or is taken
to special regeneration units as mentioned above. Regeneration of activated carbon has many
benefits besides economic ones (Shah et al., 2014); the spent adsorbent could be toxic, flammable
and/or explosive, it may need incineration if it contains hazardous waste, and exposure to air may
cause adsorption of moisture resulting in desorption of adsorbed pollutants, odour release etc.
2.1.1 Thermal swing regeneration process
A review by Thomas and Crittenden (1998) of the types of processes applied in regeneration of
carbon, their advantages and disadvantages, and a description of a basic thermal swing regeneration
operation, the most broadly used regeneration technology, are described below. Initially, exhausted
adsorbents were regenerated by steaming in a secondary plant. Then, cyclic operations were used in
plants for solvent recovery and air purification by using multi-bed arrangements, thus some beds
were regenerating the carbon by hot air or steam, while others were functioning as adsorbers.
Modern regeneration practices include thermal swing and pressure swing adsorption processes. The
driving force used for desorption is what distinguishes them, increase in temperature for the former
and reduction in total pressure to enable desorption for the later. Thermal swing regeneration is
recommended in cases where the adsorbed species are strongly bound; one of its advantages is that
the desorbate can be recovered at high concentrations; however among the disadvantages is the

Chapter 2. Literature Review
10
cited long cycle times, thermal inefficiency due to heat loss, and thermal ageing of the sorbent.
Pressure swing is chosen in cases where species are weakly adsorbed and require high purity, and
the main drawback is that it may require very low pressures. Other practical methods of desorption
include reduction in concentration, purging with an inert fluid, displacement with a more strongly
adsorbing specie, change of chemical conditions such as pH. Although changes in temperature and
pressure are the most common regeneration procedures, usually a combination of methods is
needed. A basic thermal swing adsorption operation comprises a configuration with two beds
working in a cycle as shown in Figure 2-2. Adsorption is carried out in the first column, usually at
ambient temperature (T1). In an adsorption column, an adsorbate from a fluid stream is removed by
a fixed carbon bed. The adsorption capacity of the carbon decreases over time as the adsorbate
molecules fill the pores. Once the adsorbent is exhausted, the concentration of the fluid phase at the
outlet rises until it reaches a certain level (breakthrough point), then the bed is taken off-line and the
feed is switched to the second column, where the regeneration takes place, first by heating the
adsorbent and adsorbate at the desorption temperature T2 with steam or hot purge gas; and
secondly by desorbing the compound with purge fluid at T2 (this can be done with high flow rate and
low T2, or the other way around) and then regenerating at T2 or higher. Next the bed is cooled to
temperature T1 and taken again to the first column to start a new cycle. The adsorption and
desorption/regeneration time steps must be equal. As mentioned before, thermal swing adsorption
consumes large amounts of energy, this comprises energy to raise the temperature of the adsorbent
and adsorbate, provide heat of desorption to raise the temperature of the vessel and adsorbate for
regeneration if it is higher than the used for desorption, and to recover heat losses or if any liquid
has to be vaporized. The duration of the cycle time is controlled by the desorption step and can last
from several hours in the case of a bulk separation or up to several days, in the case of purifications.
Additional problems in thermal swing processes are the reduction in capacity of the adsorbent after
repeated cycles, the formation of char in the desorption/regeneration step, and the abrasion and
crushing of the carbon due to consecutive heating and cooling cycles leading to a portion of the
carbon being reduced to dust. These drawbacks can be illustrated with an example.

Chapter 2. Literature Review
11
Figure 2-2 Basic configuration of a thermal swing regeneration process, simplified drawing from Thomas and Crittenden (1998)
The regeneration of carbon exhausted with colour substances from the decolourization step in sugar
processing is used (McLaughlin, 2005). This researcher analysed the effects of activation on the
internal structure of virgin carbon with the effects of reactivation on the internal structure of spent
activated carbon. Activation step (Figure 2-3) uses the calcined carbonaceous material (obtained by
heating below 800 °C in an oxygen-free environment to remove volatiles) and an oxidizing gas
(typically steam, but CO2 also used). As a result of this interaction, the oxidative gas removes the
graphitic backbone from the raw carbon, which produces a decrease in the particle density and the
total product weight, but increases the volume of adsorption sites. After the adsorption, the
adsorbate species in the exhausted carbon are submitted to high temperature in the absence of
oxygen (Figure 2-3, Reactivation step). This step dehydrates the adsorbate and causes it to adhere
even more to the surface of the adsorbent. As the temperature increases, the dried compounds
devolatilize and calcinate transforming into a residue named “char”.
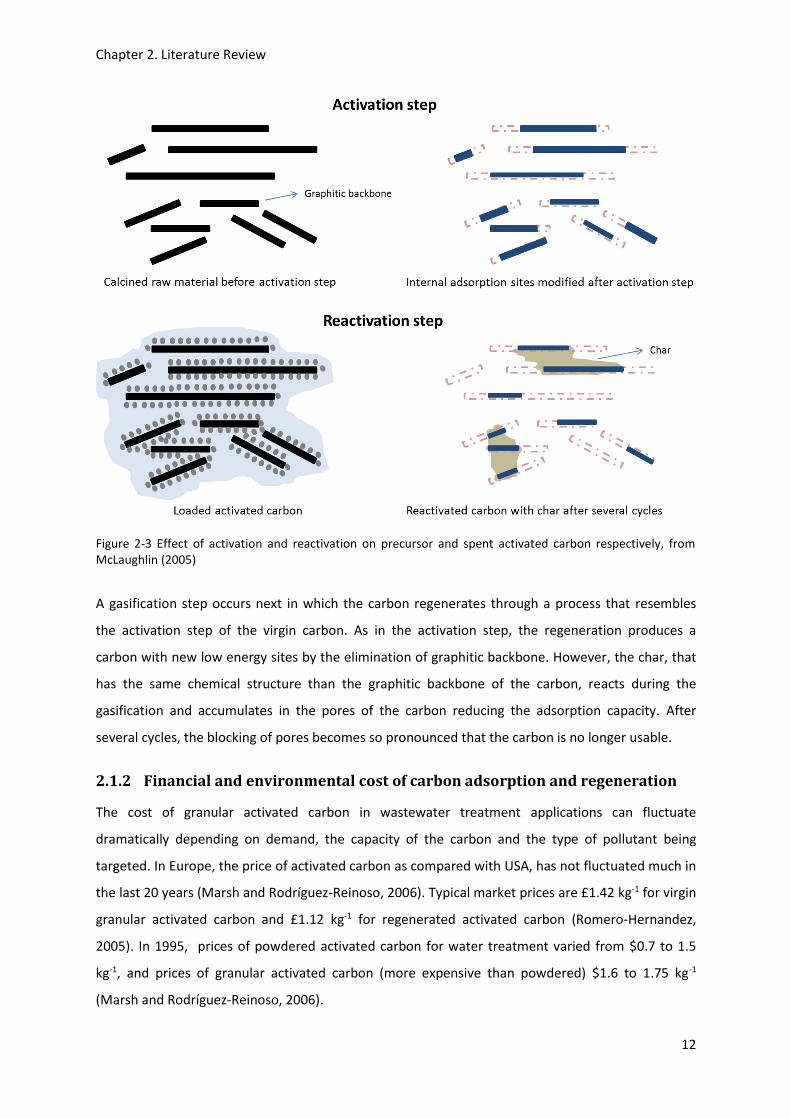
Chapter 2. Literature Review
12
Figure 2-3 Effect of activation and reactivation on precursor and spent activated carbon respectively, from McLaughlin (2005)
A gasification step occurs next in which the carbon regenerates through a process that resembles
the activation step of the virgin carbon. As in the activation step, the regeneration produces a
carbon with new low energy sites by the elimination of graphitic backbone. However, the char, that
has the same chemical structure than the graphitic backbone of the carbon, reacts during the
gasification and accumulates in the pores of the carbon reducing the adsorption capacity. After
several cycles, the blocking of pores becomes so pronounced that the carbon is no longer usable.
2.1.2 Financial and environmental cost of carbon adsorption and regeneration
The cost of granular activated carbon in wastewater treatment applications can fluctuate
dramatically depending on demand, the capacity of the carbon and the type of pollutant being
targeted. In Europe, the price of activated carbon as compared with USA, has not fluctuated much in
the last 20 years (Marsh and Rodríguez-Reinoso, 2006). Typical market prices are £1.42 kg-1 for virgin
granular activated carbon and £1.12 kg-1 for regenerated activated carbon (Romero-Hernandez,
2005). In 1995, prices of powdered activated carbon for water treatment varied from $0.7 to 1.5
kg-1, and prices of granular activated carbon (more expensive than powdered) $1.6 to 1.75 kg-1
(Marsh and Rodríguez-Reinoso, 2006).

Chapter 2. Literature Review
13
Life cycle assessment is an environmental tool that can be used to evaluate the environmental
impact of the production, use and recycling of a product (Bayer et al., 2005; Hjaila et al., 2013). The
environmental impact of granular activated carbon adsorption as a wastewater treatment
technology has been investigated by several authors (Romero-Hernandez, 2004, 2005; Manda,
Worrell and Patel, 2014). Romero-Hernandez (2004, 2005) used the most typical adsorption process
configuration in industrial wastewater treatment, comprising downflow fixed-bed pressured system,
operating with two columns in series and granular activated carbon working in continuous mode. He
used organic compounds to saturate the carbon and the exhausted adsorbent was regenerated off-
site by thermal regeneration. Based on the life cycle assessment of this particular application, the
annual requirement of the adsorbent was around 248,296 kg, at an annual cost of £352,580 in the
case of treating benzene. The annual cost for the adsorbent included the off-site regeneration of the
carbon and represented the 76.79 % of the entire adsorption process cost. The researchers
concluded their analysis by criticising the use of adsorption technology in wastewater treatment due
to its economic and environmental implications (measured in terms of global warming impact). The
main contribution was caused by the production of granular activated carbon, a conclusion arrived
at by other investigators (Manda, Worrell and Patel, 2014). Although they highlighted that the re-use
of carbon following regeneration is more environmentally friendly than the production of new
adsorbent, they pointed out that in both cases the treatment had higher environmental impact than
leaving untreated the wastewater streams. Others investigators favoured nanofiltration membrane
systems (Manda, Worrell and Patel, 2014) or biological treatment (Gabarrell et al., 2012) over
conventional granulated activated carbon water treatment based on their environmental impacts.
Activated carbon can be made out of different precursors such as coal, peat, wood and nutshells.
The environmental performance of two activated carbon productions, one from coal (physically
activated) (Bayer et al., 2005) and another from plant-based material (chemically activated) (Hjaila et
al., 2013) have been studied. The production of granular activated carbon from hard coal at
industrial scale and using a physical activation procedure is constituted by the following steps (Bayer
et al., 2005): wet grinding, mixing of coal with binding agents, creation of a compressed block,
oxidation, drying, carbonization, activation at high temperature, crushing, sieving and packaging. The
production of one ton of granular activated carbon consumed three tons of coal, 1600 KWh of
energy, 12 tons of water vapour and 330 m3 natural gas. This provides a loss of 60 % weight of the
raw material during processing that is equivalent to a high CO2 emissions. In contrast, the recycling
of the adsorbent only produced a tenth of this value, which denotes a 90 % saving in global warming
emissions. Reactivated granular activated carbon also reduced the impact of acid emissions, ozone
creation by NOx production, fossil fuels consumption and eutrophication by phosphate enrichment

Chapter 2. Literature Review
14
of soils, this varied between 25 and 70% depending on the case. The cost of virgin granular activated
carbon was different depending on type and usage as described above, and the cost for reactivated
granular activated carbon was estimated to be 50% cheaper compared to the virgin adsorbent, and
this number changed depending on the type of contaminant. This evaluation illustrates the benefits
of reactivation with respect to the original activated carbon production process, as the reuse of
granular activated carbon was more environmentally friendly and cheaper than its analogue. The
production of activated carbon from plant-based material at pilot-scale and using a chemical
activation procedure comprises the following steps (Hjaila et al., 2013): drying of the precursor,
crushing, impregnation with phosphoric acid, pyrolysis, cooling, washing with water and filtering,
drying and crushing of the activated carbon product. To produce 1 kg of adsorbent from the raw
material were needed 1.66 kg of precursor, 1.55 kg of phosphoric acid, and 40 kg of water, while the
process generated 10.25 kg of wastewater. The highest environmental impact in the chemically
activated carbon process was attributed to the phosphoric acid via 90% acidification impact and 91%
human toxicity impact. The estimation of the global warming impact was the same as in the physical
activation process (11 kg CO2 emitted per kg of activated carbon produced).Comparatively, the
amount of precursor loss by the chemically activated process was significantly lower than through
the production using a physical activation method but this did not contribute to reduced global
warming impact.
2.1.3 Alternative regeneration methods
Chemical regeneration is an alternative regeneration method, although less utilized than thermal
treatment. One advantage of this method is that it does not produce loss of carbon, but its efficiency
depends on the properties of the adsorbate and the choice of the chemical regenerant (organics
such as acetone and methanol or inorganics such as sodium hydroxide) (Bandosz, 2006). Biological
regeneration has also been investigated, where the exhausted carbon is regenerated by means of
the contact with a population of microorganisms. In this case, the regeneration is considered slow
and can only be applied to biodegradable substances (Yuen and Hameed, 2009). Among the
developing techniques for carbon regeneration, microwave regeneration seems to be finding favour
(Xin-hui, Srinivasakannan and Jin-sheng, 2014), among its advantages as compared with the
conventional thermal treatment are more rapid heating, less damage to the carbon and indeed an
increase in its surface area, the possibility of direct microwave heating of the carbon bed, the
porosity of the carbon remains unaltered, precise control of the temperature and distribution of
energy in the system, shorter regeneration times, energy savings, better performance of the carbon
adsorption, and selectivity of microwave heating (Ania et al., 2004; Yuen and Hameed, 2009). Other
regeneration methods that bring about the decomposition of the adsorbate are electric and

Chapter 2. Literature Review
15
electrochemical treatments, the use of ultrasound, and photochemical regeneration (Sheintuch and
Matatov-Meytal, 1999).
2.2 Regeneration by Advanced Oxidation Technologies
2.2.1 Advanced Oxidation Technologies
Advanced oxidation processes (AOPs) are methods to produce hydroxyl radicals (HO.), highly
reactive species that induce non-selective oxidation of a wide range of organic compounds
(Augugliaro et al., 2006), leading in some cases to their complete mineralization. There are different
methods to generate hydroxyl radicals based on chemical oxidation (O3/H2O2, Fenton,
Permanganate, Persulfate), UV-oxidation (Vacuum UV, Photo-Fenton, H2O2/UV, H2O2/O3/UV,
TiO2/UV), non-thermal gas plasmas, electrohydraulic discharge, electrocatalytic and electrochemical
oxidation.
The Fenton reaction is a dark process that consists in the combination of Fe (II) with hydrogen
peroxide (Fenton’s reagent) to produce hydroxyl radicals according to equation (Augugliaro et al.,
2006; Muranaka and Julcour, 2009):
𝐹𝑒2+ +𝐻2𝑂2 → 𝐹𝑒3+ + 𝑂𝐻− + ∙ 𝑂𝐻
This process is accelerated by UV irradiation, and is then referred to as the photo-Fenton process.
The photo-Fenton reaction is activated up to a light wavelength of 600 nm (Ballari et al., 2008).
Heterogeneous photocatalysis is an AOP based on the generation of hydroxyl radicals (OH.) using
UV-Vis radiation (Gogate and Pandit, 2004; Chong et al., 2010). The free radical mechanism is
initiated with catalysts such as TiO2 (Mozia, 2010). The photocatalyst needs to be activated
photonically. The photo-induced reactive species oxidize almost any chemical specie or
microorganism yielding carbon dioxide and inorganic ions such as nitrate and sulphate (Gogate and
Pandit, 2004; Malato et al., 2007, 2009). The hydroxyl radical can react in aqueous solution through
three possible mechanisms: hydrogen abstraction, electron transfer, and radical addition (Augugliaro
et al., 2006). The overall heterogeneous photocatalytic process can be divided into five steps
(Herrmann, 1999): firstly, transfer of reactant in the fluid phase to the photocatalyst surface,
secondly, adsorption of reactant on its surface, thirdly reaction in the adsorbed phase, fourthly
desorption of the products, and lastly, removal of products from the interface region.
Titanium dioxide (TiO2) belongs to the family of transition metal oxides and titanium is the world’s
fourth most abundant metal (Carp, 2004). Four natural crystal structures of TiO2 exist but only
anatase and rutile demonstrate photocatalytic properties (Gogate and Pandit, 2004) mainly
attributed to its microstructure and physical properties. It is also known that anatase is
photocatalytically more active than rutile but a synergistic effect, not well understood yet, has been
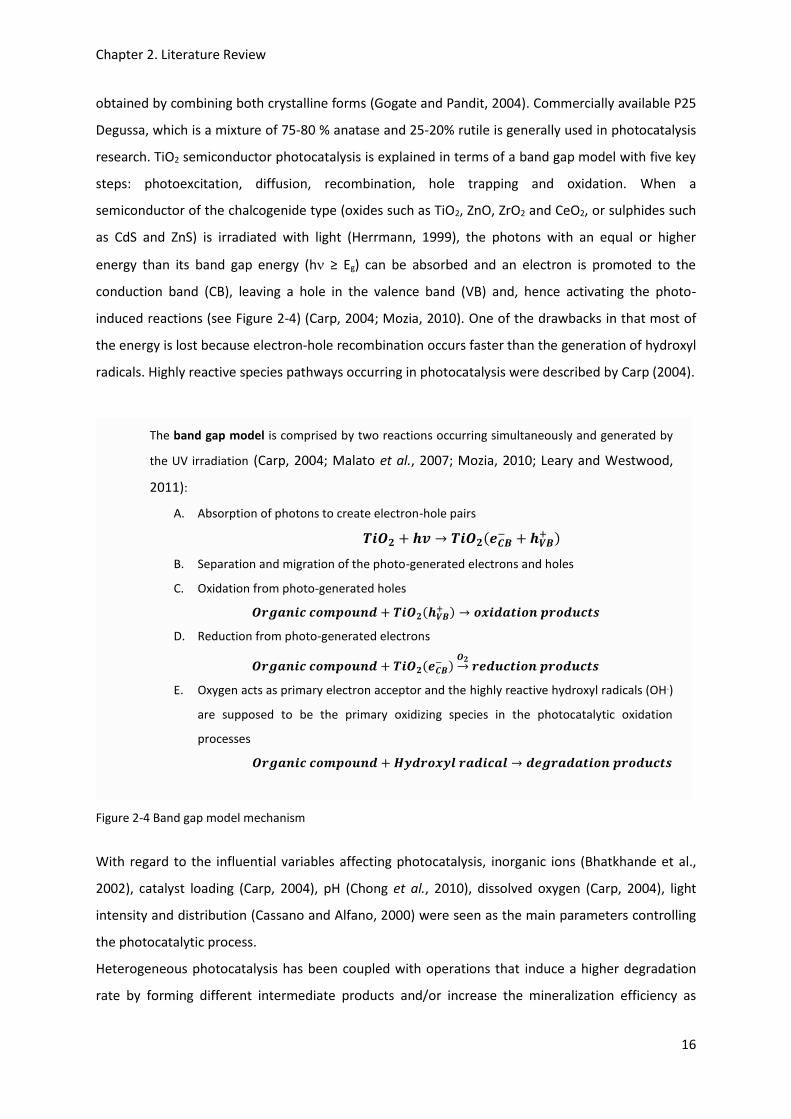
Chapter 2. Literature Review
16
obtained by combining both crystalline forms (Gogate and Pandit, 2004). Commercially available P25
Degussa, which is a mixture of 75-80 % anatase and 25-20% rutile is generally used in photocatalysis
research. TiO2 semiconductor photocatalysis is explained in terms of a band gap model with five key
steps: photoexcitation, diffusion, recombination, hole trapping and oxidation. When a
semiconductor of the chalcogenide type (oxides such as TiO2, ZnO, ZrO2 and CeO2, or sulphides such
as CdS and ZnS) is irradiated with light (Herrmann, 1999), the photons with an equal or higher
energy than its band gap energy (h ≥ Eg) can be absorbed and an electron is promoted to the
conduction band (CB), leaving a hole in the valence band (VB) and, hence activating the photo-
induced reactions (see Figure 2-4) (Carp, 2004; Mozia, 2010). One of the drawbacks in that most of
the energy is lost because electron-hole recombination occurs faster than the generation of hydroxyl
radicals. Highly reactive species pathways occurring in photocatalysis were described by Carp (2004).
Figure 2-4 Band gap model mechanism
With regard to the influential variables affecting photocatalysis, inorganic ions (Bhatkhande et al.,
2002), catalyst loading (Carp, 2004), pH (Chong et al., 2010), dissolved oxygen (Carp, 2004), light
intensity and distribution (Cassano and Alfano, 2000) were seen as the main parameters controlling
the photocatalytic process.
Heterogeneous photocatalysis has been coupled with operations that induce a higher degradation
rate by forming different intermediate products and/or increase the mineralization efficiency as
The band gap model is comprised by two reactions occurring simultaneously and generated by
the UV irradiation (Carp, 2004; Malato et al., 2007; Mozia, 2010; Leary and Westwood,
2011):
A. Absorption of photons to create electron-hole pairs
𝑻𝒊𝑶𝟐 + 𝒉𝒗 → 𝑻𝒊𝑶𝟐(𝒆𝑪𝑩− + 𝒉𝑽𝑩
+ )
B. Separation and migration of the photo-generated electrons and holes
C. Oxidation from photo-generated holes
𝑶𝒓𝒈𝒂𝒏𝒊𝒄 𝒄𝒐𝒎𝒑𝒐𝒖𝒏𝒅 + 𝑻𝒊𝑶𝟐(𝒉𝑽𝑩+ ) → 𝒐𝒙𝒊𝒅𝒂𝒕𝒊𝒐𝒏 𝒑𝒓𝒐𝒅𝒖𝒄𝒕𝒔
D. Reduction from photo-generated electrons
𝑶𝒓𝒈𝒂𝒏𝒊𝒄 𝒄𝒐𝒎𝒑𝒐𝒖𝒏𝒅 + 𝑻𝒊𝑶𝟐(𝒆𝑪𝑩− )
𝑶𝟐→ 𝒓𝒆𝒅𝒖𝒄𝒕𝒊𝒐𝒏 𝒑𝒓𝒐𝒅𝒖𝒄𝒕𝒔
E. Oxygen acts as primary electron acceptor and the highly reactive hydroxyl radicals (OH.)
are supposed to be the primary oxidizing species in the photocatalytic oxidation
processes
𝑶𝒓𝒈𝒂𝒏𝒊𝒄 𝒄𝒐𝒎𝒑𝒐𝒖𝒏𝒅 + 𝑯𝒚𝒅𝒓𝒐𝒙𝒚𝒍 𝒓𝒂𝒅𝒊𝒄𝒂𝒍 → 𝒅𝒆𝒈𝒓𝒂𝒅𝒂𝒕𝒊𝒐𝒏 𝒑𝒓𝒐𝒅𝒖𝒄𝒕𝒔

Chapter 2. Literature Review
17
compared to water treatment by only photocatalysis. These operation are ultrasonic irradiation,
photo-Fenton reaction, ozonation, and electrochemical treatment (Augugliaro et al., 2006). And also
with operations that does not affect the mentioned chemical mechanism but rather improves the
overall process through a two-step treatment, such as biological treatment, membrane reactor, and
physical adsorption. The photocatalytic process preceding the biological one is intended to modify
the structure of pollutants by converting them into biodegradable intermediates, and the coupling of
membrane filtration with photocatalysis offers the advantage of easy photocatalyst recovery and
continuous regime.
2.2.2 Photocatalytic reactors
Photocatalytic reactor design, types of photocatalytic reactors as well as their configurations are
reviewed in this section.
A photoreactor is a device that allows the contact of photons from a lamp and reactants with the
photocatalyst. The photoreactor vessel can be constructed from materials such as stainless steel,
titanium, glass or plastic (polypropylene and polyvinyl) depending on the characteristics of the water
to be treated (Oppenländer, 2003). The type of source varies depending on the application; they can
be mercury discharge or fluorescent UV lamps (Li Puma et al., 2003). Lamp sleeves are usually made
of the following UV transparent materials quartz glass, Suprasil quartz or fluoropolymer, depending
on the characteristics of the UV source. Reflectors are usually made of aluminium.
The physical geometry of the reactor has to be controlled to ensure that the collection of photons is
effective, which is probably the main distinction from classic chemical reactors (Alfano et al., 2000;
Braham and Harris, 2009). Photocatalytic reactors must provide uniform light distribution to the
entire photocatalyst surface and effective mass transfer of the pollutant to the TiO2 surface
(McCullagh et al., 2011). These two factors, light distribution and achieving irradiation of the total
surface of the catalyst have been described as the two most important factors in designing a
photoreactor (Chong et al., 2010). In general, irradiation losses due to absorption from water and
scattering from TiO2 reduce the performance of photocatalytic reactors (Lasa et al., 2005).
Furthermore, scale-up of photocatalytic reactors is constrained by several phenomena such as
opacity, light scattering, depth of radiation penetration, and local volumetric light absorption
(Mukherjee and Ray, 1999). Analysis of the reaction kinetics, design of reactor geometry and
supplying of suitable illumination are therefore central points in photocatalytic reactor design
(Alfano et al., 2000).
Methods to analyse photocatalytic reactors includes neural networks, optimal experimental design,
and mathematical radiation models based on radiation absorption and the radiative transfer
equation (RTE) (Alfano et al., 2000), which describes the traveling of photons with their

Chapter 2. Literature Review
18
corresponding energy losses due to absorption and out-scattering, and energy gain due to in-
scattering (Boyjoo et al., 2013). The condition of the photocatalyst, the type of radiation source, and
the arrangement of the illumination are design parameters that can be used to classify
photocatalytic reactors (Lasa et al., 2005). In the first category, TiO2 particles can be either
suspended (slurry photocatalytic reactors), or immobilized on the reactor walls, around the light
source case, or on a support system such as activated carbon, fibreglass, glass, membranes, zeolites,
silica gel, and stainless steel. In the second category the reactor can be constructed using a UV
polychromatic lamp or solar irradiation that can be further sub-classified in solar non-concentrating
and solar concentrating photocatalytic reactors. And lastly, the position of the lamp source: sources
can be situated inside the unit, or placed outside the vessel.
The two main photocatalytic reactor configurations for water treatment are described below:
reactors with suspended photocatalyst particles (slurry photocatalytic reactors) and reactors with
photocatalyst immobilized (fixed-bed configuration). Slurry photoreactors are the most basic type of
photoreactors and the most widely used because they demonstrate the largest photocatalytic
activity (Cassano and Alfano, 2000). The interaction between the TiO2 semiconductor and the
pollutant takes place by mixing under UV-Vis light irradiation. Dispersion of the photocatalyst can be
accomplished by sonication, mechanical or magnetic stirrers, and aeration is usually supplied to
prevent electron/hole recombination (Gogate and Pandit, 2004). Ultracentrifugation, filtration,
coagulation or settling under gravity are common separation techniques used to separate the
catalyst particles after the photocatalytic treatment (Lasa et al., 2005). The main advantage of slurry
systems is the larger irradiated surface area compared with immobilized ones (McCullagh et al.,
2011).
Nevertheless, supports are required basically for minimization of random collisions of the catalyst
particles with the reactants (Leary and Westwood, 2011), for avoiding fouling of the surface of the
lamp due to photocatalyst decomposition (Gogate and Pandit, 2004), and for reducing the high costs
associated with the recovery of the catalyst (Malato et al., 2007, 2009). Immobilization techniques
include films obtained by wash-coating using a photocatalyst suspension, or techniques such as
physical and chemical vapour deposition. The main drawback of the former is a high sensitivity to
erosion, and in the latter, although the film is more durable, there is difficulty to control the
crystalline structure of TiO2 during preparation. Scouring and mass transfer limitations due to
reduced catalyst area to volume ratio are other mentioned problems of TiO2 immobilization on
supports (Gogate and Pandit, 2004). The actual trend in photocatalysis appears to involve the use of
photo-membrane reactors (PMRs) to provide enough photo-efficiency to degrade large volumes of
water and avoid laborious recovering (Malato et al., 2007, 2009). The main advantages and

Chapter 2. Literature Review
19
disadvantages of using the catalyst in suspended form, fixed on a support or hybrids using both
approaches are summarized in Table 2-1.
A large variety of photocatalytic designs can be found in the literature due to the lack of
standardization in the field (Braham and Harris, 2009). A few examples of artificially illuminated
photocatalytic reactors with the catalyst suspended are: slurry membrane reactor (Figure 2-6), slurry
annular reactor (Figure 2-5), fluidized bed reactor (Figure 2-8), open up-flow reactor, swirl flow
reactor (Figure 2-7), Taylor vortex reactor, and turbulent slurry reactor.
Table 2-1. Comparison of the three main kinds of photocatalitic reactor configurations. Summarized from Chong et al. (2010), Mozia (2010)
Advantages Disadvantages
Slurry
photoreactors
Easy TiO2 reactivation
High total surface area of catalyst
Energy saving and size installation
Post separation
Fouling of the surface of the irradiation source
PMRs
(catalyst
suspended in
feed solution)
Low energy and chemical consumptions
Allow continuous operation
Low maintenance costs
Easy scale up and size of installation.
Catalyst easy separation, recovery and reuse
Reduction of the catalyst active sites
Higher mass transfer limitations.
Increase in operational difficulties.
Limited lifetime of the membrane
Fouling due to particles and colloids
Effectiveness of separation depends on
membrane type
PMRs (TiO2
immobilized
in/on a
membrane)
Catalyst separation and recycling not needed
Fouling lower as compared with other
membranes
Lower effectiveness as compare with the
catalyst in suspension
No possible adjust catalyst load to the
composition treated solution
Membrane exchange need when catalyst loses
its activity
Examples of artificially illuminated photocatalytic reactors in which the catalyst is immobilized are:
packed bed reactor (Figure 2-9), falling film reactor (Figure 2-10), coated tubular reactor, fibre optic
cable reactor, multiple tube reactor, rotating disc reactor, spiral glass tube reactor, and tube light
reactor (Figure 2-11). Examples of solar reactors includes parabolic trough reactor, thin film fixed
bed reactor, compound parabolic collecting reactor and double skin sheet reactor (Bahnemann,
2004). Higher operating cost and higher carbon footprint are two known disadvantages attributed
to artificial light system, but the alternative -solar irradiation- is less efficient and the light intensity
can be lower (Braham and Harris, 2009).

Chapter 2. Literature Review
20
The annular slurry photoreactor (Figure 2-5) is probably the most used slurry type photoreactor
(Mukherjee and Ray, 1999). The photoreactor consist of a cylindrical tube with a UV source variously
situated depending on the configuration. The source is protected by a quartz jacket transparent to
the radiation and placed within the cylindrical vessel, immersed within the fluid. The disposition of
the source within the aqueous media can be parallel or perpendicular to the flow. Several
modifications of this configuration are also possible, for instance by placing the UV source outside
the reactor vessel with reflectors to direct the illumination to the unit, or by coating the walls of the
vessel with a layer of TiO2. Easy of operation and symmetric irradiation due to its geometrical design
are among the advantages (Lasa et al., 2005). The main drawbacks attributed to this type of
photocatalytic reactor are problems of organic (principally bacteria) and inorganic fouling of the
quartz jacket surface, self-absorption by the lamp, reflection losses, and formation of films at the
quartz-water interface causing radiation absorption (Oppenländer, 2003).
Figure 2-5 Slurry annular photocatalytic reactor, redrawn from Oppenländer (2003), Lasa et al. (2005)
Two main configurations can be highlighted in a photocatalytic membrane reactor (Figure 2-6)
depending on where the membrane filtration unit is positioned with respect to the reactor. One of
these configurations involves an annular slurry batch photoreactor with an ultra-filtration membrane
that can be placed outside the vessel or that can be integrated within the reactor module and be
directly irradiated. This last option offers two possible alternatives: to have the catalyst fixed to the
membrane or in suspension (Mozia, 2010). The attack by free radicals on the illuminated membrane
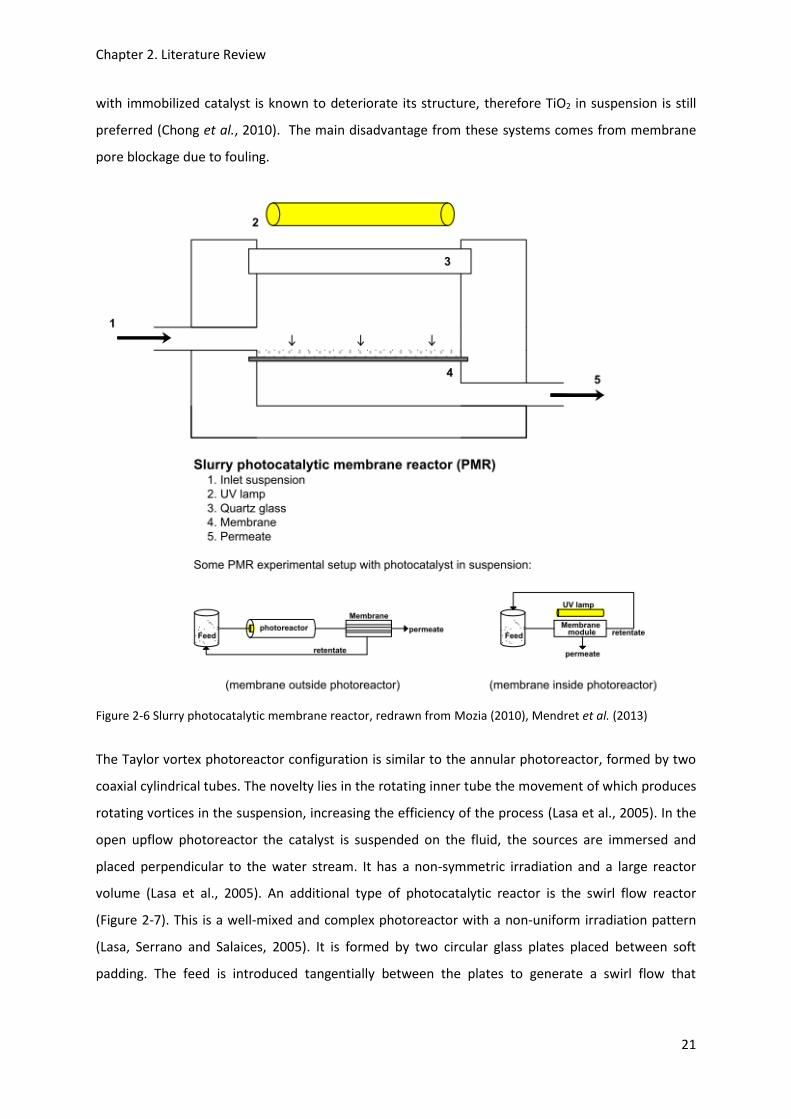
Chapter 2. Literature Review
21
with immobilized catalyst is known to deteriorate its structure, therefore TiO2 in suspension is still
preferred (Chong et al., 2010). The main disadvantage from these systems comes from membrane
pore blockage due to fouling.
Figure 2-6 Slurry photocatalytic membrane reactor, redrawn from Mozia (2010), Mendret et al. (2013)
The Taylor vortex photoreactor configuration is similar to the annular photoreactor, formed by two
coaxial cylindrical tubes. The novelty lies in the rotating inner tube the movement of which produces
rotating vortices in the suspension, increasing the efficiency of the process (Lasa et al., 2005). In the
open upflow photoreactor the catalyst is suspended on the fluid, the sources are immersed and
placed perpendicular to the water stream. It has a non-symmetric irradiation and a large reactor
volume (Lasa et al., 2005). An additional type of photocatalytic reactor is the swirl flow reactor
(Figure 2-7). This is a well-mixed and complex photoreactor with a non-uniform irradiation pattern
(Lasa, Serrano and Salaices, 2005). It is formed by two circular glass plates placed between soft
padding. The feed is introduced tangentially between the plates to generate a swirl flow that

Chapter 2. Literature Review
22
promotes high mixing. The photocatalyst can be deposited on the plates or be suspended in the fluid
(Gogate and Pandit, 2004).
Figure 2-7 Swirl flow photocatalytic reactor, redrawn from Ray and Beenackers (1997)
Fluidized bed photoreactors (Figure 2-8) are designed to keep the catalyst particles in a suspended
or fluidized state while the liquid moves upwards.
Figure 2-8 Fluidized bed photocatalytic reactor, redrawn from Imoberdorf et al. (2008), McCullagh et al. (2011)

Chapter 2. Literature Review
23
To overcome the drifting away of the fine TiO2 particles from the reaction zone in the vessel, several
approaches have been developed, such as coating the semiconductor onto activated carbon,
ceramic particles or glass beads (McCullagh et al., 2011). These solutions help to fluidize and
distribute evenly the catalyst. As in the previous case, packed bed photocatalytic reactors (Figure
2-9) are designed to overcome the necessity of post-separation treatments to recover the catalyst.
The TiO2 is supported on a support packing material (glass beads, sand, and others), and the lamp is
usually place within the reactor to increase the proportion of bed illuminated (Braham and Harris,
2009). These support particles are characterized by a low light absorption and high substrate
adsorption properties (Ida et al., 2014). The advantages associated with the packing system this
design uses are the high TiO2 surface areas and high mass transfer rates (Braham and Harris, 2009).
Figure 2-9 Packed bed photocatalytic reactor with TiO2 supported on SiO2 beads, redrawn from Ida et al. (2014)
The falling film reactor has several variants. One of the prototypes can be considered a version of
the slurry annular reactor. In this case, the photocatalyst is coated to the walls of the outer tube, the
source is centred and housed in the quartz glass tube, and the water stream film falls from the top
liquid distributor on the vessel walls, between the two coaxial cylinders (Puma and Yue, 1998). Other
configuration is the called falling film step photoreactor made of many regular steps irradiated by
the UV lamp (Ochiai and Fujishima, 2012; Boyjoo, Ang and Pareek, 2013). The water is introduced at

Chapter 2. Literature Review
24
the top and is recirculated in a closed loop mode. Similar to the falling film reactor is the inclined flat
bed photocatalytic reactor (Figure 2-10). The cited advantages of this configuration are the
avoidance of fouling and film formation, and the disadvantages are the reduced surface area to
volume ratio that limits the activity of the catalyst.
Figure 2-10 Inclined flat bed photocatalytic reactor, redrawn from Fathinia and Khataee (2013)
Another type of immobilized photoreactor is the multiple tube reactor. This photoreactor is
constructed with multiple hollow quartz glass tubes coated with titania and placed within a
cylindrical vessel. Irradiation is supplied from one end of the tubes and dispersed inside the tubes
using a reflector (Lasa et al., 2005). In the case of a spiral glass tube reactor the photocatalyst is
coated onto a spiral tube wrapped around a UV source. The reactor provides a high catalyst surface
area per unit volume, but reduced contact water-catalyst due to a more complex hydrodynamics
(Lasa et al., 2005).
The tube light reactor consists of 21 U-shaped sources placed one after another around a stainless
steel plate with 21 holes for electrical connections, enclosed in a rectangular stainless steel vessel
with catalyst coating on the glass tube and feed introduced at the top of the vessel (Figure 2-11).
Among the main advantages of this photoreactor is the capability for scaling up to any dimension
that it is economical as compared to other designs, and the large area of irradiated TiO2 per unit of
reactor volume. But the overall reactor efficiency is lower due to large excess of light energy also,
the design presents non-uniform irradiation and complex hydrodynamics (Mukherjee and Ray, 1999;
Lasa et al., 2005).

Chapter 2. Literature Review
25
Figure 2-11 Tube light photocatalytic reactor, redrawn from Mukherjee and Ray (1999)
The scale-up of slurry type photoreactors with TiO2 particles in suspension and systems with the light
source placed outside the reactor are limited to small scale applications or if applied to large scale,
large number of units are required (Mukherjee and Ray, 1999). In contrast, systems with narrow
sources immersed within the reactor, with irradiation distributed by reflectors and light conductors,
and with the catalyst fixed to a structure such as beads, plates, rods or tubes inside the reactor have
possibility of scale-up based on the values of the parameter k the illuminated catalyst surface area in
contact with the reaction liquid in the reactor volume (m2/m3), calculated from these designs and
that determines the volume of a photocatalytic reactor based on the equation (Mukherjee and Ray,
1999):
𝑉𝑅 =𝑄𝐶𝑖𝑛𝑋
𝑘𝑅
where Q is the volumetric flow rate (m3/s), Cin is the inlet pollutant concentration (mol/m3), X is the
fractional conversion desired, and R is the average mass destruction rate (mol/m2/s).
2.2.3 Regeneration by UV/TiO2 heterogeneous photocatalysis
Regeneration of activated carbon by AOPs is the subject of the present work and it is analysed in
more detail in the next section. Research of the coupling of physical adsorption with AOPs is shown
in Figure 2-12. The source of this graph as well as its formation is part of a bibliographic mapping

Chapter 2. Literature Review
26
study described in more detail in the Appendix A. Several research areas can be distinguished in the
graph. The biggest cluster shown in the figure belongs to the study of TiO2 and activated carbon in
the field, in the lower left corner cluster represents the research discipline devoted to study
regeneration of activated carbon using Fenton or any use of activated carbon to improve Fenton
technology, and that in the lower right corner refers to the ozonation/activated carbon topic.
Figure 2-12 Document Citation Network at Resolution = 1.0 showing three major cluster: TiO2/AC, Fenton/AC and Ozonation/AC, where AC denotes activated carbon

Chapter 2. Literature Review
27
The regeneration of spent adsorbents using UV/TiO2 heterogeneous photocatalysis has been
demonstrated by several researchers. Some researchers have investigated the photocatalytic
regeneration of an adsorbent polymer saturated with different cationic dyes using TiO2
photocatalysis (Dhodapkar et al., 2007). They concluded that the regeneration of the spent
adsorbent was effective through several cycles with only 10% reduction of the adsorption capacity of
the original carbon, attributed by the authors to the blocking of active sites by TiO2. Other
researchers studied the regeneration of baker's yeast biosorbent and simultaneous photo-
degradation of the desorbed dye using acid TiO2 hydrosol under sunlight (Yu et al., 2009). Under this
particular integrated biosorption and photocatalytic oxidation system, dyes were desorbed and
simultaneously degraded at acid conditions. The analysis of the adsorption, regeneration and reuse
of spent modified sugarcane bagasse adsorbent (methylene blue as adsorbate) through TiO2/UV
photocatalysis has been reported (Xing, Liu and Zhang, 2010). Effective regeneration of the spent
adsorbent, but with poorer adsorption (85% of neat adsorption capacity of the adsorbent) was the
authors’ main conclusion. Other workers have researched the technical feasibility of using
heterogeneous advanced oxidation for the regeneration of a spent commercial activated carbon,
loaded with chloroform and regenerated in TiO2 slurry reactor using artificial and solar radiation
(Notthakun et al., 1993). Regeneration times longer than adsorption times were found for capacity
recoveries higher than 90% in TiO2 slurry reactors. Only when TiO2 was not suspended, but instead
impregnated in the carbon, was the regeneration time reduced to one-fifth of the adsorption time,
attributed by the authors to the elimination of diffusion step from the exterior surface of the
adsorbent to the catalyst where the reaction takes place. But they could not justify the use of the
adsorption step, due to the higher amount of oxidant consumed in the hybrid process with respect
to conventional AOP. Some researchers (Notthakun et al., 1993; Mourand et al., 1995; Muranaka
and Julcour, 2009; Yu et al., 2009) compared the coupled adsorption and AOP system with
conventional AOP, whilst other workers (Huling and Arnold, 2000; Liu, Sun and Zhang, 2004;
Dhodapkar et al., 2007; Xing, Liu and Zhang, 2010) did not provide a similar comparison, therefore,
the full justification of the adsorption and AOP hybrid combination was not fully demonstrated. With
the exception of the studies of Notthakun et al. (1993), all the work undertaken to date with TiO2
was done at a small scale, using volumes not greater than 500 mL, and regenerated carbon masses
of the order of milligrams. Notthakun et al. in a later publication investigated the regeneration of
spent adsorbents using homogeneous advanced oxidation (Mourand et al., 1995), which has led to a
greater number of research publication with apparently promising results so far (Huling et al., 2005,
2012; Huling, Kan and Wingo, 2009; Muranaka and Julcour, 2009). Table 2-2 and Table 2-3 show the
conditions under which the oxidation step was conducted in the regeneration of activated carbon by

Chapter 2. Literature Review
28
Fenton and TiO2 technologies, respectively. The type of pollutant, the regeneration achieved, as well
as the number of cycles used is indicated in the tables. Whilst most of the adsorbents applied in
Fenton experiments were well known commercial types, some of the adsorbents selected to carry
out regeneration using TiO2 photocatalysis were of very low capacity, as low as 22.36 mg/g
(Dhodapkar et al., 2007) or 52.6 mg/g (Yu et al., 2009). Furthermore, in general the scale of the
experiments performed with in TiO2 investigations as compared with the Fenton approach was
lower.
Table 2-2 Summary of experimental conditions (oxidation step) from literature. Activated carbon regeneration including number of cycles and regeneration percentage (“Reg.”) using Fenton, H2O2/UV and Na2S2O8/H2O2
Pollutant Photoreactor type Volume Time Reg. Cycles Ref.
Fenton (Fe/H2O2)
2-CP Erlenmeyer flask 1 g EXP4 GAC
100 ml
24 h 89% 2 (Huling and Arnold,
2000)
MTBE Column reactor upflow
mode, fluidize GAC bed
16.3 g BCP GAC
2 L
24 h 91% 2 (Huling et al., 2005)
MTBE Erlenmeyer flask 5 g URV GAC
120 ml
24 h 29% 1 (Huling, Jones and
Lee, 2007)
MTBE 250 ml Erlenmeyer flask 9 g GAC
120 ml
24 h 42-72% 1 (Huling, Kan and
Wingo, 2009)
MTBE Column reactor upflow
mode
1.65 kg URV GAC
7 L
6.5-60 h 62% at 25 °C
95% at 50 °C
3 (Huling et al., 2012)
phenol Continuous fixed bed 1.7 g L27 GAC
500 ml
5 h 40% 2 (Muranaka and
Julcour, 2009)
H2O2/UV
CF Two-L glass beaker with
UV light source inside
3g Ambersorb-
572F resin
1.6 L
264 h 92% 1 (Mourand et al.,
1995)
Na2S2O8/H2O2 thermally enhanced
MTBE 250 ml Erlenmeyer flask 5 g URV GAC
120 ml
20 min-
3h
61% 1 (Huling et al., 2011)
2-CP = 2-chlorophenol, MTBE = Methyl tert-butyl ether, CF = Chloroform
The coupling of physical adsorption with TiO2 photocatalysis offers two possible configurations
(Augugliaro et al., 2006): in one case, the pollutant is loaded onto the adsorbent and then irradiated
along with the photocatalyst forming a pseudo-composite suspension; and in the other case, the
semiconductor and the adsorbent (acting as support) are chemically bound to form a composite. In
this case adsorption and photocatalysis take place concurrently, while in the former scenario the
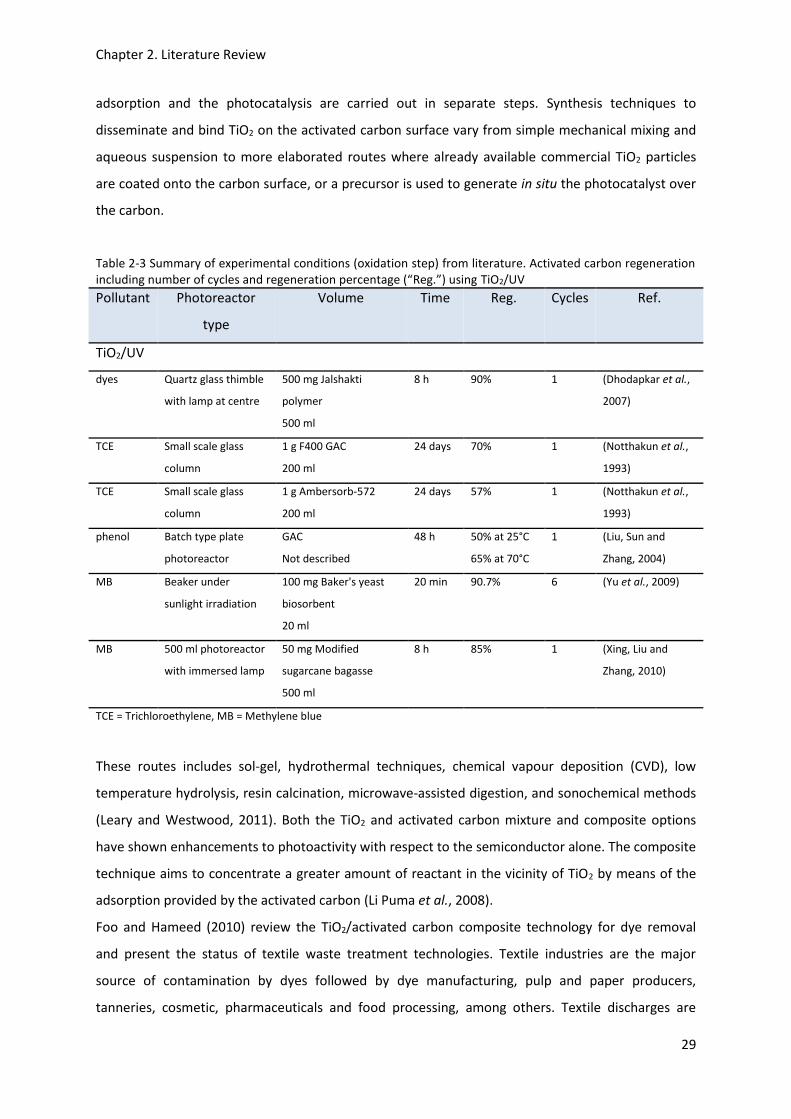
Chapter 2. Literature Review
29
adsorption and the photocatalysis are carried out in separate steps. Synthesis techniques to
disseminate and bind TiO2 on the activated carbon surface vary from simple mechanical mixing and
aqueous suspension to more elaborated routes where already available commercial TiO2 particles
are coated onto the carbon surface, or a precursor is used to generate in situ the photocatalyst over
the carbon.
Table 2-3 Summary of experimental conditions (oxidation step) from literature. Activated carbon regeneration including number of cycles and regeneration percentage (“Reg.”) using TiO2/UV
Pollutant Photoreactor
type
Volume Time Reg. Cycles Ref.
TiO2/UV
dyes Quartz glass thimble
with lamp at centre
500 mg Jalshakti
polymer
500 ml
8 h 90% 1 (Dhodapkar et al.,
2007)
TCE Small scale glass
column
1 g F400 GAC
200 ml
24 days 70% 1 (Notthakun et al.,
1993)
TCE Small scale glass
column
1 g Ambersorb-572
200 ml
24 days 57% 1 (Notthakun et al.,
1993)
phenol Batch type plate
photoreactor
GAC
Not described
48 h 50% at 25°C
65% at 70°C
1 (Liu, Sun and
Zhang, 2004)
MB Beaker under
sunlight irradiation
100 mg Baker's yeast
biosorbent
20 ml
20 min 90.7% 6 (Yu et al., 2009)
MB 500 ml photoreactor
with immersed lamp
50 mg Modified
sugarcane bagasse
500 ml
8 h 85% 1 (Xing, Liu and
Zhang, 2010)
TCE = Trichloroethylene, MB = Methylene blue
These routes includes sol-gel, hydrothermal techniques, chemical vapour deposition (CVD), low
temperature hydrolysis, resin calcination, microwave-assisted digestion, and sonochemical methods
(Leary and Westwood, 2011). Both the TiO2 and activated carbon mixture and composite options
have shown enhancements to photoactivity with respect to the semiconductor alone. The composite
technique aims to concentrate a greater amount of reactant in the vicinity of TiO2 by means of the
adsorption provided by the activated carbon (Li Puma et al., 2008).
Foo and Hameed (2010) review the TiO2/activated carbon composite technology for dye removal
and present the status of textile waste treatment technologies. Textile industries are the major
source of contamination by dyes followed by dye manufacturing, pulp and paper producers,
tanneries, cosmetic, pharmaceuticals and food processing, among others. Textile discharges are

Chapter 2. Literature Review
30
complex in nature, comprising salts, surfactants, acids and alkalis, and several types of dyes with
concentrations typically in the range 10 to 50 mg/L in solution (Alinsafi et al., 2007). Currently
700,000 tons of globally produced waste is produced annually and the forecast for the next 20 years
predicts an expansion of this sector and a subsequent increase in waste generation (Yuen and
Hameed, 2010a). Wastewaters from dye manufacturing plants are subject to several treatment
methods before being discharged: neutralization of acid and alkaline effluents, removal of heavy
metals, aerobic/anaerobic biological treatment and chemical oxidation (Ali and Ali, 2004). Colour is
usually removed by adsorption onto activated carbon or by chemical treatment with flocculating
agents (Fe3+ or Al3+ ions). Alternatively, dye removal from industrial effluents has also been
performed using methods that can be classified into four major groups: physical (e.g. adsorption,
sedimentation, coagulation, membrane filtration), chemical and photochemical (e.g. H2O2 oxidation,
Fenton oxidation, chlorination, photochemical oxidation), electrochemical (e.g. electrocoagulation,
electroflotation) and biological (e.g. aerobic and anaerobic bacterial degradation) (Garcia Einschlag,
2011). In general, there is not a definitive treatment solution for the removal of such compounds
(Yuen and Hameed, 2010a; Garcia Einschlag, 2011), limitations occur in cases like adsorption due to
regeneration difficulties, and in other cases such in Fenton or sedimentation due to the generation
of large quantities of sludge. Applications of TiO2/activated carbon composites to treat dye
wastewaters has generated a considerable number of publications, that besides having achieved
high degrees of degradation, but they suffer from the limitation that they were carried out with low
volumes and generally employed only deionized water. The TiO2/activated carbon hybrid material
has not proved yet complete adequacy to treat textile wastes but it is capturing increasing attention
as potential solution to the treatment of polluted waters. The above mentioned composite was seen
to have the following advantages (Yuen and Hameed, 2010a): the efficiency of the hybrid composite
material was favoured at lower activated carbon content which was seen to promote a stronger
interphase interaction between the photocatalyst and the adsorbent. The hybrid material improved
the optical activity of TiO2 in the visible light region, had greater stability and durability, showed
higher degradation rates and capacity (new adsorption centres), easier recovery through filtering,
multiple reuse and wider application than its constituents.
The interaction and effects between carbon and TiO2 are of major importance for regeneration
purposes, and these will be briefly reviewed below. The photocatalytic degradation of phenol or 4-
chlorophenol with a suspended mixture of TiO2 and activated carbon has been extensively
investigated (Matos, 1998, 2001; Herrmann et al., 1999; Cordero, Duchamp, et al., 2007; Matos,
Chovelon, et al., 2009; García and Matos, 2010). These studies relied mainly on the comparison of
apparent first-order rate constant of pollutant degradation of TiO2 against TiO2 and activated carbon

Chapter 2. Literature Review
31
mixture to determine enhancements to TiO2 photoactivity. The main conclusions were as follows:
Firstly, carbon activated at high temperature (H-type activated carbon) induced a synergistic effect
in the photoactivity of TiO2 for the degradation of 4-chlorophenol (Cordero, Chovelon, et al., 2007),
the carbon was in intimate contact with TiO2, through a well-dispersed layer of TiO2, with the
subsequent transference of electron density from basic activated carbon to semiconductor. High
surface area and basic surface pH (high pHPZC where PZC denotes point of zero charge) from H-type
activated carbon and TiO2 seemed to favour the interaction with TiO2 (Cordero, Chovelon, et al.,
2007; Matos, Chovelon, et al., 2009; García and Matos, 2010). Secondly, small changes in pHPZC of
activated carbon induced important changes on the surface of TiO2 and this affected the reaction
mechanism (Matos, Garcia, et al., 2009). Thirdly, Low temperature activated carbon (L-type) and
TiO2 induced both beneficial and detrimental effects on TiO2 activity in the photocatalytic
degradation of 4-chlorophenol. Synergistic effects were attributed to the presence of carboxylic
acids on the activated carbon surface detected by FTIR (Cordero, Buchamp et al., 2007). Fourthly,
the synergistic (i.e. a higher degradation rate) or inhibitory effects (i.e. a lower degradation rate) and
the formation of the different intermediate products have been correlated to the origins and the
properties of the two types of activated carbon employed (Matos, 2001). In this study the L-type
activated carbon inhibited TiO2 photoactivity and the H-type enhanced it. Synergistic effects were
not eliminated when reusing the TiO2, and the activated carbon mixture could be extrapolated to a
large solar pilot plant scale (Herrmann et al., 1999). Lastly, a TiO2 and activated carbon mixture was
able to photomineralize phenol for several consecutive runs more efficiently than TiO2 alone (Matos
et al., 2007). Other authors performed similar experiments using azo dyes (Silva et al., 2006) and
humic substances in water (Areerachakul et al., 2008) with positive effects on the photocatalytic
degradation by the addition of a TiO2 and activated carbon mixture.
2.2.4 Factors that contribute to desorption of the pollutant
Regeneration is a two-step process: adsorption of pollutant by the carbon until all the adsorption
sites are saturated, and subsequent photocatalytic exposure to desorb and simultaneously degrade
the compound. Photocatalytic regeneration consists of four steps (Liu, Sun and Zhang, 2004):
adsorbate diffusion from within the activated carbon, adsorbate adsorption and oxidation on TiO2
surface, and desorption of the oxidized product from the photocatalyst to the bulk solution. In
general, for an activated carbon to be regenerated, the adsorbate must be relatively weakly
adsorbed (Knaebel, 1999). Likewise, the photocatalytic regeneration process was found to be limited
by desorption of the adsorbates from the interior of the carbon (Takeda et al., 1995; El-Sheikh et al.,
2007), and require very long times for completion (Sheintuch and Matatov-Meytal, 1999). A pre-
desorption treatment was suggested as a possibility to maximize the photocatalytic efficiency. Fast

Chapter 2. Literature Review
32
desorption kinetics was seen as a requirement for the regeneration of activated carbon to proceed
at an acceptable rate (Notthakun et al., 1993; Mourand et al., 1995). Based on these findings,
Crittenden et al. (1997) suggested enhancing the desorption rate of the spent activated carbon
during photocatalytic treatment by applying heat. The adsorbent was impregnated with the
photocatalyst, loaded with the contaminant (trichloroethylene) and exposed to a UV source while
passing hot water over it at 90 °C. It was concluded that, although photocatalytic oxidation occurred,
the predominant method of regeneration was desorption and convective transfer by the hot water
and not the UV irradiation of the photocatalyst.
Thus desorption should be seen as a prerequisite step for photocatalytic regeneration, as it
apparently is for other regenerative process such as bioregeneration. Aktaş and Çeçen (2007)
reviewed the main factors which affect desorption of adsorbed solutes in general and in
bioregeneration technology. Operating conditions such as changes in pH or a decrease in the liquid
phase concentration, affect desorption of the adsorbate from the activated carbon. Other important
factors influencing adsorption reversibility are the change in the Gibbs free energy of adsorption.
The higher the adsorption energy, the lower will be the reversible adsorption. With respect to the
carbon, the carbon size, if powdered or granular, was claimed not to have a critical effect on the
reversibility of the adsorption (powdered carbon had higher intraparticle diffusivity and hence
desorption rate, but this does not control total desorbability). Whereas, factors with a greater
control than the particle size over desorption would be the carbon pore size distribution
(mesoporous was more regenerable than microporous activated carbon) and the activation process
itself. The activation process was described as more crucial in determining the extent of adsorption
reversibility (thermally activated carbons showed a higher extent of irreversible adsorption than
chemically activated carbons, independently of the particle size).
2.3 Adsorption Process
2.3.1 Structure of an activated carbon
Activated carbon can be considered as molecular space (porosity) with the dimensions of atoms and
molecules that is created by groups of carbon atoms in close proximity (Marsh and Rodríguez-
Reinoso, 2006). Intense London dispersion forces act within this space to produce the phenomenon
of physical adsorption. The structure of this adsorbent is formed by graphene layers which are highly
imperfect, contain five-, six-, and seven-membered ring systems, and are rarely stacked in groups of
two or three. Hydrogen, oxygen and possibly nitrogen and sulphur are located at the edges of the
graphene layers. The carbon network is composed of bent layers composed of sp2-bonded carbon.
The curvature within the layers is believed to come from the strain generated by the five and seven

Chapter 2. Literature Review
33
membered rings mentioned above. The sp3-like atoms are to be found bonding together in these
distorted layers.
Figure 2-13 (A) Single graphene layer, non-planar, with vacancies, and with five- and seven-membered rings; and (B) one of the most general accepted models of the structure of an activated carbon, with curved graphene layers, and empty space known as porosity filled with methylene blue (MB) molecules, adapted from Marsh and Rodríguez-Reinoso (2006)
The existence of sp-bonding is suggested in layers associated with ring structures made up of more
than six carbon atoms (Marsh and Rodríguez-Reinoso, 2006). If the single graphene layer from Figure
2-13 (A) is folded over to itself several times and binds to other graphene layers widely at frequent
intervals, the arrangement depicted in Figure 2-13 (B) is found, which shows the carbon structure
stabilized and with holes describing a continuous labyrinth of pores (pore size distribution).
2.3.2 Adsorption Equilibrium
Characteristics and Process Variables
Adsorption is a spontaneous process accompanied by the release of energy (the stronger the
adsorption, the more exothermic the process will be) (Bansal and Goyal, 2005). If the attraction
between the adsorbate and the adsorbent is due to van der Waals forces, the adsorption is said to
be physical, however if there are exchange or sharing of electrons between the compound and the
solid surface, then the adsorption process is called chemisorption. This is accompanied by a higher
release of energy than the former case because of the chemical bonding. Another dissimilarity

Chapter 2. Literature Review
34
between both adsorption scenarios is the possibility of forming layers of adsorbed compounds on
the surface of the solid if the adsorption is purely physical, while in the case of chemisorption the
adsorption is limited to a monolayer. If both chemisorption and physisorption happens at the same
time, then the process is better defined as sorption. The type of adsorption, if physical, chemical or
electrostatic, is determined by many variables: the properties of the contaminant, its concentration,
the structure and nature of the carbon surface, the experimental conditions such as the flow rate,
the temperature, pH, the ionic strength of the solution and the time exposure of water to activated
carbon (Bansal and Goyal, 2005; Wang et al., 2005). Figure 2-14 illustrates how the surface coverage
of the adsorbent changes with the size of the molecule being adsorbed, and points out the
difference between a monolayer and a multilayer system, where N represents the number of layers.
Figure 2-14 Diagram of molecules of difference sizes adsorbed onto the pore system of the carbon material (left), and a three layer molecules (N=3) on the carbon surface (right), adapted from Bandosz (2006)
Adsorption of dyes onto activated carbons (Duri, 1988; Porkodi and Kumar, 2007; Rodríguez et al.,
2009; Hadi, Samarghandi and McKay, 2010; Atun et al., 2011; Mahmoodi, Salehi and Arami, 2011)
and, more specifically, methylene blue onto activated carbons (Tseng, Wu and Juang, 2003; Wang et
al., 2005; Kumar and Porkodi, 2007; Wang and Zhu, 2007; Elqada, Allen and Walker, 2008;
Bayramoglu, Altintas and Arica, 2009) have been extensively researched. In aqueous solutions,
adsorption of ionic dyes by carbons rely upon the chemistry of the adsorbent surface primarily, and
secondarily on the porous structure of the carbon (Bansal and Goyal, 2005). Methylene blue
adsorption onto activated carbon was described to be profoundly affected by the carbon surface
chemistry and solution pH (Bottani and Tascón, 2008). It has been reported that molecular dyes will
adsorb only in pores where the average micropore diameter increased to about 1.7 times the
molecule’s second widest dimension (>1.43 nm in the case of methylene blue) (Pelekani and
N=1
N=3N=2
Chapter 2. Literature Review
35
Snoeyink, 1999; Tkachenko et al., 2006), although Pelekani and Snoeyink (2000) pointed out that this
might not be universally valid because those authors used shorter contact times than required for a
molecule to access pores similar in size. The shorter contact time and very high concentration used
by those researchers would focus the adsorption in the larger pores rather than occurring in small
micropores.
Adsorption Isotherm Models
The most important attributes of an adsorbent in any adsorption application are: capacity,
selectivity, regenerability, kinetics, compatibility and cost (Knaebel, 1999). Among them, adsorption
capacity (also called “loading”) is the most important characteristic of an adsorbent. It is the amount
of adsorbate taken up by the activated carbon per unit mass of carbon. Loading is important to the
cost of the operation because it determines the amount of adsorbent required. Usually, in order to
estimate the adsorption capacity of an activated carbon, it is essential first, to have information on
adsorption equilibrium. Then kinetic analysis is conducted based on rate process (Suzuki, 1990;
Duong, 1998; Hamdaoui and Naffrechoux, 2007) .
In general, an adsorption isotherm can be obtained by applying the equation given below and
varying only the initial concentration of the solute C0, or only the volume of solution V, or only the
mass of adsorbent W, and keeping the remaining parameters constant
𝑞𝑒 =(𝐶0 − 𝐶𝑒) ∙ 𝑉
𝑊
(2-1)
where q (mg g-1) is the adsorption capacity for adsorbate uptake, C0 and Ce are the initial and
equilibrium adsorbate concentrations (mg/L), respectively, V is the volume of solution (L) and W is
the weight of adsorbent (g). A few examples of the adsorption of methylene blue onto activated
carbon were collected from scientific data in Table 2-4. Based on the type of equilibrium experiment,
the tendency is to perform equilibrium adsorption experiments by keeping the mass of the
adsorbent (W) constant and to vary the initial dye concentration (C0).
Adsorption isotherm models with two parameters (e.g. the Langmuir and Freundlich equations) are
used to understand the interactions between the adsorbate and the adsorbent. Other models (e.g.
Temkin, Fowler-Guggenheim, Kiselev and Hill-de Boer equations) allow the determination of the
energy of adsorption, interaction energy between adsorbed molecules and complex formation by
the adsorbate (Hamdaoui and Naffrechoux, 2007).

Chapter 2. Literature Review
36
Table 2-4 Classification of methylene blue equilibrium adsorption experiments using activated carbon (AC)
Type of
fitting(1)
Isotherm used and best fit(2) Type adsorbent Reference
N-L Freundlich, Langmuir, Redlich-Peterson powdered activated carbon (Kumar and Sivanesan,
2006)
L Langmuir, Freundlich, BET AC from Egyptian rice chemically
activated (H2SO4)
(El-Halwany, 2010)
N-L Freundlich, Langmuir, Sips, Redlich-Peterson AC from Brasilian pine-fruit
chemically activated (H2SO4)
(Royer et al., 2009)
L Freundlich, Langmuir Commercial AC (Kannan and
Sundaram, 2001)
L Freundlich, Langmuir, Redlich-Peterson Commercial powdered AC (Qada et al., 2008)
N-L Freundlich, Langmuir, Toth, Redlich-Peterson AC from coconut shell by NaOH
activation
(Cazetta et al., 2011)
L Freundlich, Langmuir, Redlich-Peterson AC from bituminous coal (El Qada et al., 2006)
L Langmuir AC from artichoke leaves chemically
activated (phosphoric acid)
(Benadjemia et al.,
2011)
L and N-
L
Langmuir Commercial granular AC (Raposo, De La Rubia
and Borja, 2009)
N-L Freundlich, Langmuir, Redlich-Peterson AC from wood apple (Malarvizhi and Ho,
2010)
L Freundlich, Langmuir Commercial AC
Lignite
(Qi et al., 2011)
L Freundlich, Langmuir AC from bark, chemically activated (Arivoli, 2010)
L Freundlich, Langmuir, Redlich-Peterson Bituminous coal-based AC (El Qada et al., 2006)
L Freundlich, Langmuir, Redlich-Peterson Commercial powdered AC (Karaca et al., 2008)
L Langmuir AC from pit and olives stones
chemically activated
(El-Sharkawy, Soliman
and Al-Amer, 2007)
L Langmuir, Freundlich Sludge-based AC (Li et al., 2011)
N-L Freundlich, Langmuir, Toth, Redlich-
Peterson, Jovanovich, Harkins-Jura,
Tempkin, Radke-Prausnitz, Sips, Vieth-
Sladek, Brouers-Sotolongo
AC from flamboyant pods (Vargas et al., 2011)
(1) N-L non-linear fitting model, L Linear fitting model
(2) Best fit of the data to the model (highlighted by the authors) underlined
All isotherms should reduce to Henry’s law at extreme dilution. In practice, some of the most
commonly applied isotherms (e.g. Freundlich, Temkin, Sips, Dubinin-Radushkevich, Dubinin-
Astakhov) do not reduce to Henry’s law at the limit of zero loading and, therefore, because they are
thermodynamically inconsistent, the interpretation of their parameters should be done carefully.

Chapter 2. Literature Review
37
The following paragraphs describe the isotherms, their main assumptions, parameter interpretation
and range of application. For convenience, concentrations will be expressed in mg/L and mg/g the
units of the activated carbon loading (i.e. equilibrium capacity). qm corresponds to monolayer
loading for Henry, Langmuir, Freundlich, Koble-Corrigan (K-C), BET and BDDT equations, whilst for
the other models it represents an estimate maximum loading. A more comprehensive explanation of
the adsorption equilibria fundamentals is presented in Bansal and Goyal (2005) and Duong (1998)
and article reviews (Kumar and Sivanesan, 2006; Yuen and Hameed, 2010b) .
Henry’s law
The following equation describes the simplest equilibrium concept in which adsorption is
proportional to the fluid-phase concentration
𝜃 =𝑞𝑒𝑞𝑚= 𝐾 ∙ 𝐶 (2-2)
where K is the Henry’s law constant traditionally defined as the initial slope of the fractional
coverage (θ) versus concentration (C), and qm and qe correspond to monolayer loading and
adsorption capacity respectively. The Henry’s law constant provides a calculation of the interaction
between an adsorbed molecule and the most favourable adsorption sites on the surface (Ruthven,
1984). It is determined from low-concentration isotherm data or from the Langmuir isotherm
through the following equation (Yang, 2003)
𝐾 = 𝑞𝑚𝑏 (2-3)
where b is the Langmuir constant and qm the maximum adsorption capacity. Strong adsorption
yields a high Henry’s law constant (Yang, 2003).
Langmuir
This is the fundamental adsorption isotherm equation and is expressed thus
𝑞𝑒 =𝑞𝑚𝑏𝐶𝑒1 + 𝑏𝐶𝑒
(2-4)
where Ce (mg/L) equilibrium concentration of the solute in the bulk solution, qe (mg/g) amount of
adsorbate adsorbed per unit weight of adsorbent at equilibrium (i.e. adsorption capacity), qm (mg/g)
the monolayer adsorption capacity, and b (L/mg) is the constant related to the free energy of
adsorption (exponentially proportional to the heat of adsorption) which expresses the interaction
between the adsorbate molecule and the surface atoms (Duong, 1998). The disadvantages of this
model are the assumptions that the adsorption sites on solid surfaces are energetically homogenous
and that there are no lateral interactions between the adsorbed molecules. The Langmuir theory
was derived for monolayer adsorption and also assumes that the heat of adsorption to be
Chapter 2. Literature Review
38
independent of the surface coverage. However, direct determinations of heat of adsorption shows
that this parameter always decreases with increasing surface coverage (Bansal and Goyal, 2005;
Yuen and Hameed, 2010b).
Freundlich
The Freundlich equation can be written as
𝑞𝑒 = 𝐾𝐹𝐶𝑒1𝑛⁄ (2-5)
where KF (mg1-(1/n)L1/n g-1) is a constant indicative of the relative adsorption capacity of the adsorbent
and n is a constant indicative of the intensity of the adsorption. To determine the monolayer
adsorption capacity from the Freundlich equation, it is necessary to operate with constant initial
concentration C0 and variable weights of adsorbent, thus ln 𝑞𝑚 is the extrapolated value of lnq for
C=C0 according to Hamdaoui and Naffrechoux (2007)
𝐾𝐹 =𝑞𝑚
𝐶01 𝑛⁄
(2-6)
This empirical model assumes that as the adsorbate concentration increases, the concentration of
adsorbate on the adsorbent surface also increases. The equation is of special importance for
chemisorption although some physical adsorption has also been interpreted using this model. This
isotherm is likely to be more widely obeyed than the Langmuir isotherm because the heat of
adsorption normally falls with increasing surface coverage. This effect is represented by the
parameter n that allows for heterogeneity of the solid surface. The disadvantage is that the
Freundlich plot is logarithmic in form and, the heat of adsorption is more nearly linear than
logarithmic (Bansal and Goyal, 2005) and it does not have the Henry’s law limit nor indeed any
saturation limit (Duong, 1998). The Freundlich equation is suitable only at medium concentration
ranges. The model is empirical in nature, thermodynamically inconsistent at high and low
concentrations, and widely applied in heterogeneous systems (e.g. organic compounds or highly
interactive species on activated carbon) (Yuen and Hameed, 2010b).
Dubinin-Astakhov and Dubinin-Radushkevich
The Dubinin-Astakhov adsorption isotherm is
𝑞𝑒 = 𝑞𝑚𝑒𝑥𝑝(−𝐵𝐷 ∙ (𝐴)𝑛) (2-7)
where n describes the surface heterogeneity, a structural parameter of carbon that is determined
only by the standard deviation of micropore sizes, and qm (mg g-1), the maximum theoretical
saturation capacity. The characteristic energy E (J mol-1) and the adsorption potential A (J mol-1) are
defined by Samiey and Ashoori (2012)

Chapter 2. Literature Review
39
𝐸 = 1√2𝐵𝐷⁄ (2-8)
𝐴 = 𝑅𝑇 ln (1 +1
𝐶𝑒)
(2-9)
where R, T and Ce represent the gas constant (8.314 J/mol K), absolute temperature (K) and
adsorbate equilibrium concentration (mg/L), respectively. This adsorption potential A is the change
of the Gibbs free energy on adsorption: 𝐴 = −∆𝐺𝑎𝑑𝑠. The characteristics energy of the adsorbed
specie (E, J mol-1) is a measure of the strength of the interaction between the activated carbon and
the volume of adsorbate adsorbed. A higher E gives rise to steeper isotherm curves (Duong, 1998).
For n=2 we get the Dubinin-Radushkevich adsorption isotherm that can be written as follows:
𝑞𝑒 = 𝑞𝑚𝑒𝑥𝑝(−𝐵𝐷 ∙ (𝐴)2) (2-10)
The model suggests that the adsorption process is by micropore volume filling as opposed to layer-
by-layer adsorption on pore walls (Inglezakis, 2007). The Dubinin-Radushkevich equation can be
applied to experimental adsorption isotherms to determine thermodynamic properties such as heat
of adsorption and the Henry’s law constant.
Hill
The equation describing the Hill model is
𝑞𝑒 =𝑞𝑆𝐻𝐶𝑒
𝑛𝐻
𝑘𝐷 + 𝐶𝑒𝑛𝐻
(2-11)
where 𝑛𝐻 is the Hill cooperativity coefficient of the binding interaction, 𝑞𝑆𝐻 is the Hill isotherm
maximum uptake saturation (mg/L) and 𝐾𝐷 the Hill constant.
𝐾𝐷 = 𝐾𝑑𝑛𝐻 (2-12)
𝐾𝑑 is the dissociation constant per site (mg/L) and is equal to the adsorbate concentration at half
saturation, 𝐾𝑑 = 𝐶𝑒50 , and also 𝐾𝑑 = 1 𝐾𝑎⁄ where 𝐾𝑎 is the association constant. Thus, three
possible situations can occur: 𝑛𝐻 > 1 for a positive cooperative interaction, 𝑛𝐻 = 1 in the case of a
non-cooperative or hyperbolic binding, or 𝑛𝐻 < 1 for a negative cooperative interaction.
This model describes the binding of different species onto homogeneous substrates. The model
assumes that adsorption is a cooperative phenomenon, the ligand binding ability at one site on the
macromolecule, may influence different binding sites on the same macromolecule (Yuen and
Hameed, 2010b). Unfortunately this isotherm does not exhibit Henry’s law behaviour when
concentration is very low (Duong, 1998).

Chapter 2. Literature Review
40
Sips
This is sometimes referred to as the Langmuir-Freundlich equation
𝑞𝑒 =𝑎𝑠𝐶𝑒
𝛽𝑠
1 + 𝑎𝑠𝐶𝑒𝛽𝑠
(2-13)
It is a merged form of Langmuir and Freundlich expressions modified to predict the heterogeneous
adsorption isotherms (Yuen and Hameed, 2010b). 𝛽𝑠 can be considered as the parameter
characterizing the system heterogeneity of the solid, adsorbate or a combination of both (Duong,
1998) . 𝛽𝑠 =1𝑛⁄ . The larger 𝑛 is the more heterogeneous is the system, if 𝑛 equals 1 the model
reduces to the Langmuir form. The equation parameter is governed mainly by the operating
conditions such as changes of pH, temperature and concentration. Similarly to the Freundlich
isotherm, the Sips equation does not adequately model adsorption at low concentrations.
Toth
This equation is described as follows
𝑞𝑒 =𝑘𝑇𝐶𝑒
(𝑎𝑇 + 𝐶𝑒)1𝑡⁄
(2-14)
Here 𝑡, usually less than 1, like 𝛽𝑠 is a parameter that characterizes the system heterogeneity. When
𝑡 = 1 this isotherm reduces to the Langmuir equation. If it deviates further away from unity, the
system is said to be more heterogeneous. This model is deduced from potential theory and it is
applicable to adsorption on heterogeneous surfaces (Rodríguez et al., 2009). Simplicity in form and a
correct characterization at low and high concentration were highlighted as the main characteristics
of this empirical model with advantages over Sips and Freundlich equations (Duong, 1998).
Koble-Corrigan
The equation describing the three parameter empirical model can be written as:
𝑞𝑒 =𝐴𝐶𝑒
𝑛
1 + 𝐵𝐶𝑒𝑛
(2-15)
where A (Ln mg1-n/g) and B (L/mg)n are isotherm constants and n is the adsorption intensity
parameter. The Koble-Corrigan model incorporates both Langmuir and Freundlich isotherm models
(Yuen and Hameed, 2010b) like the Sips model, in fact, equations (2-13) and (2-15) from Sips and
Koble-Corrigan isotherm models, respectively, are essentially the same. It assumes that an adsorbate
molecule can provide more than one active point which can interact with “active centres” of the
adsorbent.

Chapter 2. Literature Review
41
Khan and Radke-Prausnitz
The Khan isotherm is expressed thus:
𝑞𝑒 =𝑞𝑠𝑏𝑘𝐶𝑒
(1 + 𝑏𝑘𝐶𝑒)𝑎𝑘
(2-16)
It is a generalized model recommended for pure solutions.
The Radke-Prausnitz equation has the following form:
𝑞𝑒 =𝑎𝑅𝑃𝑟𝑅𝐶𝑒
𝛽𝑅
𝑎𝑅𝑃 + 𝑟𝑅𝐶𝑒𝛽𝑅−1
(2-17)
Redlich-Peterson
The equation of R-Pe can be represented by equation (2-18)
𝑞𝑒 =𝑞𝑚𝐶𝑒
1 + 𝑏𝑅𝑃𝐶𝑒𝑔
(2-18)
where qm is equivalent to the monolayer capacity (mg/g) and bRP (L/mg) is a parameter of the
Redlich-Peterson isotherm equation. This is a hybrid isotherm characterizing both Langmuir and
Freundlich isotherms (Yuen and Hameed, 2010b). It can describe the adsorption process over a wide
range of concentrations (El Qada et al., 2006) and it is more versatile than the Langmuir and
Freundlich isotherms because it can be applied either in homogeneous or heterogeneous systems
(Rodríguez et al., 2009). The model approaches the Freundlich isotherm model when bRP is large
enough, and when g tends to one the equation reduces to the Langmuir form. If g=0 then it reduces
to the Henry’s law equation.
Brunauer-Emmett-Teller (BET)
The BET isotherm describing multilayer adsorption for liquid phase on energetically homogeneous
solids can be written as (Ebadi et al., 2009)
Case BET-1: m = ∞
𝑞𝑒 =𝑞𝑚𝐾𝑠𝐶𝑒
(1 − 𝐾𝐿𝐶𝑒)(1 + 𝐶𝑒(𝐾𝑠 −𝐾𝐿))
(2-19)
Case BET-2:
𝑞𝑒 =𝑞𝑚𝐾𝑠𝐶𝑒[1 − (𝑚 + 1)(𝐾𝐿𝐶𝑒)
𝑚 +𝑚(𝐾𝐿𝐶𝑒)𝑚+1]
(1 − 𝐾𝐿𝐶𝑒) [1 + (𝐾𝑠𝐾𝐿− 1)𝐾𝐿𝐶𝑒 − (
𝐾𝑠𝐾𝐿) (𝐾𝐿𝐶𝑒)
𝑚+1]
(2-20)
Ks (L/mg) is the equilibrium constant for adsorption for the first layer, it is a constant relating to the
energy of interaction with the surface; KL is the equilibrium constant for upper layers, qm (mg/g) is
the monolayer saturation capacity and m is the number of layers (when m=1 the BET isotherm
reduce to Langmuir isotherm). K is a dimensionless parameter related to heat of sorption of
monolayer region.

Chapter 2. Literature Review
42
𝐾 =𝐾𝑆𝐾𝐿⁄
The empirical models described so far (e.g. Langmuir, Sips, Toth, D-R, Temkin) are equations for
adsorption with monolayer coverage. The BET model considers that molecules adsorb onto the solid
surface as a layering process, and when the concentration is sufficiently high multiple layers are
formed. It is an important equation for the characterization of mesoporous solid (Duong, 1998).
The assumptions of this models are: flat surfaces (no curvature), that the surface energetically
homogeneous, and there is no interaction between adsorbed molecules.
Shape of the isotherm
The adsorption isotherm data of the adsorbed specie on activated carbon can be obtained by
plotting the amount adsorbed as a function of change in equilibrium concentration. Five main types
of adsorption isotherms are defined (Bansal and Goyal, 2005): Type I isotherm, also called L-type or
Langmuir isotherm, describes chemisorption systems and physical adsorption in highly microporous
activated carbons. According to the initial slope which depends on the rate of change of site
availability, this type of isotherm is usually indicative of molecules adsorbed flat on the surface or,
sometimes, of vertically oriented adsorbed ions with particularly strong intermolecular attraction
(Figure 2-15) (Giles et al., 1960).
Figure 2-15 Schematic representation of a flat adsorbed specie (left) and a vertically oriented specie (right) on the adsorbent surface
The plateau or the beginning of the linear portion above the “knee” represents “first degree
saturation” of the surface (i.e., the condition in which all possible sites in the original surface are
filled). A fundamental characteristic of type I isotherms (Figure 2-16a) is that adsorption is restricted
to the completion of a single monolayer of adsorbate at the adsorbent surface (Thomas and
Crittenden, 1998; Tóth, 2002).
Flat orientedVertically oriented
Adsorbent surface

Chapter 2. Literature Review
43
Figure 2-16 Types of adsorption isotherms, redrawn from Bansal and Goyal (2005)
Type II isotherm indicates multilayer physical adsorption. In Figure 2-16b, B marks the point at which
the monolayer is complete. Type III (Figure 2-16c) and V (Figure 2-16e) isotherms are convex which
indicates a cooperative adsorption where existing adsorbed molecules increases the adsorption of
others. Nonporous or highly microporous activated carbons shows Type III isotherms, and
mesoporous or microporous adsorbents shows Type V isotherms, for polar and nonpolar molecules,
but only in cases where the interaction between adsorbate and adsorbent is weak. The Type IV
isotherm (Figure 2-16d) is similar to type II, it is displayed by mesopore carbons with large size pores
and related to the concept of the theory of capillary condensation. Type VI is called the stepped
isotherm and was proposed by IUPAC in addition to the original five types of Brunauer (1945)
(Balbuena and Gubbins, 1993).
The shape of the isotherm has been considered as providing initial experimental indication of the
nature of the specific adsorption (Hamdaoui and Naffrechoux, 2007). The intrinsic shape or type of
isotherm is dependent on several factors (Ruthven, 1984): the pore structure of the adsorbent, the
nature of the forces between the adsorbent surface and adsorbate, the dependence on
concentration and energetic heterogeneity.
Type I Monolayer Type II Multilayer
B
Type III CooperativeA
mo
un
t ad
sorb
ed (
mg/
g)
Equilibrium concentration (ppm)
(a) (b) (c)
Type IV Capillary condensation
(d)
Type V Cooperative
(e)
Type VI Layering
(f)

Chapter 2. Literature Review
44
Specific Surface Area
The solid specific surface area covered by the adsorbate molecule was calculated according to the
following expression and using the monolayer capacity from adsorption isotherm experiments and
the molecular cross-sectional area (Bansal and Goyal, 2005). This equation was applied in the case
where the molecules were adsorbed flat on the entire adsorbent specific surface (Hamdaoui and
Naffrechoux, 2007) .
𝑆𝑠 =𝑞𝑚𝑎𝑥𝑁𝐴𝐴𝑚
𝑀∙ 10−20
(2-21)
where Ss is the specific surface area of the adsorbent (m2 g-1) (i.e., the surface area covered by the
adsorbate molecule), qmax is the monolayer capacity [(gsolute)(gsolid)-1], NA is Avogradro’s constant
(=6.023·1023 mol-1), Am is the ionic cross-sectional area of adsorbate (108 Å2), and M is the molecular
weight of the solute (284 g mol-1 for methylene blue (Benadjemia et al., 2011)).
2.3.3 Adsorption kinetics
Introduction
In this section, the basic theory required for the analysis and interpretation of adsorption kinetics in
batch systems is presented. The kinetics of adsorption controls the process efficiency (Bayramoglu et
al., 2009) and is dependent on the adsorption mechanisms (Inglezakis and Poulopoulos, 2006).
Adsorption kinetics depend on the adsorbate-adsorbent interaction and system conditions (Yuh-
Shan, 2004). The kinetic analysis can be approached based on the diffusion processes or by following
some kinetic-type models. But overall rates of adsorption/desorption are generally controlled by
mass transport within the pore network, rather than by the intrinsic sorption kinetics (Inglezakis and
Grigoropoulou, 2001; Inglezakis and Poulopoulos, 2006). Mass transfer kinetics control the cycle
time of an adsorption process and is related to intraparticle mass transfer resistance. Fast kinetics
result in sharp kinetic curves, while slow kinetics produces dilated curves. Slow molecular motion
can be overcome by adding adsorbent or by increasing the cycle time (Knaebel, 1999).
Simplified kinetic-type models
First and second-order kinetic models have been broadly used in liquid-phase adsorption (Yuh-Shan,
2004; Chingombe et al., 2006; Wang and Zhu, 2007; Yang, 2008; Royer et al., 2009; El-Halwany,
2010; Rubin et al., 2010; Cazetta et al., 2011; Gupta et al., 2011; Khorramfar et al., 2011; Mahmoodi
et al., 2011). A simple first-order reaction model is based on a reversible reaction with equilibrium
state being established between two phases (F-fluid and S-solid)
𝐹 ↔ 𝑆

Chapter 2. Literature Review
45
The kinetic rate analytical solution of most common kinetic-type model are summarized in Table 2-5
where qe and qt are the amounts of adsorbate at equilibrium and at various times t per unit mass of
adsorbent (mg g-1), and k1 (min-1) and k2 (g mg-1 min-1) is the rate constant of the pseudo first and
second-order model for adsorption.
Bangham’s model
Applicability of Bangham’s equation is used to indicate that diffusion of adsorbate molecules into
pores of the activated carbon mainly controls the adsorption process (Gupta et al., 2011)
log log (𝐶0
𝐶0 − 𝑞𝑡𝑤) = log (
𝑘0𝑚
2.303𝑉) + 𝛼 log(𝑡) (2-22)
Where qt is the amount of adsorbate retained at time t, C0 is the initial dye concentration in the
solution (mg/L), V is solution volume (ml), w is the mass of activated carbon per litre of solution
(g/L), and k0 and α (<1) are constants.
Table 2-5 Simplified kinetic models (Kannan and Sundaram, 2001; Yuh-Shan, 2004)
Model Linear form Plot
1st order kinetics
Annadurai and Krishnan 1𝑞𝑡⁄ = (
𝑘1𝑞𝑚𝑎𝑥⁄ ) (1 𝑡⁄ ) +
1𝑞𝑚𝑎𝑥⁄ (2-23) 1
𝑞𝑡⁄ 𝑣𝑠 (1 𝑡⁄ )
Natarajan and Khalaf log(𝐶0 𝐶𝑡⁄ ) = (𝑘1 2.303⁄ )𝑡 (2-24) log(𝐶0 𝐶𝑡⁄ ) 𝑣𝑠 𝑡
Lagergren log(qe − qt) = log qe − (kad 2.303⁄ )t (2-25) log(qe − qt) vs t
Bhattachara and Venkobachar log[1 − 𝑈(𝑇)] = (kad 2.303⁄ )t
𝑈(𝑇) = (𝐶0 − 𝐶𝑡) (𝐶0 − 𝐶𝑒)⁄
(2-26)
(2-27)
log[1 − 𝑈(𝑇)] 𝑣𝑠 t
2nd order kinetics
Lagergren 𝑡
𝑞𝑡=
1
𝑘2𝑞𝑒2+𝑡
𝑞𝑒
(2-28) 𝑡
𝑞𝑡 𝑣𝑠 𝑡
Kinetics as a Diffusion Process
In adsorption, diffusion involves the mass transfer from a fluid to a solid phase (Inglezakis and
Poulopoulos, 2006). Most of the adsorption will take place in micropores, only a small amount will
occur in mesopores, with the macropores being the means by which the adsorbate gains entry
within the carbon (Duong, 1998; Bansal and Goyal, 2005). The rate laws can be derived by applying
the well-known diffusion equations from Table 2-6, where J is the flux of the diffusing specie; C is its
concentration, considering spherical coordinates (r); and D the diffusion coefficient. Diffusion
coefficients are considered to be constant.

Chapter 2. Literature Review
46
Table 2-6 Principal diffusion equations
𝐽 = −𝐷𝑔𝑟𝑎𝑑𝐶 Fick’s first law (2-29)
𝜕𝐶
𝜕𝑡= −𝑑𝑖𝑣𝐽
Fick’s second law (2-30)
𝜕𝐶
𝜕𝑡= 𝐷 (
𝜕2𝐶
𝜕𝑟2+2
𝑟
𝜕𝐶
𝜕𝑟)
Mass transfer process
[combining eq (2-29) and (2-30)] (2-31)
The transport mechanism
Experimental data is generally analysed assuming the following mechanism of adsorption,
constituted by several steps (Kannan and Sundaram, 2001; Kumar and Porkodi, 2007):Firstly,
movement of the adsorbate from the bulk of the solution to the surface of the adsorbent; secondly,
diffusion of adsorbate through the boundary layer to the surface of the adsorbent; thirdly,
intraparticle diffusion of adsorbate into the interior pores of the activated carbon particle. And
lastly, adsorption of adsorbate at an active site on the surface of activated carbon (this is normally
considered to be very fast).
The rate of adsorption in systems with high fluid phase concentration is more likely to have their
mass transfer controlled by particle phase diffusion (pore diffusion in the fluid phase) (McKay and
Geundi, 1988). Systems with low solute concentrations are more likely to be controlled by fluid side
effects (degree of mixing and mass transfer from the bulk liquid to the external surface of the
adsorbent). For solid-liquid adsorption process, the two rate limiting steps that can be considered
are the external mass transfer (film diffusion) and the intraparticle diffusion of solute (this includes
two diffusion mechanisms: macropore or pore diffusion and micropore or solid diffusion) (McKay
and Geundi, 1988; Kannan and Sundaram, 2001; Aravindhan, Rao and Nair, 2007; Onal, Akmil-Başar
and Sarici-Ozdemir, 2007; Rubin et al., 2010). Equilibrium is set up between solid and liquid phase
concentrations and it is assumed that the adsorbent particles are homogeneous. This assumption is
valid for a limited length of time, and after this time, the effect of the internal structure of the
carbon must be taken into account. The branched pore model may be applicable to basic dye
adsorption on carbon for longer time periods (Duri, 1988). The branched pore diffusion model is an
adsorption kinetic model that accounts for the internal structure of the adsorbent (Yang, 2001). It
describes two pore size regions: macropores and micropores, and consider two different coefficients
to mass transfer in these regions (McConvey, 1985). In this model, intraparticle diffusion occurs by a
complex dual mechanism with four mass transfer parameters to describe it. The adsorption
mechanism would be as follows (Yang, 2001): firstly, film transfer from the bulk of the solution to
the carbon particle surface (external mass transfer coefficient), secondly intraparticle diffusion in the
macropores by solid diffusion measured by surface diffusivity, thirdly multidirectional interactions in

Chapter 2. Literature Review
47
the micropores (micropore diffusion) described by the micropore rate coefficient, and a fourth
parameter introduced by the model representing the fraction of total adsorptive capacity in
macropores and micropores.
External mass transfer coefficient (Kf)
The external liquid film mass transfer coefficients kF (cm/s ) is important in determining the influence
of the outside boundary layer (McConvey, 1985), and it is related to the system hydrodynamics,
which would be constant for a given system due to constant agitation speed and constant mass
employed in the experiments (Yang, 2001). At very short times the external film resistance is always
dominant, and is expected to be the dominant process for the first initial rapid phase of
approximately 50 min (Inglezakis and Poulopoulos, 2006; Porkodi and Kumar, 2007).
(A) External mass transfer model
The external mass transfer model by Furusawa and Smith (Kumar and Porkodi, 2007; Porkodi and
Kumar, 2007) calculates Kf values using experimental kinetic data for the first initial rapid phase. The
following method of determining the external mass transfer coefficient is normally employed
(McConvey, 1985)
[d(C C0⁄ )
dt]t=0
= −KfSextV
(2-32)
Thus by drawing a tangent to the curve, Ct/C0 versus t, through the origin, Kf could be obtained
(McKay and Geundi, 1988). Kf can also be calculated for the slope of ln(C/C0) versus t, and in general
this is the one giving the most consistent results (McConvey, 1985)
ln (CtC0⁄ ) = −Kf
SextVt (2-33)
Intraparticle Diffusion rate constant (ki)
The intraparticle diffusion constant (mg g-1 min-0.5) characterizes the ease of movement of the
solutes in the particle in macropores and micropores and, it is considered constant (i.e. an average
value as it can be dependent on the solute solid-phase concentration) (Inglezakis and Poulopoulos,
2006). ki is often the rate limiting step in many adsorption process, especially in rapidly stirred batch
reactors (Kannan and Sundaram, 2001; Bayramoglu, Altintas and Arica, 2009) and for very long times
in the vicinity of saturation conditions, when it becomes very slow and predominant (Inglezakis and
Poulopoulos, 2006).

Chapter 2. Literature Review
48
(A) Weber’s Intraparticle Diffusion model
The intraparticle diffusion process can be described by the Weber-Morris model. The graphical
representation of this model describes two phases in the intraparticle diffusion: surface sorption and
intraparticle diffusion (Kumar and Porkodi, 2007; Onal, Akmil-Başar and Sarici-Ozdemir, 2007). q
versus t0.5, represented by multi-linearity, is characteristic of two or more steps involved in
adsorption process (Aravindhan, Rao and Nair, 2007). The “biphasic” nature of this plot is used to
confirm the presence of both film and pore diffusion (Aravindhan, Rao and Nair, 2007; Onal, Akmil-
Başar and Sarici-Ozdemir, 2007). The first, sharper portion is attributed to the diffusion of adsorbate
through the solution to the external surface of the adsorbent. The second portion describes the
gradual adsorption stage, where intraparticle diffusion is rate limiting. The third portion is attributed
to the final equilibrium stage (Onal, Akmil-Başar and Sarici-Ozdemir, 2007).
𝑞 = 𝑘𝑖𝑡12⁄ + 𝐶 (2-34)
Where C is the intercept and boundary layer effect, ki is the intraparticle diffusion rate constant
(mg/g min0.5), q is the amount of solute adsorbed (mg/g), and t the time. The smaller the intercept
(C), the greater the contribution of intraparticle diffusion in the rate limiting step is (Arivoli, 2010). If
C is equal to zero, the adsorption is solely governed by intraparticle diffusion. ki can be determined
from the slope of the second linear portion of the plot q vs t1/2. To determine ki the data was fitted
to the model by the method of piecewise linear regression as described by (Hameed and El-Khaiary,
2008).
Film diffusion coefficient (Df)
Assuming adsorbent particles to be spheres of radius a and that the diffusion follows Fick’s law, the
relationship between uptake and time at small times is given by (Onal, Akmil-Başar and Sarici-
Ozdemir, 2007):
𝑞𝑡𝑞𝑒= 6(
𝐷𝑓
𝜋𝑎2)
12⁄
𝑡12⁄ (2-35)
The film diffusion coefficient (Df, cm2/s) values are calculated from the slope of these plots.
Pore diffusion coefficient (Di)
The Boyd kinetic expression can be used to determine which is the rate-limiting step (external or
intraparticle transport) (Aravindhan et al., 2007; Kumar and Porkodi, 2007; Onal et al., 2007; Porkodi
and Kumar, 2007)
𝐹 =𝑞𝑡𝑞𝑒
(2-36)

Chapter 2. Literature Review
49
𝐵𝑡 = −0.4977 − ln(1 − 𝐹) 𝑖𝑓 𝐹 > 0.85 (2-37)
𝐵𝑡 = 6.28318 − 3.2899𝐹 − 6.28318(1 − 1.0470𝐹)1/2 𝑖𝑓 𝐹 ≤ 0.85 (2-38)
where Bt is a mathematical function of F, F is the fraction of solute adsorbed at any time t, and qe is
the amount of dye adsorbed at infinite time (mg/g). The linearity of the plot of Bt vs time is used to
distinguish whether external and intraparticle transport controls the adsorption rate (Aravindhan et
al., 2007; Kumar and Porkodi, 2007). The calculated B values were used to calculate the effective
diffusion coefficient, Di (cm2/s) using the relation:
𝐵 =𝜋2𝐷𝑖𝑟2
(2-39)
Where B is the slope of the plot Bt vs t, r represents the radius of the particle determined using a
mastersizer analyser and assuming spherical partices (Aravindhan, Rao and Nair, 2007); Di (cm2/s) is
the effective diffusion coefficient. If the plot of Bt vs t (having slope B) is a straight line passing
through the origin, then the adsorption rate is governed by particle diffusion mechanism; otherwise,
it is governed by film diffusion (Vadivelan and Kumar, 2005; Onal et al., 2007)
2.4 Summary
A literature overview of the activated carbon adsorption and regeneration, photocatalysis and
photocatalytic reactors, as well as adsorption equilibrium and kinetics was described in this chapter.
Activated carbons are extensively employed for the adsorption of organics to decolorize sugar,
hydrogen purification, water purification, solvent recovery systems, to cite a few. Thermal
regeneration is the main process used to returns the spent carbon to the virgin structure. Some of
the cited disadvantages of this operation includes the reduction in capacity of the adsorbent after
repeated cycles, the formation of char, and the thermal ageing of the adsorbent. Chemical,
biological, microwave heating, electric and photochemical treatments are some of the alternative
regeneration methods available to the conventional thermal treatment.
The regeneration of spent adsorbents using UV/TiO2 heterogeneous photocatalysis has been
demonstrated by several researchers. In general, the photocatalytic regeneration process was found
to be limited by desorption of the adsorbates from the interior of the carbon, and require very long
times for completion. A pre-desorption treatment for enhancing the desorption rate (e.g., applying
heat) was suggested as a possibility to maximize the photocatalytic regeneration efficiency.
The coupling of physical adsorption with TiO2 photocatalysis offers two possible configurations: in
one case, the pollutant is loaded onto the adsorbent and then irradiated along with the
photocatalyst forming a pseudo-composite suspension; and in the other case, the semiconductor
and the adsorbent are chemically bounded to form a composite (i.e., adsorption and photocatalysis
take place concurrently). Both the TiO2 and activated carbon mixture and composite options have

Chapter 2. Literature Review
50
shown enhancements to photoactivity with respect to the semiconductor alone. Furthermore, the
hybrid material improved the optical activity of TiO2 in the visible light region, showed higher
degradation rates and capacity (new adsorption sites), easier recovery, multiple reuse and wider
application than its constituents.

Chapter 3. Materials and Methods
51
3 MATERIALS AND METHODS
This chapter describes reagents, analytical techniques and equipment used in this work, as well as
the experimental methodology used for adsorption, photocatalytic and regeneration experiments.
Initially materials and analytical techniques are explained. Following this, comes the methodology
used in adsorption experiments and includes equilibrium, surface charge and kinetics. The
regeneration of activated carbon in a bell photoreactor is presented next. This section includes the
description of the bell photocatalytic reactor, and the methodology for photocatalysis and
regeneration experiments performed in this reactor. The regeneration of activated carbon in a
coiled-tube photocatalytic reactor follows next, and describes the photoreactor and the
methodology for photocatalysis and regeneration experiments. The last section of this chapter deals
with the carbon characterization techniques.
3.1 Materials
Two different commercial activated carbons were investigated. AQUACARBTM 207C 12x30, coconut
shell-derived granular activated carbon from Chemviron Carbon (Chemviron Carbon Ltd., Ashton-in-
Makerfield, Lancashire); and wood-derived powdered activated carbon CA1 from Norit (Norit UK
Ltd., Glasgow). Methylene blue C16H18ClN3S·2H2O was used as a model compound in all experiments
(physical form: dark green needle-like crystals, molecular weight=355.89, pKa=2.6, 11.2 (Sabnis,
2010)). Methylene blue solutions were prepared with distilled water and were used without further
purification. The solution pH was adjusted to the values described in each experiment by adding 1M
sulphuric acid (H2SO4) or 1M sodium hydroxide (NaOH). The acid and alkali used were laboratory
grade and stored at room temperature conditions. They were obtained from Fisher Scientific (Fisher
Scientific UK Ltd., Loughborough).
Commercially available AEROXIDE® TiO2 P25 from Evonik (Lawrence Industries, Tamworth), which is
a mixture of 75-80 % anatase and 25-20% rutile, was used in this research.
3.2 Analytical Instrumentation
UV-Vis spectra measurements were done on a Perkin Elmer Lambda 35 UV-Vis Spectrometer
(PerkinElmer, Llantrisant). Methylene blue concentration values were obtained measuring the
optical absorbance between 450 and 750 nm. A calibration curve for concentration determination
was generated using multiple linear regression. Total organic carbon (TOC) measurements were
conducted using a TOC-L Shimadzu CPH E200 total organic carbon analyser (SHIMADZU UK Ltd.,
Milton Keynes). Specific surface area and pore size distribution measurements were carried out by

Chapter 3. Materials and Methods
52
the nitrogen adsorption and desorption method at 77 K using a Micromeritics ASAP 2000 automatic
analyser (Micromeritics UK Ltd., Hexton, UK). Zeta potentials and the particle size distributions were
measured with the Malvern Instruments (Malvern Instruments Ltd., Malvern UK), Zetasizer 3000
HAS v 1.5.2 and Mastersizer S version 2.19, respectively. In a typical analysis, the zeta potential was
measured 3 times for a single sample to provide an average reading. For pH measurements, a
ThermoOrion pH-meter (Thermo Fisher Scientific, Hertfordshire, UK) was used. The instrument was
calibrated on regular basis. Infrared spectra of samples were collected with a NicoletTM iSTM50 FT-IR
spectrometer (Thermo Scientific, Hemel Hempstead, UK). Every sample was oven-dried at 100
degrees for 24 hours, samples was stored in air tight Eppendorf vials for further analysis in ATR-IR.
The instrument set up was as follows: number of scans 8, resolution 4.0, scanning between
wavenumbers 400 and 4000 cm-1. Diamond absorbance (2300-1800 cm-1) was removed from
spectrum. The spectral range was split between 4000-2400 and 1800-440 cm-1 to improve
readability of the spectrum. Then automatic baseline correction was applied.
3.3 Adsorption Experiments
Adsorption experimental work comprised isotherm analysis, surface charge and kinetics studies in
carbon-dye and TiO2-carbon-dye systems for two different activated carbons.
3.3.1 Adsorption Isotherms
Adsorption isotherm experiments were conducted by adding 200 mg of CA1 or 500 mg of 207C into
300 ml of dye solution having an initial dye concentration ranging from 10 to 180 mg/L, in pseudo-
equilibrium (contact time, 1 h) and from 50 to 400 mg/L, in equilibrium conditions (contact time, 18
h). The suspension was kept at constant stirring speed (500 rpm) and room temperature in a 500 ml
beaker, and all experiments were carried out at natural pH. A total of 147 temperature
measurements were collected between November, 2012 and February, 2014 from different
adsorption experiments, where the average temperature was 19 °C ± 2. Isotherm adsorption
experiments were performed between February and July of 2013. In total 24 temperature values
were measured during these months, and the average temperature was 21 °C ± 1. Please note that
units of mg/L and ppm will be used interchangeably throughout the thesis.
After equilibrium has been reached, the samples were filtered through a Millex filter unit 0.22 µm
(Fisher) and collected for UV-Vis analysis. Concerning sample withdraws, the first part of the filtrate
was discharged in order to avoid the change of the methylene blue concentration due to adsorption
onto the filter as has been described by previous researchers (Qada et al., 2008; Benadjemia et al.,
2011). Dye solution having an initial dye concentration ranging from 10 and 400 mg/L was analysed
under two different treatments: in one case, solutions were measured directly in the UV-Vis

Chapter 3. Materials and Methods
53
spectrometer, and in the other treatment, samples were filter before analysis. Results are shown in
Figure 3-1, indicating that the filter did not retain the dye during sample filtration.
Figure 3-1 Effect of the filter on the methylene blue initial concentration (mg/L) during sample filtration
Zeta potential, mean particle size and pH measurements before and after adsorption were also
recorded. In the case of the TiO2-carbon-dye system, experimental conditions were reproduced as in
carbon-dye adsorption experiments, with the only difference that a certain amount of photocatalyst
was mixed with the adsorbent using a spatula previous to their addition in the solution. The
proportion of carbon and the photocatalyst was constant for both carbons. A mass ratio (R)
TiO2/adsorbent of 0.25, 0.5, 1.0 and 1.75 was used in each case. Each isotherm was constituted of at
least 8 points, and 50% of the points per isotherm were repeated. The region more susceptible to
variation was the one chosen for repetition (highlighted in Figure 3-2). A total of 156 experimental
points were performed, resulting in 12 isotherms. The experimental datasets were fitted using 13
equilibrium models: Langmuir, Freundlich, Dubinin-Astakhov (D-A), Dubinin-Radushkevich (D-R), Hill,
Sips, Toth, Koble-Corrigan (K-C), Khan, Radke-Prausnitz (R-Pr), Redlich-Peterson (R-Pe), BET-1, BET-2.
Solver add-in from Microsoft Excel and the software Eureqa v. 0.99.0 Beta (Schmidt and Lipson,
2014) were used for the mathematical analysis. A non-linear least-squares fitting of the isotherm
model was carried out.
400320240160800
400
320
240
160
80
0
C(0), mg/L
Tre
atm
en
t, m
g/L
Unfiltered, mg/L
Filtered, mg/L
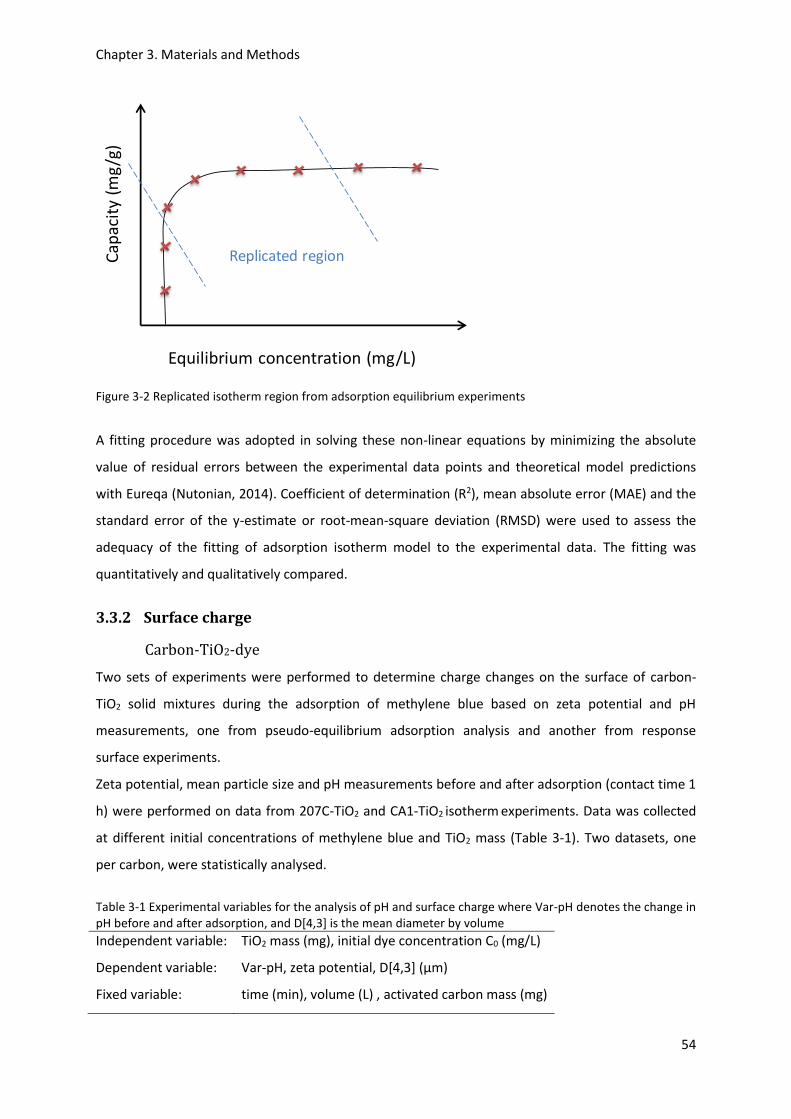
Chapter 3. Materials and Methods
54
Figure 3-2 Replicated isotherm region from adsorption equilibrium experiments
A fitting procedure was adopted in solving these non-linear equations by minimizing the absolute
value of residual errors between the experimental data points and theoretical model predictions
with Eureqa (Nutonian, 2014). Coefficient of determination (R2), mean absolute error (MAE) and the
standard error of the y-estimate or root-mean-square deviation (RMSD) were used to assess the
adequacy of the fitting of adsorption isotherm model to the experimental data. The fitting was
quantitatively and qualitatively compared.
3.3.2 Surface charge
Carbon-TiO2-dye
Two sets of experiments were performed to determine charge changes on the surface of carbon-
TiO2 solid mixtures during the adsorption of methylene blue based on zeta potential and pH
measurements, one from pseudo-equilibrium adsorption analysis and another from response
surface experiments.
Zeta potential, mean particle size and pH measurements before and after adsorption (contact time 1
h) were performed on data from 207C-TiO2 and CA1-TiO2 isotherm experiments. Data was collected
at different initial concentrations of methylene blue and TiO2 mass (Table 3-1). Two datasets, one
per carbon, were statistically analysed.
Table 3-1 Experimental variables for the analysis of pH and surface charge where Var-pH denotes the change in pH before and after adsorption, and D[4,3] is the mean diameter by volume
Independent variable:
Dependent variable:
Fixed variable:
TiO2 mass (mg), initial dye concentration C0 (mg/L)
Var-pH, zeta potential, D[4,3] (µm)
time (min), volume (L) , activated carbon mass (mg)
Equilibrium concentration (mg/L)
Cap
acit
y (m
g/g
)
Replicated region
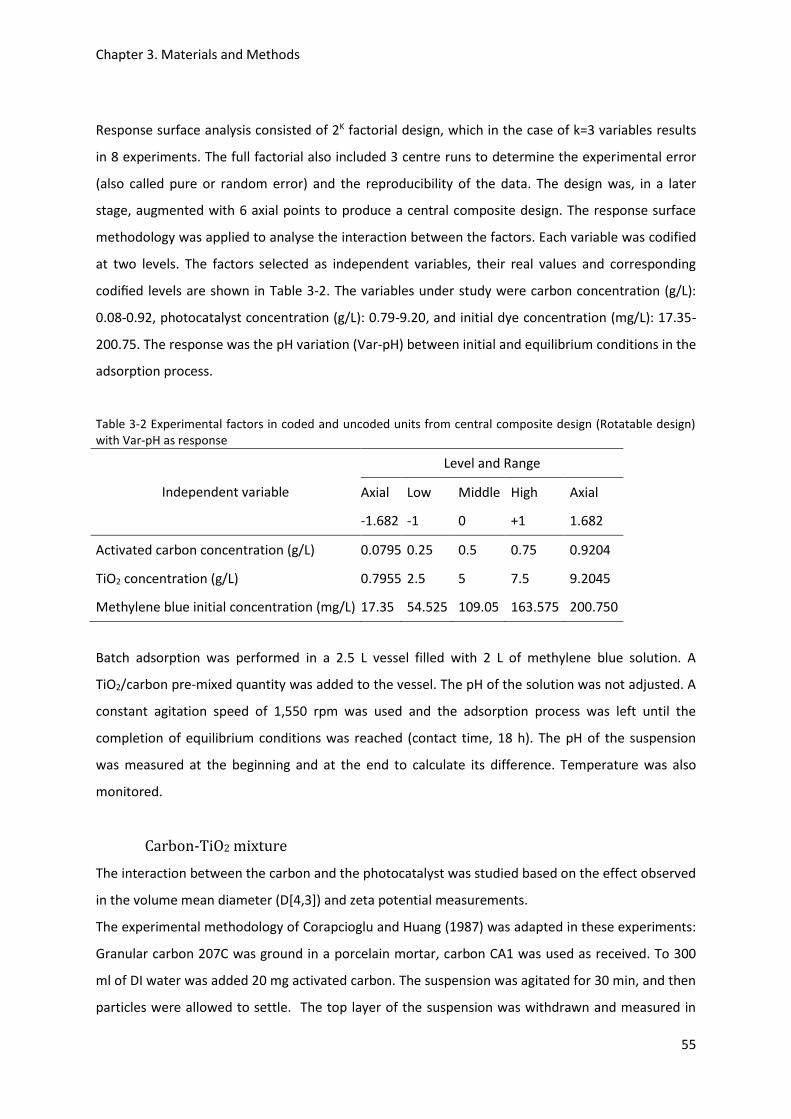
Chapter 3. Materials and Methods
55
Response surface analysis consisted of 2K factorial design, which in the case of k=3 variables results
in 8 experiments. The full factorial also included 3 centre runs to determine the experimental error
(also called pure or random error) and the reproducibility of the data. The design was, in a later
stage, augmented with 6 axial points to produce a central composite design. The response surface
methodology was applied to analyse the interaction between the factors. Each variable was codified
at two levels. The factors selected as independent variables, their real values and corresponding
codified levels are shown in Table 3-2. The variables under study were carbon concentration (g/L):
0.08-0.92, photocatalyst concentration (g/L): 0.79-9.20, and initial dye concentration (mg/L): 17.35-
200.75. The response was the pH variation (Var-pH) between initial and equilibrium conditions in the
adsorption process.
Table 3-2 Experimental factors in coded and uncoded units from central composite design (Rotatable design) with Var-pH as response
Independent variable
Level and Range
Axial Low Middle High Axial
-1.682 -1 0 +1 1.682
Activated carbon concentration (g/L) 0.0795 0.25 0.5 0.75 0.9204
TiO2 concentration (g/L) 0.7955 2.5 5 7.5 9.2045
Methylene blue initial concentration (mg/L) 17.35 54.525 109.05 163.575 200.750
Batch adsorption was performed in a 2.5 L vessel filled with 2 L of methylene blue solution. A
TiO2/carbon pre-mixed quantity was added to the vessel. The pH of the solution was not adjusted. A
constant agitation speed of 1,550 rpm was used and the adsorption process was left until the
completion of equilibrium conditions was reached (contact time, 18 h). The pH of the suspension
was measured at the beginning and at the end to calculate its difference. Temperature was also
monitored.
Carbon-TiO2 mixture
The interaction between the carbon and the photocatalyst was studied based on the effect observed
in the volume mean diameter (D[4,3]) and zeta potential measurements.
The experimental methodology of Corapcioglu and Huang (1987) was adapted in these experiments:
Granular carbon 207C was ground in a porcelain mortar, carbon CA1 was used as received. To 300
ml of DI water was added 20 mg activated carbon. The suspension was agitated for 30 min, and then
particles were allowed to settle. The top layer of the suspension was withdrawn and measured in

Chapter 3. Materials and Methods
56
the zetasizer and mastersizer. pH was measured at the initial and end conditions. This procedure
was repeated by mixing TiO2 with activated carbon at different proportions in an aqueous
suspension (from 0 to 1.75 TiO2/carbon mass ratios). Solids were mixed prior to their addition to
water. Experiments were done for both carbons, and repeated twice.
3.3.3 Adsorption Kinetics
The effect of TiO2 on the adsorption process of methylene blue onto activated carbon was bilaterally
studied, performing not only equilibrium, but also, kinetics experimental work. In order to compare
the rate of uptake of methylene blue from water under the studied conditions, the decolouration
percentage, the external mass transfer rate and the intraparticle diffusion rate were calculated.
The decolouration percentage or degradation rate was determined as follows
Decoloration or Removal = (𝐶0 − 𝐶𝑖) 𝐶0⁄ (3-1)
where C0 and Ci are the initial dye concentration and the dye concentration at a given time,
respectively. Each simplified kinetic model described in the Literature Review was applied to the
adsorption kinetics dataset.
The rate parameter for intraparticle diffusion ki (mg g-1 min-0.5) was determined using Weber’s
intraparticle diffusion model by plotting q versus 𝑡12⁄ :
𝑞 = 𝑘𝑖𝑡12⁄ + 𝐶 (3-2)
where C is the intercept and boundary layer effect, ki is the intraparticle diffusion rate constant
(mg/g min0.5), q is the amount of dye adsorbed (mg/g), and t the time.
The external mass transfer coefficient kF (cm s-1) was calculated based on the following equation,
derived from the film-solid diffusion model (Onal et al., 2007):
KF =mk2qe
2
C0Sext (3-3)
where k2 (g mg-1 min-1) is the rate constant for pseudo second-order adsorption, m is the mass of
the adsorbent (g), qe is the adsorption capacity (mg g-1), C0 is the initial dye concentration (mg m3),
and Sext is the external surface area of adsorbent (m2). More details about these models can be
found in the Literature Review.
Experimental design and data analysis
Five designs of experiment (DOE) and a total of 86 experiments were configured to investigate the
interaction between TiO2 and activated carbon. Decolouration (methylene blue removal), the change
in pH during adsorption for 207C carbon (Var-pH), the liquid film rate constant (external mass
transfer KF cm/s) and the intraparticle diffusion rate constant (Ki mg/g min0.5) were set as responses.
The mass of activated carbon, the mass of TiO2, the initial concentration of dye (C0), the time (t) and
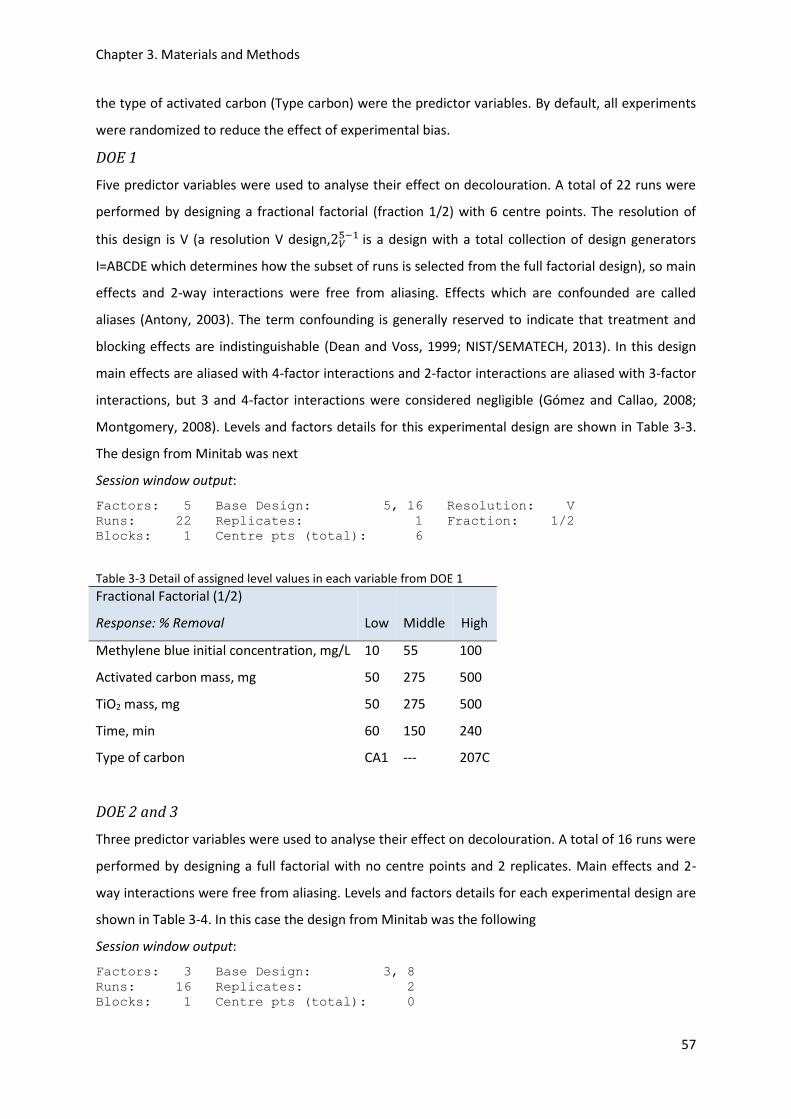
Chapter 3. Materials and Methods
57
the type of activated carbon (Type carbon) were the predictor variables. By default, all experiments
were randomized to reduce the effect of experimental bias.
DOE 1
Five predictor variables were used to analyse their effect on decolouration. A total of 22 runs were
performed by designing a fractional factorial (fraction 1/2) with 6 centre points. The resolution of
this design is V (a resolution V design,2𝑉5−1 is a design with a total collection of design generators
I=ABCDE which determines how the subset of runs is selected from the full factorial design), so main
effects and 2-way interactions were free from aliasing. Effects which are confounded are called
aliases (Antony, 2003). The term confounding is generally reserved to indicate that treatment and
blocking effects are indistinguishable (Dean and Voss, 1999; NIST/SEMATECH, 2013). In this design
main effects are aliased with 4-factor interactions and 2-factor interactions are aliased with 3-factor
interactions, but 3 and 4-factor interactions were considered negligible (Gómez and Callao, 2008;
Montgomery, 2008). Levels and factors details for this experimental design are shown in Table 3-3.
The design from Minitab was next
Session window output:
Factors: 5 Base Design: 5, 16 Resolution: V
Runs: 22 Replicates: 1 Fraction: 1/2
Blocks: 1 Centre pts (total): 6
Table 3-3 Detail of assigned level values in each variable from DOE 1
Fractional Factorial (1/2)
Response: % Removal Low Middle High
Methylene blue initial concentration, mg/L 10 55 100
Activated carbon mass, mg 50 275 500
TiO2 mass, mg 50 275 500
Time, min 60 150 240
Type of carbon CA1 --- 207C
DOE 2 and 3
Three predictor variables were used to analyse their effect on decolouration. A total of 16 runs were
performed by designing a full factorial with no centre points and 2 replicates. Main effects and 2-
way interactions were free from aliasing. Levels and factors details for each experimental design are
shown in Table 3-4. In this case the design from Minitab was the following
Session window output:
Factors: 3 Base Design: 3, 8
Runs: 16 Replicates: 2
Blocks: 1 Centre pts (total): 0

Chapter 3. Materials and Methods
58
Table 3-4 Detail of assigned level values in each variable from DOE 2 and 3
Full Factorial per carbon (contact time, 1 h)
Response: % Removal, pH Low High
Methylene blue initial concentration, mg/L 10 100
Activated carbon mass, mg 50 500
TiO2 mass, mg 50 500
DOE 4 and 5
A Full Factorial with activated carbon, TiO2 and methylene blue, at equilibrium conditions, were used
as variables. The three predictor variables were used to analyse their effect in KF and Ki. A total of 16
runs were performed by designing a full factorial with no centre points and 2 replicates. Main effects
and 2-way interactions were free from aliasing. Levels and factors details for each experimental
design are shown in Table 3-5. The session window output from Minitab was as given below
Session window output:
Factors: 3 Base Design: 3, 8
Runs: 16 Replicates: 2
Blocks: 1 Centre pts (total): 0
Table 3-5 Detail of assigned level values in each variable from DOE 4 and 5
Full Factorial per carbon (Equilibrium conditions)
Response: KF and Ki Low High
Methylene blue initial concentration, mg/L 10 100
Activated carbon mass, mg 50 500
TiO2 mass, mg 50 500
Experimental procedure
The experimental procedure for each run was as follows: Sorption kinetics experiments were carried
out using a 500 ml capacity batch-stirrer vessel. The vessel was charged with 300 ml of methylene
blue solution. Methylene blue solutions were prepared by diluting different amounts of stock
solution according to the values indicated by the DOE. Photocatalyst and adsorbent were mixed as
solids prior to addition in the solution at room temperature and constant agitation speed of 500
rpm. The reactor was left for the total time specified in each run of the design. Samples were taken
and filtered at constant intervals of time. The collected samples were then analysed using UV-Vis
spectroscopy. Zeta potential, mean particle size and pH before and after adsorption were measured
in addition. Two vessels (`A` and `B`) with the same suspension and experimental conditions were

Chapter 3. Materials and Methods
59
placed side by side. Samples were withdrawn from vessel A for analysis. To make up for the lost
volume equal amount of solutions from vessel B was added to vessel A.
3.3.4 Statistical analysis
Statistical data analysis was conducted using Minitab® v.16 and Tanagra v. 1.4 using approaches
previously described (Dean and Voss, 1999; Antony, 2003; Hinkelmann and Kempthorne, 2007;
Minitab Inc., 2007; Montgomery, 2008; NIST/SEMATECH, 2013). The starting point was a quick
screening of the raw data. Data was organized in ascending order by the response. This exploratory
analysis aimed to determine the best setting (i.e., the setting that maximizes or minimizes the
response) and the most relevant factor. Secondly, the experimental design was analysed using least
squares regression estimation, initially considering all main effects and interactions as equally
important. This allowed the identification of influential factors on the response and further
refinement by removing unimportant ones. Irrelevant factors and interactions were removed based
on the following criteria to create a reduced model: (1) No significant lack of fit, (2) Appropriate
behaviour of residuals, (3) Model with the lowest Prediction Error Sum of Squares (PRESS) or highest
Predicted R-Squares that measures the capacity of the model for making predictions, and (4)
Significance of the main factor or interaction in the ANOVA, and in the Normal and Pareto plots.
Data transformation was conducted when the reduction of the model complexity did not improve
the residuals behaviour. The best reduced model was interpreted by examining the size and sign of
the coefficients, the Normal and Pareto plots, and the main effects and interaction plots. Best
experimental conditions and, more important, interaction were discussed and compared across
designs.
3.4 Regeneration of Activated Carbon in a Bell Photocatalytic Reactor
This set of experiments aimed to both analyse the efficiency of the photoreactor to mineralize the
model compound and to evaluate the effectiveness of the regeneration.
3.4.1 The bell photocatalytic reactor
The photocatalytic activity of TiO2 on the degradation of methylene blue was evaluated in an
aqueous solution under UVC light illumination in a bell photoreactor system. Irradiation was
provided by a 400 W high-pressure mercury lamp (Heraeus Noblelight GmbH, Hanau, Germany) with
a principal emission at 256 nm, located in the centre of the vessel. The process stream was fed to
the nozzle from the constant head tank (Figure 3-5). The nozzle (Figure 3-4) generated a water bell
(Figure 3-3) inside which the UV lamp was located. A centrifugal pump was used to pump the slurry
from the bottom of the reactor to the overhead deposit through a heat exchanger to keep the slurry

Chapter 3. Materials and Methods
60
at lower temperature (25 °C). The constant head tank was fitted with an overflow to maintain
constant level. The overflow stream was introduced at the bottom of the reactor as shown in the
figure. A flow regulator located after the pump was used to control the water flow rate which in
turn affected the bell shape.
Figure 3-3 Image of water bell.
Figure 3-4 Nozzle from the bell photocatalytic reactor used to generate the water bell. Reprinted from Shama (1992)

Chapter 3. Materials and Methods
61
Figure 3-5 Process flow diagram of bell photocatalytic reactor in batch configuration
Experimental design and data analysis
Full factorial design was adopted to study the simultaneous effect of the pH, and TiO2 and
methylene blue concentrations described in Table 3-6. Other important variables such as O2
concentration, flow rate, resident time, photon fluence or Input power were kept constant in these
experiments. The treatment objective was to achieve complete mineralization of methylene blue
solution in DI water. The mineralization of methylene blue was measured by TOC analysis after 2 h of
oxidation and chosen as a response factor. The variables and response were selected according to
their importance in previous studies from the literature, and preliminary experiments were carried
out to determine the experimental domain.
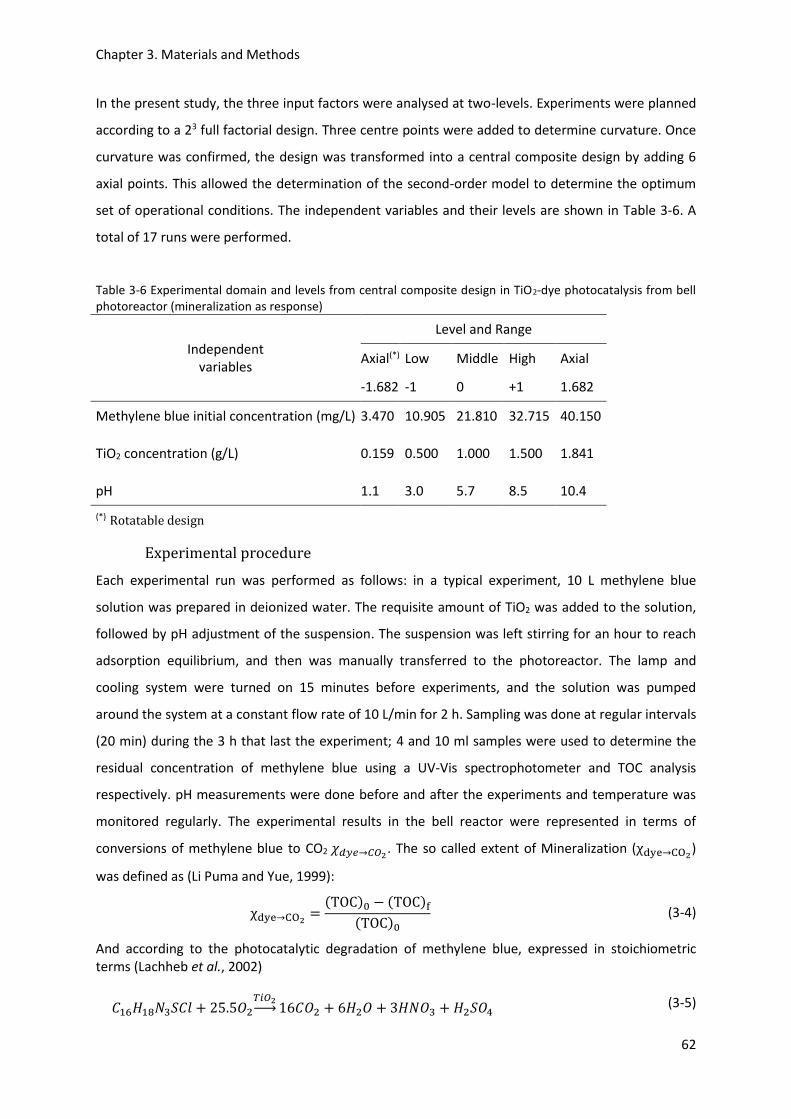
Chapter 3. Materials and Methods
62
In the present study, the three input factors were analysed at two-levels. Experiments were planned
according to a 23 full factorial design. Three centre points were added to determine curvature. Once
curvature was confirmed, the design was transformed into a central composite design by adding 6
axial points. This allowed the determination of the second-order model to determine the optimum
set of operational conditions. The independent variables and their levels are shown in Table 3-6. A
total of 17 runs were performed.
Table 3-6 Experimental domain and levels from central composite design in TiO2-dye photocatalysis from bell photoreactor (mineralization as response)
Independent variables
Level and Range
Axial(*) Low Middle High Axial
-1.682 -1 0 +1 1.682
Methylene blue initial concentration (mg/L) 3.470 10.905 21.810 32.715 40.150
TiO2 concentration (g/L) 0.159 0.500 1.000 1.500 1.841
pH 1.1 3.0 5.7 8.5 10.4
(*) Rotatable design
Experimental procedure
Each experimental run was performed as follows: in a typical experiment, 10 L methylene blue
solution was prepared in deionized water. The requisite amount of TiO2 was added to the solution,
followed by pH adjustment of the suspension. The suspension was left stirring for an hour to reach
adsorption equilibrium, and then was manually transferred to the photoreactor. The lamp and
cooling system were turned on 15 minutes before experiments, and the solution was pumped
around the system at a constant flow rate of 10 L/min for 2 h. Sampling was done at regular intervals
(20 min) during the 3 h that last the experiment; 4 and 10 ml samples were used to determine the
residual concentration of methylene blue using a UV-Vis spectrophotometer and TOC analysis
respectively. pH measurements were done before and after the experiments and temperature was
monitored regularly. The experimental results in the bell reactor were represented in terms of
conversions of methylene blue to CO2 𝜒𝑑𝑦𝑒→𝐶𝑂2. The so called extent of Mineralization (χdye→CO2)
was defined as (Li Puma and Yue, 1999):
χdye→CO2 =(TOC)0 − (TOC)f
(TOC)0 (3-4)
And according to the photocatalytic degradation of methylene blue, expressed in stoichiometric terms (Lachheb et al., 2002)
𝐶16𝐻18𝑁3𝑆𝐶𝑙 + 25.5𝑂2𝑇𝑖𝑂2→ 16𝐶𝑂2 + 6𝐻2𝑂 + 3𝐻𝑁𝑂3 +𝐻2𝑆𝑂4 (3-5)

Chapter 3. Materials and Methods
63
3.4.2 Regeneration process
Experimental design and data analysis
Response surface methodology was applied to assess and optimize the regeneration process of two
activated carbons. In the present central composite design study three variables, carbon
concentration (g/L), TiO2 concentration (g/L) and pH were considered in the experimental design.
The amount of carbon regenerated and changes in pH (Var-pH) were taken as the responses of the
design experiments. The complete design was reproduced for both carbons, CA1 and 207C. Central
composite design from control experiments were reproduced (Table 3-7); the amount of carbon
needed for saturation with the set methylene blue initial concentration was calculated and used in
the design experiments. A 23 full factorial design was constructed with the selected variables.
Table 3-7 Experimental domain and levels from central composite design in activated carbon regeneration by UV-C/TiO2 photocatalysis (Rotatable design), Response: Regeneration
Independent variables
Level and Range
Axial Low Middle High Axial
-1.682 -1 0 +1 1.682
Activated carbon concentration (g/L) 0.016 0.050 0.100 0.150 0.184
TiO2 concentration (g/L) 0.159 0.500 1.000 1.500 1.841
pH 1.1 3.0 5.7 8.5 10.4
Experimental procedure
The adsorption process was performed in a 20 cm diameter agitated vessel of 2.5 L coupled with a
pitched-blade impeller. Using operational guidelines, the impeller diameter was 5.8 cm, the liquid
height 20 cm and the clearance 1.75 cm. Intensive agitation (1,550 rpm) was provided to produce
good mass transfer and effective dispersion of the solids. A gravimetric analysis was carried out prior
to the experiments to investigate potential agglomeration of particles in the bell system. From the
outcome of this study, it was concluded that no agglomeration was observed in the photoreactor.
The TiO2/carbon mixture was used only for a single cycle. Each cycle lasted 38 h in total, and
comprised two adsorption steps of 18 hours (Ads-A and Ads-B) intercalated with 2 h regeneration
step (Reg). Methylene blue was adsorbed to the activated carbon, oxidized and readsorbed again.
The oxidation step was performed in the same manner as in the control experiments. The
adsorption step (Ads-A) consisted of a typical methylene blue adsorption process with the original
TiO2/carbon mixture. The activated carbon and TiO2 solids were mixed before addition to the dye

Chapter 3. Materials and Methods
64
solution, and then added to 2 L methylene blue solution of a predetermined concentration for
saturation conditions (contact time 18 h). The saturated solids were recovered by sedimentation,
and fresh water added. The saturated solid mixture was regenerated immediately after saturation.
The pH of the suspension was adjusted depending on the requirements of each run, the suspension
was manually transferred to the bell reactor, and regeneration was performed under UVC light. The
total volume of the suspension was 10 L. The suspension was circulated through the bell reactor at
constant flow rate of 10 L/min for 2 h. After 2 hours, the regenerated TiO2/carbon mixture was
allowed to settle overnight and recovered the next day by sedimentation. The adsorbent mixture
was removed as a settled sludge and reused. Ads-B was the last step, and it was performed in the
same manner as the initial adsorption, Ads-A. Temperature profile during irradiation at intervals of
time of 20 minutes, pH recordings before and after each step, and concentration of dye by UV-Vis
were monitored throughout the whole process. Solid samples were dried at 100 °C for 24 h and
stored in Eppendorf vials for further analysis in the ATR-IR spectrometer. The temperature increase
during the run was 5 °C.
Procedure for determining degree of regeneration
At the end of the cycle, the percentage regeneration was calculated, the solid mixture was
recovered, dried and weighed to account for carbon and TiO2 loss. Any discrepancy was considered
in the response of each experimental run. Regeneration is defined as the amount of methylene blue
that the regenerated TiO2/carbon mixture adsorbed to the amount of methylene blue adsorbed by
the original TiO2/carbon mixture.
𝑅𝑒𝑔𝑒𝑛𝑒𝑟𝑎𝑡𝑖𝑜𝑛 (%) =𝑎𝑑𝑠𝑜𝑟𝑝𝑡𝑖𝑜𝑛 𝑐𝑎𝑝𝑎𝑐𝑖𝑡𝑦 𝑎𝑓𝑡𝑒𝑟 𝑟𝑒𝑔𝑒𝑛𝑒𝑟𝑎𝑡𝑖𝑜𝑛
𝑎𝑑𝑠𝑜𝑟𝑝𝑡𝑖𝑜𝑛 𝑐𝑎𝑝𝑎𝑐𝑖𝑡𝑦 𝑏𝑒𝑓𝑜𝑟𝑒 𝑟𝑒𝑔𝑒𝑛𝑒𝑟𝑎𝑡𝑖𝑜𝑛∙ 100 (3-6)
3.5 Regeneration of Activated Carbon in a Coiled-Tube Photocatalytic
Reactor
3.5.1 The coiled-tube photocatalytic reactor
Experimental design and data analysis
The photocatalytic activity of TiO2 on the degradation of methylene blue was evaluated in an
aqueous solution under illumination of UVC light in a coiled-tube photoreactor system. Irradiation
was provided by a 40 W mercury source with a major emission at 254 nm. Fluorinated ethylene
propylene tubing (FEP) of 5 m in length and 4 mm internal diameter was coiled around the source.
The source dimensions were 40 cm in length and 3 cm diameter (Figure 3-6). The source-tubing

Chapter 3. Materials and Methods
65
system was encapsulated in a protective glass and air was provided to cool the interior. Flow rate
was set at 2 L/min.
Figure 3-6 Schematic of coiled-tube photocatalytic reactor
The aim of this study was through the adoption of appropriate experimental design to evaluate the
role of the variables selected (dye, pH, TiO2), as well as optimize methylene blue mineralization in
the suspension.
Experimental design and data analysis as used for the bell TiO2-dye photocatalysis was reproduced
for this reactor. The initial conditions used in the experimental design are described in Table 3-8.
Table 3-8 Experimental domain and levels from central composite design in TiO2-dye photocatalysis from coiled-tube photoreactor (mineralization as response)
Independent variables
Level and Range
Axial(*) Low Middle High Axial
-1.682 -1 0 +1 1.682
Methylene blue initial concentration (mg/L) 3.069 15 32.5 50 61.931
TiO2 concentration (g/L) 0.000 0.084 0.207 0.331 0.415
pH 1.1 3.0 5.7 8.5 10.4
(*) Rotatable design
Experimental procedure
The following experimental conditions were applied for each run: The photocatalytic experiments
were conducted in a 2.5 L cylindrical vessel. The vessel was filled with 2 L methylene blue solution in

Chapter 3. Materials and Methods
66
deionized water. TiO2 P25 was used as received. The requisite amount of titania was added to the
solution, followed by the pH adjustment of the suspension. Before irradiation, the suspensions were
equilibrated for 1 h in the dark under stirring at 500 rpm to allow equilibrium to be reached between
TiO2 and methylene blue. Then it was manually transferred to the photocatalytic system. The photo-
reactor set up comprised a coiled-tube photoreactor (Figure 3-6), a peristaltic pump, and a mixing
and collection vessels. Lamp and cooling system were turned on 15 min before experiments, and
solution was pumped around the system from the mixing tank at a constant flow rate of 2 L/min for
2 h. Samples were taken from the collection vessel at a regular intervals of 20 min with a 10 ml
syringe and then filtered. These comprised 4 and 10 ml samples to determine the residual
concentration of methylene blue using a UV-Vis spectrophotometer, and TOC analysis respectively.
Measurements of pH were done before and after experiments, and temperature was monitored at
intervals of 20 min.
3.5.2 Regeneration process
One variable at a time method (OVAT) was applied to the regeneration of activated carbon in the
coiled-tube photoreactor. To obtain spent carbon, 55 mg of activated carbon were mixed with the
requisite amount of TiO2. Thus ratios (w/w) of 0.25, 0.5, 1.0, 1.75 and 2.5 were used in the
experiments. Then the mixture was loaded with 40 mg/L of methylene blue solution until saturated
(300 mL, 18 h contact time) at room temperature. Samples were filtered prior to analysis for
methylene blue concentration using a UV-Vis spectrophotometer. Particles were recovered by
sedimentation and fresh water added. The pH of the suspension was then adjusted to 5.75 using
NaOH 1 M. The 2 L volume carbon-TiO2 suspension was regenerated in the coiled-tube photoreactor.
The suspension was pumped through the system from the mixing to the collection vessel at a
constant flow rate of 2 L/min. Irradiation lasted 2 h. After irradiation the solids were recovered by
sedimentation. As soon as the regenerated mixture was recovered, adsorption was carried out in the
same way described previously. Then the capacity before and after irradiation was used to calculate
the percentage of regeneration achieved in the process. Experiments were performed in duplicate.
Temperature and pH was monitored at a fixed interval of time. Solids samples were oven-dried and
stored for ATR-IR analysis.
3.6 Carbon characterization
Characterization of both activated carbons included porosimetry, particle size, surface charge
analysis and also the determination of its L- or H-type behaviour (Low or High-temperature activated
carbons). The experimental procedure of Singh et al. (2008) was adapted to determine the average

Chapter 3. Materials and Methods
67
acidity and basicity of the surface based on pH measurements from AC in suspension: 1 g of each
activated carbon was stirred with 200 ml of deionized water (0.5 %mass) for 27 h.
3.7 Summary
Materials, analytical instrumentation and experimental methods were described in this chapter.
Two different commercial activated carbons were investigated: 207C 12x30, coconut shell-derived
granular activated carbon; and wood-derived powdered activated carbon CA1. Methylene blue was
used as model compound, and commercially available TiO2 P25 was used as photocatalyst in this
research. UV-Vis and infrared spectra measurements, total organic carbon measurements, specific
surface area and pore size distribution measurements, zeta potential and particle size distribution
measurements were performed on the samples taken from the experiments.
Experimental work included adsorption (i.e., isotherm analysis, surface charge and kinetics studies in
carbon-dye and TiO2-carbon-dye systems for two different activated carbons) and regeneration of
both carbons using UVC/TiO2 photocatalysis in a bell photocatalytic reactor and in a coiled-tube
photocatalytic reactor (i.e., this set of experiments aimed to both analyse the efficiency of the
photoreactor to mineralize the dye and to evaluate the effectiveness of the regeneration).
Carbon-dye adsorption isotherm experiments were conducted adding a fix amount of carbon to
different initial dye concentrations. Isotherms were reproduced for two different contact times,
named equilibrium conditions (contact time, 18 h), and pseudo-equilibrium conditions (contact time,
1 h). In the case of the TiO2-carbon-dye system, experimental conditions were reproduced as in
carbon-dye adsorption experiments but adding to the carbon-dye system increasing amounts of
TiO2. The experimental datasets comprised 156 experimental points, resulting in a total of 12
isotherms, and were fitted using 13 equilibrium models (e.g., Langmuir, BET).
Adsorption kinetics were another set of experiments which aimed to understand the influence of
TiO2 on the rate of uptake of methylene blue from water, and its effect on the pH, the external mass
transfer rate and the intraparticle diffusion rate. Variables such as dye initial concentration,
activated carbon mass, TiO2 mass, time, and type of activated carbon were studied. This set of
experiments were performed through five designs of experiment and a total of 86 runs.
Another set of experiments included the determination of the photocatalytic activity of TiO2 on the
degradation of methylene blue in an aqueous solution under UVC light illumination in a bell
photoreactor system. Central composite design was adopted to study the simultaneous effect of the
pH, and TiO2 and dye concentrations (i.e. mineralization as response). The same response surface
methodology was applied to assess and optimize the regeneration process of both activated
carbons. The TiO2 /carbon mixture was saturated prior to the exposure to the UVC light, and was

Chapter 3. Materials and Methods
68
used only for a single cycle. Methylene blue was adsorbed to the TiO2 /carbon mixture, oxidized and
readsorbed again. Each cycle lasted 38 h in total.

Chapter 4. Characterization of Activated Carbon
69
4 CHARACTERIZATION OF ACTIVATED CARBON
4.1 Calibration curve
The methylene blue absorption spectrum is concentration-dependent due to dimerization (Tardivo
et al., 2005). It forms face-to-face dimers (two aggregate monomers) in dilute aqueous solutions and
higher aggregates at increasing dye concentration (Cenens and Schoonheydt, 1988). The adsorption
spectrum of methylene blue is affected by the formation of these dye aggregates (Tardivo et al.,
2005; Bujdák, 2006) and variables such as pH (Dai, 1994). Each type of methylene blue aggregation
absorbs light at a different wavelength because of changes in π-π transition. The planarity of the
molecule is broken when methylene blue aggregates, and the spectrum bands shifts to the blue
region of the spectrum (Carey and Sundberg, 2007; Beaudoin et al., 2011). The monomer absorbs
maximally at 664-668 nm and dimers at 590-609 nm (Sabnis, 2010). This aggregation effect is not
only concentration-dependent but also proceeds to a greater extent at interfaces than in
concentrated solutions (Bujdák, 2006). The dimerization is higher with increases in ionic strength of
the solution and may increase or decrease in the presence of charged interfaces (Cenens and
Schoonheydt, 1988). At concentrations as low as 6 mg/L only methylene blue monomers are
present (Tardivo et al., 2005).
Multivariate techniques are generally used when a single wavelength will not predict concentration
due to band overlap or when more than one component is to be measured simultaneously (Mark
and Workman, 2012). The multi-wavelength regression equation is commonly expressed as
C = B0 + B1 ∙ log1
Ri (4-1)
Where C is the concentration (mg/L) of the absorber, B0is the Y-intercept from regression (mg/L),
B1is the slope term (i.e., defined as a change in concentration divided by a change in absorbance,
mg/L), and i is the index of the wavelength used and its corresponding reflectance (Ri).
Absorbances deviate from Beer's Law at higher concentrations due to non-linearity of detection
systems (i.e., the response of an instrument saturates at high concentration like in Figure 4-1),
scattering effects (which are wavelength dependent), and stray light-caused non-linearity (Mark and
Workman, 2012). In multilinear regression, the inclusion of various wavelengths usually provides a
calibration equation compensating for noise, interferences, non-linearity, background scattering,
and other undesirable deviations from Beer's Law (Mark and Workman, 2012). Principal components
regression (PCR), partial least squares (PLS), and multilinear regression have been suggested to make
up for the non-linearity. Existing information indicates that multilinear regression is better suited if

Chapter 4. Characterization of Activated Carbon
70
the non-linearity is in the chemistry of the system (e.g. interactions between constituents), while the
more sophisticated techniques (PCR, PLS) works well if the non-linearity is in the optical data (Mark
and Workman, 2012).
The UV-Vis spectra of an aqueous solution of methylene blue from 0 to 160 mg/L, between 450 and
750 nm was recorded (see Figure 4-1). As previously mentioned, non-linear effects from Lambert-
Beer law were found at high concentrations. These non-linearities, and the spectral changes due to
shifts in wavelengths after absorption (Cenens and Schoonheydt, 1988), suggest the need of using
more than one wavelength and more sophisticated techniques. The number of variables was
synthesized using the Principal Component Analysis (PCA) technique. A data reduction algorithm was
required to remove highly correlated predictor wavelengths, a classic statistical event called
multicollinearity which affects the coefficients of the regression model (Rakotomalala, 2005).
Multiple linear regression predicted values of concentration from the first two input principal
components according to the traditional Least Squares method (Table 4-1).
Table 4-1 Regression coefficients and optimization criteria of the multiple linear regression model (std = standard deviation, [MB] = methylene blue concentration and PC = Principal component)
High concentration range Error Sum of Squares
Attribute Coefficient std t-student p-value Observed Predicted Default
(Mean)
Model PseudoR2
Intercept 84.2427 0.7354 114.552 0.00000 [MB]obs [MB]pred 19982.417 29.205 0.9985
PC_1 6.1265 0.0984 62.2582 0.00000
PC_2 5.3895 0.3607 14.9407 0.00000
Low concentration range Error Sum of Squares
Attribute Coefficient std t-student p-value Observed Predicted Default
(Mean)
Model PseudoR2
Intercept 2.7280 0.0309 88.2851 0.00000 [MB]obs [MB]pred 392.464 0.9832 0.9975
PC_1 0.5224 0.0040 130.2395 0.00000
PC_2 -0.5131 0.0251 -20.4613 0.00000

Chapter 4. Characterization of Activated Carbon
71
Figure 4-1 UV-Vis spectrum of pure methylene blue aqueous solution from 0 to 160 mg/L between 450 and 750 nm. The response of the instrument saturates at high concentration range
Methylene Blue UV-Vis spectrum at different concentrations
700600500
0.60
0.45
0.30
0.15
0.00
wavelength
Ab
so
rb
an
ce
0 mg/L0.08 mg/L
0.40 mg/L
0.80 mg/L
2.40 mg/L
700600500
2.4
1.8
1.2
0.6
0.0
wavelength
Y-D
ata
2.40 mg/L
4.79 mg/L
9.58 mg/L
11.97 mg/L
700600500
2.4
1.8
1.2
0.6
0.0
wavelength
Y-D
ata
11.97 mg/L23.94 mg/L
55.87 mg/L
71.83 mg/L
79.81 mg/L
700600500
6.0
4.5
3.0
1.5
0.0
wavelength
Y-D
ata
79.81 mg/L95.77 mg/L
119.71 mg/L
159.62 mg/L
139.66 mg/L
Low concentration range
Concentration range from 0 to 2.40 mg/L MB between 450 and 750 nm
Low concentration range
Concentration range from 2.40 to 11.97 mg/L MB between 450 and 750 nm
High concentration range
Concentration range from 11.97 to 79.81 mg/L MB between 450 and 750 nm
High concentration range
Concentration range from 79.81 to 139.66 mg/L MB between 450 and 750 nm

Chapter 4. Characterization of Activated Carbon
72
The detection limit was defined as three times the standard deviation of the matrix without
methylene blue. Lower detection limits were found when the dataset was split into two sets. In such
a way, two multiple linear regressions were computed, one including concentrations equal or lower
than 15 mg/L and other for upper concentration ranges.
Figure 4-2 Residuals randomly distributed about zero in the low concentration range calibration model.
The detection limit of the combined calibration model was established at 0.004 mg/L. The number of
components was set up by trial and error using as criteria the minimization of the residual sum of
squares of the model. This approach prioritizes the predictive accuracy of the model (Rakotomalala,
2005). The optimal solution involved the use of the first two principal components; the output of the
analysis is given in Table 4-1. The table shows that the residual sum of squares of the model is small
(29.205 and 0.9832 for the high and low concentration range models, respectively) and the pseudo-
R2 close to 1. The model therefore seems reliable. The quality of the fit was also assessed by plotting
the residuals against the concentration. Residuals were randomly and normally distributed
(Skewness = 0.1351). Figure 4-2 and Figure 4-3 show that the residual plots showed reasonable
scatter of data, close to the straight line and with no obvious outliers. The lowest points in Figure 4-2
were tested as possible outliers but its residual magnitude was close to the standard deviation
proving no reason to discard the points.
14121086420
0.2
0.1
0.0
-0.1
-0.2
concentration (mg/L)
y-r
esid
ua
ls
Scatterplot of y-residuals vs concentration Low concentration range

Chapter 4. Characterization of Activated Carbon
73
Figure 4-3 Residuals randomly distributed about zero in the high concentration range calibration model
4.2 Surface Area and Porous Structure
This section describes the porous texture characteristics of TiO2, Norit CA1 and 207C by N2
adsorption/desorption at 77 K. The pore size distribution is required in order to determine the pore
volume accessible to a molecule of a given size (Pelekani and Snoeyink, 2000). Pore sizes are
classified into four types according to the International Union of Pure and Applied Chemistry (IUPAC)
classification of pore diameter (Pelekani and Snoeyink, 1999) shown in Table 4-2.
Table 4-2 IUPAC classification of pore sizes in a porous material
IUPAC classification Pore diameter (nm)
primary micropores < 0.8
secondary micropores 0.8-2
mesopores 2-50
macropores > 50
Figure 4-4 shows the N2 adsorption-desorption isotherm of the Norit CA1 and 207C activated
carbons. The Norit CA1 sample displayed a so-called type IV isotherm, typical of mesoporous solids
(Gregg and Sing, 1991; Thomas and Crittenden, 1998). This isotherm presented a so-called type H4
hysteresis loop (IUPAC classification), characteristic of slit-shaped pores, and typical of the
simultaneous presence of micro and mesopores (Bottani and Tascón, 2008). Hysteresis indicates the
180160140120100806040200
4
3
2
1
0
-1
-2
-3
concentration (mg/L)
y-r
esid
ua
lsScatterplot of y-residuals vs concentration
High concentration range

Chapter 4. Characterization of Activated Carbon
74
presence of mesopores and gives information relating to the geometric shapes of pores (Gregg and
Sing, 1991). The more pronounced the hysteresis loop, the larger the mesoporous volume
(Benadjemia et al., 2011). Because the plateau is barely reached; one can interpret a widening of
pores (Prahas et al., 2008). The presence of a large number of mesopores, as well as some
micropores, is also revealed by the pore volume distribution of Norit CA1 from Figure 4-5 (A). Figure
4-5 shows the pore size distribution calculated in the standard manner by using Barrett-Joyner-
Halenda (BJH) method. This carbon exhibited a broad range distribution of pores comprising a high
volume of pores of diameter higher than 2 and lower than 20 nm. In the micropore domain,
secondary micropores (0.8-2 nm) are observed. Highlighting, on the one hand the higher amount of
mesopores of 13 and 19 nm and, on the other hand, the relatively high amount of micropores of 2
nm. The relative percentages of micropore and mesopore areas were 26.6% and 73.4%, respectively
(Table 4-3). In contrast, the sample 207C showed a type I or Langmuir isotherm, characterized by a
plateau that was nearly horizontal and no hysteresis. This isotherm is typical of that exhibited by
microporous solids, with narrow pores that cannot accumulate more than a single molecular layer
on their walls (Gregg and Sing, 1991). 207C showed a percentage of micropores (from the t-plot) and
mesopores area of 45.7% and 54.3%, respectively (Table 4-3). This activated carbon had a more
microporous character with a smaller mesopore region compared to CA1. The average particle size
(Dp) was found to be greater in the former carbon.
The BET surface areas from Table 4-3 were 1,107.7 m2·g-1 and 1,076.0 m2·g-1 in the case of CA1 and
207C, respectively. The value of 1250 m2·g-1 was reported in the literature for CA1 (de Jonge, Breure
and van Andel, 1996). Mesopores and macropores represent roughly ~89.2% and ~50.8% of the total
pore volume for Norit CA1 and 207C, respectively.
Table 4-3 Pore characteristics of CA1 and 207C as obtained by N2 adsorption/desorption studies
BET surface area SBET
(m2·g-1)
Micropore Area
(m2·g-1)
Mesopore and
Macropore Area
(m2·g-1)
Average Pore
Diameter
(nm)
Norit CA1 1,107.741 295.032 812.709 5.416
207C 1,075.972 491.712 584.260 5.576
Total Pore Volume
(cm3·g-1)
Micropore Vol.
(cm3·g-1)
Mesoporous Volume from BJH
(cm3·g-1)
Norit CA1 1.0126 0.1095 0.7073
207C 0.6246 0.3070 0.1614

Chapter 4. Characterization of Activated Carbon
75
Figure 4-4 N2 adsorption-desorption isotherm at 77 K on (A) Norit CA1 and (B) 207C activated carbons
Figure 4-5 Incremental pore size distribution of (A), (B) Norit CA1 and (C), (D) 207C activated carbons calculated from BJH model.
Isotherm Linear Plot
1.00.80.60.40.20.0
600
450
300
150
0
Relative Presure (P/P0)
Qu
an
tity
ad
so
rbe
d (
cm
3/g
)
1.00.80.60.40.20.0
400
300
200
100
0
Relative Presure (P/P0)
Qu
an
tity
ad
so
rbe
d (
cm
3/g
)
(A) Norit CA1
(B) 207C
Pore Size Distribution by BJH model
200150100500
0.048
0.036
0.024
0.012
0.000
Pore width (nm)In
cre
me
nta
l P
ore
Vo
lum
e (
cm
3/g
)
200150100500
80
60
40
20
0
Pore width (nm)
In
cre
me
nta
l P
ore
Are
a (
m2
/g
)
200150100500
0.060
0.045
0.030
0.015
0.000
Pore width (nm)In
cre
me
nta
l P
ore
Vo
lum
e (
cm
3/g
)
200150100500
100
75
50
25
0
Pore width (nm)
In
cre
me
nta
l P
ore
Are
a (
m2
/g
)
(A ) Pore Volume Distr ibution Norit CA 1
(C) Pore Volume Distr ibution 207C
(B) Pore A rea Distr ibution Norit CA 1
(D) Pore A rea Distr ibution 207C
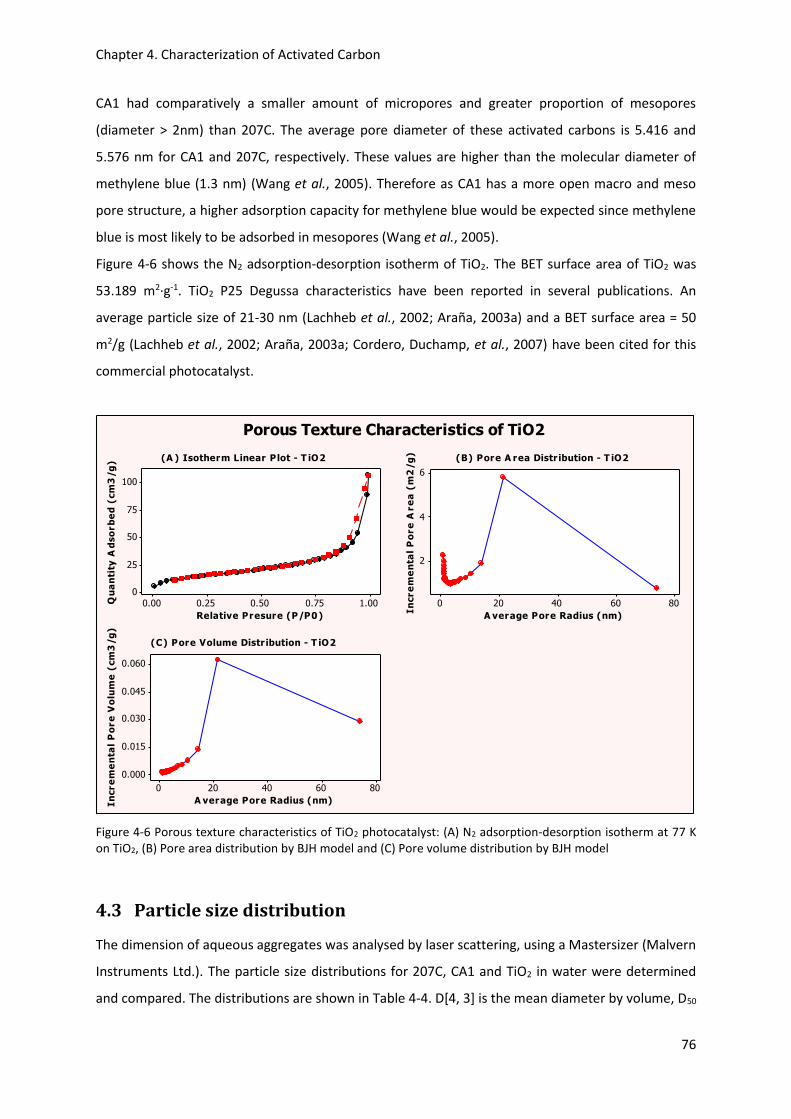
Chapter 4. Characterization of Activated Carbon
76
CA1 had comparatively a smaller amount of micropores and greater proportion of mesopores
(diameter > 2nm) than 207C. The average pore diameter of these activated carbons is 5.416 and
5.576 nm for CA1 and 207C, respectively. These values are higher than the molecular diameter of
methylene blue (1.3 nm) (Wang et al., 2005). Therefore as CA1 has a more open macro and meso
pore structure, a higher adsorption capacity for methylene blue would be expected since methylene
blue is most likely to be adsorbed in mesopores (Wang et al., 2005).
Figure 4-6 shows the N2 adsorption-desorption isotherm of TiO2. The BET surface area of TiO2 was
53.189 m2·g-1. TiO2 P25 Degussa characteristics have been reported in several publications. An
average particle size of 21-30 nm (Lachheb et al., 2002; Araña, 2003a) and a BET surface area = 50
m2/g (Lachheb et al., 2002; Araña, 2003a; Cordero, Duchamp, et al., 2007) have been cited for this
commercial photocatalyst.
Figure 4-6 Porous texture characteristics of TiO2 photocatalyst: (A) N2 adsorption-desorption isotherm at 77 K on TiO2, (B) Pore area distribution by BJH model and (C) Pore volume distribution by BJH model
4.3 Particle size distribution
The dimension of aqueous aggregates was analysed by laser scattering, using a Mastersizer (Malvern
Instruments Ltd.). The particle size distributions for 207C, CA1 and TiO2 in water were determined
and compared. The distributions are shown in Table 4-4. D[4, 3] is the mean diameter by volume, D50
Porous Texture Characteristics of TiO2
1.000.750.500.250.00
100
75
50
25
0
Relative Presure (P/P0)
Qu
an
tity
Ad
so
rb
ed
(cm
3/g
)
806040200
6
4
2
A verage Pore Radius (nm)
In
cre
me
nta
l P
ore
Are
a (
m2
/g
)
806040200
0.060
0.045
0.030
0.015
0.000
A verage Pore Radius (nm)In
cre
me
nta
l P
ore
Vo
lum
e (
cm
3/g
)
(B) Pore A rea Distr ibution - T iO2
(C) Pore Volume Distr ibution - T iO2
(A ) Isotherm Linear Plot - T iO2

Chapter 4. Characterization of Activated Carbon
77
median diameter is the size in microns at which half of the sample is above and half below this
diameter, D10 is the particle diameter at which 10% of the distribution is below this size, and D90
represents the size of particle for which 90% of the sample lies below (Malvern Instruments Ltd,
1997). In the case of CA1, similar values were found in the literature: D10 = 7 µm (Aktaş and Çeçen,
2006), D50 = 28 µm (Aktaş and Çeçen, 2006), D50 =40 µm (de Jonge et al., 1996), D90 =75 µm (Aktaş
and Çeçen, 2006). No available data was found for 207C.
Table 4-4 Volume mean diameter (D[4, 3]), volume median diameter (D50) and percentile distribution values D10 and D90 in µm units
D[4, 3] (µm) D50 (µm) D10 (µm) D90 (µm)
207C 501.43 516.00 256.17 746.40
CA1 36.48 31.48 8.75 71.60
TiO2 1.9 0.80 0.18 5.16
The pore width values in the nanometre range shown in Figure 4-5, and the actual size of the TiO2
aggregates in water (Table 4-4), suggest that it is unlikely that the catalyst can enter the pores of
either of the activated carbons. The same conclusion was arrived at by Araña (2003a). The volume
distribution is shown in Figure 4-7. The particle size of TiO2 in suspension displayed a bimodal
distribution between 0.1 µm and 1 µm, and between 1 µm and 10 µm, and the mean particle size
was 1.9 µm.
Figure 4-7 Particle size distribution curves of aqueous aggregates size for samples 207C, CA1 and TiO2 as obtained by laser scattering
10001001010.1
18
16
14
12
10
8
6
4
2
0
Particle Diameter (microns)
Vo
lum
e (
%)
207C
CA1
TiO2
Type
Particle Size Distribution
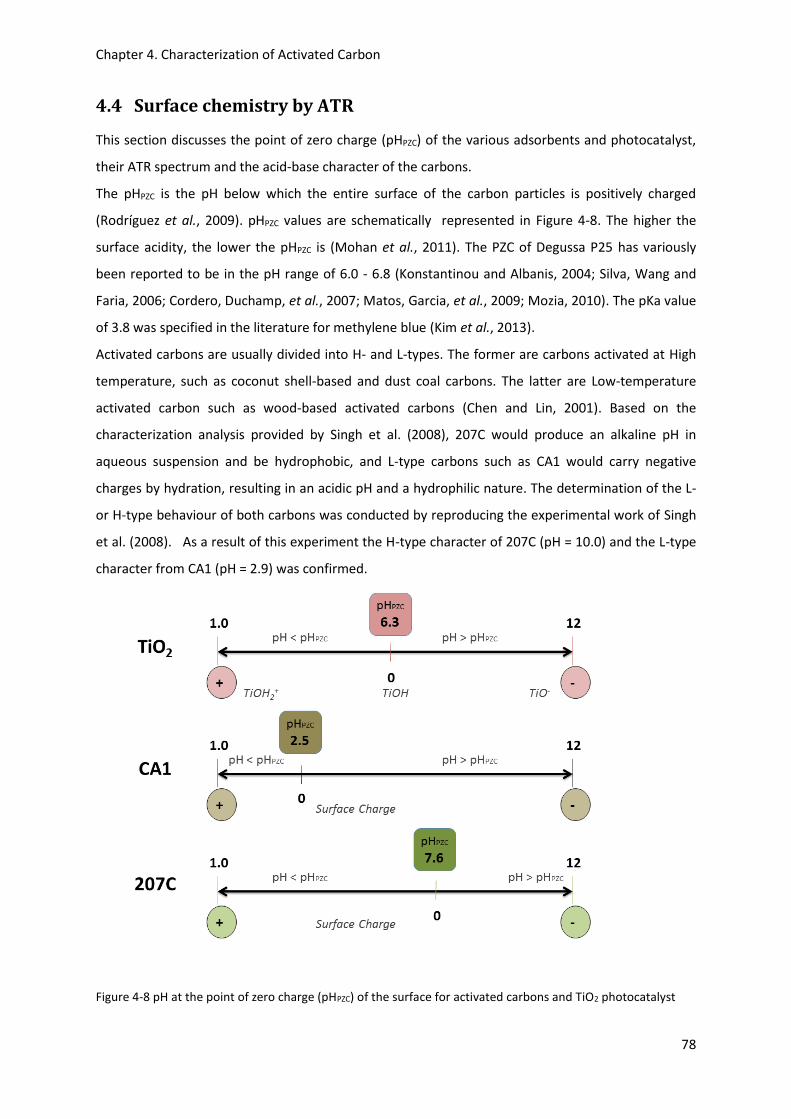
Chapter 4. Characterization of Activated Carbon
78
4.4 Surface chemistry by ATR
This section discusses the point of zero charge (pHPZC) of the various adsorbents and photocatalyst,
their ATR spectrum and the acid-base character of the carbons.
The pHPZC is the pH below which the entire surface of the carbon particles is positively charged
(Rodríguez et al., 2009). pHPZC values are schematically represented in Figure 4-8. The higher the
surface acidity, the lower the pHPZC is (Mohan et al., 2011). The PZC of Degussa P25 has variously
been reported to be in the pH range of 6.0 - 6.8 (Konstantinou and Albanis, 2004; Silva, Wang and
Faria, 2006; Cordero, Duchamp, et al., 2007; Matos, Garcia, et al., 2009; Mozia, 2010). The pKa value
of 3.8 was specified in the literature for methylene blue (Kim et al., 2013).
Activated carbons are usually divided into H- and L-types. The former are carbons activated at High
temperature, such as coconut shell-based and dust coal carbons. The latter are Low-temperature
activated carbon such as wood-based activated carbons (Chen and Lin, 2001). Based on the
characterization analysis provided by Singh et al. (2008), 207C would produce an alkaline pH in
aqueous suspension and be hydrophobic, and L-type carbons such as CA1 would carry negative
charges by hydration, resulting in an acidic pH and a hydrophilic nature. The determination of the L-
or H-type behaviour of both carbons was conducted by reproducing the experimental work of Singh
et al. (2008). As a result of this experiment the H-type character of 207C (pH = 10.0) and the L-type
character from CA1 (pH = 2.9) was confirmed.
Figure 4-8 pH at the point of zero charge (pHPZC) of the surface for activated carbons and TiO2 photocatalyst

Chapter 4. Characterization of Activated Carbon
79
The alkaline nature of 207C has already been reported (Adani et al., 2005). These results and some
other characteristics of these commercial carbons (de Jonge et al., 1996) are given in Table 4-5.
Table 4-5 Norit CA1 and 207C characteristics
Characteristic CA1 207C
Raw material wood coconut shell
Activation method chemically with H3PO4 Steam
Physical form powdered granular
pH in suspension(a) 2.9 10.0
pHPZC (zero point charge pH) 2.5 (Hao et al., 2004) 7.6(b) (Pastrana-Martínez et al., 2010)
Acidity/Basicity on activated carbon surface L-type (Acid) H-type (Basic)
(a) Based on 1 g of carbon in 200 ml deionized water and 27 h of equilibration time
(b) Value taken for AQUACARBTM 208C
Attenuated Total Reflectance (ATR) was used to identify the type of surface functional groups on the
carbons. These surface groups are important because they influence the adsorption capacity and its
mechanism (Liu et al., 2008). The study of the surface chemical structure by infrared spectroscopy
was described as relatively complex due to the intensive background absorption of carbons and the
low-intensive bands over 660-1000 and 1650-1100 (Leboda et al., 2003).
Norit CA1 is a wood-based carbon produced by chemical activation using the phosphoric acid
process at a temperature of 500 °C (Aktaş and Çeçen, 2006). This method leads to a surface with
fully oxidized active sites (de Jonge et al., 1996; Cordero, Duchamp, et al., 2007) and the residual
presence of phosphorus (Ghimbeu et al., 2010), not observed in a thermal activation process, such
as is used for 207C. As broadly reported (Aktas and Cecen, 2007; Ghimbeu et al., 2010), a thermal
activation treatment (207C) produces fewer surface oxygenated groups than a chemically activated
(CA1 ), therefore the spectra of 207C should show less peaks with weaker intensity, indicating a
relatively smaller quantity of surface functional groups (Cordero, Chovelon, et al., 2007; Liu et al.,
2008). This trend is observable in the ATR spectra of 207C and CA1 (Figure 4-10). All the pH
measurements examined from 207C were more basic than those from CA1, confirming its basic
nature. This greater surface acidity of CA1, based on the general feature of its L-type character, was
due to the presence of carboxyl, phenolic hydroxyl, carbonyl (quinone type), carboxylic acid,
anhydrides, lactone and cyclic peroxide groups (Liu et al., 2008; Singh et al., 2008). The predominant
surface oxides from 207C, based on its H-type character were identified as being lactones, quinones,
phenols and carboxylates by Singh et al. (2008). The structure of these acid and basic groups can be
seen in Figure 4-9. Increase in the load of surface oxygen groups was seen to increase the adsorption

Chapter 4. Characterization of Activated Carbon
80
capacity (Bansal and Goyal, 2005). Then, it could be expected that methylene blue cation has higher
affinity for CA1 than for 207C, because the former possesses more acidic character.
Figure 4-9 Acid (carboxyl, phenol, lactol, lactone) and basic (chromene, ketone, pyrone) groups in an activated carbon, redrawn from Newcombe and Dixon (2006)
By comparing the spectra of CA1 and 207C (Figure 4-10) , the band between 3700 - 3000 cm-1
suggested the presence of stronger hydrogen bonds in CA1 compared with 207C. The three major
peaks observed in CA1 (1696, 1575, 1182 cm-1) are indicative of the presence of carbonyl aromatic
structures or of conjugated chelated carbonyl and C-O structures (Dai, 1994; Bansal and Goyal,
2005). Interpretation of the bands between 1750 and 1000 cm-1 has led to different conclusions in
the literature (Ishizaki and Marti, 1981). The bands centred around 1696 cm-1 in CA1 have been
associated by several researchers (Ishizaki and Marti, 1981; Terzyk, 2001; Cordero, Chovelon, et al.,
2007) with C=O stretching vibration of surface groups from acids such as carboxylic acids (1698-1558
cm-1) and lactones (1730-1705 cm-1) (Cordero, Chovelon, et al., 2007). This band is present in CA1
but not in 207C. In CA1, the broad O-H stretching peak at 3385, HCH bending at 1432 cm-1, and C-O
stretching one at 1030 cm-1 may be taken as indicative of the presence of alcohols. The presence of
alkenes could be related to the C-H stretching at 3051 cm-1, C=C stretching (conjugated) peak at
1579 cm-1, HCH bending at 1432 cm-1, and the out-of-plane deformation C=C peaks below 1000 cm-1.
The presence of aromatics in the sample can be related to C-H stretching at 3051 cm-1, C=C
stretching (conjugated) at 1579 cm-1, and the out-of-plane ring bending modes at 819, 753 cm-1. The
presence of aryl ketone can be related with the stretching at 1699 cm-1 and that of carboxylic acids
due to the broad O-H stretching at 3385 cm-1 (overlapping with alcohols), the C-O stretching at 1699
cm-1, and the C-O stretching at 1220 cm-1.

Chapter 4. Characterization of Activated Carbon
81
Figure 4-10 ATR spectra of (A) CA1 and (B) 207C between the range 4000 to 440 cm-1
For 207C the IR band at 1581 cm-1 could be due to the presence of pyrone type surface groups
(1610-1580 cm-1) (Cordero, Chovelon, et al., 2007) due to its basic nature. The 207C sample showed
the presence of ether C-O stretch at 1082, but no evidence of ketones or carboxylic acids. A detailed
band assignment is shown in Table 4-6. These surface oxygenated groups, both basic and acid ones,
would influence the regeneration of activated carbon by driving electronic density to Ti+4 in the TiO2
(Cordero, Chovelon, et al., 2007).
The spectra of pure methylene blue and pure TiO2 are shown in Figure 4-12 and Figure 4-13. The
spectrum of methylene blue presents multiple bands. The presence of nitrogen (aromatic and
aliphatic C-N stretching in Figure 4-11) in methylene blue molecules contributes to absorption in the
region 1400-1000 cm-1 (Qi et al., 2011). The C-H bond from the three condensed rings of methylene
blue molecule appeared between 675 and 900 cm-1 (Vargas et al., 2011).
A
b
s
o
r
b
a
n
c
e
(A)
(B)

Chapter 4. Characterization of Activated Carbon
82
Figure 4-11 Molecular structure of methylene blue
Table 4-6 Peak position and interpretation for activated carbon
Peak Interpretation
3637 and
3384
Adsorbed water and CO-H groups (Gómez-Serrano, 1994; Randorn, Wongnawa
and Boonsin, 2004; Cordero, Chovelon, et al., 2007; Khorramfar et al., 2011)
3047 =C-H (Cordero, Chovelon, et al., 2007)
1696 C=O stretching vibration of carboxylic tautomeric structures (Ishizaki and Marti,
1981; Terzyk, 2001; Araña, 2003b; Bansal and Goyal, 2005; Cordero, Chovelon, et
al., 2007)
1575 C=O stretching quinonic and carboxylate groups and C-C stretching mode (Terzyk,
2001; Bansal and Goyal, 2005; Xingwang Zhang and Lei, 2008; Rodríguez et al.,
2009)
1432 HCH bending (Bansal and Goyal, 2005; Cordero, Chovelon, et al., 2007; Xingwang
Zhang and Lei, 2008)
O-H bonding vibration and C=C phenolic groups (Araña, 2003b; Bansal and Goyal,
2005)
1220/1182 C-O stretch, cyclic ethers and phenols (Terzyk, 2001; Araña, 2003b; Bansal and
Goyal, 2005; Cordero, Chovelon, et al., 2007)
O-H (Rodríguez et al., 2009)
1030 COC asymmetrical stretch (Terzyk, 2001; Arana et al., 2004; Xingwang Zhang and
Lei, 2008)
phenolic structures (Bansal and Goyal, 2005)
877, 819 C-H (Xingwang Zhang and Lei, 2008)
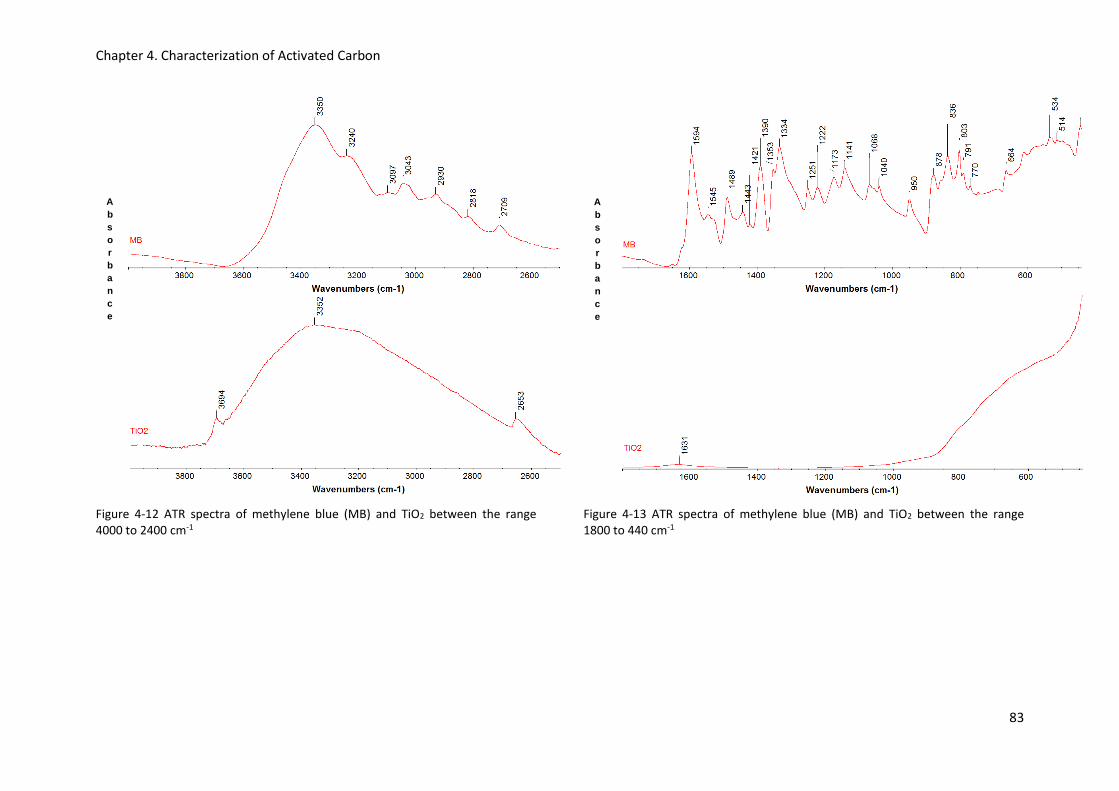
Chapter 4. Characterization of Activated Carbon
83
Figure 4-12 ATR spectra of methylene blue (MB) and TiO2 between the range 4000 to 2400 cm-1
Figure 4-13 ATR spectra of methylene blue (MB) and TiO2 between the range 1800 to 440 cm-1
A
b
s
o
r
b
a
n
c
e
A
b
s
o
r
b
a
n
c
e

Chapter 4. Characterization of Activated Carbon
84
4.5 Summary
A calibration based on PCA and a multilinear regression model was developed to determine the
methylene blue concentration more accurately. Porosimetry analysis described a CA1 carbon with a
broad range distribution of pores, and the simultaneous presence of micro and mesopores. The
coconut shell-based 207C carbon had a higher micropore character with a smaller mesopore region
and narrow pores. BET surface area was higher for CA1 compared to 207C. Particle size distribution
measurements revealed that the photocatalyst aggregates in water would be unable enter the pores
of the activated carbons. With respect to the surface chemistry of the adsorbents, CA1 was
characterised as L-type carbon (greater surface acidity) and 207C as H-type carbon (more basic
character). The ATR spectrum showed CA1 spectra with a fully oxidized surface, and 207C spectra
with fewer peaks of weaker intensity, indicating a comparatively lower quantity of surface functional
groups.

Chapter 5. Adsorption Equilibrium of Methylene Blue onto Activated Carbon and onto TiO2-Activated Carbon Mixture
85
5 ADSORPTION EQUILIBRIUM OF METHYLENE BLUE ONTO
ACTIVATED CARBON AND ONTO TIO2-ACTIVATED CARBON
MIXTURE
5.1 Introduction
In this chapter are presented studies of the effect of photocatalytic TiO2 on the adsorption
equilibrium process. The effect of carbon on the photocatalytic power of TiO2 during irradiation is
presented in Chapter 7. The aim here is to understand the changes produced by TiO2 on the
adsorption equilibrium of methylene blue in contact with activated carbon. Two different types of
carbon were investigated. The adsorption experiments described here comprised an initial
adsorption equilibrium time analysis. The isotherm study was carried out in a carbon-dye system and
in a TiO2-carbon-dye system. The adsorption equilibrium mechanism between the activated carbon
and the dye are initially described. Then, the effect of TiO2 on the same mechanism was determined.
The experiments with TiO2 were reproduced exactly under the same conditions. Conclusions from
both set of experiments were arrived at by comparing the isotherm parameters from the pseudo-
equilibrium isotherm models (contact time, 1 h) that best predicted the whole experimental range of
conditions. The monolayer adsorption capacity, the heat of adsorption, the heterogeneity and
cooperativity, and the surface charge of the solids were obtained and are discussed and compared.
The goal was to evaluate how TiO2 affected the value of those parameters. Changes in pH and zeta
potential during equilibrium adsorption were commented upon and interpreted.
5.2 Results and Discussion
The adsorption equilibrium time of methylene blue on the acid and on the basic adsorbent materials
was investigated. The first adsorption experiments were carried out over 24 hours. However, it was
established that 18 hours was sufficient time to reach equilibrium of methylene blue onto 207C
activated carbon at current experimental conditions, and more than sufficient for CA1 activated
carbon where the uptake was faster, probably due to the higher amount of micropores in the
former. Equilibrium analysis was a two-step process: firstly, a carbon-dye isotherm analysis at
equilibrium and pseudo-equilibrium conditions, and secondly, an analysis of TiO2-carbon-dye under
the same specified conditions. Four major systems were analysed: (1) 207C-dye system with a total
of two isotherms, one at equilibrium and other at pseudo-equilibrium, (2) CA1-dye system with two
isotherms, one at equilibrium and other at pseudo-equilibrium, (3) TiO2-207C-dye system and four
isotherms at pseudo-equilibrium conditions, and (4) TiO2-CA1-dye system with four isotherms at

Chapter 5. Adsorption Equilibrium of Methylene Blue onto Activated Carbon and onto TiO2-Activated Carbon Mixture
86
pseudo-equilibrium conditions. The analysis of the effect of TiO2 on the adsorption process was done
at pseudo-equilibrium conditions in order to expedite experimental determinations; and the
adsorption of methylene blue onto activated carbon at pseudo-equilibrium represented the base
case. In this research, the term “pseudo-equilibrium” is applied when equilibrium conditions were
calculated for a much shorter period of time (contact time, 1 h) than is required for a complete
isotherm (contact time, 18 h). Although, it would be inappropriate to predict the isotherm
parameters by having a partial adsorption isotherm (Kumar and Sivanesan, 2006), the fact is that
adsorption experiments at pseudo-equilibrium conditions is an approach widely applied in the
literature (Streat and Patrick, 1995; Yoon, Westerhoff and Snyder, 2005; Hameed and El-Khaiary,
2008) because it allows the comparison of isotherm terms among a higher number of experimental
condition in a shorter period of time. This approach was used to measure how TiO2 influences the
equilibrium system carbon-dye and it allowed comparison of isotherm parameters among several
experimental conditions.
5.2.1 Eureqa versus Solver
Solver add-in from Microsoft Excel and Eureqa software were used to fit the experimental data to
the isotherm model. Comparisons have demonstrated that a non-linear approach is more reliable
and provides lower error and uncertainty than a linear model fit (Yuen and Hameed, 2010b). Eureqa
optimization results from non-linear fitting of the isotherm models were compared with Solver add-
in from Excel. Both types of software gave comparable results in most cases (e.g. Langmuir,
Freundlich), but not in others (e.g. Sips). Microsoft Excel Solver is a widely used tool to solve these
equations (Radhika and Palanivelu, 2006; Kumar and Porkodi, 2007; Porkodi and Kumar, 2007;
Raposo, De La Rubia and Borja, 2009; Malarvizhi and Ho, 2010; Sze and McKay, 2010), although the
difference in the results for some models were not great, in general, the model fit was less accurate
than the solution provided by Eureqa. Also, Eureqa could fit the data to an assigned non-linear
equation without entering any initial value of the parameters.
5.2.2 Equilibrium versus pseudo-equilibrium conditions
A full isotherm, under equilibrium conditions, was created for each studied activated carbon based
on the definition of equilibrium curve given by (Kumar and Sivanesan, 2006), based on its shape,
regions and number of data points. Figure 5-1 shows the isotherms under pseudo-equilibrium
conditions (contact time, 1 h), a plateau is reached despite the short time used which is pronounced
by the protraction of the scale. Figure 5-2 shows the actual isotherm at equilibrium conditions. Both
cases are compared in Figure 5-3.

Chapter 5. Adsorption Equilibrium of Methylene Blue onto Activated Carbon and onto TiO2-Activated Carbon Mixture
87
Figure 5-1 Isotherm under pseudo-equilibrium conditions (60 min) for CA1 and 207C; Ce is the equilibrium liquid phase concentration of methylene blue (mg/L) and Qe is the amount of dye in the activated carbon at equilibrium (mg/g)
Figure 5-2 Isotherm under equilibrium conditions (18 hours) for 207C and CA1; Ce is the equilibrium liquid phase concentration of methylene blue (mg/L) and Qe is the amount of dye in the activated carbon at equilibrium (mg/g)
20151050
100
75
50
25
0
Ce (mg/L)
Qe
(m
g/
g)
706050403020100
200
150
100
50
0
Ce (mg/L)
Qe
(m
g/
g)
Subscripts = pseudo-Equilibrium
Isotherm 207C
Isotherm CA1Subscripts = pseudo-Equilibrium
100806040200
200
150
100
50
0
Ce (mg/L)
Qe
(m
g/
g)
200150100500
200
150
100
50
0
Ce (mg/L)
Qe
(m
g/
g)
Subscripts = Equilibrium
Isotherm 207C
Subscripts = Equilibrium
Isotherm CA1

Chapter 5. Adsorption Equilibrium of Methylene Blue onto Activated Carbon and onto TiO2-Activated Carbon Mixture
88
It can be observed that the isotherm “knee” (i.e., inflection point) from the pseudo-equilibrium is
smoother; this less well defined plateau indicates less contribution from the micropore region, with
greater participation from the larger pores (Alcañiz-Monge, Linares-Solano and Rand, 2002; Prahas
et al., 2008). Time effect was tested up to 24 h, confirming the actual conditions of the equilibrium.
Figure 5-3 Adsorption isotherms of methylene blue on 207C and CA1: comparison of the equilibrium isotherm obtained after 18 h contact with pseudo-equilibrium isotherm at 1 h contact time; Ce is the equilibrium liquid phase concentration of methylene blue (mg/L) and Qe is the amount of dye in the activated carbon at equilibrium (mg/g)
5.2.3 Model fit
Twelve datasets were initially fitted to 13 isotherm models: Langmuir, Freundlich, Dubinin-Astakhov
(D-A), Dubinin-Radushkevich (D-R), Hill, Sips, Toth, Koble-Corrigan (K-C), Khan, Radke-Prausnitz (R-
Pr), Redlich-Peterson (R-Pe), BET-1 and BET-2. Those models capable of fitting the whole range of
the mentioned curves were selected for further analysis. Goodness of fit was defined based on the
highest R2 and lowest mean absolute error (MAE) that is a R2 higher than 90%, and a MAE lower than
10.
Before the addition of TiO2, the best fit in CA1-dye system corresponded to the models D-A > Hill > K-
C > R-Pe > R-Pr > BET-2. And it was found that the isotherm models which better described the
uptake of methylene blue onto 207C followed in decreasing order BET-2 > R-Pe = R-Pr = Khan =Toth
>K-C = Hill >D-A > Langmuir > BET-1 (Table 5-1). The better fit of Langmuir equation in the adsorption
100806040200
200
150
100
50
0
Ce (mg/L)
Qe
(m
g/
g)
Equilibrium
pseudo-Equilibrium
200150100500
200
150
100
50
0
Ce (mg/L)
Qe
(m
g/
g)
Equilibrium
pseudo-Equilibrium
Isotherms 207C
Isotherms CA1

Chapter 5. Adsorption Equilibrium of Methylene Blue onto Activated Carbon and onto TiO2-Activated Carbon Mixture
89
of methylene blue onto 207C suggests a more homogeneous surface than CA1 and it was associated
with monolayer adsorption (El Qada et al., 2006). This analysis showed that either BET-2, D-A, Hill, K-
C, R-Pe, R-Pr gave fits for the 4 carbon-dye isotherms (equilibrium and pseudo equilibrium
conditions).
When TiO2 was added to the carbon-dye system, the best model for CA1 was BET-2 followed by Toth
= R-Pr = R-Pe = Khan > BET-1. And the best model in TiO2-207C-dye system was BET-2 followed by
Toth = Khan = Hill = K-C = D-A = R-Pe = R-Pr > BET-1. In general the correlation coefficients of
Langmuir and Freundlich models were lower in this study, and therefore they did not provide the
best isotherm constants to fit the whole dataset range.
Table 5-1 Ranking of the best fit model (comparison across isotherms). Threshold criteria was based on MAE and R2 values
Fitting evaluation CA1-MB 207C-MB TiO2-CA1-MB TiO2-207C-MB
Best --- BET-2 BET-2 BET-2
Good
D-A R-Pe Toth Toth
Hill R-Pr R-Pr Khan
K-C Khan R-Pe Hill
R-Pe Toth Khan K-C
R-Pr K-C BET-1 D-A
BET-2 Hill R-Pe
D-A R-Pr
Langmuir BET-1
BET-1
Moderate --- D-R Hill Freundlich
K-C Langmuir
D-A
Bad
Freundlich Freundlich Freundlich D-R
Toth Langmuir
Khan D-R
BET-1
Worse Langmuir --- --- ---
D-R
The models with the best prediction of the experimental data under the whole range of conditions
were BET-2, R-Pe and R-Pr (Figure 5-4, Figure 5-6 and Figure 5-8). It was also found that D-A, Hill and
K-C (Figure 5-5, Figure 5-7 and Figure 5-9) provided good predictions. They essentially provided an
ideal fit at low, intermediate and high concentrations. These 6 models were used to compare results.
Knowing that the precise shape of the isotherm is important (as well as heat effects, mass transfer
and other phenomena) (Knaebel, 1999), the BET-2 isotherm provided the best reasonable
predictions and Qm was calculated with this model. Values included in Table 5-2 and Table 5-3 are

Chapter 5. Adsorption Equilibrium of Methylene Blue onto Activated Carbon and onto TiO2-Activated Carbon Mixture
90
empirical and should be taken cautiously. Standard deviation of regression coefficients was
calculated using SolvStat, a macro that returns the standard deviations for non-linear regression
analysis (Billo, 2004).
Temporal variations in sorption parameters during non-equilibrium sorption, has previously been
studied (Lesan and Bhandari, 2003). In this study, a higher Qm and a lower Ce were obtained when
the isotherm equilibrium time considered was higher than 1 hour (Table 5-2 and Table 5-3).
Table 5-2 Hill, Koble-Corrigan and Redlich-Peterson model parameters, R2 and MAE for the equilibrium adsorption for the equilibrium and pseudo-equilibrium adsorption of methylene blue onto Norit CA1 and onto 207C activated carbons
Hill
R (TiO2 /AC) kd nh Qsh (mg/L) R2 MAE
CA1
0 (equilibrium) 0.8618 ± 0.7408 0.3020 ± 0.1865 251.7473 ± 80.5508 0.929 9.174
0 (pseudo-eq.) 3.7217 ± 1.2649 0.2248 ± 0.0822 333.2307 ± 56.1371 0.975 3.608
207C
0 (equilibrium) 0.0463 ± 0.0428 0.7591 ± 0.1989 217.6464 ± 8.8807 0.954 7.882
0 (pseudo-eq.) 0.3268 ± 0.0677 0.8206 ± 0.0805 72.8785 ± 2.7094 0.979 2.029
Koble-Corrigan
R (TiO2 /AC) A B (L/mg)n n R2 MAE
CA1
0 (equilibrium) 291.1870 ± 159.3197 1.1548 ± 0.9961 0.3011 ± 0.1862 0.929 9.172
0 (pseudo-eq.) 90.5986 ± 31.5630 0.2835 ± 0.3800 0.2274 ± 0.0511 0.977 3.618
207C
0 (equilibrium) 4732.5849 ± 4298.3402 21.7700 ± 20.1524 0.7602 ± 0.1990 0.955 7.884
0 (pseudo-eq.) 223.0351 ± 39.1785 3.0604 ± 0.6346 0.8206 ± 0.0519 0.979 2.029
Redlich-Peterson
R (TiO2 /AC) bRP (L/mg) g qmon (mg/g) R2 MAE
CA1
0 (equilibrium) 12.4661 ± 9.4736 0.9269 ± 0.0363 148.0087 0.925 11.654
0 (pseudo-eq.) 19.1221 ± 21.8756 0.8652 ± 0.0363 75.2811 0.968 3.898
207C
0 (equilibrium) 95.7659 ± 29.3016 0.9739 ± 0.0174 198.4360 0.962 7.368
0 (pseudo-eq.) 9.4709 ± 4.3059 0.8658 ± 0.0422 55.4369 0.991 1.511

Chapter 5. Adsorption Equilibrium of Methylene Blue onto Activated Carbon and onto TiO2-Activated Carbon Mixture
91
Therefore, 1 hour was not sufficient time to reach equilibrium conditions between methylene blue
and any of the two ACs under study. This is in agreement with previous studies of this type (Karaca
et al., 2008; Zhi-yuan and Yang, 2008; Sarici-Ozdemir, 2012). Since one of the best fit across
isotherms was the Hill model, the carbon-dye adsorption could be considered as a cooperative
phenomenon (i.e., influenced by adsorbate-adsorbate interactions, which are considered horizontal
interactions as compared with adsorbate-adsorbent interactions considered vertical interactions
(Duong, 1998)). And the best fit of BET-2 isotherm suggests that the adsorption occurred on specific
sites forming multilayers. At equilibrium conditions, the multilayer effect was more evident in CA1,
and was absent in 207C. The microporous carbon was better modelled by Langmuir than CA1 (Table
5-1), and the parameter g from R-Pe isotherm was closer to 1, indicating Langmuir-type behaviour.
Qm represents the monolayer capacity in two cases, the BET-2 isotherm (Ebadi, Soltan
Mohammadzadeh and Khudiev, 2009) and R-Pe (Aktaş and Çeçen, 2006). Comparison of the
monolayer capacity calculated from BET-2 and R-Pe isotherms suggested that there were no
multilayers present in 207C at equilibrium conditions. However, when equilibrium was not attained,
this carbon showed a pronounced deviation from this behaviour. Comparisons between equilibrium
and pseudo-equilibrium conditions for BET-2 model are shown in Figure 5-10 and Figure 5-11.
Carbon-dye interactions using BET isotherms have been already discussed by previous researchers
(Maurya and Mittal, 2006). They concluded that the BET isotherm predicted adsorption capacity
similar to that using Langmuir isotherm and that there was no possibility of multilayer adsorption in
their system. Arguing that the probability of multilayer adsorption in this system is weak, (Karaca et
al., 2008) suggested a possible dimeric adsorption of methylene blue onto activated carbon as the
cause of changes in the model fit, from fitting Langmuir to BET or Freundlich. This could justify the
differences observed in the isotherm overtime.
Concerning the D-A isotherm, in both carbons the maximum capacity was lower when equilibrium
was not attained. A value of 290 mg/g was found in the literature for the adsorption of methylene
blue onto CA1 (Aktaş and Çeçen, 2006). The methylene blue number (i.e. maximum amount of dye
adsorbed by 1 g of adsorbent (Raposo, De La Rubia and Borja, 2009)) given by the supplier for the
adsorption of methylene blue onto 207C was 230 mg/g. The values shown in Table 5-3 under
equilibrium conditions for the mentioned carbons (i.e., 218.1 and 216.9 mg/g for CA1 and 207C,
respectively) are lower than the ones found in the references. These differences could be attributed
to the different experimental conditions, or perhaps to partial blocking of the carbon due to long
storage, which would reduce the availability of adsorption sites lowering its capacity.

Chapter 5. Adsorption Equilibrium of Methylene Blue onto Activated Carbon and onto TiO2-Activated Carbon Mixture
92
Table 5-3 BET-2, Dubinin-Astakhov and Radke-Prausnitz model parameters, R2 and MAE for the equilibrium adsorption for the equilibrium and pseudo-equilibrium adsorption of methylene blue onto Norit CA1 and onto 207C activated carbons
BET-2
R (TiO2 /AC) m Ks (L/mg) qm (mg/g) KL (L/mg) R2 RMSD
CA1
0
(equilibrium) 2.176 ± 0.528
43.487 ±
63.2793
96.874 ±
25.2270 0.270 ± 0.276 0.948 18.470
0 (pseudo-
eq.) 2.181 ± 0.327
33.083 ±
28.667
63.731 ±
10.238 0.114 ± 0.109 0.974 10.460
207C
0
(equilibrium) 1.200 ± 0.203
117.767 ±
48.027
181.487 ±
33.953 0.854 ± 3.933 0.972 14.470
0 (pseudo-
eq.)
11.794 ±
3.803 5.396 ± 1.086
62.499 ±
4.094 0.013 ± 0.007 0.995 2.730
Dubinin-Astakhov
R (TiO2 /AC) BD (mol2 J-2) qm (mg/g) n E (J/mol) R2 MAE
CA1
0 (equilibrium) 0.0091 ±
0.0233
218.1416 ±
23.7458
0.5254 ±
0.2873 7.4103 0.936 8.707
0 (pseudo-eq.) 0.0592 ±
0.0320
163.4040 ±
33.6015
0.3620 ±
0.1245 2.9060 0.976 3.814
207C
0 (equilibrium) 7.338·10-9 ±
4.654·10-8
216.9321 ±
11.5258
2.0000 ±
0.6779 8,254.346 0.949 8.389
0 (pseudo-eq.) 2.383·10-5 ±
2.249·10-5
70.9167 ±
1.9446
1.2430 ±
0.1075 144.8419 0.977 2.222
Radke-Prausnitz
R (TiO2 /AC) βR rR aRP R2 MAE
CA1
0 (equilibrium) 0.0731 ± 0.0363 148.0053 ±
22.6071
1845.4322 ±
1187.4010 0.925 11.653
0 (pseudo-eq.) 0.1348 ± 0.0364 75.2861 ± 9.0815 1433.0048 ±
1536.1206 0.968 3.897
207C
0 (equilibrium) 0.0263 ± 0.0173 198.2995 ±
12.1846
19187.0244 ±
5054.7677 0.962 7.341
0 (pseudo-eq.) 0.1342 ± 0.0422 55.4368 ± 4.6419 525.0388 ±
200.9519 0.991 1.511

Chapter 5. Adsorption Equilibrium of Methylene Blue onto Activated Carbon and onto TiO2-Activated Carbon Mixture
93
The characteristic energy (E) is a measure of the strength of the interaction between adsorbate and
adsorbent (Duong, 1998) and, in this regard, higher values in 207C where obtained as compared
with CA1 under equilibrium and pseudo-equilibrium conditions (Table 5-3). This suggests that
smaller pores were involved in the adsorption of MB onto 207C as compared with CA1, and that the
interaction was stronger. Table 5-4 shows different values found in the literature for the parameters
E and n of this isotherm model. The value of 8.254 KJ/mol for 207C under equilibrium conditions
seems consistent with values found in the literature, however the value of 7.411·10-3 KJ/mol appears
too low if compared with other findings. Duong (1998) points out that, as the characteristic energy
increases, the adsorption becomes stronger because the adsorbent has stronger energy of
interaction with the adsorbate. This interaction energy between adsorbent and adsorbate is
proportional to the mean potential energy of the pore and it is a function of the width of the pore
(i.e., the adsorption energy increases with decreasing pore size because micropores walls are in
closer proximity, enhancing the adsorption potential). Thus smaller pore sizes provides higher
energy of interaction, and therefore, stronger adsorption (Pelekani and Snoeyink, 2000). In this
regards, it is described that the energetic heterogeneity of the adsorbent is greatly controlled by the
distribution of its pore widths (Bottani and Tascón, 2008).
Table 5-4 Parameters from Dubinin-Astakhov isotherm model found in the literature for the adsorption of several adsorbates onto activated carbon (AC)
Activated Carbon Type Adsorbate E (KJ/mol) n Reference
F400 (basic AC) Benzene 15.813 2 (Dastgheib and
Karanfil, 2005)
F400, He, 16NO (acid AC) Benzene 14.543 2 (Dastgheib and
Karanfil, 2005)
Several ACs Chlorinated organic
compounds
11.7 - 43 0.9 - 2.5 (Inglezakis, 2007)
Peat, lignite, coal, charcoal,
lignite coke, activated carbon
Organic compounds 7.9 - 19.2 2 (Inglezakis, 2007)
In both activated carbons, the energy of adsorption (E) was also lower in pseudo-equilibrium
conditions as compared with equilibrium (Table 5-3), which can be associated with pores or larger
width in the adsorption. The surface heterogeneity, n, can be used as a macroscopic measure of the
sharpness of the micropore size distribution (Toledo et al., 2003). It is related to the average size of
micropores and the micropore-size distribution. It is a measure not only of the homogeneity of pores
but also provides some indication of the adsorption mechanism in micropores (Terzyk et al., 2002).
In terms of absolute values, the adsorption of methylene blue onto CA1 took place in pores of larger
diameter than in 207C, as suggested by the higher n and E values for 207C. The values of n equal 2

Chapter 5. Adsorption Equilibrium of Methylene Blue onto Activated Carbon and onto TiO2-Activated Carbon Mixture
94
for 207C in equilibrium denote small pores, while the values from CA1 less than 2 indicates that it is
a less microporous carbons with a wider pore size distribution (Dastgheib and Karanfil, 2005). This
result suggested that CA1 was a carbon having a wide pore size distribution in contrast to 207C,
which would be a carbon with narrow pores.
The increase in homogeneity of pores at the equilibrium conditions, suggests that methylene blue
reached smaller micropores with smaller pore size range (Figure 5-10 and Figure 5-11). This effect is
not so pronounced in the case of CA1, which has a more heterogeneous nature and larger pores.
Due to the mesoporous nature of CA1 adsorption took place on both large and small pores. This
could be one of the reasons why the adsorption of methylene blue onto CA1 was faster than the was
observed for 207C. In the former case, the adsorption of about 70% of the dye happened in the first
30 minutes, and in the latter the uptake was much more gradual.
The K-C model is an isotherm that combines the Langmuir and Freundlich isotherm models. A good
fit of the experimental data to this model would be indicative that a combination of heterogeneous
and homogeneous uptake occurred. A surface is heterogeneous if it is composed of sites having
different energy of adsorption (i.e. energy of interaction between adsorbate and adsorbent) (Duong,
1998). This heterogeneity is defined as a characteristic of the particular solid and adsorbate pair,
rather than a solid feature alone. Conversely, if the system does not have an energy distribution,
that is adsorption energy is constant over all sites, then the surface is said to be homogeneous.
Freundlich equation is obtained assuming that the surface is heterogeneous, and Langmuir based on
the assumption that the same surface is homogeneous. The values of the parameter n in 207C
(0.760 under equilibrium, and 0.821 under pseudo-equilibrium conditions) are close to 1, which
indicates the applicability of Langmuir isotherm equation for the equilibrium data (Gupta and Babu,
2009), and therefore a homogeneous uptake (Figure 5-13). Figure 5-12 shows the lower values of n
for CA1 (0.301 in equilibrium, and 0.227 in pseudo-equilibrium conditions), and indicates
heterogeneity with a different energy distribution. Values in the range of 0 to 1 for the adsorption of
dyes onto activated carbon were also reported by other researchers (Wang and Yan, 2011).
The other Hill parameter is nH, the “Hill cooperativity coefficient of the binding interaction” (Yuen
and Hameed, 2010b), it varied for the two. Non equilibrium conditions gave slightly lower values for
CA1 (0.22) and slightly higher values for 207C (0.82), as compared with the values obtained from a
complete isotherm (0.30 and 0.76 for CA1 and 207C, respectively). Although this difference seems
negligible (Figure 5-12 and Figure 5-13).

Chapter 5. Adsorption Equilibrium of Methylene Blue onto Activated Carbon and onto TiO2-Activated Carbon Mixture
95
Figure 5-4 BET-2, Redlich-Peterson and Radke-Prausnitz isotherm fit (carbon-dye case)
Figure 5-5 Dubinin-Astakhov, Hill and Koble-Corrigan isotherm fit (carbon-dye case)
200150100500
200
150
100
50
0
Ce (mg/L)
Qe
(m
g/g
)
Qe (calc) BET-2
Qe (calc) Redlich-Peterson
Qe (calc) Radke-Prausnitz
Qe (obs)
Variable
1007550250
200
150
100
50
0
Ce (mg/L)
Qe
(m
g/g
)
Qe (calc) BET-2
Qe (calc) Redlich-Peterson
Qe (calc) Radke-Prausnitz
Qe (obs)
Variable
604530150
160
120
80
40
0
Ce (mg/L)
Qe
(m
g/g
)
Qe (calc) BET-2
Qe (calc) Redlich-Peterson
Qe (calc) Radke-Prausnitz
Qe (obs)
Variable
20151050
80
60
40
20
0
Ce (mg/L)
Qe
(m
g/g
)Qe (calc) BET-2
Qe (calc) Redlich-Peterson
Qe (calc) Radke-Prausnitz
Qe (obs)
Variable
Equilibr ium CA 1
Adsorption time = 18 hours
Equilibr ium 207C
Adsorption time = 18 hours
Pseudo-Equilibr ium CA 1
Adsorption time = 1 hour
Pseudo-Equilibr ium 207C
Adsorption time = 1 hour
200150100500
200
150
100
50
0
Ce (mg/L)
Qe
(m
g/g
)
Qe (calc) Dubinin-Astakhov
Qe (calc) Hill
Qe (calc) Koble-Corrigan
Qe (obs)
Variable
1007550250
200
150
100
50
0
Ce (mg/L)
Qe
(m
g/g
)
Qe (calc) Dubinin-Astakhov
Qe (calc) Hill
Qe (calc) Koble-Corrigan
Qe (obs)
Variable
604530150
160
120
80
40
0
Ce (mg/L)
Qe
(m
g/g
)
Qe (calc) Dubinin-Astakhov
Qe (calc) Hill
Qe (calc) Koble-Corrigan
Qe (obs)
Variable
20151050
80
60
40
20
0
Ce (mg/L)
Qe
(m
g/g
)
Qe (calc) Dubinin-Astakhov
Qe (calc) Hill
Qe (calc) Koble-Corrigan
Qe (obs)
Variable
Equilibr ium CA 1
Adsorption time = 18 hours
Equilibr ium 207C
Adsorption time = 18 hours
Pseudo-Equilibr ium CA 1
Adsorption time = 1 hour
Pseudo-Equilibr ium 207C
Adsorption time = 1 hour

Chapter 5. Adsorption Equilibrium of Methylene Blue onto Activated Carbon and onto TiO2-Activated Carbon Mixture
96
Figure 5-6 BET-2, Redlich-Peterson and Radke-Prausnitz isotherm fit (TiO2-CA1-dye case)
Figure 5-7 Dubinin-Astakhov, Hill and Koble-Corrigan isotherm fit (TiO2-CA1-dye case)
483624120
160
120
80
40
0
Ce (mg/L)
Qe
(m
g/g
)
Qe (calc) BET-2
Qe (calc) Redlich-Peterson
Qe (calc) Radke-Prausnitz
Qe (obs)
Variable
483624120
160
120
80
40
0
Ce (mg/L)
Qe
(m
g/g
)
Qe (calc) BET-2
Qe (calc) Redlich-Peterson
Qe (calc) Radke-Prausnitz
Qe (obs)
Variable
483624120
160
120
80
40
0
Ce (mg/L)
Qe
(m
g/g
)
Qe (calc) BET-2
Qe (calc) Redlich-Peterson
Qe (calc) Radke-Prausnitz
Qe (obs)
Variable
483624120
160
120
80
40
0
Ce (mg/L)
Qe
(m
g/g
)Qe (calc) BET-2
Qe (calc) Redlich-Peterson
Qe (calc) Radke-Prausnitz
Qe (obs)
Variable
T iO2/CA 1 = 0 .25 T iO2/CA 1 = 0 .50
T iO2/CA 1 = 1 .00 T iO2/CA 1 = 1 .75
Adsorption time = 1 hour Adsorption time = 1 hour
Adsorption time = 1 hour Adsorption time = 1 hour
483624120
160
120
80
40
0
Ce (mg/L)
Qe
(m
g/g
)
Qe (calc) Dubinin-Astakhov
Qe (calc) Hill
Qe (calc) Koble-Corrigan
Qe (obs)
Variable
483624120
160
120
80
40
0
Ce (mg/L)
Qe
(m
g/g
)
Qe (calc) Dubinin-Astakhov
Qe (calc) Hill
Qe (calc) Koble-Corrigan
Qe (obs)
Variable
483624120
160
120
80
40
0
Ce (mg/L)
Qe
(m
g/g
)
Qe (calc) Dubinin-Astakhov
Qe (calc) Hill
Qe (calc) Koble-Corrigan
Qe (obs)
Variable
483624120
160
120
80
40
0
Ce (mg/L)
Qe
(m
g/g
)
Qe (calc) Dubinin-Astakhov
Qe (calc) Hill
Qe (calc) Koble-Corrigan
Qe (obs)
Variable
T iO2/CA 1 = 0 .25
Adsorption time = 1 hour
T iO2/CA 1 = 0 .50
T iO2/CA 1 = 1 .00 T iO2/CA 1 = 1 .75
Adsorption time = 1 hour
Adsorption time = 1 hour Adsorption time = 1 hour

Chapter 5. Adsorption Equilibrium of Methylene Blue onto Activated Carbon and onto TiO2-Activated Carbon Mixture
97
Figure 5-8 BET-2, Redlich-Peterson and Radke-Prausnitz isotherm fit (TiO2-207C-dye case)
Figure 5-9 Dubinin-Astakhov, Hill and Koble-Corrigan isotherm fit (TiO2-207C-dye case)
6.04.53.01.50.0
80
60
40
20
0
Ce (mg/L)
Qe
(m
g/g
)
Qe (calc) BET-2
Qe (calc) Redlich-Peterson
Qe (calc) Radke-Prausnitz
Qe (obs)
Variable
6.04.53.01.50.0
80
60
40
20
0
Ce (mg/L)
Qe
(m
g/g
)
Qe (calc) BET-2
Qe (calc) Redlich-Peterson
Qe (calc) Radke-Prausnitz
Qe (obs)
Variable
86420
80
60
40
20
0
Ce (mg/L)
Qe
(m
g/g
)
Qe (calc) BET-2
Qe (calc) Redlich-Peterson
Qe (calc) Radke-Prausnitz
Qe (obs)
Variable
86420
80
60
40
20
0
Ce (mg/L)
Qe
(m
g/g
)Qe (calc) BET-2
Qe (calc) Redlich-Peterson
Qe (calc) Radke-Prausnitz
Qe (obs)
Variable
T iO2/207C = 0 .25 T iO2/207C = 0 .50
T iO2/207C = 1 .00 T iO2/207C = 1 .75
Adsorption time = 1 hour Adsorption time = 1 hour
Adsorption time = 1 hour Adsorption time = 1 hour
6.04.53.01.50.0
80
60
40
20
0
Ce (mg/L)
Qe
(m
g/g
)
Qe (calc) Dubinin-Astakhov
Qe (calc) Hill
Qe (calc) Koble-Corrigan
Qe (obs)
Variable
6.04.53.01.50.0
80
60
40
20
0
Ce (mg/L)
Qe
(m
g/g
)
Qe (calc) Dubinin-Astakhov
Qe (calc) Hill
Qe (calc) Koble-Corrigan
Qe (obs)
Variable
86420
80
60
40
20
0
Ce (mg/L)
Qe
(m
g/g
)
Qe (calc) Dubinin-Astakhov
Qe (calc) Hill
Qe (calc) Koble-Corrigan
Qe (obs)
Variable
86420
80
60
40
20
0
Ce (mg/L)
Qe
(m
g/g
)
Qe (calc) Dubinin-Astakhov
Qe (calc) Hill
Qe (calc) Koble-Corrigan
Qe (obs)
Variable
T iO2/207C = 0 .25
Adsorption time = 1 hour
T iO2/207C = 0 .50
T iO2/207C = 1 .00 T iO2/207C = 1 .75
Adsorption time = 1 hour
Adsorption time = 1 hour Adsorption time = 1 hour

Chapter 5. Adsorption Equilibrium of Methylene Blue onto Activated Carbon and onto TiO2-Activated Carbon Mixture
98
Figure 5-10 Equilibrium versus pseudo-equilibrium parameters comparison from Dubinin-Astakhov and BET-2 models (CA1)
Figure 5-11 Equilibrium versus pseudo-equilibrium parameters comparison from Dubinin-Astakhov and BET-2 models (207C)
0.050
0.025
0.000
PseudoEquilibrium
200
100
0
PseudoEquilibrium
0.4
0.2
0.0
PseudoEquilibrium
1.0
0.5
0.0
10
5
0
Bd (D-A)
Me
an
Qm (D-A) n (D-A)
R^2 (D-A) MAE (D-A)
2
1
0
PseudoEquilibrium
40
20
0
100
50
0
PseudoEquilibrium
0.2
0.1
0.0
1.0
0.5
0.0PseudoEquilibrium
20
10
0
m (BET2)
Me
an
Ks (BET2) qm (BET2)
KL (BET2) R^2 (BET2) RMSD (BET2)
0.05921
0.009105
163.4
218.1
0.362
0.5254
0.9764020.9357
3.81422
8.70659
2.181282.17557
33.0826
43.4871
63.7311
96.8742
0.114529
0.269997 0.9743960.948178
10.4596
18.4699
Dubinin-Astakhov Isotherm
BET-2 Isotherm
Norit CA1
Norit CA1
10
5
0
Pseudo-Eq.Equilibrium
100
50
0
200
100
0
Pseudo-Eq.Equilibrium
0.8
0.4
0.0
1.0
0.5
0.0Pseudo-Eq.Equilibrium
16
8
0
m (BET-2)
Me
an
Ks (BET-2) qm (BET-2)
KL (BET-2) R^2 (BET-2) RMSD (BET-2)
0.00002
0.00001
0.00000
Pseudo-Eq.Equilibrium
200
100
0
Pseudo-Eq.Equilibrium
2
1
0
Pseudo-Eq.Equilibrium
1.0
0.5
0.0
8
4
0
Bd (D-A)
Me
an
Qm (D-A) n (D-A)
R^2 (D-A) MAE (D-A)
11.7943
1.20045 5.39606
117.767
62.4989
181.487
0.0131432
0.853576 0.9948830.971677
2.73009
14.4699
2.383e-005
1.828e-009 70.92
216.9
1.243
2.147
0.9775360.949078
2.22224
8.38875
BET-2 Isotherm
Dubinin-Astakhov Isotherm
207C
207C

Chapter 5. Adsorption Equilibrium of Methylene Blue onto Activated Carbon and onto TiO2-Activated Carbon Mixture
99
Figure 5-12 Comparison of Hill and Koble-Corrigan isotherm parameters from pseudo-equilibrium and equilibrium (CA1)
Figure 5-13 Comparison of Hill and Koble-Corrigan isotherm parameters from pseudo-equilibrium and equilibrium (207C)
4
2
0
PseudoEquilibrium
0.30
0.15
0.00
PseudoEquilibrium
400
200
0
PseudoEquilibrium
1.0
0.5
0.0
10
5
0
Kd (Hill)
Me
an
nh (Hill) Qsh (Hill)
R^2 (Hill) MAE (Hill)
300
150
0
PseudoEquilibrium
1.0
0.5
0.0
PseudoEquilibrium
0.30
0.15
0.00
PseudoEquilibrium
1.0
0.5
0.0
10
5
0
A (K-C)
Me
an
B (K-C) n (K-C)
R^2 (K-C) MAE (K-C)
4.142
0.854
0.22
0.305 362.8
251
0.9754810.929226
3.60816
9.17387
90.6
291.2
0.2835
1.155
0.2274
0.3011
0.9765770.928765
3.61819
9.17219
Hill Isotherm
Koble-Corrigan Isotherm
Norit CA1
Norit CA1
0.30
0.15
0.00
Pseudo-Eq.Equilibrium
0.8
0.4
0.0
Pseudo-Eq.Equilibrium
200
100
0
Pseudo-Eq.Equilibrium
1.0
0.5
0.0
8
4
0
Kd (Hill)
Me
an
nh (Hill) Qsh (Hill)
R^2 (Hill) MAE (Hill)
4000
2000
0
Pseudo-Eq.Equilibrium
20
10
0
Pseudo-Eq.Equilibrium
0.8
0.4
0.0
Pseudo-Eq.Equilibrium
1.0
0.5
0.0
8
4
0
A (K-C)
Me
an
B (K-C) n (K-C)
R^2 (K-C) MAE (K-C)
0.3268
0.0463
0.82060.7591
72.88
217.6
0.9790950.954456
2.02949
7.88235
223
4733
3.06
21.77 0.82060.7602
0.9790940.954679
2.02949
7.88444
Hill Isotherm
Koble-Corrigan Isothem
207C
207C

Chapter 5. Adsorption Equilibrium of Methylene Blue onto Activated Carbon and onto TiO2-Activated Carbon Mixture
100
5.2.4 Influence of TiO2 on the adsorption of methylene blue onto TiO2-Activated
carbon mixture under pseudo-equilibrium conditions
The influence of TiO2 on the adsorption process of methylene blue onto activated carbon was
studied from a pseudo-equilibrium perspective (contact time, 1 h). The objective was to evaluate the
photocatalyst effect in the time-dependent phase distribution of methylene blue between the liquid
and solid phases. Previous experiments had indicated that equilibrium conditions were not achieved
after 1 hour adsorption conditions. In this regard, the results of this section do not consider the
fraction of sorption that is slower to reach equilibrium, which means that this shorter contact time
would place more emphasis on adsorption in the larger pores, rather than focusing on the smaller
micropores. Furthermore, work looking at adsorption of activated carbon mixed with TiO2 in totally
absence of light could be done to check the baseline of solute uptake in this mixed system.
Experimental results from this set of isotherms are shown in Table 5-5 (Hill), Table 5-6 (BET-2), Table
5-7 (Koble-Corrigan), Table 5-8 (Dubinin-Astakhov), Table 5-9 (Redlich-Peterson), and Table 5-10
(Radke-Prausnitz) .
Table 5-5 Hill model parameters, R2 and MAE for the pseudo-equilibrium adsorption of methylene blue onto CA1 and onto 207C under the influence of TiO2
R (TiO2 /AC) kd nh Qsh (mg/L) R2 MAE
CA1
0 (pseudo-equilibrium) 3.722 ± 1.265 0.2248 ± 0.0822 333.2307 ± 56.1371 0.975 3.608
0.25 0.3253 ± 0.2076 0.5666 ± 0.1646 140.0006 ± 11.7810 0.963 6.703
0.50 1.4874 ± 0.9787 0.2850 ± 0.1053 209.0207 ± 78.3605 0.941 7.085
1.00 1.6273 ± 1.0430 0.3493 ± 0.0939 202.7905 ± 73.9998 0.971 4.589
1.75 1.0242 ± 0.4108 0.4303 ± 0.0984 168.2815 ± 25.1485 0.982 4.189
207C
0 (pseudo-equilibrium) 0.3268 ± 0.0677 0.8206 ± 0.0805 72.8785 ± 2.7094 0.979 2.029
0.25 2.9398 ± 1.4965 0.6346 ± 0.137 140.9263 ± 38.8559 0.968 2.381
0.50 1.1691 ± 0.8905 0.6494 ± 0.1205 100.3908 ± 26.6431 0.962 2.130
1.00 1.4188 ± 0.7461 0.6732 ± 0.1402 96.23947 ± 25.4114 0.980 2.357
1.75 1.9962 ± 0.9303 0.5048 ± 0.1124 125.6662 ± 39.8007 0.988 1.736

Chapter 5. Adsorption Equilibrium of Methylene Blue onto Activated Carbon and onto TiO2-Activated Carbon Mixture
101
Table 5-6 BET-2 model parameters, R2 and MAE for the pseudo-equilibrium adsorption of methylene blue onto CA1 and onto 207C under the influence of TiO2
R (TiO2 /AC) m Ks (L/mg) qm (mg/g) KL (L/mg) R2 RMSD
CA1
0 (pseudo-eq.) 2.181 ± 0.327 33.083 ± 28.667 63.731 ± 10.238 0.114 ± 0.109 0.974 10.460
0.25 1.759 ± 0.233 33.069 ± 11.846 96.051 ± 9.583 0.050 ± 0.069 0.986 8.061
0.50 1.9424 ± 0.402 241.659 ± 168.75 75.008 ± 9.224 0.243 ± 0.197 0.980 9.894
1.00 1.985 ± 0.235 15.019 ± 7.061 82.351 ± 10.412 0.063 ± 0.047 0.985 8.421
1.75 1.894 ± 0.211 11.352 ± 5.754 83.898 ± 10.627 0.084 ± 0.089 0.989 7.360
207C
0 (pseudo-eq.) 11.794 ± 3.803 5.396 ± 1.086 62.499 ± 4.094 0.013 ± 0.007 0.995 2.730
0.25 2.743 ± 0.937 4.511 ± 4.198 39.736 ± 11.379 0.162 ± 0.151 0.983 4.519
0.50 3.557 ± 0.922 24.168 ± 14.458 22.668 ± 7.734 0.654 ± 0.256 0.979 4.965
1.00 3.537 ± 1.369 14.183 ± 9.857 20.849 ± 9.707 0.689 ± 0.257 0.981 4.942
1.75 2.897 ± 0.417 13.659 ± 7.171 28.515 ± 6.368 0.421 ± 0.205 0.994 2.780
Table 5-7 Koble-Corrigan model parameters, R2 and MAE for the pseudo-equilibrium adsorption of methylene blue onto CA1 and onto 207C under the influence of TiO2
R (TiO2 /AC) A B (L/mg)n n R2 MAE
CA1
0 (pseudo-eq.) 90.5986 ± 31.5630 0.2835 ± 0.3800 0.2274 ± 0.0511 0.977 3.618
0.25 430.2974 ± 244.1344 3.0735 ± 1.9607 0.5666 ± 0.0741 0.963 6.703
0.50 143.2467 ± 81.6798 0.6962 ± 0.7665 0.2880 ± 0.0517 0.942 7.104
1.00 124.6351 ± 43.1507 0.6147 ± 0.4316 0.3494 ± 0.0533 0.971 4.589
1.75 162.6042 ± 41.9398 0.9622 ± 0.3875 0.4281 ± 0.0675 0.982 4.198
207C
0 (pseudo-eq.) 223.0351 ± 39.1785 3.0604 ± 0.6346 0.8206 ± 0.0519 0.979 2.029
0.25 48.1670 ± 18.0054 0.3445 ± 0.4037 0.6364 ± 0.0492 0.968 2.382
0.50 85.7846 ± 34.6691 0.8538 ± 0.6507 0.6488 ± 0.0414 0.962 2.130
1.00 68.0804 ± 18.3985 0.7095 ± 0.3714 0.6755 ± 0.0427 0.980 2.361
1.75 62.9641 ± 16.4025 0.5012 ± 0.3271 0.5049 ± 0.0576 0.988 1.736

Chapter 5. Adsorption Equilibrium of Methylene Blue onto Activated Carbon and onto TiO2-Activated Carbon Mixture
102
Table 5-8 Dubinin-Astakhov model parameters, R2 and MAE for the pseudo-equilibrium adsorption of methylene blue onto CA1 and onto 207C under the influence of TiO2
R (TiO2 /AC) BD (mol2 J-2) qm (mg/g) n E (J/mol) R2 MAE
CA1
0 (pseudo-eq.) 0.0592 ± 0.0320 163.4040 ± 33.6015 0.3620 ± 0.1245 2.9060 0.976 3.814
0.25 0.0033 ± 0.0103 141.9542 ± 20.3703 0.6695 ± 0.1379 12.3000 0.925 9.443
0.50 0.0113 ± 0.0239 151.2991 ± 25.1660 0.5314 ± 0.1209 6.6464 0.937 7.546
1.00 0.0655 ± 0.0265 189.2982 ± 44.5116 0.3710 ± 0.1846 2.7624 0.956 6.110
1.75 0.0041 ± 0.0061 147.2384 ± 11.6649 0.6603 ± 0.1455 11.0028 0.976 5.725
207C
0 (pseudo-eq.) 2.383·10-5 ± 2.249·10-5 70.9167 ± 1.9446 1.2430 ± 0.1075 144.8419 0.977 2.222
0.25 0.0192 ± 0.0107 123.2823 ± 37.9144 0.5594 ± 0.2884 5.1039 0.966 2.523
0.50 0.0030 ± 0.0072 92.3018 ± 20.9877 0.7293 ± 0.2655 12.8771 0.962 2.116
1.00 0.0079 ± 0.0094 95.1258 ± 21.5612 0.6327 ± 0.1949 7.9317 0.980 2.335
1.75 0.0148 ± 0.0115 106.1149 ± 25.6546 0.5599 ± 0.1563 5.8145 0.987 1.828
Table 5-9 Redlich-Peterson model parameters, R2 and MAE for the pseudo-equilibrium adsorption of methylene blue onto CA1 and onto 207C under the influence of TiO2
R (TiO2 /AC) bRP (L/mg) g qmon (mg/g) R2 MAE
CA1
0 (pseudo-eq.) 19.1221 ± 21.8756 0.8652 ± 0.0363 75.2811 0.968 3.898
0.25 32.5955 ± 13.9595 0.9163 ± 0.0240 101.9526 0.981 4.774
0.50 146.1367 ± 109.6158 0.8694 ± 0.0425 85.3126 0.950 6.667
1.00 38.0531 ± 29.8108 0.8498 ± 0.0307 80.5201 0.977 4.323
1.75 25.1655 ± 12.7082 0.8654 ± 0.0217 85.7265 0.986 3.422
207C
0 (pseudo-eq.) 9.4709 ± 4.3059 0.8658 ± 0.0422 55.4369 0.991 1.511
0.25 3.6800 ± 4.2045 0.7204 ± 0.1522 47.3341 0.974 2.204
0.50 8.6892 ± 7.0261 0.7773 ± 0.1063 51.3510 0.960 2.524
1.00 2.5698 ± 2.4038 0.8615 ± 0.1397 56.9994 0.975 2.352
1.75 15.0223 ± 9.2237 0.7553 ± 0.0525 45.4701 0.987 1.703

Chapter 5. Adsorption Equilibrium of Methylene Blue onto Activated Carbon and onto TiO2-Activated Carbon Mixture
103
Table 5-10 Radke-Prausnitz model parameters, R2 and MAE for the pseudo-equilibrium adsorption of methylene blue onto CA1 and onto 207C under the influence of TiO2
R (TiO2 /AC) βR rR aRP R2 MAE
CA1
0 (pseudo-eq.) 0.1348 ± 0.0364 75.2861 ± 9.0815 1433.0048 ± 1536.1206 0.968 3.897
0.25 0.0866 ± 0.0219 101.0067 ± 6.9603 4279.7079 ± 1582.4123 0.983 4.327
0.50 0.1334 ± 0.0349 84.4466 ± 9.3751 35321.3925 ± 29957.7539 0.959 6.286
1.00 0.1543 ± 0.0328 79.9353 ± 8.3616 4402.4807 ± 4130.7762 0.971 4.110
1.75 0.1365 ± 0.0222 85.1521 ± 5.9775 2300.7396 ± 1110.8124 0.986 3.402
207C
0 (pseudo-eq.) 0.1342 ± 0.0422 55.4368 ± 4.6419 525.0388 ± 200.9519 0.991 1.511
0.25 0.2783 ± 0.1519 47.4467 ± 13.7999 173.5376 ± 149.0030 0.974 2.204
0.50 0.2228 ± 0.1062 51.3402 ± 8.4582 447.0878 ± 449.8115 0.960 2.523
1.00 0.1385 ± 0.1397 56.9892 ± 16.6417 146.5194 ± 96.1475 0.975 2.352
1.75 0.2451 ± 0.0527 45.4187 ± 3.9872 696.7135 ± 476.8819 0.987 1.697
Adsorption capacity
Adsorption capacity dictates the amount of adsorbent required (Knaebel, 1999). The capacity as
determined by some of the models in this study (Figure 5-14) indicated an increase in adsorption
capacity in CA1 due to the presence of TiO2. In contrast, a decrease in capacity in 207C was
observed. The extent of the increase or decrease, depending on the type of carbon used, was a
function of the amount of TiO2 added to the adsorption system. Small additions of TiO2 seemed to
produce the higher increase in the capacity of CA1. The capacity of 207C decreased with small
additions of TiO2 until the capacity becomes constant and further additions had no further effect. In
Figure 5-14 can be seen that the trend of the capacity from Freundlich and Re-Pe values was similar.
The Freundlich isotherm did not fit the data, so the sharper tendency from BET-2 model was
considered more reliable. This decrease in the capacity of 207C in the presence of TiO2 suggests that
the dye molecules did not enter the carbon pores. The maximum adsorption capacity of methylene
blue on Degussa P-25 was reported as 11.7 µmol/g (Lachheb et al., 2002), which is equivalent to
3.323 mg/g. As compared with control conditions (i.e., Qm at pseudo-equilibrium in Table 5-6), the
increase or decrease in the capacity of the carbons after TiO2 addition was greater than if it was
produced by the methylene blue being adsorbed onto the TiO2.

Chapter 5. Adsorption Equilibrium of Methylene Blue onto Activated Carbon and onto TiO2-Activated Carbon Mixture
104
Figure 5-14 Adsorption capacity changes with a mass ratio (R) TiO2/adsorbent of 0.0, 0.25, 0.50, 1.0 and 1.75 from BET-2, Freundlich, Radke-Prausnitz and Redlich-Peterson isotherm models
The specific surface area covered by methylene blue molecules (SS, m2/g) was calculated and are
presented in Table 5-11 and Table 5-12, using values from Table 5-13 as described by Qi et al. (2011).
BET surface area obtained from porosimetry analysis is shown in Table 5-14. SS values much lower
than SBET were obtained, because the value of SBET, included the external and the internal area and
there is a fraction of pores that cannot be accessed by methylene blue (Benadjemia et al., 2011).
Compared to control conditions (R=0) (i.e., being R the mass ratio TiO2/adsorbent), the 207C surface
area covered by methylene blue suffered a decreased when TiO2 was in the system (R=0.25 to 1.75).
The percentage decrease ranged from 33.36 to 63.58% and depended on the amount of TiO2
present. The increases in the surface area covered by methylene blue observed in the system TiO2-
CA1 ranged from 17.69 to 50.71%, depending on the amount of photocatalyst added. In this regard,
CA1 showed more sensitivity to variations of TiO2. It is interesting to remark, that the results
observed for the pseudo-equilibrium conditions of TiO2-CA1-dye showed in Table 5-11 (contact time,
1 h) were comparable to the ones under full equilibrium conditions in CA1-dye (contact time, 18 h).
2.01.51.00.50.0
100
80
60
40
20
R
Ca
pa
cit
y (
mg
/g
)rR (R-Pr)
qmon (R-Pe)
qm (BET-2)
Kf (F reundlich)
2.01.51.00.50.0
100
80
60
40
20
R
Ca
pa
cit
y (
mg
/g
)
qmon (R-Pe)
qm (BET-2)
Kf (F reundlich)
rR (R-Pr)
CA1
207C
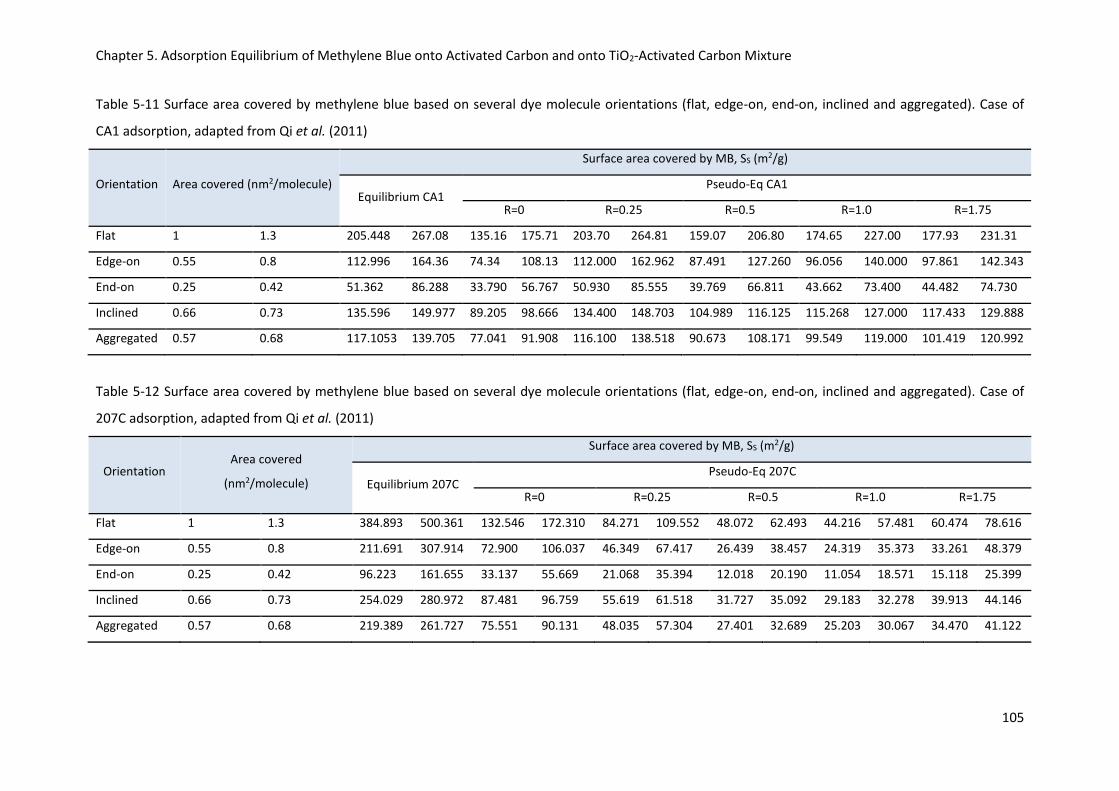
Chapter 5. Adsorption Equilibrium of Methylene Blue onto Activated Carbon and onto TiO2-Activated Carbon Mixture
105
Table 5-11 Surface area covered by methylene blue based on several dye molecule orientations (flat, edge-on, end-on, inclined and aggregated). Case of
CA1 adsorption, adapted from Qi et al. (2011)
Orientation Area covered (nm2/molecule)
Surface area covered by MB, SS (m2/g)
Equilibrium CA1 Pseudo-Eq CA1
R=0 R=0.25 R=0.5 R=1.0 R=1.75
Flat 1 1.3 205.448 267.08 135.16 175.71 203.70 264.81 159.07 206.80 174.65 227.00 177.93 231.31
Edge-on 0.55 0.8 112.996 164.36 74.34 108.13 112.000 162.962 87.491 127.260 96.056 140.000 97.861 142.343
End-on 0.25 0.42 51.362 86.288 33.790 56.767 50.930 85.555 39.769 66.811 43.662 73.400 44.482 74.730
Inclined 0.66 0.73 135.596 149.977 89.205 98.666 134.400 148.703 104.989 116.125 115.268 127.000 117.433 129.888
Aggregated 0.57 0.68 117.1053 139.705 77.041 91.908 116.100 138.518 90.673 108.171 99.549 119.000 101.419 120.992
Table 5-12 Surface area covered by methylene blue based on several dye molecule orientations (flat, edge-on, end-on, inclined and aggregated). Case of
207C adsorption, adapted from Qi et al. (2011)
Orientation Area covered
(nm2/molecule)
Surface area covered by MB, SS (m2/g)
Equilibrium 207C Pseudo-Eq 207C
R=0 R=0.25 R=0.5 R=1.0 R=1.75
Flat 1 1.3 384.893 500.361 132.546 172.310 84.271 109.552 48.072 62.493 44.216 57.481 60.474 78.616
Edge-on 0.55 0.8 211.691 307.914 72.900 106.037 46.349 67.417 26.439 38.457 24.319 35.373 33.261 48.379
End-on 0.25 0.42 96.223 161.655 33.137 55.669 21.068 35.394 12.018 20.190 11.054 18.571 15.118 25.399
Inclined 0.66 0.73 254.029 280.972 87.481 96.759 55.619 61.518 31.727 35.092 29.183 32.278 39.913 44.146
Aggregated 0.57 0.68 219.389 261.727 75.551 90.131 48.035 57.304 27.401 32.689 25.203 30.067 34.470 41.122

Chapter 5. Adsorption Equilibrium of Methylene Blue onto Activated Carbon and onto TiO2-Activated Carbon Mixture
106
Table 5-13 Adsorption capacity from BET-2 isotherm model of CA1 and 207C, R is the TiO2/adsorbent mass ratio
Adsorption Capacity CA1
(mg/g)
Adsorption Capacity 207C
(mg/g)
Equilibrium 96.874 181.487
Pseudo-Eq. 63.731 96.051 75.008 82.351 83.898 62.499 39.736 22.667 20.849 28.515
R 0 0.25 0.5 1.0 1.75 0 0.25 0.5 1.0 1.75
Table 5-14 BET surface area from porosimetry analysis
TiO2 CA1 207C
SBET (m2/g) 50 1107.741 1075.972
A correlation between surface coverage and the enhancement of the photoactivity of titania when
mixed with activated carbon was found (Cordero, Duchamp, et al., 2007; Matos, Chovelon, et al.,
2009). The authors describe how the TiO2-carbon mixtures with higher coverage, showed a higher
increase in the photocatalytic activity of TiO2. Applied to this case, that would mean that the
photodegradation of methylene blue with TiO2-CA1 should show higher photocatalytic activity than
the TiO2-207C combination. Therefore, it could be expected that on this basis a higher extent of
regeneration would be achieved for CA1.
Heat of adsorption
Adsorption is an exothermic and spontaneous process accompanied by a decrease in Gibbs free
energy of the system (Duong, 1998; Cheremisinoff, 2002; Yuen and Hameed, 2009). According to the
second law of thermodynamics, adsorption occurs with a decrease in surface free energy, ∆𝐺, as
well as a decrease in entropy, ∆𝑆, because at least one degree of freedom is lost when the specie is
adsorbed, based on the following equation (Duong, 1998; Thomas and Crittenden, 1998)
∆𝐻 = ∆𝐺 + 𝑇∆𝑆 < 0 (5-1)
Therefore the enthalpy change (i.e. the absolute value is called heat (Hill, 1951)) of adsorption, ∆𝐻,
is negative which means heat is released from the adsorption process. This release of heat during
adsorption is partially taken up by the adsorbent itself, increasing its temperature and producing a
slowing down in the adsorption kinetics (Toledo et al., 2003). The heat of adsorption varies with the
surface coverage (Figure 5-15). This variation is associated with an adsorbent surface constituted of
sites with different energy levels or with interactions among adsorbed molecules (Gómez-Serrano et
al., 1995). The adsorbate specie is adsorbed preferentially onto sites having the highest energy of
adsorption, and then sites of lower energy are filled, which results in a decrease of heat of

Chapter 5. Adsorption Equilibrium of Methylene Blue onto Activated Carbon and onto TiO2-Activated Carbon Mixture
107
adsorption with loading (Duong, 1998). The adsorption potential (A) (i.e., the change in the free
energy of adsorption, 𝐴 = −∆𝐺𝑎𝑑𝑠) is the work (energy) required to adsorb a specie (Duong, 1998).
As shows Figure 5-15 (A), low coverage adsorption occurs on high energy sites, and as the surface
coverage increases, the adsorbed specie occupy more onto lower energy sites. The addition of TiO2
increased the coverage values with respect to the base case (R = 0) in the case of CA1, and
decreased them in the case of 207C. At same surface coverage, higher energy sites were found when
TiO2 was added in the CA1 suspension, and lower ones in the presence of 207C compared to the
control conditions.
Figure 5-16 shows the influence of TiO2 in the heat of adsorption using the dimensionless parameter
K (KS/KL) from the BET-2 isotherm equation. In this case, the parameter also decreased with the
addition of TiO2 in 207C and increased with CA1. The higher changes in the Gibbs free energy of
adsorption from TiO2-CA1 adsorption system may indicate a higher energy of adsorptive binding.
This behaviour would indicate stronger interaction strength between the dye and the carbon CA1 in
the presence of TiO2. Furthermore, it could indicate that TiO2 could be occupying high energy sites
on 207C, no longer available for the dye, and thus lowering the energy of adsorption.
The enhancement in the adsorption potential leads to higher heat of adsorption. As shows Figure
5-15 (B), stronger adsorption (higher E values) was seen in CA1 and weaker energy of interaction
(lower E values) in 207C, after the addition of TiO2. The values of E in each activated carbon got
closer to each other, as compared to the base case (i.e., in the absence of TiO2), where the E value
for 207C-MB case was a hundred times bigger than in CA1-MB case. As it was described before,
smaller pore sizes provides higher energy of interaction, and therefore, stronger adsorption
(Pelekani and Snoeyink, 2000). But, as described before, the increase in adsorption energy could be
as well the result of stronger lateral interactions between the adsorbed molecules (Duong, 1998)
rather than the effect of the width of the pores.
As was described in Chapter 2, the higher the adsorption energy, the lower will be the reversible
adsorption (Aktaş and Çeçen, 2007). This highlights the possibility that low amounts of TiO2 would
produce lower regeneration percentages in CA1 than higher amounts of TiO2 due to the increased
strength of the interaction between the dye and the acid carbon in the former case (lower
desorption) (See Figure 5-15). Desorption rates would be favoured in 207C after the addition of TiO2
due to the weaker interaction carbon-dye as compared to the base case (R=0.0).

Chapter 5. Adsorption Equilibrium of Methylene Blue onto Activated Carbon and onto TiO2-Activated Carbon Mixture
108
Figure 5-15 (A) Variation of the adsorption potential A with the coverage, and (B) Characteristic energy E as a function of R (i.e., the mass ratio TiO2 /adsorbent), calculated from the Dubinin-Astakhov isotherm
Figure 5-16 Influence of TiO2 in the heat of adsorption using the dimensionless parameter K (KS/KL) from BET-2 isotherm. R is the mass ratio TiO2 /adsorbent
Dubinin-Astakhov Isotherm
20000150001000050000
1.00
0.75
0.50
0.25
0.00
A (J/mol)
Co
ve
ra
ge
0.00
0.25
0.50
1.00
1.75
R
100007500500025000
1.00
0.75
0.50
0.25
0.00
A (J/mol)
Co
ve
ra
ge
0.00
0.25
0.50
1.00
1.75
R
2.01.51.00.50.0
20
15
10
5
Ratio
E(J/m
ol)
2.01.51.00.50.0
160
120
80
40
0
Ratio
E(J/m
ol)
Change Free Energy of A dsorption
CA1
Change Free Energy of A dsorption
207C
Character istic Energy Character istic Energy
CA1 207C
(A)
(B)
2.01.51.00.50.0
1000
800
600
400
200
0
2.01.51.00.50.0
207C
R
K
CA1
Dimensionles Parameter K(BET-2 Isotherm)
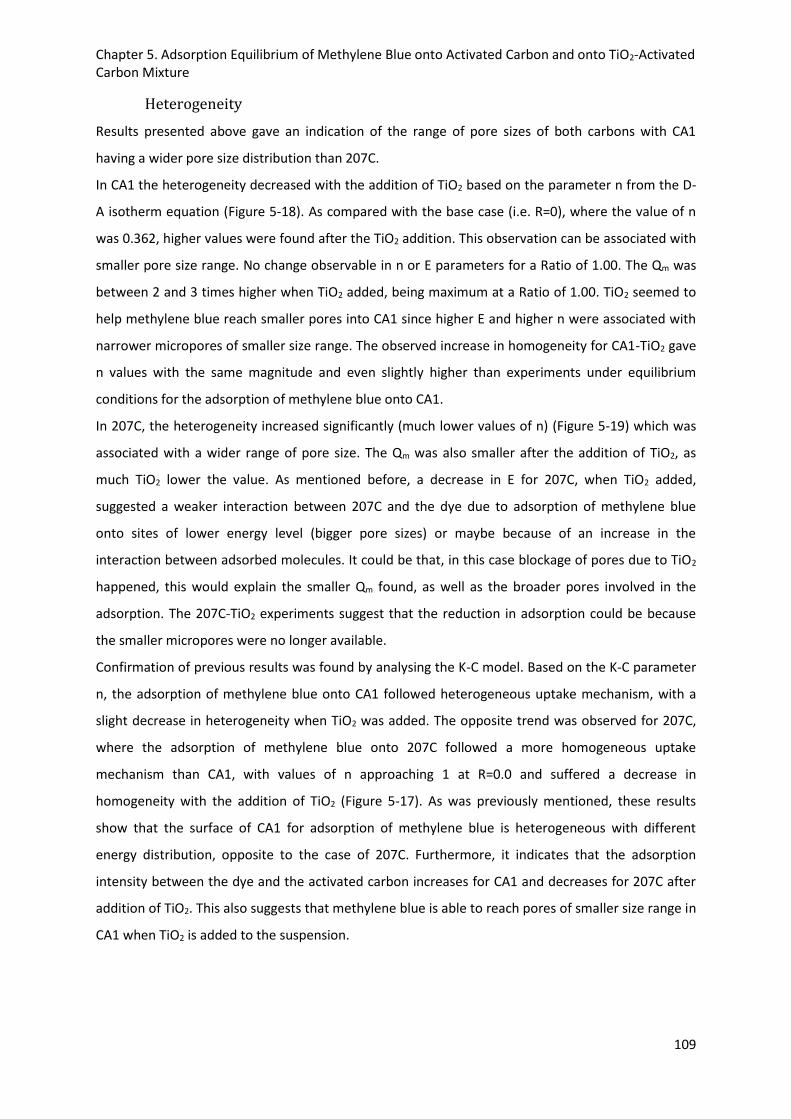
Chapter 5. Adsorption Equilibrium of Methylene Blue onto Activated Carbon and onto TiO2-Activated Carbon Mixture
109
Heterogeneity
Results presented above gave an indication of the range of pore sizes of both carbons with CA1
having a wider pore size distribution than 207C.
In CA1 the heterogeneity decreased with the addition of TiO2 based on the parameter n from the D-
A isotherm equation (Figure 5-18). As compared with the base case (i.e. R=0), where the value of n
was 0.362, higher values were found after the TiO2 addition. This observation can be associated with
smaller pore size range. No change observable in n or E parameters for a Ratio of 1.00. The Qm was
between 2 and 3 times higher when TiO2 added, being maximum at a Ratio of 1.00. TiO2 seemed to
help methylene blue reach smaller pores into CA1 since higher E and higher n were associated with
narrower micropores of smaller size range. The observed increase in homogeneity for CA1-TiO2 gave
n values with the same magnitude and even slightly higher than experiments under equilibrium
conditions for the adsorption of methylene blue onto CA1.
In 207C, the heterogeneity increased significantly (much lower values of n) (Figure 5-19) which was
associated with a wider range of pore size. The Qm was also smaller after the addition of TiO2, as
much TiO2 lower the value. As mentioned before, a decrease in E for 207C, when TiO2 added,
suggested a weaker interaction between 207C and the dye due to adsorption of methylene blue
onto sites of lower energy level (bigger pore sizes) or maybe because of an increase in the
interaction between adsorbed molecules. It could be that, in this case blockage of pores due to TiO2
happened, this would explain the smaller Qm found, as well as the broader pores involved in the
adsorption. The 207C-TiO2 experiments suggest that the reduction in adsorption could be because
the smaller micropores were no longer available.
Confirmation of previous results was found by analysing the K-C model. Based on the K-C parameter
n, the adsorption of methylene blue onto CA1 followed heterogeneous uptake mechanism, with a
slight decrease in heterogeneity when TiO2 was added. The opposite trend was observed for 207C,
where the adsorption of methylene blue onto 207C followed a more homogeneous uptake
mechanism than CA1, with values of n approaching 1 at R=0.0 and suffered a decrease in
homogeneity with the addition of TiO2 (Figure 5-17). As was previously mentioned, these results
show that the surface of CA1 for adsorption of methylene blue is heterogeneous with different
energy distribution, opposite to the case of 207C. Furthermore, it indicates that the adsorption
intensity between the dye and the activated carbon increases for CA1 and decreases for 207C after
addition of TiO2. This also suggests that methylene blue is able to reach pores of smaller size range in
CA1 when TiO2 is added to the suspension.

Chapter 5. Adsorption Equilibrium of Methylene Blue onto Activated Carbon and onto TiO2-Activated Carbon Mixture
110
Figure 5-17 Heterogeneity parameter from Koble-Corrigan isotherm versus mass of TiO2 (R is the mass ratio TiO2/adsorbent)
Cooperativity
This section looks at the parameters from the Hill isotherm model. Cooperative adsorption is said to
occur when already adsorbed molecules are able to augment the adsorption of further molecules
(Bansal and Goyal, 2005). Negative cooperativity existed in all cases for both activated carbons,
which means that the interaction between the adsorbent and the dye has more influence than the
interaction between dye molecules. The presence of apparent negative cooperativity may be due to
the heterogeneity of the binding sites. Negative binding would happen once the methylene blue
molecule had been adsorbed to the AC, its affinity for other methylene blue molecule would
decrease. In general the presence of TiO2 in the CA1-dye system decreased the negative
cooperativity, whilst in the 207C-dye system the negative cooperativity was increased. This provides
evidences that the presence of TiO2 increases the interaction between methylene blue molecules,
and the reverse is suggested for the other adsorbent.
Since nH is closer to 1 for 207C (non-cooperative binding), this case would better be described by the
Langmuir model in contrast to CA1 (negative binding). This tendency was consistent through the
results already shown, all isotherms in 207C were well characterised by the Langmuir model with R2
higher than 0.95 but in CA1 all R2 were lower than 0.95 (0.86 was the lowest). It has been claimed
that nH and KD values depend on experimental errors (Gorbatchuk et al., 2001). Therefore, without
relying on absolute values these results should be understood as an observed trend.
2.01.51.00.50.0
0.9
0.8
0.7
0.6
0.5
0.4
0.3
0.2
0.1
R
n
207C
CA1
Heterogeneity (n)(Koble-Corrigan Isotherm)

Chapter 5. Adsorption Equilibrium of Methylene Blue onto Activated Carbon and onto TiO2-Activated Carbon Mixture
111
Figure 5-18 Dubinin-Astakhov parameters changes with TIO2 mass (CA1). R is the mass ratio TiO2 /CA1
Figure 5-19 Dubinin-Astakhov parameters changes with TIO2 mass (207C). R is the mass ratio TiO2 /207C
0.060
0.045
0.030
0.015
0.000
R 1.75R 1.0R 0.5R 0.25
200
150
100
50
0R 1.75R 1.0R 0.5R 0.25
0.60
0.45
0.30
0.15
0.00
R 1.75R 1.0R 0.5R 0.25
1.00
0.75
0.50
0.25
0.00
10.0
7.5
5.0
2.5
0.0
Bd (D-A )
Me
an
Q m (D-A ) n (D-A )
R^2 (D-A ) MA E (D-A )
0.00413
0.06552
0.01132
0.003305
147.2
189.3
151.3142
0.6603
0.371
0.5314
0.6695
0.975951
0.9558130.937326
0.924679
5.72517
6.10958
7.54571
9.44359
Dubinin-Astakhov IsothermNorit CA1
0.020
0.015
0.010
0.005
0.000
R 1.75R 1.0R 0.5R 0.25
120
90
60
30
0R 1.75R 1.0R 0.5R 0.25
0.8
0.6
0.4
0.2
0.0
R 1.75R 1.0R 0.5R 0.25
1.00
0.75
0.50
0.25
0.00
2.4
1.8
1.2
0.6
0.0
Bd (D-A )
Me
an
Q m (D-A ) n (D-A )
R^2 (D-A ) MA E (D-A )
0.01479
0.007948
0.003015
0.01919
106.1
95.1392.3
123.3
0.5599
0.6327
0.7293
0.5594
0.987049
0.9801070.962311
0.965934
1.8283
2.33521
2.11612
2.52328
Dubinin-Astakhov Isotherm207C

Chapter 5. Adsorption Equilibrium of Methylene Blue onto Activated Carbon and onto TiO2-Activated Carbon Mixture
112
Figure 5-20 Hill parameter changes with the addition of TiO2 (CA1) , R is the mass ratio TiO2 /CA1
Figure 5-21 Hill parameter changes with the addition of TiO2 (207C), R is the mass ratio between TiO2 /207C
1.6
1.2
0.8
0.4
0.0
R 1.75R 1.0R 0.5R 0.25
0.60
0.45
0.30
0.15
0.00R 1.75R 1.0R 0.5R 0.25
200
150
100
50
0
R 1.75R 1.0R 0.5R 0.25
1.00
0.75
0.50
0.25
0.00
8
6
4
2
0
Kd (Hill)
Me
an
nh (Hill) Qsh (Hill)
R^2 (Hill) MAE (Hill)
1.024
1.27
1 .487
0.3254
0.4303
0.3493
0.285
0.5666
168.3
202.8209
140
0.981783
0.970602
0.941462
0.962648
4.189134.58914
7.085356.70337
Hill IsothermNorit CA1
3
2
1
0
R 1.75R 1.0R 0.5R 0.25
0.60
0.45
0.30
0.15
0.00R 1.75R 1.0R 0.5R 0.25
160
120
80
40
0
R 1.75R 1.0R 0.5R 0.25
1.00
0.75
0.50
0.25
0.00
2.4
1.8
1.2
0.6
0.0
Kd (Hill)
Me
an
nh (Hill) Qsh (Hill)
R^2 (Hill) MAE (Hill)
1.9996
1.4191.169
2.94
0 .5048
0.67320.64950.6346
125.7
96 .24100.4
140.9
0 .988169
0.9804860.96237
0.967909
1.73637
2.35728
2.13
2 .38139
Hill Isotherm207C

Chapter 5. Adsorption Equilibrium of Methylene Blue onto Activated Carbon and onto TiO2-Activated Carbon Mixture
113
Surface charge
The surface electric charge of TiO2 in combination with activated carbon was analysed in this section.
Carbon-TiO2-dye suspension
The datasets from both carbons were split in two groups to analyse the influence of the degrees of
freedom in the results, 16 and 30 observations were used as sample size in both activated carbons
analysis. No changes were found in the results with the two tested sample sizes. A correlation matrix
analysis was created to quantify the relationship between pairs of variables. VarClus (Sas Publishing,
2004; Rakotomalala, 2005) was also used as statistical tools to analyse the isotherm experiments.
The analysis of the experimental results showed that in the case of the less acidic carbon 207C,
variations of pH and zeta potential were attributed to the initial methylene blue concentration based
on the correlation matrix of Table 5-15. No influence of TiO2 was observed. In the case of the more
acidic carbon CA1, the influence of TiO2 in variations of pH in the solution before and after
adsorption was highlighted (Table 5-16). In this case, variations in the mean particle size were
measured and also correlated with the photocatalyst (i.e. scatterplot of the mean particle size as a
function of TiO2 is shown in Figure 5-23 and Figure 5-24 for CA1 and 207C, respectively). A mixture of
activated carbon with TiO2 was seen to produced TiO2 acid-basic changes by other authors (Araña,
2003b).
Table 5-15 Correlation Matrix for 207C from pseudo-equilibrium experiments (MB-carbon-TiO2)
Zeta C0 (mg/L) Var-pH R (mg TiO2/mg 207C)
Zeta 1 0.52925 0.54804 0.30972
C0 (mg/L) 0.52925 1 0.43338 0
Var-pH 0.54804 0.43338 1 -0.03231
R (mg TiO2/mg 207C) 0.30972 0 -0.03231 1
Table 5-16 Correlation Matrix for CA1 from pseudo-equilibrium experiments (MB-carbon-TiO2)
D[4,3] (µm) R (mg TiO2/mg CA1) Var-pH C0 (mg/L) Zeta
D[4,3] (µm) 1 -0.88775 -0.45632 0.0592 0.56361
R (mg TiO2/mg CA1) -0.88775 1 0.50607 0 -0.24102
Var-pH -0.45632 0.50607 1 0.82291 0.23149
C0 (mg/L) 0.0592 0 0.82291 1 0.54648
Zeta 0.56361 -0.24102 0.23149 0.54648 1
VarClus analysis was used to produce sets of variables called clusters. Each cluster is a linear
combination of the variables using the first principal component (i.e., a dimensionality reduction
technique that finds the direction where the data has the largest variance). The VarClus procedure
maximizes the variance explained by each cluster and allows the interpretation of the clustering

Chapter 5. Adsorption Equilibrium of Methylene Blue onto Activated Carbon and onto TiO2-Activated Carbon Mixture
114
depending on partial correlations. The variables in the cluster are as correlated as possible with the
cluster that belong and as uncorrelated as possible with the other clusters (Sarle, 1990). This
classificatory analysis was in agreement with the correlation matrix of Table 5-15 and Table 5-16.
Zeta values seemed more influenced by the initial concentration of methylene blue in both ACs.
Conversely, variations of pH could be explained by the initial methylene blue concentration C0 in
207C, but it was more correlated with the mass of TiO2 in CA1 (Table 5-17).
Table 5-17 VarClus analysis for pseudo-equilibrium data
207C CA1
Attribute membership Cluster 1 Cluster 2 membership Cluster 1
R (mg TiO2/mg carbon) 1 1 0.1634 1 0.9043
Zeta 1 0.3097 0.8542 0 -0.285
C0 (mg/L) 1 0.113 0.7942 0 0.2943
Var-pH 1 -0.0323 0.8053 1 0.7536
D[4,3] (µm) not measured 1 0.9203
The relation between the initial methylene blue concentration and the zeta potential of the
suspension mixture carbon-TiO2 is shown in Figure 5-22. The higher was the C0, the more positive
the zeta potential. The effect of TiO2 in the pH of the suspension, as well as in the mean particle size
is illustrated in Figure 5-23 and Figure 5-24 for CA1 and 207C, respectively. When CA1 is in the
suspension, it was found that the higher the amount of TiO2the higher was the pH. No significant
changes were observed for 207C. Furthermore, as the amount of TiO2 increases (R increases) a
decrease in the mean particle size of the suspension is observed for both carbons.
As shows Figure 5-25, in the case of 207C-TiO2-dye experiments, methylene blue would be positively
charged, but it would be non-charged (i.e., solution pH lower than the pKa of the dye) for the case of
CA1-TiO2-dye dataset. Therefore, as described by Kim et al. (2013), non-electrostatic interactions
(i.e., van der Waals, hydrophobic interactions and hydrogen bonding) would dominate between CA1
and methylene blue during the CA1-TiO2-dye experiments, and electrostatic repulsion would control
the 207C and dye interaction during the 207C-TiO2-dye experiments (See Carbon-MB adsorption
section for further details). This repulsion would be enhanced by the opposite charged TiO2 once
added to the suspension. This would explain the lower adsorption of MB, which would be displaced
by competition with the photocatalyst.

Chapter 5. Adsorption Equilibrium of Methylene Blue onto Activated Carbon and onto TiO2-Activated Carbon Mixture
115
Figure 5-22 Scatterplot C0 versus zeta at different mass of TiO2
Figure 5-23 Scatterplot R (TiO2/carbon mass ratio) versus pH and mean particle size at different C0 (CA1)
Zeta potential vs MB initial concentration
140120100806040200
15
10
5
0
-5
C0 (mg/L)
Ze
ta 50
100
200
350
(mg)
TiO2
mass
140120100806040200
-5
-10
-15
-20
-25
C0 (mg/L)
Ze
ta 50
250
500
875
(mg)
TiO2
mass
Norit CA1
207C
pH, Mean Particle Size vs RatioNorit CA1
1.81.51.20.90.60.3
20
15
10
5
4.0
3.8
3.6
3.4
Ratio
D[4
,3] (
µm
)
pH
pH
D[4,3] (µm)
1.81.51.20.90.60.3
20
15
10
5
4.0
3.8
3.6
3.4
Ratio
D[4
,3] (
µm
)
pH
pH
D[4,3] (µm)
1.81.51.20.90.60.3
20
15
10
5
4.0
3.8
3.6
3.4
Ratio
D[4
,3] (
µm
)
pH
pH
D[4,3] (µm)
2.01.61.20.80.40.0
40
30
20
10
0
3.950
3.925
3.900
3.875
3.850
Ratio
D[4
,3]
pH
pH
D[4,3]
[MB](0) = 20 mg/L [MB](0) = 70 mg/L
[MB](0) = 100 mg/L No MB present

Chapter 5. Adsorption Equilibrium of Methylene Blue onto Activated Carbon and onto TiO2-Activated Carbon Mixture
116
Figure 5-24 Scatterplot R (TiO2/carbon mass ratio) versus pH and mean particle size at different C0 (207C)
Figure 5-25 Surface charge of adsorbate (Methylene blue, MB), adsorbents (CA1, 207C) and photocatalyst (TiO2) during equilibrium adsorption experiments, based on the point of zero charge (pHPZC) of the carbons, and pKa of the dye
A broader study was done to evaluate the validity of the previous results from VarClus analysis. In
order to do this, a response surface methodology was applied. Two datasets, one per carbon, were
created and analysed. In the case of the wood-based CA1 carbon, with a standard deviation of 0.03
pH, Mean Particle Size vs Ratio207C
1.61.20.80.40.0
300
200
100
0
7.4
7.2
7.0
6.8
6.6
Ratio
D[4
,3] (
µm
)
pH
pH
D[4,3] (µm)
1.61.20.80.40.0
300
200
100
0
7.4
7.2
7.0
6.8
6.6
Ratio
D[4
,3] (
µm
)
pH
pH
D[4,3] (µm)
1.61.20.80.40.0
300
200
100
0
7.4
7.2
7.0
6.8
6.6
Ratio
D[4
,3] (
µm
)
pH
pH
D[4,3] (µm)
1.61.20.80.40.0
300
200
100
0
7.4
7.2
7.0
6.8
6.6
Ratio
D[4
,3] (
µm
)
pH
pH
D[4,3] (µm)
[MB](0) = 10 mg/L
[MB](0) = 70 mg/L
[MB](0) = 50 mg/L
[MB](0) = 130 mg/L
1 10pH 3.8pKa, MB
207C+
CA1+
MBo
TiO2+
2.5pHPZC, CA1
6.3pHPZC, TiO2
CA1-
MBo
TiO2+
207C+
CA1-
MB+
TiO2+
207C+
MB+
TiO2-
7.6pHPZC, 207C
207C-
CA1-
MB+
TiO2-
CA1-TiO2-MB, pH=3.4 – 4.0
207C-TiO2-MB, pH=6.6 – 7.2
Electrostatic Interaction CA1-TiO2
Electrostatic Interaction 207C-TiO2

Chapter 5. Adsorption Equilibrium of Methylene Blue onto Activated Carbon and onto TiO2-Activated Carbon Mixture
117
(Table 5-18 and Figure 5-26), the current design provided 67.8% probability for finding difference in
response of 0.1, and 98.7% probability for differences in pH of 0.2 when 1 replicate and 3 centre
points where used for a total of 11 runs. For the basic 207C carbon, assuming a standard deviation of
0.06, a desired effect of 0.1 would give a design with a power of only 27.5%, but 67.8% to detect
difference of 0.2 in pH (Table 5-18 and Figure 5-27). The power curve (Figure 5-26 and Figure 5-27)
can be understood as a sample size analysis to determine how many experimental runs are required
to identify significantly a predetermined effect given the noise or random variation (i.e., error)
(Antony, 2003). In this context, power is the sensitivity to detect relationships (i.e., the probability
that a false null hypothesis is correctly rejected (Allen, 2010)), the effect is the signal or desired
detectable change in response, and the number of replications determines the size of the
experiment (Antony, 2003).
Table 5-18 Power in 2-level full factorial design. Response: Var-pH CA1 2-Level Factorial Design
Alpha = 0.05
Assumed standard deviation = 0.03
Factors: 3 Base Design: 3, 8
Blocks: none
Including a term for centre points
in model.
Centre Total
Points Effect Reps Runs Power
3 0.1 1 11 0.67846
3 0.1 2 19 0.99997
3 0.1 3 27 1.00000
3 0.2 1 11 0.98753
3 0.2 2 19 1.00000
3 0.2 3 27 1.00000
207C 2-Level Factorial Design
Alpha = 0.05
Assumed standard deviation = 0.06
Factors: 3 Base Design: 3, 8
Blocks: none
Including a term for centre points in model.
Centre Total
Points Effect Reps Runs Power
3 0.1 1 11 0.27539
3 0.1 2 19 0.85101
3 0.1 3 27 0.97105
3 0.2 1 11 0.67846
3 0.2 2 19 0.99997
3 0.2 3 27 1.00000
Table B-1 (Appendix B) shows the session output from the full factorial design for the pH study of
both activated carbons. In the case of 207C, the model fit has a R2-pred (Predicted R2) equal to 0.00%
which indicates overfitting. The effect of main factors and their interactions on the response can be
visually analysed by looking at the Pareto chart (Figure 5-28) and interaction plot (Figure 5-30). In
the case of 207C, the response (Var-pH) against TiO2 factor for both levels of 207C showed an
interaction between TiO2 and 207C factors (i.e., an absence of parallel lines, Figure 5-30). The
interaction between the dye and the photocatalyst, as well as higher order interactions where also
significant at the α = 0.05 level (Figure 5-28), but in this scenario the model indicated overfitting, as
previously mentioned (Table B-1). The results indicate a true interaction between the basic activated
carbon and the photocatalyst (p-value = 0.009), and the negative sign of the interaction 207C*TiO2 in

Chapter 5. Adsorption Equilibrium of Methylene Blue onto Activated Carbon and onto TiO2-Activated Carbon Mixture
118
the estimated regression coefficients indicates a negative effect on the response therefore the
interaction lowered the pH.
This interaction is better seen in Figure 5-28, and is the second in importance after the main effect
activated carbon. With regards to the full factorial design output from the acid activated carbon, it
can be read from Table B-1 that no significant interaction between CA1 carbon and TiO2 was present,
and the addition of photocatalyst produced positive changes in pH. This model had a modest R2-adj
(71.06%) and a lower R2-pred (48.77%) which suggests that this model fit is not adequate to
describe all the variability of the sample and for making predictions. Although the objective of this
study was that of describing the relationship between the factors and the response, the design was
improved by adding axial points to create a central composite design. The addition of axial points to
create a central composite design improved significantly the modelling of this system (Table B-2 in
Appendix B). In the case of CA1 study, the response surface regression provided a model that
adequately explained the scattering of the data and can be used to make predictions. The lower
predicted R-squared values (42.46%) as compared with R-squared adjusted (67.69%) from 207C in
Table B-2 indicates that this model fitted modestly the data but fails to predict new observations. To
fully understand how much variability the model is fitting it would be needed to calculate the
prediction intervals of the model. However, as was stated before, the aim of the study focuses in the
determination of the relationship between the significant factors and the response, and this is
indicated by the low p-values and not by the value of R2. The true interaction between the 207C
carbon and the photocatalyst can mask the significance of the main effect of TiO2. This could explain
why in Table 5-15 and Table 5-17 correlations between TiO2 mass and changes in pH were not
detected. Studies conducted in the adsorption kinetics chapter (Chapter 6) provided more data to
analyse pH changes (i.e., these studies were based on kinetics experimental work described in
materials and methods chapter (Chapter 3); therefore using an independent factorial analysis this
asseverations were tested. Results from those kinetic experiments showed a much better model fit
and the same relationship between variables and response (results presented in chapter 6).
In Figure 5-28 it can be observed that the greatest effects on the response came from, the main
effect 207C and the 207C*TiO2 interaction factor, in the case of the basic carbon, and the main
effects TiO2 and CA1, in the case of the acidic carbon. This interaction effect was more important at
low doses of TiO2 and produced a reduction of pH in solution only at high level of 207C carbon
(Figure 5-30). The curved lines from the contour plot of Figure 5-29, confirms this interaction
between the 207C and the TiO2, and the straight lines display the lack of interaction between CA1
and TiO2.

Chapter 5. Adsorption Equilibrium of Methylene Blue onto Activated Carbon and onto TiO2-Activated Carbon Mixture
119
Figure 5-26 Power curve for 2-level factorial design in Var-pH CA1 adsorption analysis (MB = methylene blue)
Figure 5-27 Power curve for 2-level factorial design in Var-pH 207C adsorption analysis (MB = methylene blue)
0.20.10.0-0.1-0.2
1.0
0.8
0.6
0.4
0.2
0.0
Effect
Po
we
r A lpha 0.05
StDev 0.03
# Factors 3
# C orner Pts 8
# Blocks none
# Terms O mitted 0
C enter Points Yes
Terms Included In Model
A ssumptions
1, 3
2, 3
3, 3
Ctr Pts Per Blk
Reps,
Power Curve for 2-Level Factorial Design(Adsorption of MB onto TiO2/CA1)
0.40.30.20.10.0-0.1-0.2-0.3-0.4
1.0
0.8
0.6
0.4
0.2
0.0
Effect
Po
we
r A lpha 0.05
StDev 0.06
# Factors 3
# C orner Pts 8
# Blocks none
# Terms O mitted 0
C enter Points Yes
Terms Included In Model
A ssumptions
1, 3
2, 3
3, 3
Ctr Pts Per Blk
Reps,
Power Curve for 2-Level Factorial Design(Adsorption of MB onto TiO2/207C)

Chapter 5. Adsorption Equilibrium of Methylene Blue onto Activated Carbon and onto TiO2-Activated Carbon Mixture
120
Figure 5-28 Pareto charts of the standardized effects for both carbons
Figure 5-29 Contour plot of Var-pH for both carbons in response surface analysis
Pareto Chart of the Standardized Effects(response is Var-pH, Alpha = 0.05)
AC
C
B
ABC
BC
AB
A
121086420
Te
rm
Standardized Effect
3.18
A 207C (g/L)
B TiO2 (g/L)
C MB (ppm)
Factor Name
AC
C
BC
ABC
AB
A
B
876543210
Te
rm
Standardized Effect
4.303
A CA1 (g/L)
B TiO2 (g/L)
C MB (ppm)
Factor Name
Contour Plot of Var-pH
207C (g/L)
TiO
2 (
g/L)
0.90.80.70.60.50.40.30.20.1
8
6
4
2
>
–
–
–
–
< 0.0
0.0 0.5
0.5 1.0
1.0 1.5
1.5 2.0
2.0
Var-pH
CA1 (g/L)
TiO
2 (
g/L)
0.90.80.70.60.50.40.30.20.1
8
6
4
2
>
–
–
–
< -0.2
-0.2 -0.1
-0.1 0.0
0.0 0.1
0.1
Var-pH

Chapter 5. Adsorption Equilibrium of Methylene Blue onto Activated Carbon and onto TiO2-Activated Carbon Mixture
121
Figure 5-30 Main effects and interaction plots for Var-pH in full factorial analysis
0.750.500.25
-0.15
-0.20
-0.25
7.55.02.5
163.575109.05054.525
-0.15
-0.20
-0.25
CA1 (g/L)
Me
an
TiO2 (g/L)
MB (ppm)
Corner
Center
Point Type
7.5
5.0
2.5
163.57
5
109.05
0
54.525
-0.1
-0.2
-0.3
-0.1
-0.2
-0.3
CA1 (g/L)
TiO2 (g/L)
MB (ppm)
0.25 Corner
0.50 Center
0.75 Corner
(g/L)
CA1
Point Type
(g/L)
CA1
Point Type
2.5 Corner
5.0 Center
7.5 Corner
(g/L)
TiO2
Point Type
0.750.500.25
0.9
0.6
0.3
7.55.02.5
163.575109.05054.525
0.9
0.6
0.3
207C (g/L)
Me
an
TiO2 (g/L)
MB (ppm)
Corner
Center
Point Type
7.5
5.0
2.5
163.57
5
109.05
0
54.5
25
1.0
0.5
0.0
1.0
0.5
0.0
207C (g/L)
TiO2 (g/L)
MB (ppm)
0.25 Corner
0.50 Center
0.75 Corner
(g/L)
207C
Point Type
(g/L)
207C
Point Type
2.5 Corner
5.0 Center
7.5 Corner
(g/L)
TiO2
Point Type
Main Effects Plot for Var-pH
Data Means
Interaction Plot for Var-pH
Data Means

Chapter 5. Adsorption Equilibrium of Methylene Blue onto Activated Carbon and onto TiO2-Activated Carbon Mixture
122
With respect to the sign of the main effect TiO2 on the response in CA1 dataset, the positive sign of
the TiO2 main effect in CA1 indicated that this factor produced an increase in pH at both high and
low levels of CA1 carbon and the effect is more important at high level of photocatalyst (Figure
5-30). In the next section, the interaction between the carbon and the photocatalyst placed on a
water suspension and without methylene blue is analysed.
Carbon-TiO2 suspension
The effect of TiO2 on pH and zeta potential changes in carbon-TiO2 mixtures is discussed in this
section. Values of pH from raw activated carbon suspension (20 mg of carbon to 300 ml deionized
water under 30 min stirring time and room temperature) showed a more acidic pH for CA1(pHCA1 =
3.86) compared with 207C (pH207C = 5.9), which pH was only slightly acidic. Changes in pH due to TiO2
addition on raw solids were more pronounced in 207C than in CA1 (Figure 5-33).
For 207C (Figure 5-32), any addition of TiO2 reduced the pH of the suspension relative to that of raw
207C (R=0.0). The lower addition of TiO2 (R=0.25) gave the most acid pH as compared with the
suspension of raw 207C (R=0.0) and higher R, which produced suspensions more basic than lower R.
In CA1-TiO2 (Figure 5-32), the same experiment showed a rise in pH after TiO2 addition compared
with raw CA1 (R=0.0), and higher R produced suspensions more basic than lower R. Therefore for
both carbons, the addition of TiO2 produced an increase of pH. Based on the information provided in
the characterization chapter (Chapter 4), at the pH measured in these experiments TiO2 would exist
as a cation in both set of experiments (i.e., CA1-TiO2 and 207-TiO2), 207C would be in its positive
form as well, and the surface of CA1 would be negative (Figure 5-31). Based on this information, the
interaction between the negatively charged CA1 and the positively charged TiO2 would be
electrostatic attraction, as opposed to the interaction between both positively charged 207C and
TiO2 which would have non-electrostatic nature.
The acidification of the suspension with 207C (Figure 5-32) could be linked to the interaction
between this carbon and the semiconductor; and the basification of the suspension with CA1 should
be attributed to the addition of more amounts of TiO2 in the suspension.
The zeta potential (mV) is the net effective charge between particles, which provides an index of the
interaction between colloidal particles. The zeta potential measurements were used to follow the
changes which took place in the suspension. Both activated carbon surfaces were negatively charged
(Figure 5-33). The surface of 207C was less negatively charged than that of CA1.

Chapter 5. Adsorption Equilibrium of Methylene Blue onto Activated Carbon and onto TiO2-Activated Carbon Mixture
123
Figure 5-31 Surface charge of CA1 and 207C adsorbents, and TiO2 photocatalyst during Carbon-TiO2 experiments, based on the point of zero charge (pHPZC) of TiO2 and both carbons
In both ACs the addition of TiO2 increased the density of the surface charge. The addition of TiO2 to
both activated carbon increases the zeta potential of the suspension such that the suspension
becomes more stable. Zeta potential changed more abruptly with the addition of the photocatalyst
in the case of 207C. The main dissimilarity observed between both systems lay in the sign of the zeta
potential; this was always negative in the case of CA1, although this became less negative as more
TiO2 was added to the suspension. The TiO2-207C mixture moved from a negative zeta potential to a
positive value with the addition of TiO2. In 207C, around R=0.5 the net surface charge approached
zero and further addition caused charge reversal. In CA1 the asymptote to zero could be explained
by the electrostatic attraction between TiO2 and the carbon surface. The reversal of zeta potential
could be attributed to an increase in ionic strength and indicates a specific adsorption of TiO2 onto
the 207C surface (Ersoy et al., 2010). Specific adsorption is described as an interaction with a specific
functional group on the adsorbent surface that does not end in the formation of a true chemical
bond (Alley, 2007). In this regard, the specifically adsorbed cation would make the zeta potential
more positive.
1 10pH
207C+
CA1+
TiO2+
2.5pHPZC, CA1
6.3pHPZC, TiO2
CA1-
TiO2+
207C+
TiO2+
207C+
CA1-
TiO2-
7.6pHPZC, 207C
207C-
CA1-
TiO2-
CA1-TiO2, pH=3.8 – 4.0
207C-TiO2, pH=4.8 – 5.8
Non-electrostatic interaction
Electrostatic interaction

Chapter 5. Adsorption Equilibrium of Methylene Blue onto Activated Carbon and onto TiO2-Activated Carbon Mixture
124
Figure 5-32 Zeta and pH variations of TiO2-carbon mixture as a function of R (i.e., the TiO2/adsorbent mass ratio) and classified by the type of carbon at natural pH carbon (View I)
Figure 5-33 Zeta and pH variations of TiO2-carbon mixture as a function of R (i.e., the TiO2/adsorbent mass ratio) and classified by the type of carbon at natural pH (View II)
2.01.51.00.50.0
10
0
-10
-20
5.80
5.55
5.30
5.05
4.80
R
Ze
ta P
ote
nti
al (m
V)
pH
Zeta
pH
2.01.51.00.50.0
0
-5
-10
-15
-20
4.00
3.95
3.90
3.85
R
Ze
ta P
ote
nti
al (m
V)
pH
Zeta
pH
Activated Carbon 207C
Activated Carbon CA1
2.01.51.00.50.0
10
5
0
-5
-10
-15
2.01.51.00.50.0
6.0
5.5
5.0
4.5
4.0
Zeta Potential (mV)
R
pH207C
CA1
Type AC

Chapter 5. Adsorption Equilibrium of Methylene Blue onto Activated Carbon and onto TiO2-Activated Carbon Mixture
125
This increase in zeta potential observed in TiO2-207C mixtures would lead to increased repulsion of
the cationic dye from the surface if added to the system, thus lowering its adsorption. In contrast,
since the zeta potential of the TiO2-CA1 mixture is consistently negative for the studied range of
conditions, this would favour the adsorption of methylene blue to a greater extent than was the
case for 207C. One possible explanation of this behaviour could come from the fact that chemically-
activated carbons have a surface with fully oxidized sites, as opposed to thermally-activated carbons
in which oxygen is absent from the surface (Aktaş and Çeçen, 2007). This would make the surface of
207C more reactive toward oxygen from TiO2, whereas the surface of CA1 differs in this respect.
It was noticeable as well that the point of zero charge for the mixture occurred at a lower pH than
the one for raw solids. That the pHPZC of the mixture was lower than that of the semiconductor was
seen by some authors as detrimental to the photoactivity of TiO2 during photocatalysis (Matos,
2001; Cordero, Chovelon, et al., 2007; Cordero, Duchamp, et al., 2007; Matos, Chovelon, et al.,
2009). For H-type AC, the higher the BET surface area and the higher the pHPZC, the higher the
photoactivity of TiO2-carbon mixtures was found to be in comparison to that of TiO2 alone (Matos,
Chovelon, et al., 2009). This could potentially be a sign that the regeneration of 207C would be lower
than that of CA1.
If Figure 5-33 and Figure 5-22 are compared, an analogy in zeta potential measurements can be
observed. In the case of Figure 5-22, the adsorption of methylene blue onto activated carbon in the
presence of TiO2 (i.e., pseudo-equilibrium experiments) suggests that methylene blue suffered a
specific adsorption onto CA1, but not onto 207C.
The particle size distribution (PSD) was measured, but only for the CA1-TiO2 mixture (i.e.,
unfortunately the dataset for the 207C-TiO2 mixture was lost). The mean diameter showed a
dependency on the amount of TiO2 present. As R increases the average particle size of the mixture in
suspension decreases (Figure 5-34). Figure 5-35 shows the particle size distribution of raw CA1, raw
TiO2 suspension and CA1-TiO2 mixtures at various TiO2 additions.

Chapter 5. Adsorption Equilibrium of Methylene Blue onto Activated Carbon and onto TiO2-Activated Carbon Mixture
126
Figure 5-34 Zeata potential and mean particle size variations as a function of the mass of TiO2 (R = TiO2/carbon) in CA1 analysis
Figure 5-35 PSD (from left to right) of raw CA1, various TiO2-CA1 mixtures and raw TiO2 suspension in deionized water
2.01.51.00.50.0
-2
-4
-6
-8
-10
-12
-14
40
30
20
10
0
R
Ze
ta P
ote
nti
al (m
V)
Me
an
Dia
me
ter
(mic
ron
s)
Zeta Potential (mV)
Mean Diameter (microns)
TiO2 - CA1 mixture
10001001010.1
8
4
0
Particle Diameter (microns)
Vo
lum
e (
%)
10001001010.1
8
4
0
Particle Diameter (microns)
Vo
lum
e (
%)
10001001010.1
8
4
0
Particle Diameter (microns)
Vo
lum
e (
%)
10001001010.1
8
4
0
Particle Diameter (microns)
Vo
lum
e (
%)
10001001010.1
8
4
0
Particle Diameter (microns)
Vo
lum
e (
%)
10001001010.1
8
4
0
Particle Diameter (microns)
Vo
lum
e (
%)
CA1 TiO2/CA1 = 0.25
TiO2/CA1 = 0.5 TiO2/CA1 = 1.0
TiO2/CA1 = 1.75 TiO2

Chapter 5. Adsorption Equilibrium of Methylene Blue onto Activated Carbon and onto TiO2-Activated Carbon Mixture
127
Carbon-MB adsorption
Generally speaking, the interaction mechanism between methylene blue and activated carbon could
be of different types, including electrostatic interactions between the positive charge of nitrogen
present in methylene blue and the negatively-charged sites on the carbon surface such as carboxylic
(-COOH) and phenolic (-OH) groups (Bansal and Goyal, 2005; Marsh and Rodríguez-Reinoso, 2006),
to also hydrogen bonds interactions, and π-π dispersion interactions (Vargas et al., 2011). Some
authors described two parallel adsorption mechanisms involving both electrostatic and dispersion
interactions in the adsorption of dyes on activated carbons (Bottani and Tascón, 2008) although
others consider only electrostatic forces as playing the mayor role (Liu et al., 2008). In the case of
CA1, the adsorption of methylene blue by phosphoric-acid treated Norit CA1 was claimed to be
controlled by dispersive and electrostatic interactions depending on the amount of oxygen at the
surface (Benadjemia et al., 2011). For adsorption of methylene blue onto coconut shell derived
activated carbon (207C), the major mode of adsorption was ion exchange (Bhatnagar et al., 2010).
However, some authors suggested electrostatic interactions were significant for acid-treated
carbons, and dispersive interactions for thermally treated ones (Mezohegyi et al., 2012), therefore
two different adsorption mechanisms could initially be expected.
Methylene blue adsorption onto activated carbon is mainly determined by the chemistry of the
carbon surface and solution pH rather than by the porous structure of the carbon (Bansal and Goyal,
2005; Bottani and Tascón, 2008). The presence of surface groups on the carbon surface affects the
extent of electrostatic (acidity/alkalinity) and dispersive interactions (hydrophilicity)(Bansal and
Goyal, 2005; Wang et al., 2005; Bandosz, 2006). In general, high adsorption of methylene blue is
found at basic pH because the electrostatic interaction is favoured due to the negative surface
charge of the activated carbon (pH>pHpzc) (Dai, 1994; El Qada et al., 2006; Rodríguez et al., 2009;
Benadjemia et al., 2011). Therefore, the lower is the pHpzc value (acid carbon), the higher is the
electrostatic attraction at basic pH (Ersoy et al., 2010; Benadjemia et al., 2011). High adsorption of
cationic dyes onto a basic carbon (pH<pHpzc) at acid pH has been observed (Benadjemia et al., 2011)
and attributed to the predominant dispersive interactions. Some authors (Bansal and Goyal, 2005)
suggest that a pH between 3 and 7.5 was found to be the best for maximum adsorption of
methylene blue onto a variety of different carbons. Whilst others (Karaca et al., 2008; Arivoli, 2010)
claim that at a pH higher than 7, the molecular aggregation of methylene blue prevents the dye from
enter the pores of the acid carbon, explaining the lower values of the adsorption uptake found with
respect to acid pH, thus the effect of the charge on the surface of acid carbons could not explain to
their results.

Chapter 5. Adsorption Equilibrium of Methylene Blue onto Activated Carbon and onto TiO2-Activated Carbon Mixture
128
Acidification of the solution was observed in the adsorption of methylene blue onto AC. This was
mainly attributed to cation exchange at the negatively charged surface of the carbon (Domals, 1996;
Malarvizhi and Ho, 2010):
𝐶−⋯𝐻+ +𝑀𝐵+ + 𝐶𝑙− → 𝐶−⋯𝑀𝐵+ +𝐻+ + 𝐶𝑙−
If the zeta potential is zero, dispersion forces are dominant between the carbon surface and the dye.
At both positive and negative zeta potentials, electrostatic interactions are dominant (Yuen and
Hameed, 2009). The acid groups on the carbon surface dissociate if pH>pHPZC, releasing protons and
leaving a negatively charged surface on the AC. Basic sites combine with protons if pH < pHPZC,
leaving a positively charged surface (Bandosz, 2006; Benadjemia et al., 2011).
5.3 Summary
The adsorption capacity of methylene blue onto activated carbons CA1 and 207C was evaluated.
Equilibrium was set at a contact time of 18 h, and tested up to 24 h. The adsorptive capacity of CA1
with respect to methylene blue was higher than that of 207C. Equilibrium isotherm results indicated
that 207C had a more homogeneous surface compared to CA1 based on its closer association with
monolayer adsorption and energy of adsorption values. BET-2, R-Pe, R-Pr, D-A, Hill and K-C provided
an ideal fit at low, intermediate and high concentrations, under the studied conditions. These
isotherm models were used in order to understand the influence of TiO2 on methylene blue
adsorption. The analysis of the effect of TiO2 on the adsorption process was done at pseudo-
equilibrium conditions (contact time, 60 min) in order to expedite experimental determinations. The
effect of shorter contact time on methylene blue adsorption was also studied using the “raw”
carbons; lower loading and lower energy of adsorption was observed under non equilibrium
conditions. This study also revealed that at shorter times than is required to reach equilibrium there
is greater participation by pores of larger size in the adsorption process. The adsorption of
methylene blue onto 207C was characterized as taking place in narrow pores, as compared with the
adsorption of methylene blue onto CA1 where a wider pore size distribution was involved (greater
heterogeneity). Smaller micropores with smaller pore size range (indicating homogeneity) were
observed when the system tended toward equilibrium. The adsorption of methylene blue onto CA1
took place in broader pores than in 207C independently of the time carried out. With respect to the
results of the influence of the semiconductor in the isotherms, the addition of TiO2 to the adsorption
process produced the following observed effects in the case of CA1: (1) An increase in the adsorptive
capacity of CA1 from 17.69 to 50.71% in the surface area covered by MB, (2) higher strength of the
interaction, (3) increase in ΔG, (4) decrease in heterogeneity associated with narrower micropores of
smaller size range

Chapter 5. Adsorption Equilibrium of Methylene Blue onto Activated Carbon and onto TiO2-Activated Carbon Mixture
129
In the case of adsorption process of 207C, the addition of photocatalyst produced the following
outcomes: (1) A decreased capacity of the carbon to adsorb methylene blue, this varied from 33.36
to 63.58% of the surface area covered by the dye, (2) decrease in the strength of the interaction
between methylene blue and the adsorbent, (3) a decrease in ΔG, (4) heterogeneity increased
significantly associated with a wider range of pore size.
Changes in pH during equilibrium were also evaluated. TiO2 added to a carbon-TiO2 mixture had an
acidifying effect on the suspension of 207C and a basic effect on suspensions of CA1. In both cases,
the higher the concentration of TiO2, the higher was the pH. Changes in zeta potential suggested an
electrostatic attraction between CA1 and the semiconductor, but a specific adsorption of TiO2 on
207C. Independent response surface studies of the effects of dye, adsorbent and TiO2 on pH
demonstrated that the reduction of pH in the suspension containing 207C was caused by a strong
interaction between the adsorbent and the semiconductor. This interaction was more important at
low doses of TiO2, and it was not present in CA1.
These results suggest a selective fixation of TiO2 on the 207C that could reduce the adsorption of
methylene blue onto the carbon. A lower energy of adsorption between the dye and the adsorbent
was measured after the addition of TiO2 which may indicate the preference of TiO2 for adsorption
sites on the 207C surface of higher energy. A blockage of pores due to TiO2 in the case of 207C could
be seen as another explanation. On the other hand, the electrostatic attraction between CA1 and
TiO2 could help methylene blue penetrating into CA1.

Chapter 6. Adsorption Kinetics of Methylene Blue onto TiO2-Activated Carbon Mixture
130
6 ADSORPTION KINETICS OF METHYLENE BLUE ONTO TIO2-
ACTIVATED CARBON MIXTURE
6.1 Introduction
This chapter will focus on the screening design of variables affecting the adsorption kinetics process,
such as time, adsorbent mass, initial adsorbate concentration, mass of TiO2 photocatalyst, and type
of adsorbent. The objectives were to identify key variables and factor interactions affecting the rate
of adsorption in terms of macroscopic decolouration and mass transfer rate (external mass transfer
rate and intraparticle diffusion rate). This work was accomplished initially by identifying critical
process variables in a 2-level fractional screening design of resolution V. After identifying the main
factors that have the greatest effect on the response (i.e., removal of methylene blue), a full 2-level
full factorial design was performed. This later design allowed the investigation of different aspects of
the adsorption kinetics process, such as changes in decolouration, pH and mass transfer parameters
for two different adsorbents, the wood-based and acidic CA1, and the coconut-based and basic 207C
activated carbons.
6.2 Results and Discussion
6.2.1 Power and sample size
Power (i.e., sensitivity of a statistical test) and sample size of all experimental designs performed in
this chapter is described in this section. Trial experiments were used to calculate the standard
deviation from the data. Based on the variability of the response and its desired effect, the design
was configured to provide a high reasonable power to detect the variables that significantly affected
the response. The design setting in the 2-level fractional factorial (22r, 5F, 1R, 6CP where r=run,
F=factor, R=replicate, CP=centre point) was used to determine the effect of the variables time, initial
dye concentration, type of activated carbon, adsorbent mass and TiO2 mass in decolouration
response; the power of detecting significant variables in this design was 1 (Table B-3-A and Figure
6-1-A). The 2-level full factorial design was (16r, 3 F, 2 R, 0CP) - (Table B-3-B, Figure 6-1-B) in TiO2-
207C and (16r, 3 F, 2 R, 0 CP) - (Table B-3-C, Figure 6-1-C) in TiO2-CA1 analysis. The initial dye
concentration, adsorbent mass, and TiO2 mass were used as variables. This design was applied to
study decolouration at a low contact time only (60 min), where the interaction between TiO2 and
activated carbon was seen to affect the adsorption uptake of methylene blue. This observation is
based on previous equilibrium experiments (i.e., after measuring isotherm parameter changes it was
concluded that the addition of TiO2 provoked an increase or decrease in the adsorption depending

Chapter 6. Adsorption Kinetics of Methylene Blue onto TiO2-Activated Carbon Mixture
131
on the type of carbon). The design allowed an 82.675 % chance of detecting the variables that
significantly affected the response (differences in response of 0.1) in 207C (Table B-3-B, Figure 6-1-B)
and 85.909% probability for difference in response of 0.1 in CA1 (Table B-3-C, Figure 6-1-C). Standard
deviations of 0.0603 and 0.0576 for 207C and CA1, respectively, were obtained from previous
experiments. The same design was used to analyse changes in pH during methylene blue adsorption
onto 207C in the presence of TiO2 (response: pH variation) (Figure 6-1-D). In this case, assuming a
standard deviation of 0.212, and a desired effect of 0.3, the power was 0.69899. The last of the
designs was a 2-level full factorial (32 r, 4 F, 2 R, 0 CP) and was used to determine the effect of the
same 3 variables in KF and Ki responses, for each activated carbon.
The signal to noise ratio gave different results for each response based on their different variability
and desired effects, the power of this design was higher for Ki than for KF. In Figure 6-2-E and Figure
6-2-F, the standard deviation of the data was 1.2093·10-5 and 1.491·10-7 in CA1 (Table B-4-E) and
207C (Table B-4-F) respectively, and the minimum difference (effect) it would like to be detected had
magnitudes of 1.507·10-5 and 1.502·10-7 for CA1 and 207C, respectively. This signal to noise ratio
allowed a power of 0.5905 and 0.4261 for CA1 and 207C, respectively to be achieved. In Figure 6-2-G
and Figure 6-2-H, the same experimental set up allowed a 100% and 76.534% chance of detecting an
effect of magnitude 5.760 and 2.345 in CA1 (Table B-4-G) and 207C (Table B-4-H), respectively. This
design seems too strong for CA1; probably less number of runs would have been enough to detect
those differences.
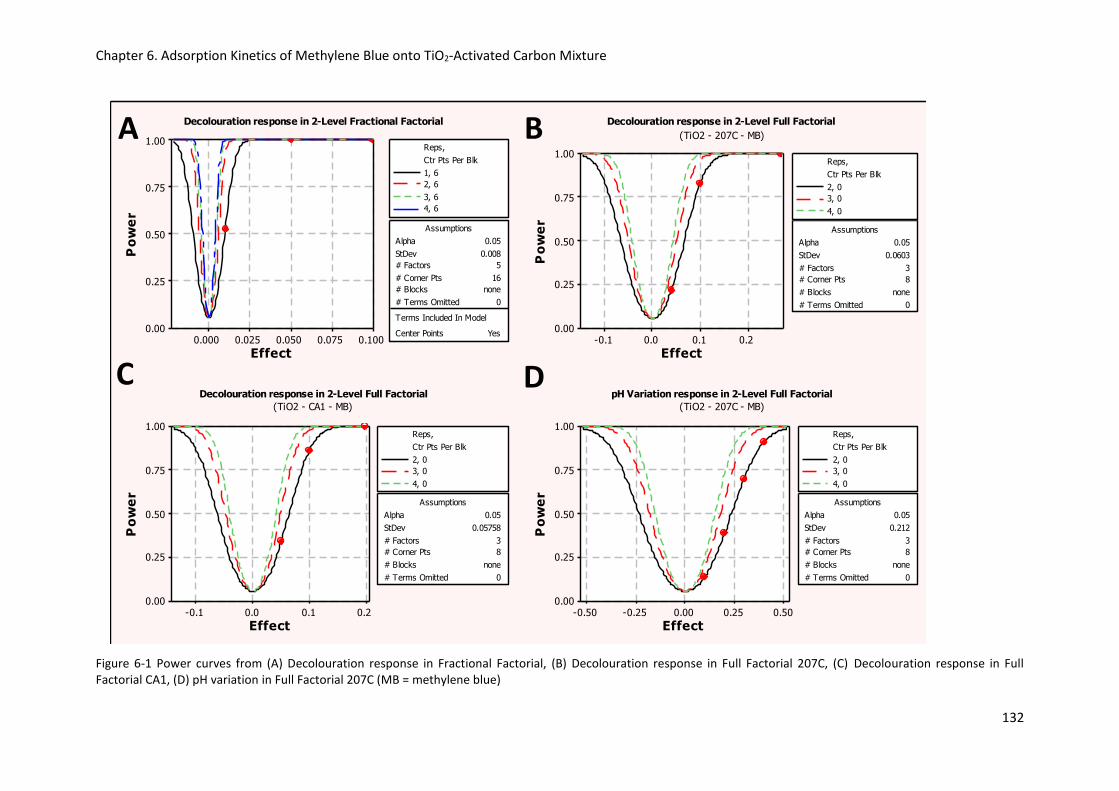
Chapter 6. Adsorption Kinetics of Methylene Blue onto TiO2-Activated Carbon Mixture
132
Figure 6-1 Power curves from (A) Decolouration response in Fractional Factorial, (B) Decolouration response in Full Factorial 207C, (C) Decolouration response in Full Factorial CA1, (D) pH variation in Full Factorial 207C (MB = methylene blue)
0.1000.0750.0500.0250.000
1.00
0.75
0.50
0.25
0.00
Effect
Po
we
r
Alpha 0.05
StDev 0.008
# Factors 5
# Corner Pts 16
# Blocks none
# Terms Omitted 0
Center Points Yes
Terms Included In Model
Assumptions
1, 6
2, 6
3, 6
4, 6
Ctr Pts Per Blk
Reps,
0.20.10.0-0.1
1.00
0.75
0.50
0.25
0.00
Effect
Po
we
r
Alpha 0.05
StDev 0.0603
# Factors 3
# Corner Pts 8
# Blocks none
# Terms Omitted 0
Assumptions
2, 0
3, 0
4, 0
Ctr Pts Per Blk
Reps,
0.20.10.0-0.1
1.00
0.75
0.50
0.25
0.00
Effect
Po
we
r
Alpha 0.05
StDev 0.05758
# Factors 3
# Corner Pts 8
# Blocks none
# Terms Omitted 0
Assumptions
2, 0
3, 0
4, 0
Ctr Pts Per Blk
Reps,
0.500.250.00-0.25-0.50
1.00
0.75
0.50
0.25
0.00
Effect
Po
we
r
Alpha 0.05
StDev 0.212
# Factors 3
# Corner Pts 8
# Blocks none
# Terms Omitted 0
Assumptions
2, 0
3, 0
4, 0
Ctr Pts Per Blk
Reps,
Decolouration response in 2-Level Fractional Factorial Decolouration response in 2-Level Full Factorial
(TiO2 - 207C - MB)
Decolouration response in 2-Level Full Factorial
(TiO2 - CA1 - MB)
pH Variation response in 2-Level Full Factorial
(TiO2 - 207C - MB)
A
DC
B

Chapter 6. Adsorption Kinetics of Methylene Blue onto TiO2-Activated Carbon Mixture
133
Figure 6-2 Power curves from (E) Kf response in Full Factorial CA1, (F) Kf response in Full Factorial 207C, (G) Ki response in Full Factorial CA1, (H) Ki response in Full Factorial 207C (MB = methylene blue)
0.00
002
0.00
001
0.00
000
-0.000
01
-0.000
02
1.00
0.75
0.50
0.25
0.00
Effect
Po
we
r
Alpha 0.05
StDev 0.0000121
# Factors 3
# Corner Pts 8
# Blocks none
# Terms Omitted 0
Assumptions
2, 0
3, 0
4, 0
Ctr Pts Per Blk
Reps,
0.00
0000
30
0.00
0000
15
0.00
0000
00
-1.500
E-07
-3.0
00E-
07
1.00
0.75
0.50
0.25
0.00
Effect
Po
we
r
Alpha 0.05
StDev 0.0000001
# Factors 3
# Corner Pts 8
# Blocks none
# Terms Omitted 0
Assumptions
2, 0
3, 0
4, 0
Ctr Pts Per Blk
Reps,
420-2
1.00
0.75
0.50
0.25
0.00
Effect
Po
we
r
Alpha 0.05
StDev 1.07836
# Factors 3
# Corner Pts 8
# Blocks none
# Terms Omitted 0
Assumptions
2, 0
3, 0
4, 0
Ctr Pts Per Blk
Reps,
3.01.50.0-1.5-3.0
1.00
0.75
0.50
0.25
0.00
Effect
Po
we
r
Alpha 0.05
StDev 1.53082
# Factors 3
# Corner Pts 8
# Blocks none
# Terms Omitted 0
Assumptions
2, 0
3, 0
4, 0
Ctr Pts Per Blk
Reps,
Kf response in 2-Level Full Factorial Design
(TiO2-CA1-MB)
Kf response in 2-Level Full Factorial Design
(TiO2-207C-MB)
Ki response in 2-Level Full Factorial Design
(TiO2-CA1-MB)
Ki response in 2-Level Full Factorial Design
(TiO2-207C-MB)
E F
G H
Chapter 6. Adsorption Kinetics of Methylene Blue onto TiO2-Activated Carbon Mixture
134
6.2.2 Fractional factorial design
The screening experiments were conducted using a 2-level fractional factorial design of resolution V,
where five variables were tested: time (t), initial dye concentration (MB), type of activated carbon
(TypeAC), adsorbent mass (AC) and TiO2 mass (TiO2). Decolouration or removal was used as
response.
Exploratory Data Analysis
Initially the experiments were arranged in ascending order by the response. Preliminary survey to
this configuration determined the setting that maximizes the uptake of methylene blue, and the
most important factor, that is, the factor that produced the greatest change in the value of the
response when the system moved from its low to its high level. By analysing the data it was
observed that the subset of response values that was best, have in common a high level of activated
carbon and all the lowest response values came from the opposite setting of this factor. Accordingly,
the amount of activated carbon in suspension was the most important factor responsible for the
removal of methylene blue in solution. The two largest response values (0.999, 0.999) have AC at +1,
and the two lowest response values (0.314, 0.206) have AC at -1. The best setting based on the raw
data to maximize the Decolouration was (MB, AC, TiO2, t, Type AC) = (-, +, +, +, CA1) at Y = 0.999.
The Full Model
The fitted model data did not show typical normal residuals, therefore the data was transformed. A
Johnson transformation function was used to make the data approximately normal. The Johnson
transformation uses three different transformation functions ( 𝛾 + 𝜂 ln[(𝑥 − 𝜀) (𝜆 + 𝜀 − 𝑥)⁄ ] ,
+𝜂 ln(𝑥 − 𝜀) , and 𝛾 + 𝜂 sinh−1[(𝑥 − 𝜀) 𝜆⁄ ] where sinh−1(𝑥) = ln[𝑥 + 𝑠𝑞𝑟𝑡(1 + 𝑥2)]), and selects
the one that makes the original data normal (Cheshire, 2012). The probability plot for transformed
data showed a linear pattern, which indicated that the normal distribution was a good model for this
data. The Minitab session window output from the fractional design is shown in Table B-5 (Appendix
B). The analysis of variance in this table provides a summary of the main effects and interactions in
terms of their statistical significance. The model was orthogonal and did not contain covariates. The
lower the standard error of the regression (s), the better the fit is. This fit had a large R2 (99.37%)
and adjusted R2 (97.37%) but also several large p-values (> 0.10) indicating that the model had
unnecessary terms. Furthermore the lack of fit was significant (p-value < 0.05), the R-Sq (pred) was
zero (overfitting), and the normal probability plot of the residuals and the plot of residuals versus
the predicted values were not satisfactory. This means that the model did not fit conveniently the
dataset, therefore a reduced model was required.

Chapter 6. Adsorption Kinetics of Methylene Blue onto TiO2-Activated Carbon Mixture
135
The Reduced model
The previously described model was not the best model to describe the data. A reduced model was
therefore created containing only the significant factors. A stepwise procedure was carried out in
which irrelevant variables were removed one at a time, based on the changes to the predicted R2
values (Table 6-1). The non-significant factors that did not improve the model more than expected
by chance alone were removed from the model. Based on Table 6-1 the best reduced model was
model number 2. The R2 for prediction in this model explained 92.91% of the variability in predicting
new observations, as compared with the 98.87% of response variation that was explained by its
relationship with the predictor variables in the least squares regression. The residuals had a constant
variance, were normally distributed, and not correlated with each other (Figure 6-3).
Table 6-1 Model reduction results in fractional factorial design. Response: Decolouration
Least Squares Fit R2 Adj R2 Pred R2 PRESS s P Lack-of-fit
Full Model 99.37 97.37 0.00 9.880 0.046 0.000
Reduced Model 1 99.27 96.93 18.16 20.074 0.189 0.506
Reduced Model 2 98.87 97.36 92.91 1.739 0.176 0.706
Reduced Model 3 98.22 96.27 89.01 2.697 0.2088 0.460
The session window output for the selected model is shown in Table B-6, all the terms were highly
significant (confidence level of 95 %, if the p-value is less than 0.05 the null hypothesis is rejected
and it is concluded that the factor had an impact on the removal) and there was no indication of
significant lack of fit. Based on the ANOVA analysis, all the main factors and 2-way interactions listed
on this table had a p-value equal to or lower than 0.05. Therefore, they had some impact on the
response. The model also highlighted curvature. The fact that the response at the centre points of
the design is higher than the one of the corner points is also an indication of curvature in the design
(Figure 6-6). The best predictive model was also analysed by looking at the normal plot of effects,
the Pareto plot, and the magnitude of the coefficients. The magnitude of the coefficients indicated
how significant the coefficient was, and the sign of each coefficient indicated the direction of the
relationship (Table B-6). The normal (Figure 6-4) and Pareto (Figure 6-5) plot of the effects (95%
confidence level, t value = 2.26) were used as visual tools to identify the important effects and
compare the relative magnitude of the significant effects. The activated carbon mass (AC) was by far
the most important factor affecting decolouration, followed by the type of carbon, the interaction
MB*AC, the time, and the interaction AC*TiO2. Thus the three most important main factors were AC,
TypeAC and t (Figure 6-6). The three most important interactions of factors affecting the response
were MB*AC, AC*TiO2 and TiO2*t (Figure 6-7). The plots confirmed that these factors were

Chapter 6. Adsorption Kinetics of Methylene Blue onto TiO2-Activated Carbon Mixture
136
statistically significant at 5% significance level. These main effects and interactions were most
important to the adsorption process and therefore could be studied at a greater depth.
Figure 6-3 Residual plot from response % Decolouration (Fractional Factorial)
Figure 6-4 Normal plot of the standardized effects in % Decolouration study (Fractional Factorial)
0.300.150.00-0.15-0.30
99
90
50
10
1
Residual
Perc
en
t
N 22
AD 0.237
P-Value 0.757
210-1-2
0.30
0.15
0.00
-0.15
-0.30
Fitted Value
Resid
ual
0.240.120.00-0.12-0.24
4.8
3.6
2.4
1.2
0.0
Residual
Fre
qu
en
cy
222018161412108642
0.30
0.15
0.00
-0.15
-0.30
Observation Order
Resid
ual
Normal Probability Plot Versus Fits
Histogram Versus Order
Residual Plots for Johnson_Decol
2520151050-5-10
99
95
90
80
70
60
50
40
30
20
10
5
1
Standardized Effect
Pe
rce
nt
A MB
B A C
C TiO 2
D Ty pe A C
E t
Factor Name
Not Significant
Significant
Effect Type
DE
CE
CDBE
BC
AB
E
D
C
B
A
Normal Plot of the Standardized Effects(response is Johnson_Decol, Alpha = 0.05)

Chapter 6. Adsorption Kinetics of Methylene Blue onto TiO2-Activated Carbon Mixture
137
Figure 6-5 Pareto chart of the standardized effects in % Decolouration study (Fractional Factorial)
The positive values of the effects (AC, MB*AC, t, AC*TiO2, TiO2, TypeAC* TiO2, AC*t) mean that an
increase in their levels leads to an increase in methylene blue removal (i.e., decolouration). The
negative values of the effects (TypeAC, TiO2*t, MB, TypeAC*t) equates to a reduction of the
percentage removal when their levels are increased. Although only significant at α=0.10 level, it can
be observed from Table B-5 that the positive value of the interaction between MB*TiO2 would not
be beneficial for the adsorption process, while in the case of AC*TiO2, a positive value of their
interaction would increase the uptake of methylene blue.
Based on Figure 6-6, the factor settings that maximize the transformed Decolouration were (MB, AC,
TiO2, t, Type AC) = (-, +, +, +, CA1). A ranked list of effects based on their importance was compiled
from the interaction plot of Figure 6-7. The interactions could be explained as follows: MB*AC -
Activated carbon main effect, no dye effect and an interaction (crossover). AC*TiO2: Both main
effects and an interaction (crossover). TiO2*t: Both main effects and an interaction (crossover).
TiO2*Type AC : Both main effects and an interaction (no crossover).
An interaction is referred to as a “crossover” (i.e., also called disordinal interaction) when the lines
intersect, or are opposite in slope (one positive, the other negative) (Maxwell and Delaney, 2004).
This crossover interaction indicates that a main effect has one effect in one level and the opposite
effect in the other level of the other factor. An ordinal interaction (no crossover) indicates that one
of the factors has a more intense effect in one of the levels of the other main effect.
DE
BE
CD
A
C
CE
BC
E
AB
D
B
20151050
Te
rm
Standardized Effect
2.26
A MB
B A C
C TiO 2
D Ty pe A C
E t
Factor Name
Pareto Chart of the Standardized Effects(response is Johnson_Decol, Alpha = 0.05)

Chapter 6. Adsorption Kinetics of Methylene Blue onto TiO2-Activated Carbon Mixture
138
Figure 6-6 Main effect plot for % Decolouration response (Fractional Factorial)
The factor that most interacted with the dye was activated carbon. The importance of methylene
blue on the response was high at low activated carbon concentrations; this means that the initial
concentration of methylene blue had a greater effect on the mean response decolouration when
activated carbon was set at low level. At low level of activated carbon, low amounts of dye would
give higher removal. The interaction of methylene blue with the other factors seemed unimportant.
The effect of the TiO2 addition was more important when activated carbon was set at high level; the
mean response at low level of activated carbon was almost the same whatever the TiO2 addition was
(i.e., slightly higher at low level of TiO2). The addition of TiO2 would improve the uptake of
methylene blue if the amount of activated carbon in the system was high. In other words, the
crossover interaction between both main effects (activated carbon and TiO2) indicates an opposite
effect: if the amount of activated carbon is low, then higher removal is achieved if the level of TiO2 is
set at low. However, if the amount of activated carbon is high, then the adsorption uptake would be
higher if TiO2 is set at high level. There was a difference in removal between short and long times
when TiO2 was set at low level; in this case, longer periods of time improved the removal. The
contact time was less important at high levels of TiO2. The importance of TiO2 in the removal was
higher for 207C than for CA1. In both carbons, high additions of TiO2 improved the removal. Low
additions of TiO2 would decrease the removal more in the case of 207C.
1005510
1.0
0.5
0.0
-0.5
-1.0
50027550 50027550
207CCA1
1.0
0.5
0.0
-0.5
-1.0
24015060
MB
Me
an
A C TiO 2
Ty pe A C t
Corner
Centre
Point Type
Main Effects Plot for Johnson_DecolData Means
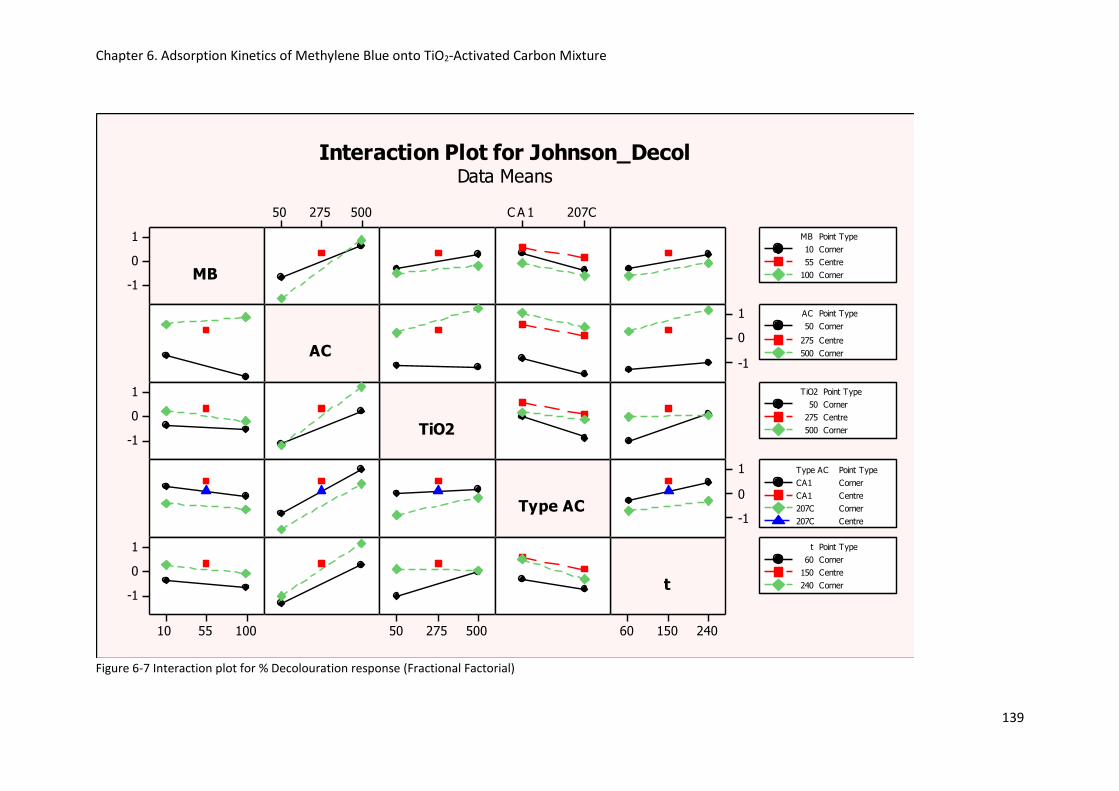
Chapter 6. Adsorption Kinetics of Methylene Blue onto TiO2-Activated Carbon Mixture
139
Figure 6-7 Interaction plot for % Decolouration response (Fractional Factorial)
1
0
-1
24015060
50027550 207CC A 1
1
0
-1
1
0
-1
1
0
-1
1005510
1
0
-1
50027550
MB
AC
TiO2
Type AC
t
10 Corner
55 Centre
100 Corner
MB Point Type
50 Corner
275 Centre
500 Corner
AC Point Type
50 Corner
275 Centre
500 Corner
TiO2 Point Type
CA1 Corner
CA1 Centre
207C Corner
207C Centre
Type AC Point Type
60 Corner
150 Centre
240 Corner
t Point Type
Interaction Plot for Johnson_DecolData Means

Chapter 6. Adsorption Kinetics of Methylene Blue onto TiO2-Activated Carbon Mixture
140
6.2.3 Full factorial design
Based on the Fractional Factorial design, the following conclusions were reached:
(1) Interaction MB*AC was more important at low levels of activated carbon, (2) Interaction TiO2*AC
was more important at high levels of activated carbon, (3) Interaction TiO2*TypeAC was more
important at low levels of TiO2 and for 207C, and (4) Interaction TiO2*t was more important at low
levels of TiO2.
The mass of TiO2 was seen to have a larger effect on the removal of methylene blue at short times. A
full factorial design at a fixed time of 60 min for each carbon was also studied. This factorial can be
seen as a confirmatory experiment of previous conclusions about two-factor interaction effects.
Response: Decolouration
Exploratory Data Analysis
Qualitatively, activated carbon and methylene blue were the most important factors in both full
factorial designs. The best setting configurations are detailed in Table 6-2. The results seemed
consistent; the main difference observed was in the higher decolouration values achieved in each
carbon (higher response setting), suggesting that the capacity of CA1 is higher than the one of 207C
at low adsorption times (contact time, 1 h). The worst condition was set at high concentration of
methylene blue when activated carbon was at low level.
Table 6-2 Comparison of best setting across design in exploratory analysis
207C CA1
Most important factor MB and AC MB and AC
Higher response setting; (MB, TiO2, AC) 0.999; (-,+,+) 0.999; (+,+,+)
Lower response setting; (MB, TiO2, AC) 0.181; (+,+,-) 0.232; (+,-,-)
Reduced Model
No suitable model was found working with the raw response (i.e., lack of fit); Decolouration values
were transformed to improve the fitting. The Johnson transformation was employed for this. Based
on the methodology described in the previous section (inclusion of the most significant effects and
interactions, simplicity, highest R-sq (Pred), and the fulfilment of residual assumptions) the best fit
was chosen. Table 6-3 shows the results from the reduction technique to find the best model fit.
Model number 2 in the case of CA1, and model number 3 in the case of 207C were chosen as best
outcomes. Results from Minitab are shown in Table B-7. In CA1, the most significant main effect was
CA1, and the most significant interaction was MB*CA1. In 207C, the interaction between carbon and

Chapter 6. Adsorption Kinetics of Methylene Blue onto TiO2-Activated Carbon Mixture
141
dye was not observed and, the two-way interaction TiO2*207C was only statistically significant at α
=0.10 level, although its removal was detrimental to the model fit.
Table 6-3 Model reduction results in full factorial design (best fit in italic). Response: Decolouration
Least Squares Fit R2 Adj R2 Pred R2 PRESS s P Lack-of-fit
CA1
Full Model 94.60 89.87 78.38 4.712 0.384 …
Reduced Model 1 94.38 90.63 82.24 3.872 0.369 0.587
Reduced Model 2 94.12 91.18 84.95 3.281 0.358 0.714
Reduced Model 3 90.66 87.27 80.24 4.307 0.430 0.201
207C
Full Model 92.21 85.39 68.83 4.617 0.340 …
Reduced Model 1 92.17 86.95 75.25 3.667 0.359 0.842
Reduced Model 2 92.00 87.99 79.51 3.035 0.344 0.898
Reduced Model 3 91.02 87.76 81.01 2.814 0.348 0.753
Reduced Model 4 87.50 84.37 77.78 3.292 0.393 0.378
The ranking of importance based on the normal and pareto plots from Figure 6-8 and Figure 6-9,
respectively, was 207C >MB >207C*TiO2 for the coconut-based activated carbon; and CA1 >MB*CA1
>CA1*TiO2 for the wood-based carbon. An analysis of Figure 6-10 and Figure 6-11 showed that the
only important interaction in 207C (the interaction that produces the largest shift in the response)
was between TiO2 and AC. This interaction was approximately of the same order of magnitude in
both carbons. The interaction between methylene blue and activated carbon in CA1 was very
important, in fact, it was almost at the same order of magnitude that the main effect AC. As
previously mentioned, this interaction was not observed in 207C.
A high level of TiO2 maximized the response if a high level of activated carbon was also set, but if the
activated carbon is at low level, then the level of TiO2 should be low as well (Figure 6-11 and Figure
6-13). In CA1 the interaction between methylene blue and CA1 was strong (Figure 6-11); conversely
the interaction between methylene blue and 207C was not seen to affect the uptake of methylene
blue (Figure 6-13). The interaction TiO2*CA1 seemed more important at high levels of CA1 (Figure
6-11).

Chapter 6. Adsorption Kinetics of Methylene Blue onto TiO2-Activated Carbon Mixture
142
Figure 6-8 Normal plot of the standardized effects (Full factorial CA1 and 207C)
Figure 6-9 Pareto chart of the standardized effects (Full factorial CA1 and 207C)
Normal Plot of the Standardized Effects(response is Johnson_Decoloration, Alpha = 0.05)
10.07.55.02.50.0-2.5-5.0
99
90
50
10
1
Standardized Effect
Pe
rce
nt
A MB, ppm
B TiO2, mg
C 207C, mg
Factor Name
Not Significant
Significant
Effect Type
1086420-2
99
90
50
10
1
Standardized Effect
Pe
rce
nt
A MB, ppm
B TiO2, mg
C CA1, mg
Factor Name
Not Significant
Significant
Effect Type
C
A
BC
A C
C
Pareto Chart of the Standardized Effects(response is Johnson_Decoloration, Alpha = 0.05)
B
BC
A
C
9876543210
Te
rm
Standardized Effect
2.201
A MB, ppm
B TiO2, mg
C 207C, mg
Factor Name
A
B
BC
AC
C
1086420
Te
rm
Standardized Effect
2.23
A MB, ppm
B TiO2, mg
C CA1, mg
Factor Name

Chapter 6. Adsorption Kinetics of Methylene Blue onto TiO2-Activated Carbon Mixture
143
Figure 6-10 Main effect plots for Johnson_Decoloration in CA1 (Full Factorial)
Figure 6-11 Interaction plots for Johnson_Decoloration in CA1 (Full Factorial)
10010
0.5
0.0
-0.5
-1.0
50050
50050
0.5
0.0
-0.5
-1.0
MB, ppm
Me
an
TiO2, mg
CA1, mg
Main Effects Plot for Johnson_DecolorationData Means
50050 50050
1
0
-1
1
0
-1
MB, ppm
TiO2, mg
CA1, mg
10
100
ppm
MB,
50
500
mg
TiO2,
Interaction Plot for Johnson_DecolorationData Means

Chapter 6. Adsorption Kinetics of Methylene Blue onto TiO2-Activated Carbon Mixture
144
Figure 6-12 Main effect plots for Johnson_Decoloration in 207C (Full Factorial)
Figure 6-13 Interaction plots for Johnson_Decoloration in 207C (Full Factorial)
10010
1.0
0.5
0.0
-0.5
-1.050050
50050
1.0
0.5
0.0
-0.5
-1.0
MB, ppm
Me
an
TiO2, mg
207C, mg
Main Effects Plot for Johnson_DecolorationData Means
50050 50050
1
0
-1
1
0
-1
MB, ppm
TiO2, mg
207C, mg
10
100
ppm
MB,
50
500
mg
TiO2,
Interaction Plot for Johnson_DecolorationData Means

Chapter 6. Adsorption Kinetics of Methylene Blue onto TiO2-Activated Carbon Mixture
145
The summary of the main effects and interactions in the full factorial design for decoloration studies
based on Figure 6-10 to Figure 6-13 were as follows:
- In 207C study: (1)MB*TiO2; No interaction, no TiO2 effect, methylene blue main effect. (2)
MB*207C; both main effects and no interaction. (3) TiO2*207C; Crossover interaction, 207C main
effect, no TiO2 effect.
- In CA1 study: (1) MB*TiO2; no interaction, no main effects. (2) MB*CA1; crossover interaction, CA1
main effect, no methylene blue main effect. (3) TiO2*CA1; crossover interaction, CA1 main effect, no
TiO2 main effect
The main differences between both activated carbons relied on the MB*AC interaction effect in the
removal. At low level of activated carbon, the effect of TiO2 was more important in 207C but at high
levels of activated carbon, then the importance of TiO2 was higher in CA1.
Response: pH
There was a moderate correlation (67.3%) between change in pH (between initial and final
conditions) and decolouration, therefore the most positive change observed in pH (pH increases) did
not necessarily mean the greatest removal, and the most negative change in pH (pH decrease) did
not correlate completely with the least methylene blue decolouration value, although this seemed
to agree to some extent. It was reported (Malarvizhi and Ho, 2010) that methylene blue adsorption
on activated carbon lead to a pH decrease due to an ion exchange process between the carbon
surface and the cation form of the molecules in solution; this would release a number of H+ ions
from the surface of the carbon having acidic groups.
The ranked order of the significant factors was 207C >TiO2 > TiO2*207 (Figure 6-14). The interaction
MB*207C was not significant, but its removal caused a lack of fit in the model (Table B-8). Based on
Figure 6-15, the most important factor (the one that produce the greatest change in the pH
response) was mass of 207C, followed by TiO2. Qualitatively it could be said that methylene blue
appears to be unimportant (as indicated by an almost flat line). The best setting to obtains the
highest pH is (MB, 207C, TiO2) = (-, +, -) and the second best setting is (+, +, -)
The most important interaction (steep line) seemed to be between TiO2 and 207C, followed by
insignificant interactions between MB*207C and MB*TiO2 (Figure 6-16). TiO2 was able to produce a
significant change in pH, higher at low 207C level. Positive changes in pH were moderately
correlated with the uptake of methylene blue. Therefore the changes observed in pH before and
after the adsorption process seemed to be mainly associated with activated carbon, TiO2 and their
interaction.

Chapter 6. Adsorption Kinetics of Methylene Blue onto TiO2-Activated Carbon Mixture
146
Figure 6-14 Normal and Pareto plot of the standardized effects in pH variation response (207C)
Figure 6-15 Main effects plot for pH variation in 207C
12.510.07.55.02.50.0-2.5-5.0
99
90
50
10
1
Standardized Effect
Pe
rce
nt
A MB, ppm
B TiO2, mg
C 207C, mg
Factor Name
Not Significant
Significant
Effect Type
A
AC
BC
B
C
121086420
Te
rm
Standardized Effect
2.23
A MB, ppm
B TiO2, mg
C 207C, mg
Factor Name
BC
C
B
Normal Plot of the Standardized Effects
(response is pH variation, Alpha = 0.05)
Pareto Chart of the Standardized Effects
(response is pH variation, Alpha = 0.05)
10010
2.0
1.5
1.0
0.5
0.050050
50050
2.0
1.5
1.0
0.5
0.0
MB, ppm
Me
an
TiO2, mg
207C, mg
Main Effects Plot for pH variationData Means

Chapter 6. Adsorption Kinetics of Methylene Blue onto TiO2-Activated Carbon Mixture
147
Figure 6-16 Interaction plot for pH variation in 207C
Response: KF
Adsorption kinetics of methylene blue onto activated carbon and onto TiO2/carbon mixture followed
the Lagergren second-order kinetics model:
𝑡
𝑞𝑡=
1
𝑘2𝑞𝑒2 +
𝑡
𝑞𝑒 (6-1)
where qe and qt are the amounts of adsorbate at equilibrium and at time t per unit mass of
adsorbent (mg g-1), and k2 (g mg-1 min-1) is the rate constant of the second-order model for
adsorption. The value of k2 was used to determine KF based on the equation described in the
methodology chapter.
Exploratory data analysis was done arranging the data in descending order by the external mass
transfer rate (KF) values. In the CA1 dataset, the greatest change in the response was seen when
methylene blue and CA1 factors moved from their low to high levels. In 207C, the subset of response
values that was higher, have in common a high level of TiO2 and 207C simultaneously. In this case all
the lowest response values came from the opposite setting of these two factors. Thus the setting
that maximizes the response KF was (MB, TiO2, CA1) = (-, -, +) at Y= 9.972·10-5, and (MB, TiO2, 207C) =
(-, -, +) at Y= 4.630·10-6. Some KF values found in the literature for methylene blue and other dyes
are shown in Table 6-4.
50050 50050
2
1
0
2
1
0
MB, ppm
TiO2, mg
207C, mg
10
100
ppm
MB,
50
500
mg
TiO2,
Interaction Plot for pH variationData Means

Chapter 6. Adsorption Kinetics of Methylene Blue onto TiO2-Activated Carbon Mixture
148
Table 6-4 External mass transfer coefficients examples of several dye-carbon systems
KF (cm/s) Dye Adsorbent Ref. 2 to 2.8 * 10 -3 Different dyes Activated
carbon Filtrasorb 400 (Duri, 1988)
6 to 7 * 10 -6 Methylene Blue P. Notatum (garden grass) (Kumar and Porkodi, 2007)
0.25 to 0.7 * 10 -2 Different dyes wood (McConvey, 1985)
2 to 4 * 10 -3 Different dyes Activated carbon (McKay, 1983)
0.2 to 1.3 * 10 -5 1 * 10 -4 to 9 * 10 -6
Malaquite Green Activated carbon (Onal et al., 2007)
0.14 to 3 * 10 -3 2 to 17 * 10 -4
Different dyes and concentrations
Jute fibre carbon (Porkodi and Kumar, 2007)
An analysis of the main effects and interactions in the mean response KF was done for each carbon.
The reduced models are shown in Table B-9. For CA1, the best model formulated using the main
effects CA1 and methylene blue, no interactions were highlighted at 95% confidence level, t value =
2.306. For 207C, the best reduced model included the main effects 207C and methylene blue and
also its interaction effect. The R2 for prediction in this model explained only 47.57% of the variability
in predicting new observations. In this scenario, the relationships described by the model between
the factors and the response KF are still valid because they are determined by the p-value and not by
the R2, which deals more with the response variability explained by the model (data more
scattered)(Frost, 2014). Therefore the apparently low R2-adj (63.13%) and lower R2-pred (47.57%)
affect the precision of the prediction (greater uncertainty), but do not affect the identification of the
significant variables, which was the main objective of the study. The observed interaction dye-
carbon had a significant impact on the mean value of KF of 207C but not in CA1. Higher external
mass transfer KF values were achieved in CA1 as compared with 207C. The negative value of the
crossover interaction effect MB*207C means that an increase in its level leads to a decrease in the
mean response KF (Figure 6-17). This could be explained in terms of a methylene blue aggregation
effect, which could slow the molecular motion due to its bigger size and show lower KF values (Yang,
2001).
As the interaction plot (Figure 6-18) shows, the interaction effect MB*207C on the mean response
KF becomes more important at high level of carbon. On the other hand, the negative sign of the
main effect MB indicated that a high level of this factor was not desirable for achieving high external
mass transfer rates in CA1 and 207C. This decrease in the value of KF with increase of initial
adsorbate concentration was also seen by other authors (Onal et al., 2007). TiO2 was not significant
at α = 0.05 level in any case. The main effect plot from Figure 6-18 suggests that in 207C the external
mass transfer was faster at high levels of TiO2, and (although unimportant) it seems slightly slower in
CA1.
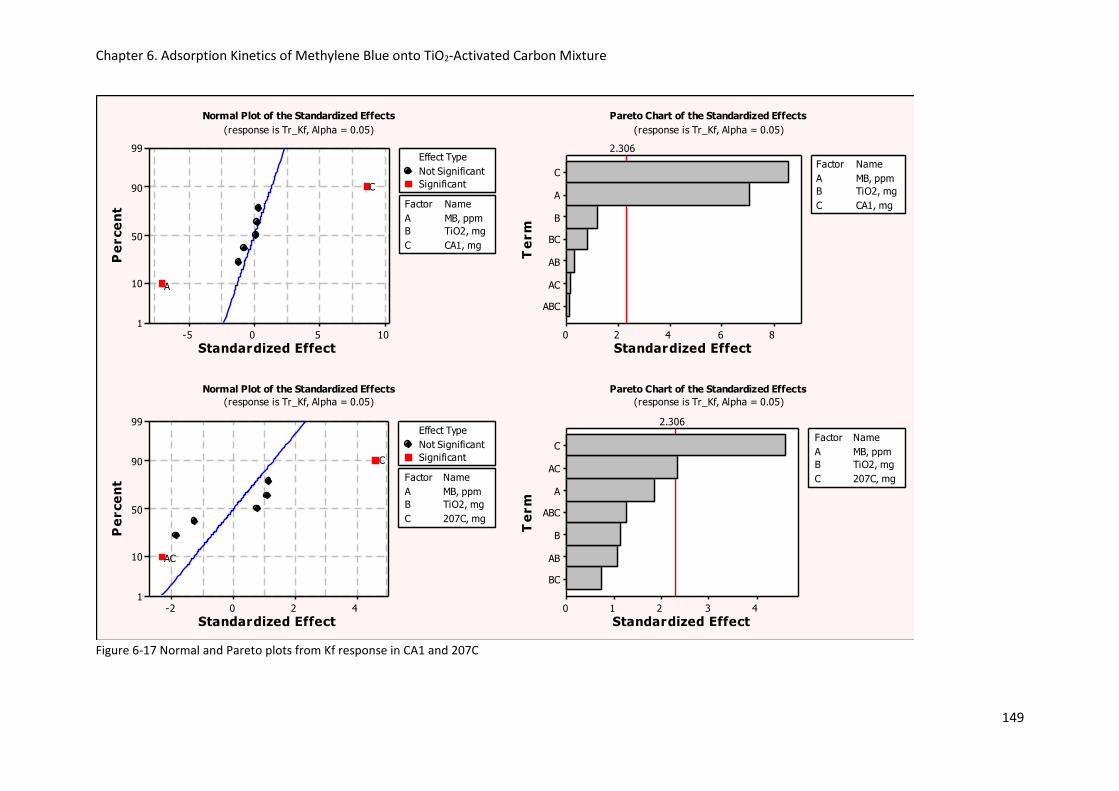
Chapter 6. Adsorption Kinetics of Methylene Blue onto TiO2-Activated Carbon Mixture
149
Figure 6-17 Normal and Pareto plots from Kf response in CA1 and 207C
1050-5
99
90
50
10
1
Standardized Effect
Pe
rce
nt
A MB, ppm
B TiO2, mg
C CA1, mg
Factor Name
Not Significant
Significant
Effect Type
ABC
AC
AB
BC
B
A
C
86420
Te
rm
Standardized Effect
2.306
A MB, ppm
B TiO2, mg
C CA1, mg
Factor Name
420-2
99
90
50
10
1
Standardized Effect
Pe
rce
nt
A MB, ppm
B TiO2, mg
C 207C, mg
Factor Name
Not Significant
Significant
Effect Type
BC
AB
B
ABC
A
AC
C
43210
Te
rm
Standardized Effect
2.306
A MB, ppm
B TiO2, mg
C 207C, mg
Factor Name
C
A
AC
C
Normal Plot of the Standardized Effects
(response is Tr_Kf, Alpha = 0.05)
Pareto Chart of the Standardized Effects
(response is Tr_Kf, Alpha = 0.05)
Normal Plot of the Standardized Effects
(response is Tr_Kf, Alpha = 0.05)
Pareto Chart of the Standardized Effects
(response is Tr_Kf, Alpha = 0.05)

Chapter 6. Adsorption Kinetics of Methylene Blue onto TiO2-Activated Carbon Mixture
150
Figure 6-18 Main effects and interaction plots from Kf response in CA1 and 207C
10010
1
0
-1
50050
50050
1
0
-1
MB, ppm
Me
an
TiO2, mg
CA1, mg
50050 500502
0
-22
0
-2
MB, ppm
TiO2, mg
CA1, mg
10
100
ppm
MB,
ppm
MB,
50
500
mg
TiO2,
10010
0.5
0.0
-0.5
50050
50050
0.5
0.0
-0.5
MB, ppm
Me
an
TiO2, mg
207C, mg
50050 50050
1
0
-1
1
0
-1
MB, ppm
TiO2, mg
207C, mg
10
100
ppm
MB,
ppm
MB,
50
500
mg
TiO2,
Main Effects Plot for Tr_Kf
Data Means
Interaction Plot for Tr_Kf
Data Means

Chapter 6. Adsorption Kinetics of Methylene Blue onto TiO2-Activated Carbon Mixture
151
Response: Ki
The effect of the main factors in the intraparticle diffusion rate was also studied. Exploratory data
analysis in CA1 and 207C showed an influence of methylene blue initial concentration and mass of
carbon on the response Ki when moving from their low to high levels. The best combination of
operating conditions was (MB, TiO2, CA1) = (+, -, -) at Y =14.529 and (MB, TiO2, 207C) = (+, -, -) at Y
=16.464. Some Ki values found in the literature for methylene blue and other dyes are shown in
Table 6-5. The kinetics of 207C was slower than in the case of CA1, attributed in previous chapter to
the presence of much larger proportion of micropores in the carbon. Therefore the fact that the
intraparticle diffusion rate values from 207C were higher than in CA1 dataset suggest that external
mass transfer was the rate limiting step in the adsorption mechanism. The model output from
Minitab is shown in Table B-10. The mass of carbon followed by the initial dye concentration were
seen to affect the rate significantly in CA1 (Figure 6-19) and 207C (Figure 6-20). The response Ki
increased with increase of initial dye concentration for both carbons. This was attributed by other
authors (Onal et al., 2007) to the greater driving force. In 207C the importance of the main effect MB
was greater than in CA1, and no interactions were highlighted at alpha = 0.05 (95% confidence level,
t value = 2.31) (Figure 6-20). Only when alpha was set at 0.10 level was an interaction between 207C
and photocatalyst observed, but it was considered unimportant since its inclusion in the model could
not be justified. The case of CA1 in terms of interactions was more complex (95% confidence level, t
value = 2.26) (Figure 6-19). A three way interaction between carbon, dye and photocatalyst was
observed, followed in importance by the interaction carbon-dye. The sign of the three-way
interaction was positive, therefore the interaction set at its high level would increase the mean
response Ki. The error of using a kinetic constant as response in the DOE could be higher than in the
case of the decolouration because the mathematical procedure to calculate the response could
accumulate more mistakes, so this tentatively suggests that results from Normal and pareto plots
indicated a significant influence of the photocatalyst in the intraparticle diffusion of CA1. The main
effects plot showed an opposite trend between both carbons, when the TiO2 main effect was moved
from its low to a high level. The interaction plot showed a stronger interaction between methylene
blue and activated carbon in CA1 case (higher steep).

Chapter 6. Adsorption Kinetics of Methylene Blue onto TiO2-Activated Carbon Mixture
152
Figure 6-19 Full Factorial Ki response in CA1
20100-10-20
99
90
50
10
1
Standardized Effect
Pe
rce
nt
A MB, ppm
B TiO2, mg
C CA1, mg
Factor Name
Not Significant
Significant
Effect Type
AB
BC
B
AC
ABC
A
C
20151050
Te
rm
Standardized Effect
2.31
A MB, ppm
B TiO2, mg
C CA1, mg
Factor Name
10010
9
6
3
50050
50050
9
6
3
MB, ppm
Me
an
TiO2, mg
CA1, mg
50050 50050
10
5
0
10
5
0
MB, ppm
TiO2, mg
CA1, mg
10
100
ppm
MB,
ppm
MB,
50
500
mg
TiO2,
ABC
AC
C
A
Normal Plot of the Standardized Effects
(response is Ki, Alpha = 0.05)
Pareto Chart of the Standardized Effects
(response is Ki, Alpha = 0.05)
Main Effects Plot for Ki
Data Means
Interaction Plot for Ki
Data Means

Chapter 6. Adsorption Kinetics of Methylene Blue onto TiO2-Activated Carbon Mixture
153
Figure 6-20 Full Factorial Ki response in 207C
1050-5-10
99
90
50
10
1
Standardized Effect
Pe
rce
nt
A MB, ppm
B TiO2, mg
C 207C, mg
Factor Name
Not Significant
Significant
Effect Type
AB
ABC
AC
B
BC
A
C
10.07.55.02.50.0
Te
rm
Standardized Effect
2.31
A MB, ppm
B TiO2, mg
C 207C, mg
Factor Name
10010
0.8
0.0
-0.8
50050
50050
0.8
0.0
-0.8
MB, ppm
Me
an
TiO2, mg
207C, mg
50050 50050
1
0
-1
1
0
-1
MB, ppm
TiO2, mg
207C, mg
10
100
ppm
MB,
ppm
MB,
50
500
mg
TiO2,
C
A
Normal Plot of the Standardized Effects
(response is Johnson Ki, Alpha = 0.05)
Pareto Chart of the Standardized Effects
(response is Johnson Ki, Alpha = 0.05)
Main Effects Plot for Johnson Ki
Data Means
Interaction Plot for Johnson Ki
Data Means

Chapter 6. Adsorption Kinetics of Methylene Blue onto TiO2-Activated Carbon Mixture
154
Table 6-5 Ki values from literature for several dyes and adsorbents
Ki mg/(g min0.5)
Dye Adsorbent Ref.
0.5 to 2 Methylene Blue P. Notatum (garden grass)
(Kumar and Porkodi, 2007)
5 to 10 Malaquite Green
Activated carbon (Onal et al., 2007)
0.55 to 3 Average value for different dyes
Activated carbon (Porkodi and Kumar, 2007)
0.5 to 0.8 Methylene Blue Rice husk (Vadivelan and Kumar, 2005)
6.3 Summary
The influence of the type of activated carbon, methylene blue initial concentration, TiO2 and carbon
mass, and time in the adsorption of methylene blue were analysed by fractional factorial design
approach. The study led to the following conclusions: The mass of carbon, the type of carbon, the
interaction between dye and carbon, and the time of contact were the three most import factors in
the kinetic analysis (they were seen to affect the removal of methylene blue to a greater extent).
Following there factors, it was found that the interaction between carbon and photocatalyst, the
interaction between photocatalyst and time, and the mass of photocatalyst also affected the
response dye removal. Listing these in order of least important (+ positive effect on the response, -
negative effect on the response):
mass carbon (+) >>> type of carbon (-) > interaction carbon-dye (+) > time > interaction carbon-
semiconductor (+) > interaction semiconductor-time (-) >> mass of photocatalyst (+) > initial dye
concentration (-) > interaction photocatalyst-type carbon (+) > interaction mass carbon-time (+) >
interaction type carbon-time (-).
From this study the following points were highlighted: (1) the importance of the TiO2 effect was
higher at higher proportions of carbon, at shorter contact times, and more important for 207C than
for CA1; (2) the effect of methylene blue was more important at low proportion of carbon. A
summary of the main findings from fractional factorial design can be found in Appendix B (Table B-
11).
From several full factorial designs at fixed time and type of carbon, the influence of the initial
methylene blue concentration, mass of carbon and photocatalyst in the responses removal of
methylene blue, external mass transfer coefficient and intraparticle diffusion rate were analysed . In
terms of the response decolouration, the main differences between both carbons relied on the
MB*AC interaction effect in the removal, being higher in the case of CA1. At low level of activated
carbon, the effect of TiO2 was more important for 207C but at high levels of activated carbon, then
the importance of TiO2 was higher for CA1.

Chapter 6. Adsorption Kinetics of Methylene Blue onto TiO2-Activated Carbon Mixture
155
In the case of the response KF, higher external mass transfer values were achieved with CA1 as
compared to 207C. The most important variables (ordered from most to least important), for CA1,
were as follow: mass of carbon (+) > initial dye concentration (-). And in the case of 207C were: mass
of carbon (+) > interaction dye-carbon (-).
The interaction effect MB*207C would be more important at high level of carbon, and its negative
value means that an increase in its level would lead to a decrease in the mean response KF. Also the
negative sign of the main effect MB indicated that high level of this factor was not desirable for
achieving high external mass transfer rates in CA1 and 207C.
Regarding the intraparticle diffusion rate (Ki) response, the mass of carbon followed by the initial
dye concentration were seen to affect the rate significantly in CA1 and 207C. The response Ki
increased with increase of initial dye concentration for both carbons due to the greater driving force.
A three way interaction between carbon, dye and photocatalyst was observed only in the wood-
based carbon, followed in importance by the interaction carbon dye. The sign of the three-way
interaction was positive, therefore the interaction set at its high level would increase the mean
response Ki. This study suggested a significant influence of the photocatalyst in the intraparticle
diffusion of CA1, which was not observed in the other carbon. As pointed out in the previous
chapter, this interaction could have electrostatic nature. A summary of the main findings from full
factorial design can be found in Appendix B (Table B-12).

Chapter 7. Regeneration of Activated Carbon in a Photocatalytic Reactor
156
7 REGENERATION OF ACTIVATED CARBON IN A PHOTOCATALYTIC
REACTOR
7.1 Introduction
This chapter is divided into three parts. Results from response surface experiments are analysed in
the first section. This experimental design was applied to finding the optimum conditions for
mineralization in the coiled-tube and bell photocatalytic reactors using methylene blue as model
compound and TiO2 as photocatalyst performing direct photocatalytic decolourization. The second
part of this chapter describes the regeneration of two carbons, CA1 and 207C, in both
photoreactors. The regeneration experiments in the coiled-tube photoreactor were done using One
Variable at Time (OVAT) method. Experiments were performed at a constant pH = 5.75 and constant
mass of adsorbent. The effect of the mass of TiO2 was the only studied variable in these
regeneration experiments. Experiments using the bell photoreactor were performed applying the
same response surface method used in common photocatalysis (control). The variables under study
were pH, concentration of dye-saturated carbon and photocatalyst concentration. This set of
experiments explored the possibility of employing modifications to the pH to desorb methylene blue
faster, and attempt to make the desorption rate of the dye at least equal to the oxidation rate using
TiO2 photocatalyst. Results from both reactors are described and compared. And finally the third
part, discusses changes in ATR spectrum from both regenerated and raw materials.
7.2 Results
7.2.1 Performance of the coiled-tube and bell photocatalytic reactors
Power and sample size
Full factorial design in bell photoreactor experiments provided a 40.66% probability for finding
difference in response of 0.05, and an 85.5% probability for differences in mineralization of 0.10
(Table B-13(A) and Figure 7-1). Using the coiled-tube photoreactor, experiments based on full
factorial design provided only 21.1% probability for finding a difference in response of 5%, but a
54.8% probability for differences in mineralization of 10% (Table B-13(B) and Figure 7-2).
Screening design
The dataset was sorted in descending order based on the response results. No apparent pattern was
detected. The best setting from methylene blue mineralization in coiled-tube photoreactor was (MB,
pH, TiO2) = (15 mg/L, 8.5, 0.331 g/L) at Y = 0.767, where Y is the mineralization. In the case of
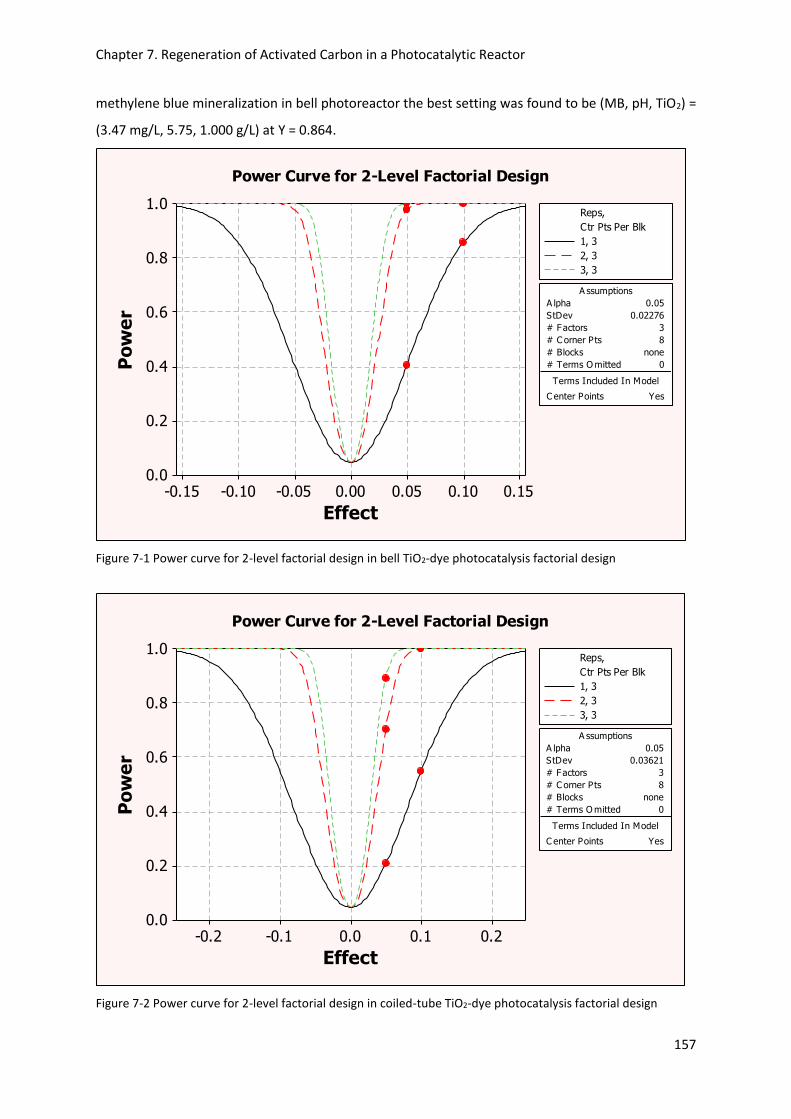
Chapter 7. Regeneration of Activated Carbon in a Photocatalytic Reactor
157
methylene blue mineralization in bell photoreactor the best setting was found to be (MB, pH, TiO2) =
(3.47 mg/L, 5.75, 1.000 g/L) at Y = 0.864.
Figure 7-1 Power curve for 2-level factorial design in bell TiO2-dye photocatalysis factorial design
Figure 7-2 Power curve for 2-level factorial design in coiled-tube TiO2-dye photocatalysis factorial design
0.150.100.050.00-0.05-0.10-0.15
1.0
0.8
0.6
0.4
0.2
0.0
Effect
Po
we
r
A lpha 0.05
StDev 0.02276
# Factors 3
# C orner Pts 8
# Blocks none
# Terms O mitted 0
C enter Points Yes
Terms Included In Model
A ssumptions
1, 3
2, 3
3, 3
Ctr Pts Per Blk
Reps,
Power Curve for 2-Level Factorial Design
0.20.10.0-0.1-0.2
1.0
0.8
0.6
0.4
0.2
0.0
Effect
Po
we
r
A lpha 0.05
StDev 0.03621
# Factors 3
# C orner Pts 8
# Blocks none
# Terms O mitted 0
C enter Points Yes
Terms Included In Model
A ssumptions
1, 3
2, 3
3, 3
Ctr Pts Per Blk
Reps,
Power Curve for 2-Level Factorial Design
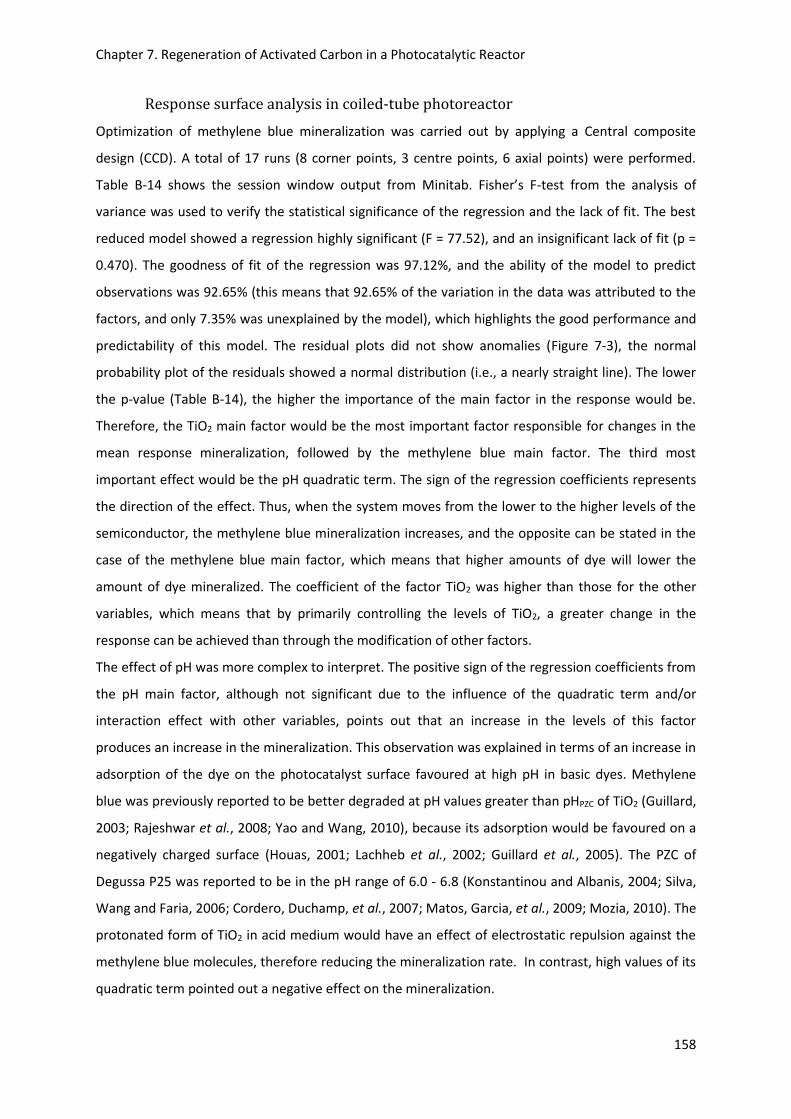
Chapter 7. Regeneration of Activated Carbon in a Photocatalytic Reactor
158
Response surface analysis in coiled-tube photoreactor
Optimization of methylene blue mineralization was carried out by applying a Central composite
design (CCD). A total of 17 runs (8 corner points, 3 centre points, 6 axial points) were performed.
Table B-14 shows the session window output from Minitab. Fisher’s F-test from the analysis of
variance was used to verify the statistical significance of the regression and the lack of fit. The best
reduced model showed a regression highly significant (F = 77.52), and an insignificant lack of fit (p =
0.470). The goodness of fit of the regression was 97.12%, and the ability of the model to predict
observations was 92.65% (this means that 92.65% of the variation in the data was attributed to the
factors, and only 7.35% was unexplained by the model), which highlights the good performance and
predictability of this model. The residual plots did not show anomalies (Figure 7-3), the normal
probability plot of the residuals showed a normal distribution (i.e., a nearly straight line). The lower
the p-value (Table B-14), the higher the importance of the main factor in the response would be.
Therefore, the TiO2 main factor would be the most important factor responsible for changes in the
mean response mineralization, followed by the methylene blue main factor. The third most
important effect would be the pH quadratic term. The sign of the regression coefficients represents
the direction of the effect. Thus, when the system moves from the lower to the higher levels of the
semiconductor, the methylene blue mineralization increases, and the opposite can be stated in the
case of the methylene blue main factor, which means that higher amounts of dye will lower the
amount of dye mineralized. The coefficient of the factor TiO2 was higher than those for the other
variables, which means that by primarily controlling the levels of TiO2, a greater change in the
response can be achieved than through the modification of other factors.
The effect of pH was more complex to interpret. The positive sign of the regression coefficients from
the pH main factor, although not significant due to the influence of the quadratic term and/or
interaction effect with other variables, points out that an increase in the levels of this factor
produces an increase in the mineralization. This observation was explained in terms of an increase in
adsorption of the dye on the photocatalyst surface favoured at high pH in basic dyes. Methylene
blue was previously reported to be better degraded at pH values greater than pHPZC of TiO2 (Guillard,
2003; Rajeshwar et al., 2008; Yao and Wang, 2010), because its adsorption would be favoured on a
negatively charged surface (Houas, 2001; Lachheb et al., 2002; Guillard et al., 2005). The PZC of
Degussa P25 was reported to be in the pH range of 6.0 - 6.8 (Konstantinou and Albanis, 2004; Silva,
Wang and Faria, 2006; Cordero, Duchamp, et al., 2007; Matos, Garcia, et al., 2009; Mozia, 2010). The
protonated form of TiO2 in acid medium would have an effect of electrostatic repulsion against the
methylene blue molecules, therefore reducing the mineralization rate. In contrast, high values of its
quadratic term pointed out a negative effect on the mineralization.

Chapter 7. Regeneration of Activated Carbon in a Photocatalytic Reactor
159
Interaction effects between dye and pH, and dye and photocatalyst were included in the model
despite their lack of significance because they improved the adjusted R2. However the interaction is
not discussed here because unless their p-value is lower than 0.5, there is no certainty over the
interactions. Based on response optimization results, the complete dye mineralization was achieved
with 0.4149 g/L TiO2 and using 3.07 mg/L of methylene blue at a pH= 6.5. As can be seen in Figure
7-4 where the contour and surface plots of the fitted model are shown, mineralization increases
with increase in TiO2 concentration and decreases in initial dye concentration. The higher
mineralization values were found at pH values between 4 and 8, and with dye concentrations lower
than 20 mg/L and photocatalyst concentrations higher than 0.25 g/L.
Figure 7-3 Residuals plots for methylene blue Mineralization in the coiled-tube photoreactor
0.080.040.00-0.04-0.08
99
90
50
10
1
Residual
Perc
en
t
N 17
AD 0.308
P-Value 0.524
0.80.60.40.20.0
0.050
0.025
0.000
-0.025
-0.050
Fitted Value
Resid
ual
0.060.040.020.00-0.02-0.04-0.06
4.8
3.6
2.4
1.2
0.0
Residual
Fre
qu
en
cy
161412108642
0.050
0.025
0.000
-0.025
-0.050
Observation Order
Resid
ual
Normal Probability Plot Versus Fits
Histogram Versus Order
Residual Plots for Mineralization

Chapter 7. Regeneration of Activated Carbon in a Photocatalytic Reactor
160
Figure 7-4 Contour and surface plots of methylene blue mineralization in the coiled-tube photoreactor
MB (mg/L)
pH
604020
10
8
6
4
2
TiO2 (g/L) 0.3308
Hold Values
>
–
–
–
< 0.2
0.2 0.4
0.4 0.6
0.6 0.8
0.8
Mineralization
0.0
0.5
025
50
1.0
05050
5
0
10
Mineralizat.
pH
MB (mg/L)
TiO2 (g/L) 0.3308
Hold Values
MB (mg/L)
TiO
2 (
g/L
)
604020
0.35
0.25
0.15
0.05
pH 8.5
Hold Values
>
–
–
–
< 0.00
0.00 0.25
0.25 0.50
0.50 0.75
0.75
Mineralization
0.0
0.5
0025
50
02525
0.5
1.0
0.050
0.2
0.4
Mineralizat.
TiO2 (g/L)
MB (mg/L)
pH 8.5
Hold Values
(A) Contour Plot of Mineralization vs pH, MB (mg/L) (B) Surface Plot of Mineralization vs pH, MB (mg/L)
(C) Contour Plot of Mineralization vs TiO2 (g/L), MB (mg/L) (D) Surface Plot of Mineralization vs TiO2 (g/L), MB (mg/L)

Chapter 7. Regeneration of Activated Carbon in a Photocatalytic Reactor
161
Response surface analysis in bell photoreactor
The session window output from Minitab of the response surface regression in bell photoreactor is
shown in Table B-15. Fisher’s F-test from the analysis of variance was used to verify the statistical
significance of the regression and the lack of fit. The regression was statistically significant with an F-
value of 7.24 and a probability value of 0.008. Lack of fit was revealed not significant (p > 0.05). The
R2 (adj) of 76.41% was used as goodness of fit to select the best model, but since it does not describe
the model predictive behaviour, R2 (pred) was evaluated (i.e., “pred” stands for predicted).
R2 for prediction was 18.51% which indicates that less than 20% of the variation in the data could be
attributed to the factors; the rest of the variation was unexplained by the model. The lowest p-value
result indicates that the pH was the most significant factor in the mineralization of methylene blue.
Interactions were revealed not to be sufficiently significant. Results from Figure 7-5 indicate that
residuals were normally distributed (the normal probability plot shows a nearly straight line), and
had constant variance around zero (versus fit plot). Also, runs do not follow any particular trend over
time (versus order plot). It is not justifiable to use the histogram to evaluate normality if sample size
is less than 50 runs (NIST/SEMATECH, 2013).
Figure 7-5 Residual plot for JonnsonMineralization in TiO2-dye photocatalysis (bell photoreactor)
0.80.40.0-0.4-0.8
99
90
50
10
1
Residual
Perc
en
t
N 17
AD 0.335
P-Value 0.468
210-1
0.50
0.25
0.00
-0.25
-0.50
Fitted Value
Resid
ual
0.40.20.0-0.2-0.4
3
2
1
0
Residual
Fre
qu
en
cy
161412108642
0.50
0.25
0.00
-0.25
-0.50
Observation Order
Resid
ual
Normal Probability Plot Versus Fits
Histogram Versus Order
Residual Plots for JohnsonMiner.

Chapter 7. Regeneration of Activated Carbon in a Photocatalytic Reactor
162
The model could not be improved by dropping terms or transforming the response. The underlying
cause of the problem was investigated by identifying the distribution of the data. The methodology
described by Frost (2012) was followed. To identify the best fitting distribution, the Anderson-
Darling statistic (lowest value) and the p-value (highest value) were used. The goodness of fit test
and distribution parameter values can be read from Table B-16 in the case of mineralization data
from the coiled-tube photoreactor, and Table B-17 in the case of mineralization data from the bell
photoreactor. Results indicate that mineralization dataset from the coiled-tube is normally
distributed because the p-value is higher than 0.05, whereas the distribution that best described the
mineralization data from the bell photoreactor experiments was the Weibull distribution, which is
the alternative to the normal distribution when data is non symmetric (in this case negatively
skewed), and therefore the mean value is to the right of the centre of the range. The distribution is
in fact highly skewed to the lower values (skewness=-2.3432). Figure 7-9 shows the probability plot
of the data, where it can be observed how well the mineralization data fit the Weibull distribution
(alignment of the data to the centre line). The plot reveals an outlier in the sample. Because the
distribution is skewed, the centre and spread of the distribution is calculated using percentiles from
this probability plot. The middle point of this data is at a mineralization value of 0.692, which means
that the median is closer to the higher values than the lower ones. Furthermore, 95% of the
population shows values of mineralization higher than 0.382 and lower than 0.849 if the whole data
is used, but falls within the range 0.5034 and 0.8408 mineralization values if the outlier is removed
(plot not shown).Kurtosis is equal to 7.3419 which means that the distribution has a peak higher and
sharper than an ideal Gaussian distribution.
In the case of the mineralization data in the coiled-tube photoreactor (Table B-16), the data is
centred at 0.3606 and the standard deviation is 0.2443 (dataset from the bell photoreactor shows
less variance than the mineralization dataset from the coiled-tube photoreactor). The distribution is
approximately symmetrical (skewness=0.2672) and the peak is lower and broader (kurtosis=-1.2378)
than a normal distribution. In this scenario 95% of the population (values within the 2.5th and 97.5th
percentiles) falls within the mineralization values of 0.118 and 0.8339 (plot not shown). The plots
from Figure 7-6 and Figure 7-7 show the proportion of specific mineralization regions, and these may
be better appreciated in the form of pie charts in Figure 7-8. These figures help to identify where
specific mineralization populations are in the distribution. Four ranges were highlighted in red: 0-0.4,
0.4-0.6, 0.6-0.8, and 0.8-1.0; apparently 65.96% of the population fall between the range 0.6 and 0.8
in the data collected from the bell reactor and this increases to 76.73% if the outlier is removed (plot
not shown). For some unexplained reasons, values lower than 0.6 and higher than 0.8 did not occur.
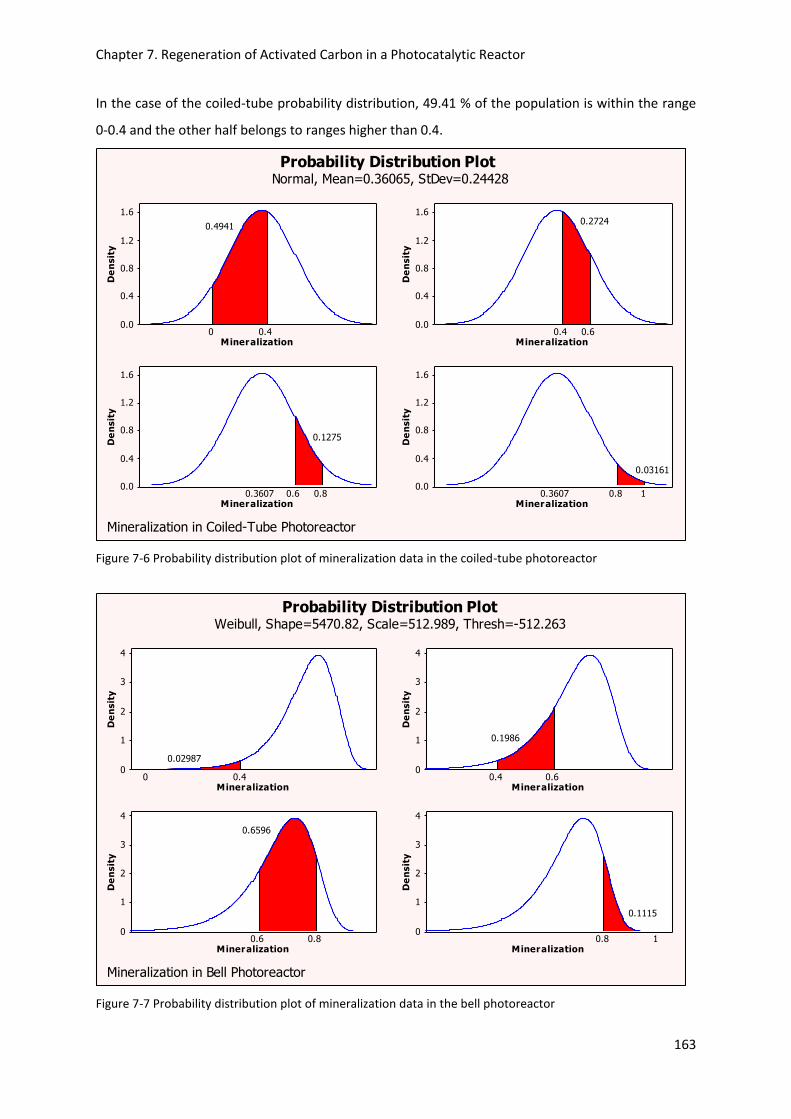
Chapter 7. Regeneration of Activated Carbon in a Photocatalytic Reactor
163
In the case of the coiled-tube probability distribution, 49.41 % of the population is within the range
0-0.4 and the other half belongs to ranges higher than 0.4.
Figure 7-6 Probability distribution plot of mineralization data in the coiled-tube photoreactor
Figure 7-7 Probability distribution plot of mineralization data in the bell photoreactor
Probability Distribution Plot Normal, Mean=0.36065, StDev=0.24428
Mineralization in Coiled-Tube Photoreactor
1.6
1.2
0.8
0.4
0.0
Mineralization
De
nsit
y
0
0.4941
0.4
1.6
1.2
0.8
0.4
0.0
Mineralization
De
nsit
y
0.4
0.2724
0.6
1.6
1.2
0.8
0.4
0.0
Mineralization
De
nsit
y
0.6
0.1275
0.80.3607
1.6
1.2
0.8
0.4
0.0
Mineralization
De
nsit
y
0.8
0.03161
10.3607
Probability Distribution PlotWeibull, Shape=5470.82, Scale=512.989, Thresh=-512.263
Mineralization in Bell Photoreactor
4
3
2
1
0
Mineralization
De
nsit
y
0
0.02987
0.4
4
3
2
1
0
Mineralization
De
nsit
y
0.4
0.1986
0.6
4
3
2
1
0
Mineralization
De
nsit
y
0.6
0.6596
0.8
4
3
2
1
0
Mineralization
De
nsit
y
0.8
0.1115
1

Chapter 7. Regeneration of Activated Carbon in a Photocatalytic Reactor
164
Although the versus order plot (Figure 7-5) did not detect any trend over time, the raw response can
be plot in time sequence (run order) to detect trend changes in the process that the residual plot
might not detect (NIST/SEMATECH, 2013).Figure 7-10 shows the run sequence plot used to evaluate
time effects. While in coiled-tube reactor the experiments looked random, in the bell experimental
set the run order indicated a constant trend in the response. It is also noticeable the outlier (run 16)
in the bell group.
Figure 7-8 Pie chart of area (%) from probability distribution plot results
The effect of the factors depends on the high and low levels set, therefore two possibilities apply: (1)
levels of the variable were too close to one another, or (2) levels were too far appart from one
another. Both scenarios can lead to non-significant differences in the response. Experimental
domain and levels were described in the methodology chapter (Chapter 3). Whilst the TiO2
concentration range fluctuated between 0 and 0.41 g/L in the coiled-tube photoreactor, it varied
between 0.16 and 1.84 g/L in the bell reactor; pH levels were identical in both datasets, and the
initial dye concentration was of similar magnitude (between 3 and 62 mg/L in the coiled-tube design,
and between 3.5 and 40 mg/L for bell experiments). Apparently it seems that the upper level of TiO2
factor chosen for one of the reactors was too high when compared with the other.
Pie Chart of Area (%) from Probability Distribution
0.0-0.4
0.4-0.6
0.6-0.8
0.8-1.0
Category
0.0-0.4
0.4-0.6
0.6-0.8
0.8-1.0
Category
11.2%
66.0%
19.9%
3.0%
3.4%13.8%
29.4%
53.4%
Type = 3-Weibull
Type = Normal

Chapter 7. Regeneration of Activated Carbon in a Photocatalytic Reactor
165
Figure 7-9 Probability plot of mineralization data from the bell photoreactor
Figure 7-10 Run sequence plot of mineralization response from bell and coiled-tube photoreactors
10.9
0.8
0.7
0.6
0.5
0.4
0.3
0.2
0.15
99
90807060504030
20
10
5
3
2
1
Mineralization
Pe
rce
nt
97.5
0.8
49
50
0.6
92 2.5
0.3
82
Shape 5471
Scale 513.0
Thresh -512.3
N 17
AD 0.443
P-Value 0.183
3-Parameter Weibull - 95% CI
Probability Plot of Mineralization from Bell Photoreactor
161412108642
0.9
0.8
0.7
0.6
0.5
0.4
0.3
0.2
0.1
0.0
Run Order
Re
sp
on
se
Mineralization (Bell)
Mineralization (Coiled-Tube)
Variable
Run Sequence Plot
Chapter 7. Regeneration of Activated Carbon in a Photocatalytic Reactor
166
To determine if the observed differences in the response between both reactors are significant and
mainly produced by the photocatalyst, the information from both analyses was merged and
analysed in the following manner: firstly the data was ordered by response; secondly using two-
sample t-test, two-sample standard deviation test, and factor analysis for mixed data (AFDM) were
performed. The simple ordering of the data by the predicted variable (mineralization) suggested that
higher observed values in the response were closely related to TiO2 concentrations. A more precise
determination of the observed differences in response between both reactors was done by
comparing the means (Figure 7-11) and the variability of the data (Figure 7-12). The mean response
(mineralization) from the bell reactor was significantly greater than the mean measured in the
coiled-tube reactor, and the variance of the sample was lower for the bell group as compared with
that of the coiled-tube reactor.

Chapter 7. Regeneration of Activated Carbon in a Photocatalytic Reactor
167
Figure 7-11 Summary report of two-Sample t-test for the mean of bell and coiled-tube photoreactors
0.80.60.40.20.0
Bell
Coiled-Tube
Coiled-Tube (p < 0.05).
The mean of Bell is significantly greater than the mean of
> 0.50.10.050
NoYes
P = 0.000
0.40.30.20.10.0
and 0.42670 with 90% confidence.
-- The true difference is between 0.18870
Coiled-Tube at the 0.05 level of significance.
-- The mean of Bell is greater than
Sample size 17 17
Mean 0.66835 0.36065
90% CI (0.6040, 0.7327) (0.25721, 0.46408)
Standard deviation 0.15192 0.24428
Statistics Bell Coiled-Tube
0.30770
(0.18870, 0.42670)
Difference between means*
90% CI
* The difference is defined as Bell - Coiled-Tube.
Distribution of Data
Compare the data and means of the samples.
Mean Test
Is Bell greater than Coiled-Tube?
90% CI for the Difference
Does the interval include zero?
Comments

Chapter 7. Regeneration of Activated Carbon in a Photocatalytic Reactor
168
Figure 7-12 Summary report of two-sample standard deviation test based on Levene/Brown-Forsythe test for bell and coiled-tube photoreactors
0.80.60.40.20.0
Bell
Coiled-Tube
Coiled-Tube (p < 0.05).
The standard deviation of Bell is significantly less than
> 0.50.10.050
NoYes
P = 0.005
Coiled-Tube
Bell
0.300.250.200.150.10
determine if it has practical implications.
Consider the size of the difference to
that the standard deviations differ.
-- Comparison chart: Red intervals indicate
significance.
than Coiled-Tube at the 0.05 level of
-- The standard deviation of Bell is less
Sample size 17 17
Mean 0.66835 0.36065
Standard deviation 0.15192 0.24428
90% CI (0.0810, 0.3155) (0.2049, 0.3224)
Statistics Bell Coiled-Tube
Distribution of Data
Compare the spread of the samples.
Standard Deviation Test
Is Bell less than Coiled-Tube?
Standard Deviations Comparison Chart
Comments

Chapter 7. Regeneration of Activated Carbon in a Photocatalytic Reactor
169
Table 7-1 T-test (unequal variance) for bell and coiled-tube photoreactors
Attribute_Y Attribute_X Description Statistical test
MB,mg/L Photoreactor Value Examples Average Std-dev T
d.f.
p-value
FALSE
26.8
0.028536
Bell 17 21.81 10.0749
C.tube 17 32.5 16.1679
All 34 27.155 14.3314
TiO2, g/L Photoreactor Value Examples Average Std-dev T
d.f.
p-value
0.8220 / 0.1169 =
7.033645
18.8
0.000001 Bell 17 1 0.4619
C.tube 17 0.178 0.1371
All 34 0.589 0.5354
pH Photoreactor Value Examples Average Std-dev T
d.f.
p-value
0.0000 / 0.8714 =
0.000000
32
1 Bell 17 5.75 2.5407
C.tube 17 5.75 2.5407
All 34 5.75 2.5019
Mineralization Photoreactor Value Examples Average Std-dev T
d.f.
p-
value
0.3077 / 0.0698 =
4.410193
26.77
0.000148 Bell 17 0.6683 0.1519
C.tube 17 0.3606 0.2443
All 34 0.5145 0.254
Two statistical tools were used to detect which was the variable that most contributed to the
differences in the mineralization observed between both photoreactors: a t-test (unequal variance)
and a factor analysis for mixed data (AFDM). Table 7-1 and Figure 7-13 shows the t-test and AFDM
results, respectively. Obviously, the comparison does not take into account other exogenous
variables to this analysis which could produce differences in mineralization between both
photoreactors, such as the different light sources used in each group. This definitely overestimates
the influence of the factors in the measured differences in response between photoreactors, so the
analysis should be seen just as an approximation to improve the direction of the response in the bell
photoreactor based on the three studied variables.

Chapter 7. Regeneration of Activated Carbon in a Photocatalytic Reactor
170
In the AFDM study the squared correlation table (commonalities) is used to highlight the influence of
the variables in the formation of the factors by showing the values of the (*) square of correlation
coefficient in the case of quantitative variables, and the (**) correlation ratio for the qualitative
variables (Rakotomalala, 2005). The correlation table (factor loadings) determines the influence of
the quantitative variables in the factor. It can be observed that there is a stronger and positive
relation between mineralization and titanium dioxide, as compared with the negative and less
correlated dye initial concentration. The assessment of the influence of the type of reactor
(qualitative variable) is done by using the conditional means table (table not shown). These tables
along with the graphical representation of the data are shown in Figure 7-13.
The t-test (Table 7-1) showed that there were differences in the mean value for the mineralization (p
= 0.000148) and TiO2 concentration (p = 0.000001) between the two groups (type of photoreactor).
The AFDM analysis also showed that differences in the mineralization values between both
photoreactors can be mainly attributed to differences in the TiO2 concentration used, and less to the
different values in dye concentration applied in those experiments.
Figure 7-13 AFDM summary output: (A) Scatterplot of factor 1 versus factor 2 labelled by photoreactor type, (B) Correlation scatterplot of factor 1 versus factor 2 showing the quantitative variables, (C) Squared correlation table and (D) the correlation table with the quantitative variables.

Chapter 7. Regeneration of Activated Carbon in a Photocatalytic Reactor
171
In conclusion, response surface method for straightforward photocatalytic decolourization
experiments in the bell photoreactor was not satisfactory. The distribution of the data was narrow
and, although mineralization values were close to the optimum, the fact is that values observed in
the response did not change much at the levels set by the variables, fluctuating mainly between 0.6
and 0.8. The next step in the analysis was to determine what caused the lack of variability in this
dataset. Observed differences in mineralization between bell and coiled-tube photoreactors were
attributed mainly to the TiO2 treatment. Comparison between both groups led to the conclusion that
if the upper level of the TiO2 factor was lowered this could potentially broaden the distribution of
the response sample and increase the treatment variance (variability due to factors) which was very
low in the model.
7.2.2 Regeneration of activated carbon using TiO2 photocatalysis
This section describes firstly the regeneration of activated carbon using TiO2 photocatalysis in the
bell photoreactor and later it describes regeneration in the coiled-tube photoreactor.
Regeneration of CA1 and 207C in the bell photoreactor
Desorption is the first step in the photocatalytic regeneration (Liu, Sun and Zhang, 2004), and then
methylene blue have to contact TiO2 in order to get good photocatalytic regeneration. This is
because the TiO2 aggregates in water are too big (1.9 µm) to enter the much smaller pore size from
activated carbon (average pore diameter of 5.416 nm for CA1 and 5.576 nm for 207C). Desorption is
favoured at conditions in which adsorption decreases (e.g., decrease of pH, increase of
temperature), and the type of carbon also plays a role in the irreversibility of the adsorption (de
Jonge, Breure and van Andel, 1996). Intraparticle mass transfer, closely related to contact time, can
determine reversibility. An effective particle diffusivity (cm2/s) was described to exist at which
desorption would be faster (Streat and Patrick, 1995). But in this case a compromise has to be
arrived at because high pH values favour photocatalytic degradation of methylene blue and the
adsorption process, - conditions that do not favour desorption hence regeneration.
Response: Regeneration
Based on the results from the surface response analysis in CA1, 63.3% regeneration was achieved
using 15.9 mg/L of saturated CA1 at very acidic pH (Figure 7-15). The reduced linear model that best
described the dataset highlighted no significant influence by the photocatalyst (Table B-18). The
pareto chart from Figure 7-14 shows that pH was the most important main factor. In general, basic
dyes like methylene blue exhibit good attraction toward acidic media (Lu et al., 2011; Salleh et al.,
2011), therefore the hypothesis that massive desorption occurred at acid pH seems reasonable. The
fact is that this model could explain only 48.80% of the variation in the data, and the other half was

Chapter 7. Regeneration of Activated Carbon in a Photocatalytic Reactor
172
unexplained. The value of the R2-pred is comparatively much lower than R2-adj, which is a sign of low
model prediction and overfitting. The possible cause of this lack of significance in the regression
might come from the narrow distribution of the data, also observed in the control experiments.
Therefore this model does not seem adequate to describe the dataset. In the case of 207C, no
significant variation in the regeneration was found at the studied levels of the operational variables.
A more narrow distribution of the data was found in this case as compared to the acidic carbon. In
general, each run showed a lower regeneration percentage in the case of 207C when compared with
CA1.
Figure 7-14 Pareto chart of the standardized effects from Full factorial of the CA1 regeneration in bell photocatalytic reactor
AB
AC
A
ABC
BC
B
C
9876543210
Te
rm
Standardized Effect
4.303
A C A 1 (g/L)
B TiO 2 (g/L)
C pH
Factor Name
Pareto Chart of the Standardized Effects(response is Regeneration (%), Alpha = 0.05)

Chapter 7. Regeneration of Activated Carbon in a Photocatalytic Reactor
173
Figure 7-15 Contour plot of CA1 regeneration in the bell photoreactor
Response: Var-pH
The analysis of changes in pH during irradiation of the spent adsorbents in the presence of TiO2 was
also studied. Results from the response surface design in the photocatalytic step of the CA1 and
207C regeneration are shown in Table B-19 and Table B-20, respectively.
Based on the magnitude of the regression coefficients, pH was the factor that affects changes in pH
to a greater extent, which is obvious. TiO2 produced measurable changes in pH in the 207C study,
but no influence on the response was detected in the acid-activated carbon. Therefore, pH and TiO2
were the factors that most influenced changes in pH during the photocatalytic regeneration of 207C.
Regression coefficients were negative indicating that high levels of these factors and their mutual
interaction decreased the response (acidification). Only pH was seen to produce significant changes
in the response during CA1 irradiation, additionally in this case, a decrease in the pH at high levels of
pH is described by the negative sign of the regression coefficient generated by the model. Both
response surface regressions were significant (p=0.000), with high R2-pred and similar to R2-adj,
indicating the adequacy of the models.
CA1 (g/L)
pH
0.180.160.140.120.100.080.060.040.02
10
9
8
7
6
5
4
3
2
>
–
–
–
–
–
–
< 42
42 45
45 48
48 51
51 54
54 57
57 60
60
(%)
Regeneration
Contour Plot of Regeneration (%)

Chapter 7. Regeneration of Activated Carbon in a Photocatalytic Reactor
174
Figure 7-16 Contour plot of Var-pH in 207C regeneration using the bell reactor
Figure 7-17 Surface plot of Var-pH in 207C regeneration using the bell reactor
TiO2 (g/L)
pH
1.81.61.41.21.00.80.60.40.2
10
9
8
7
6
5
4
3
2
207C (g/L) 0.05
Hold Values
>
–
–
–
–
–
< -5
-5 -4
-4 -3
-3 -2
-2 -1
-1 0
0
Var-pH
Contour Plot of Var-pH
-6
-4
-2
0.00.5 1.0
1.5
0
10
5
01.5
Var-pH
pH
TiO2 (g/L)
207C (g/L) 0.05
Hold Values
Surface Plot of Var-pH

Chapter 7. Regeneration of Activated Carbon in a Photocatalytic Reactor
175
In the 207C experiments, the interaction TiO2*pH was not significant, but its removal was
detrimental to the regression (lower R2-adj). Contour plots from Figure 7-16 shows the curves that
have the same response for the paired pH and TiO2 factors. The surface plot from Figure 7-17 is
useful in that it reveals the direction in which the response increases or decreases with the
interaction of both factors. Positive changes of pH occurred at pH values between 3 and 5.5
approximately. Negative changes in pH were found outside this range, as can be observed from the
figure.
Regeneration of CA1 and 207C in the coiled-tube photoreactor
The OVAT method was set up to test the regeneration of CA1 and 207C in the coiled-tube
photoreactor. At a constant operational pH of 5.75 a negatively charged CA1, a positively charged
207C, a positively charged methylene blue and a positive net surface charge on TiO2 could be
expected. In the regeneration of CA1 (Figure 7-18), the addition of TiO2 made the pH of the solution
more acidic. It was also observed that the same variable produced an increase in regeneration. The
opposite trend was observed in the case of the other activated carbon, where the addition of TiO2
made the pH of the solution more basic during regeneration. In this case higher regeneration
percentage were obtained when lower amounts of TiO2 were used during regeneration. Although
apparently higher regeneration was achieved in the case of CA1, these differences could not be
considered statistically significant in this reactor as will be explained in the next section.
Figure 7-18 Scatterplot of Regeneration (%) and changes in pH during irradiation at a pH = 5.75 in the coiled-tube photoreactor. Each point represents the average value of two repetitions.
2.52.01.51.00.5
40.0
37.5
35.0
32.5
30.0
27.5
25.0
2.52.01.51.00.5
-0.2
-0.3
-0.4
-0.5
-0.6
Regeneration (%)
R
Var-pH207C
CA1
Type AC
Regeneration (%), Var-pH vs R

Chapter 7. Regeneration of Activated Carbon in a Photocatalytic Reactor
176
7.3 Performance Comparison between control and regeneration
experiments: Does a synergy exist between carbon and
semiconductor during the photocatalytic process?
This section compares the mean (17 control experiments) of the methylene blue mineralization
using only TiO2 in both photoreactors. It also compares the mean (17 regeneration experiments) of
the activated carbon regeneration from the bell photoreactor and the 5 regeneration experiments
per carbon (and repetitions) from the coiled-tube photoreactor. To facilitate comparison between
both photoreactors, and between control and regeneration experiments, both mineralization and
regeneration values were transformed. Thus the ratio 𝑚𝑔 𝑀𝐵
𝑔 𝑇𝑖𝑂2 represented the milligrams of dye
mineralized per gram of photocatalyst added.
Figure 7-19 Interval plot (95 % CI for the Mean) for (A) Mineralization comparison in both photoreactors, (B) 𝑚𝑔 𝑀𝐵
𝑔 𝑇𝑖𝑂2 comparison in both photoreactors, (C) Regeneration (%) comparison in the bell photoreactor, (D)
Activated carbon regeneration comparison in terms of 𝑚𝑔 𝑀𝐵
𝑔 𝑇𝑖𝑂2 from the bell photoreactor at pH=5.75, (E)
Regeneration (%) comparison in the coiled-tube photoreactor (pH=5.75), (F) Activated carbon regeneration
comparison in terms of 𝑚𝑔 𝑀𝐵
𝑔 𝑇𝑖𝑂2 in the coiled-tube photoreactor (pH=5.75).
Figure 7-19 shows the interval plots for direct photocatalytic decolourization and regeneration
processes. Plot A and B describes which was the most efficient photoreactor based on its central
C oiled-tubeBell
0.6
0.4
0.2
Photoreactor
Min
era
liza
tio
n
C oiled-tubeBell
60
40
20
Photoreactor
mg
MB
/g
TiO
2
C A 1207C
56
48
40
A C T ype
% R
eg
en
era
ted
Reg. C A 1Reg. 207CC ontrol
16
12
8
T ype
mg
MB
/g
TiO
2
C A 1207C
40
32
24
A C T ype
% R
eg
en
era
ted
C oiled-tubeC A 1207C
200
100
0
T ype
mg
MB
/g
TiO
2
(B) Photoreactor Comparison
(C) Regeneration (%) in Bell Photoreactor
(E) Regeneration (%) in Coiled-tube Photoreactor (F) Regeneration in Coiled-tube Photoreactor
(A) Photoreactor Comparison
(D) Regeneration in Bell Photoreactor

Chapter 7. Regeneration of Activated Carbon in a Photocatalytic Reactor
177
tendency and variability. Therefore, based on the mean symbol with a 95% confidence interval bar,
it could be concluded that although the mean mineralization in the bell reactor was higher than that
achieved using the coiled-tube photoreactor (plot A), in fact it was the coiled-tube photoreactor
(plot B) that yielded higher values of 𝑚𝑔 𝑀𝐵
𝑔 𝑇𝑖𝑂2. Plots C and D display which carbon was regenerated the
most in the bell photoreactor. Results are presented in terms of regeneration percentages in plot C
and 𝑚𝑔 𝑀𝐵
𝑔 𝑇𝑖𝑂2 in plot D. Plots E and F described the same variables but for the coiled-tube reactor.
Regeneration results from both bell and coiled-tube photoreactors in plots C and E highlighted the
higher regeneration mean of CA1 compared with 207C, although those differences in the
regeneration were only significant in the bell reactor. The regeneration differences between these
two adsorbents in the coiled-tube reactor could not be considered significant because the interval
bars overlap. In plot D regeneration values from bell reactor were transformed into 𝑚𝑔 𝑀𝐵
𝑔 𝑇𝑖𝑂2 to be able
to compare regeneration with mineralization values from control experiments. Again, the mean was
higher in the case of CA1 as compared with 207C, and both carbons showed lower means than the
control. This indicated that the amount of methylene blue removed from inside the carbon,
assuming it was all mineralized, was on average lower than the amount mineralized in the control
experiments in the bell reactor. This indicates a lack of synergistic effect between photocatalyst and
carbon during irradiation. The opposite conclusion was found in the coiled-tube photoreactor (plot
F), but with no real significance. Plots D and F are particularly useful in comparing the carbon
regeneration performance of both photoreactors. In this case, the 𝑚𝑔 𝑀𝐵
𝑔 𝑇𝑖𝑂2 from any of the
regenerated carbons was on average higher in the coiled-tube reactor than in the bell reactor.
Experimental work from plot F was performed at a constant pH and carbon mass, and it contained
on average less number of runs. On the other hand, experiments from plot D were performed at a
wider range of experimental conditions of pH and mass with a substantial number of runs. In
summary, while observed differences in plot F could not be considered significant because the
interval bars overlapped, the large-scale study did not suggest evidence of synergistic effect in terms
of a carbon-TiO2 interaction that would improve the mineralization. Figure 7-20 shows a higher CA1
regeneration at lower working pH and a higher regeneration performance of CA1 as compared with
207C at different working pH, statistically significant only in the acid range. The better regeneration
performance achieved for the acidic CA1 adsorbent as compared with the basic 207C carbon seems
to be independent of the pH, as can be observed in Figure 7-20, unfortunately there is no statistical
significance to this conclusion.
To conclude, only the following conclusions could be drawn from this study: (1) A significantly higher
regeneration (%) of CA1 with respect to 207C was achieved. (2) The coiled-tube photoreactor proved
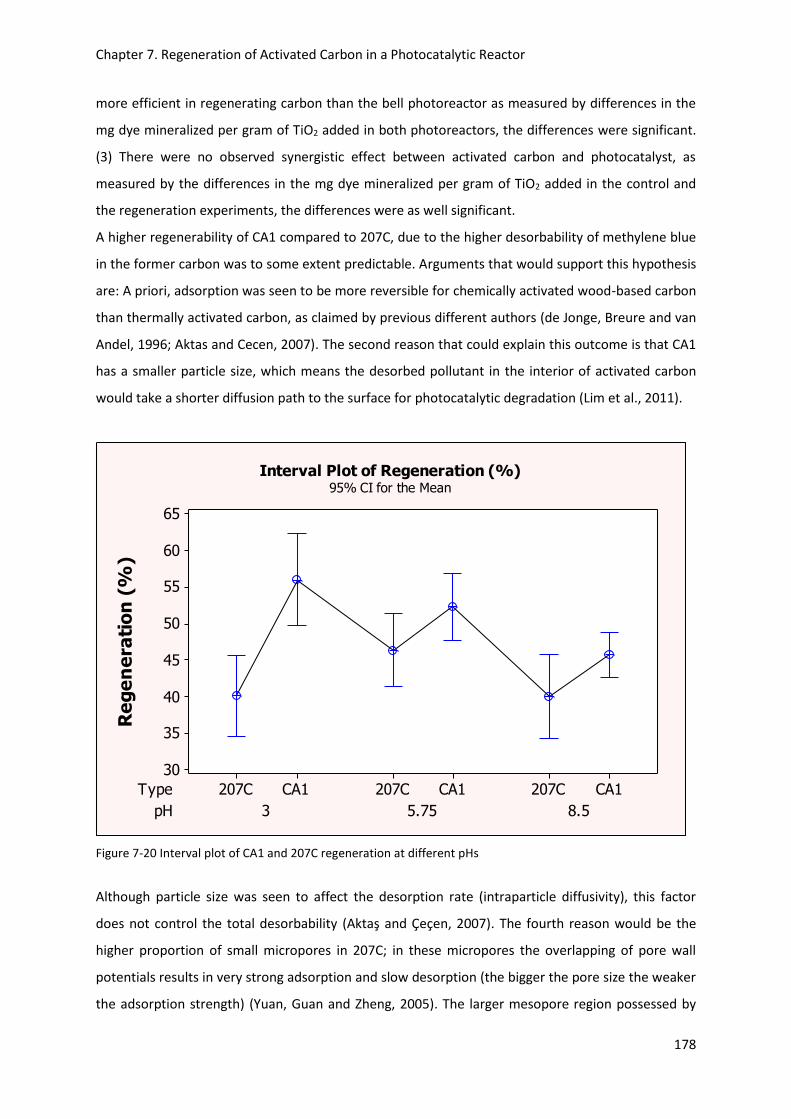
Chapter 7. Regeneration of Activated Carbon in a Photocatalytic Reactor
178
more efficient in regenerating carbon than the bell photoreactor as measured by differences in the
mg dye mineralized per gram of TiO2 added in both photoreactors, the differences were significant.
(3) There were no observed synergistic effect between activated carbon and photocatalyst, as
measured by the differences in the mg dye mineralized per gram of TiO2 added in the control and
the regeneration experiments, the differences were as well significant.
A higher regenerability of CA1 compared to 207C, due to the higher desorbability of methylene blue
in the former carbon was to some extent predictable. Arguments that would support this hypothesis
are: A priori, adsorption was seen to be more reversible for chemically activated wood-based carbon
than thermally activated carbon, as claimed by previous different authors (de Jonge, Breure and van
Andel, 1996; Aktas and Cecen, 2007). The second reason that could explain this outcome is that CA1
has a smaller particle size, which means the desorbed pollutant in the interior of activated carbon
would take a shorter diffusion path to the surface for photocatalytic degradation (Lim et al., 2011).
Figure 7-20 Interval plot of CA1 and 207C regeneration at different pHs
Although particle size was seen to affect the desorption rate (intraparticle diffusivity), this factor
does not control the total desorbability (Aktaş and Çeçen, 2007). The fourth reason would be the
higher proportion of small micropores in 207C; in these micropores the overlapping of pore wall
potentials results in very strong adsorption and slow desorption (the bigger the pore size the weaker
the adsorption strength) (Yuan, Guan and Zheng, 2005). The larger mesopore region possessed by
pH
Type
8.55.753
CA1207CCA1207CCA1207C
65
60
55
50
45
40
35
30
Re
ge
ne
rati
on
(%
)
Interval Plot of Regeneration (%)95% CI for the Mean

Chapter 7. Regeneration of Activated Carbon in a Photocatalytic Reactor
179
CA1 would provide a weaker uptake and molecules would migrate more easily to the TiO2 surface.
The last reason is that 207C would be less regenerable because the point of zero charge of the 207C-
TiO2 mixture is lower (5.3) than that of titania alone (~6.3) (Matos, 2001; Cordero, Chovelon, et al.,
2007; Cordero, Duchamp, et al., 2007; Matos, Chovelon, et al., 2009), which was seen to be
associated with lower photocatalytic degradation power of titania. Against arguments for the higher
regenerability of CA1 compared with 207C would be the fact that CA1 has a higher affinity for
methylene blue due to its more acidic character (stronger interaction, and hence lower desorption),
but it was mentioned by Aktaş and Çeçen (2007) that the activation process and the porosity are
likely to affect the extent of the desorption to a greater extent. From the point of view of the
regeneration of the carbons, L- and H- type character of the activated carbon was seen to influence
the extent of the photocatalytic degradation of TiO2 in a carbon-TiO2 mixture.
The observed synergy between carbon and titania in the case of an L-type activated carbon was
attributed to the interaction of titania with the oxygenated surface groups of activated carbon, these
carboxylic acid groups would promote e- transfer and improve photocatalysis (the pHPZC of the
mixture was found to be higher and lower than that of titania alone) (Matos, 2001; Cordero,
Chovelon, et al., 2007; Cordero, Duchamp, et al., 2007; Matos, Chovelon, et al., 2009; Lim et al.,
2011). On the other hand, H-type carbons would be better than L-type ones in dispersing TiO2 on
activated carbon surface ( due to their higher BET surface areas) and also its higher pHPZC would
increase the interfacial e- transfer (its basic functional groups were seen to inhibit the recombination
of photoelectrons by carrying the charge (García and Matos, 2010)).
The fact that adsorption time was 18 hours, and that desorption times are in general longer than the
adsorption times might suggest that acid and basic changes in pH were not enough to promote
desorption, and longer oxidation times (longer than 2 h) are required under the studied conditions
to produce capacity recoveries higher than the actually observed (approximately 60% in the case of
CA1). But then the adsorption step would not be justified, since conventional AOPs could mineralize
the same amount of pollutant in 2 hours.
7.4 ATR analysis of the regenerated carbon
ATR spectra of regenerated AC-TiO2 mixture were recorded and are presented here. The analysis of
the data consisted of identification of shifts in the absorption bands. All the peaks that show a shift
to a new wavelength signify an indication of the involvement of the functional groups in the
adsorption process (Etim et al., 2012). The analysis also included monitoring of the major absorption
bands at 1729, 1585, 1250 which are related to the degree of oxidation of activated carbon (Bansal
and Goyal, 2005). The reduced intensity of these bands may be interpreted as adsorption/reactive

Chapter 7. Regeneration of Activated Carbon in a Photocatalytic Reactor
180
sites or suggest physical coverage of the titania on its surface (X. Zhang and Lei, 2008). The data was
analysed at: (A) Constant pH = 5.75 and different amounts of titania (Figure 7-22 and Figure 7-23 for
207C; Figure 7-21 for CA1). (B) Constant pH = 8.5 and different amounts of titania (Figure 7-24 for
207C; Figure 7-26 and Figure 7-27 for CA1). (C) Fixed amount of titania R= 10.0 at different pH values
(Figure 7-25 for 207C; Figure 7-28 and Figure 7-29 for CA1).
The spectra at pH=5.75 for 207C are shown in Figure 7-22 and Figure 7-23; and the spectra for CA1
at the same working pH are shown in Figure 7-21. In the case of CA1, the CA1-TiO2 spectra at low
dose of titania (low R) showed some resemblance to the raw methylene blue spectra. Higher
additions of titania (higher R) produced a weakening of all the absorption bands. Very high R
(R=62.85) resembled the raw TiO2 spectra (Figure 7-21). A shift toward lower frequencies (from 3384
to 3043 cm-1) was detected as the addition of titania was decreased in this carbon (Figure 7-21).
Some authors (Araña, 2003a) described how shifts of OH vibrations could be related to changes in
the acid-base character of these hydroxyl groups. Shifts toward lower wavenumbers would indicate
an increment of the positive charge of these groups (Araña, 2003a). In the case of 207C (Figure
7-23), there is a shift toward higher wavenumbers and a slight decrease in the intensity of the band
at 1071-1073 (from 1071-1073 to 1090, 1076, 1113 cm-1). The decrease of this peak was associated
with the conversion of hydroxyl groups into acidic oxygen-containing functional groups on the
carbon surface (Liu et al., 2008). The band at 1581, attributed to pyrone-type surface groups (1610-
1580 cm-1) (Cordero, Chovelon, et al., 2007), suffered as well a shift toward lower wavenumbers as
the amount of titania was increased (from 1581 to 1580, 1575, 1572 cm-1 and from 1562 to 1558,
1561, 1534 depending on R values).
The ATR spectrum from the regenerated 207C-TiO2 mixture treated at basic pH was analysed at two
different values of R in Figure 7-24. The analogous ATR spectrum in the case of CA1 is shown in
Figure 7-26 and Figure 7-27. The ATR spectrum from the regenerated 207C-TiO2 mixture at constant
R=10.0 from Figure 7-25, compares the mixture after regeneration at two different pH treatments.
The analogous ATR spectrum in the case of CA1 is shown in Figure 7-28 and Figure 7-29. The basic
regeneration of 207C from Figure 7-24 might suggest the presence of alcohols due to broad OH
stretching at 3218, HCH bending around 1430, and C-O stretching at 1057. Appearance of the
carbonyl group at 1637 is also noticeable, possibly coming from ketones (although the peak at 2653
could suggest aldehydic source). The spectrum coming from 207C is difficult to interpret as the signal
is too weak. After basic pH regeneration of CA1 (Figure 7-27), two bands near 1250 (1260 and 1227)
appeared. This could be an indication of the presence of aryl esters. At pH=8.5 (Figure 7-27) and 3.0
(Figure 7-29) the CA1 IR bands at 1700, 1581 and 1208, 1185 cm-1 disappeared or shifted from the
spectrum and new bands around 1630, 1602, 1319 and 1121 appeared. These bands could be

Chapter 7. Regeneration of Activated Carbon in a Photocatalytic Reactor
181
associated with carboxylate ions (Arana et al., 2004). A shift toward higher frequencies (Figure 7-26
and Figure 7-28) was observed for the hydroxyl groups, from 3637 to 3695/3698 cm-1 at both pH
ranges. The higher the amount of TiO2 in the mixture, the higher was the shift (Figure 7-26). Raw-
TiO2 showed this band centred at 3694 and the mechanical mixture of both solids move this band
toward lower wavenumbers, not higher (Figure 7-30). The simple mechanical mixture of both solids
did not cause the appearance of new bands (Figure 7-31). Another important point is that the
surface treated at acid pH had less surface acidic groups than the CA1 surface treated with titania at
basic pH at the same R=10.0 (Figure 7-29). Moreover, at identical pH treatment, the amount of TiO2
in the system affected the position and identification of the bands compared with the raw CA1
spectra (Figure 7-26 and Figure 7-27). The C-O band at 1030 in the raw CA1 spectra from Figure 7-27
and Figure 7-29 appeared shifted to 1069 and 1057 in the regenerated CA1, depending on the
amount of TIO2.
Figure 7-21 Regenerated CA1 (with TiO2) in Coiled-tube (R=0.5 and 1.75) and Bell reactors (R=62.85) at pH=5.75

Chapter 7. Regeneration of Activated Carbon in a Photocatalytic Reactor
182
This shift was observable for CA1 under basic and acidic regeneration conditions as well as for 207C
(Figure 7-25), in this case shifting from 1073 to 1082 or 1088 depending on the pH. As mentioned
previously, carbonate and carboxylate species could have been formed after regeneration. The
bands centred at 1630, 1444, 1319 and 1263, 1121 would correspond to these species (Figure 7-27
and Figure 7-29), as suggested by (González et al., 2002; Mikhaylov and Lisachenko, 2009). The
carboxylate anions on L-type activated carbon surface were seen by other authors (Cordero,
Duchamp, et al., 2007). They implicated these anions as responsible for the synergy between
activated carbon and TiO2 detected in their work. The same authors also analysed the interaction of
an H-type activated carbon and titania (Cordero, Chovelon, et al., 2007), arriving at the conclusion
that the interaction between both solids occurred by means of oxygenated surface groups of
activated carbon. Figure 7-24 and Figure 7-25 showed changes after regeneration on the H-type
activated carbon, but as previously mentioned, the authors found it difficult to interpret due to the
low signal intensity. The interpretations of the effect of pH treatment and amount of titania on the
activated carbon spectrum should also include the interaction of the previously adsorbed methylene
blue on the carbon surface. Some authors (Vargas et al., 2011) suggested that the dye-carbon
interaction would produce a decrease in the band intensity between 3300 and 3600 with phenolic
and carboxylic acid origin, as well as, affecting the band centred at 1581 and 1435 (both due to
carboxylate anion deformations). Due to the difficulty that these multiple interactions present,
complementary analytical technique (e.g., x-ray photoelectron spectroscopy, XPS) are required to
better understand the interpretation of the observed shifts and band positions.

Chapter 7. Regeneration of Activated Carbon in a Photocatalytic Reactor
183
Figure 7-22 Regenerated 207C (with TiO2) in Coiled-tube reactor at pH=5.75
Figure 7-23 Regenerated 207C (with TiO2) in Bell reactor at pH=5.

Chapter 7. Regeneration of Activated Carbon in a Photocatalytic Reactor
184
Figure 7-24 Regenerated 207C (with TiO2) in Bell reactor at pH=8.5
Figure 7-25 Regenerated 207C (with TiO2) in Bell reactor at R=10.0

Chapter 7. Regeneration of Activated Carbon in a Photocatalytic Reactor
185
Figure 7-26 Regenerated CA1 (with TiO2) in Bell reactor at pH=8.5 between 4000 and 2400 cm-1
Figure 7-27 Regenerated CA1 (with TiO2) in Bell reactor at pH=8.5 between 1800 and 900 cm-1
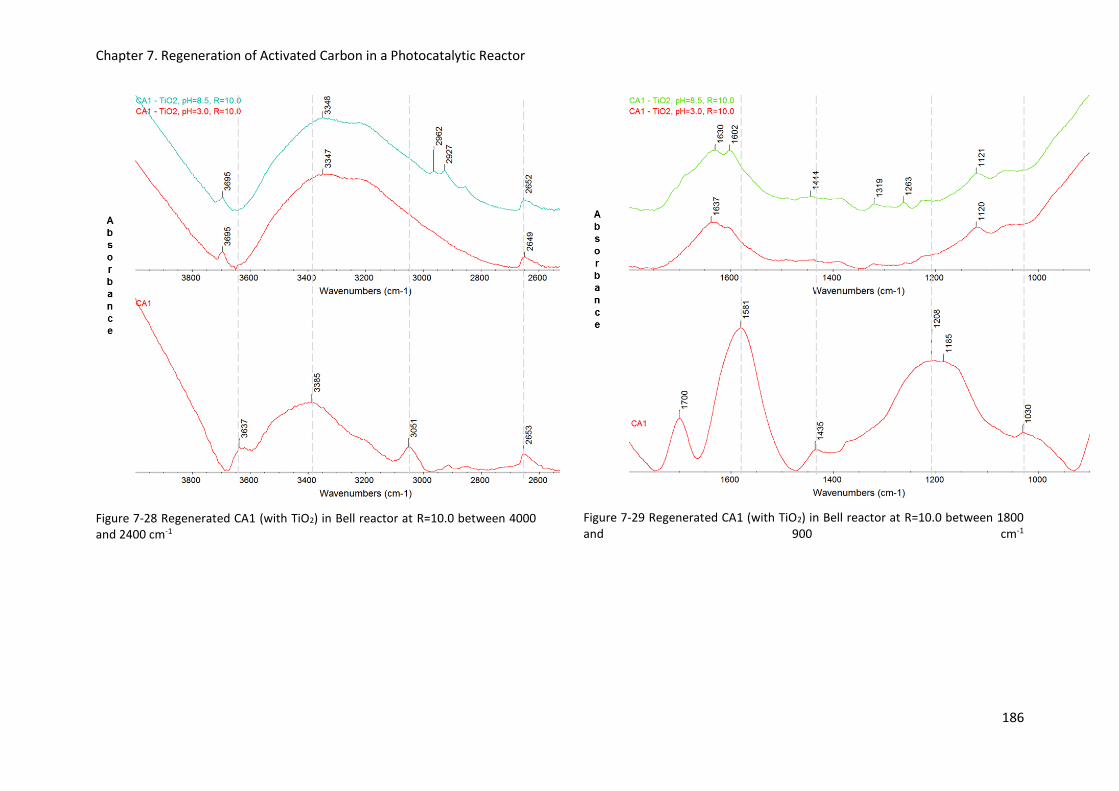
Chapter 7. Regeneration of Activated Carbon in a Photocatalytic Reactor
186
Figure 7-28 Regenerated CA1 (with TiO2) in Bell reactor at R=10.0 between 4000 and 2400 cm-1
Figure 7-29 Regenerated CA1 (with TiO2) in Bell reactor at R=10.0 between 1800 and 900 cm-1
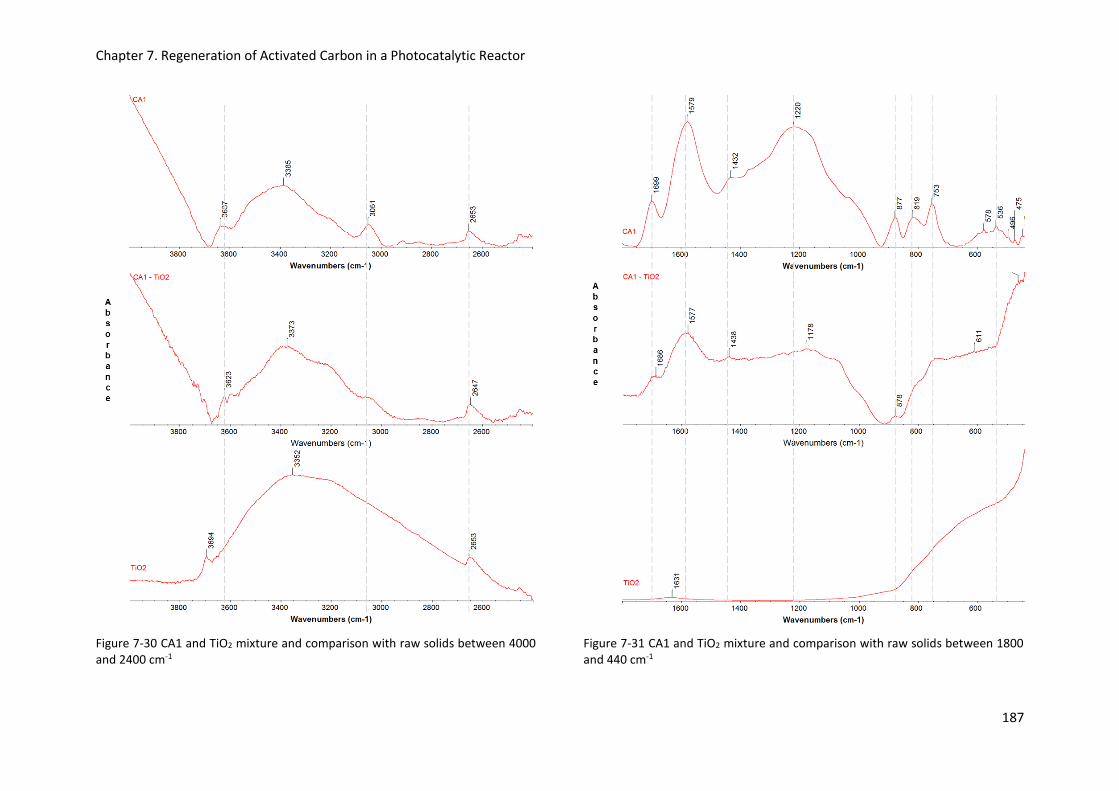
Chapter 7. Regeneration of Activated Carbon in a Photocatalytic Reactor
187
Figure 7-30 CA1 and TiO2 mixture and comparison with raw solids between 4000 and 2400 cm-1
Figure 7-31 CA1 and TiO2 mixture and comparison with raw solids between 1800 and 440 cm-1

Chapter 7. Regeneration of Activated Carbon in a Photocatalytic Reactor
188
7.5 Summary
Response surface methodology was applied to the study of the photocatalytic mineralization of
methylene blue by TiO2 in both coiled-tube and bell photoreactors. A good predictive model was
found using the photocatalytic dataset from the coiled-tube reactor; central composite design
highlighted TiO2 as the most important factor (its levels produced a greater change in the response).
The dye concentration was the second most important factor. Mineralization increased when the
photocatalyst concentration moved from its lower to higher levels. With respect to the dye, higher
concentrations of methylene blue lowered the mineralization. Complete mineralization of the dye
was achieved in this reactor using 3.07 mg/L of methylene blue at pH 6.5 with 0.4149 g/L TiO2.
Central composite design from a bell photoreactor proved to be faulty. Analysis of the distribution,
mean and variability of the sample were carried out to understand the cause of the flaw in the
design. Results indicated that the distribution of the data was narrow and centred at high
mineralization values. The amount of information contained in the sample was lower compared to
the data from coiled-tube mineralization experiments. This lack of variability was attributed to the
unsuitable TiO2 levels used in the design. However, this conclusion does not consider other
influential variables such the irradiation source (i.e., the tube used a low pressure 365 nm source,
whereas a medium pressure broad UV spectrum source was used with the bell photoreactor),
photoreactor design or the scale of the experiments. Comparisons between both photoreactors
suggested that coiled-tube photoreactor was a more efficient photoreactor than the bell in terms of
mass of dye mineralized per gram of photocatalyst used.
Regeneration studies using CA1 and 207C activated carbons were performed in both photoreactors.
Complete regeneration was not achieved in either case. In the bell reactor, analysis of regeneration
as response from the studied factors lacked significance and samples showed low variability. Results
were mainly attributed to the lack of optimization of the reactor, as previously mentioned. The
highest regeneration of CA1 was observed at acid pH, where desorption was likely to occur. Changes
in pH were attributed to pH main factor and its interaction with TiO2. pH changes in the oxidation
step were not produced by activated carbon or any interaction effects with the adsorbent. Results
from the regeneration in the coiled-tube photoreactor indicated an increase in regeneration of CA1
and a decrease in the pH during the oxidation step at higher concentration of the photocatalyst. In
the case of the regeneration of 207C, the addition of TiO2 lowered the regeneration and made the
suspension more basic during the photocatalytic step. Based on the central tendency and variability
of the regeneration samples from both adsorbents, it was found significant differences (95%
confidence interval) between the regeneration of the activated carbons, being higher in the case of
CA1. No statistical significance was found when their regeneration was compared with control

Chapter 7. Regeneration of Activated Carbon in a Photocatalytic Reactor
189
experiments (common photocatalysis), therefore synergistic effect was not observed in this study.
The low regeneration percentages achieved (lower than 65%) could be seen as a consequence of the
low irradiation times used (2 hours). Comparatively, the regeneration process mineralized lower
amounts of methylene blue than that mineralized by the same amount of TiO2 under conventional
photocatalysis treatment. These differences were statistically significant and suggest that the use of
the adsorption process do not add any benefit to photocatalysis under the present conditions.

Chapter 8. Conclusions and Future Work
190
8 CONCLUSIONS AND FUTURE WORK
This chapter is divided into three main sections, firstly a résumé of the principal findings, secondly
limitations of the study, and lastly recommendations for future work.
8.1 Discussion of the principal findings
A comprehensive study of the effect of TiO2 on the adsorption equilibrium and kinetics of methylene
blue onto two different types of activated carbon was performed. The analysis of changes in
isotherm parameters, changes in pH during the adsorption process, and surface charge analysis
based on zeta potential measurements was discussed in the adsorption equilibrium chapter (Chapter
5). The changes in the external mass transfer rate, intraparticle diffusion rate and the decay of
methylene blue concentration (decolouration) were examined in the adsorption kinetics chapter
(Chapter 6). Adsorption equilibria and kinetics of methylene blue adsorption onto activated carbon
have been extensively described by previous researchers. However, research on the effect of TiO2
during the adsorption process has not yet been undertaken. The work provides several
experimental evidence of the interaction between the semiconductor and the activated carbon
during the adsorption process. Both carbons were different regarding their pore size distribution,
activation process and chemical surface, and they showed opposite behaviour with TiO2 when both,
equilibrium and kinetics adsorption of methylene blue were evaluated.
In the case of the adsorption equilibrium, isotherm results showed that CA1 is a carbon which has a
more heterogeneous nature and wider pore size ranges (faster uptake), while 207C has narrow
pores (gradual uptake, longer time). Irrespective of whether the equilibrium was reached or not,
smaller pores were involved in the adsorption of methylene blue onto 207C as compared with CA1,
and the interaction between the dye and 207C was stronger based on the comparison of their
isotherm parameters. When TiO2 was added to the suspension, higher values in homogeneity and
energy of adsorption were measured for the more acidic CA1 as compared with the base case (only
dye and carbon). Two explanations were suggested, one that adsorption took place in narrower
pores, and the other that stronger lateral dye-dye interactions occurred. If TiO2 was in the
suspension, the surface area covered by methylene blue at pseudo-equilibrium conditions (contact
time, 1 h) was of the same magnitude as for equilibrium conditions (contact time, 18 h). However,
contrasting results were found for 207C. In this case, TiO2 decreased the capacity of the carbon, and
a weaker energy of interaction dye-207C, and an increase in heterogeneity as compared with the
base case were found, which suggested that larger pores were participating in the adsorption and/or

Chapter 8. Conclusions and Future Work
191
the interaction between dye molecules decreased. During these equilibrium experiments, TiO2 was
correlated with changes in pH in CA1 but not in 207C. These changes were positive, therefore the
higher the amount of TiO2 in the mixture, the higher was the changes in pH measured for CA1.
In the case of adsorption kinetics experiments, analysis revealed that methylene blue interacted
mainly with activated carbon, and the interaction of the dye with TiO2 was unimportant. The
importance of TiO2 in the removal was higher for 207C than for CA1. In both carbons, high additions
of TiO2 improved the removal. Furthermore, the mass of TiO2 was seen to have a larger effect on
the removal of methylene blue at shorter contact times. TiO2 had a positive effect on the methylene
blue uptake if the amount of photocatalyst was high at high amounts of carbon, and low at low
amounts of carbon. However, if the amount of TiO2 was high at low levels of adsorbent (high ratio
TiO2/carbon), a negative effect on the uptake was observed. The interaction carbon-dye was
important for changing the mean response KF (external mass transfer rate) only in 207C, and the
interaction produced a negative response on decoloration. The interaction carbon-dye was
important for changing the mean response Ki (intraparticle rate constant) only in CA1, and the
interaction produced a positive response on decoloration. A three way interaction between carbon,
dye and photocatalyst was observed only in the wood-based CA1 carbon, followed in importance by
the interaction carbon dye. The sign of the three-way interaction was positive, therefore the
interaction set at its high level would increase the mean response Ki. This study suggested a
significant influence of the photocatalyst in the intraparticle diffusion of CA1, which was not
observed in the other carbon.
Changes in pH were measured during adsorption experiments. These changes in pH highlighted
contrasting behaviour between these two adsorbents and the semiconductor. On one hand,
experimental design showed that an interaction between 207C and TiO2 (stronger at low
concentrations of TiO2) reduced the pH of the suspension only at high level of 207C carbon. This
interaction was not shown for CA1, in this case the addition of TiO2 produced an increase in pH at
both high and low levels of CA1, and the effect was more important at high level of photocatalyst.
On the other hand, pH changes were also measured and analysed in an aqueous suspension of
carbon and TiO2. In this set of experiments, the acid and basic effect of TiO2 after measuring pH
changes in the suspension of 207C and CA1, respectively, was noticed again. Results indicated that
the measured basic effect on the pH for CA1 could be attributed to the addition of greater
concentration of TiO2 in the suspension (i.e., electrostatic attraction), but the acidification of pH was
linked to the interaction between 207C and TiO2 (i.e., specific adsorption as suggested by zeta

Chapter 8. Conclusions and Future Work
192
potential values). This interaction was hypothesised to occur between the oxygen from TiO2 and the
surface of the thermally-activated 207C carbon. The increase in zeta potential observed in TiO2-207C
mixtures (from negative to positive zeta potential) would lead to increased repulsion of the cationic
dye from the surface, thus lowering its adsorption. However, the zeta potential of the TiO2-CA1
mixture was consistently negative for the studied range of conditions, which will favour adsorption
of the dye to a greater extent than was the case for 207C. These experiments also revealed that the
pHPZC of the 207C-TiO2 mixture was occurred at a lower pH than the one for the raw solids, which
was seen by many researchers as detrimental to the photoactivity of TiO2 during photocatalysis.
These results suggest that a selective fixation of TiO2 on the 207C was seen to reduce the adsorption
of methylene blue onto the carbon. A lower energy of adsorption between the dye and the
adsorbent was measured after the addition of TiO2 which may indicate the preference of TiO2 for
adsorption sites on the 207C surface of higher energy. A blockage of pores due to TiO2 in the case of
207C could be seen as another explanation. On the other hand, the electrostatic attraction between
CA1 and TiO2 was beneficial for the adsorption of methylene blue onto CA1.
This work aimed to evaluate a novel bell photocatalytic reactor for the photocatalytic process, and
to compare it with a more standard design. Photocatalytic operations need new hybrid systems and
improvements of reactor designs. Light intensity and distribution is one the main influential variables
controlling photocatalysis. In general, irradiation losses due to absorption from water and scattering
from TiO2 reduce the performance of photocatalytic reactors. The bell reactor is a slurry
photocatalytic reactor, artificially illuminated, with a configuration designed to avoid the restrictions
of other reactor types to the depth of light penetration. Optimal experimental design was the
method chosen to analyse the photocatalytic reactor performance. The novel bell photoreactor was
evaluated for the photocatalytic process using Central Composite Design in Chapter 7, and its
efficiency (i.e., measured in terms of milligrams of dye mineralized per gram of photocatalyst used)
was compared with a more standard design, a coiled-tube photoreactor. Results demonstrated a
higher efficiency for the coiled-tube reactor with respect to the novel bell photocatalytic reactor.
This higher performance of the coiled-tube reactor was observed not only in the direct
photocatalysis but also in the regeneration performance of both adsorbents. The lower values found
in the bell reactor were attributed to unsuitable TiO2 levels in the experimental design of the direct
photocatalysis.
The suitability of UV-C/TiO2 for the simultaneous mineralization of methylene blue adsorbed on
activated carbon and regeneration of the spent adsorbent was investigated. Under the studied

Chapter 8. Conclusions and Future Work
193
conditions, UV-C/TiO2 technology was suitable for the direct mineralization of the dye, achieving
almost complete mineralization in the experimental design. However, under the same conditions
regeneration percentages lower than 65% were found, lower than in the case of the basic 207C
carbon. The low regeneration percentages were achieved after 2 hour of irradiation, the same time
used by direct photocatalysis to mineralize the dye in solution. This indicates that the irradiation
time was shorter than required to provide complete desorption. In the photocatalytic regeneration
the first step is the desorption and diffusion of the adsorbate from within the activated carbon,
followed by the adsorption and oxidation on TiO2 surface, and lastly the desorption of the oxidized
product from the photocatalyst to the bulk solution. Desorption from within the carbon was seen to
be the controlling mechanism step.
Another of the objectives of this research was to establish whether a synergistic effect in the
mineralization between TiO2 and the carbon was present during the oxidation step of the
regeneration process. Previous studies relied mainly on the comparison of apparent first-order rate
constant of pollutant degradation of TiO2 against TiO2 and activated carbon mixture, instead of the
mineralization, to determine enhancements to TiO2 photoactivity. In this work, synergistic effects
between TiO2 and activated carbon during regeneration process were determined comparing
mineralization results between regeneration and control experiments. The amount of methylene
blue removed from the carbon, assuming it was all mineralized, was on average lower than the
amount mineralized in the control experiments (direct photocatalysis). This indicated a lack of
synergistic effect between photocatalyst and carbon during irradiation as measured by the
differences in mineralization. ATR spectrum analysis of regenerated CA1-TiO2 and 207C-TiO2
mixtures suggested the presence of carbonate and carboxylate species bands, which has been
associated in the literature with enhancements in the photocatalytic activity of TiO2, but could not
here be related to apparent improvements.
Factors such as pore size distribution and the activation process of the adsorbent can be crucial to
determine the extent of adsorption reversibility. Previous investigations have shown that TiO2
photocatalysis was also affected (i.e., the photocatalytic degradation rate) by the different physico-
chemical characteristics of the activated carbon used, such as the activation process, the oxygenated
surface groups or surface pH. This work also aimed to study which of both dye-saturated activated
carbons (i.e., granular coconut-based and basic 207C, and powdered wood-based and acid Norit
CA1), with distinctive pore size distribution and activation process, were more regenerable using UV-
C/TiO2 photocatalysis. Powdered activated carbon is more used in liquid phase application compared

Chapter 8. Conclusions and Future Work
194
to granular activated carbon due to its lower cost. However, its regeneration capability is currently
lower than that for granular activated carbon. Results showed, with 95% confidence that powdered
CA1 was more regenerable than granular 207C under the studied conditions, and this trend was
seen to be independent of the pH of the suspension. The higher regeneration of the acid CA1 with
respect to the basic 207C could be associated to its different activation process (chemically for the
former, and physically in the case of the latter), or due to the larger mesopore region of CA1, but it
could also be associated with other factors such as the previously described effect that TiO2 has on
the adsorption process of these two adsorbents, or in the different surface charge changes undergo
between the photocatalyst and the carbon (i.e., the point of zero charge of the 207-TiO2 mixture was
lower (5.3) than that of TiO2 alone (~6.3) which was seen to be associated with lower photocatalytic
degradation power of titania). If the effect of TiO2 in the adsorption is considered, for CA1, higher
regeneration percentages could be expected at higher TiO2 concentrations due to the lower strength
of the adsorption interaction at higher dose of TiO2 as compared with lower amount of
semiconductor which produced higher adsorption energies (i.e., lower reversibility of the
adsorption).
A weak but interesting link between the adsorption behaviour of CA1 and 207C activated carbons in
the presence of TiO2 and their ability to be regenerated by the semiconductor was not proved but it
is suggested by several findings. The type of activated carbon that was seen to be more regenerable
during the oxidation step of the regeneration process was the one having a positive adsorption
interaction with the photocatalyst, that is, an enhancement in the intraparticle diffusion rate, a
stronger energy of interaction of the dye within this carbon, and an interaction between the carbon
and the photocatalyst apparently of electrostatic nature.
8.2 Limitations of the study
This work is limited in several ways. It is not clear from this study that the observed differences in
adsorption after TiO2 addition are a consequence of surface differences, pore size distribution
differences or perhaps activation process dissimilarities. This could be further investigated by
isolating the dissimilarities and studying them one at a time. The activated carbons used in this study
were different in many aspects, which makes difficult to identify the carbon characteristics that
trigger the different response of TiO2 during adsorption. Both activated carbons come from different
activation processes, and also possess different pore size distribution. Using two carbons with similar
pore size distribution but different activation process, or two carbons with the same activation
process but different pore structure might be a better approach to determine how these differences
affects the effect of TiO2 on the adsorption equilibrium and kinetics.

Chapter 8. Conclusions and Future Work
195
Furthermore, the experiments performed do not clearly identify the relation between adsorption
effects and regeneration effects of the photocatalyst, which was one of the aims of this work. If the
mechanistic differences from these two processes are related in some way this needs to be further
investigated. This research question has not been answered before, and the utility of the
information has to be yet determined to establish the possible applications of these findings.
8.3 Recommendations for future work
This section includes several recommendations for future work based on the results presented in
this thesis:
The bell photocatalytic reactor has a great potential for the photocatalytic degradation of methylene
blue, as these findings seem to suggest. However, further evaluation and optimization of the bell
photocatalytic reactor is required due to the limitations of the present design. The efficiency of the
photoreactor can be optimized by tailoring appropriately the experimental conditions (i.e., lower
concentrations of photocatalyst as suggest the current findings) or by attempting a more efficient
setup (e.g., lower flow rate or a different light source).
With respect to the regeneration process, a pre-desorption treatment can be applied in order to
increase the desorption rate during the oxidation step. Pre-desorption treatments such as applying
heat have been attempted by several researchers. In this work pH was used to promote desorption
during the oxidation step of the photocatalytic regeneration. Results indicated that desorption of
methylene blue was likely to occur to a greater extent at acid pH, at least for one of activated
carbons (CA1). However, the effect of pH did not achieve complete desorption in the studied time.
This limitation indicates the need of further investigation on new pre-desorption strategies after the
adsorption step of the regeneration process, and also comparisons between pre-desorption
treatments to determine the best approach to achieve greater regeneration percentages. Similarly,
the study of broader range of conditions and other variables such as the light intensity can be
beneficial information for the regeneration process.
The relationships between the adsorption behaviour of the carbon in the presence of TiO2 and its
ability to be regenerated by the semiconductor could be another interesting objective for future
work. The effect of TiO2 on the adsorption of an adsorbate onto activated carbon has captured little
attention in the research literature. This work suggests a measurable effect of the photocatalyst on
the adsorption process itself that should be evaluated further using other compounds rather than
methylene blue, and also for different activated carbons than the used in this work. Similarly, the
Chapter 8. Conclusions and Future Work
196
effect of different types of TiO2 photocatalyst on the adsorption behaviour of the activated carbon
could be explored. At the same time, these experiments should be specifically designed to
understand how the interaction of TiO2 and the adsorbent in the adsorption step affects later its
regeneration.
Finally, the current trends in the application of activated carbon on TiO2/UV-C heterogeneous
photocatalytic technology call for the investigation of activated carbon to promote visible light
response on TiO2. The approaches developed and evaluated in this thesis can be tailored and applied
for further investigation in that area of research, with potential benefits yet to be discovered.

References
197
REFERENCES
Adani, K. G., Barley, R. W. and Pascoe, R. D. (2005) ‘Silver recovery from synthetic photographic and
medical X-ray process effluents using activated carbon’, Minerals Engineering, 18(13-14), pp. 1269–
1276. doi: 10.1016/j.mineng.2005.05.021.
Aktas, O. and Cecen, F. (2007) ‘Adsorption, desorption and bioregeneration in the treatment of 2-
chlorophenol with activated carbon’, Journal of Hazardous Materials, 141(3), pp. 769–777. doi:
10.1016/j.jhazmat.2006.07.050.
Aktaş, Ö. and Çeçen, F. (2006) ‘Effect of type of carbon activation on adsorption and its reversibility’,
Journal of Chemical Technology & Biotechnology, 81(1), pp. 94–101. doi: 10.1002/jctb.1363.
Aktaş, Ö. and Çeçen, F. (2007) ‘Bioregeneration of activated carbon: A review’, International
Biodeterioration & Biodegradation, 59(4), pp. 257–272. doi: 10.1016/j.ibiod.2007.01.003.
Alcañiz-Monge, J., Linares-Solano, A. and Rand, B. (2002) ‘Mechanism of adsorption of water in
carbon micropores as revealed by a study of activated carbon fibers’, Journal of Physical Chemistry B,
106(12), pp. 3209–3216. doi: 10.1021/jp014388b.
Alfano, O. M., Bahnemann, D., Cassano, A. E., Dillert, R. and Goslich, R. (2000) ‘Photocatalysis in
water environments using artificial and solar light’, 58, pp. 199–230.
Ali, M. and Ali, B. (2004) Handbook of Industrial Chemistry: Organic Chemicals. McGraw Hill
Professional.
Alinsafi, a., Evenou, F., Abdulkarim, E. M., Pons, M. N., Zahraa, O., Benhammou, a., Yaacoubi, a.
and Nejmeddine, a. (2007) ‘Treatment of textile industry wastewater by supported photocatalysis’,
Dyes and Pigments, 74(2), pp. 439–445. doi: 10.1016/j.dyepig.2006.02.024.
Allen, T. T. (2010) Introduction to Engineering Statistics and Lean Sigma: Statistical Quality Control
and Design of Experiments and Systems. Springer.
Alley, E. R. (2007) Water quality control handbook. McGraw-Hill.
Ania, C. O., Menéndez, J. a., Parra, J. B. and Pis, J. J. (2004) ‘Microwave-induced regeneration of
activated carbons polluted with phenol. A comparison with conventional thermal regeneration’,
Carbon, 42(7), pp. 1383–1387. doi: 10.1016/j.carbon.2004.01.010.
Antony, J. (2003) Design of Experiments for Engineers and Scientists. Butterworth-Heinemann.
Araña, J. (2003a) ‘TiO2 activation by using activated carbon as a support Part I. Surface
characterisation and decantability study’, Applied Catalysis B: Environmental, 44(2), pp. 161–172.
doi: 10.1016/S0926-3373(03)00107-3.
Araña, J. (2003b) ‘TiO2 activation by using activated carbon as a support Part II. Photoreactivity and
FTIR study’, Applied Catalysis B: Environmental, 44(2), pp. 153–160. doi: 10.1016/S0926-
3373(03)00075-4.
Arana, J., Doña-Rodriguez, J. M., Cabo, C. G. I., González-Diaz, O., Herrera-Melián, J. a. and Pérez-

References
198
Peña, J. (2004) ‘FTIR study of gas-phase alcohols photocatalytic degradation with TiO2 and AC-TiO2’,
Applied Catalysis B: Environmental, 53(4), pp. 221–232. doi: 10.1016/j.apcatb.2004.04.024.
Aravindhan, R., Rao, J. R. and Nair, B. U. (2007) ‘Removal of basic yellow dye from aqueous solution
by sorption on green alga Caulerpa scalpelliformis.’, Journal of hazardous materials, 142(1-2), pp.
68–76. doi: 10.1016/j.jhazmat.2006.07.058.
Areerachakul, N., Vigneswaran, S., Kandasamy, J. and Duangduen, C. (2008) ‘The Degradation of
Humic Substance using Continuous Photocatalysis Systems’, Separation Science and Technology,
43(1), pp. 93–112. doi: 10.1080/01496390701749214.
Arivoli, S. (2010) ‘Adsorption dynamics of methylene blue by acid activated carbon’, J Chem Pharm,
2(5), pp. 626–641.
Atun, G., Hisarli, G., Kurtoğlu, A. E. and Ayar, N. (2011) ‘A comparison of basic dye adsorption onto
zeolitic materials synthesized from fly ash.’, Journal of hazardous materials, 187(1-3), pp. 562–73.
doi: 10.1016/j.jhazmat.2011.01.075.
Augugliaro, V., Litter, M., Palmisano, L. and Soria, J. (2006) ‘The combination of heterogeneous
photocatalysis with chemical and physical operations: A tool for improving the photoprocess
performance’, Journal of Photochemistry and Photobiology C: Photochemistry Reviews, 7(4), pp.
127–144. doi: 10.1016/j.jphotochemrev.2006.12.001.
Bahnemann, D. (2004) ‘Photocatalytic water treatment: solar energy applications’, Solar Energy,
77(5), pp. 445–459. doi: 10.1016/j.solener.2004.03.031.
Balbuena, P. B. and Gubbins, K. E. (1993) ‘Theoretical Interpretation of Adsorption Behavior of
Simple Fluids in Slit Pores’, Langmuir, 9(7), pp. 1801–1814. doi: 10.1021/la00031a031.
Ballari, M. D. L. M., Brandi, R., Alfano, O. and Cassano, A. (2008) ‘Mass transfer limitations in
photocatalytic reactors employing titanium dioxide suspensions’, Chemical Engineering Journal,
136(1), pp. 50–65. doi: 10.1016/j.cej.2007.03.028.
Bandosz, T. J. (2006) Activated Carbon Surfaces in Environmental Remediation. Academic Press.
Bansal, R. C. and Goyal, M. (2005) Activated Carbon Adsorption. CRC Press.
Bayer, P., Heuer, E., Karl, U. and Finkel, M. (2005) ‘Economical and ecological comparison of granular
activated carbon (GAC) adsorber refill strategies.’, Water research, 39(9), pp. 1719–28. doi:
10.1016/j.watres.2005.02.005.
Bayramoglu, G., Altintas, B. and Arica, M. Y. (2009) ‘Adsorption kinetics and thermodynamic
parameters of cationic dyes from aqueous solutions by using a new strong cation-exchange resin’,
Chemical Engineering Journal, 152(2-3), pp. 339–346. doi: 10.1016/j.cej.2009.04.051.
Beaudoin, J. J., Patarachao, B., Raki, L. and Alizadeh, R. (2011) ‘Adsorption of methylene blue as a
descriptor of C–S–H nanostructure’, Cement and Concrete Composites. Elsevier Ltd, 33(2), pp. 246–
250. doi: 10.1016/j.cemconcomp.2010.10.011.
Benadjemia, M., Millière, L., Reinert, L., Benderdouche, N. and Duclaux, L. (2011) ‘Preparation,
characterization and Methylene Blue adsorption of phosphoric acid activated carbons from globe

References
199
artichoke leaves’, Fuel Processing Technology. Elsevier B.V., 92(6), pp. 1203–1212. doi:
10.1016/j.fuproc.2011.01.014.
Bhatkhande, D. S., Pangarkar, V. G. and Beenackers, A. a?C?M (2002) ‘Photocatalytic degradation for
environmental applications - a review’, Journal of Chemical Technology & Biotechnology, 77(1), pp.
102–116. doi: 10.1002/jctb.532.
Bhatnagar, A., Vilar, V. J. P., Botelho, C. M. S. and Boaventura, R. a R. (2010) ‘Coconut-based
biosorbents for water treatment--a review of the recent literature.’, Advances in colloid and
interface science. Elsevier B.V., 160(1-2), pp. 1–15. doi: 10.1016/j.cis.2010.06.011.
Billo, E. J. (2004) Excel for Chemists: A Comprehensive Guide. Wiley.
Bottani, E. J. and Tascón, J. M. D. (2008) Adsorption By Carbons. Elsevier.
Boyjoo, Y., Ang, M. and Pareek, V. (2013) ‘Some aspects of photocatalytic reactor modeling using
computational fluid dynamics’, Chemical Engineering Science. Elsevier, 101, pp. 764–784. doi:
10.1016/j.ces.2013.06.035.
Braham, R. J. and Harris, A. T. (2009) ‘Review of Major Design and Scale-up Considerations for Solar
Photocatalytic Reactors’, Industrial & Engineering Chemistry Research, 48(19), pp. 8890–8905. doi:
10.1021/ie900859z.
Brunauer, S. (1945) The adsorption of gases and vapors. Volume I: Physical Adsorption. Princeton
University Press.
Bujdák, J. (2006) ‘Effect of the layer charge of clay minerals on optical properties of organic dyes. A
review’, Applied Clay Science, 34(1-4), pp. 58–73. doi: 10.1016/j.clay.2006.02.011.
Carey, F. A. and Sundberg, R. J. (2007) Advanced Organic Chemistry. Springer.
Carp, O. (2004) ‘Photoinduced reactivity of titanium dioxide’, Progress in Solid State Chemistry, 32(1-
2), pp. 33–177. doi: 10.1016/j.progsolidstchem.2004.08.001.
Cassano, A. E. and Alfano, O. M. (2000) ‘Reaction engineering of suspended solid heterogeneous
photocatalytic reactors’, 58, pp. 167–197.
Cazetta, A. L., Vargas, A. M. M., Nogami, E. M., Kunita, M. H., Guilherme, M. R., Martins, A. C., Silva,
T. L., Moraes, J. C. G. and Almeida, V. C. (2011) ‘NaOH-activated carbon of high surface area
produced from coconut shell: Kinetics and equilibrium studies from the methylene blue adsorption’,
Chemical Engineering Journal, 174, pp. 117– 125. doi: 10.1016/j.cej.2011.08.058.
Cenens, J. and Schoonheydt, R. (1988) ‘Visible spectroscopy of methylene blue on hectorite, laponite
B and barasym in aqueous suspension’, Clays and Clay Minerals. Clay Minerals Soc, 36(3), pp. 214–
224. doi: 10.1346/CCMN.1988.0360302.
Chen, C., Ibekwe-SanJuan, F. and Hou, J. (2010) ‘The Structure and Dynamics of Cocitation Cluster: A
Multiple-Perspective Cocitation Analysis’, Journal of the American Society for Information Science
and Technology, 61(7), pp. 1386–1409. doi: 10.1002/asi.21309.
Chen, J. P. and Lin, M. (2001) ‘Equilibrium and kinetics of metal ion adsorption onto a commercial H-

References
200
type granular activated carbon: experimental and modeling studies.’, Water research, 35(10), pp.
2385–94.
Cheng, M., Yang, S. and Hsieh, C. (2007) ‘Thermal Regeneration of Activated Carbons Exhausted with
Phenol Compound’, Separation Science and Technology, 42(3), pp. 639–652. doi:
10.1080/01496390601070059.
Cheremisinoff, N. P. (2002) Handbook of Water and Wastewater Treatment Technologies.
Butterworth-Heinemann.
Cheshire, A. (2012) Transformers! Normal Data in Disguise?, The Minitab Blog. Available at:
http://blog.minitab.com/blog/quality-data-analysis-and-statistics/transformers-normal-data-in-
disguise (Accessed: 1 February 2015).
Chingombe, P., Saha, B. and Wakeman, R. J. (2006) ‘Sorption of atrazine on conventional and surface
modified activated carbons.’, Journal of colloid and interface science, 302(2), pp. 408–16. doi:
10.1016/j.jcis.2006.06.065.
Chong, M. N., Jin, B., Chow, C. W. K. and Saint, C. (2010) ‘Recent developments in photocatalytic
water treatment technology: a review.’, Water research. Elsevier Ltd, 44(10), pp. 2997–3027. doi:
10.1016/j.watres.2010.02.039.
Cobo, M. J., López-Herrera, a. G., Herrera-Viedma, E. and Herrera, F. (2011) ‘An approach for
detecting, quantifying, and visualizing the evolution of a research field: A practical application to the
Fuzzy Sets Theory field’, Journal of Informetrics. Elsevier Ltd, 5(1), pp. 146–166. doi:
10.1016/j.joi.2010.10.002.
Corapcioglu, M. and Huang, C. (1987) ‘The surface acidity and characterization of some commercial
activated carbons’, Carbon, 25(4), pp. 569–578.
Cordero, T., Chovelon, J.-M., Duchamp, C., Ferronato, C. and Matos, J. (2007) ‘Surface nano-
aggregation and photocatalytic activity of TiO2 on H-type activated carbons’, Applied Catalysis B:
Environmental, 73(3-4), pp. 227–235. doi: 10.1016/j.apcatb.2006.10.012.
Cordero, T., Duchamp, C., Chovelon, J.-M., Ferronato, C. and Matos, J. (2007) ‘Influence of L-type
activated carbons on photocatalytic activity of TiO2 in 4-chlorophenol photodegradation’, Journal of
Photochemistry and Photobiology A: Chemistry, 191(2-3), pp. 122–131. doi:
10.1016/j.jphotochem.2007.04.012.
Crittenden, J. C., Suri, R. P. S., Perram, D. L. and Hand, D. W. (1997) ‘Decontamination of water using
adsorption and photocatalysis’, Water Research. Elsevier, 31(3), pp. 411–418.
Dai, M. (1994) ‘The effect of zeta potential of activated carbon on the adsorption of dyes from
aqueous solution’, pp. 223–228.
Dastgheib, S. a and Karanfil, T. (2005) ‘The effect of the physical and chemical characteristics of
activated carbons on the adsorption energy and affinity coefficient of Dubinin equation.’, Journal of
colloid and interface science, 292(2), pp. 312–21. doi: 10.1016/j.jcis.2005.06.017.
Dean, A. M. and Voss, D. (1999) Design and Analysis of Experiments. Springer Science & Business

References
201
Media.
Dhodapkar, R., Rao, N. N., Pande, S. P., Nandy, T. and Devotta, S. (2007) ‘Adsorption of cationic dyes
on Jalshakti®, super absorbent polymer and photocatalytic regeneration of the adsorbent’, Reactive
and Functional Polymers. Elsevier, 67(6), pp. 540–548. doi: 10.1016/j.reactfunctpolym.2007.03.007.
Domals, G. (1996) ‘Application of thermal analysis techniques in activated carbon production’, pp. 8–
12.
Duong, D. Do (1998) Adsorption Analysis: Equilibria and Kinetics. Imperial College Press.
Duri, B. Al (1988) ‘Basic dye adsorption on carbon using a solid-phase diffusion model’, The Chemical
Engineering Journal, 38, pp. 23–31.
Ebadi, A., Soltan Mohammadzadeh, J. S. and Khudiev, A. (2009) ‘What is the correct form of BET
isotherm for modeling liquid phase adsorption?’, Adsorption, 15(1), pp. 65–73. doi: 10.1007/s10450-
009-9151-3.
El-Halwany, M. M. (2010) ‘Study of adsorption isotherms and kinetic models for Methylene Blue
adsorption on activated carbon developed from Egyptian rice hull (Part II)’, Desalination. Elsevier
B.V., 250(1), pp. 208–213. doi: 10.1016/j.desal.2008.07.030.
Elqada, E., Allen, S. and Walker, G. (2008) ‘Adsorption of basic dyes from aqueous solution onto
activated carbons’, Chemical Engineering Journal, 135(3), pp. 174–184. doi:
10.1016/j.cej.2007.02.023.
El-Sharkawy, E. a, Soliman, A. Y. and Al-Amer, K. M. (2007) ‘Comparative study for the removal of
methylene blue via adsorption and photocatalytic degradation.’, Journal of colloid and interface
science, 310(2), pp. 498–508. doi: 10.1016/j.jcis.2007.02.013.
El-Sheikh, A. H., Al-Degs, Y. S., Newman, A. P. and Lynch, D. E. (2007) ‘Oxidized activated carbon as
support for titanium dioxide in UV-assisted degradation of 3-chlorophenol’, Separation and
Purification Technology, 54(1), pp. 117–123. doi: 10.1016/j.seppur.2006.08.020.
Ersoy, B., Sariisik, A., Dikmen, S. and Sariisik, G. (2010) ‘Characterization of acidic pumice and
determination of its electrokinetic properties in water’, Powder Technology. Elsevier B.V., 197(1-2),
pp. 129–135. doi: 10.1016/j.powtec.2009.09.005.
Etim, U. J., Umoren, S. a. and Eduok, U. M. (2012) ‘Coconut coir dust as a low cost adsorbent for the
removal of cationic dye from aqueous solution’, Journal of Saudi Chemical Society. King Saud
University. doi: 10.1016/j.jscs.2012.09.014.
Fathinia, M. and Khataee, a. R. (2013) ‘Residence time distribution analysis and optimization of
photocatalysis of phenazopyridine using immobilized TiO2 nanoparticles in a rectangular
photoreactor’, Journal of Industrial and Engineering Chemistry. The Korean Society of Industrial and
Engineering Chemistry, 19(5), pp. 1525–1534. doi: 10.1016/j.jiec.2013.01.019.
Frost, J. (2012) How to Identify the Distribution of Your Data using Minitab, The Minitab Blog.
Available at: http://blog.minitab.com/blog/adventures-in-statistics/how-to-identify-the-distribution-
of-your-data-using-minitab.

References
202
Frost, J. (2014) How to Interpret a Regression Model with Low R-squared and Low P values, The
Minitab Blog. Available at: http://blog.minitab.com/blog/adventures-in-statistics/how-to-interpret-
a-regression-model-with-low-r-squared-and-low-p-values.
Gabarrell, X., Font, M., Vicent, T., Caminal, G., Sarrà, M. and Blánquez, P. (2012) ‘A comparative life
cycle assessment of two treatment technologies for the Grey Lanaset G textile dye: biodegradation
by Trametes versicolor and granular activated carbon adsorption’, The International Journal of Life
Cycle Assessment, 17(5), pp. 613–624. doi: 10.1007/s11367-012-0385-z.
García, A. and Matos, J. (2010) ‘Photocatalytic Activity of TiO2 on Activated Carbon Under Visible
Light in the Photodegradation of Phenol’, Open Materials Science Journal, (1), pp. 2–4.
Garcia Einschlag, F. S. (2011) Waste water - Treatment and reutilization. InTech. doi: 10.5772/656.
Ghimbeu, C. M., Gadiou, R., Dentzer, J., Schwartz, D. and Vix-Guterl, C. (2010) ‘Influence of surface
chemistry on the adsorption of oxygenated hydrocarbons on activated carbons.’, Langmuir : the ACS
journal of surfaces and colloids, 26(24), pp. 18824–33. doi: 10.1021/la103405j.
Giles, C. H., MacEwan, T. H., Nakhwa, S. N. and Smith, D. (1960) ‘786. Studies in adsorption. Part XI. A
system of classification of solution adsorption isotherms, and its use in diagnosis of adsorption
mechanisms and in measurement of specific surface areas of solids’, Journal of the Chemical Society
(Resumed), 846, pp. 3973–3993. doi: 10.1039/jr9600003973.
Gogate, P. R. and Pandit, A. B. (2004) ‘A review of imperative technologies for wastewater treatment
I: oxidation technologies at ambient conditions’, Advances in Environmental Research, 8(3-4), pp.
501–551. doi: 10.1016/S1093-0191(03)00032-7.
Gómez, V. and Callao, M. P. (2008) ‘Modeling the adsorption of dyes onto activated carbon by using
experimental designs.’, Talanta, 77(1), pp. 84–9. doi: 10.1016/j.talanta.2008.05.049.
Gómez-Serrano, V. (1994) ‘Oxidation of activated carbon by hydrogen peroxide. Study of surface
functional groups by FT-ir’, Fuel, 73(3), pp. 387–395.
Gómez-Serrano, V., Acedo-Ramos, M. a., López-Peinado, a. J. and Valenzuela-Calahorro, C. (1995)
‘Thermogravimetric study of activated carbon oxidized with H2O2’, Thermochimica Acta, 254, pp.
249–260. doi: 10.1016/0040-6031(94)02130-G.
González, O. D., Viera, A., Peña, J. P., Sosa, P. M. M., Jiménez, V. E. and D, O. G. (2002) ‘TiO2 -
photocatalysis as a tertiary treatment of naturally treated wastewater’, Catalysis Today, 76, pp. 279–
289.
Gorbatchuk, V. V., Ziganshin, M. a., Mironov, N. a. and Solomonov, B. N. (2001) ‘Homotropic
cooperative binding of organic solvent vapors by solid trypsin’, Biochimica et Biophysica Acta (BBA) -
Protein Structure and Molecular Enzymology, 1545(1-2), pp. 326–338. doi: 10.1016/S0167-
4838(00)00298-3.
Gregg, S. J. and Sing, K. S. W. (1991) Adsorption, surface area, and porosity. Academic Press.
Guillard, C. (2003) ‘Influence of chemical structure of dyes, of pH and of inorganic salts on their
photocatalytic degradation by TiO2 comparison of the efficiency of powder and supported TiO2’,

References
203
Journal of Photochemistry and Photobiology A: Chemistry, 158(1), pp. 27–36. doi: 10.1016/S1010-
6030(03)00016-9.
Guillard, C., Puzenat, E., Lachheb, H., Houas, A. and Herrmann, J.-M. (2005) ‘Why inorganic salts
decrease the TiO2 photocatalytic efficiency’, International Journal of Photoenergy, 7(1), pp. 1–9. doi:
10.1155/S1110662X05000012.
Guo, Y. and Du, E. (2012) ‘The Effects of Thermal Regeneration Conditions and Inorganic Compounds
on the Characteristics of Activated Carbon Used in Power Plant’, Energy Procedia, 17, pp. 444–449.
doi: 10.1016/j.egypro.2012.02.118.
Gupta, S. and Babu, B. V. (2009) ‘Utilization of waste product (tamarind seeds) for the removal of
Cr(VI) from aqueous solutions: Equilibrium, kinetics, and regeneration studies’, Journal of
Environmental Management. Elsevier Ltd, 90(10), pp. 3013–3022. doi:
10.1016/j.jenvman.2009.04.006.
Gupta, V. K., Gupta, B., Rastogi, A., Agarwal, S. and Nayak, A. (2011) ‘Pesticides removal from waste
water by activated carbon prepared from waste rubber tire’, Water Research. Elsevier Ltd, 45(13),
pp. 4047–4055. doi: 10.1016/j.watres.2011.05.016.
Hadi, M., Samarghandi, M. R. and McKay, G. (2010) ‘Equilibrium two-parameter isotherms of acid
dyes sorption by activated carbons: Study of residual errors’, Chemical Engineering Journal. Elsevier
B.V., 160(2), pp. 408–416. doi: 10.1016/j.cej.2010.03.016.
Hamdaoui, O. and Naffrechoux, E. (2007) ‘Modeling of adsorption isotherms of phenol and
chlorophenols onto granular activated carbon. Part I. Two-parameter models and equations allowing
determination of thermodynamic parameters.’, Journal of hazardous materials, 147(1-2), pp. 381–
94. doi: 10.1016/j.jhazmat.2007.01.021.
Hameed, B. H. and El-Khaiary, M. I. (2008) ‘Batch removal of malachite green from aqueous solutions
by adsorption on oil palm trunk fibre: equilibrium isotherms and kinetic studies.’, Journal of
hazardous materials, 154(1-3), pp. 237–44. doi: 10.1016/j.jhazmat.2007.10.017.
Hao, X., Quach, L., Korah, J., Spieker, W. . and Regalbuto, J. R. (2004) ‘The control of platinum
impregnation by PZC alteration of oxides and carbon’, Journal of Molecular Catalysis A: Chemical,
219(1), pp. 97–107. doi: 10.1016/j.molcata.2004.04.026.
He, Q., Chen, B., Pei, J., Qiu, B., Mitra, P. and Giles, L. (2009) ‘Detecting topic evolution in scientific
literature: how can citations help?’, in Proceedings of the 18th ACM conference on Information and
knowledge management. New York, USA, pp. 957–966.
Herrmann, J. (1999) ‘Heterogeneous photocatalysis: fundamentals and applications to the removal
of various types of aqueous pollutants’, Catalysis Today, 53(1), pp. 115–129. doi: 10.1016/S0920-
5861(99)00107-8.
Herrmann, J., Matos, J., Disdier, J., Guillard, C. and Laine, J. (1999) ‘Solar photocatalytic degradation
of 4-chlorophenol using the synergistic effect between titania and activated carbon in aqueous
suspension’, 54, pp. 255–265.
Hill, T. L. (1951) ‘Thermodynamics of adsorption’, Transactions of the Faraday Society, 47, p. 376.

References
204
doi: 10.1039/tf9514700376.
Hinkelmann, K. and Kempthorne, O. (2007) Design and Analysis of Experiments, Introduction to
Experimental Design. John Wiley & Sons.
Hjaila, K., Baccar, R., Sarrà, M., Gasol, C. M. and Blánquez, P. (2013) ‘Environmental impact
associated with activated carbon preparation from olive-waste cake via life cycle assessment.’,
Journal of environmental management. Elsevier Ltd, 130, pp. 242–7. doi:
10.1016/j.jenvman.2013.08.061.
Houas, a (2001) ‘Photocatalytic degradation pathway of methylene blue in water’, Applied Catalysis
B: Environmental, 31(2), pp. 145–157. doi: 10.1016/S0926-3373(00)00276-9.
Huling, S. and Arnold, R. (2000) ‘Contaminant adsorption and oxidation via Fenton reaction’, Journal
of Environmental Engineering, 126(7), pp. 595–600.
Huling, S. G., Jones, P. K., Ela, W. P. and Arnold, R. G. (2005) ‘Fenton-driven chemical regeneration of
MTBE-spent GAC.’, Water research, 39(10), pp. 2145–53. doi: 10.1016/j.watres.2005.03.027.
Huling, S. G., Jones, P. K. and Lee, T. R. (2007) ‘Iron optimization for Fenton-driven oxidation of
MTBE-spent granular activated carbon.’, Environmental science & technology, 41(11), pp. 4090–6.
Huling, S. G., Kan, E., Caldwell, C. and Park, S. (2012) ‘Fenton-driven chemical regeneration of MTBE-
spent granular activated carbon--a pilot study.’, Journal of hazardous materials. Elsevier B.V., 205-
206, pp. 55–62. doi: 10.1016/j.jhazmat.2011.12.003.
Huling, S. G., Kan, E. and Wingo, C. (2009) ‘Fenton-driven regeneration of MTBE-spent granular
activated carbon—Effects of particle size and iron amendment procedures’, Applied Catalysis B:
Environmental, 89(3-4), pp. 651–658. doi: 10.1016/j.apcatb.2009.02.002.
Huling, S. G., Ko, S., Park, S. and Kan, E. (2011) ‘Persulfate oxidation of MTBE- and chloroform-spent
granular activated carbon.’, Journal of hazardous materials. Elsevier B.V., 192(3), pp. 1484–90. doi:
10.1016/j.jhazmat.2011.06.070.
Hunger, K. (2007) Industrial Dyes: Chemistry, Properties, Applications. John Wiley & Sons.
Ida, J., Watanabe, T., Watanabe, S., Matsuyama, T. and Yamamoto, H. (2014) ‘Photocatalytic packed
bed reactor design for efficient UV light utilization’, Separation and Purification Technology. Elsevier
B.V., 134, pp. 66–72. doi: 10.1016/j.seppur.2014.07.026.
Imoberdorf, G. E., Taghipour, F., Keshmiri, M. and Mohseni, M. (2008) ‘Predictive radiation field
modeling for fluidized bed photocatalytic reactors’, Chemical Engineering Science, 63(16), pp. 4228–
4238. doi: 10.1016/j.ces.2008.05.022.
Inglezakis, V. J. (2007) ‘Solubility-normalized Dubinin–Astakhov adsorption isotherm for ion-
exchange systems’, Microporous and Mesoporous Materials, 103(1-3), pp. 72–81. doi:
10.1016/j.micromeso.2007.01.039.
Inglezakis, V. J. and Grigoropoulou, H. P. (2001) ‘Applicability of Simplified Models for the Estimation
of Ion Exchange Diffusion Coefficients in Zeolites.’, Journal of colloid and interface science, 234(2),
pp. 434–441. doi: 10.1006/jcis.2000.7304.
References
205
Inglezakis, V. J. and Poulopoulos, S. G. (2006) Adsorption, Ion Exchange And Catalysis: Design of
Operations And Environmental Applications. Elsevier.
Ishizaki, C. and Marti, I. (1981) ‘Surface oxide structures on a commercial activated carbon’, Carbon,
19(6).
de Jonge, R. J., Breure, A. M. and van Andel, J. G. (1996) ‘Reversibility of adsorption of aromatic
compounds onto powdered activated carbon (PAC)’, Science. Elsevier, 30(4), pp. 883–892.
Kannan, N. and Sundaram, M. M. (2001) ‘Kinetics and mechanism of removal of methylene blue by
adsorption on various carbons—a comparative study’, Dyes and Pigments, 51(1), pp. 25–40. doi:
10.1016/S0143-7208(01)00056-0.
Karaca, S., Gu, A., Gürses, A., Açikyildiz, M. and Ejder (Korucu), M. (2008) ‘Adsorption of cationic dye
from aqueous solutions by activated carbon’, Microporous and Mesoporous Materials, 115(3), pp.
376–382. doi: 10.1016/j.micromeso.2008.02.008.
Kas, M. (2011) Structures and Statistics of Citation Networks.
Khorramfar, S., Mahmoodi, N. M., Arami, M. and Bahrami, H. (2011) ‘Oxidation of dyes from colored
wastewater using activated carbon/hydrogen peroxide’, Desalination. Elsevier B.V., 279(1-3), pp.
183–189. doi: 10.1016/j.desal.2011.06.005.
Kim, J. R., Santiano, B., Kim, H. and Kan, E. (2013) ‘Heterogeneous Oxidation of Methylene Blue with
Surface-Modified Iron-Amended Activated Carbon’, American Journal of Analytical Chemistry,
2013(July), pp. 115–122. doi: 10.4236/ajac.2013.47A016.
Knaebel, K. S. (1999) ‘The basics of adsorber design’, Chemical Engineering, April, pp. 92–103.
Konstantinou, I. K. and Albanis, T. a (2004) ‘TiO2-assisted photocatalytic degradation of azo dyes in
aqueous solution: kinetic and mechanistic investigations’, Applied Catalysis B: Environmental, 49(1),
pp. 1–14. doi: 10.1016/j.apcatb.2003.11.010.
Kumar, K. V. and Porkodi, K. (2007) ‘Mass transfer, kinetics and equilibrium studies for the
biosorption of methylene blue using Paspalum notatum.’, Journal of hazardous materials, 146(1-2),
pp. 214–26. doi: 10.1016/j.jhazmat.2006.12.010.
Kumar, K. V. and Sivanesan, S. (2006) ‘Equilibrium data, isotherm parameters and process design for
partial and complete isotherm of methylene blue onto activated carbon.’, Journal of hazardous
materials, 134(1-3), pp. 237–44. doi: 10.1016/j.jhazmat.2005.11.002.
Lachheb, H., Puzenat, E., Houas, A., Ksibi, M., Elaloui, E., Guillard, C. and Herrmann, J.-M. (2002)
‘Photocatalytic degradation of various types of dyes (Alizarin S, Crocein Orange G, Methyl Red,
Congo Red, Methylene Blue) in water by UV-irradiated titania’, Applied Catalysis B: Environmental,
39(1), pp. 75–90. doi: 10.1016/S0926-3373(02)00078-4.
Lang, A. R. (2008) Dyes and Pigments: New Research. Nova Science Publishers.
Lasa, H. I. De, Serrano, B. and Salaices, M. (2005) Photocatalytic reaction engineering. Springer.
Leary, R. and Westwood, A. (2011) ‘Carbonaceous nanomaterials for the enhancement of TiO2

References
206
photocatalysis’, Carbon, 49(3), pp. 741–772. doi: 10.1016/j.carbon.2010.10.010.
Leboda, R., Skubiszewska-Zięba, J., Tomaszewski, W. and Gun’ko, V. M. (2003) ‘Structural and
adsorptive properties of activated carbons prepared by carbonization and activation of resins’,
Journal of Colloid and Interface Science, 263(2), pp. 533–541. doi: 10.1016/S0021-9797(03)00275-3.
Ledesma, B., Román, S., Álvarez-Murillo, a., Sabio, E. and González, J. F. (2014) ‘Cyclic
adsorption/thermal regeneration of activated carbons’, Journal of Analytical and Applied Pyrolysis.
Elsevier B.V., 106, pp. 112–117. doi: 10.1016/j.jaap.2014.01.007.
Lesan, H. M. and Bhandari, A. (2003) ‘Atrazine sorption on surface soils: time-dependent phase
distribution and apparent desorption hysteresis.’, Water research, 37(7), pp. 1644–54. doi:
10.1016/S0043-1354(02)00497-9.
Li Puma, G., Bono, A., Krishnaiah, D., Collin, J. G. and Li, G. (2008) ‘Preparation of titanium dioxide
photocatalyst loaded onto activated carbon support using chemical vapor deposition: a review
paper.’, Journal of hazardous materials, 157(2-3), pp. 209–19. doi: 10.1016/j.jhazmat.2008.01.040.
Li Puma, G. and Yue, P. L. (1999) ‘Comparison of the Effectiveness of Photon-Based Oxidation
Processes in a Pilot Falling Film Photoreactor’, Environmental Science & Technology, 33(18), pp.
3210–3216. doi: 10.1021/es9811795.
Li Puma, G., Yue, P. L., Li, G. and Lock, P. (2003) ‘Modelling and design of thin-film slurry
photocatalytic reactors for water purification’, Chemical Engineering Science, 58(11), pp. 2269–2281.
doi: 10.1016/S0009-2509(03)00086-1.
Li, W.-H., Yue, Q.-Y., Gao, B.-Y., Ma, Z.-H., Li, Y.-J. and Zhao, H.-X. (2011) ‘Preparation and utilization
of sludge-based activated carbon for the adsorption of dyes from aqueous solutions’, Chemical
Engineering Journal. Elsevier B.V., 171(1), pp. 320–327. doi: 10.1016/j.cej.2011.04.012.
Lim, T., Yap, P. and Srinivasan, M. (2011) ‘Critical Reviews in Environmental Science and Technology
TiO2 / AC Composites for Synergistic Adsorption-Photocatalysis Processes : Present Challenges and
Further Developments for Water Treatment and Reclamation’, Membrane Technology, (September),
pp. 37–41.
Liu, M. Y., Tsang, D. C. W., Hu, J., Ng, K. T. W., Liu, T. and Lo, I. M. C. (2008) ‘Adsorption of Methylene
Blue and Phenol by Wood Waste Derived Activated Carbon’, Journal of Environmental Engineering,
134(5), p. 338. doi: 10.1061/(ASCE)0733-9372(2008)134:5(338).
Liu, S. X., Sun, C. L. and Zhang, S. R. (2004) ‘Photocatalytic regeneration of exhausted activated
carbon saturated with phenol.’, Bulletin of environmental contamination and toxicology, 73(6), pp.
1017–24. doi: 10.1007/s00128-004-0527-5.
Lu, P.-J., Lin, H.-C., Yu, W.-T. and Chern, J.-M. (2011) ‘Chemical regeneration of activated carbon used
for dye adsorption’, Journal of the Taiwan Institute of Chemical Engineers. Taiwan Institute of
Chemical Engineers, 42(2), pp. 305–311. doi: 10.1016/j.jtice.2010.06.001.
Mahmoodi, N. M., Salehi, R. and Arami, M. (2011) ‘Binary system dye removal from colored textile
wastewater using activated carbon: Kinetic and isotherm studies’, Desalination. Elsevier B.V., 272(1-
3), pp. 187–195. doi: 10.1016/j.desal.2011.01.023.

References
207
Malarvizhi, R. and Ho, Y.-S. (2010) ‘The influence of pH and the structure of the dye molecules on
adsorption isotherm modeling using activated carbon’, Desalination. Elsevier B.V., 264(1-2), pp. 97–
101. doi: 10.1016/j.desal.2010.07.010.
Malato, S., Blanco, J., Alarcón, D. C., Maldonado, M. I., Fernández-Ibáñez, P. and Gernjak, W. (2007)
‘Photocatalytic decontamination and disinfection of water with solar collectors’, Catalysis Today,
122(1-2), pp. 137–149. doi: 10.1016/j.cattod.2007.01.034.
Malato, S., Fernández-Ibáñez, P., Maldonado, M. I., Blanco, J. and Gernjak, W. (2009)
‘Decontamination and disinfection of water by solar photocatalysis: Recent overview and trends’,
Catalysis Today, 147(1), pp. 1–59. doi: 10.1016/j.cattod.2009.06.018.
Malvern Instruments Ltd (1997) ‘Manual MAN 0101 Issue 1.3.’
Manda, B. M. K., Worrell, E. and Patel, M. K. (2014) ‘Innovative membrane filtration system for
micropollutant removal from drinking water – prospective environmental LCA and its integration in
business decisions’, Journal of Cleaner Production. Elsevier Ltd, 72, pp. 153–166. doi:
10.1016/j.jclepro.2014.02.045.
Mark, H. and Workman, J. (2012) Statistics in Spectroscopy. Elsevier Science.
Marsh, H. and Rodríguez-Reinoso, F. (2006) Activated Carbon. Elsevier.
Matos, J. (1998) ‘Synergy effect in the photocatalytic degradation of phenol on a suspended mixture
of titania and activated carbon’, Applied Catalysis B: Environmental, 18, pp. 281–291.
Matos, J. (2001) ‘Effect of the Type of Activated Carbons on the Photocatalytic Degradation of
Aqueous Organic Pollutants by UV-Irradiated Titania’, Journal of Catalysis, 200(1), pp. 10–20. doi:
10.1006/jcat.2001.3191.
Matos, J., Chovelon, J., Cordero, T. and Ferronato, C. (2009) ‘Influence of Surface Properties of
Activated Carbon on Photocatalytic Activity of TiO 2 in 4-chlorophenol Degradation’, Environmental
Engineering, pp. 21–29.
Matos, J., Garcia, A., Cordero, T., Chovelon, J.-M. and Ferronato, C. (2009) ‘Eco-friendly TiO2–AC
Photocatalyst for the Selective Photooxidation of 4-Chlorophenol’, Catalysis Letters, 130(3-4), pp.
568–574. doi: 10.1007/s10562-009-9989-8.
Matos, J., Laine, J., Herrmann, J.-M., Uzcategui, D. and Brito, J. L. (2007) ‘Influence of activated
carbon upon titania on aqueous photocatalytic consecutive runs of phenol photodegradation’,
Applied Catalysis B: Environmental, 70(1-4), pp. 461–469. doi: 10.1016/j.apcatb.2005.10.040.
Maurya, N. and Mittal, A. (2006) ‘Applicability of equilibrium isotherm models for the biosorptive
uptakes in comparison to activated carbon-based adsorption’, Journal of Environmental Engineering,
132(12), pp. 1589–1599.
Maxwell, S. E. and Delaney, H. D. (2004) Designing Experiments and Analyzing Data: A Model
Comparison Perspective. Psychology Press.
McConvey, I. (1985) ‘Mass transfer model for the adsorption of basic dyes on woodmeal in agitated
batch adsorbers’, Chemical engineering and processing.

References
208
McCullagh, C., Skillen, N., Adams, M. and Robertson, P. K. J. (2011) ‘Photocatalytic reactors for
environmental remediation: a review’, Journal of Chemical Technology & Biotechnology, 86(8), pp.
1002–1017. doi: 10.1002/jctb.2650.
McKay, G. (1983) ‘The adsorption of dyestuffs from aqueous solution using activated carbon:
Analytical solution for batch adsorption based on external mass transfer and’, The Chemical
Engineering Journal, 27, pp. 187–196.
McKay, G. and Geundi, M. El (1988) ‘External mass transport processes during the adsorption of dyes
onto bagasse pith’, Water Research, 22(12), pp. 1527–1533.
McLaughlin, H. (2005) ‘Understanding activated carbon reactivation and low-temperature
regeneration technology.’, International sugar journal.
McMurry, J. and Fay, R. C. (2004) Chemistry. Pearson Education International.
McNamara, D., Wong, P., Christen, P. and Ng, K. (2013) ‘Predicting High Impact Academic Papers
Using Citation Network Features’, in Trends and Applications in Knowledge Discovery and Data
Mining, pp. 14–25. doi: 10.1007/978-3-642-40319-4_2.
Mendret, J., Hatat-Fraile, M., Rivallin, M. and Brosillon, S. (2013) ‘Hydrophilic composite membranes
for simultaneous separation and photocatalytic degradation of organic pollutants’, Separation and
Purification Technology. Elsevier B.V., 111, pp. 9–19. doi: 10.1016/j.seppur.2013.03.030.
Mezohegyi, G., van der Zee, F. P., Font, J., Fortuny, A. and Fabregat, A. (2012) ‘Towards advanced
aqueous dye removal processes: a short review on the versatile role of activated carbon.’, Journal of
environmental management. Elsevier Ltd, 102, pp. 148–64. doi: 10.1016/j.jenvman.2012.02.021.
Mikhaylov, R. and Lisachenko, A. (2009) ‘FTIR and TPD Analysis of Surface Species on a TiO2
Photocatalyst Exposed to NO, CO, and NO-CO Mixtures: Effect of UV-Vis Light Irradiation’, The
Journal of Physical Chemistry C, 113(47), pp. 20381–20387. doi: 10.1021/jp906176c.
Minitab Inc. (2007) ‘Minitab Statistical Software.’ State College, Pennsylvania: Minitab is a registered
trademark of Minitab Inc.
Mohan, D., Sarswat, A., Singh, V. K., Alexandre-Franco, M. and Pittman, C. U. (2011) ‘Development of
magnetic activated carbon from almond shells for trinitrophenol removal from water’, Chemical
Engineering Journal. Elsevier B.V., 172(2-3), pp. 1111–1125. doi: 10.1016/j.cej.2011.06.054.
Montgomery, D. C. (2008) Design and Analysis of Experiments. John Wiley & Sons.
Mourand, J. T., Crittenden, J. C., Hand, D. W., Perram, D. L. and Notthakun, S. (1995) ‘Regeneration
of spent adsorbents using homogeneous advanced oxidation’, Water Environment Research, 67(3),
pp. 355–363. doi: 10.2175/106143095X131583.
Mozia, S. (2010) ‘Photocatalytic membrane reactors (PMRs) in water and wastewater treatment. A
review’, Separation and Purification Technology. Elsevier B.V., 73(2), pp. 71–91. doi:
10.1016/j.seppur.2010.03.021.
Mukherjee, P. S. and Ray, A. K. (1999) ‘Major Challenges in the Design of a Large-Scale Photocatalytic
Reactor for Water Treatment’, Chemical Engineering & Technology, 22(3), pp. 253–260. doi:

References
209
10.1002/(SICI)1521-4125(199903)22:3<253::AID-CEAT253>3.0.CO;2-X.
Muranaka, C. and Julcour, C. (2009) ‘Regeneration of activated carbon by (photo)-Fenton oxidation’,
Industrial & Engineering Chemistry Research, 49(3), pp. 989–995. doi: 10.1021/ie900675d.
Newcombe, G. and Dixon, D. (2006) Interface science in drinking water treatment: Theory and
Applications. Academic Press.
NIST/SEMATECH (2013) e-Handbook of Statistical Methods. Available at:
http://www.itl.nist.gov/div898/handbook/.
Notthakun, S., Hand, D. W., Perram, D. L. and Mullins, M. E. (1993) ‘Regeneration of adsorbents
using heterogeneous advanced oxidation’, Journal of Environmental Engineering, 119(4), p. 695.
Nutonian (2014) Eureqa Desktop Documentation. Available at:
http://formulize.nutonian.com/documentation/eureqa/#.
Ochiai, T. and Fujishima, A. (2012) ‘Photoelectrochemical properties of TiO2 photocatalyst and its
applications for environmental purification’, Journal of Photochemistry and Photobiology C:
Photochemistry Reviews. Elsevier B.V., 13(4), pp. 247–262. doi:
10.1016/j.jphotochemrev.2012.07.001.
Onal, Y., Akmil-Başar, C. and Sarici-Ozdemir, C. (2007) ‘Investigation kinetics mechanisms of
adsorption malachite green onto activated carbon.’, Journal of hazardous materials, 146(1-2), pp.
194–203. doi: 10.1016/j.jhazmat.2006.12.006.
Oppenländer, T. (2003) Photochemical purification of water and air. Wiley-VCH.
Pastrana-Martínez, L. M., López-Ramón, M. V, Fontecha-Cámara, M. a and Moreno-Castilla, C. (2010)
‘Batch and column adsorption of herbicide fluroxypyr on different types of activated carbons from
water with varied degrees of hardness and alkalinity.’, Water research, 44(3), pp. 879–85. doi:
10.1016/j.watres.2009.09.053.
Pelekani, C. and Snoeyink, V. (2000) ‘Competitive adsorption between atrazine and methylene blue
on activated carbon: the importance of pore size distribution’, Carbon. Elsevier, 38(10), pp. 1423–
1436. doi: 10.1016/S0008-6223(99)00261-4.
Pelekani, C. and Snoeyink, V. L. (1999) ‘Competitive adsorption in natural water: role of activated
carbon pore size’, Water Research, 33(5), pp. 1209–1219. doi: 10.1016/S0043-1354(98)00329-7.
Porkodi, K. and Kumar, K. V. (2007) ‘Equilibrium, kinetics and mechanism modeling and simulation of
basic and acid dyes sorption onto jute fiber carbon: Eosin yellow, malachite green and crystal violet
single component systems.’, Journal of hazardous materials, 143(1-2), pp. 311–27. doi:
10.1016/j.jhazmat.2006.09.029.
Prahas, D., Kartika, Y., Indraswati, N. and Ismadji, S. (2008) ‘Activated carbon from jackfruit peel
waste by H3PO4 chemical activation: Pore structure and surface chemistry characterization’,
Chemical Engineering Journal, 140(1-3), pp. 32–42. doi: 10.1016/j.cej.2007.08.032.
Puma, G. L. and Yue, P. L. (1998) ‘A laminar falling film slurry photocatalytic reactor. Part I—model
development’, Chemical Engineering Science, 53(16), pp. 2993–3006. doi: 10.1016/S0009-

References
210
2509(98)00120-1.
Qada, E. N. El, Allen, S. J., Walker, G. M. and Elqada, E. (2008) ‘Adsorption of basic dyes from
aqueous solution onto activated carbons’, Chemical Engineering Journal, 135(3), pp. 174–184. doi:
10.1016/j.cej.2007.02.023.
El Qada, E. N., Allen, S. J., Walker, G. M. and Qada, E. N. El (2006) ‘Adsorption of Methylene Blue
onto activated carbon produced from steam activated bituminous coal: A study of equilibrium
adsorption isotherm’, Chemical Engineering Journal, 124(1-3), pp. 103–110. doi:
10.1016/j.cej.2006.08.015.
Qi, Y., Hoadley, A. F. a., Chaffee, A. L. and Garnier, G. (2011) ‘Characterisation of lignite as an
industrial adsorbent’, Fuel. Elsevier Ltd, 90(4), pp. 1567–1574. doi: 10.1016/j.fuel.2011.01.015.
Radhika, M. and Palanivelu, K. (2006) ‘Adsorptive removal of chlorophenols from aqueous solution
by low cost adsorbent--Kinetics and isotherm analysis.’, Journal of hazardous materials, 138(1), pp.
116–24. doi: 10.1016/j.jhazmat.2006.05.045.
Rajeshwar, K., Osugi, M. E., Chanmanee, W., Chenthamarakshan, C. R., Zanoni, M. V. B.,
Kajitvichyanukul, P. and Krishnan-Ayer, R. (2008) ‘Heterogeneous photocatalytic treatment of
organic dyes in air and aqueous media’, Journal of Photochemistry and Photobiology C:
Photochemistry Reviews, 9(4), pp. 171–192. doi: 10.1016/j.jphotochemrev.2008.09.001.
Rakotomalala, R. (2005) ‘Tanagra: a free software for research and academic purposes.’ Lyon: in
Proceedings of EGC’2005, vol.2, pp. 697–702.
Randorn, C., Wongnawa, S. and Boonsin, P. (2004) ‘Bleaching of methylene blue by hydrated
titanium dioxide’, ScienceAsia, 30, pp. 149–156.
Raposo, F., De La Rubia, M. a and Borja, R. (2009) ‘Methylene blue number as useful indicator to
evaluate the adsorptive capacity of granular activated carbon in batch mode: influence of
adsorbate/adsorbent mass ratio and particle size.’, Journal of hazardous materials, 165(1-3), pp.
291–9. doi: 10.1016/j.jhazmat.2008.09.106.
Ray, A. K. and Beenackers, A. a. C. M. (1997) ‘Novel swirl-flow reactor for kinetic studies of
semiconductor photocatalysis’, AIChE Journal, 43(10), pp. 2571–2578. doi: 10.1002/aic.690431018.
Rodríguez, A., García, J., Ovejero, G. and Mestanza, M. (2009) ‘Adsorption of anionic and cationic
dyes on activated carbon from aqueous solutions: equilibrium and kinetics.’, Journal of hazardous
materials, 172(2-3), pp. 1311–20. doi: 10.1016/j.jhazmat.2009.07.138.
Romero-Hernandez, O. (2004) ‘To treat or not to treat? Applying chemical engineering tools and a
life cycle approach to assessing the level of sustainability of a clean-up technology’, Green Chemistry,
(1), pp. 395–400.
Romero-Hernandez, O. (2005) ‘Applying Life Cycle Tools and Process Engineering to Determine the
Most Adequate Treatment Process Conditions. A Tool in Environmental Policy (12 pp)’, The
International Journal of Life Cycle Assessment, 10(5), pp. 355–363.
Royer, B., Cardoso, N. F., Lima, E. C., Vaghetti, J. C. P., Simon, N. M., Calvete, T. and Veses, R. C.

References
211
(2009) ‘Applications of Brazilian pine-fruit shell in natural and carbonized forms as adsorbents to
removal of methylene blue from aqueous solutions--kinetic and equilibrium study.’, Journal of
hazardous materials, 164(2-3), pp. 1213–22. doi: 10.1016/j.jhazmat.2008.09.028.
Rubin, E., Rodri guez, P., Herrero, R. and Sastre de Vicente, M. E. (2010) ‘Adsorption of Methylene
Blue on Chemically Modified Algal Biomass: Equilibrium, Dynamic, and Surface Data’, Journal of
Chemical & Engineering Data. ACS Publications, pp. 5707–5714.
Ruthven, D. M. (1984) Principles of Adsorption and Adsorption Processes. John Wiley & Sons.
Sabnis, R. W. (2010) Handbook of Biological Dyes and Stains: Synthesis and Industrial Applications.
John Wiley & Sons.
Salleh, M. A. M., Mahmoud, D. K., Karim, W. A. W. A. and Idris, A. (2011) ‘Cationic and anionic dye
adsorption by agricultural solid wastes: A comprehensive review’, Desalination. Elsevier B.V., 280(1-
3), pp. 1–13. doi: 10.1016/j.desal.2011.07.019.
Samiey, B. and Ashoori, F. (2012) ‘Adsorptive removal of methylene blue by agar: effects of NaCl and
ethanol.’, Chemistry Central journal. Chemistry Central Ltd, 6(1), p. 14. doi: 10.1186/1752-153X-6-14.
San Miguel, G., Lambert, S. D. and Graham, N. J. D. (2002) ‘Thermal regeneration of granular
activated carbons using inert atmospheric conditions.’, Environmental technology, 23(12), pp. 1337–
46. doi: 10.1080/09593332508618449.
Sarici-Ozdemir, C. (2012) ‘Adsorption and desorption kinetics behaviour of methylene blue onto
activated carbon’, Physicochemical Problems of Mineral Processing, 48(2), pp. 441–454.
Sarle, W. S. (1990) ‘The {VARCLUS} Procedure’, SAS/STAT User’s Guide, 2, pp. 1641–1659.
Sas Publishing (2004) ‘SAS/STAT 9.1 User’s Guide’, p. 5136.
Schmidt, M. and Lipson, H. (2014) ‘Eureqa (version 0.99.0 beta) [Software].’ Available from
www.nutonian.com.
Sci2 Team (2009) ‘Science of Science (Sci2) tool.’ Indiana University and SciTech Strategies.
Shah, I. K., Pre, P. and Alappat, B. J. (2014) ‘Effect of thermal regeneration of spent activated carbon
on volatile organic compound adsorption performances’, Journal of the Taiwan Institute of Chemical
Engineers. Taiwan Institute of Chemical Engineers, 45(4), pp. 1733–1738. doi:
10.1016/j.jtice.2014.01.006.
Shama, G. (1992) ‘Ultraviolet irradiation apparatus for disinfecting liquids of high ultraviolet
absorptivities’, Letters in Applied Microbiology, 15(2), pp. 69–72. doi: 10.1111/j.1472-
765X.1992.tb00727.x.
Sheintuch, M. and Matatov-Meytal, Y. (1999) ‘Comparison of catalytic processes with other
regeneration methods of activated carbon’, Catalysis Today, 53, pp. 73–80.
da Silva, C. G. and Faria, J. L. (2003) ‘Photochemical and photocatalytic degradation of an azo dye in
aqueous solution by UV irradiation’, Journal of Photochemistry and Photobiology A: Chemistry,
155(1-3), pp. 133–143. doi: 10.1016/S1010-6030(02)00374-X.

References
212
Silva, C. G., Wang, W. and Faria, J. L. (2006) ‘Photocatalytic and photochemical degradation of mono-
, di- and tri-azo dyes in aqueous solution under UV irradiation’, Journal of Photochemistry and
Photobiology A: Chemistry, 181(2-3), pp. 314–324. doi: 10.1016/j.jphotochem.2005.12.013.
Singh, K. P., Malik, A., Sinha, S. and Ojha, P. (2008) ‘Liquid-phase adsorption of phenols using
activated carbons derived from agricultural waste material.’, Journal of hazardous materials, 150(3),
pp. 626–41. doi: 10.1016/j.jhazmat.2007.05.017.
Small, H. (2006) ‘Tracking and predicting growth areas in science’, Scientometrics, 68(3), pp. 595–
610.
Streat, M. and Patrick, J. (1995) ‘Sorption of phenol and para-chlorophenol from water using
conventional and novel activated carbons’, Water Research.
Suzuki, M. (1990) Adsorption engineering. Kodansha.
Sze, M. F. F. and McKay, G. (2010) ‘An adsorption diffusion model for removal of para-chlorophenol
by activated carbon derived from bituminous coal’, Environmental Pollution. Elsevier Ltd, 158(5), pp.
1669–1674. doi: 10.1016/j.envpol.2009.12.003.
Takeda, N., Torimoto, T., Sampath, S., Kuwabata, S. and Yoneyama, H. (1995) ‘Effect of Inert
Supports for Titanium Dioxide Loading on Enhancement of Photodecomposition Rate of Gaseous
Propionaldehyde’, The Journal of Physical Chemistry, 99(24), pp. 9986–9991. doi:
10.1021/j100024a047.
Tardivo, J. P. J., Del Giglio, A., de Oliveira, C. S., Gabrielli, D. S., Junqueira, H. C., Tada, D. B., Severino,
D., de Fátima Turchiello, R., Baptista, M. S., Giglio, A. Del and Oliveira, C. De (2005) ‘Methylene blue
in photodynamic therapy: From basic mechanisms to clinical applications’, Photodiagnosis and
Photodynamic Therapy, 2(3), pp. 175–191. doi: 10.1016/S1572-1000(05)00097-9.
Terzyk, A. (2001) ‘The influence of activated carbon surface chemical composition on the adsorption
of acetaminophen (paracetamol) in vitro Part II. TG, FTIR, and XPS analysis of carbons and the
temperature dependence of adsorption kinetics at the neutral pH’, Colloids and Surfaces A:
Physicochemical and Engineering Aspects, 177(1), pp. 23–45. doi: 10.1016/S0927-7757(00)00594-X.
Terzyk, A., Gauden, P. and Kowalczyk, P. (2002) ‘What kind of pore size distribution is assumed in the
Dubinin–Astakhov adsorption isotherm equation?’, Carbon, 40, pp. 2879–2886.
Thomas, W. J. and Crittenden, B. D. (1998) Adsorption Technology and Design. Butterworth-
Heinemann.
Tkachenko, N. H., Yaremko, Z. M. and Bellmann, C. (2006) ‘Effect of 1-1-charged ions on aggregative
stability and electrical surface properties of aqueous suspensions of titanium dioxide’, Colloids and
Surfaces A: Physicochemical and Engineering Aspects, 279(1-3), pp. 10–19. doi:
10.1016/j.colsurfa.2005.09.037.
Toledo, L., Silva, A., Augusti, R. and Lago, R. (2003) ‘Application of Fenton’s reagent to regenerate
activated carbon saturated with organochloro compounds’, Chemosphere, 50, pp. 1049–1054.
Tóth, J. (2002) Adsorption: Theory, Modeling, and Analysis. CRC Press.

References
213
Tseng, R., Wu, F. and Juang, R. (2003) ‘Liquid-phase adsorption of dyes and phenols using pinewood-
based activated carbons’, Chemical Engineering, 41, pp. 487–495.
Vadivelan, V. and Kumar, K. V. (2005) ‘Equilibrium, kinetics, mechanism, and process design for the
sorption of methylene blue onto rice husk.’, Journal of colloid and interface science, 286(1), pp. 90–
100. doi: 10.1016/j.jcis.2005.01.007.
Vargas, A. M. M. M., Cazetta, A. L., Kunita, M. H., Silva, T. L. and Almeida, V. C. (2011) ‘Adsorption of
methylene blue on activated carbon produced from flamboyant pods (Delonix regia): Study of
adsorption isotherms and kinetic models’, Chemical Engineering Journal. Elsevier B.V., 168(2), pp.
722–730. doi: 10.1016/j.cej.2011.01.067.
Wang, G., Wu, T., Li, Y., Sun, D., Wang, Y., Huang, X., Zhang, G. and Liu, R. (2012) ‘Removal of
ampicillin sodium in solution using activated carbon adsorption integrated with H2O2 oxidation’,
Journal of Chemical Technology & Biotechnology, 87(5), pp. 623–628. doi: 10.1002/jctb.2754.
Wang, L. G. and Yan, G. B. (2011) ‘Adsorptive removal of direct yellow 161dye from aqueous solution
using bamboo charcoals activated with different chemicals’, Desalination. Elsevier B.V., 274(1-3), pp.
81–90. doi: 10.1016/j.desal.2011.01.082.
Wang, S. and Zhu, Z. (2007) ‘Effects of acidic treatment of activated carbons on dye adsorption’,
Dyes and Pigments, 75(2), pp. 306–314. doi: 10.1016/j.dyepig.2006.06.005.
Wang, S., Zhu, Z. H., Coomes, A., Haghseresht, F. and Lu, G. Q. (2005) ‘The physical and surface
chemical characteristics of activated carbons and the adsorption of methylene blue from
wastewater.’, Journal of colloid and interface science, 284(2), pp. 440–6. doi:
10.1016/j.jcis.2004.10.050.
White, H. and Griffith, B. (1981) ‘Author cocitation: A literature measure of intellectual structure’,
Journal of the American Society for Information Science, 32(3), pp. 163–171. doi:
10.1002/asi.4630320302.
Xing, Y., Liu, D. and Zhang, L.-P. (2010) ‘Enhanced adsorption of Methylene Blue by EDTAD-modified
sugarcane bagasse and photocatalytic regeneration of the adsorbent’, Desalination. Elsevier B.V.,
259(1-3), pp. 187–191. doi: 10.1016/j.desal.2010.04.008.
Xin-hui, D., Srinivasakannan, C. and Jin-sheng, L. (2014) ‘Process optimization of thermal
regeneration of spent coal based activated carbon using steam and application to methylene blue
dye adsorption’, Journal of the Taiwan Institute of Chemical Engineers. Taiwan Institute of Chemical
Engineers, 45(4), pp. 1618–1627. doi: 10.1016/j.jtice.2013.10.019.
Yang, R. T. (2003) Adsorbents: Fundamentals and Applications. John Wiley & Sons.
Yang, X. (2001) ‘Application of branched pore diffusion model in the adsorption of reactive dyes on
activated carbon’, Chemical Engineering Journal, 83, pp. 15–23.
Yao, J. and Wang, C. (2010) ‘Decolorization of Methylene Blue with TiO2 Sol via UV Irradiation
Photocatalytic Degradation’, International Journal of Photoenergy, 2010, pp. 1–6. doi:
10.1155/2010/643182.

References
214
Yoon, Y., Westerhoff, P. and Snyder, S. (2005) ‘Adsorption of 3H-labeled 17-β estradiol on powdered
activated carbon’, Water, Air, and Soil Pollution, pp. 343–351.
Yu, J., Li, B., Sun, X., Jun, Y. and Chi, R. (2009) ‘Adsorption of methylene blue and rhodamine B on
baker’s yeast and photocatalytic regeneration of the biosorbent’, Biochemical Engineering Journal,
45(2), pp. 145–151. doi: 10.1016/j.bej.2009.03.007.
Yuan, R., Guan, R. and Zheng, J. (2005) ‘Effect of the pore size of TiO-loaded activated carbon fiber
on its photocatalytic activity’, Scripta Materialia, 52(12), pp. 1329–1334. doi:
10.1016/j.scriptamat.2005.02.028.
Yuen, F. K. and Hameed, B. H. (2009) ‘Recent developments in the preparation and regeneration of
activated carbons by microwaves.’, Advances in colloid and interface science. Elsevier B.V., 149(1-2),
pp. 19–27. doi: 10.1016/j.cis.2008.12.005.
Yuen, F. K. and Hameed, B. H. (2010a) ‘Decontamination of textile wastewater via TiO2/activated
carbon composite materials.’, Advances in colloid and interface science. Elsevier B.V., 159(2), pp.
130–43. doi: 10.1016/j.cis.2010.06.002.
Yuen, F. K. and Hameed, B. H. (2010b) ‘Insights into the modeling of adsorption isotherm systems’,
Chemical Engineering Journal, 156(1), pp. 2–10. doi: 10.1016/j.cej.2009.09.013.
Yuh-Shan, H. (2004) ‘Citation review of Lagergren kinetic rate equation on adsorption reactions’,
Scientometrics, 59(1), pp. 171–177.
Zhang, X. and Lei, L. (2008) ‘Effect of preparation methods on the structure and catalytic
performance of TiO(2)/AC photocatalysts.’, Journal of hazardous materials, 153(1-2), pp. 827–33.
doi: 10.1016/j.jhazmat.2007.09.052.
Zhang, X. and Lei, L. (2008) ‘Effect of preparation methods on the structure and catalytic
performance of TiO2/AC photocatalysts’, Journal of hazardous materials. Elsevier, 153(1-2), pp. 827–
833.
Zhi-yuan, Y. and Yang, Z. (2008) ‘Kinetics and mechanism of the adsorption of methylene blue onto
ACFs’, Journal of China University of Mining and Technology, 18(3), pp. 437–440. doi:
10.1016/S1006-1266(08)60090-5.

Appendix A. Bibliographic Mapping Study
215
APPENDIX A BIBLIOGRAPHIC MAPPING STUDY
Appendix A.1 Introduction
A science map is a representation of the relations among disciplines, papers or authors, and it aims
to display and detect research areas (Cobo et al., 2011). Document citation and document co-
citation studies are some commonly used data analysis techniques to create these maps. A paper
citation network is an unweighted, directed citation network (Sci2 Team, 2009). The edges, point
from cited references to citing documents, therefore, this type of network allows for the tracking of
citations chronologically. A simple document citation representation is shown in Figure A-1. A paper
co-citation network is an undirected and weighted network, frequently used to identify research
areas and subfields, for discovering knowledge communities. It can also be used to show how
research on one topic influences research on another, and also predicts emergence and growth of
recent scientific areas (White and Griffith, 1981; He et al., 2009; Chen, Ibekwe-SanJuan and Hou,
2010). A co-citation relation exists (edge) if two documents (nodes) are cited together by a common
document. If two publications are frequently co-cited then they can be classified into the same
research area.
Figure A-1 Document citation representation
The bibliographic data analysis methodology comprised of a series of steps in order to process and
interpret the data. Data collection from Web of Science database (WoS), document citation matrix
formation and document co-citation network extraction from document citation network were the
first three steps. Fourthly, dimensionality reduction consisting of Local Citation Count (LCC) cut-off
value of zero and pruning with Minimum Spanning Tree (MST)-Pathfinder algorithm in Sci2 software
was done. This was followed by cluster identification using community detection algorithm in Gephi.
Then data visualization and cluster labelling by analysis of cited members of clusters, and lastly
interpretation using graph metrics was done. The methodological analysis chosen, showed
comprehensively emerging research areas from scientific literature, tendencies in the field of the

Appendix A. Bibliographic Mapping Study
216
regeneration of TiO2 and activated carbon using AOPs, and relevant research articles. Although some
subfields overlap, clear clusters sharing common features were seen to emerge from the data.
Nonetheless, it is a screening analysis, and should not be considered as a detailed overview of this
speciality. This network analysis approach also showed the maturity of the field, as well as the
importance of papers based not only in number of citation but rather in other relevant node metrics
in the network, as well as their importance based on the position they occupy in the network (central
or peripheral).
Thomson Reuters Web of Knowledge was used to retrieve input data for network analysis. The query
for the literature search included the terms “photocatalysis”, “advanced oxidation”, “titanium
dioxide”, “fenton”, “electrohydraulic discharge”, “nonthermal plasma”, “chemical oxidation”,
“electrocatalytic oxidation”, “electrochemical oxidation” in combination with “activated carbon”,
“charcoal” (February 2014); 1,499 articles matched the search query and were used in a document
citation network and a document co-citation network analysis. Sci² Tool version: 0.5.2 alpha and
Gephi 0.8.2 beta were the software chosen for network analysis. All visualizations were performed
using Gephi software.
Appendix A.2 Document Citation Network
Figure A-2 shows the document citation network omitting nodes which fell below the threshold of 1.
Each node represents a paper. The colour of each node corresponds to its betweenness centrality
value. The betweenness centrality measure identifies potential revolutionary scientific publications
(Chen, Ibekwe-SanJuan and Hou, 2010).
The size of the node is proportional to the amount of citations received within the network (LCC).
Thus, a large red node denotes a highly cited paper with a high betweenness centrality number.
The network seems to be divided in to three major cluster. The bigger cluster belongs to the study of
TiO2 and activated carbon/titania research topic, the left down corner cluster represents the TiO2
and activated carbon/fenton subfield of the research discipline, and the right down corner cluster
integrates the TiO2 and activated carbon/ozonation topic. This observed broad classification can be
refined extracting from this data the corresponding co-citation network to analyse in more detail
these blocks.

Appendix A. Bibliographic Mapping Study
217
Figure A-2 Document Citation Network showing only nodes with out-degree higher than zero (Resolution = 1.0)
Appendix A.2.1 Network centrality measures
Table A-1 describes network centrality measures such as degree centrality, closeness centrality,
betweenness centrality and page rank. The local citation counts or out-degree indicates how often a
paper was cited by papers within the network (Figure A-1). Very high in-degree values are used to
identify review papers. Papers high in closeness centrality are those with rapid access to information
in other papers (Kas, 2011). Documents high in betweenness centrality tend to bring different sub-
fields of the research area together. The removal of these nodes may result in partitioning of the
network (Kas, 2011). Some of the papers with the highest betweenness are those with the highest
in-degree due to the high amount of references they contain, connecting multiple sub-areas. Nodes
that are highly connected and span network boundaries (betweenness centrality) are likely to be
more influential (McNamara et al., 2013). Page rank is the algorithm used by Google to rank their
website searches. It is based on the idea that if a paper is cited by an important paper, that paper is

Appendix A. Bibliographic Mapping Study
218
likely to be important, so it helps to identify importance not only by the number of links but rather
from where they are coming.
Table A-1 Network centrality measures in document citation network
LCC = Out-degree In-degree Betweenness
Centrality
Closeness
Centrality
Page Rank
Matos J, 1998, Appl
Catal B-environ, V18,
P281
Lim Tt, 2011, Crit Rev
Env Sci Tec, V41, P1173
Lim Tt, 2011, Crit Rev
Env Sci Tec, V41, P1173
Tatsuda N, 2004, J Mater
Chem, V14, P3440
Zhang Yl, 2009, J Colloid
Interf Sci, V339, P434
Matos J, 2001, J Catal,
V200, P10,
Leary R, 2011, Carbon,
V49, P741
Puma Gl, 2008, J Hazard
Mater, V157, P209
Dusenbury Js, 1996,
Carbon, V34, P1577
Zhang Yl, 2009,
Chemsuschem, V2, P867
Tryba B, 2003, Appl Catal
B-environ, V41, P427
Puma Gl, 2008, J Hazard
Mater, V157, P209
Leary R, 2011, Carbon,
V49, P741
Hisanaga T, 2002, J
Hazard Mater, V93, P331
Lim Tt, 2011, Crit Rev
Env Sci Tec, V41, P1173
Torimoto T, 1997, J
Photoch Photobio A,
V103, P153
Mezohegyi G, 2012, J
Environ Manage, V102,
P148
Gao Bf, 2011, Chem Eng
J, V171, P1098
Herrmann Jm, 2000, Cr
Acad Sci Ii C, V3, P417
Leary R, 2011, Carbon,
V49, P741
Torimoto T, 1996,
Environ Sci Technol, V30,
P1275
Tryba B, 2008, Int J
Photoenergy
Arana J, 2003, Appl Catal
B-environ, V44, P161
Tatsuda N, 2005,
Carbon, V43, P2358
Mezohegyi G, 2012, J
Environ Manage, V102,
P148
Arana J, 2003, Appl Catal
B-environ, V44, P161
Keane D, 2011, Catal
Lett, V141, P300
Georgi A, 2005, Appl
Catal B-environ, V58, P9
Cannon Fs, 1996, Ozone-
sci Eng, V18, P417
Bai Cp, 2013, Chem Eng
J, V215, P227
Takeda N, 1995, J Phys
Chem-us, V99, P9986
Eliyas Ae, 2013, Cent Eur
J Chem, V11, P464
Fu Pf, 2004, J Mol Catal
A-chem, V221, P81
Fan Cm, 2003, T Nonferr
Metal Soc, V13, P452
Huling Sg, 2012, J Hazard
Mater, V205, P55
Ao Ch, 2003, Appl Catal
B-environ, V44, P191
Huang Zh, 2004, New
Carbon Mater, V19,
P229
El-sheikh Ah, 2004, Surf
Coat Tech, V187, P284
Chuan Xy, 2004, Appl
Catal B-environ, V51,
P255
Duarte Fm, 2013, Appl
Catal A-gen, V458, P39
Herrmann Jm, 1999,
Catal Today, V54, P255
Li W, 2012, Adsorption,
V18, P67
Matos J, 1998, Appl
Catal B-environ, V18,
P281
Haque F, 2005, J
Photoch Photobio A,
V169, P21
Puma Gl, 2008, J Hazard
Mater, V157, P209
Ao Ch, 2004, J Photoch
Photobio A, V161, P131
Wang Xj, 2009, J Hazard
Mater, V169, P1061
Matos J, 2001, J Catal,
V200, P10
Harada M, 1999, Z Phys
Chem, V213, P59
Yap Ps, 2012, Water Res,
V46, P3054
Appendix A.3 Document Co-citation Network
Document co-citation analysis was used to give an overview of the topics and subtopics in the
present field of this research thesis, and detect emerging fields of research using community
detection in the co-citation network of papers. In total 572 documents were extracted from
document citation network, with a total number of connections, 6,710. The largest connected
component consisted of 548 nodes. The clustering method involved applying community detection
algorithm with Gephi, and it uses the edges weights. Boundary research communities were defined
by adjusting the so called resolution parameter to the decomposition levels and identifying better

Appendix A. Bibliographic Mapping Study
219
the boundaries of the communities, that is the level of detail. This determined how sensitive the
documents were to belong to one of the other cluster. The network clustering was analysed at
resolution 1 (Figure A-6 ) and 1.5 (Figure A-5 ), results can be seen in Table A-3, and the size
distribution of the cluster are shown in Figure A-3 and Figure A-4 for resolutions 1.5 and 1.0,
respectively. At resolution = 1.0, clustering was carried out a total of 2 times, initially over the raw
document co-citation (Figure A-6 ) and then clustering the resultant document clusters (from Figure
A-7 to Figure A-12 ), giving a hierarchical or nested structure of clusters 2 level deep. Layout was
created using Yifan Hu or Force Atlas 2 graph drawing algorithms.
General characteristics, from the generated networks so far, can be read in Table A-2. Modularity
(scale from 0 to 1) measures how suitable the division into clusters is for the network. Low
modularity indicates clusters with no clear boundaries, while high modularity implies a well-
structured network (Chen, Ibekwe-SanJuan and Hou, 2010).
Table A-2 General characteristics from document citation (DC) and document co-citation (DCC) networks and their pruning graphs
1. Raw input data
1,499 records
2. DC network
(isolated removed)
3. Pruned DC
network (LCC ≥ 1)
4. DCC network
(isolated removed)
5. MST-Pathfinder
N. Scaling
Nodes 1,156 634 (54.84% DC
visible)
572 572
Edges 3,503 1863 (53.18% DC
visible)
6,710 563
Modularity
(resolution = 1.0)
0.558 0.523 0.332 0.796
Figure A-3 Size Distribution in community detection from document co-citation (DCC) network (Resolution = 1.5)

Appendix A. Bibliographic Mapping Study
220
In the document co-citation representation, nodes represent the papers and links between papers
represent co-citation. The nodes are sized by their local citation count values and colourized by the
topic they belong; an edge is created between two nodes if there are cited together by a third one
(co-citation), the thickness of the undirected edges reflects the strength of the co-citation, it speaks
about how strong is the linkage between the nodes (seen more clearly in Figure A-7 to Figure A-12 ).
Table A-3 Output data clusterization from document co-citation (DCC) network (Level 1). AC stands for Activated Carbon
Cluster (colour) Members Edges % visible DCC network Label
Resolution = 1.0
1 (violet) 132 2575 23.08 AC-TiO2 in water treatment
2 (light blue) 56 186 9.79 AC-TiO2 in air purification
3 (red) 66 276 11.54 AC- TiO2 visible light
4 (dark blue) 73 337 12.76 AC-Electro* technologies
5 (orange) 155 798 27.1 Combination Adsorption/AOPs
6 (green) 64 301 11.19 AC-Chemical Oxidation
Others clusters 8 (biggest) 10 (biggest) 4.54 not labelled
Resolution ≥ 1.5
1 (violet) 251 4459 43.88 AC-TiO2
2 (green) 23 100 4.02 AC- TiO2 visible light
3 (light blue) 269 1481 47.03 AC-non TiO2 AOPs
Others clusters --- --- 5.07 not labelled
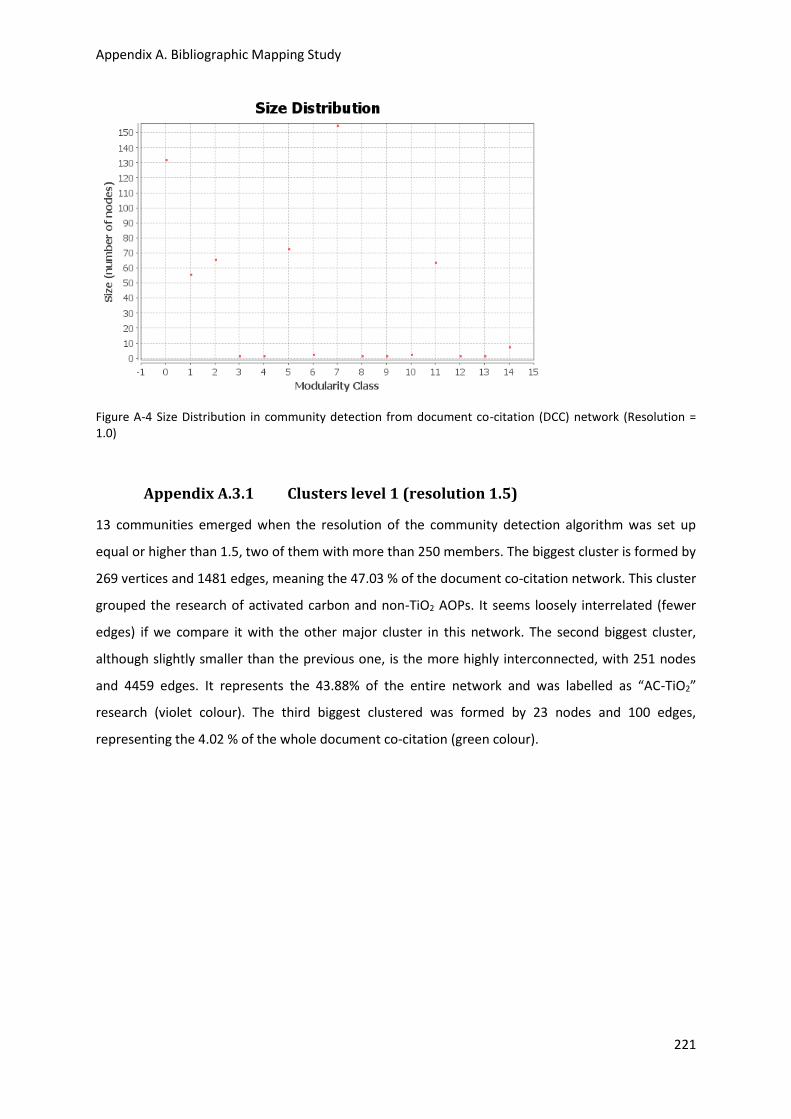
Appendix A. Bibliographic Mapping Study
221
Figure A-4 Size Distribution in community detection from document co-citation (DCC) network (Resolution = 1.0)
Appendix A.3.1 Clusters level 1 (resolution 1.5)
13 communities emerged when the resolution of the community detection algorithm was set up
equal or higher than 1.5, two of them with more than 250 members. The biggest cluster is formed by
269 vertices and 1481 edges, meaning the 47.03 % of the document co-citation network. This cluster
grouped the research of activated carbon and non-TiO2 AOPs. It seems loosely interrelated (fewer
edges) if we compare it with the other major cluster in this network. The second biggest cluster,
although slightly smaller than the previous one, is the more highly interconnected, with 251 nodes
and 4459 edges. It represents the 43.88% of the entire network and was labelled as “AC-TiO2”
research (violet colour). The third biggest clustered was formed by 23 nodes and 100 edges,
representing the 4.02 % of the whole document co-citation (green colour).

Appendix A. Bibliographic Mapping Study
222
Figure A-5 Cluster 1 (Level 1) with resolution = 1.5 from document co-citation (DCC) network
Appendix A.3.2 Clusters level 1 (resolution 1.0)
A resolution of 1.0, using edge weight, was applied to detect communities in the document co-
citation; 15 clusters were found, 6 of them with more than 50 members. Inspecting the data reveals
6 broader categories or topics where activated carbon and AOPs are simultaneously applied and
investigated. The research areas are (Table A-3): The use of activated carbon and TiO2 photocatalysis
in water treatment (cluster 1); application of activated carbon and TiO2 photocatalysis in air
purification (cluster 2); activated carbon and TiO2 combinations to evaluate their visible light activity
(cluster 3); the involvement of activated carbon in technologies using electrical discharge (cluster 4).
Hybrid combinations of an adsorption process and Fenton or ozonation (cluster 5); and experiments

Appendix A. Bibliographic Mapping Study
223
using chemical oxidation and activated carbon combinations such as ozone/ activated carbon,
hydrogen peroxide/ activated carbon (cluster 6).
Figure A-6 Cluster 1 (Level 1) with resolution = 1.0 from document co-citation (DCC) network
The largest cluster is 5 (orange) with 155 members, labelled as “Combination Adsorption/AOPs”. It
mostly represents adsorption process technology combinations with AOPs technologies such as
fenton, ozonation, or non-thermal plasma (but not TiO2 based); they are hybrid systems
combinations for carbon regeneration and/or AOPs improvement. The second largest cluster is 1
(violet) with 132 members, labelled as “AC-TiO2 in water treatment”. It integrates the scientific
literature that research combinations of TiO2 based technology with activated carbon or other
adsorbents (supports -composites-, suspended mixtures, adsorption-TiO2 based photocatalytic
hybrid processes). This research focuses especially on cluster 5 and 1; however the body of
knowledge is broader as it can be seen in Figure A-6 and Table A-3.
Research focused on water treatment outperformed by far investigations on indoor air (limited to
cluster 2). The research activity focused on the use of any type of TiO2 and activated carbon
application represents an important research area (clusters 1 to 3). The so called “AC-TiO2 visible
light” cluster (cluster 3) seems a quite independent area with loose ties with core “AC-TiO2”

Appendix A. Bibliographic Mapping Study
224
research. Due to the peripheral paper's position in this cluster, one could argue that we are speaking
about an emerging sub-field. A closer look of publication year shows documents no older than 2007.
Also there is a recent tendency toward activated carbon fibres instead of activated carbon. If we
agree that the more recent is a highly cited article in a research area, the more likely that topic will
expand quickly in the near future (Small, 2006), then one can determine which of the 6 categories is
more likely to grow rapidly based on the year of publication of the most cited documents within
each cluster. The application of activated carbon in AOPs technology to promote visible light
response on catalysts from Clusters 3 (Figure A-9 ) with highly cited papers from 2011, and the
studies with activated carbon fibres from cluster 2 (years 2008/2009 in Figure A-8 ) seem to be
emerging areas of research with the fastest growth in future.
Figure A-7 Cluster 1 (Level 2) with resolution = 1.0 from document co-citation (DCC) network

Appendix A. Bibliographic Mapping Study
225
Figure A-8 Cluster 2 (Level 2) with resolution = 1.0 from document co-citation (DCC) network
Figure A-9 Cluster 3 (Level 2) with resolution = 1.0 from document co-citation (DCC) network
Figure A-10 Cluster 4 (Level 2) with resolution = 1.0 from document co-citation (DCC) network

Appendix A. Bibliographic Mapping Study
226
Figure A-11 Cluster 5 (Level 2) with resolution = 1.0 from document co-citation (DCC) network
Figure A-12 Cluster 6 (Level 2) with resolution = 1.0 from document co-citation (DCC) network
Appendix A.3.3 MST pathfinder
Another visualization of the graph was also obtained from the pruned network by Minimum
Spanning Tree (MST)-Pathfinder algorithm in Sci2 software. The total number of edges was reduced
to 563, improving the visibility of relevant nodes.
The size of the nodes indicates the local number of citations. Red nodes represent the betweenness
centrality measure of the node in the trimmed network, not in the overall document co-citation
network. The thickness of the link indicates the strength of the connection. It can be considered that
the papers represented in Figure A-13 constitute the core of the research field analysed so far. Table
A-4 summarizes the ten top articles, based on their number of citations and prominent metrics such
as betweenness centrality, closeness centrality, degree, and page rank.

Appendix A. Bibliographic Mapping Study
227
Figure A-13 Document Co-citation network pruned by pathfinder network scaling algorithm

Appendix A. Bibliographic Mapping Study
228
Table A-4 Ten most relevant articles based on the overall document co-citation (DCC) network
LCC Betweenness
centrality
Closeness
centrality
Degree PageRank
Matos J, 1998, Appl Catal
B-environ, V18, P281
Lucking F, 1998, Water
Res, V32, P2607
Conti-ramsden Mg,
2012, Chem Eng Sci,
V79, P219
Tryba B, 2003, Appl Catal
B-environ, V41, P427
Matos J, 1998, Appl
Catal B-environ, V18,
P281
Matos J, 2001, J Catal,
V200, P10
Westerhoff P, 2005,
Environ Sci Technol, V39,
P6649
Soares Osgp, 2011,
Desalination, V279,
P367
Li Yj, 2006, Water Res,
V40, P1119
Li Yj, 2006, Water Res,
V40, P1119
Tryba B, 2003, Appl Catal
B-environ, V41, P427
Li Yj, 2006, Water Res,
V40, P1119
Chang Cp, 2009, Fresen
Environ Bull, V18, P968
Liu Sx, 2007, J Hazard
Mater, V143, P257
Tryba B, 2003, Appl
Catal B-environ, V41,
P427
Torimoto T, 1997, J
Photoch Photobio A,
V103, P153
Liu Sx, 2007, J Hazard
Mater, V143, P257
Jan Yh, 2009, J Air
Waste Manage, V59,
P1186
Matos J, 1998, Appl Catal
B-environ, V18, P281
Liu Sx, 2007, J Hazard
Mater, V143, P257
Torimoto T, 1996,
Environ Sci Technol, V30,
P1275
Ramirez Jh, 2007, Appl
Catal B-environ, V75,
P312
Dusenbury Js, 1996,
Carbon, V34, P1577
Matos J, 2001, J Catal,
V200, P10
Matos J, 2001, J Catal,
V200, P10
Arana J, 2003, Appl Catal
B-environ, V44, P161
Matos J, 1998, Appl Catal
B-environ, V18, P281
Canizares P, 2004, J Appl
Electrochem, V34, P111
Arana J, 2003, Appl Catal
B-environ, V44, P161
Lucking F, 1998, Water
Res, V32, P2607
Takeda N, 1995, J Phys
Chem-us, V99, P9986
Sanchez-polo M, 2005,
Water Res, V39, P3189
Van Hege K, 2004,
Water Res, V38, P1550
El-sheikh Ah, 2004, Surf
Coat Tech, V187, P284
Wang Wd, 2007, Appl
Catal B-environ, V70,
P470
Herrmann Jm, 1999,
Catal Today, V54, P255
Tryba B, 2003, Appl Catal
B-environ, V41, P427
Gimeno O, 2003, Ind
Eng Chem Res, V42,
P1076
Wang Wd, 2007, Appl
Catal B-environ, V70,
P470
Ramirez Jh, 2007, Appl
Catal B-environ, V75,
P312
Ao Ch, 2003, Appl Catal
B-environ, V44, P191
Jans U, 1998, Ozone-sci
Eng, V20, P67
Gotvajn Az, 2009, J
Hazard Mater, V162,
P1446
Torimoto T, 1997, J
Photoch Photobio A,
V103, P153
Arana J, 2003, Appl
Catal B-environ, V44,
P161
Ao Ch, 2004, J Photoch
Photobio A, V161, P131
Matos J, 2001, J Catal,
V200, P10
Welander U, 1998,
Environ Technol, V19,
P591
Puma Gl, 2008, J Hazard
Mater, V157, P209
El-sheikh Ah, 2004, Surf
Coat Tech, V187, P284

Appendix B. Additional Tables
229
APPENDIX B ADDITIONAL TABLES
Table B-1 Session window output from Minitab of full factorial design. Response: Var-pH
Estimated Effects and Coefficients for Var-pH in 207C (coded units)
Term Effect Coef SE Coef T P
Constant 0.6545 0.03127 20.93 0.000
207C (g/L) 0.8500 0.4250 0.03667 11.59 0.001
TiO2 (g/L) -0.2500 -0.1250 0.03667 -3.41 0.042
MB (mg/L) -0.2000 -0.1000 0.03667 -2.73 0.072
207C (g/L)*TiO2 (g/L) -0.4500 -0.2250 0.03667 -6.14 0.009
207C (g/L)*MB (mg/L) 0.2000 0.1000 0.03667 2.73 0.072
TiO2 (g/L)*MB (mg/L) 0.3000 0.1500 0.03667 4.09 0.026
207C (g/L)*TiO2 (g/L)*MB (mg/L) -0.3000 -0.1500 0.03667 -4.09 0.026
S = 0.103719 PRESS = 6.03949
R-Sq = 98.72% R-Sq(pred) = 0.00% R-Sq(adj) = 95.74%
Analysis of Variance for Var-pH in 207C (coded units)
Source DF Seq SS Adj SS Adj MS F P
Main Effects 3 1.65000 1.65000 0.55000 51.13 0.004
207C (g/L) 1 1.44500 1.44500 1.44500 134.32 0.001
TiO2 (g/L) 1 0.12500 0.12500 0.12500 11.62 0.042
MB (mg/L) 1 0.08000 0.08000 0.08000 7.44 0.072
2-Way Interactions 3 0.66500 0.66500 0.22167 20.61 0.017
207C (g/L)*TiO2 (g/L) 1 0.40500 0.40500 0.40500 37.65 0.009
207C (g/L)*MB (mg/L) 1 0.08000 0.08000 0.08000 7.44 0.072
TiO2 (g/L)*MB (mg/L) 1 0.18000 0.18000 0.18000 16.73 0.026
3-Way Interactions 1 0.18000 0.18000 0.18000 16.73 0.026
207C (g/L)*TiO2 (g/L)*MB (mg/L) 1 0.18000 0.18000 0.18000 16.73 0.026
Residual Error 3 0.03227 0.03227 0.01076
Curvature 1 0.02561 0.02561 0.02561 7.68 0.109
Pure Error 2 0.00667 0.00667 0.00333
Total 10 2.52727
Estimated Effects and Coefficients for Var-pH in CA1 (coded units)
Term Effect Coef SE Coef T P
Constant -0.2000 0.01725 -11.59 0.000
CA1 (g/L) -0.1000 -0.0500 0.01725 -2.90 0.023
TiO2 (g/L) 0.1500 0.0750 0.01725 4.35 0.003
Ct Pt -0.0167 0.03303 -0.50 0.629
S = 0.0487950 PRESS = 0.04215
R-Sq = 79.74% R-Sq(pred) = 48.77% R-Sq(adj) = 71.06%
Analysis of Variance for Var-pH in CA1 (coded units)
Source DF Seq SS Adj SS Adj MS F P
Main Effects 2 0.0650000 0.0650000 0.0325000 13.65 0.004
CA1 (g/L) 1 0.0200000 0.0200000 0.0200000 8.40 0.023
TiO2 (g/L) 1 0.0450000 0.0450000 0.0450000 18.90 0.003
Curvature 1 0.0006061 0.0006061 0.0006061 0.25 0.629
Residual Error 7 0.0166667 0.0166667 0.0023810
Lack of Fit 1 0.0050000 0.0050000 0.0050000 2.57 0.160
Pure Error 6 0.0116667 0.0116667 0.0019444
Total 10 0.0822727

Appendix B. Additional Tables
230
Table B-2 Session output from Minitab of the response surface regression. Response: Var-pH
The analysis was done using coded units.
Estimated Regression Coefficients for Var-pH in 207C
Term Coef SE Coef T P
Constant 0.652273 0.06413 10.171 0.000
Block 0.002273 0.06413 0.035 0.972
207C (g/L) 0.372106 0.06838 5.441 0.000
TiO2 (g/L) -0.085538 0.06838 -1.251 0.235
207C (g/L)*TiO2 (g/L) -0.225000 0.08935 -2.518 0.027
S = 0.252716 PRESS = 1.81958
R-Sq = 75.77% R-Sq(pred) = 42.46% R-Sq(adj) = 67.69%
Analysis of Variance for Var-pH in 207C
Source DF Seq SS Adj SS Adj MS F P
Blocks 1 0.00008 0.00008 0.00008 0.00 0.972
Regression 3 2.39589 2.39589 0.79863 12.50 0.001
Linear 2 1.99089 1.99089 0.99544 15.59 0.000
207C (g/L) 1 1.89096 1.89096 1.89096 29.61 0.000
TiO2 (g/L) 1 0.09992 0.09992 0.09992 1.56 0.235
Interaction 1 0.40500 0.40500 0.40500 6.34 0.027
207C (g/L)*TiO2 (g/L) 1 0.40500 0.40500 0.40500 6.34 0.027
Residual Error 12 0.76639 0.76639 0.06387
Lack-of-Fit 5 0.23972 0.23972 0.04794 0.64 0.680
Pure Error 7 0.52667 0.52667 0.07524
Total 16 3.16235
The analysis was done using coded units.
Estimated Regression Coefficients for Var-pH in CA1
Term Coef SE Coef T P
Constant -0.08561 0.01453 -5.891 0.000
Block -0.11894 0.01453 -8.185 0.000
CA1 (g/L) -0.04160 0.01550 -2.685 0.019
TiO2 (g/L) 0.08088 0.01550 5.219 0.000
S = 0.0572678 PRESS = 0.0679325
R-Sq = 88.64% R-Sq(pred) = 81.90% R-Sq(adj) = 86.02%
Analysis of Variance for Var-pH in CA1
Source DF Seq SS Adj SS Adj MS F P
Blocks 1 0.21969 0.21969 0.219688 66.99 0.000
Regression 2 0.11297 0.11297 0.056486 17.22 0.000
Linear 2 0.11297 0.11297 0.056486 17.22 0.000
CA1 (g/L) 1 0.02364 0.02364 0.023639 7.21 0.019
TiO2 (g/L) 1 0.08933 0.08933 0.089333 27.24 0.000
Residual Error 13 0.04263 0.04263 0.003280
Lack-of-Fit 6 0.01097 0.01097 0.001828 0.40 0.855
Pure Error 7 0.03167 0.03167 0.004524
Total 16 0.37529

Appendix B. Additional Tables
231
Table B-3 Session window output from experimental design and power calculation in (A) Decolouration response Fractional Factorial, (B) Decolouration response Full Factorial 207C, (C) Decolouration response Full Factorial CA1, (D) pH variation Full Factorial 207C A
2-Level Fractional Factorial Design
Response: MB Removal
Alpha = 0.05
Assumed standard deviation = 0.008
Factors: 5 Base Design: 5, 16
Blocks: none
Including a term for centre points in model.
Centre Total
Points Effect Reps Runs Power
6 0.01 1 22 0.52261
6 0.05 1 22 1.00000
6 0.10 1 22 1.00000
B
2-Level Full Factorial Design
Response: MB Removal (on TiO2-207C)
Alpha = 0.05
Assumed standard deviation = 0.0603
Factors: 3 Base Design: 3, 8
Blocks: none
Centre Total
Points Effect Reps Runs Power
0 0.04 2 16 0.21608
0 0.10 2 16 0.82675
0 0.27 2 16 1.00000
C
2-Level Full Factorial Design
Response: MB Removal (on TiO2-CA1)
Alpha = 0.05
Assumed standard deviation = 0.05758
Factors: 3 Base Design: 3, 8
Blocks: none
Centre Total
Points Effect Reps Runs Power
0 0.05 2 16 0.334091
0 0.10 2 16 0.859091
0 0.20 2 16 0.999971
D
2-Level Full Factorial Design
Response: pH variation (on TiO2-207C)
Alpha = 0.05
Assumed standard deviation = 0.212
Factors: 3 Base Design: 3, 8
Blocks: none
Centre Total
Points Effect Reps Runs Power
0 0.1 2 16 0.132774
0 0.2 2 16 0.382916
0 0.3 2 16 0.698990
0 0.4 2 16 0.908899

Appendix B. Additional Tables
232
Table B-4 Session window output from experimental design and power calculation in (E) Kf response Full Factorial CA1, (F) Kf response Full Factorial 207C, (G) Ki response Full Factorial CA1, (H) Ki response Full Factorial 207C E
2-Level Full Factorial Design
Response: Kf (TiO2-CA1)
Alpha = 0.05
Assumed standard deviation = 0.000012093
Factors: 3 Base Design: 3, 8
Blocks: none
Centre Total
Points Effect Reps Runs Power
0 0.0000151 2 16 0.590468
0 0.0000151 3 24 0.817282
0 0.0000151 4 32 0.922256
F
2-Level Full Factorial Design
Response: Kf (TiO2-207C)
Alpha = 0.05
Assumed standard deviation = 1.491050E-07
Factors: 3 Base Design: 3, 8
Blocks: none
Centre Total
Points Effect Reps Runs Power
0 0.0000002 2 16 0.426089
0 0.0000002 3 24 0.639763
0 0.0000002 4 32 0.780470
G
2-Level Full Factorial Design
Response: Ki (TiO2-CA1)
Alpha = 0.05
Assumed standard deviation = 1.07836
Factors: 3 Base Design: 3, 8
Blocks: none
Centre Total
Points Effect Reps Runs Power
0 5.7604 2 16 1
0 5.7604 3 24 1
0 5.7604 4 32 1
H
2-Level Full Factorial Design
Response: Ki (TiO2-207C)
Alpha = 0.05
Assumed standard deviation = 1.53082
Factors: 3 Base Design: 3, 8
Blocks: none
Centre Total
Points Effect Reps Runs Power
0 2.34528 2 16 0.765341
0 2.34528 3 24 0.940552
0 2.34528 4 32 0.985890

Appendix B. Additional Tables
233
Table B-5 Full model fit in the fractional factorial design. Response: Decolouration
Estimated Effects and Coefficients for Decolouration (coded units)
Term Effect Coef SE Coef T P
Constant 0.7804 0.011465 68.07 0.000
MB (mg/L) -0.2604 -0.1302 0.011465 -11.35 0.000
AC (mg) 0.4283 0.2141 0.011465 18.68 0.000
TiO2 (mg) 0.0444 0.0222 0.011465 1.93 0.111
Type AC -0.0740 -0.0370 0.009777 -3.78 0.013
t (min) 0.0814 0.0407 0.011465 3.55 0.016
MB*AC 0.2581 0.1290 0.011465 11.25 0.000
MB*TiO2 -0.0571 -0.0285 0.011465 -2.49 0.055
MB*Type AC 0.0596 0.0298 0.011465 2.60 0.048
MB*t -0.0281 -0.0140 0.011465 -1.22 0.275
AC*TiO2 -0.0344 -0.0172 0.011465 -1.50 0.194
AC*Type AC 0.0966 0.0483 0.011465 4.21 0.008
AC*t -0.0725 -0.0363 0.011465 -3.16 0.025
TiO2*Type AC 0.0319 0.0159 0.011465 1.39 0.223
TiO2*t -0.0680 -0.0340 0.011465 -2.97 0.031
Type AC*t 0.0593 0.0296 0.011465 2.58 0.049
Ct Pt 0.2167 0.021954 9.87 0.000
S = 0.0458596 PRESS = 9.88005
R-Sq = 99.37% R-Sq(pred) = 0.00% R-Sq(adj) = 97.37%
Analysis of Variance for Decolouration (coded units)
Source DF Seq SS Adj SS Adj MS F P
Main Effects 5 1.06925 1.06925 0.213850 101.68 0.000
MB (mg/L) 1 0.27116 0.27116 0.271162 128.93 0.000
AC (mg) 1 0.73361 0.73361 0.733609 348.82 0.000
TiO2 (mg) 1 0.00787 0.00787 0.007872 3.74 0.111
Type AC 1 0.03012 0.03012 0.030122 14.32 0.013
t (min) 1 0.02649 0.02649 0.026486 12.59 0.016
2-Way Interactions 10 0.39653 0.39653 0.039653 18.85 0.002
MB*AC 1 0.26641 0.26641 0.266406 126.67 0.000
MB*TiO2 1 0.01303 0.01303 0.013027 6.19 0.055
MB*Type AC 1 0.01420 0.01420 0.014203 6.75 0.048
MB*t 1 0.00315 0.00315 0.003152 1.50 0.275
AC*TiO2 1 0.00474 0.00474 0.004738 2.25 0.194
AC*Type AC 1 0.03736 0.03736 0.037357 17.76 0.008
AC*t 1 0.02103 0.02103 0.021035 10.00 0.025
TiO2*Type AC 1 0.00406 0.00406 0.004062 1.93 0.223
TiO2*t 1 0.01850 0.01850 0.018499 8.80 0.031
Type AC*t 1 0.01405 0.01405 0.014047 6.68 0.049
Curvature 1 0.20482 0.20482 0.204824 97.39 0.000
Residual Error 5 0.01052 0.01052 0.002103
Lack of Fit 1 0.01051 0.01051 0.010512 13867.12 0.000
Pure Error 4 0.00000 0.00000 0.000001
Total 21 1.68112

Appendix B. Additional Tables
234
Table B-6 Session window output from Minitab of the best reduced model in the fractional factorial design. Response: Decolouration
Estimated Effects and Coefficients for Johnson_Decol (coded units)
Term Effect Coef SE Coef T P
Constant -0.2025 0.04390 -4.61 0.001
MB (mg/L) -0.3236 -0.1618 0.04390 -3.69 0.005
AC (mg) 1.8872 0.9436 0.04390 21.49 0.000
TiO2 (mg) 0.4520 0.2260 0.04390 5.15 0.001
Type AC -0.5583 -0.2791 0.03744 -7.46 0.000
t (min) 0.5928 0.2964 0.04390 6.75 0.000
MB*AC 0.5939 0.2969 0.04390 6.76 0.000
AC*TiO2 0.5327 0.2664 0.04390 6.07 0.000
AC*t 0.2669 0.1334 0.04390 3.04 0.014
TiO2*Type AC 0.2722 0.1361 0.04390 3.10 0.013
TiO2*t -0.5143 -0.2572 0.04390 -5.86 0.000
Type AC*t -0.1990 -0.0995 0.04390 -2.27 0.050
Ct Pt 0.5466 0.08407 6.50 0.000
S = 0.175609 PRESS = 1.73866
R-Sq = 98.87% R-Sq(pred) = 92.91% R-Sq(adj) = 97.36%
Analysis of Variance for Johnson_Decol (coded units)
Source DF Seq SS Adj SS Adj MS F P
Main Effects 5 18.6020 18.6020 3.7204 120.64 0.000
MB (mg/L) 1 0.4189 0.4189 0.4189 13.58 0.005
AC (mg) 1 14.2464 14.2464 14.2464 461.97 0.000
TiO2 (mg) 1 0.8171 0.8171 0.8171 26.50 0.001
Type AC 1 1.7142 1.7142 1.7142 55.58 0.000
t (min) 1 1.4055 1.4055 1.4055 45.58 0.000
2-Way Interactions 6 4.3438 4.3438 0.7240 23.48 0.000
MB*AC 1 1.4108 1.4108 1.4108 45.75 0.000
AC*TiO2 1 1.1353 1.1353 1.1353 36.81 0.000
AC*t 1 0.2848 0.2848 0.2848 9.24 0.014
TiO2*Type AC 1 0.2963 0.2963 0.2963 9.61 0.013
TiO2*t 1 1.0580 1.0580 1.0580 34.31 0.000
Type AC*t 1 0.1585 0.1585 0.1585 5.14 0.050
Curvature 1 1.3038 1.3038 1.3038 42.28 0.000
Residual Error 9 0.2775 0.2775 0.0308
Lack of Fit 5 0.1194 0.1194 0.0239 0.60 0.706
Pure Error 4 0.1582 0.1582 0.0395
Total 21 24.5271

Appendix B. Additional Tables
235
Table B-7 Session window output from Minitab of the best reduced model in the full factorial design of CA1 and 207C. Response: Decolouration
Estimated Effects and Coefficients for Johnson_Decoloration in CA1 (coded units)
Term Effect Coef SE Coef T P
Constant -0.1589 0.08949 -1.78 0.106
MB, mg/L -0.0061 -0.0031 0.08949 -0.03 0.973
TiO2, mg 0.2155 0.1078 0.08949 1.20 0.256
CA1, mg 1.6884 0.8442 0.08949 9.43 0.000
MB, mg/L*CA1, mg 1.4296 0.7148 0.08949 7.99 0.000
TiO2, mg*CA1, mg 0.4343 0.2171 0.08949 2.43 0.036
S = 0.357976 PRESS = 3.28057
R-Sq = 94.12% R-Sq(pred) = 84.95% R-Sq(adj) = 91.18%
Analysis of Variance for Johnson_Decoloration in CA1 (coded units)
Source DF Seq SS Adj SS Adj MS F P
Main Effects 3 11.5894 11.5894 3.8631 30.15 0.000
MB, mg/L 1 0.0001 0.0001 0.0001 0.00 0.973
TiO2, mg 1 0.1858 0.1858 0.1858 1.45 0.256
CA1, mg 1 11.4034 11.4034 11.4034 88.99 0.000
2-Way Interactions 2 8.9299 8.9299 4.4650 34.84 0.000
MB, mg/L*CA1, mg 1 8.1755 8.1755 8.1755 63.80 0.000
TiO2, mg*CA1, mg 1 0.7544 0.7544 0.7544 5.89 0.036
Residual Error 10 1.2815 1.2815 0.1281
Lack of Fit 2 0.1034 0.1034 0.0517 0.35 0.714
Pure Error 8 1.1781 1.1781 0.1473
Total 15 21.8008
Estimated Effects and Coefficients for Johnson_Decoloration in 207C (coded units)
Term Effect Coef SE Coef T P
Constant -0.0415 0.08693 -0.48 0.643
MB, mg/L -0.7575 -0.3788 0.08693 -4.36 0.001
TiO2, mg 0.0250 0.0125 0.08693 0.14 0.888
207C, mg 1.6328 0.8164 0.08693 9.39 0.000
TiO2, mg*207C, mg 0.3612 0.1806 0.08693 2.08 0.062
S = 0.347718 PRESS = 2.81385
R-Sq = 91.02% R-Sq(pred) = 81.01% R-Sq(adj) = 87.76%
Analysis of Variance for Johnson_Decoloration in 207C (coded units)
Source DF Seq SS Adj SS Adj MS F P
Main Effects 3 12.9620 12.9620 4.3207 35.74 0.000
MB, mg/L 1 2.2953 2.2953 2.2953 18.98 0.001
TiO2, mg 1 0.0025 0.0025 0.0025 0.02 0.888
207C, mg 1 10.6642 10.6642 10.6642 88.20 0.000
2-Way Interactions 1 0.5219 0.5219 0.5219 4.32 0.062
TiO2, mg*207C, mg 1 0.5219 0.5219 0.5219 4.32 0.062
Residual Error 11 1.3300 1.3300 0.1209
Lack of Fit 3 0.1758 0.1758 0.0586 0.41 0.753
Pure Error 8 1.1542 1.1542 0.1443
Total 15 14.8139

Appendix B. Additional Tables
236
Table B-8 Session window output from Minitab of the best reduced model in full factorial. Response: Var-pH
Estimated Effects and Coefficients for pH variation in 207C (coded units)
Term Effect Coef SE Coef T P
Constant 1.0375 0.08385 12.37 0.000
MB, mg/L -0.2000 -0.1000 0.08385 -1.19 0.261
TiO2, mg -0.7500 -0.3750 0.08385 -4.47 0.001
207C, mg 1.7750 0.8875 0.08385 10.58 0.000
MB, mg/L*207C, mg -0.3500 -0.1750 0.08385 -2.09 0.063
TiO2, mg*207C, mg 0.4500 0.2250 0.08385 2.68 0.023
S = 0.335410 PRESS = 2.88
R-Sq = 93.55% R-Sq(pred) = 83.48% R-Sq(adj) = 90.32%
Analysis of Variance for pH variation (coded units)
Source DF Seq SS Adj SS Adj MS F P
Main Effects 3 15.0125 15.0125 5.0042 44.48 0.000
MB, mg/L 1 0.1600 0.1600 0.1600 1.42 0.261
TiO2, mg 1 2.2500 2.2500 2.2500 20.00 0.001
207C, mg 1 12.6025 12.6025 12.6025 112.02 0.000
2-Way Interactions 2 1.3000 1.3000 0.6500 5.78 0.021
MB, mg/L*207C, mg 1 0.4900 0.4900 0.4900 4.36 0.063
TiO2, mg*207C, mg 1 0.8100 0.8100 0.8100 7.20 0.023
Residual Error 10 1.1250 1.1250 0.1125
Lack of Fit 2 0.5050 0.5050 0.2525 3.26 0.092
Pure Error 8 0.6200 0.6200 0.0775
Total 15 17.4375
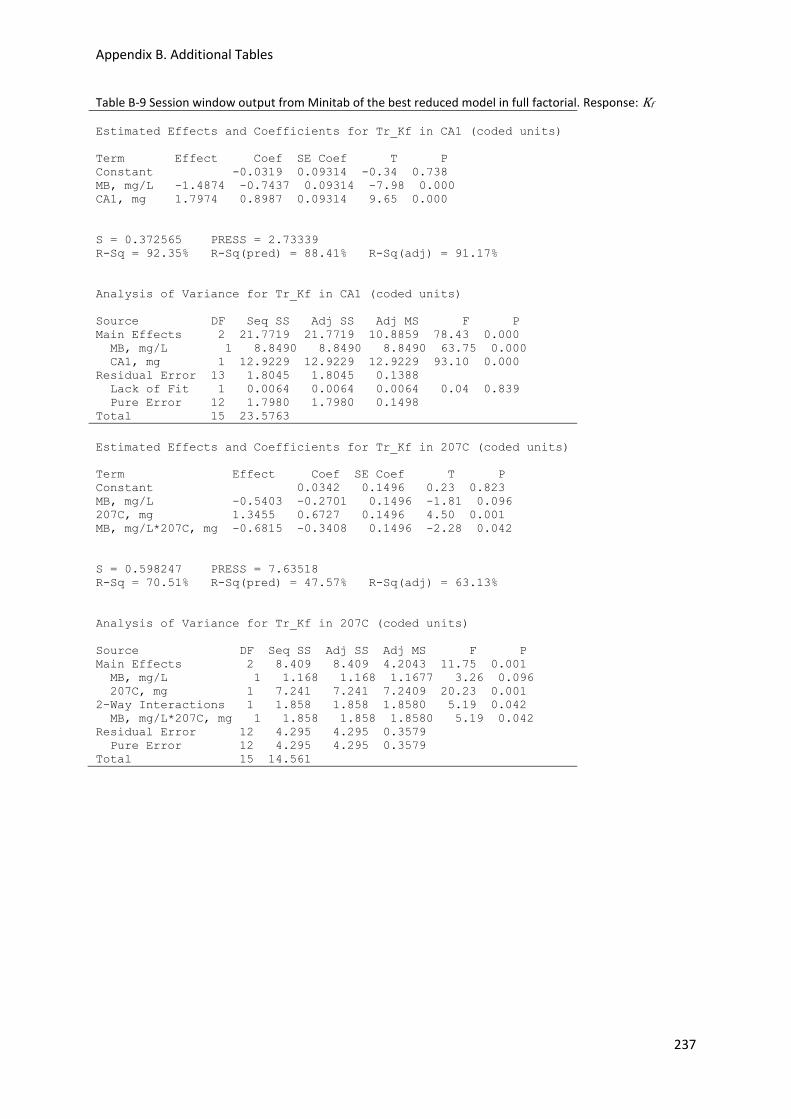
Appendix B. Additional Tables
237
Table B-9 Session window output from Minitab of the best reduced model in full factorial. Response: Kf
Estimated Effects and Coefficients for Tr_Kf in CA1 (coded units)
Term Effect Coef SE Coef T P
Constant -0.0319 0.09314 -0.34 0.738
MB, mg/L -1.4874 -0.7437 0.09314 -7.98 0.000
CA1, mg 1.7974 0.8987 0.09314 9.65 0.000
S = 0.372565 PRESS = 2.73339
R-Sq = 92.35% R-Sq(pred) = 88.41% R-Sq(adj) = 91.17%
Analysis of Variance for Tr_Kf in CA1 (coded units)
Source DF Seq SS Adj SS Adj MS F P
Main Effects 2 21.7719 21.7719 10.8859 78.43 0.000
MB, mg/L 1 8.8490 8.8490 8.8490 63.75 0.000
CA1, mg 1 12.9229 12.9229 12.9229 93.10 0.000
Residual Error 13 1.8045 1.8045 0.1388
Lack of Fit 1 0.0064 0.0064 0.0064 0.04 0.839
Pure Error 12 1.7980 1.7980 0.1498
Total 15 23.5763
Estimated Effects and Coefficients for Tr_Kf in 207C (coded units)
Term Effect Coef SE Coef T P
Constant 0.0342 0.1496 0.23 0.823
MB, mg/L -0.5403 -0.2701 0.1496 -1.81 0.096
207C, mg 1.3455 0.6727 0.1496 4.50 0.001
MB, mg/L*207C, mg -0.6815 -0.3408 0.1496 -2.28 0.042
S = 0.598247 PRESS = 7.63518
R-Sq = 70.51% R-Sq(pred) = 47.57% R-Sq(adj) = 63.13%
Analysis of Variance for Tr_Kf in 207C (coded units)
Source DF Seq SS Adj SS Adj MS F P
Main Effects 2 8.409 8.409 4.2043 11.75 0.001
MB, mg/L 1 1.168 1.168 1.1677 3.26 0.096
207C, mg 1 7.241 7.241 7.2409 20.23 0.001
2-Way Interactions 1 1.858 1.858 1.8580 5.19 0.042
MB, mg/L*207C, mg 1 1.858 1.858 1.8580 5.19 0.042
Residual Error 12 4.295 4.295 0.3579
Pure Error 12 4.295 4.295 0.3579
Total 15 14.561

Appendix B. Additional Tables
238
Table B-10 Session window output from Minitab of the best reduced model in full factorial. Response: Ki
Estimated Effects and Coefficients for Ki in CA1 (coded units)
Term Effect Coef SE Coef T P
Constant 5.632 0.1672 33.69 0.000
MB, mg/L 5.458 2.729 0.1672 16.33 0.000
TiO2, mg 0.681 0.340 0.1672 2.04 0.076
CA1, mg -7.121 -3.560 0.1672 -21.30 0.000
MB, mg/L*TiO2, mg -0.430 -0.215 0.1672 -1.29 0.234
MB, mg/L*CA1, mg -1.533 -0.767 0.1672 -4.59 0.002
TiO2, mg*CA1, mg 0.653 0.326 0.1672 1.95 0.087
MB, mg/L*TiO2, mg*CA1, mg 1.754 0.877 0.1672 5.25 0.001
S = 0.668607 PRESS = 14.3051
R-Sq = 98.98% R-Sq(pred) = 95.93% R-Sq(adj) = 98.09%
Analysis of Variance for Ki (coded units)
Source DF Seq SS Adj SS Adj MS F P
Main Effects 3 323.858 323.858 107.953 241.49 0.000
MB, mg/L 1 119.173 119.173 119.173 266.58 0.000
TiO2, mg 1 1.853 1.853 1.853 4.14 0.076
CA1, mg 1 202.832 202.832 202.832 453.73 0.000
2-Way Interactions 3 11.848 11.848 3.949 8.83 0.006
MB, mg/L*TiO2, mg 1 0.741 0.741 0.741 1.66 0.234
MB, mg/L*CA1, mg 1 9.403 9.403 9.403 21.03 0.002
TiO2, mg*CA1, mg 1 1.704 1.704 1.704 3.81 0.087
3-Way Interactions 1 12.306 12.306 12.306 27.53 0.001
MB, mg/L*TiO2, mg*CA1, mg 1 12.306 12.306 12.306 27.53 0.001
Residual Error 8 3.576 3.576 0.447
Pure Error 8 3.576 3.576 0.447
Total 15 351.588
Estimated Effects and Coefficients for Johnson Ki in 207C (coded units)
Term Effect Coef SE Coef T P
Constant -0.1564 0.06884 -2.27 0.044
MB, mg/L 1.4657 0.7329 0.06884 10.65 0.000
TiO2, mg -0.2397 -0.1198 0.06884 -1.74 0.110
207C, mg -1.5363 -0.7681 0.06884 -11.16 0.000
TiO2, mg*207C, mg 0.2708 0.1354 0.06884 1.97 0.075
S = 0.275347 PRESS = 1.76445
R-Sq = 95.70% R-Sq(pred) = 90.90% R-Sq(adj) = 94.14%
Analysis of Variance for Johnson Ki (coded units)
Source DF Seq SS Adj SS Adj MS F P
Main Effects 3 18.2639 18.2639 6.08796 80.30 0.000
MB, mg/L 1 8.5935 8.5935 8.59353 113.35 0.000
TiO2, mg 1 0.2298 0.2298 0.22977 3.03 0.110
207C, mg 1 9.4406 9.4406 9.44058 124.52 0.000
2-Way Interactions 1 0.2933 0.2933 0.29325 3.87 0.075
TiO2, mg*207C, mg 1 0.2933 0.2933 0.29325 3.87 0.075
Residual Error 11 0.8340 0.8340 0.07582
Lack of Fit 3 0.1123 0.1123 0.03742 0.41 0.747
Pure Error 8 0.7217 0.7217 0.09022
Total 15 19.3911

Appendix B. Additional Tables
239
Table B-11 Summary of the main findings from Fractional Factorial Design in Chapter 6
Factors and
Interactions(1)
Effect on MB
removal(2)
Importance of the Effect(3)
Fractional Factorial
AC mass + The most important factor affecting the dye removal, and the factor that most interacted with the dye
Type of AC - CA1 had a greater effect on the removal of methylene blue than 207C
Interaction MB*AC + Opposite effect: At high amount of AC, high amount of methylene blue improved removal, but at low amount of
AC, low amounts of methylene blue were required to improve the removal.
The interaction of methylene blue with other factors seemed unimportant
Time (t) + Longer periods of time improved the removal of the dye
Interaction TiO2*AC + Opposite effect: At high amount of AC, high amount of TiO2 improved removal, but at low amount of AC, low
amounts of TiO2 were required to improve the removal
Interaction TiO2*t - At low level of TiO2, longer periods of time improved the removal.
The importance of TiO2 in the removal was higher when time was set at low level
TiO2 mass + Effect of TiO2 addition was more important when AC was set at high level
MB concentration - Methylene blue effect more important at low AC concentrations.
Interaction TiO2*Type
AC + The importance of TiO2 in the removal was higher for 207C than for CA1.
In both AC, high additions of TiO2 improved the removal
Interaction AC*t + The effect of contact time was more important at high amount of AC
Interaction Type AC*t - The effect of contact time was more important for CA1 than for 207C
(1) Named from the most to the least important (2) + : Increase in the level of the factor or interaction leads to an increase in the response
- : Increase in the level of the factor or interaction leads to a reduction in the response (3) Importance understood as the effect that produced the largest shift in the response

Appendix B. Additional Tables
240
Table B-12 Summary of the main findings from Full Factorial Design in Chapter 6
AC
Type
Factors and
Interactions(1)
Effect on
Response(2) Importance of the Effect(3)
Full Factorial (Response: KF)
CA1 AC mass + The greatest change in KF was seen when dye and CA1 factors moved from their low to high levels
High level of MB was not desirable for achieving high external mass transfer rates in CA1 and 207C MB concentration - 207C AC mass + The amount of 207C was the most important factor , the one that produced the greatest change in KF
Higher external mass transfer rates were obtained at high amount of 207C
Interaction MB*AC - The interaction effect dye*207C on the mean response KF was more important at high level of carbon
High dye concentration produced lower KF values when the amount of 207C was high, but higher KF values if
207C was set at low level
Full Factorial (Response: Ki)
CA1 AC mass - The higher the amount of carbon, the lower the intraparticle diffusion rate was
MB concentration + The intraparticle diffusion rate increased with increase of initial dye concentration for both carbons
MB*TiO2*AC + A three way interaction was observed between dye, CA1 and TiO2 with positive sign, therefore the
interaction set at its high level would increase the mean response Ki. Interaction MB*AC - 207C AC mass - High amount of carbon produced lower intraparticle diffusion rates
MB concentration + The importance of the main effect MB was greater than in CA1, and no interactions were highlighted
Full Factorial (Response: pH variation)
207C AC mass + The higher the amount of 207C, the more positive the change in pH was (pH increased)
TiO2 mass - Lower pH variation was obtained at high amount of TiO2 when compared with its low level
Interaction TiO2*AC + The importance of TiO2 in the pH variation was higher at low amount of 207C
The importance of 207C in the pH variation was higher at high amount of TiO2
The most negative change in pH (acidification) was measured at high amount of TiO2, when 207C was set its
low level (1) (2) (3) See Table B-11

Appendix B. Additional Tables
241
Table B-13 Power and sample size of the factorial design in (A) bell TiO2-dye photocatalysis and (B) coiled-tube TiO2-dye photocatalysis A 2-Level Factorial Design
Alpha = 0.05
Assumed standard deviation = 0.02276
Factors: 3 Base Design: 3, 8
Blocks: none
Including a term for centre points
in model.
Centre Total
Points Effect Reps Runs Power
3 0.05 1 11 0.40657
3 0.05 2 19 0.97630
3 0.05 3 27 0.99909
3 0.10 1 11 0.85535
3 0.10 2 19 1.00000
3 0.10 3 27 1.00000
B
2-Level Factorial Design
Alpha = 0.05
Assumed standard deviation = 0.03621
Factors: 3 Base Design: 3, 8
Blocks: none
Including a term for centre points in model.
Centre Total
Points Effect Reps Runs Power
3 0.05 1 11 0.21116
3 0.05 2 19 0.70213
3 0.05 3 27 0.89199
3 0.10 1 11 0.54838
3 0.10 2 19 0.99856
3 0.10 3 27 0.99999
Table B-14 Response surface regression from TiO2-dye photocatalysis in the coiled-tube photoreactor
The analysis was done using coded units.
Estimated Regression Coefficients for Mineralization
Term Coef SE Coef T P
Constant 0.458473 0.01893 24.225 0.000
Block 0.008597 0.01072 0.802 0.446
MB (mg/L) -0.126146 0.01122 -11.240 0.000
pH 0.007426 0.01122 0.662 0.527
TiO2 (g/L) 0.206148 0.01122 18.368 0.000
pH*pH -0.099772 0.01194 -8.359 0.000
TiO2 (g/L)*TiO2 (g/L) -0.025150 0.01194 -2.107 0.068
MB (mg/L)*pH -0.029122 0.01466 -1.986 0.082
MB (mg/L)*TiO2 (g/L) -0.031646 0.01466 -2.158 0.063
S = 0.0414763 PRESS = 0.0702160
R-Sq = 98.56% R-Sq(pred) = 92.65% R-Sq(adj) = 97.12%
Analysis of Variance for Mineralization
Source DF Seq SS Adj SS Adj MS F P
Blocks 1 0.007557 0.001107 0.001107 0.64 0.446
Regression 7 0.933454 0.933454 0.133351 77.52 0.000
Linear 3 0.798446 0.798446 0.266149 154.71 0.000
MB (mg/L) 1 0.217318 0.217318 0.217318 126.33 0.000
pH 1 0.000753 0.000753 0.000753 0.44 0.527
TiO2 (g/L) 1 0.580374 0.580374 0.580374 337.37 0.000
Square 2 0.120212 0.120212 0.060106 34.94 0.000
pH*pH 1 0.112574 0.120206 0.120206 69.88 0.000
TiO2 (g/L)*TiO2 (g/L) 1 0.007638 0.007638 0.007638 4.44 0.068
Interaction 2 0.014796 0.014796 0.007398 4.30 0.054
MB (mg/L)*pH 1 0.006785 0.006785 0.006785 3.94 0.082
MB (mg/L)*TiO2 (g/L) 1 0.008012 0.008012 0.008012 4.66 0.063
Residual Error 8 0.013762 0.013762 0.001720
Lack-of-Fit 6 0.011140 0.011140 0.001857 1.42 0.470
Pure Error 2 0.002622 0.002622 0.001311
Total 16 0.954773

Appendix B. Additional Tables
242
Table B-15 Session window output from Minitab in response surface regression. Response: Transformed mineralization response (Johnson transformation) in the bell photoreactor
The analysis was done using coded units.
Estimated Regression Coefficients for JohnsonMiner.
Term Coef SE Coef T P
Constant 0.615826 0.2978 2.068 0.077
Block 0.116598 0.1269 0.919 0.389
MB,mg/L -0.362322 0.1300 -2.786 0.027
TiO2, g/L 0.162702 0.1300 1.251 0.251
pH -0.002440 0.1300 -0.019 0.986
MB,mg/L*MB,mg/L 0.253734 0.1462 1.735 0.126
TiO2, g/L*TiO2, g/L -0.399709 0.1462 -2.734 0.029
pH*pH -0.697671 0.1462 -4.771 0.002
MB,mg/L*TiO2, g/L 0.329518 0.1699 1.940 0.094
MB,mg/L*pH 0.390275 0.1699 2.297 0.055
S = 0.480526 PRESS = 12.7603
R-Sq = 89.68% R-Sq(pred) = 18.51% R-Sq(adj) = 76.41%
Analysis of Variance for JohnsonMiner.
Source DF Seq SS Adj SS Adj MS F P
Blocks 1 0.6687 0.1950 0.19500 0.84 0.389
Regression 8 13.3728 13.3728 1.67161 7.24 0.008
Linear 3 2.1544 2.1544 0.71815 3.11 0.098
MB,mg/L 1 1.7928 1.7928 1.79283 7.76 0.027
TiO2, g/L 1 0.3615 0.3615 0.36153 1.57 0.251
pH 1 0.0001 0.0001 0.00008 0.00 0.986
Square 3 9.1312 9.1312 3.04375 13.18 0.003
MB,mg/L*MB,mg/L 1 3.5131 0.6953 0.69532 3.01 0.126
TiO2, g/L*TiO2, g/L 1 0.3613 1.7255 1.72548 7.47 0.029
pH*pH 1 5.2568 5.2568 5.25685 22.77 0.002
Interaction 2 2.0872 2.0872 1.04359 4.52 0.055
MB,mg/L*TiO2, g/L 1 0.8687 0.8687 0.86866 3.76 0.094
MB,mg/L*pH 1 1.2185 1.2185 1.21851 5.28 0.055
Residual Error 7 1.6163 1.6163 0.23090
Lack-of-Fit 5 1.3108 1.3108 0.26217 1.72 0.408
Pure Error 2 0.3055 0.3055 0.15274
Total 16 15.6579

Appendix B. Additional Tables
243
Table B-16 Distribution identification for mineralization in the coiled-tube photoreactor
Descriptive Statistics
N N* Mean StDev Median Minimum Maximum Skewness Kurtosis
17 0 0.360646 0.244281 0.365719 0.0368530 0.766749 0.267163 -1.23780
Box-Cox transformation: Lambda = 0.5
Goodness of Fit Test
Distribution AD P LRT P
Normal 0.444 0.251
Box-Cox Transformation 0.375 0.374
Lognormal 0.700 0.055
3-Parameter Lognormal 0.445 * 0.210
Exponential 0.720 0.244
2-Parameter Exponential 0.611 0.225 0.205
Weibull 0.463 0.240
3-Parameter Weibull 0.419 0.353 1.000
Smallest Extreme Value 0.612 0.098
Largest Extreme Value 0.444 >0.250
Gamma 0.481 0.250
3-Parameter Gamma 0.425 * 1.000
Logistic 0.471 0.193
Loglogistic 0.624 0.064
3-Parameter Loglogistic 0.453 * 0.442
ML Estimates of Distribution Parameters
Distribution Location Shape Scale Threshold
Normal* 0.36065 0.24428
Box-Cox Transformation* 0.55977 0.22418
Lognormal* -1.35236 0.96638
3-Parameter Lognormal -0.49399 0.37943 -0.29348
Exponential 0.36065
2-Parameter Exponential 0.34403 0.01662
Weibull 1.45122 0.39613
3-Parameter Weibull 1.74060 0.45259 -0.04233
Smallest Extreme Value 0.48133 0.22530
Largest Extreme Value 0.24577 0.19954
Gamma 1.65075 0.21847
3-Parameter Gamma 4.51414 0.11617 -0.16378
Logistic 0.35145 0.14423
Loglogistic -1.24421 0.53897
3-Parameter Loglogistic -0.72386 0.29593 -0.17013
* Scale: Adjusted ML estimate

Appendix B. Additional Tables
244
Table B-17 Distribution identification for mineralization in the bell photoreactor
Descriptive Statistics
N N* Mean StDev Median Minimum Maximum Skewness Kurtosis
17 0 0.668346 0.151924 0.710280 0.169101 0.863757 -2.34324 7.34195
Box-Cox transformation: Lambda = 3
Johnson transformation function:
0.548963 + 0.774105 * Asinh( ( X - 0.742383 ) / 0.0432517 )
Goodness of Fit Test
Distribution AD P LRT P
Normal 1.256 <0.005
Box-Cox Transformation 0.317 0.510
Lognormal 2.579 <0.005
3-Parameter Lognormal 1.229 * 0.000
Exponential 5.200 <0.003
2-Parameter Exponential 4.630 <0.010 0.005
Weibull 0.919 0.017
3-Parameter Weibull 0.443 0.183 0.016
Smallest Extreme Value 0.443 >0.250
Largest Extreme Value 2.322 <0.010
Gamma 2.104 <0.005
3-Parameter Gamma 31.590 * 1.000
Logistic 0.632 0.060
Loglogistic 1.246 <0.005
3-Parameter Loglogistic 0.632 * 0.002
Johnson Transformation 0.157 0.942
ML Estimates of Distribution Parameters
Distribution Location Shape Scale Threshold
Normal* 0.66835 0.15192
Box-Cox Transformation* 0.33527 0.14583
Lognormal* -0.44735 0.36269
3-Parameter Lognormal 6.27611 0.00028 -531.04560
Exponential 0.66835
2-Parameter Exponential 0.53045 0.13790
Weibull 6.37364 0.71581
3-Parameter Weibull 5470.82342 512.98883 -512.26251
Smallest Extreme Value 0.72633 0.09376
Largest Extreme Value 0.58201 0.21008
Gamma 11.42614 0.05849
3-Parameter Gamma 31154.33169 0.00084 -25.71609
Logistic 0.69075 0.06722
Loglogistic -0.37971 0.12765
3-Parameter Loglogistic 6.23949 0.00013 -511.90838
Johnson Transformation* -0.02762 0.98925
* Scale: Adjusted ML estimate

Appendix B. Additional Tables
245
Table B-18 Reduced linear model of CA1 regeneration in the bell photoreactor
The analysis was done using coded units.
Estimated Regression Coefficients for Regeneration (%)
Term Coef SE Coef T P
Constant 51.4288 0.8580 59.942 0.000
Block 0.4795 0.8580 0.559 0.586
CA1 (g/L) -2.2505 0.9149 -2.460 0.029
pH -4.5309 0.9149 -4.952 0.000
S = 3.38104 PRESS = 256.867
R-Sq = 70.38% R-Sq(pred) = 48.80% R-Sq(adj) = 63.54%
Analysis of Variance for Regeneration (%)
Source DF Seq SS Adj SS Adj MS F P
Blocks 1 3.571 3.571 3.571 0.31 0.586
Regression 2 349.524 349.524 174.762 15.29 0.000
Linear 2 349.524 349.524 174.762 15.29 0.000
CA1 (g/L) 1 69.166 69.166 69.166 6.05 0.029
pH 1 280.357 280.357 280.357 24.53 0.000
Residual Error 13 148.608 148.608 11.431
Lack-of-Fit 6 74.875 74.875 12.479 1.18 0.410
Pure Error 7 73.734 73.734 10.533
Total 16 501.703
Table B-19 Session output window of the response surface regression from CA1 regeneration in the bell reactor. Response: Var-pH
The analysis was done using coded units.
Estimated Regression Coefficients for Var-pH
Term Coef SE Coef T P
Constant -0.1917 0.11673 -1.642 0.124
Block -0.1167 0.08659 -1.347 0.201
pH -1.0078 0.09169 -10.991 0.000
pH*pH -0.6010 0.09453 -6.357 0.000
S = 0.338847 PRESS = 2.53294
R-Sq = 92.55% R-Sq(pred) = 87.36% R-Sq(adj) = 90.84%
Analysis of Variance for Var-pH
Source DF Seq SS Adj SS Adj MS F P
Blocks 1 0.0418 0.2084 0.2084 1.82 0.201
Regression 2 18.5117 18.5117 9.2559 80.61 0.000
Linear 1 13.8711 13.8711 13.8711 120.81 0.000
pH 1 13.8711 13.8711 13.8711 120.81 0.000
Square 1 4.6406 4.6406 4.6406 40.42 0.000
pH*pH 1 4.6406 4.6406 4.6406 40.42 0.000
Residual Error 13 1.4926 1.4926 0.1148
Lack-of-Fit 2 0.1714 0.1714 0.0857 0.71 0.511
Pure Error 11 1.3213 1.3213 0.1201
Total 16 20.0462

Appendix B. Additional Tables
246
Table B-20 Session output window of the response surface regression from 207C regeneration in the bell reactor. Response: Var-pH
The analysis was done using coded units.
Estimated Regression Coefficients for Var-pH
Term Coef SE Coef T P
Constant 0.38735 0.09244 4.190 0.002
Block -0.05309 0.05236 -1.014 0.337
207C (g/L) -0.03927 0.05482 -0.716 0.492
TiO2 (g/L) -0.06091 0.05482 -1.111 0.295
pH -1.18854 0.05482 -21.680 0.000
TiO2 (g/L)*TiO2 (g/L) -0.19822 0.05830 -3.400 0.008
pH*pH -1.01139 0.05830 -17.348 0.000
TiO2 (g/L)*pH -0.12500 0.07163 -1.745 0.115
S = 0.202591 PRESS = 1.75291
R-Sq = 98.86% R-Sq(pred) = 94.58% R-Sq(adj) = 97.97%
Analysis of Variance for Var-pH
Source DF Seq SS Adj SS Adj MS F P
Blocks 1 0.0927 0.0422 0.0422 1.03 0.337
Regression 6 31.8729 31.8729 5.3121 129.43 0.000
Linear 3 19.3638 19.3638 6.4546 157.26 0.000
207C (g/L) 1 0.0211 0.0211 0.0211 0.51 0.492
TiO2 (g/L) 1 0.0507 0.0507 0.0507 1.23 0.295
pH 1 19.2920 19.2920 19.2920 470.04 0.000
Square 2 12.3841 12.3841 6.1921 150.87 0.000
TiO2 (g/L)*TiO2 (g/L) 1 0.0319 0.4745 0.4745 11.56 0.008
pH*pH 1 12.3522 12.3522 12.3522 300.96 0.000
Interaction 1 0.1250 0.1250 0.1250 3.05 0.115
TiO2 (g/L)*pH 1 0.1250 0.1250 0.1250 3.05 0.115
Residual Error 9 0.3694 0.3694 0.0410
Lack-of-Fit 7 0.3077 0.3077 0.0440 1.43 0.472
Pure Error 2 0.0617 0.0617 0.0308
Total 16 32.3350