Embed Size (px)
Citation preview
ifo WORKING PAPERS
2892019
January 2019
Refugees’ Self-selection into Europe: Who Migrates Where? Cevat Giray Aksoy, Panu Poutvaara

Impressum:
ifo Working Papers Publisher and distributor: ifo Institute – Leibniz Institute for Economic Research at the University of Munich Poschingerstr. 5, 81679 Munich, Germany Telephone +49(0)89 9224 0, Telefax +49(0)89 985369, email [email protected] www.cesifo-group.de
An electronic version of the paper may be downloaded from the ifo website: www.cesifo-group.de

ifo Working Paper No. 289
Refugees’ Self-selection into Europe: Who Migrates Where?*
Abstract
About 1.4 million refugees and irregular migrants arrived in Europe in 2015 and 2016. We model how refugees and irregular migrants are self-selected. Using unique datasets from the International Organization for Migration and Gallup World Polls, we provide the first large-scale evidence on reasons to emigrate, and the self-selection
and sorting of refugees and irregular migrants for multiple origin and destination countries. Refugees and female irregular migrants are positively self-selected with respect to education, while male irregular migrants are not. We also analyze how border controls affect destination country choice.
JEL code: J15, J24, O15 Keywords: Refugees, self-selection, human capital, predicted income
Cevat Giray Aksoy European Bank for Reconstruction and
Development, IZA, London School of Economics
Office of the Chief Economist One Exchange Square London EC2A 2JN, UK
Phone: + 44 20 7338 7106 [email protected]
Panu Poutvaara ifo Institute – Leibniz Institute for
Economic Research at the University of Munich,
University of Munich, CESifo, IZA Poschingerstr. 5
81679 Munich, Germany Phone: + 49 89 9224 1372
* We are grateful to Nuno Nunes, Ivona Zakoska-Todorovska, and the International Organization for Migration (IOM) for kindly providing the Flow Monitoring Surveys. We also thank Michal Burzynski, Ralph De Haas, Yvonne Giesing and participants at the OECD Migration Conference (2018) for helpful comments. Views presented are those of the authors and not necessarily of the EBRD, IOM or any other organization. All interpretations, errors, and omissions are our own.

2
1. Introduction
The 1951 Refugee Convention and its extension in 1967 define a refugee as a person who is
outside his or her country of nationality “owing to well-founded fear of being persecuted for
reasons of race, religion, nationality, membership of a particular social group or political
opinion,” and is unable or unwilling to return there. The Convention forbids returning a
refugee to a territory where his or her life or freedom would be threatened due to persecution
(UNHCR, 1967). Irregular migrant is broadly defined as a person who travels abroad
voluntarily in search of economic opportunities but has no legal right to remain in the
intended destination country. Distinguishing between refugees and irregular migrants is
complicated: an irregular migrant has a strong incentive to claim to be a refugee to obtain
permission to stay. Receiving countries, instead, may aim to reduce the numbers of refugees
by tightening the burden of proof for persecution.
Nearly 66 million people were forcibly displaced worldwide at the end of 2016
(UNHCR, 2017). The total seeking safety across international borders as refugees reached
22.5 million, with more than half of all refugees worldwide coming from only three
countries: Afghanistan, South Sudan, and Syria (UNHCR, 2017). Although most refugees
stay in developing countries (Chin and Cortes 2015; Hatton 2016), about 1.6 million refugees
and irregular migrants have arrived in Europe between January 2015 and December 2017
(see Figure 1). About one million of them arrived in 2015 alone, with more than 800,000
reaching Europe by sea from Turkey to Greece (UNHCR, 2018). The present migration
crisis differs from that in the 1990s in three crucial respects, as summarized by Dustmann et
al. (2017). First, the current crisis has had a much stronger political impact on Europe that
was already divided by populist and separatist national movements and weakened by the
Great Recession and the Eurozone crisis. Second, the current crisis involves multiple actors
over which Western nations have much weaker influence than in conflicts in the 1990s.
Third, the refugees arriving in Europe are perceived to be culturally more distant than those
in the early 1990s.
As policymakers try to make sense of a complex reality, it is important to understand
the self-selection of refugees and irregular migrants in terms of their skills and demographic
characteristics. This is the focus of our paper. We provide the first large-scale systematic
evidence on the motivations, self-selection and intended sorting of refugees and irregular
migrants from multiple countries of origin. We analyze data from the 2015 and 2016 Flow
Monitoring Surveys (FMS) carried out in Europe as part of the Displacement Tracking

3
Matrix of the IOM. In these surveys, migrants were asked about their demographic
characteristics, intended destination countries and reasons for leaving their home countries.1
The large sample size of FMS allows us to analyze data on nearly 19,000 refugees and
irregular migrants aged 14 and over. We combine FMS with Gallup World Polls to
understand how migrant groups are self-selected from the source population in terms of
observable characteristics and predicted income.
Motivations of migrants and their self-selection and intended sorting are important for
several reasons. First, knowing the motivations and intended destinations of migrants helps to
distinguish between the refugee crisis and challenges associated with irregular migration and
helps to plan optimal policies to alleviate the humanitarian crisis. Second, refugees’ self-
selection has implications for rebuilding their home countries. The more skilled refugees are,
the more difficult the gap they leave is to fill once the country enters the reconstruction stage.
Third, knowing the skill distribution and intended destinations of refugees and irregular
migrants who make it to the transit countries is helpful in planning integration policies, and
thereby contributes to social stability in host countries and in intended destination countries.
In 2015 and 2016, concerns about refugees and irregular migrants resulted in the re-
introduction of border controls inside the Schengen area, disrupting the central principle of
intra-EU free mobility and intra-European trade and supply chains. The refugee crisis also
played a central role in the Leave campaign against the United Kingdom’s membership in the
European Union (despite the United Kingdom being outside the Schengen area and therefore
relatively unaffected by the refugee crisis). Worries about immigration have powered the rise
of populist parties and candidates in Germany (Otto and Steinhardt 2014), Austria (Halla et
al. 2017), Denmark (Dustmann et al., forthcoming), France (Edo et al. 2018), and Greece
(Dinas et al. 2018).
To preview, we find that 77 percent of respondents had emigrated mainly due to
conflict or persecution, 21 percent for economic reasons or lack of basic services like
healthcare, and 2 percent due to natural disasters or other reasons. However, there are major
differences in main reasons to emigrate between different nationalities. More than 90 percent
of respondents from Afghanistan, Iraq, Somalia, Sudan, and Syria emigrated because of
conflict or persecution, while this share was less than 10 percent for respondents from
Algeria and Morocco. We find important differences in how refugees and irregular migrants
1 We use the term “refugees and irregular migrants” to refer to individuals surveyed in Flow Monitoring Surveys. We will sometimes refer to each group separately. We will also sometimes refer to both groups as migrants.

4
are self-selected relative to the country of origin population: refugees from countries
suffering from major conflict with 1000 or more battle-related deaths (Afghanistan, Iraq,
Libya, Nigeria, Pakistan, Somalia, Sudan, and Syria) are positively self-selected with respect
to secondary and tertiary education. We show that extending the framework developed by
Roy (1951) and Borjas (1987) to account for risks associated with conflict or persecution can
explain why migrants from countries facing a major conflict or large-scale repression are
positively self-selected, even when returns to skill in those countries would be higher than in
the destination countries. This positive self-selection from countries plagued by major
conflict arises even without assuming borrowing constraints and is contrary to the intuition
that migrants from more unequal countries should be negatively self-selected. Borrowing
constraints would further strengthen the result as those with more education are likely to have
more resources that allow them to leave, and those able to leave are likely to want to do so in
times of major conflict, even when returns to skills in Europe would be relatively low. These
patterns with respect to tertiary education hold for both men and women, as does the finding
that young people are more likely to emigrate from all country groups. Among men, singles
are more likely to migrate, while married women are more likely to emigrate than single
women, reflecting that women typically migrate with their spouse.
To further investigate selection, we also compare predicted earnings of refugees and
irregular migrants and non-migrants. We find that refugees and irregular migrants are
strongly positively self-selected in terms of their predicted earnings in all country groups
(that is, major conflict and minor or no conflict). When we compare predicted earnings by
migrants and non-migrants separately for men and women, we find that men are more
strongly positively self-selected from all country groups.
Migrant self-selection is of major importance for both origin and destination
countries. Building on Roy (1951), Borjas (1987) showed that if skills are sufficiently
transferable across countries, the theory suggests that migrants from a less egalitarian to a
more egalitarian country should come from the lower end of the skill distribution, and
migrants from a more egalitarian to a less egalitarian country should come from the upper
end of the skill distribution. Subsequently, Grogger and Hanson (2011) presented a model
that also builds on the Roy model but assumes linear utility and absolute cost of migration,
instead of time-equivalent costs as in Borjas (1987). The model by Grogger and Hanson
(2011) predicts that migrants are generally positively self-selected also from less egalitarian
countries and that the sorting of migrants depends on relative skill prices in different

5
destinations. Therefore, more educated migrants are more likely to settle in countries that
offer high rewards to skill.
Deciding whether to migrate is a complicated process. It is often difficult to
distinguish between refugees and those migrating for other reasons but claiming to be
refugees. Economic incentives can be expected to play an important role even for those
leaving countries suffering from civil war. Understanding migrants’ decision-making process
better helps to plan policies that alleviate migration pressure resulting from a lack of
economic opportunities. Given that European countries have much narrower income
differences than African and Middle Eastern countries, theory by Borjas (1987) suggests that
economic migrants from these regions to European welfare states should come from the
lower end of the skill distribution, while Grogger and Hanson (2011) predict that migrants
should be positively self-selected also from these regions, but sorted according to differences
in skill prices in different destinations. Liquidity constraints and immigration restrictions can
mean that the poorest simply cannot migrate, and could help to explain why the high-skilled
have been found to be more mobile (Docquier, Lowell and Marfouk 2009). Research has also
shown that low growth, high (youth) unemployment and environmental problems are
powerful push factors for international migration in poor countries of origin (Beine and
Parsons 2015; Cattaneo and Peri 2016; Mayda 2010).
In this paper, we make five main contributions. First, we provide the first large-scale
evidence on the motivations of migrants in the transit countries in 2015 and 2016,
distinguishing refugees and (irregular) economic migrants. Second, we document how recent
flows of refugees and migrants in transit countries are selected from the source population in
terms of various characteristics, like gender, age, and education. Third, we analyze how these
characteristics and self-selection differ between migrants whose main reason to emigrate is
conflict or persecution, and migrants who emigrate for other reasons. Fourth, we provide a
theoretical model of refugee self-selection, building upon Borjas (1987) and Grogger and
Hanson (2011). Fifth, we analyze how demographic characteristics differ by intended
destination countries.
Although there is a large literature on migrant self-selection, its focus has been on
economic migrants (see Borjas 1987; Chiquiar and Hanson 2005; Fernandez-Huertas Moraga
2011; Grogger and Hanson 2011; Abramitzky et al. 2012; Parey et al. 2017; Borjas et al
forthcoming). There are a few studies that analyze the self-selection of refugees from some
individual countries (see Cohen (2007) on immigrants from the former Soviet Union in Israel
and the United States and Birgier et al. (2016) on Argentinian and Chilean refugees in the

6
United States, Sweden, and Israel) but no systematic analysis on the self-selection of refugees
from multiple countries of origin into multiple destinations. As for the current refugee crisis,
there is an ongoing research project on recently arrived refugees in Germany, based on
surveys carried out since June 2016 by the Institute for Employment Research (IAB), the
Research Centre of the Federal Office for Migration and Refugees (BAMF-FZ), and the
German Socio-Economic Panel (SOEP) at the German Institute for Economic Research
(DIW Berlin). The first results by Brücker et al. (2016) show that refugees who have arrived
in Germany have a relatively low level of education compared with the German population:
13 percent of respondents aged 18 or more have a university degree and 6 percent have a
vocational qualification. As a comparison, 21 percent of Germans have a university degree
and 59 percent a vocational qualification. The IAB-BAMF-SOEP survey also contains a
question about reasons to emigrate, but it allows respondents to list several reasons to migrate
and does not ask the main reason. Brücker et al. (2016) report that 70% of respondents listed
war and conflict, followed by persecution (44%), poor personal living conditions (39%),
discrimination (38%) and fear of forced conscription (36%). Using the same data, Guichard
(2017) compares people who came to Germany from three conflict-affected source countries
(Afghanistan, Iraq, and Syria) and two countries that are generally considered as safe
(Albania and Serbia). He finds that refugees from Afghanistan, Iraq, and Syria are positively
self-selected in terms of education relative to the population at the origin, while migrants
arriving from Albania and Serbia are negatively self-selected. Our paper and these studies are
complements. Taken together, our survey data from 2015 and 2016 and IAB data from 2016
onwards allow comparing how migrants who applied for asylum in Germany compare with
refugees and irregular migrants in transit countries, separately for those aiming at Germany
and those aiming at other destinations.
The remainder of the paper is organized as follows: Section 2 outlines a theoretical
framework for understanding the self-selection mechanisms. Section 3 provides details on the
data sources. Section 4 shows descriptive statistics. Section 5 describes the estimation
strategy. Section 6 presents the results, after which section 7 concludes.

7
2. Theoretical Framework
We analyze emigration from several countries of origin into one destination. We denote
countries of origin with index k, and the potential destination with index d.2 Our model builds
on Borjas (1987), but adds into it risks related to conflict or persecution in the home country,
and risks related to migrating. As Grogger and Hanson (2011), we simplify the Borjas (1987)
framework by leaving out unobservable skill components in origin and in destination as our
data do not allow testing hypotheses related to it. We denote human capital of individual i
beyond primary education by ℎ𝑖𝑖. The wage individual i would receive in home country k is
given by
𝑤𝑤𝑖𝑖𝑘𝑘 = exp(𝛼𝛼𝑘𝑘 + 𝑟𝑟𝑘𝑘ℎ𝑖𝑖),
in which exp(𝛼𝛼𝑘𝑘) captures the wage available to those with primary education, and 𝑟𝑟𝑘𝑘 is the
return to human capital above primary education in country k. To capture the risk of conflict
or persecution, we assume that there is a country-specific risk 𝑞𝑞𝑘𝑘, 0 ≤ 𝑞𝑞𝑘𝑘 < 1 of losing the
wage income and suffering an additional utility loss 𝐿𝐿𝑘𝑘, 𝐿𝐿𝑘𝑘 ≥ 0. The utility is logarithmic in
terms of consumption in case of working and linear in terms of the loss in case the risk is
realized. It is reasonable to expect 𝑞𝑞𝑘𝑘 to be highest in countries suffering a war or civil war,
intermediate in countries with a low-intensity conflict or persecution, while it can be viewed
as zero, or close to zero, in relatively safe countries from which migrants are motivated by the
lack of job opportunities, rather than conflict or persecution. The expected utility in case of
no migration is therefore
𝐸𝐸𝑈𝑈𝑖𝑖𝑘𝑘 = (1 − 𝑞𝑞𝑘𝑘) log�𝑤𝑤𝑖𝑖𝑘𝑘� − 𝑞𝑞𝑘𝑘𝐿𝐿𝑘𝑘 .
In case of successful migration, individual i receives wage 𝑤𝑤𝑖𝑖𝑑𝑑 = exp(𝛼𝛼𝑑𝑑 + 𝑟𝑟𝑑𝑑ℎ𝑖𝑖 −
𝜋𝜋𝑘𝑘), in which exp(𝛼𝛼𝑑𝑑) depicts the wage available to natives with primary education in
country d, 𝑟𝑟𝑑𝑑 is the return to human capital above primary education in country d and 𝜋𝜋𝑘𝑘
measures the loss of potential productivity due to imperfect applicability of migrant’s human
capital and lack of language skills. It plays an equivalent role to time-equivalent migration
2 We model migration decision between staying in the home country or migrating into one destination, rather than a specific choice between various European countries, as asylum-seekers may face considerable uncertainty on whether they can make it to their preferred destination country. Destination d may be interpreted as a composite of various European countries, in which different countries receive a weight corresponding to the conditional probability that a migrant from country k ends up there in case of reaching Europe.
8
costs in Borjas (1987), and can differ across countries of origin, for example reflecting
linguistic distance and quality of schooling.
To capture the idea that refugees and irregular migrants face various risks also on
their way to the destination countries, we assume that migrants from country k face risk 𝑠𝑠𝑘𝑘,
0 ≤ 𝑠𝑠𝑘𝑘 < 1 of not making it to their intended destination in case of trying to migrate. This
risk could include, at its extreme, dying on the way, as well as being imprisoned or caught in
a transit country the migrant would prefer not to stay in due to lack of funds or unexpected
border closures. We denote the expected loss in case the risk is realized by 𝐿𝐿𝑀𝑀 , 𝐿𝐿𝑀𝑀 ≥ 0. We
also allow for gender-specific risks and norms that affect the cost of travelling, by
introducing gender dummy 𝐷𝐷𝑖𝑖 which obtains value 1 if individual i is female and 0 if
individual i is male. We expect lower female migration rates as many traditional societies
have social norms that may make travelling alone more difficult for women. As only men are
subject to conscription in most countries, it is an additional push factor for men and has a
similar effect on gender difference as a higher migration cost for women. The differential
cost for women of migrating from country k is denoted by 𝑐𝑐𝑘𝑘. Finally, an idiosyncratic
component 𝜀𝜀𝑖𝑖 depicts various costs and benefits related to migration that are not captured by
other terms, including valuation of different cultural norms and social networks. The
expected utility in case of migration is therefore
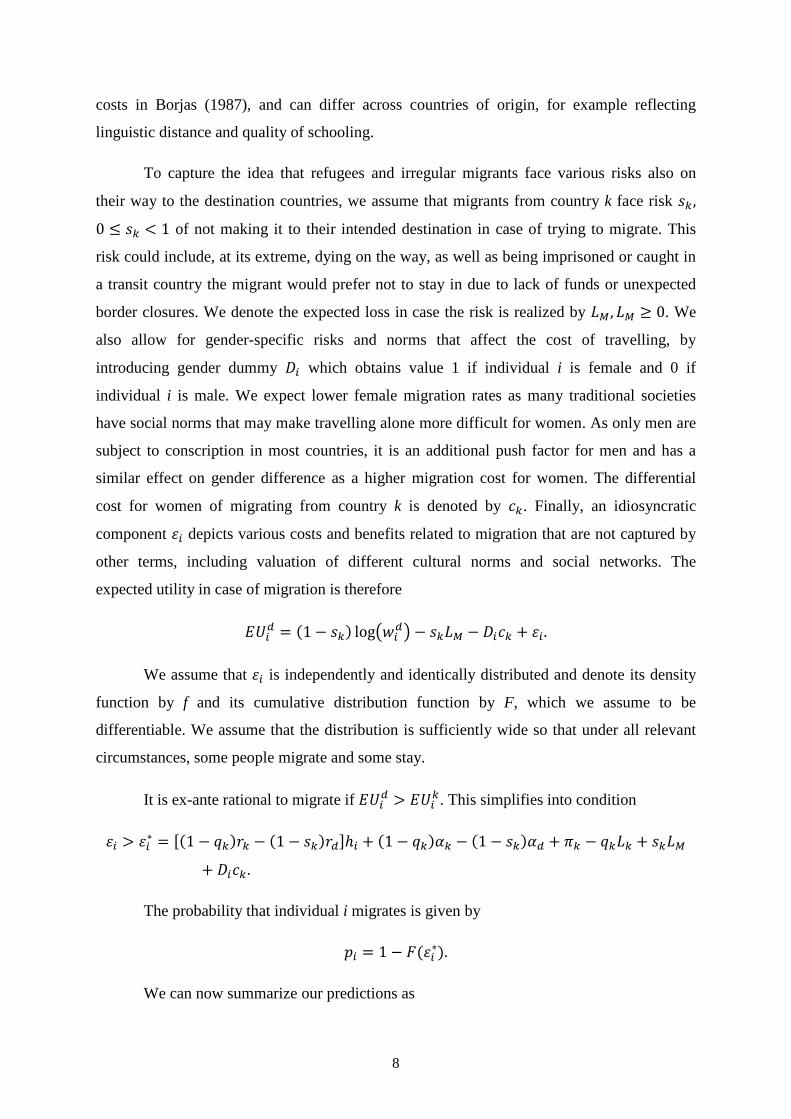
𝐸𝐸𝑈𝑈𝑖𝑖𝑑𝑑 = (1 − 𝑠𝑠𝑘𝑘) log�𝑤𝑤𝑖𝑖𝑑𝑑� − 𝑠𝑠𝑘𝑘𝐿𝐿𝑀𝑀 − 𝐷𝐷𝑖𝑖𝑐𝑐𝑘𝑘 + 𝜀𝜀𝑖𝑖.
We assume that 𝜀𝜀𝑖𝑖 is independently and identically distributed and denote its density
function by f and its cumulative distribution function by F, which we assume to be
differentiable. We assume that the distribution is sufficiently wide so that under all relevant
circumstances, some people migrate and some stay.
It is ex-ante rational to migrate if 𝐸𝐸𝑈𝑈𝑖𝑖𝑑𝑑 > 𝐸𝐸𝑈𝑈𝑖𝑖𝑘𝑘. This simplifies into condition
𝜀𝜀𝑖𝑖 > 𝜀𝜀𝑖𝑖∗ = [(1 − 𝑞𝑞𝑘𝑘)𝑟𝑟𝑘𝑘 − (1 − 𝑠𝑠𝑘𝑘)𝑟𝑟𝑑𝑑]ℎ𝑖𝑖 + (1 − 𝑞𝑞𝑘𝑘)𝛼𝛼𝑘𝑘 − (1 − 𝑠𝑠𝑘𝑘)𝛼𝛼𝑑𝑑 + 𝜋𝜋𝑘𝑘 − 𝑞𝑞𝑘𝑘𝐿𝐿𝑘𝑘 + 𝑠𝑠𝑘𝑘𝐿𝐿𝑀𝑀+ 𝐷𝐷𝑖𝑖𝑐𝑐𝑘𝑘.
The probability that individual i migrates is given by
𝑝𝑝𝑖𝑖 = 1 − 𝐹𝐹(𝜀𝜀𝑖𝑖∗).
We can now summarize our predictions as

9
Proposition 1.
(i) 𝑑𝑑𝑝𝑝𝑖𝑖𝑑𝑑ℎ𝑖𝑖
= −[(1− 𝑞𝑞𝑘𝑘)𝑟𝑟𝑘𝑘 − (1 − 𝑠𝑠𝑘𝑘)𝑟𝑟𝑑𝑑]𝑓𝑓(𝜀𝜀𝑖𝑖∗);
(ii) 𝑑𝑑𝑝𝑝𝑖𝑖𝑑𝑑𝑟𝑟𝑘𝑘
= −(1 − 𝑞𝑞𝑘𝑘)ℎ𝑖𝑖𝑓𝑓(𝜀𝜀𝑖𝑖∗) < 0;
(iii) 𝑑𝑑𝑝𝑝𝑖𝑖𝑑𝑑𝑟𝑟𝑑𝑑
= (1 − 𝑠𝑠𝑘𝑘)ℎ𝑖𝑖𝑓𝑓(𝜀𝜀𝑖𝑖∗) > 0;
(iv) 𝑑𝑑𝑝𝑝𝑖𝑖𝑑𝑑𝛼𝛼𝑘𝑘
= −(1 − 𝑞𝑞𝑘𝑘)𝑓𝑓(𝜀𝜀𝑖𝑖∗) < 0;
(v) 𝑑𝑑𝑝𝑝𝑖𝑖𝑑𝑑𝛼𝛼𝑑𝑑
= (1 − 𝑠𝑠𝑘𝑘)𝑓𝑓(𝜀𝜀𝑖𝑖∗) > 0;
(vi) 𝑑𝑑𝑝𝑝𝑖𝑖𝑑𝑑𝑞𝑞𝑘𝑘
= (𝑟𝑟𝑘𝑘ℎ𝑖𝑖 + 𝐿𝐿𝑘𝑘)𝑓𝑓(𝜀𝜀𝑖𝑖∗) > 0;
(vii) 𝑑𝑑𝑝𝑝𝑖𝑖𝑑𝑑𝑠𝑠𝑘𝑘
= −(𝑟𝑟𝑑𝑑ℎ𝑖𝑖 + 𝐿𝐿𝑀𝑀)𝑓𝑓(𝜀𝜀𝑖𝑖∗) < 0;
(viii) 𝑑𝑑𝑝𝑝𝑖𝑖𝑑𝑑𝐿𝐿𝑘𝑘
= 𝑞𝑞𝑘𝑘𝑓𝑓(𝜀𝜀𝑖𝑖∗) > 0;
(ix) 𝑑𝑑𝑝𝑝𝑖𝑖𝑑𝑑𝐿𝐿𝑀𝑀
= −𝑠𝑠𝑘𝑘𝑓𝑓(𝜀𝜀𝑖𝑖∗) < 0;
(x) 𝑑𝑑𝑝𝑝𝑖𝑖𝑑𝑑𝜋𝜋𝑘𝑘
= −𝑓𝑓(𝜀𝜀𝑖𝑖∗) < 0;
(xi) 𝑑𝑑𝑝𝑝𝑖𝑖𝑑𝑑𝑐𝑐𝑘𝑘
= −𝐷𝐷𝑖𝑖𝑓𝑓(𝜀𝜀𝑖𝑖∗) < 0.
Part (i) of proposition 1 shows that the self-selection of migrants with respect to their
human capital depends not just on returns to human capital, but also on risks related to
conflict or persecution if staying in the home country and risks related to potential migration.
Migrants are positively (negatively) self-selected if (1 − 𝑞𝑞𝑘𝑘)𝑟𝑟𝑘𝑘 < (1 − 𝑠𝑠𝑘𝑘)𝑟𝑟𝑑𝑑 ((1 − 𝑞𝑞𝑘𝑘)𝑟𝑟𝑘𝑘 >
(1 − 𝑠𝑠𝑘𝑘)𝑟𝑟𝑑𝑑). This implies that if returns to skills are relatively higher in the country of origin
and the country of origin is relatively safe (a low risk term 𝑞𝑞𝑘𝑘) migrants are negatively self-
selected, in line with Borjas (1987). However, if the country of origin suffers from a
sufficiently severe conflict, given by 𝑞𝑞𝑘𝑘 > 1 − (1−𝑠𝑠𝑘𝑘)𝑟𝑟𝑑𝑑𝑟𝑟𝑘𝑘
, the self-selection is reversed and
migrants tend to come from the upper part of the skill distribution. This is the main prediction
that we test in our empirical part. It also implies a central difference between our model and
that by Chin and Cortes (2015). According to Chin and Cortes, “refugees will be less selected
10
on characteristics associated with labor market success in the destination country compared to
other migrants.” According to our model, refugees’ self-selection depends on the relative
risks faced in the country of origin and during the migration process. Even if everyone in the
country of origin would face the same risk of losing one’s job due to persecution, a high risk
could result in refugees being self-selected more strongly in terms of their skills than irregular
migrants who are not subject to persecution would be from an otherwise identical country.
The different prediction arises as Chin and Cortes (2015) model persecution as a disamenity
which does not influence the wage income in the country of origin, while we assume that
people who are subject to persecution both lose their wage income and are subject to an
additional utility loss, for example due to maltreatment if being imprisoned.3
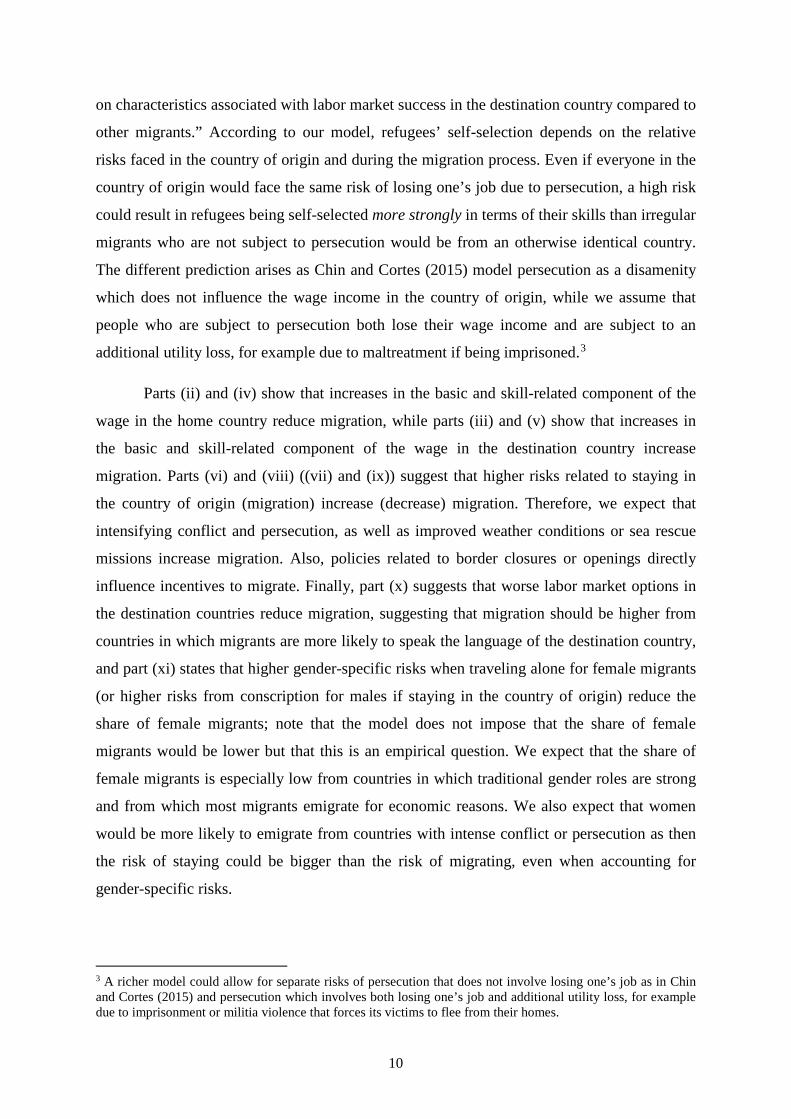
Parts (ii) and (iv) show that increases in the basic and skill-related component of the
wage in the home country reduce migration, while parts (iii) and (v) show that increases in
the basic and skill-related component of the wage in the destination country increase
migration. Parts (vi) and (viii) ((vii) and (ix)) suggest that higher risks related to staying in
the country of origin (migration) increase (decrease) migration. Therefore, we expect that
intensifying conflict and persecution, as well as improved weather conditions or sea rescue
missions increase migration. Also, policies related to border closures or openings directly
influence incentives to migrate. Finally, part (x) suggests that worse labor market options in
the destination countries reduce migration, suggesting that migration should be higher from
countries in which migrants are more likely to speak the language of the destination country,
and part (xi) states that higher gender-specific risks when traveling alone for female migrants
(or higher risks from conscription for males if staying in the country of origin) reduce the
share of female migrants; note that the model does not impose that the share of female
migrants would be lower but that this is an empirical question. We expect that the share of
female migrants is especially low from countries in which traditional gender roles are strong
and from which most migrants emigrate for economic reasons. We also expect that women
would be more likely to emigrate from countries with intense conflict or persecution as then
the risk of staying could be bigger than the risk of migrating, even when accounting for
gender-specific risks.
3 A richer model could allow for separate risks of persecution that does not involve losing one’s job as in Chin and Cortes (2015) and persecution which involves both losing one’s job and additional utility loss, for example due to imprisonment or militia violence that forces its victims to flee from their homes.

11
3. Data The data used in this paper come from the Flow Monitoring Surveys (IOM), Gallup World
Polls, the World Bank’s World Development Indicators (WDI), and the Uppsala Conflict
Data Program (UCDP). The level of analysis is the individual level, and the details on how
the dataset was constructed are provided below.
3.1. Flow Monitoring Surveys Our analysis is based on the Flow Monitoring Survey (FMS) obtained from the International
Organization for Migration (IOM). The FMS provides in-depth insight in the profile,
motivations, experiences and intentions of the migrants. It aims to derive quantitative
estimates of the flow of (non-European) third-country nationals who are migrating towards
Europe through the so-called Central and the Eastern Mediterranean routes. The surveys are
conducted in 11 languages (Arabic, Dari, English, Farsi, French, Italian, Kurdish, Pashto,
Somali, Tigrinya, and Urdu) and administered by trained (male and female) data collectors
with a mix of cultural and linguistic backgrounds (IOM, 2017).4 FMS only gathers
information from migrants and refugees aged 14 and older.
The survey aims to be representative of the nationalities, sex and age structures of
migrants arriving in Europe through the Central and Eastern Mediterranean route (IOM,
2017). Figure 2 illustrates the main migratory flows: (i) the Central Mediterranean Route
refers to the sea journey from Sub-Saharan Africa to Italy, with Libya being the main point of
departure; (ii) the Eastern Mediterranean Route refers to the sea crossing from Turkey to
Greece. Migrants who entered the EU (Bulgaria or Greece) via Turkey by land or sea then
travel through Western Balkan countries — Albania, Bosnia and Herzegovina, Croatia,
Former Yugoslav Republic of Macedonia, Kosovo, Montenegro, Serbia, and Slovenia —
with the aim of reaching the Schengen area.5
4 In case of large groups, the surveys were conducted on a sample of the population. In case of small groups, the entire population was surveyed. 5 As for Italy, the FMS was conducted in 36 entry and transit points in Sicily, Calabria and Apulia in 2016 including the 3 of the 4 hotspots operating in the country (Trapani, Pozzallo and Taranto). The hotspots are first reception facilities with high capacity for the purpose of identification and registration of migrants soon upon arrival (IOM, 2016).Western Mediterranean Route (sea crossing from Morocco to mainland Spain) is not part of the analysis. Migrants using East African Route (sea crossing from Egypt and Libya to mainland Greece and Italy) might be included in our datasets depending on where they arrived.
12
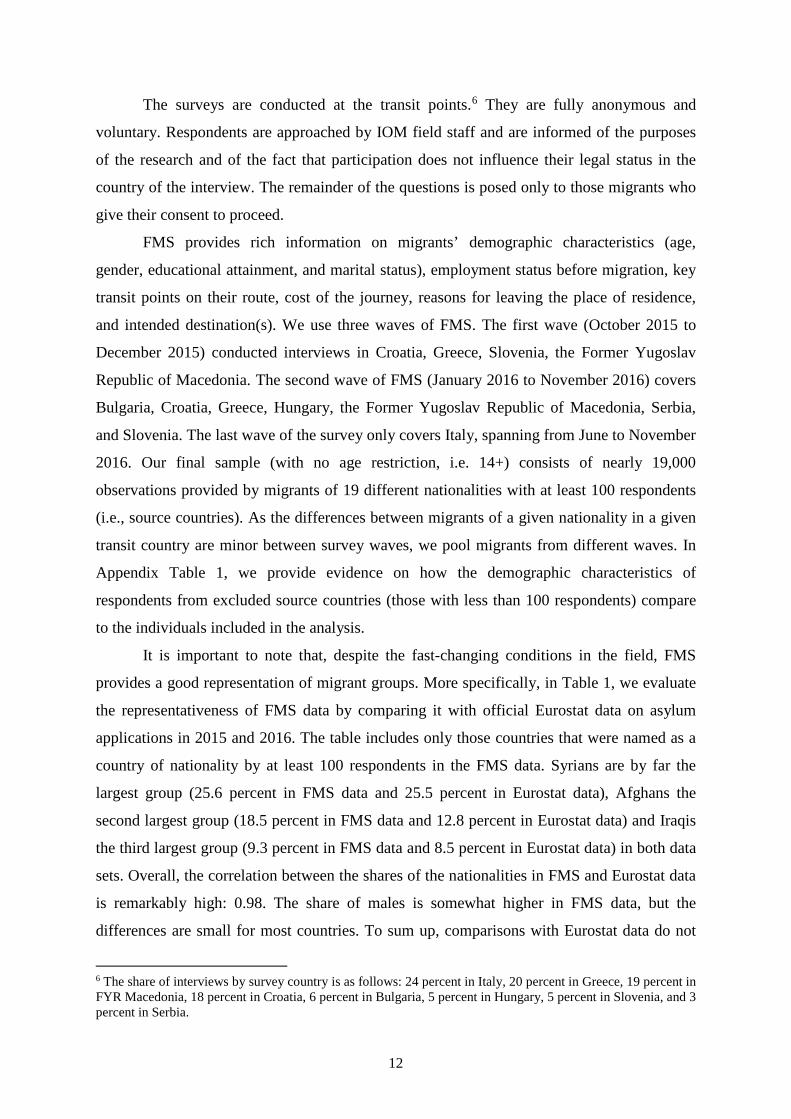
The surveys are conducted at the transit points.6 They are fully anonymous and
voluntary. Respondents are approached by IOM field staff and are informed of the purposes
of the research and of the fact that participation does not influence their legal status in the
country of the interview. The remainder of the questions is posed only to those migrants who
give their consent to proceed.
FMS provides rich information on migrants’ demographic characteristics (age,
gender, educational attainment, and marital status), employment status before migration, key
transit points on their route, cost of the journey, reasons for leaving the place of residence,
and intended destination(s). We use three waves of FMS. The first wave (October 2015 to
December 2015) conducted interviews in Croatia, Greece, Slovenia, the Former Yugoslav
Republic of Macedonia. The second wave of FMS (January 2016 to November 2016) covers
Bulgaria, Croatia, Greece, Hungary, the Former Yugoslav Republic of Macedonia, Serbia,
and Slovenia. The last wave of the survey only covers Italy, spanning from June to November
2016. Our final sample (with no age restriction, i.e. 14+) consists of nearly 19,000
observations provided by migrants of 19 different nationalities with at least 100 respondents
(i.e., source countries). As the differences between migrants of a given nationality in a given
transit country are minor between survey waves, we pool migrants from different waves. In
Appendix Table 1, we provide evidence on how the demographic characteristics of
respondents from excluded source countries (those with less than 100 respondents) compare
to the individuals included in the analysis.
It is important to note that, despite the fast-changing conditions in the field, FMS
provides a good representation of migrant groups. More specifically, in Table 1, we evaluate
the representativeness of FMS data by comparing it with official Eurostat data on asylum
applications in 2015 and 2016. The table includes only those countries that were named as a
country of nationality by at least 100 respondents in the FMS data. Syrians are by far the
largest group (25.6 percent in FMS data and 25.5 percent in Eurostat data), Afghans the
second largest group (18.5 percent in FMS data and 12.8 percent in Eurostat data) and Iraqis
the third largest group (9.3 percent in FMS data and 8.5 percent in Eurostat data) in both data
sets. Overall, the correlation between the shares of the nationalities in FMS and Eurostat data
is remarkably high: 0.98. The share of males is somewhat higher in FMS data, but the
differences are small for most countries. To sum up, comparisons with Eurostat data do not
6 The share of interviews by survey country is as follows: 24 percent in Italy, 20 percent in Greece, 19 percent in FYR Macedonia, 18 percent in Croatia, 6 percent in Bulgaria, 5 percent in Hungary, 5 percent in Slovenia, and 3 percent in Serbia.

13
raise any major concerns about the representativeness of FMS data, with the caveat that
women may have been somewhat less likely to answer the FMS survey, as suggested by IOM
experts based on their field experience (UNICEF, 2017). Importantly, we are not able to
include Eritrea in the analysis as it is not surveyed by Gallup World Polls.
3.2. Gallup World Poll and Country Level Characteristics
Our primary data on the source country population come from the 2009-2014 Gallup World
Polls (GWP).7 These nationally representative surveys are fielded every year in over 120
countries and interview approximately 1,000 individuals in each country on a range of topics.
The GWP provides detailed information on individuals’ demographic characteristics (age,
gender, educational attainment, and marital status), labor market outcomes, income, and
migration intentions.
The GWP’s main advantage for our purposes is that the poll allows us to combine the
FMS data with data on non-migration population for a broad spectrum of countries.
Specifically, we merge two unique datasets based on 19 source countries reported by at least
100 respondents in the FMS. We then create a “migrant” indicator variable, which takes a
value of 1 for respondents surveyed in the FMS and zero otherwise. Using this pseudo-cross-
sectional sample, we investigate how refugees and irregular migrants are self-selected from
the source population.8 Importantly, each variable in GWP is harmonized with the definitions
used in FMS to ensure comparability.
To further understand the characteristics of refugees and economic migrants, we use
Uppsala Conflict Data Program (UCDP) battle-related deaths dataset and classify the source
countries based on their conflict intensity (Therése and Eck, 2018).9 Following the definitions
provided by UCDP, we define: i) major conflict category as countries with 1000 or more
battle-related deaths in any of the years between 2009 and 2014 (this category includes
Afghanistan, Iraq, Libya, Nigeria, Pakistan, Somalia, Sudan, and Syria); ii) minor conflict
category as countries with 25 to 999 battle-related deaths in any of the years between 2009
and 2014 (this category includes Algeria, Egypt, Iran, and Mali); iii) no conflict category as 7 In appendix, we show that our results remain qualitatively the same when we use the data on source population between 2009 and 2011 (i.e. pre-Syrian conflict period). 8 When we restrict our sample to age band 25-64, the data relate to people from the following thirteen countries: Afghanistan, Algeria, Bangladesh, Cameroon, Côte d'Ivoire, Iran, Iraq, Morocco, Nigeria, Pakistan, Senegal, Sudan and Syria. 9 We use the UCDP’s best estimate for battle-related deaths to classify the countries based on their conflict intensity.

14
countries that did not experience a major war or minor conflict in any of the years between
2009 and 2014 (this category includes Bangladesh, Cameroon, Côte d'Ivoire, Ghana, Guinea,
Morocco, and Senegal). It is important to note that there is some movement of countries
between the categories across years and using a continuous measure of the conflict intensity
produces qualitatively similar results.10
We also use a number of country characteristics in our analysis. We obtained country
level unemployment rates and the GINI Index (0-100 range) from the World Bank’s World
Development Indicators database. For destination countries, we use migrant integration
policy index variable from the MIPEX, which measures migrants’ opportunities to participate
in society. The index uses 167 policy indicators covering 8 policy areas (labor market
mobility, family reunion, education, political participation, long-term residence, access to
nationality, anti-discrimination and health) to rate countries from 0 to 100, with 100 being the
top score.11 We obtained data on the average duration of asylum procedure from Eurofound
(2016). This variable reports the average number of months passed between the submission
of the asylum claim and the first decision. For ease of interpretation, we rescale this variable
from 0 to 1, with 1 being the longest duration. Data on waiting duration for labor market
access come from the OECD (2016). This variable measures the waiting period, in months,
that it takes to obtain a work permit after successfully claiming asylum. Again, we rescale
this variable from 0 to 1, with 1 being the longest duration.
4. Descriptive Statistics
Tables 2.a and 2.b present descriptive statistics of FMS data, with respect to when and where
the interviews took place and basic demographic and socioeconomic characteristics of survey
respondents. In table 2.a, we show the descriptive statistics for the full-sample (i.e., with no
age restrictions). In Table 2.b, we focus on the sample of migrants aged 25 to 64.
Table 2.a shows descriptive statistics for the full FMS sample. An overwhelming
majority of survey respondents are male (82 percent) and single (70 percent) with an average
age of 26. 18 percent of the respondents have tertiary level education. About half of the
respondents also report to have been employed before migration.
10 These results are not presented here but available upon request. 11 For details of the compilation of the MIPEX, see Huddleston et al. (2015).

15
When we focus on individuals aged 25 to 64 in Table 2.b, we again find that a vast
majority of survey respondents are male (80 percent). There are also notable differences
between the two samples: migrants in this age band are more likely than those in the full-
sample to be married (57 percent), to have tertiary level education (25 percent), and to have
been employed before migration (63 percent). These differences in education levels and
employment status before migration also highlight the importance of focusing on individuals
aged 25 and older. By doing so, we avoid the share of young respondents mechanically
driving results for self-selection with respect to tertiary level education and employment.
When it comes to the reasons for leaving their home country, migrants cite “conflict or
persecution (79 percent)” and “economic reasons (17 percent)” as the main causes. The
shares are almost the same for the full-sample.
There are some notable differences between the survey waves. First, the share of
Syrians, Afghans, and Iraqis are the highest in the Wave 1 and Wave 2. In Wave 3, most
migrants come from Africa, with Nigerians and Guineans being the largest groups. This is
expected given that the Wave 3 was fielded in Italy, which is the main arrival point for people
fleeing conflict and poverty in Africa. Second, the share of migrants motivated by economic
reasons is somewhat higher in the second and the third wave, although conflict or persecution
dominate as the main reasons for the vast majority also in these waves. Third, there is huge
variation in the level of education across survey waves: the share of those with tertiary
education in the full sample is 36 percent in wave 1, 20 percent in wave 2 and 6 percent in
wave 3. Corresponding patterns prevail if the analysis is restricted to those aged 25 to 64.
In Table 3, we present descriptive characteristics of the source population from the
GWP. Unlike in Tables 2a and 2b, the gender ratio is balanced. People in source countries
(compared to refugees and irregular migrants) are also older on average, more likely to be
married, and less likely to have (completed) tertiary level education. There is no significant
differential in employment between the two groups in the full sample. In contrast, refugees
and irregular migrants are more likely to be employed before migration in the 25-64 sample.
These patterns remain qualitatively similar when we use the source population data between
2009 and 2011 (see Appendix Table 2).
Table 4 presents the differences in educational attainment for the main source
countries. Apart from Nigeria, Bangladesh, and Senegal, migrants are better educated than
non-migrants, whether analyzing the full population or restricting the attention to those aged
25 to 64.
16
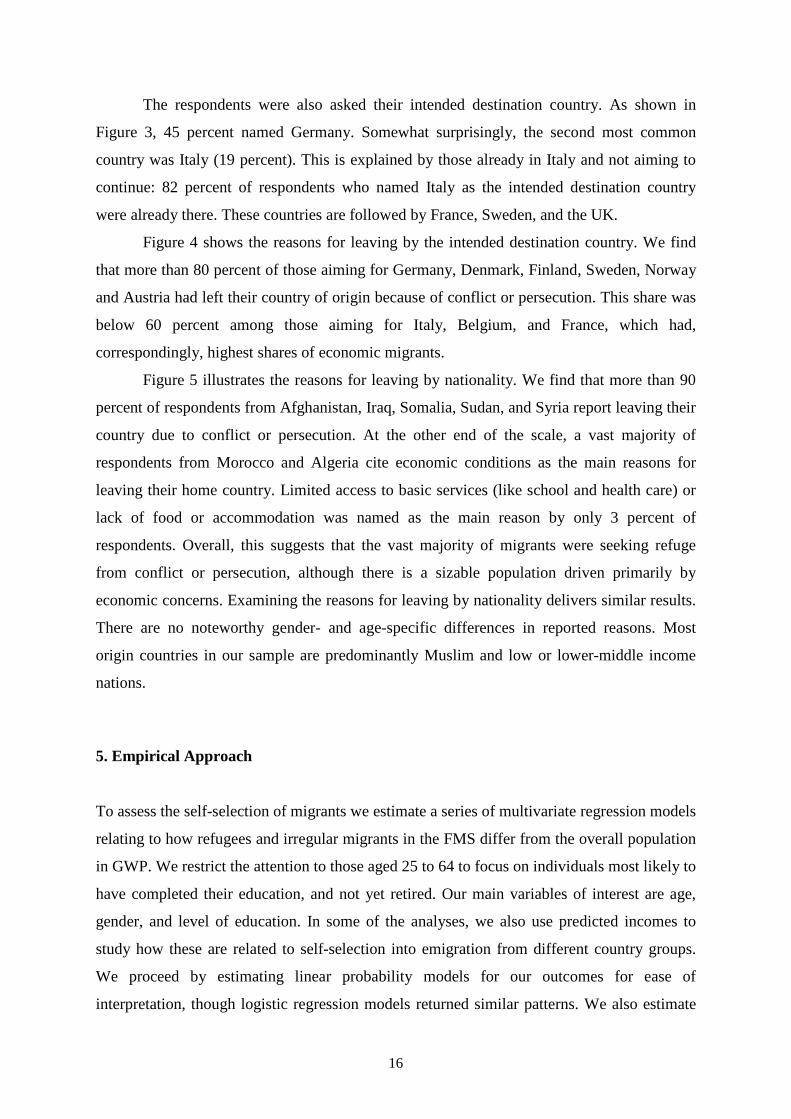
The respondents were also asked their intended destination country. As shown in
Figure 3, 45 percent named Germany. Somewhat surprisingly, the second most common
country was Italy (19 percent). This is explained by those already in Italy and not aiming to
continue: 82 percent of respondents who named Italy as the intended destination country
were already there. These countries are followed by France, Sweden, and the UK.
Figure 4 shows the reasons for leaving by the intended destination country. We find
that more than 80 percent of those aiming for Germany, Denmark, Finland, Sweden, Norway
and Austria had left their country of origin because of conflict or persecution. This share was
below 60 percent among those aiming for Italy, Belgium, and France, which had,
correspondingly, highest shares of economic migrants.
Figure 5 illustrates the reasons for leaving by nationality. We find that more than 90
percent of respondents from Afghanistan, Iraq, Somalia, Sudan, and Syria report leaving their
country due to conflict or persecution. At the other end of the scale, a vast majority of
respondents from Morocco and Algeria cite economic conditions as the main reasons for
leaving their home country. Limited access to basic services (like school and health care) or
lack of food or accommodation was named as the main reason by only 3 percent of
respondents. Overall, this suggests that the vast majority of migrants were seeking refuge
from conflict or persecution, although there is a sizable population driven primarily by
economic concerns. Examining the reasons for leaving by nationality delivers similar results.
There are no noteworthy gender- and age-specific differences in reported reasons. Most
origin countries in our sample are predominantly Muslim and low or lower-middle income
nations.
5. Empirical Approach
To assess the self-selection of migrants we estimate a series of multivariate regression models
relating to how refugees and irregular migrants in the FMS differ from the overall population
in GWP. We restrict the attention to those aged 25 to 64 to focus on individuals most likely to
have completed their education, and not yet retired. Our main variables of interest are age,
gender, and level of education. In some of the analyses, we also use predicted incomes to
study how these are related to self-selection into emigration from different country groups.
We proceed by estimating linear probability models for our outcomes for ease of
interpretation, though logistic regression models returned similar patterns. We also estimate

17
most models separately by the level of conflict in source country and gender. Our models of
self-selection take the form:
(1) Refugee/Migrantic = α + β1Xi + + β2Cc + εi
where Refugee/Migrantic takes a value of 1 if individual i from country c is in the FMS
sample and 0 otherwise. Xi is a vector of demographic variables that includes: age group
dummies (25-34, 35-44, 45-54); education dummies (tertiary education, secondary
education); dummy variable indicating the labor market status before migration (employed);
a dummy variable indicating the marital status (married, divorced, widowed). To account for
other unobservable characteristics, we include a full set of source country (Cc) dummies,
which control for all time-invariant variation caused by factors that vary cross-nationally.
We use data for the source population from Gallup World Polls between 2009 and
2014; however, the results are robust to using data between 2009 and 2011 (pre-Syrian
conflict period). Note that in equation (1) the relevant reference category is composed of
individuals who are in the Gallup World Poll. We estimate standard errors robust to
heteroscedasticity.
To investigate the self-selection of refugees and migrants with respect to income, we
use Gallup data that includes household income and individual income. Specifically, we first
estimate within-country Mincer regressions controlling for the level of education,
employment status, gender, age, and marital status based on migrants’ home country. We
then use these estimates to predict household income and personal income for those surveyed
in the FMS and use these predicted incomes to gain further insights into how migrants from
different country groups are self-selected with respect to their earnings potential.
After analyzing self-selection into emigration, we analyze sorting into different intended destinations by using FMS data only. Our models of sorting take the form:
(2) OUTCOMEc = α + β1Xi + + β2Cc + εi
where OUTCOMEc is one of the country level indicators: (i) Gini coefficient; (ii) country-
level unemployment; (iii) migrant integration policy index; (iv) average duration of asylum
procedure; (v) average waiting duration for labor market access; (vi) social expenditure as
percentage of GDP. In addition, we use country-level estimates for returns to education as an
outcome (i.e., by estimating within-country Mincer equations in GWP). All other variables
are as described above.

18
6. Results
This section presents four sets of results. We first show self-selection of refugees and
irregular migrants with respect to education and other demographic characteristics. Second,
we analyze the self-selection of refugees and irregular migrants according to their predicted
earnings. Third, we investigate whether refugees and irregular migrants with tertiary level
education (or more) sort themselves into more inegalitarian countries and whether refugees’
and irregular migrants’ choice for destination countries is shaped by macro-level
characteristics. The final set of results provides descriptive evidence on the role of border
closures in migrants’ intended destinations.
6.1. Self-selection of Refugees and Irregular Migrants with respect to Demographic
Characteristics
In this subsection, we start testing our theoretical predictions - based on the Roy-Borjas
model - to understand how the distribution of education among refugees and irregular
migrants compares with that among non-migrants. We present this evidence in Table 5 for
males and females together, in Table 6 for males only, and in Table 7 for females only. The
columns are structured as follows: all countries (column 1); major conflict countries (column
2); minor or no conflict countries (column 3). As mentioned above, we restrict attention to
individuals aged 25 to 64 to focus on individuals most likely to have completed their
education and not yet retired.
In column 1 of Table 5, we find that educated people are significantly more likely to
migrate when we analyze all countries together. The results in column 2 and 3 suggest that
the probability of emigration increases in tertiary education in both country groups, but
decreases in secondary education in countries with a minor or no conflict.12 Notably, refugees
and irregular migrants escaping major conflicts tend to be highly educated relative to the
national average in their country of origin. These results are in line with our theoretical
predictions suggesting that if the risk of being a victim of conflict or persecution increases,
the probability of emigration becomes eventually increasing in human capital even if returns
to human capital would be higher in the country of origin in the absence of conflict or 12 The results hold also if excluding Iran, which has by far the highest share of tertiary educated emigrants.

19
persecution. An additional mechanism outside our model is that better-educated individuals
would find it easier to finance their trip, while liquidity constraints would prevent the least
educated people from migrating. Turning to other covariates, we find that the probability of
emigration is higher for men, younger people, and singles.
Tables 6 and 7 present corresponding analyses separately for men and women. The
probability of emigration increases in both secondary and tertiary education for both men and
women in countries suffering from a major conflict. In countries with minor or no conflict,
men with secondary education are somewhat less likely to emigrate than men with less than
secondary education, while the effect of tertiary education is statistically insignificant. This is
intuitive as African and Asian countries have much wider income differences than European
countries. More positive self-selection of migrants from major conflict countries is in line
with our model. Table 7 shows that in countries with minor or no conflict women with
tertiary education are significantly more likely to emigrate than women with less than
secondary education, while women with secondary education do not differ from women with
less than secondary education in their probability of emigration. At the first sight, positive
self-selection of women from minor or no conflict countries with respect to their education
may appear to contradict our model. However, it is important to note that gender
discrimination is a major problem in most of Africa and Asia, and in many countries
women’s labor market opportunities are severely restricted. If these restrictions hit
disproportionately tertiary-educated women, then they may actually enjoy higher expected
return to their human capital in Europe, explaining opposite selection pattern compared with
men. Furthermore, the fact that also female migrants are more strongly positively self-
selected from major conflict countries than from minor or no conflict countries is in line with
what our theory predicts.
We also find that men who were in employment before migration are more likely to
emigrate from countries suffering from major conflict but less likely to emigrate from
countries with minor or no conflict, again in line with emigration from no or low conflict
countries being motivated by lack of economic opportunities. The opposite is found for
women: those who were in employment before migration are less likely to emigrate from
countries suffering from major conflict but more likely to emigrate from countries with minor
or no conflict. Given that employment and educated may be strongly correlated, we analyzed
the effects of employment and demographic controls separately according to the level of
education (results available upon request). The results for men are driven by those with
secondary education. When analyzing women, a more complex picture arises. Being

20
employed reduces the probability of emigrating from major conflict countries for women
with primary or secondary education, but has no effect on the probability of emigration from
minor conflict countries. Among women with tertiary educated, being employed has no effect
on the probability of emigration from major conflict countries, but increases the probability
of emigration from minor or no conflict countries. This finding may reflect highly educated
women’s relatively bad labor market opportunities to which those women who choose to
pursue employment react more strongly.
We establish a link between self-selection among refugees and irregular migrants and
their main motivation to emigrate in Table 8. More specifically, our outcome variable is
reason to migrate: conflict/persecution, which is equal to 1 for respondents who cite conflict
or persecution as the main reason to migrate and 0 for other respondents who cite other
reasons (economic reasons, limited access to amenities and natural disasters and other
reasons) in the Flow Monitoring Surveys. The columns are structured as follows: all
respondents (column 1); males (column 2); females (column 3). We again restrict attention to
individuals aged 25 to 64.
In Column 1 of Table 8, we find that refugees who escaped conflict or persecution are
significantly more likely to have secondary and tertiary level education compared with those
who cite other reasons for leaving their countries. The results in column 2 and 3 suggest that
this pattern applies to both men and women. These results are in line with our theory: higher
risks related to remaining in the country of origin can result in positive self-selection of
migrants, even if self-selection in the absence of conflict or persecution would be negative.
6.2. Self-selection with respect to Predicted Income In Table 9, we use predicted individual income as the only explanatory variable to predict
emigration of those aged 25 to 64, in addition to country fixed effects. Specifically, we obtain
predicted individual income by estimating within-country Mincer regressions which control
for the level of education, employment status, gender, age, and marital status, separately for
each country or origin.
Note that our models in Table 9 do not include individual covariates again as these are
all strongly correlated with predicted income. We find that predicted log income strongly
increases the probability of emigration from all country groups. The effect of predicted
income is highest for migrants from countries suffering a major conflict, in line with our
theoretical predictions. Interestingly, migrants from countries with minor or no conflict are

21
also positively self-selected when using all migrants. If the attention is restricted to singles,
the effect of predicted income turns negative for men from countries with minor or no
conflict. The patterns without restriction to singles also remain qualitatively similar when
using predicted household income.13
A potential concern related to our findings is that self-selection according to predicted
earnings could reflect borrowing constraints, with migrants from countries with higher
income being more likely to be able to emigrate. Therefore, we analyzed self-selection
separately from Syria, Afghanistan, and Iraq, and ran the regressions separately for men and
women. The results also confirm that refugees and irregular migrants are positively self-
selected from main sending countries.14 As these countries all suffer major conflict, the
finding of positive self-selection in terms of earnings potential is in line with our theoretical
predictions.
Borjas, Kauppinen, and Poutvaara (forthcoming) showed that the Roy model has
more precise predictions about the self-selection of migrants than previously realized. The
same conditions that result in positive or negative selection in terms of expected earnings also
imply a stochastic dominance relationship between the earnings distributions of migrants and
non-migrants. As FMS did not ask respondents about their income, we can only test self-
selection with respect to predicted incomes. We use predicted incomes for both migrants and
non-migrants to focus on both groups’ income arising from observable characteristics. We
restrict the attention to single persons to minimize any confounding factors related to marital
status.
Figures 6 and 7 show migrants’ and non-migrants’ cumulative distribution functions
(CDFs) of predicted income for major conflict countries and for countries with minor or no
conflict. We find that both male and female migrants from major conflict countries are
positively self-selected in terms of their predicted income. For countries with minor or no
conflict, migrant and non-migrant men do not differ in terms of their income distribution.
Migrating women, instead, are positively self-selected in terms of their income. This could
reflect single women facing more difficulties in financing the journey than single men,
resulting in self-selection from upper part of earnings distribution even when relative returns
to skills in Europe are lower than in the origin countries.
Figure 8 compares CDF of refugees who migrate due to conflict or persecution with
non-migrants’ CDF, and Figure 9 makes a corresponding comparison between irregular 13 These results are not reported but available upon request. 14 These results are not reported but available upon request.

22
migrants whose main reason to emigrate was not conflict or persecution and non-migrants.
Male and female refugees and female irregular migrants are positively self-selected with
respect to their income. Male irregular migrants, instead, do not differ much from non-
migrants. The pattern that male refugees are more strongly positively self-selected that male
irregular migrants is in line with what our theory predicts. The absence of such a difference
among women is surprising and explaining it is an important topic for future research. It
should be noted that women are a small minority among refugees and irregular migrants.
Among single refugees covered in Figure 8, 7 percent are women and among single irregular
migrants in Figure 9, 6 percent.
6.3. Sorting of Refugees and Irregular Migrants We next analyze sorting of refugees and irregular migrants into different intended destination
countries. Table 10 investigates how migrants’ sorting according to their education differs
between major conflict countries and countries without a major conflict. In this table, we only
focus on FMS sample and our outcome variable is the Gini coefficient of the intended
destination country. When studying all destination countries, those with tertiary education are
more likely to choose more unequal countries and those with secondary education more equal
countries than those below secondary education. This pattern also holds for those who
emigrate from major conflict countries. When it comes to countries with minor or no conflict,
the sorting pattern of those with tertiary education is strongly in line the Roy-Borjas model:
they are much more likely to aim for more unequal countries. Surprisingly, migrants with
secondary education from countries with conflict are less likely to sort into more unequal
countries, compared with those with only primary education. An important caveat is that
these models implicitly assume that skills are sufficiently transferable across countries. These
findings also do not imply causality, as other factors (such as culture and institutions) may
affect the choice of destination and be linked to a person’s education. Nonetheless, our
findings indicate that education may play an important role when refugees and irregular
migrants choose their destination.
Table 11 provides suggestive evidence on other country-specific factors that might
influence migrants’ choice of destination. As with the previous analysis, the sample is
restricted to respondents covered by FMS surveys (ages 25 to 64), while outcome variables
represent various characteristics of the intended destination country of each respondent.
However, unlike in previous tables, we now report the estimates using migrants with tertiary

23
education as a reference category. This helps us to highlight the country level characteristics
that are more important for low-skilled migrants.
Migrants who are educated to primary and secondary level are more likely to head for
countries that have lower unemployment rates and more comprehensive migrant integration
policies. The nature of integration policies is captured by the Migrant Integration Policy
Index (MIPEX), which ranges from 0 to 100 and is based on 167 policy indicators covering
the following eight policy areas: labor market mobility, reunification of families, education,
political participation, long-term residence, access to nationality, measures tackling
discrimination and health.
Refugees and irregular migrants who are educated to primary and secondary level are
also more likely to choose destination countries where asylum applications are considered
faster and where work permit applications, once asylum has been granted, take less time to
process. More generous social safety nets also make a destination country more attractive for
migrants with primary and secondary education. In other words, refugees and irregular
migrants coming to Europe respond to incentives at all stages of the migration process.
Table 12 provides evidence on sorting of refugees and irregular migrants into
intended destinations with respect to their skill levels. Specifically, we focus on the top five
intended destination countries reported in the FMS sample (Germany, Italy, France, Sweden,
and Austria). We find that those with secondary level education less likely to target Germany
and Italy and more likely to target France and Sweden. There is no clear sorting pattern for
those with tertiary level education.
6.4. The Role of Border Controls The refugee crisis catapulted to the top of the European policy agenda following Chancellor
Merkel’s decision to open German borders to Syrian refugees in August 2015. Subsequently,
several other policy changes, mostly tightening border controls, significantly reduced or
redirected the numbers of refugees and irregular migrants to affected countries. In this
section, we analyze the effect of such policies on FMS respondents’ intended destination
country, using information on the interview date. Did the policies change intended
destinations and, if so, how? Alternatively, it could be that policy changes would have
relatively little effect on intended destinations, and simply change timing and intended route
of entry.

24
We mainly focus on the major border policy changes over the sample period of FMS
(October 2015-November 2016). In particular, we identified five important policy changes:
(i) Austria imposes quota refers to a dummy variable that is equal to one, if interviews were
conducted after 19th February 2016, when Austria imposed a quota of accepting maximum
80 refugees or irregular migrants and a maximum of 3,200 people allowed traveling through
Austria per day; (ii) Austria quota announcement is equal to one for interview dates after
Austria announced this quota on 20th January 2016; (iii) Hungary border closing is equal to
one if the interview took place after Hungary closed its border on 16th October 2015; (iv)
Slovenia and Macedonia border tightening refers to the date on which Macedonia closed its
border with Greece and Slovenia set stricter border controls, and it is equal to one if the
interview was conducted after 9th March 2016. Sweden border control is equal to one, if
interviews took place after the 11th November 2015.
Table 13 reports the coefficients of border policy dummies listed above, while
controlling for origin and survey country fixed effects as well as individual characteristics.
The outcomes across the columns are as follows: intended destination is Germany (column
1); the intended destination is Italy (column 2); the intended destination is France (column 3);
the intended destination is Austria (column 4); and intended destination is United Kingdom
(column 5).
The results suggest that border policies significantly affected the intended destinations
of refugees and irregular migrants. Results in Column 1 suggest that while Austria quota
announcement and Sweden border controls increased the likelihood of stating “Germany” as
an intended destination country, Slovenia and Macedonia border tightening significantly
reduced migration intentions to Germany. Moving to Column 2, we find that none of the
policies have significantly affected sorting patterns to Italy. This is expected given that those
who migrate from sub-Saharan Africa aim to settle in Italy and these policies should not
affect their choices. Focusing on France (Column 3) and the UK (Column 6), we find that
Slovenia and Macedonia border tightening is the only policy that significantly affected
(positively) the sorting patterns of refugees and irregular migrants.
Column 4 present results for Sweden. We find that Sweden’s border controls and
Austria’s quota policies significantly reduced the migration intentions to Sweden. Finally, in
Column 5, we focus on sorting to Austria. The results suggest that migrants are significantly
more likely to aim for Austria after the quota announcement. This is in line with the intuition
that migrants wanted to reach Austria before they actually start imposing quotas on the 19th of

25
February, 2016. However, once Austria limits the number of refugees accepted in the
country, the likelihood of stating Austria as a destination country falls.
7. Conclusion
Using Flow Monitoring Surveys and Gallup World Polls, we analyzed the main reasons to
emigrate and self-selection of refugees and irregular migrants through the so-called Central
and the Eastern Mediterranean routes in 2015 and 2016. We found that 77 percent of
respondents were refugees in the sense of fleeing war, conflict or persecution, 21 percent
were motivated by economic reasons, including the lack of basic necessities, and 2 percent
had left because of natural disasters or other reasons. Most of the respondents were from
Syria, Afghanistan, and Iraq, followed by Nigeria, Pakistan, Morocco, and Iran. Refugees and
irregular migrants are more likely to be single, male, and young, with vast cross-country
variation in the main motivation to migrate.
Our results show that refugees are more educated than irregular migrants whose main reason
to emigrate is not conflict or persecution. There are, however, important gender differences.
While both men and women emigrating from countries with major conflict are positively
self-selected with respect to their education, self-selection patterns between men and women
are starkly different from countries with no or minor conflict, or if analyzing those whose
main motivation to emigrate was not conflict or persecution. Men from minor or no conflict
countries, as well as men whose main motivation to emigrate was not conflict or persecution,
instead, do not differ much from non-migrants. Women from minor or no conflict countries,
as well as women whose main motivation to emigrate was not conflict or persecution, are
more educated than non-migrants. Our conjecture is that women’s positive self-selection in
terms of education also from countries with no or minor conflict arises because of gender
discrimination that depresses especially tertiary educated women’s job opportunities. We also
find that those with lower levels of education are relatively more likely to head for countries
with lower unemployment rates, better migrant integration policies, faster asylum processes,
easier access to the labor market for people who have successfully claimed asylum, and
stronger social safety nets.
Our detailed analysis of socio-demographic characteristics and background of refugees and
irregular migrants points to several policy implications. While the vast majority of them leave

26
their country in order to escape conflict, the main motivation of a significant number of
migrants from countries such as Algeria, Egypt, Morocco, and Pakistan is a desire to seek out
better economic opportunities abroad. While most of these migrants may ultimately be denied
asylum, they can slow down asylum application procedures. This may, in turn, undermine
popular support for a well-managed and fair asylum system (Hatton, 2017). Ageing European
economies could consider tackling this problem by increasing legal employment
opportunities for African citizens on a selective basis, depending on local needs. Such
initiatives could form part of a broader strategy aimed at containing illegal migration to
Europe (MEDAM, 2018).
Moreover, policies that support refugees’ and migrants’ integration into the labor market
need to be tailored to their skills (World Bank, 2018). Migrants escaping major conflicts
(such as the fighting in Syria) may well benefit from receiving early access to language
courses and other basic training while waiting for decisions on their asylum applications.
Battisti et al. (2018) show that certain groups of refugees can increase their labor market
outcomes though a basic job search assistance program. Prompt access to employment will
also help migrants to integrate better into society (OECD, 2018). All of these aspects are
particularly important in terms of promoting the integration of migrants and helping a country
to make society more inclusive for everyone.
References Abramitzky, R., Boustan, L. and Eriksson, K. (2012). Europe’s Tired, Poor, Huddled Masses: Self-selection and Economic Outcomes in the Age of Mass Migration. American Economic Review 102(5): 1832–56. Battisti, M., Giesing, Y. and Laurentsyeva N. (2018). Can Job Search Assistance Improve the Labour Market Integration of Refugees? Evidence from a Field Experiment. CESifo WP No. 7291. Beine, M. and Parsons, C. (2015). Climatic Factors as Determinants of International Migration. Scandinavian Journal of Economics 117: 723-767.

27
Birgier, D. P. Lundh, C., Haberfeld, Y. and Elldér, E. (2018). Self-Selection and Host Country Context in the Economic Assimilation of Political Refugees in the United States, Sweden, and Israel. International Migration Review 52(2): 524–558. Borjas, G.J. (1987). Self-selection and the Earnings of Immigrants. American Economic Review 77: 531-53. Borjas, G.J., Kauppinen, I. and Poutvaara, P. (forthcoming). Self‐Selection of Emigrants: Theory and Evidence on Stochastic Dominance in Observable and Unobservable Characteristics. The Economic Journal. Brücker, H., Rother, N., Schupp, J., von Gostomski, C.B., Böhm, A., Fendel, T., Friedrich, M., Giesselmann, M., Kosyakova, Y., Kroh, M., Kühne, S., Liebau, E., Richter, D., Romiti, A., Schacht, D., Scheible, J.A., Schmelzer, P., Siegert, M., Sirries, S., Trübswetter, P., and Vallizadeh, E. (2016). Forced Migration, Arrival in Germany, and First Steps toward Integration. In Britzke, J., and Schupp, J. (Eds.), SOEP Wave Report 2016, p. 149-164. Cattaneo, C. and Peri, G. (2016). The Migration Response to Increasing Temperatures. Journal of Development Economics 122: 127-146. Chin, A. and Cortes, K.E. (2015). The Refugee/Asylum Seeker. In Handbook of the Economics of International Migration, Volume 1, Edited by Chiswick, B.R. and Miller, P.W. Pages 585-658. Chiquiar, D. and Hanson, G.H. (2005). International Migration, Self-selection, and the Distribution of Wages: Evidence from Mexico and the United States. Journal of Political Economy 113(2): 239–281. Cohen, Y. (2007). Self-Selection and Earnings Assimilation: Immigrants from the Former Soviet Union in Israel and the United States. Demography 44(3): 649–668. Dinas, E., Matakos, K., Xefteris, D., Hangartner, D. (2017). Waking up the Golden Dawn: Does Exposure to the Refugee Crisis Increase Support for Extreme-right Parties? Manuscript. Docquier, F., Lowell, B.L. and Marfouk, A. (2009). A Gendered Assessment of Highly Skilled Emigration. Population and Development Review 35: 297–321. Dustmann, C., Fasani, F., Frattini, T., Minale, L. and Schönberg, U. (2017). On the Economics and Politics of Refugee Migration. Economic policy 32(91): 497-550.

28
Dustmann, C., Vasiljeva, K., and Damm, A.P. (forthcoming). Refugee Migration and Electoral Outcomes. The Review of Economic Studies. Edo, A., Giesing, Y., Öztunc, J., and Poutvaara, P. (2018). Immigration and Electoral Support for the Far-Left and the Far-Right. CESifo Working Paper No. 6918. Eurofound (2016). Approaches to the Labour Market Integration of Refugees and Asylum Seekers. Publications Office of the European Union, Luxembourg. Fernandez-Huertas Moraga, J. (2011). New Evidence on Emigrant Selection. Review of Economics and Statistics 93(1): 72–96. Grogger, J., and Hanson, G.H. (2011). Income Maximization and the Selection and Sorting of International Migrants. Journal of Development Economics 95: 42-57. Guichard, L. (2017). Self-selection of Refugees. Manuscript, IAB. Halla, M., Wagner, A. F., and Zweimüller, J. (2017). Immigration and Voting for the Far Right. Journal of the European Economic Association 15: 1341–1385. Hatton, T.J. (2017). Refugees and Asylum Seekers, the Crisis in Europe and the Future of Policy. Economic Policy 32(91): 447-496. Huddleston, T., Bilgili, Ö., Joki, A.L. and Vankova, Z. (2015). Migrant Integration Policy Index 2015. Barcelona Centre for International Affairs, Migration Policy Group. IOM (2016). Mixed Migration Flows in the Mediterranean and Beyond. Available here: http://migration.iom.int/docs/Analysis_Flow_Monitoring_and_Human_Trafficking_Surveys_in_the_Mediterranean_and_Beyond_8_DECEMBER_2016.pdf IOM (2017). Mixed Migration Flows in the Eastern Mediterranean and Beyond. Available here: http://migration.iom.int/docs/Analysis_Flow_Monitoring_Surveys_in_the_Mediterranean_and_Beyond_11_April_2017.pdf Mayda, A. (2010). International Migration: A Panel Data Analysis of the Determinants of Bilateral Flows. Journal of Population Economics 23: 1249–1274.

29
MEDAM (2018). Flexible Solidarity: A Comprehensive Strategy for Asylum and Immigration in the EU – 2018 MEDAM Assessment Report on Asylum and Migration Policies in Europe, Mercator Dialogue on Asylum and Migration, Kiel. OECD (2016). Making Integration Work: Refugees and others in need of protection, OECD Publishing, Paris. OECD (2018). Engaging with Employers in the Hiring of Refugees, Paris. Otto, A.H. and Steinhardt, M.F. (2014). Immigration and Election Outcomes: Evidence from City Districts in Hamburg. Regional Science and Urban Economics 45: 67–79. Parey, M., Ruhose, J., Waldinger, F. and Netz, N. (2017). The Selection of High-skilled Emigrants. Review of Economics and Statistics 99(5): 776-792. Pettersson, T. and Eck, K. (2018). Organized Violence, 1989-2017. Journal of Peace Research 55(4): 535-547. Roy, A.D. (1951). Some Thoughts on the Distribution of Earnings. Oxford Economic Papers 3(2): 135-146. UNHCR (1967). Convention and Protocol Relating to the Status of Refugees. Available here: http://www.unhcr.org/3b66c2aa10 UNHCR (2017). Global Trends: Forced Displacement in 2016. Available here: http://www.unhcr.org/5943e8a34.pdf UNHCR (2018). See and Land Arrivals Monthly. Available here: https://data2.unhcr.org/en/situations/mediterranean UNICEF (2017). Harrowing Journeys. Available here: https://data.unicef.org/resources/harrowing-journeys/ World Bank (2018). Asylum Seekers in the European Union: Building Evidence to Inform Policy Making, Washington, D.C.

30
Figure 1: Sea and land arrivals to Europe, monthly
Source: UNHCR and authors’ calculations. Figure 2: Mediterranean Sea routes and main land routes
Source: IOM and authors’ calculations.
0
50000
100000
150000
200000
250000Ja
nuar
y, 2
015
Febr
uary
, 201
5M
arch
, 201
5Ap
ril, 2
015
May
, 201
5Ju
ne, 2
015
July
, 201
5Au
gust
, 201
5Se
ptem
ber,
2015
Octo
ber,
2015
Nov
embe
r, 20
15D
ecem
ber,
2015
Janu
ary,
201
6Fe
brua
ry, 2
016
Mar
ch, 2
016
April
, 201
6M
ay, 2
016
June
, 201
6Ju
ly, 2
016
Augu
st, 2
016
Sept
embe
r, 20
16Oc
tobe
r, 20
16N
ovem
ber,
2016
Dec
embe
r, 20
16Ja
nuar
y, 2
017
Febr
uary
, 201
7M
arch
, 201
7Ap
ril, 2
017
May
, 201
7Ju
ne, 2
017
July
, 201
7Au
gust
, 201
7Se
ptem
ber,
2017
Octo
ber,
2017
Nov
embe
r, 20
17D
ecem
ber,
2017

31
Figure 3: Intended destination country, age 14+
Source: FMS (2015-16) and authors’ calculations. Figure 4: Reasons to emigrate by intended destination country
Source: FMS (2015-16) and authors’ calculations.
0
5
10
15
20
25
30
35
40
45
Ger
man
y
Italy
Fran
ce
Swed
en
Aust
ria UK
Net
herla
nds
Switz
erla
nd
Nor
way
Belg
ium
Den
mar
k
Finl
and
Othe
rs
Unkn
own
Perc
enta
ge o
f res
pond
ents
0%
20%
40%
60%
80%
100%
Perc
enta
ge o
f res
pond
ents
Conflict or persecution Limited access to amenities
Natural disasters/other reasons Economic reasons

32
Figure 5: Reasons to emigrate by origin country
Source: FMS (2015-16) and authors’ calculations.
0%
20%
40%
60%
80%
100%
Syria
Suda
n
Iraq
Som
alia
Afgh
anis
tan
Liby
a
Mal
i
Nig
eria
Côte
d'Iv
oire
Cam
eroo
n
Gui
nea
Sene
gal
Iran
Gha
na
Bang
lade
sh
Paki
stan
Egyp
t
Alge
ria
Mor
occo
Perc
enta
ge o
f res
pond
ents
Conflict or persecution Limited access to amenities
Natural disasters/other reasons Economic reasons
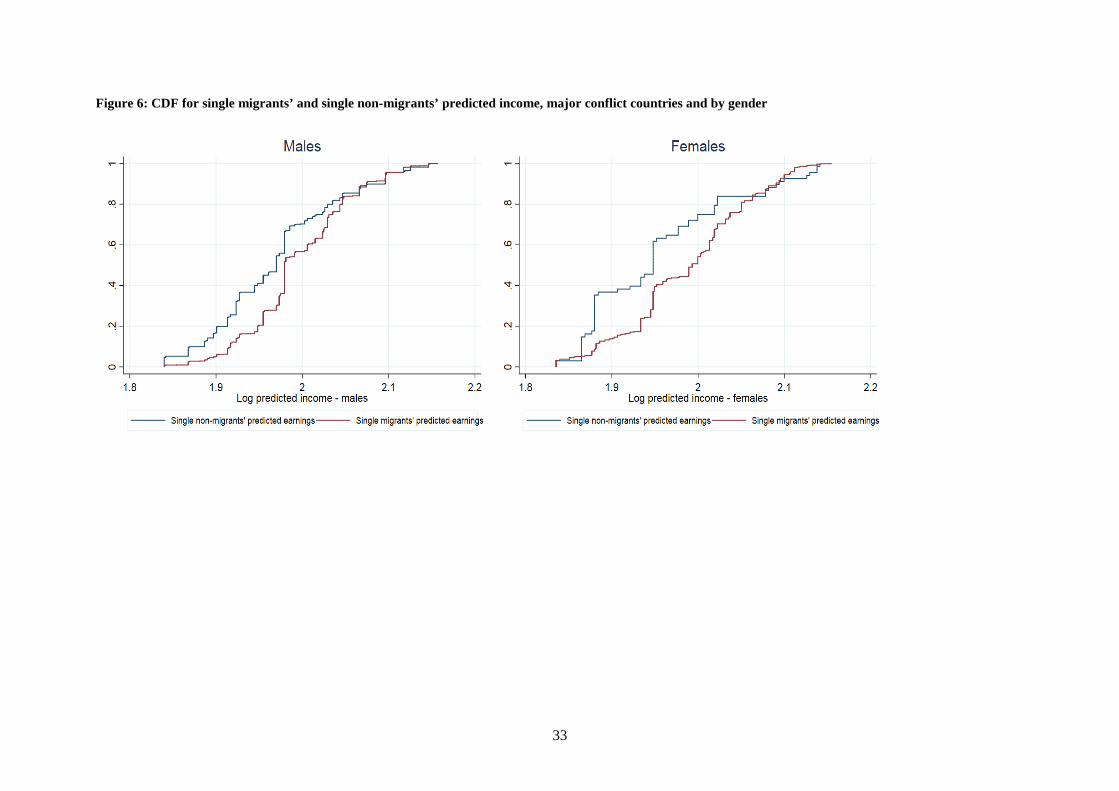
33
Figure 6: CDF for single migrants’ and single non-migrants’ predicted income, major conflict countries and by gender

34
Figure 7: CDF for single migrants’ and single non-migrants’ predicted income, minor or no conflict countries and by gender
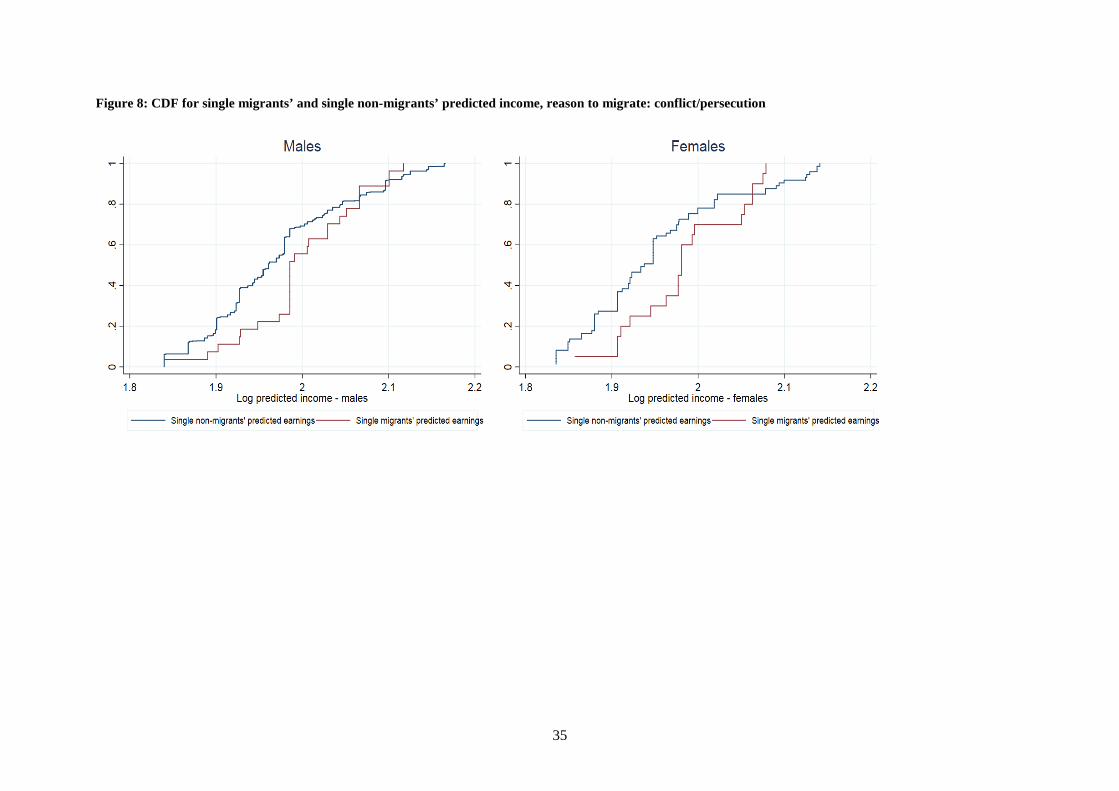
35
Figure 8: CDF for single migrants’ and single non-migrants’ predicted income, reason to migrate: conflict/persecution

36
Figure 9: CDF for single migrants’ and single non-migrants’ predicted income, reason to migrate: others (i.e. all but conflict/persecution)

37
Table 1: Comparison of FMS and Eurostat data by nationality
Nationality Number of observations from FMS
Share Share of Males
FMS Eurostat FMS Eurostat Syria 5562 0.256 0.255 0.719 0.674 Afghanistan 4026 0.185 0.128 0.866 0.765 Iraq 2028 0.093 0.085 0.803 0.681 Nigeria 1223 0.056 0.031 0.729 0.698 Pakistan 1056 0.049 0.036 0.985 0.933 Eritrea 971 0.045 0.040 0.778 0.705 Morocco 817 0.038 0.007 0.902 0.896 Iran 721 0.033 0.024 0.770 0.711 Guinea 553 0.025 0.008 0.955 0.790 Bangladesh 418 0.019 0.014 0.995 0.940 Senegal 400 0.018 0.008 0.983 0.939 Mali 323 0.015 0.009 0.954 0.936 Sudan 317 0.015 0.009 0.962 0.916 Somalia 285 0.013 0.019 0.677 0.678 Côte d'Ivoire 284 0.013 0.006 0.852 0.806 Algeria 246 0.011 0.008 0.967 0.888 Egypt 237 0.011 0.004 0.987 0.830 Ghana 215 0.010 0.006 0.986 0.882 Cameroon 165 0.008 0.003 0.812 0.675 Libya 108 0.005 0.004 0.935 0.758
Correlation: 0.978*** Correlation: 0.875*** Source: Flow Monitoring Surveys, 2015 and 2016. Eurostat, 2015 and 2016. Notes: Eurostat data set contains information on the number of asylum applications by nationality. The table only includes countries, which at least 100 respondents in the FMS named as their nationality. Eritrea is not included in the analysis as it is not surveyed by Gallup World Polls. * significant at 10%; ** significant at 5%; *** significant at 1%.

38
Table 2.a: Descriptive Characteristics from Flow Monitoring Survey (all ages) (1) (2) (3) (4) Variables Full sample Wave 1
(10/2015 - 12/2015) Wave 2
(01/2016 - 11/2016) Wave 3
(06/2016 - 11/2016) Age 26.45 (8.46) 27.40 (8.85) 27.77 (8.73) 22.50 (5.94) Male 0.82 (0.38) 0.79 (0.40) 0.81 (0.39) 0.87 (0.33) Married 0.29 (0.46) -- 0.43 (0.50) 0.16 (0.37) Divorced 0.00 (0.01) -- 0.01 (0.11) 0.00 (0.07) Widowed 0.00 (0.00) -- 0.01 (0.10) 0.00 (0.07) Secondary education 0.50 (0.50) 0.40 (0.49) 0.53 (0.50) 0.45 (0.50) Tertiary level education 0.18 (0.38) 0.36 (0.48) 0.20 (0.40) 0.06 (0.24) Employed 0.47 (0.50) -- 0.47 (0.50) 0.46 (0.50) Reasons for leaving: Conflict or persecution 0.77 (0.42) 0.86 (0.35) 0.79 (0.40) 0.67 (0.46) Economic reasons 0.17 (0.38) 0.11 (0.31) 0.17 (0.38) 0.21 (0.41) Limited access to amenities 0.03 (0.18) 0.01 (0.06) 0.01 (0.11) 0.08 (0.26) Other reasons 0.02 (0.15) 0.02 (0.10) 0.02 (0.15) 0.03 (0.16) Nationalities: Syria 0.29 (0.46) 0.47 (0.50) 0.36 (0.48) 0.01 (0.09) Afghanistan 0.21 (0.40) 0.24 (0.42) 0.28 (0.45) 0.01 (0.07) Iraq 0.11 (0.30) 0.14 (0.35) 0.13 (0.34) 0.01 (0.09) Nigeria 0.06 (0.25) 0.01 (0.07) 0.00 (0.05) 0.26 (0.43) Pakistan 0.05 (0.22) 0.06 (0.23) 0.07 (0.25) 0.01 (0.13) Morocco 0.04 (0.20) 0.02 (0.15) 0.05 (0.22) 0.03 (0.17) Iran 0.04 (0.19) 0.05 (0.22) 0.05 (0.21) 0.01 (0.05) Guinea 0.03 (0.16) 0.01 (0.02) 0.01 (0.030 0.11 (0.32) Bangladesh 0.02 (0.14) 0.01 (0.08) 0.00 (0.06) 0.08 (0.26) Senegal 0.02 (0.14) 0.01 (0.05) 0.00 (0.06) 0.08 (0.27) N 18,945 1,638 12,708 4,599 Source: Flow Monitoring Surveys, 2015 and 2016. Notes: Means (standard deviations). The sample sizes for some variables are different either due to missing data or because they were not asked in each wave.

39
Table 2.b: Descriptive Characteristics from Flow Monitoring Survey (25-64 ages) (1) (2) (3) (4) Variables Full sample Wave 1
(10/2015 - 12/2015) Wave 2
(01/2016 - 11/2016) Wave 3
(06/2016 - 11/2016) Age 32.42 (7.60) 32.70 (8.32) 32.92 (7.80) 29.60 (5.03) Male 0.80 (0.40) 0.80 (0.39) 0.79 (0.41) 0.87 (0.33) Married 0.57 (0.49) -- 0.65 (0.47) 0.40 (0.50) Divorced 0.01 (0.13) -- 0.02 (0.14) 0.01 (0.12) Widowed 0.01 (0.16) -- 0.01 (0.13) 0.01 (0.11) Secondary education 0.48 (0.50) 0.35 (0.47) 0.50 (0.49) 0.44 (0.50) Tertiary level education 0.25 (0.43) 0.41 (0.49) 0.26 (0.44) 0.12 (0.32) Employed 0.63 (0.48) -- 0.61 (0.49) 0.69 (0.46) Reasons for leaving: Conflict or persecution 0.79 (0.41) 0.86 (0.34) 0.79 (0.41) 0.69 (0.46) Economic reasons 0.17 (0.37) 0.10 (0.30) 0.17 (0.37) 0.22 (0.41) Limited access to amenities 0.02 (0.13) 0.02 (0.08) 0.01 (0.07) 0.06 (0.23) Other reasons 0.02 (0.16) 0.02 (0.08) 0.03 (0.16) 0.02 (0.15) Nationalities: Syria 0.37 (0.48) 0.51 (0.50) 0.41 (0.49) 0.03 (0.07) Afghanistan 0.17 (0.37) 0.15 (0.36) 0.20 (0.40) 0.01 (0.06) Iraq 0.14 (0.35) 0.15 (0.36) 0.16 (0.37) 0.02 (0.15) Nigeria 0.05 (0.21) 0.01 (0.08) 0.00 (0.05) 0.30 (0.46) Pakistan 0.06 (0.23) 0.06 (0.24) 0.06 (0.23) 0.03 (0.17) Morocco 0.05 (0.20) 0.02 (0.13) 0.05 (0.21) 0.18 (0.38) Iran 0.06 (0.23) 0.07 (0.24) 0.06 (0.25) 0.01 (0.07) Guinea 0.01 (0.09) 0.01 (0.03) 0.01 (0.03) 0.05 (0.22) Bangladesh 0.01 (0.12) 0.01 (0.07) 0.01 (0.05) 0.07 (0.26) Senegal 0.01 (0.10) 0.01 (0.05) 0.01 (0.06) 0.06 (0.24) N 9,828 925 7,475 1,428 Source: Flow Monitoring Surveys, 2015 and 2016. Notes: Means (standard deviations). The sample sizes for some variables are different either due to missing data or because they were not asked in each wave.

40
Table 3. Descriptive Characteristics from Gallup World Polls, 2009-2014 (1) (2) Full sample (all ages) Restricted sample (ages 25-64) Age 33.22 39.31 (14.68) (10.90) Male 0.51 0.52 (0.50) (0.50) Married 0.61 0.76 (0.49) (0.42) Divorced 0.02 0.03 (0.15) (0.17) Widowed 0.04 0.04 (0.21) (0.21) Secondary education 0.42 0.37 (0.49) (0.48) Tertiary level education 0.08 0.10 (0.27) (0.29) Employed 0.48 0.55 (0.50) (0.50) N 129,431 89,484 Source: Gallup World Polls, 2009-2014. Means (standard deviations). This table presents summary statistics for 19 source countries included in the analysis: Afghanistan, Algeria, Bangladesh, Cameroon, Côte d'Ivoire, Egypt, Ghana, Guinea, Iran, Iraq, Libya, Mali, Morocco, Nigeria, Pakistan, Senegal, Somalia, Sudan, and Syria.

41
Table 4: Educational attainment by source country (1) (2) (3) (4) Secondary education
(Full-sample) Tertiary education
(Full-sample) Secondary education
(Ages 25-64) Tertiary education
(Ages 25-64) Flow Monitoring Surveys
Syria 0.51 (0.50) 0.31 (0.46) 0.48 (0.50) 0.34 (0.47) Afghanistan 0.45 (0.50) 0.13 (0.34) 0.39 (0.49) 0.19 (0.39) Iraq 0.61 (0.49) 0.20 (0.40) 0.59 (0.49) 0.23 (0.42) Nigeria 0.50 (0.50) 0.06 (0.23) 0.52 (0.50) 0.09 (0.29) Pakistan 0.56 (0.50) 0.11 (0.31) 0.53 (0.50) 0.14 (0.35) Morocco 0.66 (0.47) 0.09 (0.29) 0.63 (0.48) 0.11 (0.32) Iran 0.44 (0.50) 0.40 (0.49) 0.41 (0.49) 0.45 (0.50) Guinea 0.47 (0.50) 0.06 (0.24) 0.38 (0.48) 0.18 (0.39) Bangladesh 0.39 (0.48) 0.02 (0.14) 0.44 (0.49) 0.05 (0.22) Senegal 0.36 (0.48) 0.04 (0.20) 0.32 (0.47) 0.06 (0.23) Gallup World Polls Syria 0.37 (0.48) 0.07 (0.25) 0.35 (0.48) 0.09 (0.28) Afghanistan 0.25 (0.44) 0.04 (0.19) 0.21 (0.41) 0.05 (0.22) Iraq 0.46 (0.50) 0.13 (0.33) 0.43 (0.50) 0.15 (0.35) Nigeria 0.71 (0.45) 0.03 (0.17) 0.69 (0.46) 0.04 (0.20) Pakistan 0.27 (0.44) 0.05 (0.22) 0.24 (0.42) 0.06 (0.23) Morocco 0.34 (0.47) 0.06 (0.25) 0.26 (0.44) 0.08 (0.27) Iran 0.58 (0.49) 0.25 (0.43) 0.54 (0.50) 0.28 (0.44) Guinea 0.16 (0.37) 0.06 (0.24) 0.12 (0.32) 0.08 (0.27) Bangladesh 0.47 (0.49) 0.03 (0.16) 0.41 (0.49) 0.03 (0.18) Senegal 0.39 (0.48) 0.02 (0.15) 0.33 (0.47) 0.03 (0.18) Source: Flow Monitoring Surveys, 2015 and 2016. Gallup World Polls, 2009-2014. Notes: Means (standard deviations).

42
Table 5: Self-selection of refugees and irregular migrants, adults aged 25-64 (1) (2) (3) Sample All Major conflict Minor or no conflict Secondary education 0.022*** 0.045*** -0.006** (0.002) (0.004) (0.002) Tertiary education 0.037*** 0.049*** 0.016*** (0.004) (0.005) (0.005) Employed 0.001 0.003 -0.001 (0.002) (0.003) (0.003) Female -0.057*** -0.066*** -0.044*** (0.002) (0.003) (0.003) Age 25-34 0.079*** 0.097*** 0.061*** (0.002) (0.004) (0.003) Age 35-44 0.035*** 0.052*** 0.016*** (0.002) (0.004) (0.002) Age 45-54 0.012*** 0.021*** 0.005*** (0.002) (0.003) (0.001) Married -0.035*** -0.031*** -0.043*** (0.003) (0.005) (0.004) Divorced -0.036*** -0.066*** -0.003 (0.006) (0.008) (0.008) Widowed -0.013*** -0.015** -0.018*** (0.005) (0.007) (0.005) Country FE Yes Yes Yes r2 0.081 0.079 0.061 N 62488 34405 28083 Source: Flow Monitoring Surveys, 2015 and 2016. Gallup World Polls, 2009-2014. Notes: * significant at 10%; ** significant at 5%; *** significant at 1%. Outcome variable, refugee/migrant, is equal to 1 for respondents in the Flow Monitoring Surveys and 0 for participants in Gallup World Polls. All specifications include source country fixed effects. Countries are classified by the level of conflict following the definitions provided by Uppsala Conflict Data Program: major conflict category includes countries with 1000 or more battle-related deaths in a given year over the sample period (Afghanistan, Iraq, Nigeria, Pakistan, Sudan, Syria); minor conflict category includes countries with 25 to 999 battle-related casualties in a given year over the sample period (Algeria, Iran); no conflict category includes countries that did not experience a major conflict or minor conflict over the sample period (Bangladesh, Cameroon, Côte d'Ivoire, Morocco, Senegal). Reference categories are as follows: less than secondary education, unemployed or out of labor force, female, age 54+, and single.

43
Table 6: Self-selection of refugees and irregular migrants, adults aged 25-64, males (1) (2) (3) Sample All Major conflict Minor or no conflict Secondary education 0.021*** 0.045*** -0.010** (0.004) (0.005) (0.004) Tertiary education 0.036*** 0.053*** 0.008 (0.005) (0.007) (0.008) Employed 0.012*** 0.029*** -0.011** (0.004) (0.005) (0.005) Age 25-34 0.107*** 0.126*** 0.095*** (0.004) (0.006) (0.005) Age 35-44 0.043*** 0.068*** 0.021*** (0.003) (0.005) (0.003) Age 45-54 0.014*** 0.028*** 0.005** (0.003) (0.005) (0.002) Married -0.062*** -0.067*** -0.059*** (0.005) (0.007) (0.006) Divorced -0.081*** -0.133*** -0.001 (0.011) (0.013) (0.018) Widowed -0.070*** -0.088*** -0.033** (0.011) (0.016) (0.013) Country FE Yes Yes Yes r2 0.086 0.082 0.072 N 33253 18869 14384 Source: Flow Monitoring Surveys, 2015 and 2016. Gallup World Polls, 2009-2014. Notes: * significant at 10%; ** significant at 5%; *** significant at 1%. Outcome variable, refugee/migrant, is equal to 1 for respondents in the Flow Monitoring Surveys and 0 for participants in Gallup World Polls. Countries are classified by the level of conflict following the definitions provided by Uppsala Conflict Data Program: major conflict category includes countries with 1000 or more battle-related deaths in any of the years over the sample period (Afghanistan, Iraq, Nigeria, Pakistan, Sudan, Syria); minor conflict category includes countries with 25 to 999 battle-related casualties in any of the years over the sample period (Algeria, Iran); no conflict category includes countries that did not experience a major conflict or minor conflict in any of the years over the sample period (Bangladesh, Cameroon, Côte d'Ivoire, Morocco, Senegal). Reference categories are as follows: less than secondary education, unemployed or out of labor force, female, age 54+, and single.

44
Table 7: Self-selection of refugees and irregular migrants, adults aged 25-64, females (1) (2) (3) Sample All Major conflict Minor or no conflict Secondary education 0.025*** 0.046*** 0.001 (0.003) (0.004) (0.002) Tertiary education 0.045*** 0.057*** 0.028*** (0.005) (0.007) (0.006) Employed -0.012*** -0.034*** 0.015*** (0.002) (0.003) (0.003) Age 25-34 0.035*** 0.050*** 0.017*** (0.003) (0.005) (0.002) Age 35-44 0.016*** 0.027*** 0.001 (0.003) (0.005) (0.001) Age 45-54 0.003 0.009* -0.001 (0.002) (0.005) (0.001) Married 0.024*** 0.039*** 0.005 (0.003) (0.005) (0.003) Divorced 0.022*** 0.016 0.025*** (0.006) (0.010) (0.008) Widowed 0.031*** 0.049*** 0.007* (0.005) (0.008) (0.004) Country FE Yes Yes Yes r2 0.061 0.068 0.028 N 29235 15536 13699 Source: Flow Monitoring Surveys, 2015 and 2016. Gallup World Polls, 2009-2014. Notes: * significant at 10%; ** significant at 5%; *** significant at 1%. Outcome variable, refugee/migrant, is equal to 1 for respondents in the Flow Monitoring Surveys and 0 for participants in Gallup World Polls. Countries are classified by the level of conflict following the definitions provided by Uppsala Conflict Data Program: major conflict category includes countries with 1000 or more battle-related deaths in any of the years over the sample period (Afghanistan, Iraq, Nigeria, Pakistan, Sudan, Syria); minor conflict category includes countries with 25 to 999 battle-related casualties in any of the years over the sample period (Algeria, Iran); no conflict category includes countries that did not experience a major conflict or minor conflict in any of the years over the sample period (Bangladesh, Cameroon, Côte d'Ivoire, Morocco, Senegal). Reference categories are as follows: less than secondary education, unemployed or out of labor force, female, age 54+, and single.

45
Table 8: Self-selection of refugees and irregular migrants, adults aged 25-64, FMS sample only (1) (2) (3) Outcome: reason to migrate: conflict or persecution Sample All Male Female Secondary education 0.067*** 0.054*** 0.121*** (0.013) (0.015) (0.026) Tertiary education 0.080*** 0.087*** 0.048* (0.017) (0.019) (0.023) Employed -0.027** -0.020 -0.006 (0.014) (0.003) (0.034) Married 0.019 0.015 0.050 (0.014) (0.015) (0.049) Divorced -0.009 0.026 0.013 (0.042) (0.057) (0.072) Widowed 0.040 0.068 0.031 (0.043) (0.069) (0.070) Country FE Yes Yes Yes r2 0.359 0.350 0.429 N 4473 3553 920 Source: Flow Monitoring Surveys, 2015 and 2016. Notes: * significant at 10%; ** significant at 5%; *** significant at 1%. Outcome variable, reason to migrate: conflict or persecution, is equal to 1 for respondents who cite conflict or persecution as the main reason to migrate and 0 for other respondents who cite other reasons (economic reasons, limited access to amenities and natural disasters and other reasons) in the Flow Monitoring Surveys. Reference categories are as follows: less than secondary education, unemployed or out of labor force, and single.

46
Table 9: Self-selection of refugees and irregular migrants based on predicted income, adults aged 25-64 (1) (2) (3) (4) (5) Sample All Major conflict Minor or no conflict Major conflict & singles Minor or no conflict & singles
Men and women Predicted log income 0.080*** 0.103*** 0.047*** 0.035*** 0.002* (0.004) (0.006) (0.004) (0.012) (0.000) r2 0.045 0.042 0.011 0.071 0.011 N 62488 34405 28083 6839 5787 Country FE Yes Yes Yes Yes Yes
Men Predicted log income 0.101*** 0.127*** 0.062*** 0.019** -0.015*** (0.006) (0.008) (0.007) (0.008) (0.004) r2 0.050 0.048 0.012 0.093 0.043 N 33253 18869 14384 4648 3751 Country FE Yes Yes Yes Yes Yes
Women Predicted log income 0.037*** 0.046*** 0.026*** 0.044*** 0.018*** (0.004) (0.006) (0.004) (0.008) (0.003) r2 0.050 0.046 0.014 0.036 0.014 N 29235 15536 13699 2191 2036 Country FE Yes Yes Yes Yes Yes Source: Flow Monitoring Surveys, 2015 and 2016. Gallup World Polls, 2009-2014. Notes: * significant at 10%; ** significant at 5%; *** significant at 1%. Outcome variable, refugee/migrant, is equal to 1 for respondents in the Flow Monitoring Surveys and 0 for participants in Gallup World Polls. Countries are classified by the level of conflict following the definitions provided by Uppsala Conflict Data Program: major conflict category includes countries with 1000 or more battle-related deaths in any of the years over the sample period (Afghanistan, Iraq, Nigeria, Pakistan, Sudan, Syria); minor conflict category includes countries with 25 to 999 battle-related casualties in any of the years over the sample period (Algeria, Iran); no conflict category includes countries that did not experience a major conflict or minor conflict in any of the years over the sample period (Bangladesh, Cameroon, Côte d'Ivoire, Morocco, Senegal).
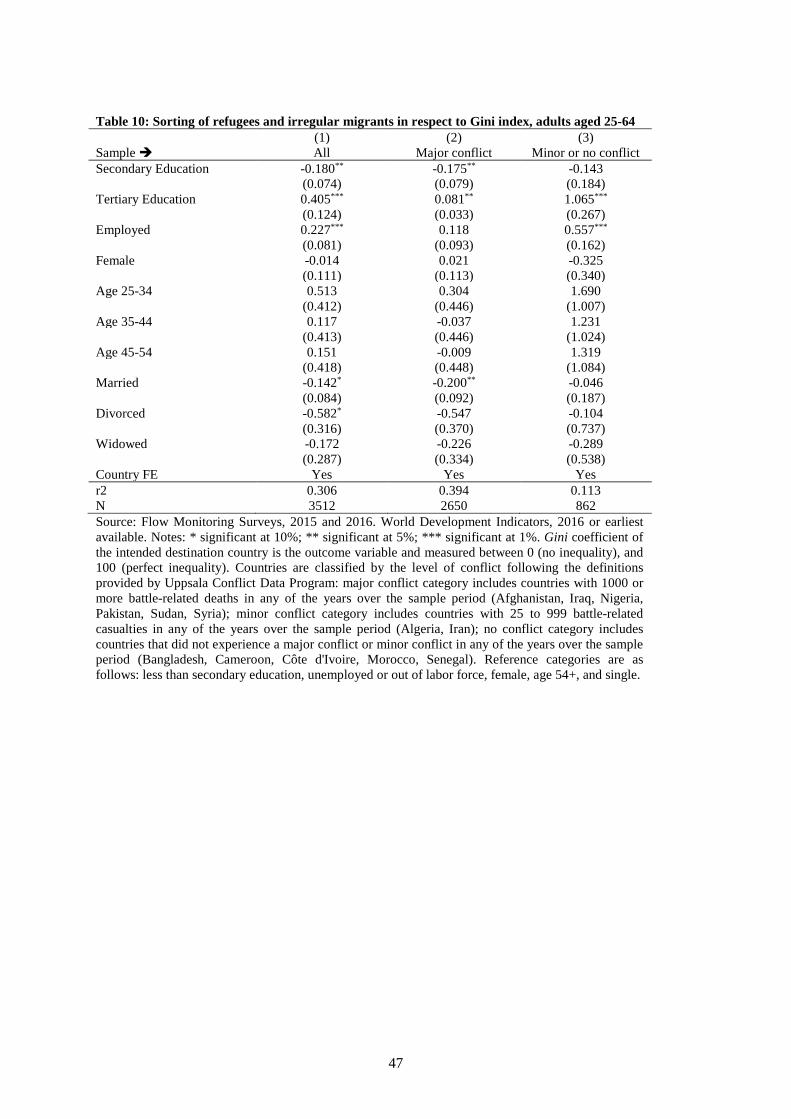
47
Table 10: Sorting of refugees and irregular migrants in respect to Gini index, adults aged 25-64 (1) (2) (3) Sample All Major conflict Minor or no conflict Secondary Education -0.180** -0.175** -0.143 (0.074) (0.079) (0.184) Tertiary Education 0.405*** 0.081** 1.065*** (0.124) (0.033) (0.267) Employed 0.227*** 0.118 0.557*** (0.081) (0.093) (0.162) Female -0.014 0.021 -0.325 (0.111) (0.113) (0.340) Age 25-34 0.513 0.304 1.690 (0.412) (0.446) (1.007) Age 35-44 0.117 -0.037 1.231 (0.413) (0.446) (1.024) Age 45-54 0.151 -0.009 1.319 (0.418) (0.448) (1.084) Married -0.142* -0.200** -0.046 (0.084) (0.092) (0.187) Divorced -0.582* -0.547 -0.104 (0.316) (0.370) (0.737) Widowed -0.172 -0.226 -0.289 (0.287) (0.334) (0.538) Country FE Yes Yes Yes r2 0.306 0.394 0.113 N 3512 2650 862 Source: Flow Monitoring Surveys, 2015 and 2016. World Development Indicators, 2016 or earliest available. Notes: * significant at 10%; ** significant at 5%; *** significant at 1%. Gini coefficient of the intended destination country is the outcome variable and measured between 0 (no inequality), and 100 (perfect inequality). Countries are classified by the level of conflict following the definitions provided by Uppsala Conflict Data Program: major conflict category includes countries with 1000 or more battle-related deaths in any of the years over the sample period (Afghanistan, Iraq, Nigeria, Pakistan, Sudan, Syria); minor conflict category includes countries with 25 to 999 battle-related casualties in any of the years over the sample period (Algeria, Iran); no conflict category includes countries that did not experience a major conflict or minor conflict in any of the years over the sample period (Bangladesh, Cameroon, Côte d'Ivoire, Morocco, Senegal). Reference categories are as follows: less than secondary education, unemployed or out of labor force, female, age 54+, and single.

48
Table 11: Sorting of refugees and irregular migrants in respect of characteristics of destination countries, adults aged 25-64 (1) (2) (3) (4) (5) Outcome Unemployment rate
(log) Migrant integration
policy index Average duration of asylum procedure
Waiting duration for labor market access
Social expenditure (as percentage of GDP)
Primary Education -0.092*** 0.844*** -0.035*** -0.072*** 0.687*** (0.019) (0.270) (0.007) (0.014) (0.140) Secondary Education -0.084*** 0.841*** -0.011*** -0.051*** 0.723*** (0.018) (0.265) (0.003) (0.013) (0.137) Employed 0.024* 0.020 0.002 0.004 -0.136 (0.015) (0.189) (0.005) (0.009) (0.103) Female -0.042** 0.774*** 0.020*** 0.005 -0.384*** (0.017) (0.270) (0.007) (0.012) (0.132) Age 25-34 0.075* -0.311 0.007 0.043 0.437 (0.044) (1.145) (0.030) (0.044) (0.369) Age 35-44 0.005 0.460 -0.002 0.011 0.290 (0.045) (1.152) (0.030) (0.044) (0.370) Age 45-54 -0.031 0.357 0.010 -0.008 -0.314 (0.418) (1.217) (0.031) (0.044) (0.393) Married -0.012 0.637*** -0.001 -0.016* 0.068 (0.014) (0.190) (0.005) (0.009) (0.104) Divorced 0.037 0.221 -0.032* 0.004 0.389 (0.045) (0.676) (0.019) (0.029) (0.373) Widowed -0.050 0.867 -0.001 -0.017 -0.356 (0.056) (1.008) (0.027) (0.034) (0.452) Country FE Yes Yes Yes Yes Yes r2 0.302 0.053 0.192 0.076 0.353 N 3492 3509 3484 3509 3423 Source: Eurofound, Flow Monitoring Surveys, 2015 and 2016, MIPEX, OECD, World Development Indicators. Notes: * significant at 10%; ** significant at 5%; *** significant at 1%. Unemployment (log) is the unemployment rate in the intended destination country in the survey year. Migrant integration policy index is a continuous variable (0-100, with 100 being the top score) and measures the country specific integration outcomes, integration policies, and other contextual factors for migrants’ integration. Average duration of asylum procedure is the duration (number of months) between the submission of the asylum claim and the first decision (rescaled from 0 to 1, with 1 being the longest duration). Waiting duration for labor market access is the waiting period (number of months) for obtaining the work permit after claiming asylum (rescaled from 0 to 1, with 1 being the longest duration). Social expenditure is measured as a percentage of GDP and comprises cash benefits, direct in-kind provision of goods and services, and tax breaks with social purposes. Reference categories are as follows: tertiary education, unemployed or our of labor force, female, age 54+, and single.

49
Table 12: Sorting of refugees and irregular migrants into intended destinations, adults age 25-64 Outcome Intended destination country: Germany All Major conflict Minor or no conflict Secondary Education -0.041*** -0.043** -0.058** (0.015) (0.019) (0.024) Tertiary Education -0.005 0.022 -0.074* (0.022) (0.027) (0.038) r2 0.284 0.245 0.106 Outcome Intended destination country: Italy Secondary Education -0.054*** -0.027* -0.135*** (0.013) (0.014) (0.033) Tertiary Education -0.081*** -0.070*** -0.127*** (0.017) (0.019) (0.040) r2 0.456 0.491 0.375 Outcome Intended destination country: France Secondary Education 0.030*** -0.003 0.129*** (0.010) (0.010) (0.028) Tertiary Education -0.006 -0.023* 0.052* (0.012) (0.013) (0.029) r2 0.201 0.067 0.299 Outcome Intended destination country: Sweden Secondary Education 0.020*** 0.028*** -0.003 (0.007) (0.009) (0.007) Tertiary Education -0.010 -0.011 -0.002 (0.008) (0.010) (0.009) r2 0.067 0.064 0.026 Outcome Intended destination country: Austria Secondary Education 0.003 0.002 0.006 (0.007) (0.008) (0.011) Tertiary Education 0.002 0.015 -0.037** (0.011) (0.013) (0.017) r2 0.052 0.056 0.069 N 3421 2480 941 Demographics Yes Yes Yes Employment status before migration
Yes Yes Yes
Country fixed effects Yes Yes Yes Source: Flow Monitoring Surveys, 2015 and 2016. Notes: * significant at 10%; ** significant at 5%; *** significant at 1%. Intended destination country is the outcome variable. Countries are classified by the level of conflict following the definitions provided by Uppsala Conflict Data Program: major conflict category includes countries with 1000 or more battle-related deaths in any of the years over the sample period (Afghanistan, Iraq, Nigeria, Pakistan, Sudan, Syria); minor conflict category includes countries with 25 to 999 battle-related casualties in any of the years over the sample period (Algeria, Iran); no conflict category includes countries that did not experience a major conflict or minor conflict in any of the years over the sample period (Bangladesh, Cameroon, Côte d'Ivoire, Morocco, Senegal).

50
Table 13: Border policies and sorting of refugees and irregular migrants, adults age 15+ Outcome Intended destination country
(1) Germany
(2) Italy
(3) France
(4) Sweden
(5) Austria
(6) UK
Austria quota announcement 0.160*** 0.001 0.000 -0.058*** 0.016*** 0.001 (0.011) (0.008) (0.006) (0.005) (0.005) (0.005) Austria imposes quota -0.007 0.012 0.007 -0.015*** -0.025*** -0.002 (0.011) (0.008) (0.006) (0.006) (0.005) (0.005) Hungary border closing -0.111 0.007 0.004 -0.055 0.031 0.024 (0.080) (0.059) (0.045) (0.039) (0.034) (0.035) Slovenia and Macedonia border tightening -0.161*** 0.003 0.029** 0.048*** 0.010** 0.024*** (0.012) (0.009) (0.006) (0.006) (0.005) (0.039) Sweden border control 0.116*** 0.007 -0.015 -0.072*** -0.002 0.000 (0.018) (0.013) (0.010) (0.009) (0.008) (0.008) Demographics Yes Yes Yes Yes Yes Yes Employment status before migration Yes Yes Yes Yes Yes Yes Origin Country FE Yes Yes Yes Yes Yes Yes Survey Country FE Yes Yes Yes Yes Yes Yes r2 0.406 0.503 0.407 0.082 0.030 0.082 N 20463 20463 20463 20463 20463 20463 Source: Flow Monitoring Surveys, 2015 and 2016. Notes: * significant at 10%; ** significant at 5%; *** significant at 1%. Intended destination country is the outcome variable, which is equal to one if a refugee or irregular migrant names a particular country as their country of destination and zero otherwise. Austria quota announcement is equal to one for interview dates after Austria announced this quota on 20th January 2016. Austria imposes quota refers to a dummy variable that is equal to one, if interviews were conducted after 19th February 2016, when Austria imposed a quota of accepting maximum 80 refugees or irregular migrants and a maximum of 3,200 people allowed traveling through Austria per day. Hungary border closing is equal to one if the interview took place after Hungary closed its border on 16th October 2015. Slovenia and Macedonia border tightening refers to the date on which Macedonia closed its border with Greece and Slovenia set stricter border controls and it is equal to one if the interview was conducted after 9th March 2016. Sweden border control is equal to one, if interviews took place after the 11th November 2015. For details on individual characteristics, see notes to Table 5.

51
Appendix Figure 1: CDF for single migrants’ and single non-migrants’ predicted income, all country groups and by gender

52
Appendix Table 1. Descriptive Characteristics from Flow Monitoring Survey – Excluded Countries (1) (2) Full sample (all ages) Restricted sample (ages 25-64) Age 25.38 31.05 (7.28) (6.39) Male 0.86 0.83 (0.34) (0.36) Married 0.26 0.49 (0.44) (0.50) Divorced 0.00 0.01 (0.09) (0.13) Widowed 0.00 0.01 (0.07) (0.12) Secondary education 0.49 0.51 (0.50) (0.50) Tertiary level education 0.13 0.16 (0.33) (0.36) Employed 0.46 0.64 (0.49) (0.48) Reasons for leaving: Conflict or persecution 0.65 0.63 (0.47) (0.48) Economic reasons 0.26 0.26 (0.43) (0.44) Limited access to amenities 0.05 0.05 (0.18) (0.13) Other reasons 0.04 0.06 (0.16) (0.19) N 587 283 Source: Flow Monitoring Surveys, 2015 and 2016. Means (standard deviations). This table presents summary statistics for 19 source countries that are not included in the analysis due to small number of observations (i.e. less than 100 respondents): Burkina Faso, Central African Republic, the Republic of the Congo, the Democratic Republic of the Congo, Cuba, Ethiopia, Guinea-Bissau, India, Kenya, Lebanon, Liberia, Mauritania, Nepal, Niger, Palestine, Sierra Leone, Sri Lanka, Togo, Tunisia.

53
Appendix Table 2: Descriptive Characteristics from Gallup World Polls, 2009-2011 (1) (1) Full sample (all ages) Restricted sample (ages 25-64) Age 33.20 38.87 (12.49) (10.51) Male 0.51 0.51 (0.50) (0.50) Married 0.58 0.73 (0.49) (0.44) Divorced 0.02 0.03 (0.14) (0.18) Widowed 0.03 0.04 (0.19) (0.20) Secondary education 0.42 0.36 (0.49) (0.48) Tertiary level education 0.08 0.10 (0.27) (0.30) Employed 0.49 0.56 (0.50) (0.50) N 65688 46270 Means (standard deviations). Source: Gallup World Polls, 2009-2011. This table presents summary statistics for 19 source countries included in the analysis: Afghanistan, Algeria, Bangladesh, Cameroon, Côte d'Ivoire, Egypt, Ghana, Guinea, Iran, Iraq, Libya, Mali, Morocco, Nigeria, Pakistan, Senegal, Somalia, Sudan, and Syria.

54
Appendix Table 3: Self-selection of refugees and irregular migrants, GWP 2009-2011 (1) (2) (3) Sample All Major conflict Minor or no conflict Secondary education 0.044*** 0.076*** -0.015*** (0.004) (0.006) (0.005) Tertiary education 0.089*** 0.096*** 0.077*** (0.007) (0.009) (0.014) Employed -0.004 -0.008 0.003 (0.004) (0.005) (0.007) Male 0.107*** 0.113*** 0.093*** (0.004) (0.005) (0.006) Age 25-34 0.153*** 0.166*** 0.130*** (0.005) (0.007) (0.006) Age 35-44 0.069*** 0.088*** 0.032*** (0.004) (0.006) (0.005) Age 45-54 0.025*** 0.036*** 0.009** (0.004) (0.006) (0.004) Married -0.049*** -0.037*** -0.080*** (0.006) (0.007) (0.008) Divorced -0.041*** -0.076*** 0.021 (0.011) (0.014) (0.019) Widowed -0.008 -0.010 -0.017* (0.009) (0.013) (0.010) Country FE Yes Yes Yes r2 0.161 0.134 0.234 N 29401 19023 10378 Source: Flow Monitoring Surveys, 2015 and 2016. Gallup World Polls, 2009-2011. Notes: * significant at 10%; ** significant at 5%; *** significant at 1%. Outcome variable, refugee/migrant, is equal to 1 for respondents in the Flow Monitoring Surveys and 0 for participants in Gallup World Polls (adults aged 25-64). All specifications include source country fixed effects. Countries are classified by the level of conflict following the definitions provided by Uppsala Conflict Data Program: major conflict category includes countries with 1000 or more battle-related deaths in a given year over the sample period (Afghanistan, Iraq, Nigeria, Pakistan, Sudan, Syria); minor conflict category includes countries with 25 to 999 battle-related casualties in a given year over the sample period (Algeria, Iran); no conflict category includes countries that did not experience a major conflict or minor conflict over the sample period (Bangladesh, Cameroon, Côte d'Ivoire, Morocco, Senegal). Reference categories are as follows: less than secondary education, unemployed or out of labor force, female, age 54+, and single.

55
Appendix Table 4: Self-selection of refugees and irregular migrants, males, GWP 2009-2011 (1) (2) (3) Sample All Major conflict Minor or no conflict Secondary education 0.039*** 0.070*** -0.021** (0.006) (0.008) (0.009) Tertiary education 0.082*** 0.097*** 0.047** (0.010) (0.012) (0.019) Employed 0.018** 0.037*** -0.024** (0.007) (0.009) (0.012) Age 25-34 0.209*** 0.225*** 0.197*** (0.007) (0.010) (0.011) Age 35-44 0.096*** 0.126*** 0.046*** (0.007) (0.009) (0.008) Age 45-54 0.034*** 0.057*** 0.004 (0.006) (0.009) (0.006) Married -0.089*** -0.079*** -0.105*** (0.008) (0.010) (0.013) Divorced -0.105*** -0.169*** 0.050 (0.020) (0.021) (0.038) Widowed -0.104*** -0.120*** -0.046* (0.020) (0.025) (0.027) Country FE Yes Yes Yes r2 0.171 0.144 0.243 N 16152 10650 5502 Source: Flow Monitoring Surveys, 2015 and 2016. Gallup World Polls, 2009-2011. Notes: * significant at 10%; ** significant at 5%; *** significant at 1%. Outcome variable, refugee/migrant, is equal to 1 for respondents in the Flow Monitoring Surveys and 0 for participants in Gallup World Polls (adults aged 25-64). Countries are classified by the level of conflict following the definitions provided by Uppsala Conflict Data Program: major conflict category includes countries with 1000 or more battle-related deaths in any of the years over the sample period (Afghanistan, Iraq, Nigeria, Pakistan, Sudan, Syria); minor conflict category includes countries with 25 to 999 battle-related casualties in any of the years over the sample period (Algeria, Iran); no conflict category includes countries that did not experience a major conflict or minor conflict in any of the years over the sample period (Bangladesh, Cameroon, Côte d'Ivoire, Morocco, Senegal). Reference categories are as follows: less than secondary education, unemployed or out of labor force, female, age 54+, and single.

56
Appendix Table 5: Self-selection of refugees and irregular migrants, females, GWP 2009-2011 (1) (2) (3) Sample All Major conflict Minor or no conflict Secondary education 0.048*** 0.078*** -0.002 (0.005) (0.007) (0.005) Tertiary education 0.108*** 0.111*** 0.115*** (0.010) (0.012) (0.020) Employed -0.029*** -0.063*** 0.036*** (0.005) (0.006) (0.007) Age 25-34 0.073*** 0.085*** 0.041*** (0.006) (0.009) (0.005) Age 35-44 0.030*** 0.040*** 0.002 (0.005) (0.008) (0.004) Age 45-54 0.008 0.011 -0.001 (0.005) (0.008) (0.003) Married 0.049*** 0.063*** 0.013* (0.006) (0.008) (0.007) Divorced 0.056*** 0.046*** 0.064*** (0.013) (0.017) (0.021) Widowed 0.067*** 0.083*** 0.021** (0.009) (0.014) (0.010) Country FE Yes Yes Yes r2 0.121 0.108 0.207 N 13249 8373 4876 Source: Flow Monitoring Surveys, 2015 and 2016. Gallup World Polls, 2009-2011. Notes: * significant at 10%; ** significant at 5%; *** significant at 1%. Outcome variable, refugee/migrant, is equal to 1 for respondents in the Flow Monitoring Surveys and 0 for participants in Gallup World Polls (adults aged 25-64). Countries are classified by the level of conflict following the definitions provided by Uppsala Conflict Data Program: major conflict category includes countries with 1000 or more battle-related deaths in any of the years over the sample period (Afghanistan, Iraq, Nigeria, Pakistan, Sudan, Syria); minor conflict category includes countries with 25 to 999 battle-related casualties in any of the years over the sample period (Algeria, Iran); no conflict category includes countries that did not experience a major conflict or minor conflict in any of the years over the sample period (Bangladesh, Cameroon, Côte d'Ivoire, Morocco, Senegal). Reference categories are as follows: less than secondary education, unemployed or out of labor force, female, age 54+, and single.

ifo Working Papers No. 288 Potrafke, N., Dragnet-controls and government ideology, January 2019.
No. 287 Drometer, M., Institutional quality and foreign aid, December 2018. No. 286 Nikolka, T., Familiy Return migration, December 2018.
No. 285 Dahlberg, M. and M. Valeyatheepillay, On the Anatomy of a Refugee Dispersal Policy: Neighborhood Integration and Dynamic Sorting, December 2018.
No. 284 Mier, M. and C. Weissbart, Power Markets in Transition: Decarbonization, Energy Efficiency,
and Short-Term Demand Response, December 2018. No. 283 Kauppinen, I. and P. Poutvaara, Preference for Redistribution and International Migration,
December 2018.
No. 282 Schwefer, M., Birth Order Effects and Educational Achievement in the Developing
World, December 2018.
No. 281 Simon, L. K., Shocking Choice: Trade Shocks, Local Labor Markets and Vocational Occupations Choices, December 2018.
No. 280 Klug, T., T. Schuler and E. Mayer, The Corporate Saving Glut and the Current Account in
Germany, December 2018. No. 279 Schwefer, M. and P. Poutvaara, Husbands’ and wives’ diverging perceptions on who
decides, December 2018.
No. 278 Curuk, M. and S. Sen, Climate Policy and Resource Extraction with Variable Markups
and Imperfect Substitutes, November 2018.
No. 277 Potrafke, N., Electoral cycles in perceived corruption: International empirical evidence, November 2018.

No. 276 Potrafke, N. and F. Roesel, A banana republic? The effects of inconsistencies in the counting of votes on voting behavior, November 2018.
No. 275 Bussolo, M., C. Krolage, M. Makovec, A. Peichl, M. Stöckli, I. Torre and C. Wittneben, Vertical and Horizontal Redistribution: The Cases of Western and Eastern Europe, November 2018.
No. 274 Schmitt, A., Optimal Carbon Pricing and Income Taxation Without Commitment,
November 2018. No. 273 Heinrich, M. and M. Reif, Forecasting using mixed-frequency VARs with time-varying
parameters, October 2018.
No. 272 Potrafke, N., The globalisation-welfare state nexus: Evidence from Asia, October 2018. No. 271 Sandkamp, A. and S. Yang, Where Has the Rum Gone? Firms’ Choice of Transport Mode
under the Threat of Maritime Piracy, October 2018. No. 270 Weissbart, C., Decarbonization of Power Markets under Stability and Fairness: Do They
Influence Efficiency?, October 2018.
No. 269 Hausfeld, J. and S. Resnjanskij, Risky Decisions and the Opportunity of Time, Octo-
ber 2018.
No. 268 Bornmann, L., K. Wohlrabe and S. Gralka, The Graduation Shift of German Universities
of Applied Sciences, October 2018.
No. 267 Potrafke, N., Does public sector outsourcing decrease public employment? Empirical evidence from OECD countries, October 2018.
No. 266 Hayo, B. and F. Neumeier, Central Bank Independence in New Zealand: Public
Knowledge About and Attitude Towards the Policy Target Agreement, October 2018. No. 265 Reif, M., Macroeconomic Uncertainty and Forecasting Macroeconomic Aggregates,
October 2018.


![LISA BECK AND PANU LAHTI arXiv:2009.09889v1 [math.FA] 21 … · 2020. 9. 22. · 2 LISA BECK AND PANU LAHTI This result is analogous to the case of weakly convergent sequences in](https://img.pdfslide.us/doc/110x75/60b8699914439d091443b875/lisa-beck-and-panu-lahti-arxiv200909889v1-mathfa-21-2020-9-22-2-lisa-beck.jpg)