Embed Size (px)
Citation preview
agricultural economics
Cien. Inv. Agr. 39(2):265-278. 2012www.rcia.uc.cl
Introduction
In foreign trade, logistics is key for competitive-ness in the global market, which, depending on management, means that they can represent a successful or an unsuccessful international ex-pansion for a company (Tugores, 2006; Plá and León, 2004). Accordingly, from the economic-financial perspective, international transport costs are critical for a coherent export project. These logistics costs have an important economic im-pact on the supply chain, on the final cost of the product and, consequently, on competitiveness.
Therefore, international transport costs represent an additional element within the total production costs of goods, and these costs include all that is necessary for that good to reach its potential consumers.
Terrestrial goods transport is an extremely com-plex market for two fundamental reasons: the large number of companies with a high level of atomization, which causes constant and slightly growing returns to scale (Blauwens et al., 2007) and the high levels of competence required for these activities (Quinet and Vickerman, 2004; De Rus et al., 2003). Due to the complex net of dif-ferent companies offering road transport services (autonomous, transport agencies, logistics agen-
research paper
Refrigeration logistics operations and perishable transport costs in groupage loads: an application for Spanish exports in Europe
Silvia Andrés González-MoralejoGrupo de Economía Internacional. Universidad Politécnica de Valencia, Departamento de Economía y
Ciencias Sociales, Escuela Técnica Superior de Ingeniería Agronómica y Medio Natural. Edificio 3B (2a planta). Camino de Vera, s/n. 46022, Valencia, Spain.
Abstract
S. Andrés González-Moralejo. 2012. Refrigeration logistics operations and perishable transport costs in groupage loads: an application for Spanish exports in Europe. Cien. Inv. Agr. 39(2): 265-278. In this paper, we analyze the current Spanish tariff system as applied by low-temperature distribution companies on transport in part loads of perishable freight that are destined to Spain’s main European export markets. Using 2008 data that have been directly obtained from a sample of transport companies, the price structure is formulated by making a distinction between ordinary and final prices and their respective variables. Next, the price structure is compared to the mean production costs. According to our calculations, we can state that the tariffs of distribution companies depend on the mean total cost, and they are estimated by using final prices calculated expressly for every customer. Finally, this paper outlines directions for future empirical work.
Key words: Discount, mean costs, perishable freight, prices, road transport.
Received June 22, 2011. Accepted October 28, 2011.Corresponding author: [email protected]
ciencia e investigación agraria266
cies), this work focuses on the most consolidated figure in recent years in the perishable food sector, the refrigeration logistics operators, which are companies specializing in a wide range of activi-ties related to logistics at controlled temperatures: transport services and transport management, supply chain management services, warehouse management services and information systems management, among others.
Concern for the cost analysis of international goods transport has driven the development of two main lines of research at the academic level. Transport costs have been included in the theory of international commerce, firstly, in traditional models based on comparative advantage (Samuel-son, 1952; Mundell, 1957) and, secondly, in models supporting international specialization with the existence of economies of scale (Deardorff, 1984; Helpman and Krugman, 1985). Suárez (2007) has demonstrated that the effects from these costs exhibit different guidelines; in either case the structure and the patterns of international pro-ductive specialization are conditioned. Secondly, there are other noteworthy and remarkable studies empirically contrasting the impact of transport costs on the growth of commerce flows (Sampson and Yeats, 1978; Rousslang and To, 1993; Baier and Bergstrand, 2001).
The economic literature, especially in Spain, is scarce and academically addresses the pricing principles in goods traffic. Within the perish-able food sector, the empirical contribution by Rebollo et al. is remarkable (2006) and analyzes the evolution of commercial margins in Spain for fresh food products, and Mir and Borrás (2008) estimate the distribution costs of fresh horticultural products. Transport costs are considered in both documents, but the composition or the influencing variables are not specified because the empirical analysis entails serious and practical difficulties. The most important works have focused on sec-tor regulation and cost function estimations. The contributions by Bayliss (1998) are especially remarkable; he has analyzed the causes and effects
of deregulation beginning in the early eighties for the entire European Union, as well as the evolution of the economic (market structure, externalities, transparency) and public policies (employment, industrial structure, regional diversity) applied to the sector and the ruling regulation since that time. Likewise, there are noteworthy empirical studies stating the need for price regulation (Hurley, 1995) or analyzing the economic implications for the European economy from the introduction of a special tax (ton-kilometer) on goods transport by road (Barker and Köhler, 2000). The works by Harmatuck (1991) laid the foundations for the estimation of cost functions (based on a translog cost model) for logistics operators, which are used to analyze the nature of economies of scale and the scope of goods transport services in the United States. In the case of Europe, Daughety et al. (1985) achieve similar results. In regard to economies of density, the works by Caves and Christensen (1988) and De Rus et al. (2003) are recommended.
The limitations and problems related to measur-ing transport costs and their pricing have been studied in the literature dedicated to the analysis of commerce flows; among the most recent stud-ies, Anderson and Van Wincoop (2004) analyzed the different elements shaping commerce costs, some related to goods transport. Fundamentally, two limitations are observed. First, the empiri-cal evidence on goods transport is limited by a lack of databases to enable the research, with some exceptions: the US Waterborne Database of the American Maritime Administration, the databases from PIERS Global Trade Intelligence and the International Transport Database BTI of CEPAL (United Nations). To mitigate this gap, the TRADE TRANS database is being developed in Spain with a new type of statistics nonexistent in Europe in either the academic area or specialized consulting. García and Pérez (2007) reviewed the methodology that is followed in the construction of TRADE TRANS, as well as the main biases and the problems inherent in its use. Second, most of the information required for the analysis
267VOLUME 39 Nº2 MAY - AUGUST 2012
of a pricing system, especially the quantitative information (prices, direct costs, indirect costs), is confidential; it is private and protected information that companies are reluctant to share.
In this context, and considering the current empirical ignorance on both domestic and inter-national logistic costs in Spain, the first aim of this work was to analyze how the pricing works for refrigeration logistics operators (RLOs) in the community transport of perishable freight in groupage loads from Spain. A model identifying the main components involved in the final cost of this type of transport can then be formulated. The second aim is to identify the importance attributed to the main components that determine the final prices charged by the transport (producer costs and discount) because there is accurate informa-tion available on production costs stemming from the RLO activity.
Materials and methods
The generation of primary information: case studies
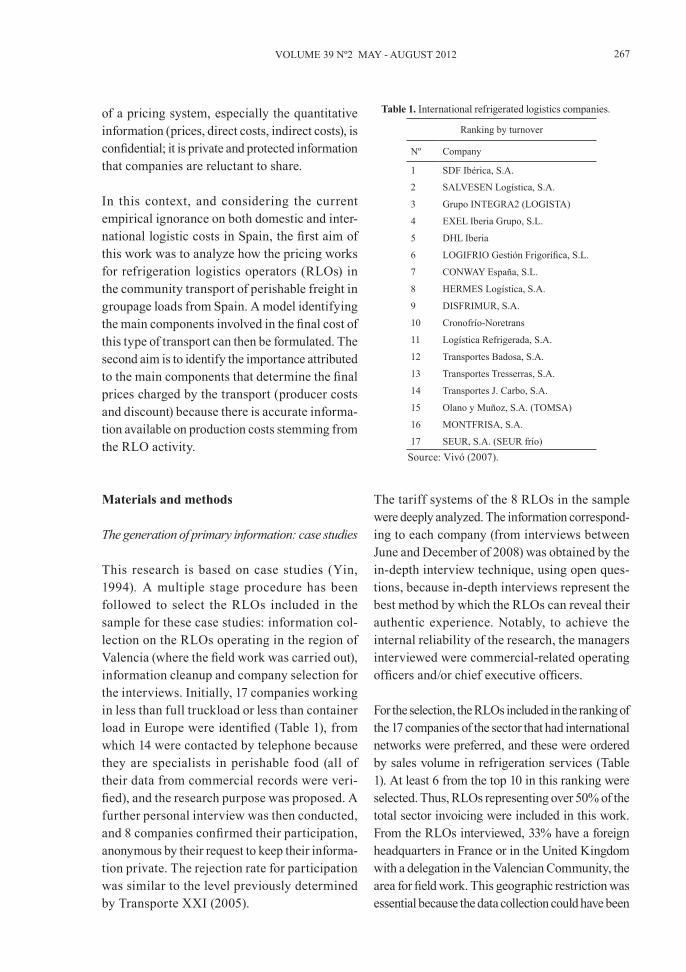
This research is based on case studies (Yin, 1994). A multiple stage procedure has been followed to select the RLOs included in the sample for these case studies: information col-lection on the RLOs operating in the region of Valencia (where the field work was carried out), information cleanup and company selection for the interviews. Initially, 17 companies working in less than full truckload or less than container load in Europe were identified (Table 1), from which 14 were contacted by telephone because they are specialists in perishable food (all of their data from commercial records were veri-fied), and the research purpose was proposed. A further personal interview was then conducted, and 8 companies confirmed their participation, anonymous by their request to keep their informa-tion private. The rejection rate for participation was similar to the level previously determined by Transporte XXI (2005).
Table 1. International refrigerated logistics companies.
Ranking by turnover
Nº Company
1 SDF Ibérica, S.A.
2 SALVESEN Logística, S.A.
3 Grupo INTEGRA2 (LOGISTA)
4 EXEL Iberia Grupo, S.L.
5 DHL Iberia
6 LOGIFRIO Gestión Frigorífica, S.L.
7 CONWAY España, S.L.
8 HERMES Logística, S.A.
9 DISFRIMUR, S.A.
10 Cronofrío-Noretrans
11 Logística Refrigerada, S.A.
12 Transportes Badosa, S.A.
13 Transportes Tresserras, S.A.
14 Transportes J. Carbo, S.A.
15 Olano y Muñoz, S.A. (TOMSA)
16 MONTFRISA, S.A.
17 SEUR, S.A. (SEUR frío)Source: Vivó (2007).
The tariff systems of the 8 RLOs in the sample were deeply analyzed. The information correspond-ing to each company (from interviews between June and December of 2008) was obtained by the in-depth interview technique, using open ques-tions, because in-depth interviews represent the best method by which the RLOs can reveal their authentic experience. Notably, to achieve the internal reliability of the research, the managers interviewed were commercial-related operating officers and/or chief executive officers.
For the selection, the RLOs included in the ranking of the 17 companies of the sector that had international networks were preferred, and these were ordered by sales volume in refrigeration services (Table 1). At least 6 from the top 10 in this ranking were selected. Thus, RLOs representing over 50% of the total sector invoicing were included in this work. From the RLOs interviewed, 33% have a foreign headquarters in France or in the United Kingdom with a delegation in the Valencian Community, the area for field work. This geographic restriction was essential because the data collection could have been
ciencia e investigación agraria268
greatly hindered. All of the RLOs interviewed also have operations in other Spanish regions.
A report created by IVEX (2007) on the foreign trade of the Valencian Community has been in-cluded to select destination markets. This report indicated that the main destination countries for perishable food exports from the Valencian Com-munity are within the European Union, specifically France, Germany, the United Kingdom, Italy and Portugal, which account for 65% of Spain’s total European exports.
Generation of primary information: recorded variables
The quantitative variables recorded were obtained from observations made at four different levels.
The first level corresponds to the general common price per pallet (TGOpallet) from each RLO. The first-level observations include a value per pallet according to the number of pallets and the route; thus, a TGOpallet is available for deliveries of 1 pal-let, 2/3 pallets, 4/6 pallets and 7/10 pallets from the main points of goods delivery (Madrid, Barcelona, Valencia, Sevilla and Bilbao) and are destined for the main localities in France, Germany, the United Kingdom, Italy and Portugal (62 destinations). There have been 1,240 first-level observations recorded for each of the 8 RLOs interviewed.
The second level corresponds to the final cost per pallet (PFpallet) offered to each customer. The second-level observations include a value per pallet according to the number of pallets and the destination; thus, PFpallet for deliveries of 1, 2/3, 4/6 and 7/10 pallets is available for each customer (128 customers) originating in the route from Valencia and destined for the main locali-ties of France, Germany, the United Kingdom, Italy and Portugal (62 destinations). There have been 248 second-level observations recorded for each of the 128 customers. It should be noted that some of the second-level observations might be
incomplete, depending on the specifications for each customer, due to the lack of the correspond-ing value per destination (not all of the customers export to all of the destinations included in this work) or even per number of pallets.
The third level corresponds to the mean cost of the producer per pallet (CMepallet) from each RLO. The third-level observations include a value per pallet according to the number of pallets and the route; thus, a CMepallet is available for deliver-ies of 1, 2/3, 4/6 and 7/10 pallets originating in the route in Valencia and destined for the main localities in France, Germany, the United King-dom, Italy and Portugal (62 destinations). There have been 248 third-level observations recorded for each of the 8 RLOs interviewed.
Finally, to allow for comparison with the final prices in the groupage loads, the fourth level corresponds to the price of a full truckload originating in the Valencia route and destined to the 10 geographic zones where they group together, according to the kilometer distance and the second-level observa-tions (as explained in the Results section). There were 10 third-level observations recorded for each RLO interviewed. All of the observations collected correspond to 2008, when the highest volume of information is available for services at controlled temperatures with palletized goods on Pallet EUR (0.80 x 1.20 m), with a maximum pallet height (1.80 m) and maximum weight (800 kg). All of the tariffs and prices are independent of whether the goods are refrigerated or frozen.
Design of the pricing model
The pricing system proposed in this work derives directly from the information extracted from the case studies (described in detail in the previous section) and the specific pricing procedure of the RLO, whose business reality is analyzed.
The RLO pricing system, more common in Eu-ropean refrigerated transport, is composed of a
269VOLUME 39 Nº2 MAY - AUGUST 2012
fundamental element called transport cost and an additional insurance cost. The first derives from the main service by the RLO; therefore, it is the most important invoice item, which justifies the transport costs existence. Additional insurance cost is an auxiliary cost that depends on the transport cost and is senseless without it. The transport cost is built in unitary terms from the general common tariff per pallet (TGOpallet), estimated according to the destination of the good, plus a discount per customer; it is then multiplied by the number of pallets. The TGOpallet is composed through an internal tariff gathering the structure of the direct and indirect costs of the RLO plus a commercial gross margin. The discount per customer is applied according to the production costs of the service and the com-mercial policies of the company, which include the following factors:
· Synergies with the destination point (the prob-ability that the vehicle carries new goods in the return trip)
· Degree of vehicle use or load factor (high or low)
· Possible business volume involved in the ser-vice hired and frequency (unique or periodical delivery)
· Importance of the customer requesting the service (on the total annual income of the RLO)
· Volume of the current total business of the RLO (need to sell).
Consequently, the unitary transport cost is, in most cases, personalized because it is estimated ad hoc for each customer as result of a negotia-tion where different factors converge: the country of destination, the moment of the year when the service is requested (in Spain, the perishable food sector is affected by a high degree of seasonal-ity) or the macroeconomic situation. Therefore, the unitary transport cost will take a different value for each customer and good delivery. This uniqueness illustrates the difficulties that require a deep knowledge of transport cost because there are numerous variables to consider in the
estimation whose unitary influence is not always observable (even for the RLOs, themselves). For the purpose of this work, the unitary transport cost corresponds to the final cost per pallet (PFpallet) for each transport service; this is the TGOpallet plus a discount (without multiplying by the number of pallets). The insurance is the last invoice item and is the amount paid by the customer because the RLO insures the goods during the transport trip. Therefore, the RLO will pay the customer an indemnity previously determined, at international level, if there is some damage, loss or delay during the service, accord-ing to article 23 of the Convenio de Transporte Internacional de Mercancías por Carretera (CMR Convention, Geneva, 1956, modified by the Pro-tocol of Geneva, 1978. This insurance is applied to any contract of goods transport by road made for valuable consideration in vehicles, provided that the place of the load take and the delivery place are located in different countries and at least one of the countries is a contracting party. Spain is a contracting party of that Convention). This indemnity can vary if there is an agreement between the parties stated in the contract. Due to the optional feature, the insurance is excluded from our empirical analysis.
As stated above, the TGOpallet is composed of an internal tariff plus a commercial gross margin. The internal tariff is disaggregated into four types of production costs different for each RLO: business cost, pick-up cost, haulage cost, and distribution cost. These cost items represent privileged information from each company that the RLOs have revealed exclusively for this research; therefore, we agreed not to reveal the monetary value of the items to competition. In this work, and following the notation used in Álvarez et al. (2007), the internal tariff is called the mean cost per pallet (CMepallet); this is the sum of the four components of the producer cost, described below. Although the quantitative information available is not public, the real CMepallet breakdown in the components indicated is used in the estima-tions of this work.
ciencia e investigación agraria270
The business cost derives from the structure of the direct and indirect costs. The direct costs refer to the exploitation of the articulated refrigeration vehicle in each route. Without publishing the real value, as promised, because of the strategic importance for the companies of the sample, the analysis developed by “Observatorio de Costos para el Transporte de Mercancías por Carretera” of the Ministerio de Fomento (2008) and updated on October 31, 2008, illustrates the structure of the mean direct costs generated for a goods transport company by the exploitation of an articulated refrigeration vehicle. This direct cost corresponds to the national mean obtained after weighting the costs from each province by the weight of the province in the goods transport by road. According to the cited Observatorio, the direct cost is estimated as 1.092 euros per run kilometer (1.376 dollars, May 23, 2012) or as 1.050 euros per run kilometer, in the case of 2-axle refrigeration trucks (1.323 dollars, May 23, 2012). The indirect management, staff, marketing costs, etc. are added to the direct cost supported by the RLO; these costs are sometimes difficult to quantify because there is no direct relationship with the transport volume made by the company. Therefore, the RLOs quantify the indirect costs as a percentage of the direct cost per run kilometer or as a sum percentage of the value of the other cost items (pick-up, haulage and distribution). The use of percentages in the direct cost per run kilometer is common in tariff estimation for full trucks (complete loads), while the application of a sum percentage of the value from the other cost items is common in the tariff estimation for groupage loads, which are addressed in this work.
The pick-up cost represents the cost of goods col-lected in the customer’s facilities. The distribution cost refers to the local distribution to the delivery point, also known as capillary distribution. Due to the strategic importance for the RLOs of the sample, the distribution costs are illustrated by the “Observatorio de Costos para el Transporte de Mercancías por Carretera” (Ministerio de Fomento, 2008), especially in the case of capil-
lary distribution, although the direct costs per pallet of the delivery truck communicated by the companies of the sample were used for the estimation pallet.
RLOs have predetermined routes with a point of origin and a point of destination. Therefore, the goods move from one logistics platform of a company to another until reaching their destination. In each platform, the goods are unloaded from the truck and grouped in another truck along with the goods from different ori-gins whose destination is also the destination platform. These stops cause the service to be more expensive; a handling cost is applied at each stop, which has an impact in the haulage cost. If there are no stops, no haulage fees are applied. If there are stops, one fixed amount is added to each haulage at an average value of 15.75 euros per pallet (19.85 dollars, May 23, 2012), which corresponds to the data from the RLO interviews, with a mean down load price of 14.50 euros per pallet (18.27 dollars, May 23 2012), and a mean load price of 1.25 euros per pallet (1.58 dollars, May 23, 2012).
The commercial gross margin (MC) applied by the RLO is valued as the sum percentage of the value of the previous cost items (business, pick-up, haulage and distribution costs). The algebraic expression collected from the TGOpallet estima-tion for each route is as follows:
TGOpallet = CMepallet + MCpallet [1]
TGOpallet = (Cpick-up + Chaulage + Cdistribution + Cbusiness) + MCpallet [2]
TGOpallet = m(C1 + C2 + C3 + 1.092 K3* n3-1+ p∑
i=1
3
Ci) [3]
TGOpallet = m(1.050 K1* n1-1 + C2 + 1.050 K2* n2
-1 + 1.092
K3 * n3-1
+ p∑i=1
3
Ci) [4]
where m = percentage applied by the commercial gross margin (m>1),
271VOLUME 39 Nº2 MAY - AUGUST 2012
C1 = pick-up cost or 1.050 K1 n1-1 (where K1 is the
number of kilometers of the collection route, and n1 is the capacity of the 2-axle refrigeration truck in number of pallets),
C2 = haulage cost (C2=0 without haulage),
C3 = distribution cost or 1.050 K2 n2-1 (where K2
is the number of kilometers in the distribution route, and n2 is the capacity of the distribution refrigeration truck in number of pallets), 1.092K3 n3
-1 is the direct cost of the company (K3 is the number of kilometers of the transport route, and n3 is the capacity of the articulated refrigeration truck in number of pallets), p = percentage applied by the indirect cost of the company (p<1).
If the discount is included in [4] (BNpallet), the PFpallet is the following:
PFpallet = TGOpallet ± BNpallet [5]
PFpallet = t[m(1.050 K1* n1-1 + C2 + 1.050 K2* n2
-1 + 1.092 K3*
n3-1
+ p∑i=1
3
Ci)] [6]
where t = percentage applied by discount (t<1 in case of discount).
Statistical treatment of data
According to the notation used by De Rus (1989), good transport service at a controlled temperature is a multiproduct activity because there are as many products as there are possible origins-destinations in the net; this number is increased by the number of pallets. The data provided by the RLO in regard to their inter-national pricing system provide the CMepallet and the TGOpallet of the RLO for each route and the PFpallet for each customer and route. In this work, the variables for estimation have been defined from the CMepallet and TGOpallet
for each route: the mean general ordinary tariff per pallet (TMGOpallet), the final mean price per pallet (PMFpallet) and the mean total cost per pallet (CTMepallet).
The model described below has been built to en-able the estimation [7]. The resulting TMGOpallet has been calculated by the TGOpallet average from the 8 RLOs, weighting each TGOpallet by the percentage that the annual invoicing of each RLO represents within the total invoicing. The TMGOpallet can be expressed by the following formula:
TMGOpallet = ∑i=1
8
(TGOipalé⋅Fi)
∑i=1
8
Fi
[7]
An automatic calculator of general mean tariffs has been built from [7] using Microsoft Office Excel 2007; the calculator allows for the immedi-ate estimation of the TMGOpallet for deliveries from the main points of goods expedition (Ma-drid, Barcelona, Valencia, Sevilla and Bilbao) and destined for the main localities in France, Germany, the United Kingdom, Italy and Portu-gal. The calculator has been elaborated to allow the user to apply any commercial margin to each internal tariff; thus, their potential is increased. A data base on mean costs per pallet and general tariffs per dynamic pallet is then available, which allows for multiple simulations.
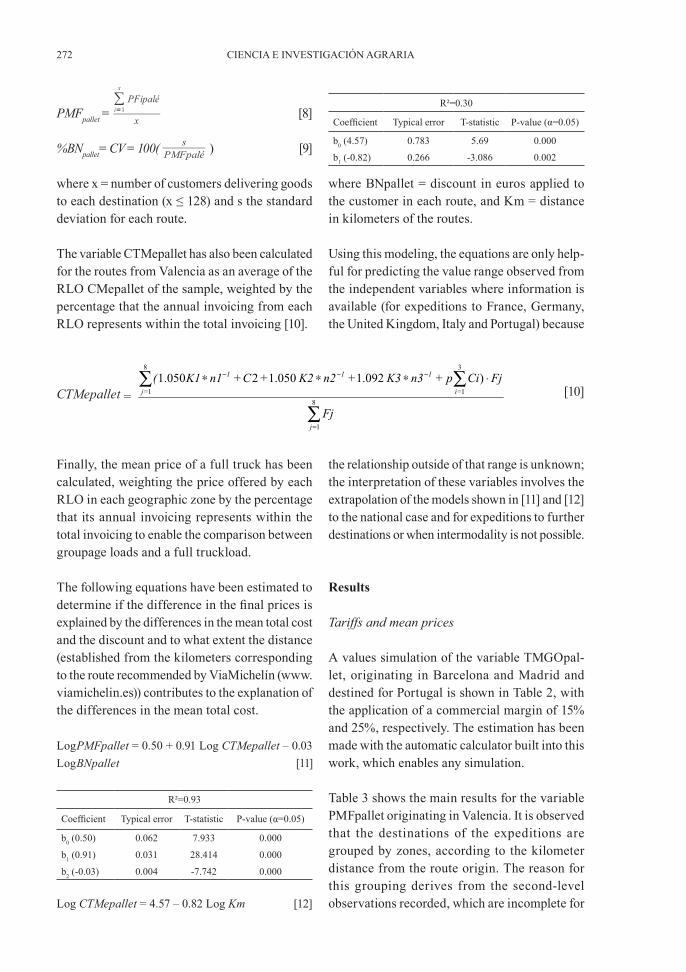
The available second-level PFpallet observa-tions, one per customer, were averaged out to obtain the PMFpallet for routes originating in Valencia. Additionally, the discount percent-age has been approximated from the standard deviation to determine and illustrate the per-centage of the mean discount applied by the RLO, including the arithmetic mean of the deviations in comparison to the PMFpallet, calculating the percentage that this standard deviation represents for the PMFpallet; this represents the coefficient of variation (which is insensible to the data magnitude):
ciencia e investigación agraria272
PMFpallet =∑i=1
x
PFipalé
x [8]
%BNpallet= CV = 100( sPMFpalé ) [9]
where x = number of customers delivering goods to each destination (x ≤ 128) and s the standard deviation for each route.
The variable CTMepallet has also been calculated for the routes from Valencia as an average of the RLO CMepallet of the sample, weighted by the percentage that the annual invoicing from each RLO represents within the total invoicing [10].
CTMepallet = [10]
Finally, the mean price of a full truck has been calculated, weighting the price offered by each RLO in each geographic zone by the percentage that its annual invoicing represents within the total invoicing to enable the comparison between groupage loads and a full truckload.
The following equations have been estimated to determine if the difference in the final prices is explained by the differences in the mean total cost and the discount and to what extent the distance (established from the kilometers corresponding to the route recommended by ViaMichelín (www.viamichelin.es)) contributes to the explanation of the differences in the mean total cost.
LogPMFpallet = 0.50 + 0.91 Log CTMepallet – 0.03LogBNpallet [11]
R²=0.93
Coefficient Typical error T-statistic P-value (α=0.05)
b0 (0.50) 0.062 7.933 0.000
b1 (0.91) 0.031 28.414 0.000
b2 (-0.03) 0.004 -7.742 0.000
Log CTMepallet = 4.57 – 0.82 Log Km [12]
R²=0.30
Coefficient Typical error T-statistic P-value (α=0.05)
b0 (4.57) 0.783 5.69 0.000
b1 (-0.82) 0.266 -3.086 0.002
where BNpallet = discount in euros applied to the customer in each route, and Km = distance in kilometers of the routes.
Using this modeling, the equations are only help-ful for predicting the value range observed from the independent variables where information is available (for expeditions to France, Germany, the United Kingdom, Italy and Portugal) because
the relationship outside of that range is unknown; the interpretation of these variables involves the extrapolation of the models shown in [11] and [12] to the national case and for expeditions to further destinations or when intermodality is not possible.
Results
Tariffs and mean prices
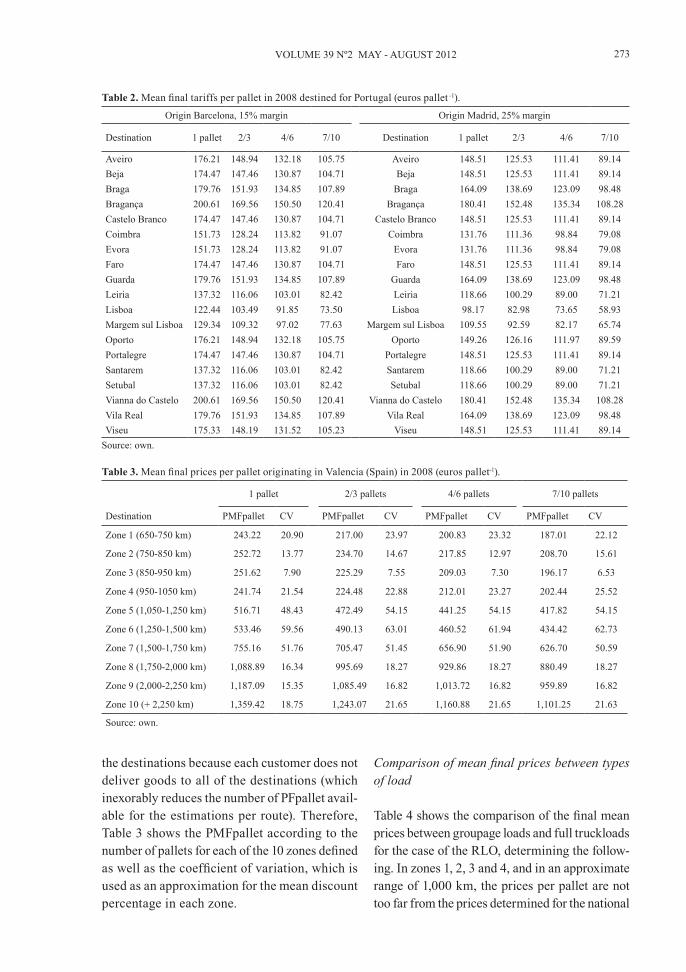
A values simulation of the variable TMGOpal-let, originating in Barcelona and Madrid and destined for Portugal is shown in Table 2, with the application of a commercial margin of 15% and 25%, respectively. The estimation has been made with the automatic calculator built into this work, which enables any simulation.
Table 3 shows the main results for the variable PMFpallet originating in Valencia. It is observed that the destinations of the expeditions are grouped by zones, according to the kilometer distance from the route origin. The reason for this grouping derives from the second-level observations recorded, which are incomplete for
273VOLUME 39 Nº2 MAY - AUGUST 2012
the destinations because each customer does not deliver goods to all of the destinations (which inexorably reduces the number of PFpallet avail-able for the estimations per route). Therefore, Table 3 shows the PMFpallet according to the number of pallets for each of the 10 zones defined as well as the coefficient of variation, which is used as an approximation for the mean discount percentage in each zone.
Comparison of mean final prices between types of load
Table 4 shows the comparison of the final mean prices between groupage loads and full truckloads for the case of the RLO, determining the follow-ing. In zones 1, 2, 3 and 4, and in an approximate range of 1,000 km, the prices per pallet are not too far from the prices determined for the national
Table 2. Mean final tariffs per pallet in 2008 destined for Portugal (euros pallet -1).
Origin Barcelona, 15% margin Origin Madrid, 25% margin
Destination 1 pallet 2/3 4/6 7/10 Destination 1 pallet 2/3 4/6 7/10
Aveiro 176.21 148.94 132.18 105.75 Aveiro 148.51 125.53 111.41 89.14Beja 174.47 147.46 130.87 104.71 Beja 148.51 125.53 111.41 89.14Braga 179.76 151.93 134.85 107.89 Braga 164.09 138.69 123.09 98.48Bragança 200.61 169.56 150.50 120.41 Bragança 180.41 152.48 135.34 108.28Castelo Branco 174.47 147.46 130.87 104.71 Castelo Branco 148.51 125.53 111.41 89.14Coimbra 151.73 128.24 113.82 91.07 Coimbra 131.76 111.36 98.84 79.08Evora 151.73 128.24 113.82 91.07 Evora 131.76 111.36 98.84 79.08Faro 174.47 147.46 130.87 104.71 Faro 148.51 125.53 111.41 89.14Guarda 179.76 151.93 134.85 107.89 Guarda 164.09 138.69 123.09 98.48Leiria 137.32 116.06 103.01 82.42 Leiria 118.66 100.29 89.00 71.21Lisboa 122.44 103.49 91.85 73.50 Lisboa 98.17 82.98 73.65 58.93Margem sul Lisboa 129.34 109.32 97.02 77.63 Margem sul Lisboa 109.55 92.59 82.17 65.74Oporto 176.21 148.94 132.18 105.75 Oporto 149.26 126.16 111.97 89.59Portalegre 174.47 147.46 130.87 104.71 Portalegre 148.51 125.53 111.41 89.14Santarem 137.32 116.06 103.01 82.42 Santarem 118.66 100.29 89.00 71.21Setubal 137.32 116.06 103.01 82.42 Setubal 118.66 100.29 89.00 71.21Vianna do Castelo 200.61 169.56 150.50 120.41 Vianna do Castelo 180.41 152.48 135.34 108.28Vila Real 179.76 151.93 134.85 107.89 Vila Real 164.09 138.69 123.09 98.48Viseu 175.33 148.19 131.52 105.23 Viseu 148.51 125.53 111.41 89.14
Source: own.
Table 3. Mean final prices per pallet originating in Valencia (Spain) in 2008 (euros pallet-1).
1 pallet 2/3 pallets 4/6 pallets 7/10 pallets
Destination PMFpallet CV PMFpallet CV PMFpallet CV PMFpallet CV
Zone 1 (650-750 km) 243.22 20.90 217.00 23.97 200.83 23.32 187.01 22.12
Zone 2 (750-850 km) 252.72 13.77 234.70 14.67 217.85 12.97 208.70 15.61
Zone 3 (850-950 km) 251.62 7.90 225.29 7.55 209.03 7.30 196.17 6.53
Zone 4 (950-1050 km) 241.74 21.54 224.48 22.88 212.01 23.27 202.44 25.52
Zone 5 (1,050-1,250 km) 516.71 48.43 472.49 54.15 441.25 54.15 417.82 54.15
Zone 6 (1,250-1,500 km) 533.46 59.56 490.13 63.01 460.52 61.94 434.42 62.73
Zone 7 (1,500-1,750 km) 755.16 51.76 705.47 51.45 656.90 51.90 626.70 50.59
Zone 8 (1,750-2,000 km) 1,088.89 16.34 995.69 18.27 929.86 18.27 880.49 18.27
Zone 9 (2,000-2,250 km) 1,187.09 15.35 1,085.49 16.82 1,013.72 16.82 959.89 16.82
Zone 10 (+ 2,250 km) 1,359.42 18.75 1,243.07 21.65 1,160.88 21.65 1,101.25 21.63
Source: own.
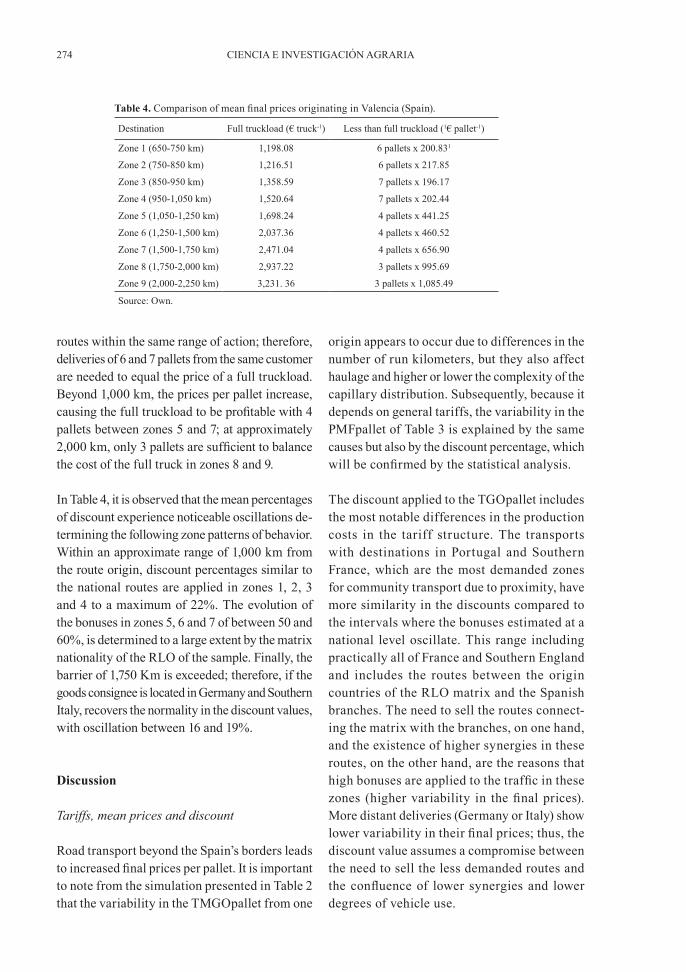
ciencia e investigación agraria274
routes within the same range of action; therefore, deliveries of 6 and 7 pallets from the same customer are needed to equal the price of a full truckload. Beyond 1,000 km, the prices per pallet increase, causing the full truckload to be profitable with 4 pallets between zones 5 and 7; at approximately 2,000 km, only 3 pallets are sufficient to balance the cost of the full truck in zones 8 and 9.
In Table 4, it is observed that the mean percentages of discount experience noticeable oscillations de-termining the following zone patterns of behavior. Within an approximate range of 1,000 km from the route origin, discount percentages similar to the national routes are applied in zones 1, 2, 3 and 4 to a maximum of 22%. The evolution of the bonuses in zones 5, 6 and 7 of between 50 and 60%, is determined to a large extent by the matrix nationality of the RLO of the sample. Finally, the barrier of 1,750 Km is exceeded; therefore, if the goods consignee is located in Germany and Southern Italy, recovers the normality in the discount values, with oscillation between 16 and 19%.
Discussion
Tariffs, mean prices and discount
Road transport beyond the Spain’s borders leads to increased final prices per pallet. It is important to note from the simulation presented in Table 2 that the variability in the TMGOpallet from one
origin appears to occur due to differences in the number of run kilometers, but they also affect haulage and higher or lower the complexity of the capillary distribution. Subsequently, because it depends on general tariffs, the variability in the PMFpallet of Table 3 is explained by the same causes but also by the discount percentage, which will be confirmed by the statistical analysis.
The discount applied to the TGOpallet includes the most notable differences in the production costs in the tariff structure. The transports with destinations in Portugal and Southern France, which are the most demanded zones for community transport due to proximity, have more similarity in the discounts compared to the intervals where the bonuses estimated at a national level oscillate. This range including practically all of France and Southern England and includes the routes between the origin countries of the RLO matrix and the Spanish branches. The need to sell the routes connect-ing the matrix with the branches, on one hand, and the existence of higher synergies in these routes, on the other hand, are the reasons that high bonuses are applied to the traffic in these zones (higher variability in the final prices). More distant deliveries (Germany or Italy) show lower variability in their final prices; thus, the discount value assumes a compromise between the need to sell the less demanded routes and the confluence of lower synergies and lower degrees of vehicle use.
Table 4. Comparison of mean final prices originating in Valencia (Spain).
Destination Full truckload (€ truck-1) Less than full truckload (1€ pallet-1)
Zone 1 (650-750 km) 1,198.08 6 pallets x 200.831
Zone 2 (750-850 km) 1,216.51 6 pallets x 217.85
Zone 3 (850-950 km) 1,358.59 7 pallets x 196.17
Zone 4 (950-1,050 km) 1,520.64 7 pallets x 202.44
Zone 5 (1,050-1,250 km) 1,698.24 4 pallets x 441.25
Zone 6 (1,250-1,500 km) 2,037.36 4 pallets x 460.52
Zone 7 (1,500-1,750 km) 2,471.04 4 pallets x 656.90
Zone 8 (1,750-2,000 km) 2,937.22 3 pallets x 995.69
Zone 9 (2,000-2,250 km) 3,231. 36 3 pallets x 1,085.49
Source: Own.
275VOLUME 39 Nº2 MAY - AUGUST 2012
The mean final prices and their components
The results obtained from the model, whose equa-tions are presented in the Materials and Methods section, support some hypotheses in regard to the pricing of the community traffic of perishable freight by the RLO. Economic theory suggests a causal relationship between the PMFpallet and the CTMepallet and the results of the present study appear to support this theory. Therefore, when the time comes to explain the variability of the final prices, our logarithmic model explains 93% (R2=0.93) of the final price. As observed in the model, the impact of the CTMepallet on the differences in the final prices significantly exceeds the effect from the discount on the final cost. This result suggests that the final prices charged by the RLO are an effect of the CTMe-pallet instead of the commercial policies of the company or even other factors such as the price applied by competitors. In other words, the RLO are applying tariffs according to the total mean cost. The elasticity of final prices has a value of 0.91 in comparison to the mean cost per pallet, while the elasticity is -0.03 in comparison to the discount per pallet.
The concise percentage variability of the CTMe-pallet explained in the second logarithmic model (R2=0.3), which offers a better fit than the linear or the quadratic models, suggests that the mean costs are not dependent only on the distance but are also, and even to a larger extent, dependent on the existence of haulage and difficult capillary distribution. Therefore, the model shows a haulage accumulation or a complicated capillary distribution causing the corresponding cost items (haulage and distribution cost) to exceed the kilometer cost in value (collected in the business cost). Therefore, the relevance of each cost component within the CTMepallet weighting the weight of the business, pick up, haulage and distribution costs has been analyzed in depth; thus, it was determined that the item affecting the CTMepallet the most is the distribution cost, representing over 60% within the total cost, followed by the haulage cost, which
exceeds the business cost in significance as soon as two or more haulage events accumulate; thus, the haulage cost can assume 15% (1 haulage) to 20%, percentages at which the representative-ness of the business cost also evolves, while the pick-up cost does not reach 5%.
Another outstanding aspect from the model is that the elasticity of the mean costs per pallet in relation to the movement distance is -0.82, which might indicate that the CTMepallet reduces with the distance. This fact is not unusual because a farther destination with less haulage or easier local distribution will accumulate a lower CTMepallet. Additionally, the way that an RLO works from predetermined routes hides the real distance run by the goods, which can sometimes be longer than the distance considered in this article (recom-mended route origin-destination).
The results obtained in the estimation of the CTMepallet and the function of mean costs per pallet, although implicitly, sustain the hypothesis of existing economies of density in the provision of refrigeration transport by the RLO, which means that the mean cost for transporting a pallet decreases with the number of pallets transported. Therefore, it is possible to know how the mean cost per pallet behaves in the presence of varia-tions in the total flow of pallets transported by delivery: the empirical evidence provided by this work shows that the increase of 1 additional pallet in the number of pallets included in the delivery reduces the mean cost per pallet, on average, by 4%. The presence of economies of density is very important because when price policies are negotiated, these economies will affect the final prices per pallet, according to the number of pal-lets, which is illustrated in Table 3.
Final considerations
This work covers price formation in community goods transport in groupage loads, which is not always addressed in the literature of Transport
ciencia e investigación agraria276
Economy, emphasizing the case of perishable products and the RLO. This paper analyzes the most important components for determining the prices to be used and the value reached by each component, integrating the final cost and illustrating how it is related to the production cost derived from the activity.
In general, road transport abroad leads to an increase in the final prices per pallet. This fact justifies the limited number of second-level ob-servations, especially when studies at a national level are examined (Andrés and Compés, 2009). The limited number of second-level observations is explained by the existence of full loads as an alternative form of transport that is offered not only by RLOs but also by autonomous agents and other transport agencies.
The generalized pricing system uses final prices, calculated specifically for each customer, due to the varied intensity of demand during the year and routes with noticeable differences in the pro-duction costs. Thus, the discount applied to the TGOpallet includes the most notable differences in the production costs in the tariff structure, hindering the discriminatory component of the unique general tariff per route.
The estimations obtained in this work, reinforced by the constants used, support the hypothesis that the RLOs are applying tariffs according to the total mean cost, not according to the competition or the market.
Some fundamental issues for the strategy of a freight company using an RLO are derived from the implications from these results for the busi-ness practice highlighted below.
The PFpallet offered by the RLO is high, their estimation lack a certain complexity and are very variable. Two sources of variability have been characterized. On the one hand, the TGOpallet used as a reference to obtain the final prices is based on the structure of the direct and indirect
costs of RLO exploitation. Therefore, it will take a different value depending on the RLO. On the other hand, the TGOpallet where a discount is applied basically depends on the structural net of the RLO (explaining the existence of synergies and the degree of vehicle use for each route) but also on their commercial policy; consequently, the PFpallet will change not only according to the RLO considered but also for the same RLO, according to the season of the year when the service is contracted.
The previous evidence favors strongly competitive industries, such as food product manufacturers that minimize their production costs. These manufacturers will have a chance to achieve a substantial reduction of their transport costs if they consider the convenience of working with two or more RLO as suppliers (especially with different origins for their matrix) and consider not only the price of groupage loads but also the full truckload for each of them. Therefore, in an expedition to England, Germany or Italy, the less-than-full truckload appears unjustified and a full truckload appears reasonable, due to its more competitive price.
The identification of the items with a greater effect on the mean cost per pallet involves an added value for the RLO, which can be used in their analysis for improvement, while other items will present lower performance margins.
The present work allows the future lines of research to be outlined to foster the results obtained. There is a wide range in the invoicing volumes from both the RLO and the loading companies (large, medium, and small companies), as well as in the related subcontracting agreements (formal long term contracts, “letters of collaboration”, verbal agreements, strategic alliances, etc.), which allow a case segmentation to analyze different behaviors depending on these variables. Thus, it would be interesting to know the price policy of large and small RLOs with large, medium, and small loading companies and with formal or informal long-term
277VOLUME 39 Nº2 MAY - AUGUST 2012
contracts. Likewise, it would also increase time-liness to know which pick-up, haulage, business and distribution costs per pallet are generated by a large RLO, versus a small or medium RLO, dis-criminating for the possible differences between the items where these differences exist. Another improvement to deepen the understanding devel-oped in this paper would be a comparison of the
production costs among different types of road transport, with a further quantification of their impact on the differences in the final prices.
Acknowledgements
Classified as JEL: L92, R41.
Resumen
S. Andrés González-Moralejo. 2012. Operadores logísticos de frío y coste del transporte de perecederos en carga fraccionada: aplicación a las exportaciones españolas realizadas al continente europeo. Cien. Inv. Agr. 39(2): 265-278. En este trabajo se analiza el sistema de tarificación aplicado en España por los operadores logísticos de frío, en el transporte de alimentos perecederos en carga fraccionada con destino a los principales mercados europeos de exportación. Utilizando datos para el año 2008, obtenidos directamente de una muestra de empresas porteadoras, se formula la estructura de precios, diferenciando entre tarifas ordinarias y precios finales y las variables que los integran, y se compara con los costes medios de producción derivados de la actividad. A partir de las ecuaciones estimadas se constata que los operadores están tarificando según el coste total medio, empleando precios finales que calculan expresamente para cada cliente. Por último, se subrayan las directrices para futuras investigaciones.
Palabras clave: Bonificación, coste medio, mercancías perecederas, precios, transporte por carretera.
References
Álvarez, O., P. Cantos, and R. Pereira. 2007. Precios óptimos en el transporte interurbano por carret-era. Revista de Economía Aplicada 45: 155-182.
Anderson, J.E., and E. Van Wincoop. 2004. Gravity with gravitas: a solution to the border puzzle. American Economic Review 93: 170-192.
Andrés, S., and R. Compés. 2009. Problemas con-tractuales y acuerdos de subcontratación: el caso de la logística frigorífica en la industria alimen-taria valenciana. Estudios de Economía Aplicada 27: 279-309.
Baier, S.L., and J.H. Bergstrand. 2001. The growth of world trade: tariffs, transport costs and income sim-ilarity. Journal of International Economics 53: 1-27.
Barker, T., and J. Köhler. 2000. Changing for road freight in the EU. Economic implications of a
weigh-inmotion tax. Journal of Transport Eco-nomics and Policy 34: 311-332.
Bayliss, B. 1998. Regulation in the road freight transport sector. Journal of Transport Economics and Policy 23: 113-131.
Blauwens, G., P. De Baere, and E. Van der Voorde. 2007. Transport Economics. Edit. Uitgeverij De Boeck. Antwerpen, Bélgica. 494 pp.
Caves, D.W., and L.R. Christensen. 1988. The im-portant of economies of scale, capacity utiliza-tion, and density in explaining interindustry dif-ferences in productivity growth. The Logistic and Transportation Review 24: 3-32.
Daughety, A.F., F.D. Nelson, and W.R. Vigdor. 1985. An econometric analysis of the cost and production structure of the trucking industry. In: Daughety, A.F. (ed.). Analitical Studies in Transport Economics. Cambridge, Cambridge University Press. 416 pp.
ciencia e investigación agraria278
Deardorff, A.V. 1984. An exposition and exploration of Krueger´s Trade Model. Canadian Journal of Economics 17: 731-746.
De Rus, G. 1989. Análisis del Mercado de servicios de transporte público en España: costes, deman-da, precios y nivel de calidad. Investigaciones Económicas 15: 229-247.
De Rus, G., J. Campos, and G. Nombela. 2003. Economía del Transporte. Edit. Antoni Bosch. Barcelona, España. 447 pp.
García, L., and E.M. Pérez. 2007. Fundamentos metodológicos de la base de datos TRADE-TRANS para el análisis de costes de transporte en España. Información Comercial Española 834: 61-78.
Harmatuck, D.J. 1991. Economies of scale and scope in the motor carrier industry. Journal of Transport Economics and Policy 25: 135-151.
Helpman, E., and P.R. Krugman. 1985. Market struc-ture and foreign trade. Edit. MIT Press, Cam-bridge, Massachestts, USA: 271 pp.
Hurley, W. 1995. Is it necessary to regulate prices in freight transport markets?. Journal of Transport Economics and Policy 29: 169-178.
IVEX. 2007. Comercio exterior agroalimentario de la Comunidad Valenciana. Edit. Generalitat Va-lenciana, julio. Valencia, España. 45 pp.
Ministerio de Fomento. 2008. Observatorio de Costes para el Transporte de Mercancías por Carretera. Informe realizado por la Secretaría de Estado de Transportes, octubre. Madrid, España. 60 pp.
Mir, J., and F. Borrás. 2008. Los costes de la cadena de distribución de productos hortícolas en fresco. Distribución y Consumo 98: 55-63.
Mundell, R.A. 1957. A geometry of transport costs in international trade theory. Canadian Journal of Economics and Political Sciencie, August, p. 331-348.
Plá, J., and F. León. 2004. Dirección de Empresas Internacionales. Editado por Pearson Educación. Madrid, España. 357 pp.
Quinet, E., and R. Vickerman. 2004. Principles of Transport Economics. Edit. Edward Elgar Pub-lications. Paris, Francia. 385 pp.
Rebollo, A., J. Romero, and M.J. Yagüe. 2006. El coste de la comercialización de los productos de alimentación en fresco. Distribución y Consumo 85: 31-51.
Rousslang, D.J., and T. To. 1993. Domestic trade and transportation costs as barriers to interna-tional trade. Canadian Journal of Economics 26: 208-221.
Sampson, G.P., and A.J. Yeats. 1978. The incidence of transport costs on exports from the United Kingdom. Journal of Transport Economics and Policy 12: 196-201.
Samuelson, P.A. 1952. The transfer problem and transport costs: the terms of trade when im-pediments are absent. The Economic Journal 62:278-304.
Suárez, C. 2007. Los costes del transporte en la teo-ría del transporte internacional. Modelos y aplica-ciones. Información Comercial Española 834: 7-22.
Transporte XXI. 2005. Libro Blanco de los Opera-dores Logísticos en España. Transeditores S.A. (Grupo XXI). Periódico del transporte y la logís-tica en España. Vizcaya, España. 168 pp.
Tugores, J. 2006. Economía Internacional: Globali-zación e Integración Regional. Edit. McGraw-Hill. Barcelona, España. 244 pp.
Vivó, D. 2007. Informe sectorial: logística del frío. Infopack 126: 8-20.
Yin, R.K. 1994. Case Study Research. Edit. Sage Publications. California, USA: 219 pp.