Embed Size (px)
Citation preview
I
I
Refrigeration Control in International Transport and Distribution
MSQS.009 Final Report December 1997
Meat Research Corporation
I
I I
I I.
A report of research conducted November 1996-December 1997 by
Powell International Technologies Pty Ltd Brisbane, Australia
This research project was funded by the
Meat Research Corporation PO BoxA498
Sydney South, NSW 2000 Phone (02)9380 0666 Fax (02)9380 0699
TABLE OF CONTENTS
LIST OF ACRONYMS 2
ABSTRACT 3
EXECUTIVE SUMMARY 4
International Shipping 4 Oceanic shipments to Japan and the USA 4 Domestic distribution in Japan 7 Domestic distribution in USA 8
I Conclusions 9 I
i • Recommendations 9
1. INTRODUCTION 11 , .. 1.1 Nature of Australia's Export Business with Meat I 11 •. 1.2 Distribution system from Australia exporter to Japanese end-user 13 1.3 Distribution system from Australia exporter to American end-user 14
2. METHODOLOGY 16 2.1 Types of loggers, manufacturers and specifications 16 2.2 Organisation of trials and other activities: 16 2.3 Export Trials to Japan and USA 17 2.4 Domestic trials within Japan and USA. 18 2.5 Static Trials with 20 foot Containers 19 2.5 Use of the loggers 20
3. RESULTS AND DISCUSSION 21 3.1 Prior work in the area 21 3.2.1 Shipment of chilled products to Japan 21 3.2.2 Power supply to containers 25 3.2.3 Seals to the Doors of Containers 29
I 3.2.4 Container's specifications 31 I.
3.3 Domestic Distribution within Japan 32 3.4 Shipment of Frozen Meat to the USA 38
i 3.5 Transport of Frozen meat within USA · 40
! 3.5.1 Amount of Snow used in snow shooting 48 3.6 Static Trials with Individual Shipping Companies 49 3.7 Other Issues 50 3.7.1 Container Age Profile Survey 51 3.7.2 Blue Star Line: 51 3.7.3 Five Star Shipping (COSCO) 52 3.7.4 Columbus Line 52 3.7.5 Maersk Line 52 3.7.6 ANZDL 52 3.8 AQIS Plant Data 52 3.9 AUTHOR'S NOTE: 53
Meat Research Corporation
' !·· '
I
I
I
! '
4.
5.
6.
7.
CONCLUSIONS 55
4.1 From Australia to Japan 54 4.2 Japanese Distribution System 54 4.3 From Australia to USA 55 4.4 American Distribution System 55
RECOMMENDATIONS 56
EXTENSION ACTIVITIES 57 6.1 Containers from Australia to Japan 57 6.2 Domestic Distribution within Japan 57 6.3 Containers from Australia to USA 57 6.4 Domestic Distribution within the USA 57
REFERENCES 58
Meat Research Corporation
TABLE OF GRAPHS
GRAPH 1: AIR TEMPERATURES IN CONTAINER TRIU 1047334, POSITIONS 2 & 5, Set Point is -1°C 25
GRAPH 2: SUSPECTED PERIODS OFF POWER WHILE AT SEA, AIR TEMPERATURES IN CONTAINER GCEA 3212478 POSITION2 26
GRAPH3: BLOW-UP OF SUSPECTED PERIODS OFF POWER WHILE AT SEA AIR TEMPERATURES IN CONTAINER GCEA3212478 26
! .. GRAPH4: AIR TEMPERATURES IN CONTAINER NYKU 7600881 27 ,.,...
GRAPH 5: BLOW-UP OF SUSPECTED PERIOD FOR CONTAINER NYKU 7600881 OFF POWER AT JAPANESE TERMINAL 28
GRAPH 6: MEAT TEMPERATURES IN CONTAINER NYKU 7600881 AT POSITION 2 - FROM BRISBANE TO OSAKA 28
GRAPH?: AIR TEMPERATURES IN CONTAINER TRIU 655 2606, POSITIONS 1, 2 & 5 30
GRAPH 8: MEAT SURFACE TEMPERATURES IN CONTAINER TRIU 655 2606 AT POSITION 2 - BRISBANE TO YOKOHAMA, 25 SEPTEMBER TO 10 OCTOBER 31
GRAPHS: MEAT SURFACE TEMPERATURES IN CONTAINER TRIU 655 2606 IN POSITION 5 - BRISBANE TO YOKOHAMA, 25 SEPTEMBER TO 10 OCTOBER 31
GRAPH 10: FROM THE CENTRAL COLDSTORE IN CARTON OF CHILLED MEAT OSAKA TO MIYASAKI, KYUSHU 33
GRAPH 11: CARTON OF CHILLED MEAT FROM THE CENTRAL COLDSTORE IN OSAKA TO BUTCHER SHOP IN FUKUOKA, KYUSHU 34
1·· GRAPH 12: CARTON OF CHILLED MEAT FROM THE CENTRAL COLDSTORE ' IN OSAKA TO DISTRIBUTION CENTRE, SHIGA PREF. 35 '
GRAPH 13: CARTON OF CHILLED MEAT FROM THE CENTRAL COLDSTORE IN OSAKA TO BUTCHER SHOP, HIROSHIMA 35
GRAPH 14: CARTON OF CHILLED MEAT FROM THE CENTRAL COLDSTORE IN TOKYO TO BUTCHER SHOP IN SANNONE, AOMARI PREF. 36
GRAPH 15: BLOW-UP OF GRAPH 14, AREA BETWEEN POINTS 2 & 3, SANNONE COLDSTORE IN SANNONE, AOMARI PREF. 36
GRAPH 16: CARTON OF CHILLED MEAT FROM THE CENTRAL COLDSTORE ! IN OSAKA TO A BUTCHER SHOP IN KITAKYUSHU, KYUSHU 37
Meat Research Corporation
TABLE OF TABLES
TABLE 1 - BEEF IMPORTS TO USA BY COUNTRY OF ORIGIN 12
TABLE 2 - BEEF IMPORTS TO JAPAN BY COUNTRY OF ORIGIN 12
TABLE 3: NUMBER AND DESTINATIONS OF CONTAINERS* WITH CHLLED MEAT FROM AUSTRALIA TO JAPAN & UK 22
TABLE 4: SUMMARY OF THE MAXIMUM AIR & MEAT TEMPERATURES WITHIN THE CONTAINERS TO JAPAN 22
Cont I TABLE 4: SUMMARY OF THE MAXIMUM AIR & MEAT TEMPERATURES*** I
WITHIN THE CONTAINERS TO JAPAN 23 i
TABLE 5: RANGE OF AIR TEMPERATURES RECORDED WITHIN
L CONTAINERS FROM EXPORTER TO CENTRAL COLDSTORES IN JAPAN 23
TABLE 6: RANGE OF MEAT TEMPERATURES RECORDED WITHIN CONTAINERS FROM EXPORTER TO CENTRAL COLDSTORES IN JAPAN 24
TABLE 7: AIR AND MEAT TEMPERATURES IN CONTAINER TRIU 655 2606, BRISBANE TO YOKOHAMA, 25 SEPTEMBER TO 10 OCTOBER 30
TABLE 8: NUMBER AND DESTINATIONS OF CONTAINERS* WITH FROZEN MEAT FROM AUSTRALIA TO USA 38
TABLE 9: CONTAINERS OF AUSTRALIAN FROZEN MEAT SNOW SHOT ON WEST COAST, TRANSLOADED TO EAST COAST, USA 41
TABLE 10: TRANSCONTINENTAL SHIPMENT OF CONTAINERS 42
I '
Meat Research Corporation
L_ __
!: .
r !
i I
ACOS AMC AMLC ANZDL AQIS CFR CIF CSIRO FSIS MAC NAP RO PTS RH RHS USA
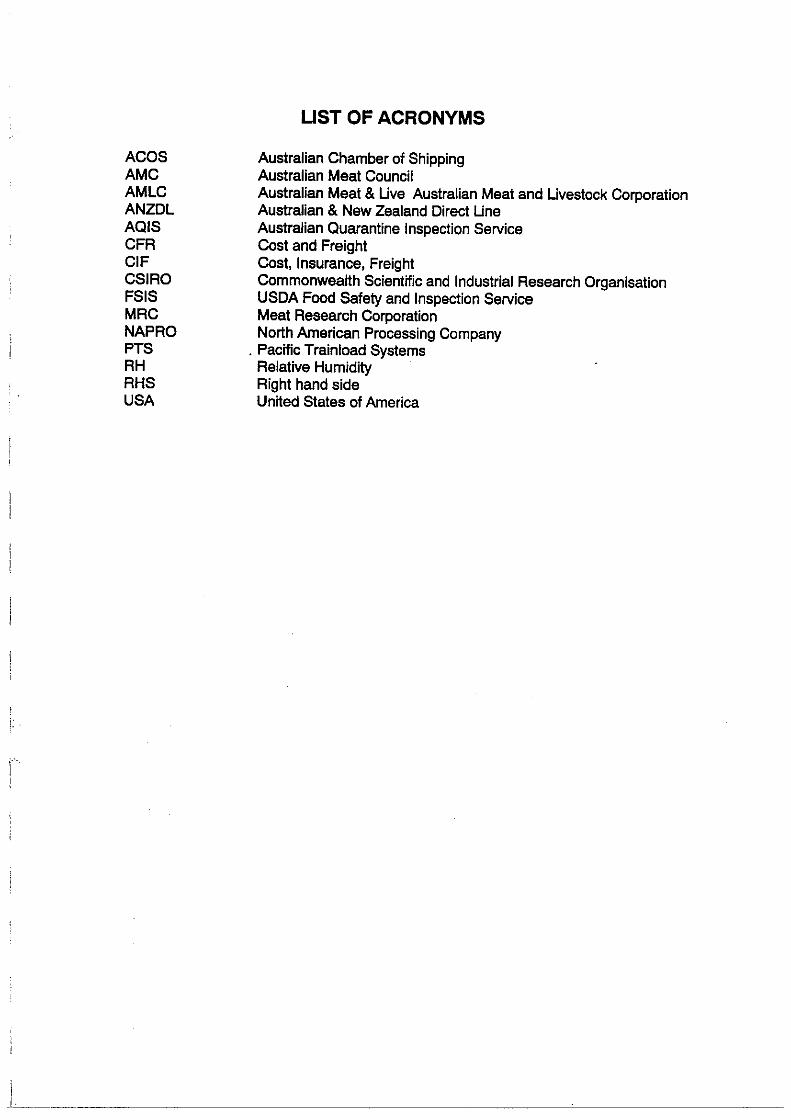
UST OF ACRONYMS
Australian Chamber of Shipping Australian Meat Council Australian Meat & Live Australian Meat and Livestock Corporation Australian & New Zealand Direct Line Australian Quarantine Inspection Service Cost and Freight Cost, Insurance, Freight Commonwealth Scientific and Industrial Research Organisation USDA Food Safety and Inspection Service Meat Research Corporation North American Processing Company
. Pacific Trainload Systems Relative Humidity Right hand side United States of America
r:.
I '
' (
ABSTRACT
An assessment of the refrigeration and handling practices for Australian chilled and frozen meats in international trade and its relationship to Food Safety was investigated.
36 Containers of chilled beef from Australia to Japan and 12 containers of frozen meats from Australia to the United States were investigated. Meat temperatures in the containers sent to Japan were always below 3°C and more than 97.5% of the time were below 1 •c. While there was a major problem with ingress/loss of warm/cold air with one of these containers, the meat temperatures were maintained at 1.2°c or less. Eleven of the 12 containers monitored to the States had air temperatures at -18°C or colder; one had an air temperature between -18°C and -14°C.
Within Japan during the summer of 1997, the domestic meat distribution lines were investigated on 32 occasions. It was regarded as one of the hottest summers in the last ten years. During distribution, the actual fluctuations in meat temperature from o•c were minimal, usually only a 2°c or 3°C. By far, the worst example of temperature abuse had a surface temperature above 5°C but below 9°C for 25 hr. There were two other examples of temperature abuse where the meat surface temperatures were (1), over 5°C for 1 o hr (at 1 o•c for 4.5 hr) and (2), above 5°C for 6 hr (at 9°C but below 1 o•c for 4.5 hr). Whilst this has negligible effect on Food Safety there will be an effect on weep and on the shelf-life of the meat in the vacuum pack and on the display-life of the resultant retail packs of meat.
Within the USA, 12 containers were successfully investigated within the domestic distribution system. These containers were snow shot at the West Coast Terminals and transported without mechanical refrigeration on trans-continental rail hauls to eastern destinations. The air temperatures in a snow shot container are usually held below -1 o•c for 1 O days, which is adequate time to deliver the product to customers. There were three exceptions. On one occasion the air temperature increased to -5°C after only two and a half days and to -2.3°C after five days from snow shooting. The air temperature within the other two containers at the time of unloading (six days from snow shooting) was between -5°C and -2°c.
No damage to cartons and no loss of product due to unsound condition were found.
On both shipping routes to Japan and the to West Coast of America and within their internal distribution channels there was no cause for concern by Australian Exporters with the Food Safety of Australian meats. However there is some concern about the temperature controVJntegrity of containers with the snow shooting operation in the USA.
A pre-delivery test for "air or gas tightness" or an alternative test to determine integrity of containers is strongly recommended.
Meat Research Corporation 3
'-----------~-------
! .·•
L.
I
I I
I
I
EXECUTIVE SUMMARY
The key program in Food Safety addressed the issue of food safety in all elements of the production chain from the producer through to the consumer. The overall objective of the program is to give consumers confidence in the safety of Australian meats and meat products and to provide all sectors of the industry with the infrastructure, solutions and support systems to ensure that consumption of Australian red meats is safe.
This project aimed to assess refrigeration and handling practices for Australian meat in international trade, and support implementation of improved practices
International Shipping The Australian Chamber of Shipping was quite helpful. Columbus and ANZDL Lines in particular offered much assistance and cooperation.
Because of procedural requirements the temperature history of the chilled and frozen cartonned meat exported to Japan and the USA was divided into two parts. Meat and air temperatures were logged in integral containers from Australia to the central cold stores in Japan. Only air temperatures in both porthole and integral containers were logged to the American terminals on both the West and East Coasts. Meat surface temperatures were logged from the central cold stores in Japan to end-users. Air temperatures were recorded within snow shot containers from the West Coast of the US to a range of destinations including Chicago lllinios, Fort Worth Texas, Philadelphia Pennsylvania, Newark Delaware, & Jacksonville Florida.
A porthole or clip-on container does not have an independent refrigeration unit. It has sealable top and bottom portholes in the front panel/wall. The centralised refrigeration units at the terminals or on-board the ship are clipped onto these portholes. An integral container has its own refrigeration unit built into the container.
Oceanic shipments to Japan and the USA The container trials to Japan commenced in mid-summer (February) in Australia, midwinter in Japan and the trials ran continuously until mid-Ociober. The air temperatures circulating within 36 containers were monitored from the Australian exporter to cold stores in Japan. There are 19 examples of containers departing Australia in mid-winter and arriving in Japan in mid-summer.
Meat Research Corporation 4
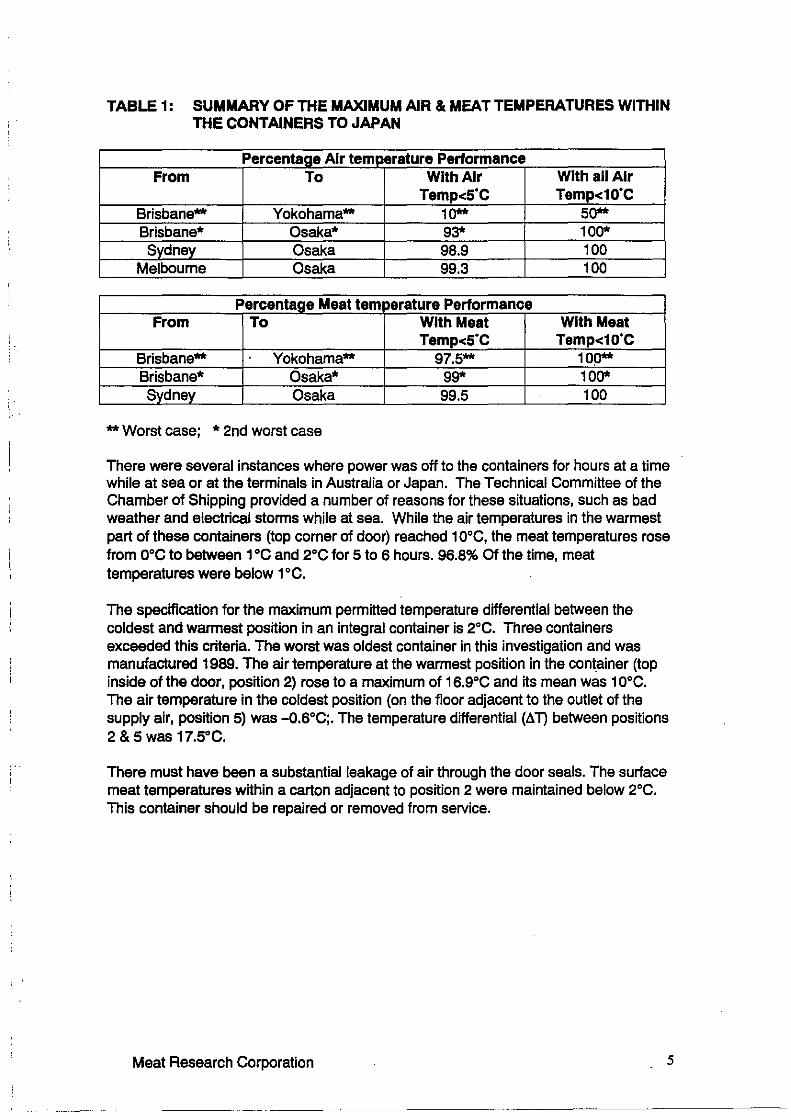
TABLE 1: SUMMARY OF THE MAXIMUM AIR & MEAT TEMPERATURES WITHIN THE CONTAINERS TO JAPAN
PercentaQe Air temoerature Performance From To With Air With all Air
Temp<S'C Temp<10'C Brisbane** Yokohama** 10** 50** Brisbane* Osaka* 93* 100* Sydney Osaka 98.9 100
Melbourne Osaka 99.3 100
PercentaQe Meat tern erature Performance From To With Meat With Meat
Temp<S'C Temp<10'C Brisbane** Yokohama** 97.5** 1 OIJ** Brisbane* Osaka* 99* 100* Sydney Osaka 99.5 100
**Worst case; * 2nd worst case
There were several instances where power was off to the containers for hours at a time while at sea or at the terminals in Australia or Japan. The Technical Committee of the Chamber of Shipping provided a number of reasons for these situations, such as bad weather and electrical storms while at sea. While the air temperatures in the warmest part of these containers (top corner of door) reached 1 o•c, the meat temperatures rose from o•c to between 1 •c and 2•c for 5 to 6 hours. 96.8% Of the time, meat temperatures were below 1 •c.
The specification for the maximum permitted temperature differential between the coldest and warmest position in an integral container is 2•c. Three containers exceeded this criteria. The worst was oldest container in this investigation and was manufactured 1989. The air temperature at the warmest position in the. container (top inside of the door, position 2) rose to a maximum of 16.9°C and its mean was 1 o•c. The air temperature in the coldest position (on the floor adjacent to the outlet of the supply air, position 5) was -0.s•c;. The temperature differential (AT) between positions 2 & 5 was 17.S"C.
There must have been a substantial leakage of air through the door seals. The surface meat temperatures within a carton adjacent to position 2 were maintained below 2•c. This container should be repaired or removed from service.
Meat Research Corporation 5
,. ', .
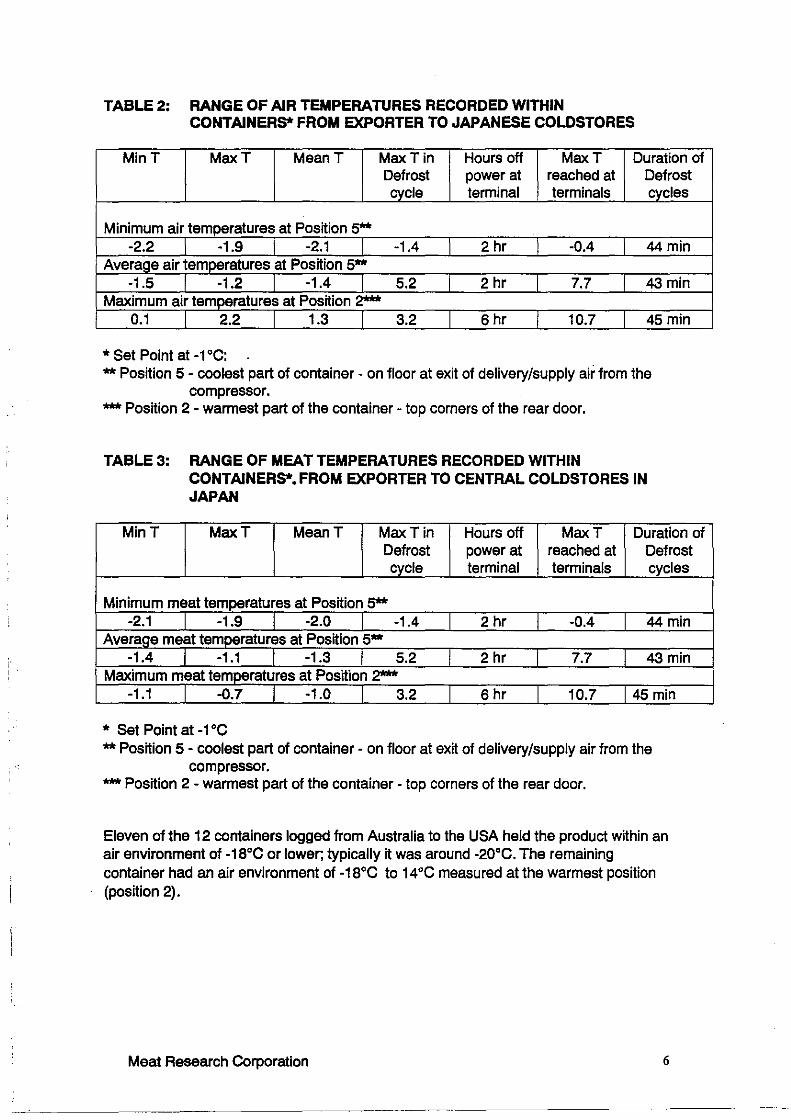
TABLE 2: RANGE OF AIR TEMPERATURES RECORDED WITHIN CONTAINERS* FROM EXPORTER TO JAPANESE COLDSTORES
MinT MaxT MeanT MaxTin Hours off MaxT Duration of Defrost power at reached at Defrost cycle terminal terminals cycles
Minimum air temperatures at Position 5** -2.2 -1.9 -2.1 -1.4 2 hr -0.4 44min
Average air temoeratures at Position 5** -1.5 -1.2 -1.4 5.2 2 hr 7.7 43min
Maximum air temoeratures at Position 2*** 0.1 2.2 1.3 3.2 6 hr 10.7 45min
* Set Point at -1 •c: ** Position 5 - coolest part of container - on floor at exit of delivery/supply air from the
compressor. ***Position 2 - warmest part of the container - top corners of the rear door.
TABLE 3: RANGE OF MEAT TEMPERATURES RECORDED WITHIN CONTAINERS*, FROM EXPORTER TO CENTRAL COLDSTORES IN JAPAN
MinT MaxT MeanT Max Tin Hours off MaxT Duration of Defrost power at reached at Defrost cycle terminal terminals cycles
Minimum meat temperatures at Position 5** -2.1 -1.9 -2.0 -1.4 2 hr -0.4 44min
Averaae meat temoeratures at Position 5** -1.4 -1.1 -1.3 5.2 2 hr 7.7 43min
Maximum meat temoeratures at Position 2*** -1.1 --0.7 -1.0 3.2 6 hr 10.7 45 min
* Set Point at -1 •c ** Position 5 - coolest part of container - on floor at exit of delivery/supply air from the
compressor. ***Position 2 - warmest part of the container - top corners of the rear door.
Eleven of the 12 containers logged from Australia to the USA held the product within an air environment of-18°C or lower; typically it was around -20°c. The remaining container had an air environment of -18°C to 14°C measured at the warmest position (position 2).
Meat Research Corporation 6
i-
I I
I
l I
I
I
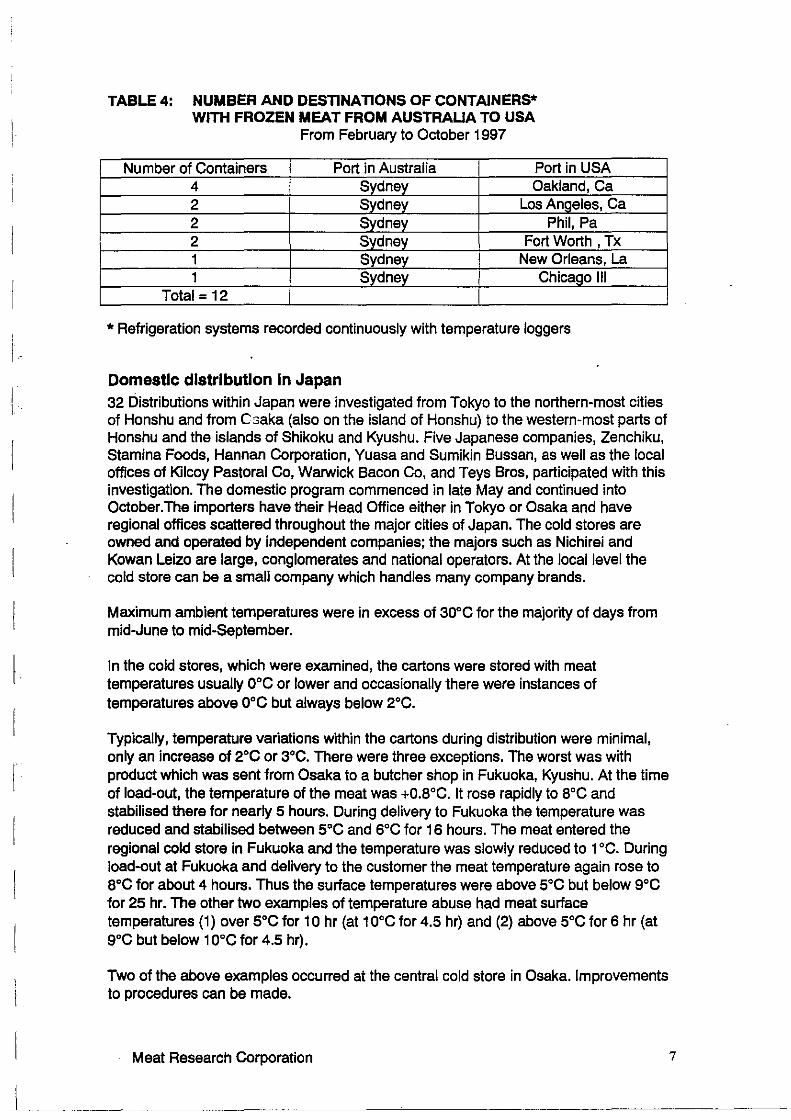
TABLE 4: NUMBER AND DESTINATIONS OF CONTAINERS* WITH FROZEN MEAT FROM AUSTRALIA TO USA
From February to October 1997
Number of Containers Port in Australia Port in USA 4 Sydney Oakland, Ca 2 Svdnev Los Angeles, Ca 2 Sydney Phil, Pa 2 Svdney Fort Worth , Tx 1 Sydney New Orleans, La 1 Svdnev Chicago Ill
Total=12
* Refrigeration systems recorded continuously with temperature loggers
Domestic distribution In Japan 32 Distributions within Japan were investigated from Tokyo to the northern-most cities of Honshu and from C saka (also on the island of Honshu) to the western-most parts of Honshu and the islands of Shikoku and Kyushu. Five Japanese companies, Zenchiku, Stamina Foods, Hannan Corporation, Yuasa and Sumikin Bussan, as well as the local offices of Kilcoy Pastoral Co, Warwick Bacon Co, and Teys Bros, participated with this investigation. The domestic program commenced in late May and continued into October.The importers have their Head Office either in Tokyo or Osaka and have regional offices scattered throughout the major cities of Japan. The cold stores are owned and operated by independent companies; the majors such as Nichirei and Kowan Leizo are large, conglomerates and national operators. At the local level the cold store can be a small company which handles many company brands.
Maximum ambient temperatures were in excess of 30°C for the majority of days from mid-June to mid-September.
In the cold stores, which were examined, the cartons were stored with meat temperatures usually 0°C or lower and occasionally there were instances of temperatures above 0°C but always below 2°c.
Typically, temperature variations within the cartons during distribution were minimal, only an increase of 2°C or 3°C. There were three exceptions. The worst was with product which was sent from Osaka to a butcher shop in Fukuoka, Kyushu. At the time of load-out, the temperature of the meat was +0.8°C. It rose rapidly to a0 c and stabilised there for nearly 5 hours. During delivery to Fukuoka the temperature was reduced and stabilised between 5°C and 6°C for 16 hours. The meat entered the regional cold store in Fukuoka and the temperature was slowly reduced to 1 °C. During load-out at Fukuoka and delivery to the customer the meat temperature again rose to 8°C for about 4 hours. Thus the surface temperatures were above 5°C but below 9°C for 25 hr. The other two examples of temperature abuse had meat surface temperatures (1) over 5°C for 1 O hr (at 10°C for 4.5 hr) and (2) above 5°C for 6 hr (at 9°C but below 10°C for 4.5 hr).
Two of the above examples occurred at the central cold store in Osaka. Improvements to procedures can be made.
Meat Research Corporation 7
_\------~-~--------
I
I ,.
i i
I
! I
Domestic distribution in USA
Columbus and ANZDL lines were most helpful. The nature of the USA trade is that they, or the cold stores which assist them, perform most of the hands-on functions in the distribution process.
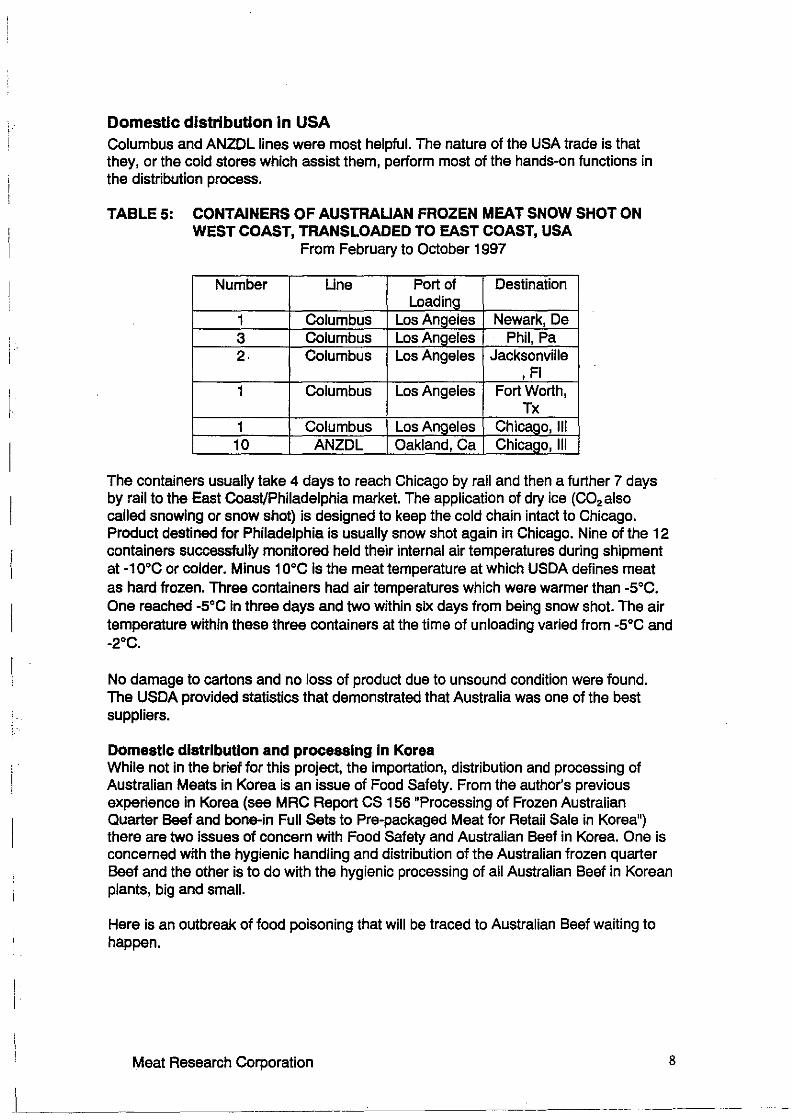
TABLE 5: CONTAINERS OF AUSTRALIAN FROZEN MEAT SNOW SHOT ON WEST COAST, TRANSLOADED TO EAST COAST, USA
From February to October 1997
Number Line Port of Destination Loadina
1 Columbus LosAnaeles Newark, De 3 Columbus Los Angeles Phil, Pa 2. Columbus Los Angeles Jacksonville
, Fl 1 Columbus Los Angeles Fort Worth,
Tx 1 Columbus LosAnaeles Chicaao, Ill 10 ANZDL Oakland, Ca Chicago, Ill
The containers usually take 4 days to reach Chicago by rail and then a further 7 days by rail to the East Coast/Philadelphia market. The application of dry ice (C02 also called snowing or snow shot) is designed to keep the cold chain intact to Chicago. Product destined for Philadelphia is usually snow shot again in Chicago. Nine of the 12 containers successfully monitored held their internal air temperatures during shipment at -1 o•c or colder. Minus 1 o•c is the meat temperature at which USDA defines meat as hard frozen. Three containers had air temperatures which were warmer than -5°C. One reached -5°C in three days and two within siX days from being snow shot. The air temperature within these three containers at the time of unloading varied from -5°C and -2°c.
No damage to cartons and no loss of product due to unsound condition were found. The USDA provided statistics that demonstrated that Australia was one of the best suppliers.
Domestic distribution and processing In Korea While not in the brief for this project, the importation, distribution and processing of Australian Meats in Korea is an issue of Food Safety. From the author's previous experience in Korea (see MAC Report CS 156 "Processing of Frozen Australian Quarter Beef and bone-in Full Sets to Pre-packaged Meat for Retail Sale in Korea") there are two issues of concern with Food Safety and Australian Beef in Korea. One is concerned with the hygienic handling and distribution of the Australian frozen quarter Beef and the other is to do with the hygienic processing of all Australian Beef in Korean plants, big and small.
Here is an outbreak of food poisoning that will be traced to Australian Beef waiting to happen.
Meat Research Corporation 8
i I
I I
Conclusions Thirty-five of the 36 integral containers logged from Australia to Japan performed well. There were some minor variations in performance. The container that performed poorly due to an ingress of warm air through the doors should be repaired or withdrawn from service. Even though this container had a serious leakage of air into it, the meat temperatures were always below 2°c.
Eleven of the 12 containers, both integral (1 only) and porthole (11), logged from Australia to the USA, had air temperatures colder than -20°C. Only one had air temperatures which rose to -14°C as its maximum (or hottest) temperature.
During distribution within Japan three cases of temperature abuse (out of the 32 investigated) are noteworthy. The first case had surface temperatures above 5°C but below 9°C for 25 hr. The two other cases had temperatures (1) over 5°C for. 1 O hr (at 10°C for 4.5 hr) and (2) over 5°C for 6 hr (at 9°C but below 10°C for 4.5 hr). Two of these three examples were subjected to poor practices at the cold store in Osaka.
T)le safety of Australian meats in Japan was not compromised but shelf life of the vacuum packs and display life of the resultant retail cuts would be reduced and weep increased.
Within the USA, 9 of the 12 containers held their air temperatures at -10°C or lower during distribution. Three containers were poor performers and require maintenance.
The introduction of an "air or gas tightness" test or an alternative test to the predelivery check-off of the containers should remove the above "problem" containers from service.
No evidence of "unsound meat" was obtained during these trials. In fact USDA stated that Australia was one of the best suppliers.
The domestic trials in Japan and in the US were limited in numbers and resources should be committed to build the bigger picture.
From the data obtained and from the point of view of food safety, it is difficult to support a series of international seminars to recommend better handling/distribution procedures.
Recommendations • From data obtained and with food safety as the primary focus, a series of
international seminars to recommend distribution procedures, etc, is not the preferred option,
• From this snapshot of temperatures within containers in the international chilled and frozen meat trade, awareness brochures including a short brochure on the USA cold chain incorporating the inland transfer of snow shot containers is suggested for exporters and for the ACOS,
• A short pamphlet or brochure translated into Japanese on the best practice for the distribution of chilled meat may be a useful information document,
Meat Research Corporation 9
;·· t
I. I
I I I
L I
! I.
I.
• At the container terminals both here in Australia but mainly in Japan, procedures should be implemented so that containers are connected to power as soon as possible,
• Work with individual Japanese companies to improve their domestic distribution and handling practices,
• The independently owned cold store in Osaka needs to be approached with the objective of improving their handling operations during the northern summer.
• Resolve the "problems" either with the quantity of snow or the quality of the containers used for transcontinental shipping. The preferred approach is to work with the ACOS to develop and introduce an "air or gas tightness" test or an alternative test to the pre-delivery check-off program tor containers to remove the "problem" containers from service,
• The Set Point on all integral containers to be packed with chilled meat should be pre-set to minus 1°C; the Set Point of containers with frozen beef should be set to -18°C or lower,
• Inspection of a container's Set Point must be a part of the exporter's QA program, • Exporters should check for any damage, 'especially the doors on the all containers,
integral and porthole, tor a tight seal. A check for worn rubber seals, buckled doors, etc, must be a part of the exporter's QA program,
• Do not pre-cool the container prior to loading, • Dry or wipe the water from the walls, the roof and the floor of the container before
loading commences, • Do not load cartons above the "red" load line, • When loaded containers are received at the Australian container terminal, terminal
personnel should have "Set Points" on their "check off" list of things to do, • If other researchers wish to target the reasons tor USDA rejections of Australian
frozen meats, then AQIS should be persuaded to be more cooperative and to make available for research purposes the confidential USDA data on specific works. Confidentiality Agreements are an everyday occurrence in industry and they should work here to guarantee security of the data.
• The 1997 summer trials in Japan should be implemented again in 1998 or in 1999 building on the experiences, contacts and procedures now established,
• In conjunction with the shipping lines, conduct more trials of the Columbus Reflex and ANZDL system in the 1998 or 1999 Northern Hemisphere summer.
• The potential Food Safety issue with Australian frozen Beef handled, distributed and processed in Korea should be investigated.
Meat Research Corporation 10
i _.
1. INTRODUCTION
The recently completed Meat Industry Strategic Plan highlighted food safety as a high priority area for the Australian meat industry. The Meat Research Corporation responded to the industry plan by outlining a program of 32 projects within the Microbial Food Safety Key program. The explicit industry goal is to have all enterprises from producer to retail, operate in accordance with accredited quality assurance (QA) systems based on HACCP principles by 1999. All the projects were to be finalised by 1999. The objective of the program is to provide all sectors of the red meat industry, from producers to consumers, "paddock to plate', with the infrastructure, solutions and support systems to ensure consumption of safe meat. The program vision is to give consumers confidence in the safety of Australian meat and meat products.
With the outbreak of BSE in the UK in early 1996, and the seemingly increasing outbreaks of illness due to E.coli organisms in many countries of the world, consumers are more conscious than ever when selecting foods for consumption.
This project is one of the 32 projects in the MAC Microbial Food Safety Key Program and aimed to assess refrigeration and handling practices for Australian meat in international trade, and support implementation of improved practices.
Specifically:
To study refrigeration and handling practices for Australian meat in international trade and identify areas of poor practice in overseas storage and distribution networks.
To develop awareness and training for importers and distributors in major export markets in regard to temperature control or cold chain maintenance.
To support the implementation of better handling of Australian product in our export markets.
1.1 Nature of Australia's Export Business with Meat For many years Australia has been the largest exporter of beef in the world. Most of our beef exports were frozen lean, manufacturing type meat and went to the United States. Here the lean meat is tempered to about -5°C, ground and blended with fat trimmed from grain-fed US beef to make sausages or hamburger patties.
Meat Research Corporation 11
!"
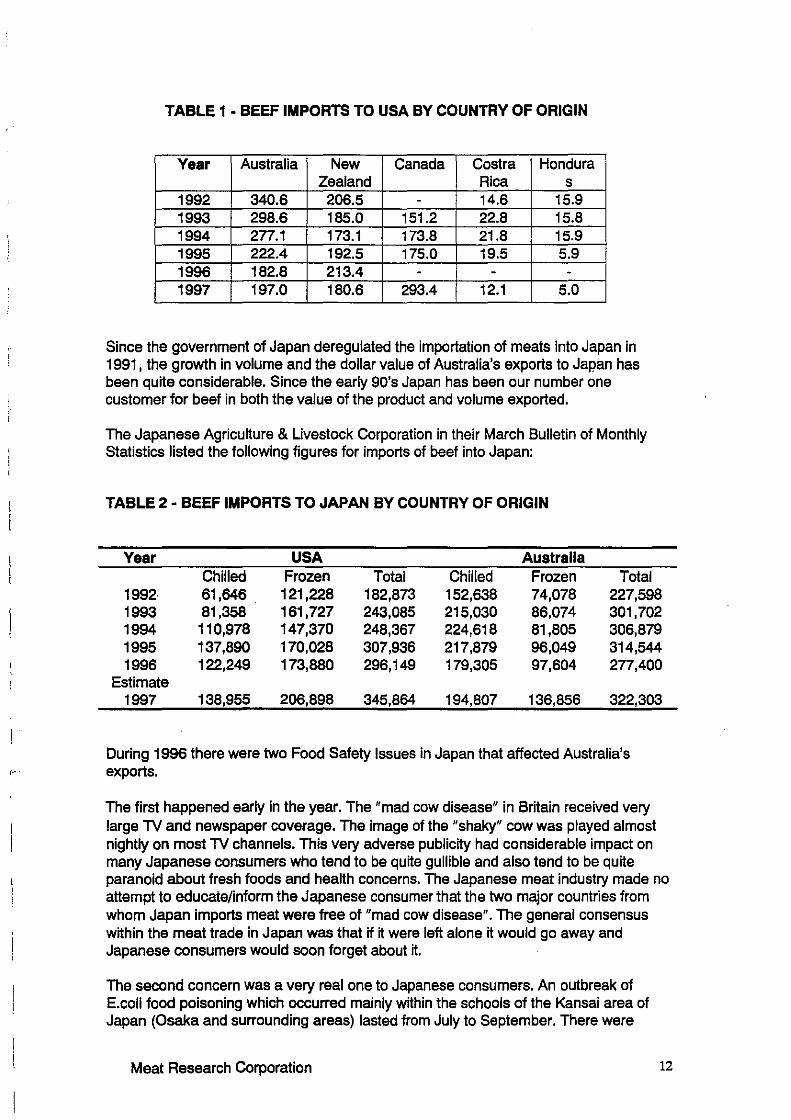
TABLE 1 • BEEF IMPORTS TO USA BY COUNTRY OF ORIGIN
Vear Australia New Canada Costra Hondura Zealand Rica s
1992 340.6 206.5 - 14.6 15.9 1993 298.6 185.0 151.2 22.8 15.8 1994 277.1 173.1 173.8 21.8 15.9 1995 222.4 192.5 175.0 19.5 5.9 1996 182.8 213.4 - - -1997 197.0 180.6 293.4 12.1 5.0
Since the government of Japan deregulated the importation of meats into Japan in 1991 , the growth in volume and the dollar value of Australia's exports to Japan has been quite considerable. Since the early 90's Japan has been our number one customer for beef in both the value of the product and volume exported.
The Japanese Agriculture & Livestock Corporation in their March Bulletin of Monthly Statistics listed the following figures for imports of beef into Japan:
TABLE 2 • BEEF IMPORTS TO JAPAN BY COUNTRY OF ORIGIN
Vear USA Australla Chilled Frozen Total Chilled Frozen Total
1992 61,646 121,228 182,873 152,638 74,078 227,598 1993 81,358 161,727 243,085 215,030 86,074 301,702 1994 110,978 147,370 248,367 224,618 81,805 306,879 1995 137,890 170,028 307,936 217,879 96,049 314,544 1996 122,249 173,880 296,149 179,305 97,604 277,400
Estimate 1997 138,955 206,898 345,864 194,807 136,856 322,303
During 1996 there were two Food Safety Issues in Japan that affected Australia's exports.
The first happened early in the year. The "mad cow disease" in Britain received very large TV and newspaper coverage. The image of the "shaky" cow was played almost nightly on most TV channels. This very adverse publicity had considerable impact on many Japanese consumers who tend to be quite gullible and also tend to be quite paranoid about fresh foods and health concerns. The Japanese meat industry made no attempt to educate/inform the Japanese consumer that the two major countries from whom Japan imports meat were free of "mad cow disease". The general consensus within the meat trade in Japan was that if it were left alone it would go away and Japanese consumers would soon forget about it.
The second concern was a very real one to Japanese consumers. An outbreak of E.coli food poisoning which occurred mainly within the schools of the Kansai area of Japan (Osaka and surrounding areas) lasted from July to September. There were
Meat Research Corporation 12
several deaths of children and old people. Both "scares" had a very significant impact on the consumption of beef and hence on the volume of beef imported into Japan.
These two Food Safety issues impacted most severely on imported Australian chilled beef. There was an overall reduction of 36,000 tonnes in 1996 from the previous year (Table 1 ). It could be argued that there was also a reduction of 10,000 tonnes of frozen beef from Australia as well as a tonnage factor for the growth component of Australian chilled beef imported that year. The imported American chilled beef had a reduction of 15,000 tonnes.
Again it was in 1996 in which the total volume of beef imported into Japan from the USA first exceeded that imported from Australia. The gap between the amount of meat imported from the US and Australia is expected to continue to widen. There are several reasons for this trend:
• Superior packing to specification /consistency of the product packed into ·the carton by the US packers,
• US grades of "Prime, Choice & Select" are much more widely known and recognised,
• Container loads of individual cuts are readily available from the US. Australia predominantly sends full sets or its equivalent,
• There is a very significant presence of marketeers from US companies permanently in Japan supporting their company's branded products; that is, there is a very different philosophy towards marketing. Compare this to Australia's generic marketing of "Aussie Beef",
• US is a "Price Setter', Australia is a "Price Taker". This situation arises because beef carcases in the US and Japan are equivalent in weight and hence the resultant cuts are equivalent in weight & size. If the price offered by Japanese buyers to American packers is not equivalent or better than US domestic prices then US meat is not exported. This is not the situation in Australia where our domestic carcases are usually at least 100 kg lower in weight. Therefore the meat from Australian domestic carcases is totally unsuitable for export to Japan. Australia must rear its animals to the much heavier weights required for the Japanese market. The meat from these heavier animals is totally unsuitable for the Australian domestic market. This meat must go to Japan or face a very severe price discount in the Australian domestic market. Thus Australia is a "Price Taker" when dealing with the Japanese buyers.
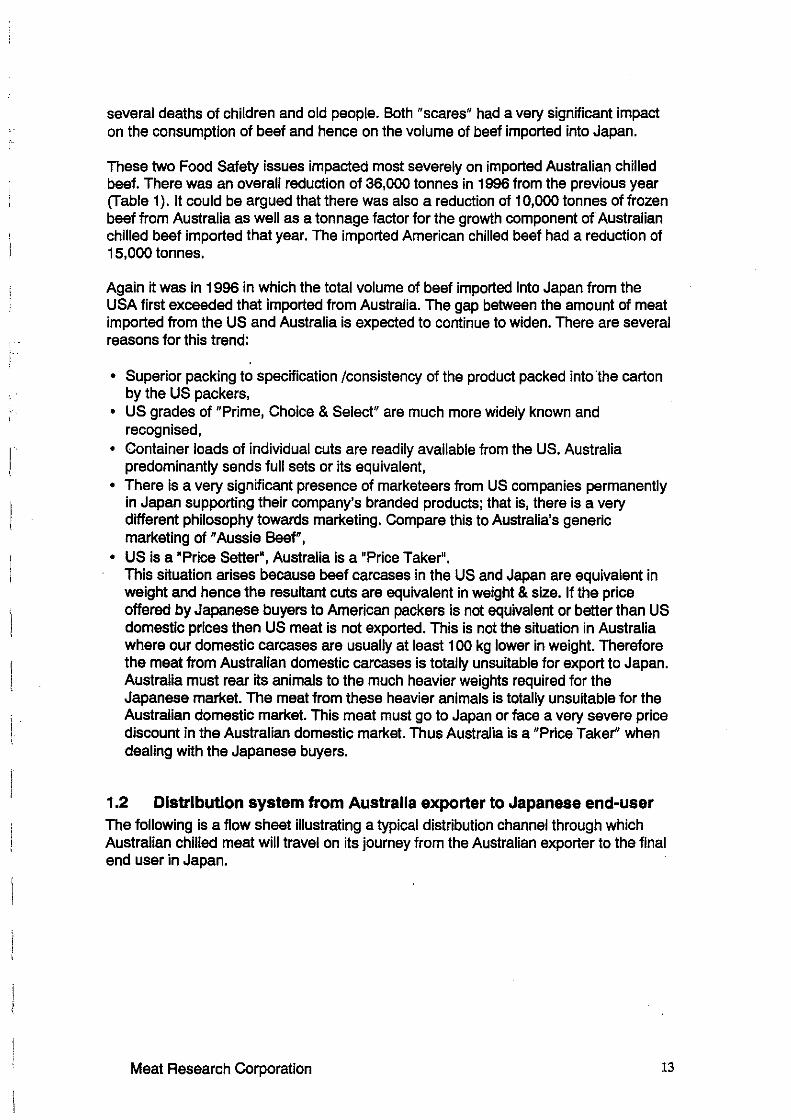
1.2 Distribution system from Australia exporter to Japanese end-user The following is a flow sheet illustrating a typical distribution channel through which Australian chilled meat will travel on its journey from the Australian exporter to the final end user in Japan.
Meat Research Corporation 13
' .
A. Australian exporter Container is loaded at loading dock
B. Unload container from ship & connect to Japanese Terminal
E. Cartons despatched by truck to local area cold store
Transport to Australian Terminal
C. Transport container & unload at the central cold store in Tokyo or Osaka
F. Cartons despatched _ by truck to local store,
restaurant, etc
On-board ship to Japan
D. Cartons despatched by truck to regional cold store
G. Meat purchased at a store or consumed in a restaurant, etc
Other major cities which are also ports, eg, Nagoya, Fukuoka, etc, may receive direct deliveries of containers by sea, ie, B to D. The regional cold store will also receive cartons of meat from the central cold stores in Tokyo and Osaka as illustrated. Cartons are usually despatched from the regional ones (D) to area cold stores (E) who deliver to end-users (F). Regional cold stores (D) also service end users (F); especially if the regional one is a company distribution centre, such as Seiyu's Distribution Centre at Nakanura which is on the outskirts of Tokyo. This centre services about 150 Seiyu stores in the Kanto region (greater Tokyo area).
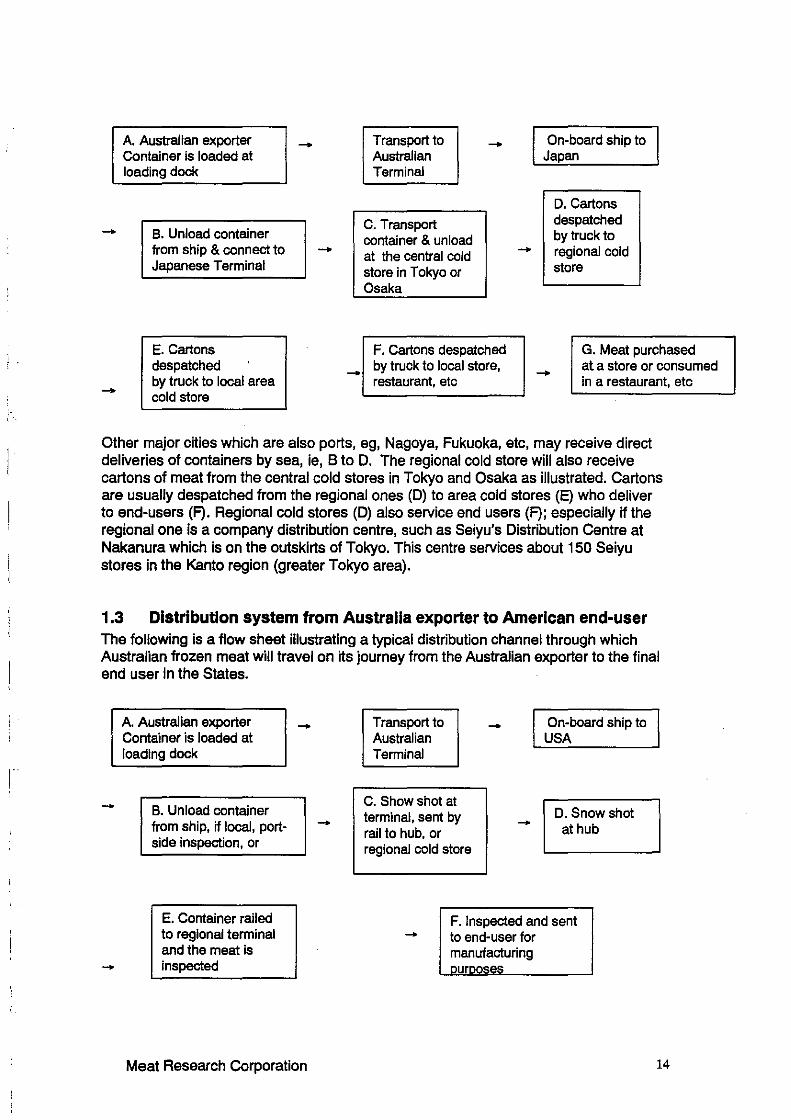
1.3 Distribution system from Australia exporter to American end-user The following is a flow sheet illustrating a typical distribution channel through which Australian frozen meat will travel on its journey from the Australian exporter to the final end user in the States.
A. Australian exporter Container is loaded at loading dock
B. Unload container from ship, if local, portside inspection, or
E. Container railed to regional terminal and the meat is inspected
Meat Research Corporation
Transport to Australian Terminal
C. Show shot at terminal, sent by rail to hub, or regional cold store
On-board ship to USA
D. Snow shot at hub
F. Inspected and sent to end-user for manufacturing
14
After the containers are unloaded (B) and if they are going to a local business, a portside inspection is undertaken and the product is shipped direct to the end-user (F). If the container is being shipped trans-continental it will be snow shot and sent to the hub (D) or sent direct to a regional bonded cold store for inspection (C to E). If the containers are going east or south east of the Mississippi they are re-shot with snow at the hub in Chicago and again consigned under seal to the regional bonded cold store for inspection (C, D & E) followed by dispatch to the end-user (F).
The nature of the USA trade is that the shipping line or the cold stores which assist them perform most of the hands on functions in the distribution process. The importer, with the exception of Napro, who is an active and more sophisticated importerdistributor, frequently never sees the cargo and is basically a paper trader. This is not meant to be derogatory but the USA import meat business is dealing with large volumes of commodity products and the shipping lines are competitively striving to provide the highest leyel of service to importers to ensure they maintain market share.
Meat Research Corporation 15
:- . '
2. METHODOLOGY
2.1 Types of loggers, manufacturers and specifications The Gemini Tiny Tag loggers were manufactured in the UK and their Australian agents are Hastings Data Loggers from Port Macquarie, NSW. These loggers only have one internal thermistor sensor and the sensor accuracy is +/-0.4°C between +30°C and -30°C. They have a reading capacity of 7900 records and have a battery life of twoyears. The Tiny Tag loggers can be programmed to record readings from intervals which range from 1 sec to 100 hour plus between readings. These loggers were used for all domestic investigations in Japan and many in the USA.
Due to the nature of the frozen beef trade to the USA, it was decided to use two types of loggers, the ACR StnartReader 1 and Gemini Tiny Tag loggers. The SmartReader is manufactured in Canada and its Australian agent is Axion in Sydney. The SmartReader 1 has 2 channels, one is internal and the other is external on about a one-metre cable. They have a larger memory and can be used to log for longer periods at short time intervals. These loggers were used for a number of USA shipments and for many domestic investigations in the USA. They can take up to 21,500 readings and operate to -65°C to 70°C. They also have a 1 0-year battery and a tolerance of +/-0.2°C. The SmartReader can be programmed to take readings from 8 sec to 59 min intervals between readings.
The ACR multi channel SmartReader 6 has one internal channel and six external channels for the attachment of thermocouples. Except for the number of external channels, the specifications for the various models of the SmartReader loggers are virtually identical. The external channels with Cu/con thermocouples attached to the SmartReader 6s were calibrated before and after each shipment.
Both loggers used software packages which were Windows compatible. The raw and transposed data can be exported through Windows into a range of formats. However, the ability of the Gemini Tiny Tag software to support any form of descriptive comments was extremely limited. The software supporting the SmartReader loggers was much more user friendly but not as sophisticated as with the more expensive temperature loggers.
2.2 Organisation of trials and other activities: The former Shipowner's Refrigerated Cargo Research Association in the UK, now called the Cambridge Refrigeration Technology, was contacted. Two references to research publications on insulated and refrigerated containers were forwarded.
Discussions were also held with AMLC in Sydney and with members of the Country Meatworks Association of NSW at their annual meeting.
2.2.1 Pre-trial discussions were held with the Australian Chamber of Shipping (ACOS). Meetings were then held with the Technical Committee of the ACOS and with representatives of NYK line, Blue Star line, Columbus line and ANZDL line. The NYK line is a major line in the chilled beef trade to Japan and Blue Star line operate in both trades, A detailed list of questions regarding container age and profiles was submitted
Meat Research Corporation 16
I I
totheACOS.
An inspection of the container terminal at Port Botany was made and measurements of both porthole containers used with the frozen meat trade to the USA and integral containers used in the chilled beef trade to Japan were recorded. Photographs were also taken of the containers and data was recorded on dimensions, the refrigeration units and the types of floor panels within containers.
A porthole or clip-on container does not have an independent refrigeration unit. It has sealable top and bottom holes in the front panel/wall. The centralised refrigeration units at the terminals or on-board the ship are clipped onto these portholes. An integral container has its own refrigeration unit built into the container.
2.2.2 Insurance and shipping industry data were collected and collated.
2.2.3 AQIS plant data and related aspects to cold chain including carton integrity, container packing and transportation rejection data were collect~d.
2.2.4 Contacts were made with meat exporters to Japan and to the USA.
2.2.5 Contacts were made with importers in Japan and with Napro in the US.
2.2.6 Visited plants to arrange procedural requirements and selection of shipments.
2.3 Export Trials to Japan and USA Commenced export trials to Japan in February 1997; it was summer in the southern and winter in the Northern Hemispheres. Six companies participated with the trials to Japan, Warwick Bacon, Teys Bros, Kilcoy Pastoral, Lachley Meats (Forbes), Zenchiku and Sumikin Bussan. Zenchiku sourced their beef from Consolidated Meats in Rockhampton and the Kilcoy Pastoral Company while Sumikin Bussan sourced their meat from their Longford plant in Tasmania.
At the exporter's load-out area, on the evening immediately prior to stuffing or one to two hours prior to stuffing the container, a SmartReader 6 was strapped inside the container. Five thermocouples were positioned as represented in the container diagram on page 20. If possible during stuffing, selected cartons were opened and a Tiny Tag or SmartReader 1 was inserted into the carton; the lid was re-placed and the carton re-strapped. These cartons were then positioned within the container either in position 2 or 5 adjacent to the thermocouples 2 & 5 from the SmartReader 6. The trials ran continuously until mid-October.
Commenced export trials to the USA, March 1997. Bindaree Beef at lnverell in NSW and Lachley Meat (Forbes) agreed to participate in the project. The loggers were placed inside the shipping container at the warmest spot which is located near the container doors above the red line (top right hand side near door - Position2). One logger was placed inside a plastic bag and packed in the fresh beef at the time of processing in the boning at Bindaree Beef and then blast frozen. The product was then shipped.
Meat Research Corporation 17
2.4 Domestic trials within Japan and USA. Liaised with importers and cold stores etc. Cooperation was sought and obtained from the shipping companies. Visits were made to Japan and USA to co-ordinate and inspect the cold chain and procedural details.
Commenced domestic trials in Japan, from Tokyo & Osaka in late May and continued into late October. AMLC officers in Tokyo and Osaka were interviewed and briefed. Five Japanese companies, Zenchiku, Stamina Foods, Hannan Corporation, Yuasa and Sumikin Bussan participated with this investigation.
These domestic trials were initiated from the offices of the various Japanese companies in either Tokyo or Osaka. Many end-users in many Japanese cities on three of the four main islands of Japan were contacted and then f!elected by the staff of participating companies. Orders were assembled at the central cold stores in Tokyo and Osaka. Cartons were selected, opened and Tiny Tag loggers were inserted. The cartons were re-strapped, labelled and despatched to. selected customers. Loggers were recovered from end-users and returned to Australia for downloading of the data. Graphs were drawn and interpreted.
Commenced domestic USA investigations in late July 1997.
The ANZDL Line arranged for an inspection of the new Port of Los Angeles and three large cold stores, Union Ice, Weighmasters Murphy and USA Transmode in the Long Beach/Los Angeles area. The new Port of Los Angeles is one of the largest port complexes in the world and handles most of the imported beef in Southern California.
Deans Cold Storage in San Francisco was visited. Most of the imported meat used in Northern California is handled through here. Also visited were the Port of Richmond and Cooltainers/Fesco lines. (Note: This line is also contemplating the use of snow shooting to send containers into the Chicago area or other inland destinations after the product is unloaded from the vessel.)
The shipping companies, in particular Columbus and ANZDL Lines assisted with the organisation of temperature monitoring in the USA. Inspections were made of depots which snow shoot with carbon dioxide (COJ, including Pacific Trainload Systems at Oakland, (assisted by ANZDL) and Prax Air at Long Beach (assisted by Columbus Line). A total of 8 containers were logged for ANZDL from Oakland to Chicago. Only 4 loggers were recovered. Through Columbus, eight containers were successfully logged from Long Beach to Chicago where one container was re-shot and despatched to Philadelphia, Pa, and others were sent direct from Long Beach to Jacksonville, Florida, Fort Worth, Texas, and Newark Delaware.
Two containers were inspected at including Pacific Trainload Systems at Oakland. The first container was a relatively old integral container (April 1988 manufacture) ICSU5208448. The product packed was Edmond's AFH90CL Halal beef packed on 16 May 1997 (Marks: ME/11 OBA/PHIL). Although the product was packed for Philadelphia it had been shipped to the West Coast for snow shooting and would be railed to the Chicago hub of ANZDL The importer was Napro. The container doors were opened and approximately 3, 182 kg (7,000 lbs) of C02 snow was pumped into the top of the container above the cartons (above red line). When the container was full with snow, the doors were resealed and the container was then moved to the rail terminal by road.
Meat Research Corporation 18
I !
i .. i
I !
The second container was also a relatively old (1989) integral container (ANZDL) TRIU6560807, Throsby AFH90CL, Marks: WAM5576B visible. The product was to be transferred at Berkshire, Chicago for the importer Louis Dreyfus. Again 3, 182 kg (7,000 lbs) weight of C02 snow was added to the container. The doors were opened and the snow was pumped through a lance which was pushed over the top of the cartons.
Columbus Line uses porthole containers and the snow is added through the porthole of the container. The doors are not opened. Columbus also stated that they use only 1,000 - 1273 kg (2,200-2,800 lbs) at their Prax Air facility in Long Beach. Containers bound for the East Coast, such as Philadelphia, are snowed again in Chicago for the next leg.
Blue Star Line stated that 1364 kg (3,000 lbs) of snow was sufficient for 10 days transit.
USDA personnel, Australian Embassy Veterinary Counsellor, Dr Miller, in Washington DC the Meat Importers Council of America, American importers, shipping lines & AMLC Officers in New York were interviewed and briefed. The temperature loggers were recovered from the containers and time temperature graphs were prepared and interpreted.
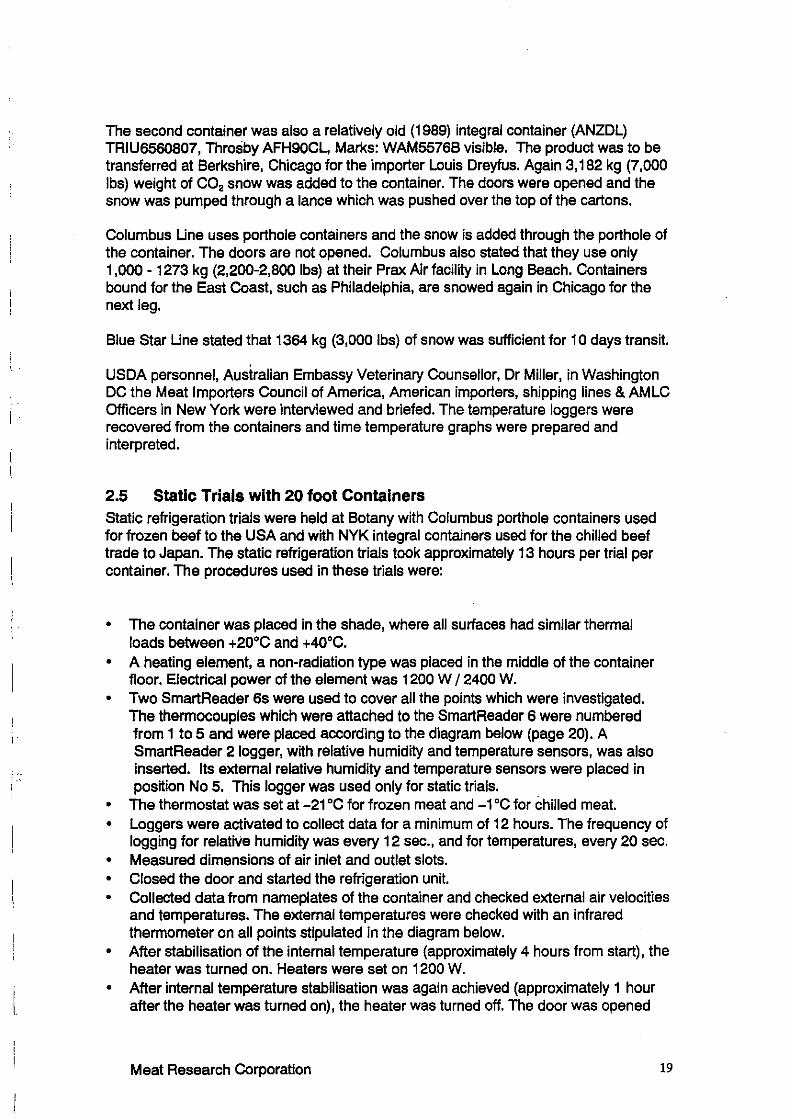
2.5 Static Trials with 20 foot Containers Static refrigeration trials were held at Botany with Columbus porthole containers used for frozen beef to the USA and with NYK integral containers used for the chilled beef trade to Japan. The static refrigeration trials took approximately 13 hours per trial per container. The procedures used in these trials were:
• The container was placed in the shade, where all surfaces had similar thermal loads between +20°C and +40°C.
• A heating element, a non-radiation type was placed in the middle of the container floor. Electrical power of the element was 1200 W / 2400 W.
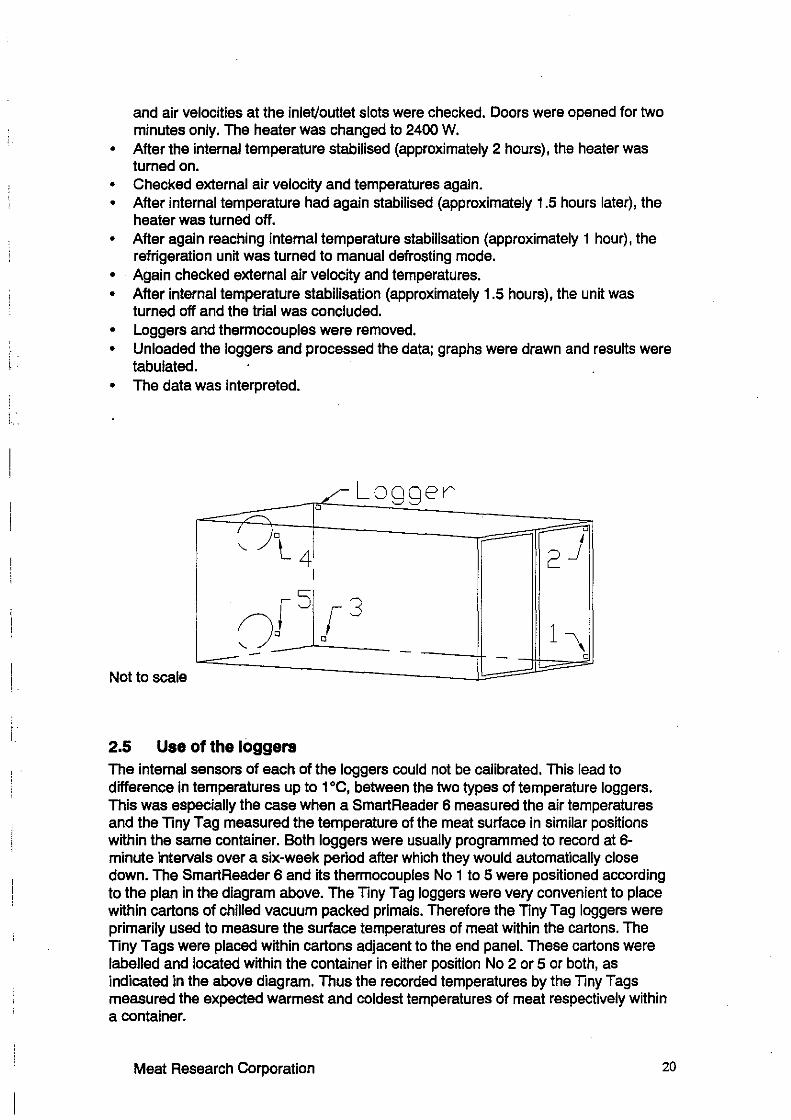
• Two SmartReader 6s were used to cover all the points which were investigated. The thermocouples which were attached to the SmartReader 6 were numbered from 1 to 5 and were placed according to the diagram below (page 20). A SmartReader 2 logger, with relative humidity and temperature sensors, was also inserted. Its external relative humidity and temperature sensors were placed in position No 5. This logger was used only for static trials.
• The thermostat was set at -21 ·c for frozen meat and -1 ·c for chilled meat. • Loggers were activated to collect data for a minimum of 12 hours. The frequency of
logging for relati\ie humidity was every 12 sec., and for temperatures, every 20 sec. • Measured dimensions of air inlet and outlet slots. • Closed the door and started the refrigeration unit. • Collected data from nameplates of the container and checked external air velocities
and temperatures. The external temperatures were checked with an infrared thermometer on all points stipulated in the diagram below.
• After stabilisation of the internal temperature (approximately 4 hours from start), the heater was turned on. Heaters were set on 1200 W.
• After internal temperature stabilisation was again achieved (approximately 1 hour after the heater was turned on), the heater was turned off. The door was opened
Meat Research Corporation 19
l
i I..
I '.
and air velocities at the inlet/outlet slots were checked. Doors were opened for two minutes only. The heater was changed to 2400 W.
• After the internal temperature stabilised (approximately 2 hours), the heater was turned on.
• Checked external air velocity and temperatures again. • After internal temperature had again stabilised (approximately 1.5 hours later), the
heater was turned off. • After again reaching internal temperature stabilisation (approximately 1 hour), the
refrigeration unit was turned to manual defrosting mode. • Again checked external air velocity and temperatures. • After internal temperature stabilisation (approximately 1.5 hours), the unit was
turned off and the trial was concluded. • Loggers and thermocouples were removed. • Unloaded the loggers and processed the data; graphs were drawn and results were
tabulated. • The data was interpreted.
~ 0
Logger / '
I Jo ' '-- l 4 2 .J I
rs {3 (Jo 0 1\ - - 0
Notto scale
2.5 Use of the loggers The internal sensors of each of the loggers could not be calibrated. This lead to difference in temperatures up to 1°C, between the two types of temperature loggers. This was especially the case when a SmartReader 6 measured the air temperatures and the Tiny Tag measured the temperature of the meat surface in similar positions within the same container. Both loggers were usually programmed to record at 6-minute intervals over a six-week period after which they would automatically close down. The SmartReader 6 and its thermocouples No 1 to 5 were positioned according to the plan in the diagram above. The Tiny Tag loggers were very convenient to place within cartons of chilled vacuum packed primals. Therefore the Tiny Tag loggers were primarily used to measure the surface temperatures of meat within the cartons. The Tiny Tags were placed within cartons adjacent to the end panel. These cartons were labelled and located within the container in either position No 2 or 5 or both, as indicated in the above diagram. Thus the recorded temperatures by the Tiny Tags measured the expected warmest and coldest temperatures of meat respectively within a container.
Meat Research Corporation 20
i
I
3. RESULTS AND DISCUSSION
3.1 Prior work In the area A comprehensive search was made of the formal literature via the computer databases that were available to the CSIRO Library Services. Irving, et al., (1991) from CSIRO, reported on chilled quarter beef sent in special gas tight containers from Brisbane, Australia to Osaka, Japan. The containers used in this work had been specially modified by P&O for this "new" business opportunity. Several old references were also obtained; the most relevant article was by Dellacasa, A. 1987. Rev. Int. Froid. Refrigerated Transport by Sea, 10, 349. It was a very generalised paper.
The Cambridge Refrigeration Technology at Cambridge in the UK provided two publications which reported on refrigeration and handling practices of meat within containers in the international trade. Heap and Pryor (1993) from Cambridge Refrigeration Technology discussed the influence of refrigeration within containers on the temperatures of New Zealand chilled meat within cartons sent to the UK. The second paper only discussed detailed Design and Performance of containers.
ACOS provided a copy of the Protocol and quality assurance document that had been prepared for fruit as well as the draft document on container packing prepared by Barry Johnson of AMT. ACOS thought that the protocol for the containerisation of fruit might be applicable to meat.
CSIRO Meat Research Report 2/89, "USDA and Agriculture Canada Port Reinspection Rejections and other Technical Matters Relevant to the Exports of Australian Meat to the USA and Canada" by Barry Johnson, is still regarded by industry as the reference work in this area. Nothing has changed except there are fewer rejections now than in 1989.
3.2.1 Shipment of chilled products to Japan For logistical reasons the temperature history of chilled carton meat to Japanese end users was divided into two parts:
(a) Log the temperatures from Australia to the central cold stores in Japan, and (b) Log the temperatures from the central cold stores in Japan to end-users.
36 Containers of chilled meat were monitored from the loading docks of Australian exporters to the central cold stores either in Tokyo or Osaka (Table 3). A container of chilled meat which went to the UK was also investigated.
Meat Research Corporation 21

i. ,.
I I
TABLE 3: NUMBER AND DESTINATIONS OF CONTAINERS* WITH CHLLED MEAT FROM AUSTRALIA TO JAPAN & UK
From February to October 1997
Number of Containers Port in Australia Port in Japan 18 Brisbane Osaka 8 Brisbane Yokohama 5 Svdnev Yokohama 3 Sydney Osaka 2 Melbourne Osaka
Total= 36 1 Sydney London
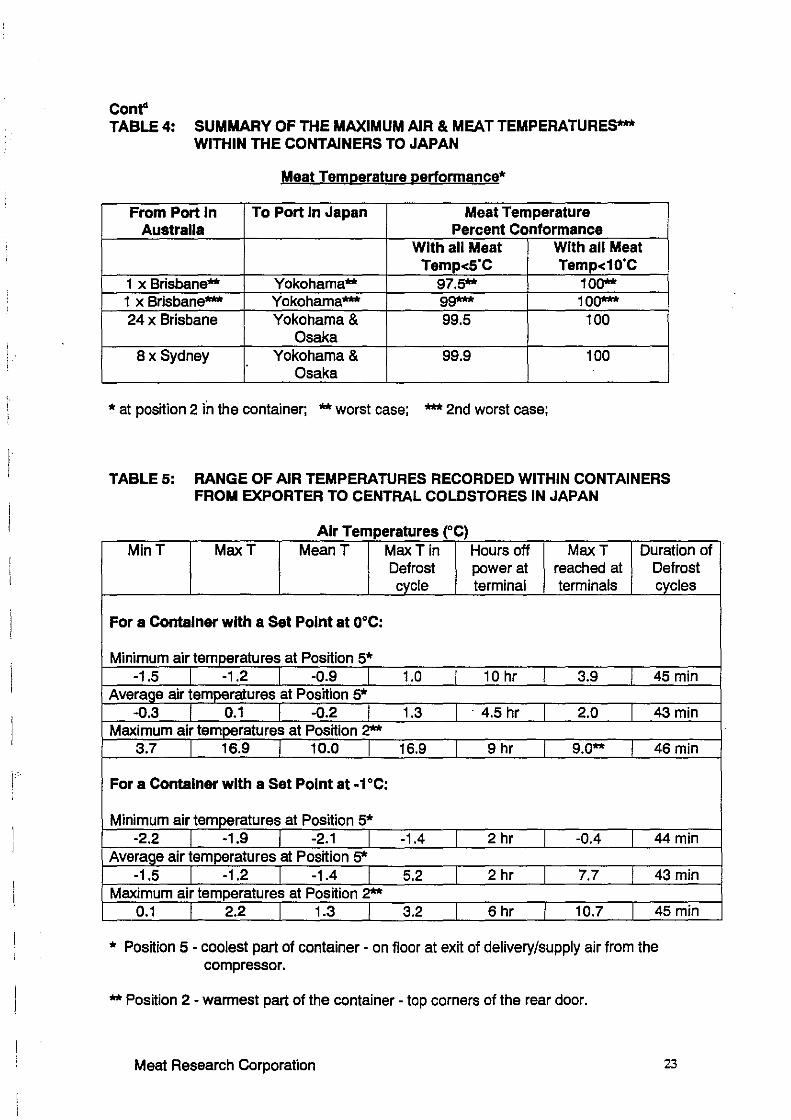
Table 4 is a summary of the percentage conformance to air and meat temperature maximums within the containers listed in Table 3. In Case No 1 the air temperatures in this container at position No 2 were below 5 ·c for only 45% of the time and below 1 o·c for 80% of the time. Table 5 lists the range of air temperatures at two set points (O'C & -1°C) on the container refrigeration controls while Table 6 lists the ranges in meat temperatures. The meat temperature at position 2 within the container Case No 1, Table 4, was always below 2.4'C and averaged 1.3'C for the whole duration, see Graphs 7, 8 & 9.
TABLE 4: .SUMMARY OF THE MAXIMUM AIR & MEAT TEMPERATURES WITHIN THE CONTAINERS TO JAPAN
Air Temperature Performance*
From Port In To Port In Japan Air Temperature Australia Percent Conformance
With all Air With all Air Temp<S'C Temp<10'C
1 x Brisbane** Yokohama** O** 41.9** 6x Brisbane Yokohama 97.8 100
1 x Brisbane- Yokohama- 93- 100-18 x Brisbane Osaka 97.6 100 8 x Sydney Yokohama& 98.9 100
Osaka 2 x Melbourne Osaka 99.3 100
* at position 2 in the container; ** worst case; - 2nd worst case;
Meat Research Corporation 22
i
i
I I
Cont" TABLE4: SUMMARY OF THE MAXIMUM AIR & MEAT TEMPERATURES
WITHIN THE CONTAINERS TO JAPAN
Meat Temperature performance*
From Port In To Port In Japan Meat Temperature Australla Percent Conformance
With all Meat With all Meat Temp<s·c Temp<1o·c
1 x Brisbane** Yokohama** 97.5** 100** 1 x Brisbane*** Yokohama*** 99*** 100*** 24 x Brisbane Yokohama& 99.5 100
Osaka Bx Sydney Yokohama& 99.9 100
Osaka
* at position 2 in the container; ** worst case; *** 2nd worst case;
TABLE 5: RANGE OF AIR TEMPERATURES RECORDED WITHIN CONTAINERS FROM EXPORTER TO CENTRAL COLDSTORES IN JAPAN
Air Temperatures (°C) MinT MaxT MeanT Max Tin Hours off MaxT Duration of
Defrost power at reached at Defrost cvcle terminal terminals cycles
For a Container with a Set Point at 0°C:
Minimum air temperatures at Position 5* -1.5 -1.2 -0.9 1.0 10 hr 3.9 45 min
Average air temoeratures at Position 5* -0.3 0.1 -0.2 1.3 · 4.5 hr 2.0 43min
Maximum air temoeratures at Position 2** 3.7 16.9 10.0 16.9 9 hr 9.0** 46min
For a Container with a Set Point at -1°c:
Minimum air temoeratures at Position 5* -2.2 -1.9 -2.1 -1.4 2 hr -0.4 44min
Average air temperatures at Position 5* -1.5 -1.2 -1.4 5.2 2 hr 7.7 43min
Maximum air temperatures at Position 2** 0.1 2.2 1.3 3.2 6 hr 10.7 45min
* Position 5 - coolest part of container - on floor at exit of delivery/supply air from the compressor.
**Position 2 - warmest part of the container - top corners of the rear door.
Meat Research Corporation 23
! •.
' '
' i !
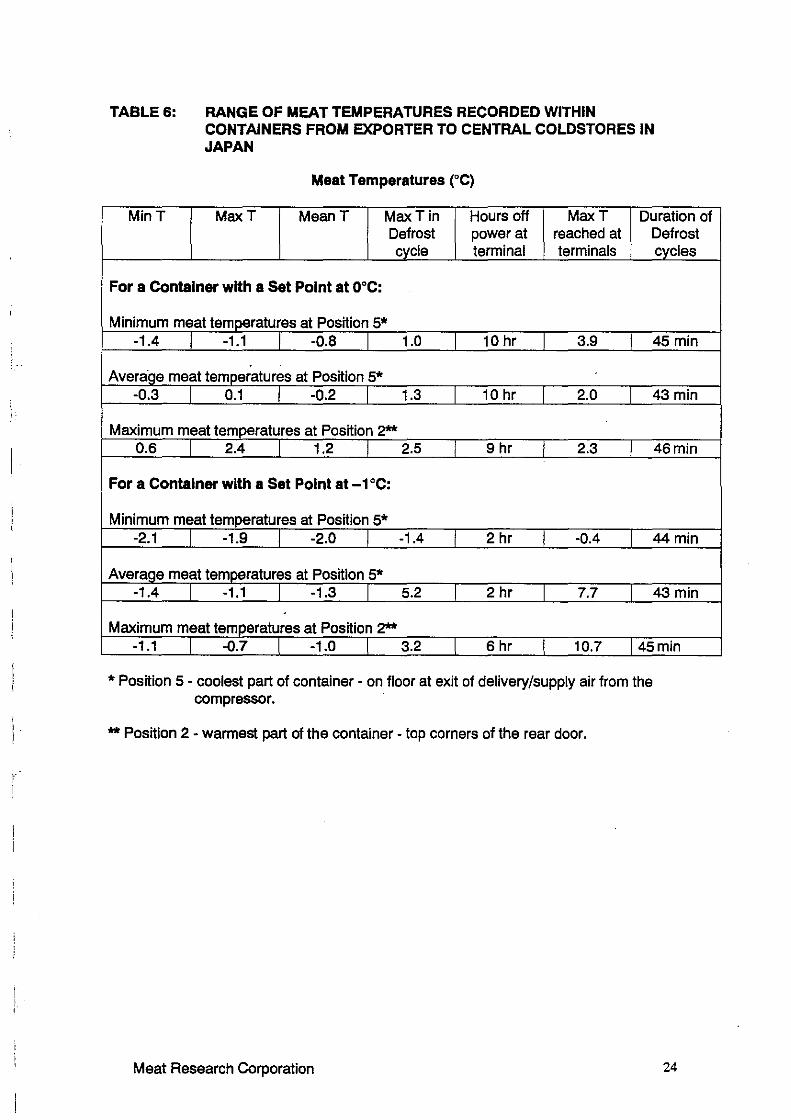
TABLES: RANGE OF MEAT TEMPERATURES RECORDED WITHIN CONTAINERS FROM EXPORTER TO CENTRAL COLDSTORES IN JAPAN
Meat Temperatures (°C)
MinT MaxT MeanT MaxTin Hours off MaxT Duration of Defrost power at reached at Defrost cvcle terminal terminals cvcles
For a Container with a Set Point at 0°c:
Minimum meat temoeratures at Position 5* -1.4 -1.1 -0.8 1.0 10 hr 3.9 45min
Average meat temperatures at Position 5* -0.3 0.1 -0.2 1.3 10 hr 2.0 43min
Maximum meat temoeratures at Position 2""* 0.6 2.4 1.2 2.5 9 hr 2.3 46min
For a Container with a Set Point at -1°c:
Minimum meat temperatures at Position 5* -2.1 -1.9 -2.0 -1.4 2 hr -0.4 44min
Average meat temooratures at Position 5* -1.4 -1.1 -1.3 5.2 2 hr 7.7 43min
Maximum meat temperatures at Position 2""* -1.1 -0.7 -1.0 3.2 6 hr 10.7 45min
*Position 5 - coolest part of container - on floor at exit of delivery/supply air from the compressor.
** Position 2 - warmest part of the container - top corners of the rear door.
Meat Research Corporation 24
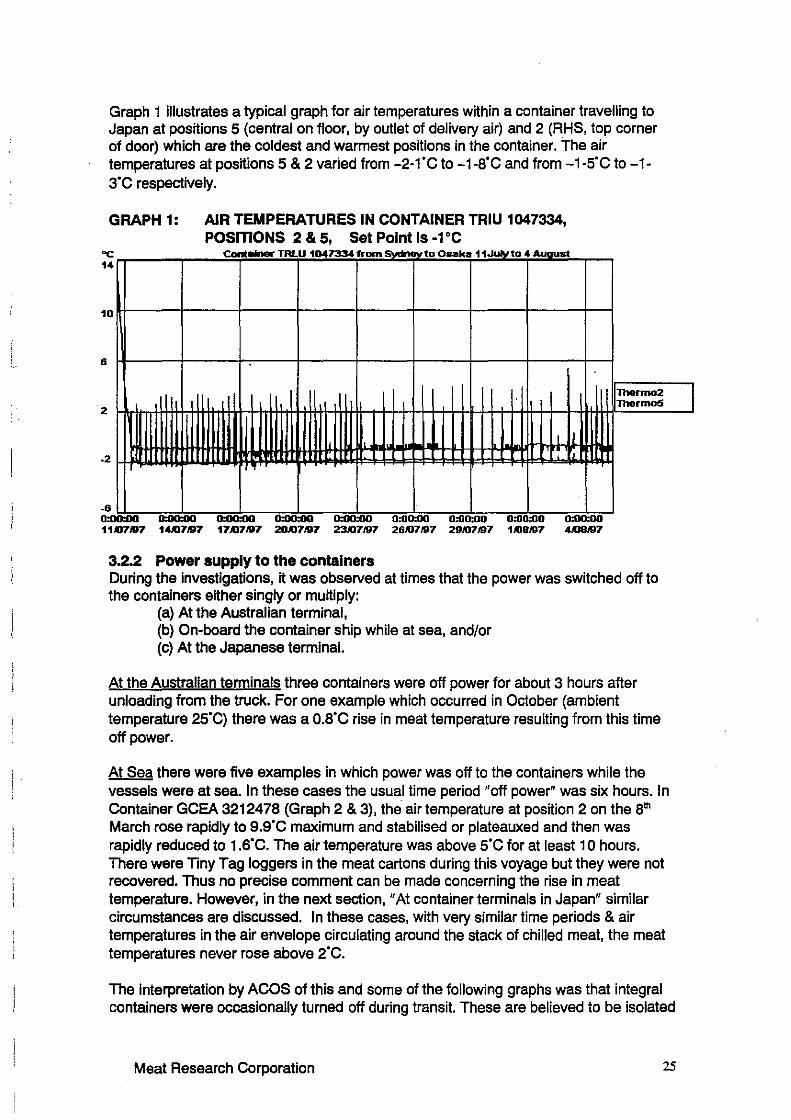
Graph 1 illustrates a typical graph for air temperatures within a container travelling to Japan at positions 5 (central on floor, by outlet of delivery air) and 2 (RHS, top corner of door) which are the coldest and warmest positions in the container. The air temperatures at positions 5 & 2 varied from -2-1'C to-1-8'C and from -1-5'C to-1-3'C respectively.
GRAPH 1: AIR TEMPERATURES IN CONTAINER TRIU 1047334, POSmONS 2 & 5, Set Point Is -1°C
"C 14
Cont8'ner TRLU 104733.tfrom QMlt1o uto Osaka 11-h&tuto 4 Auaust
10
6
2 1Thermo2 Thermo5
I I .2 • J
-6 0:00:00 0:00:00 0:00:00 0:00:00 0:00:00 0:00:00 0:00:00 0:00:00 0:00:00 11.1117.1117 14.1117.1117 17.1117.1117 20Al7.1117 23.1117197 26.1117.1117 291117'97 1Al8.1117 4jQ8.1117
3.2.2 Power supply to the containers During the investigations, it was observed at times that the power was switched off to the containers either singly or multiply:
(a) At the Australian terminal, (b) On-board the container ship while at sea, and/or (c) At the Japanese terminal.
At the Australian teuninals three containers were off power for about 3 hours after unloading from the truck. For one example which occurred in October (ambient temperature 25'C) there was a 0.8'C rise in meat temperature resulting from this time off power.
At Sea there were five examples in which power was off to the containers while the vessels were at sea. In these cases the usual time period "off power" was six hours. In Container GCEA 3212478 (Graph 2 & 3), the air temperature at position 2 on the 8"' March rose rapidly to 9.9'C maximum and stabilised or plateauxed and then was rapidly reduced to 1.s·c. The air temperature was above s·c for at least 1 o hours. There were Tiny Tag loggers in the meat cartons during this voyage but they were not recovered. Thus no precise comment can be made concerning the rise in meat temperature. However, in the next section, "At container terminals in Japan" similar circumstances are discussed. In these cases, with very similar time periods & air temperatures in the air envelope circulating around the stack of chilled meat, the meat temperatures never rose above 2·c.
The interpretation by ACOS of this and some of the following graphs was that integral containers were occasionally turned off during transit. These are believed to be isolated
Meat Research Corporation 25
I
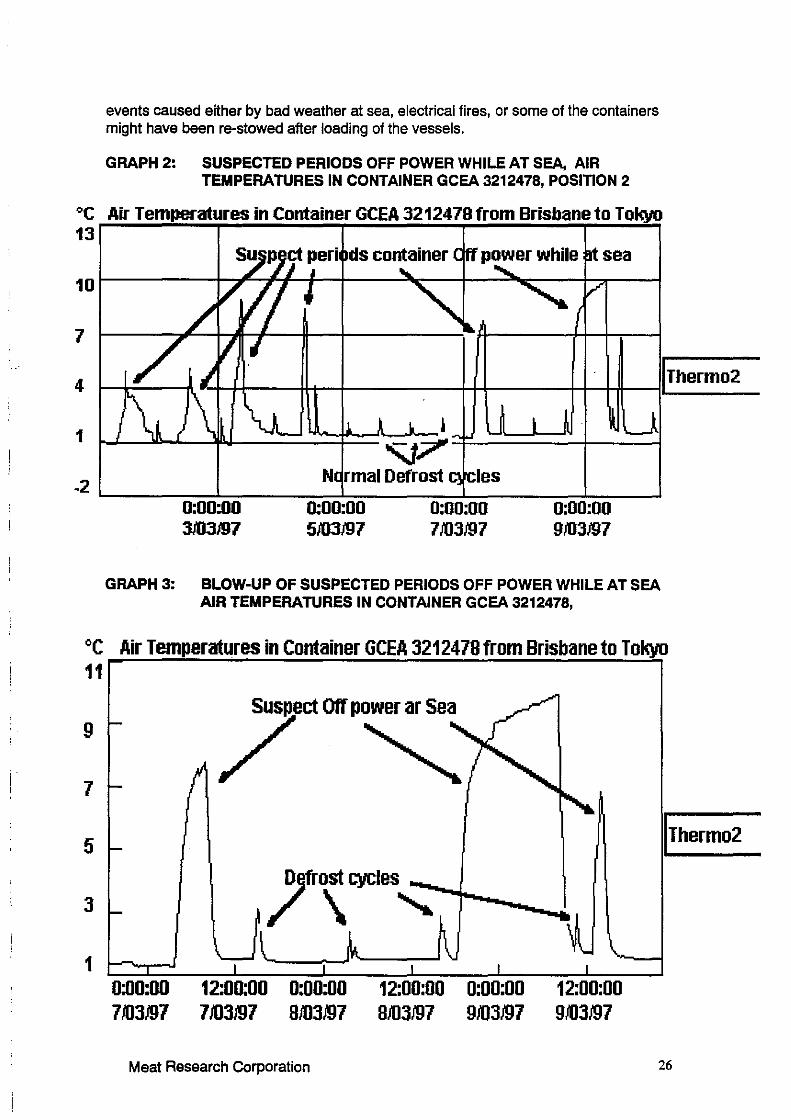
events caused either by bad weather at sea, electrical fires, or some of the containers might have been re-stowed after loading of the vessels.
GRAPH 2: SUSPECTED PERIODS OFF POWER WHILE AT SEA, AIR TEMPERATURES IN CONTAINER GCEA 3212478, POSITION 2
°C Air Temperatures in Container GCEA 3212478 from Brisbane to Tokyo 13
7
4
1 - ...... __. -.,.._,f"-.._, .. __.,.__.... ~ 'J/-'F-----+----1
N rmal Defrost les
0:00:00 5/03197
GRAPH 3: BLOW-UP OF SUSPECTED PERIODS OFF POWER WHILE AT SEA AIR TEMPERATURES IN CONTAINER GCEA 3212478,
jThermo2
°C Air Temperatures in Container GCEA 3212478 from Brisbane to Tokyo 11
9
7
5
3
1 0:00:00 7!03197
12:00:00 0:00:00 7 !03197 8!03197
Meat Research Corporation
12:00:00 8!03197
0:00:00 9!03197
12:00:00 9!03197
1Thermo2
26
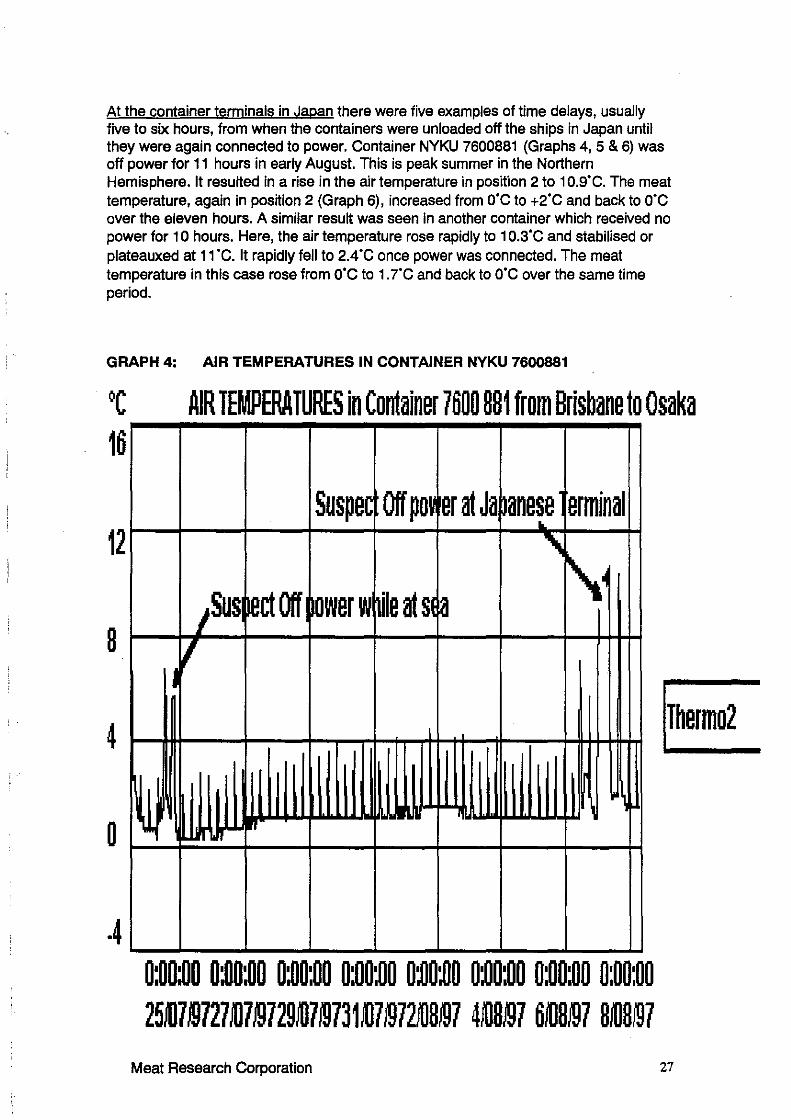
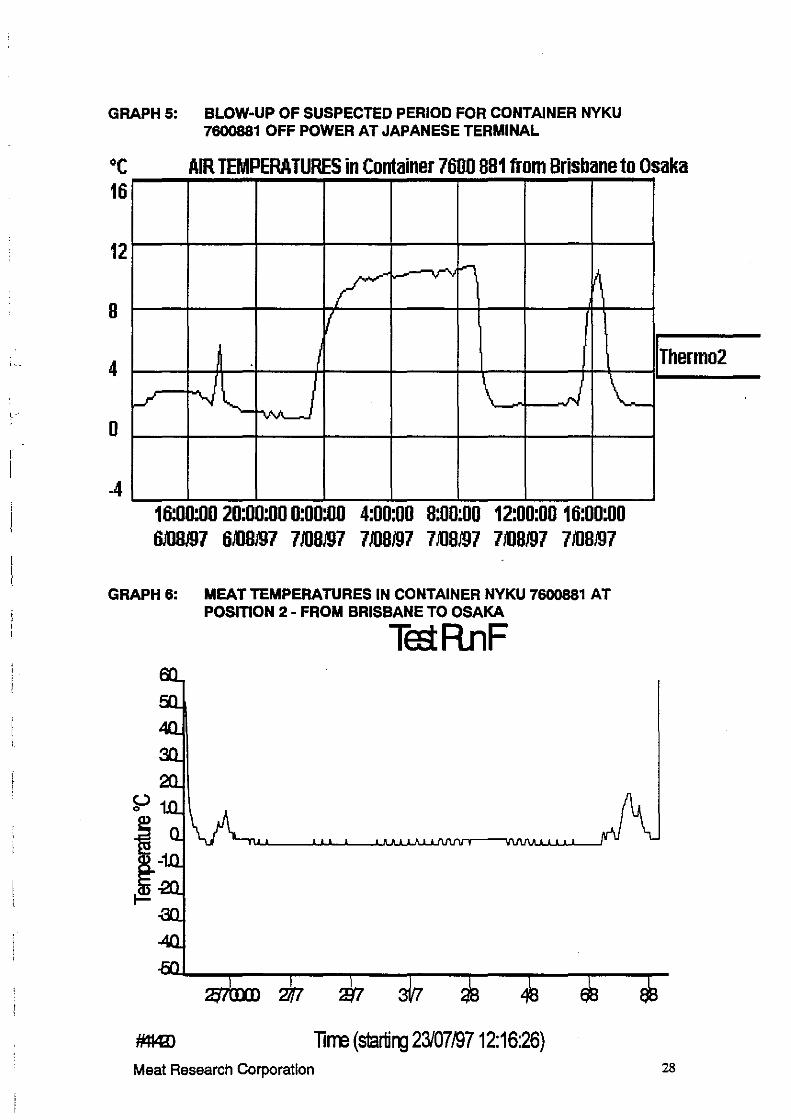
At the container terminals in Japan there were five examples of time delays, usually five to six hours, from when the containers were unloaded off the ships in Japan until they were again connected to power. Container NYKU 7600881 (Graphs 4, 5 & 6) was off power for 11 hours in early August. This is peak summer in the Northern Hemisphere. It resulted in a rise in the air temperature in position 2 to 1 o.s·c. The meat temperature, again in position 2 (Graph 6), increased from o·c to +2·c and back to o·c over the eleven hours. A similar result was seen in another container which received no power for 1 O hours. Here, the air temperature rose rapidly to 10.3·c and stabilised or plateauxed at 11 ·c. It rapidly fell to 2.4.C once power was connected. The meat temperature in this case rose from o·c to 1.7'C and back to o·c over the same time period.
GRAPH 4: AIR TEMPERATURES IN CONTAINER NYKU 7600881
°C AIR TEMPERA TURES in Container 7600 881 from Brisbane to Osaka 16
12
8
4
0
.4
Suspec Off pm er at Ja 1anese e rminal ...
" ,sus ect Off ower w ile at s1 a \·
I I
•
~~I lW'\
0:00:00 0:00:00 0:00:00 0:00:00 0:00~0 0:00:00 0:00:00 0:00:00 25i0719727i07!9729i0719731 i07 !972ffi8!97 4ffi8197 6i08!97 8ffi8!97
Meat Research Corporation
Thermo2
27
\ ...
1.·
GRAPH 5: BLOW-UP OF SUSPECTED PERIOD FOR CONTAINER NYKU 7600881 OFF POWER AT JAPANESE TERMINAL
°C AIR TEMPERA TURES in Container 7600 881 from Brisbane to Osaka 16
12
8
4
0
-4
- "'"" ~ r v •
I
\.._ ~ .... .........__ \ -. .... . . ..
16:00:00 20:00:00 0:00:00 4:00:00 8:00:00 12:00:00 16:00:00 6J1J8J97 6/08J97 7/08J97 1m0~1 1m0~1 1m0~1 1m0~1
GRAPH 6: MEAT TEMPERATURES IN CONTAINER NYKU 7600881 AT POSITION 2 • FROM BRISBANE TO OSAKA
Te:tRnF
:mo:m '21fl ';g7
#MD lirre (startillj 23/07/9712:16:26)
1Thermo2
Meat Research Corporation 28
NOTE: The sub-title "Test Run F" shown in the above graph and in many of the following graphs produced from Tiny Tag loggers, was recorded during the set-up of the program within the software. It is impossible to remove "Test Run F" once the program has been initiated. Some graphs will not have "Test Run F" as a sub-title. It was removed during set-up. The starting time on the X-axis was the time that the logger was programmed to commence logging temperatures.
The graphs for the air temperature in containers GCEA 3212478 and NYKU 7600881 (Graphs 2 & 4 and 5 & 6) demonstrated that when there was a lack of refrigeration to the container the air temperature (position 2) rose rapidly and apparently stabilised between 1 o ·c and 11 ·c. The maximum temperature in Osaka on the 7"' and 8"' August was 33·c on both days. This apparent stabilisation of the internal air temperature within the container is due to a partial equilibrium between the external heat leaking into the container and the cold, thermal mass within the stack of chilled meat. Presumably this apparent equilibrium within the container would be maintained for several hours. The temperature would continue to increase slowly for quite some time. As the temperature of the stack of chilled meat slowly increases then there would be an increasing rate of temperature increase as both internal air and meat temperatures converge towards that of the ambient temperatures outside. Under the quasi equilibrium conditions operating in these containers, the external surface temperatures of the chilled meat in the outer cartons of the stack are increasing at a rate of about 1 ·c everv four hours.
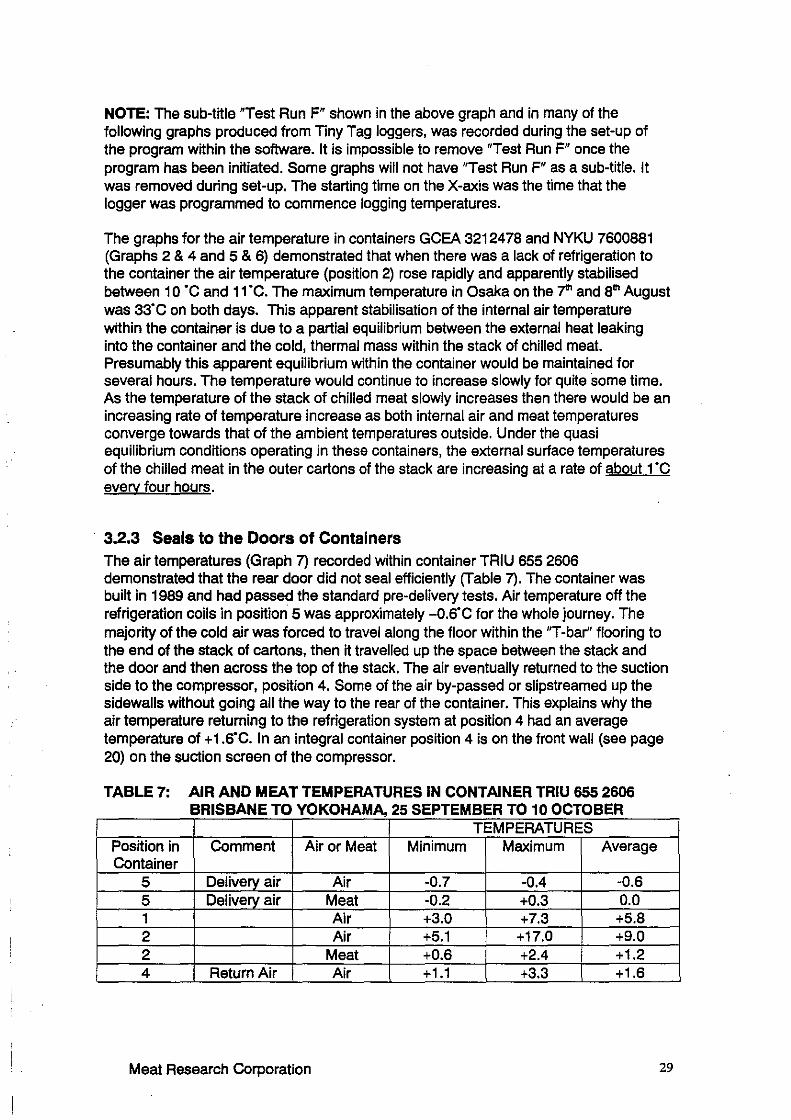
· 3.2.3 Seals to the Doors of Containers The air temperatures (Graph 7) recorded within container TRIU 655 2606 demonstrated that the rear door did not seal efficiently (Table 7). The container was built in 1989 and had passed the standard pre-delivery tests. Air temperature off the refrigeration coils in position 5 was approximately -0.6"C for the whole journey. The majority of the cold air was forced to travel along the floor within the "T-bar" flooring to the end of the stack of cartons, then it travelled up the space between the stack and the door and then across the top of the stack. The air eventually returned to the suction side to the compressor, position 4. Some of the air by-passed or slipstreamed up the sidewalls without going all the way to the rear of the container. This explains why the air temperature returning to the refrigeration system at position 4 had an average temperature of+ 1.6"C. In an integral container position 4 is on the front wall (see page 20) on the suction screen of the compressor.
TABLE 7: AIR AND MEAT TEMPERATURES IN CONTAINER TRIU 655 2606 BRISBANE TO YOKOHAMA, 25 SEPTEMBER TO 10 OCTOBER
TEMPERATURES Position in Comment Air or Meat Minimum Maximum Average Container
5 Delivery air Air -0.7 -0.4 -0.6 5 Delivery air Meat -0.2 +0.3 0.0 1 Air +3.0 +7.3 +5.8 2 Air +5.1 +17.0 +9.0 2 Meat +0.6 +2.4 +1.2 4 Return Air Air +1.1 +3.3 +1.6
Meat Research Corporation 29
GRAPH 7: AIR TEMPERATURES IN CONTAINER TRIU 655 2606, POSITIONS 1, 2&5
"C Al{ TEMPERATURES In Conta03r TRll 655 2606from ~to Yokohama 20
15
10
5
0
~-~,,_==,..,.,,_,,-='=---=-=""'"=,,--=-=""='=-----::--='":-::---=-=~::--,==-=--=-,,.,-.,,.,,_~-:.'7-=:--' 0:00:00 0:00:00 0:00:00 0:00:00 0:00:00 0:00:00 0:00:00 0:00:00 0:00:00 0:00:00 25.Q9197 ZIDMJ7 29.(191117 1110lll7 3110/97 5110/97 7/18197 9/10/97 11/10/97 13118197
Thermo5
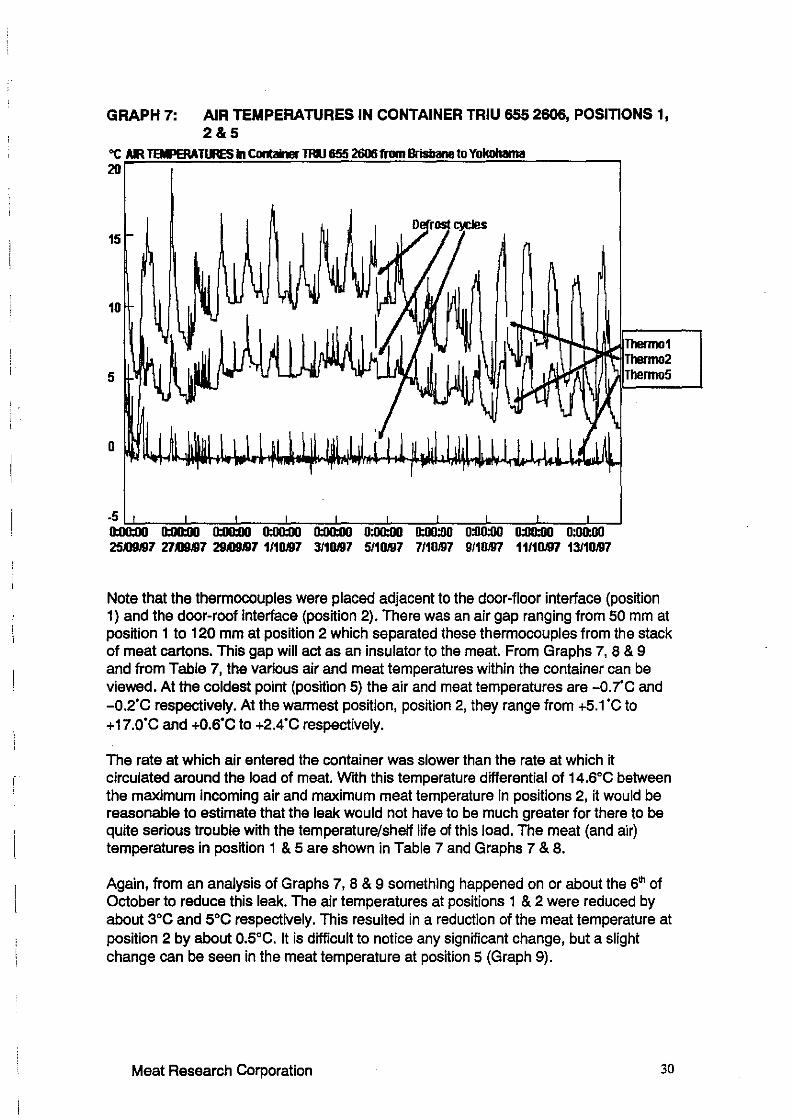
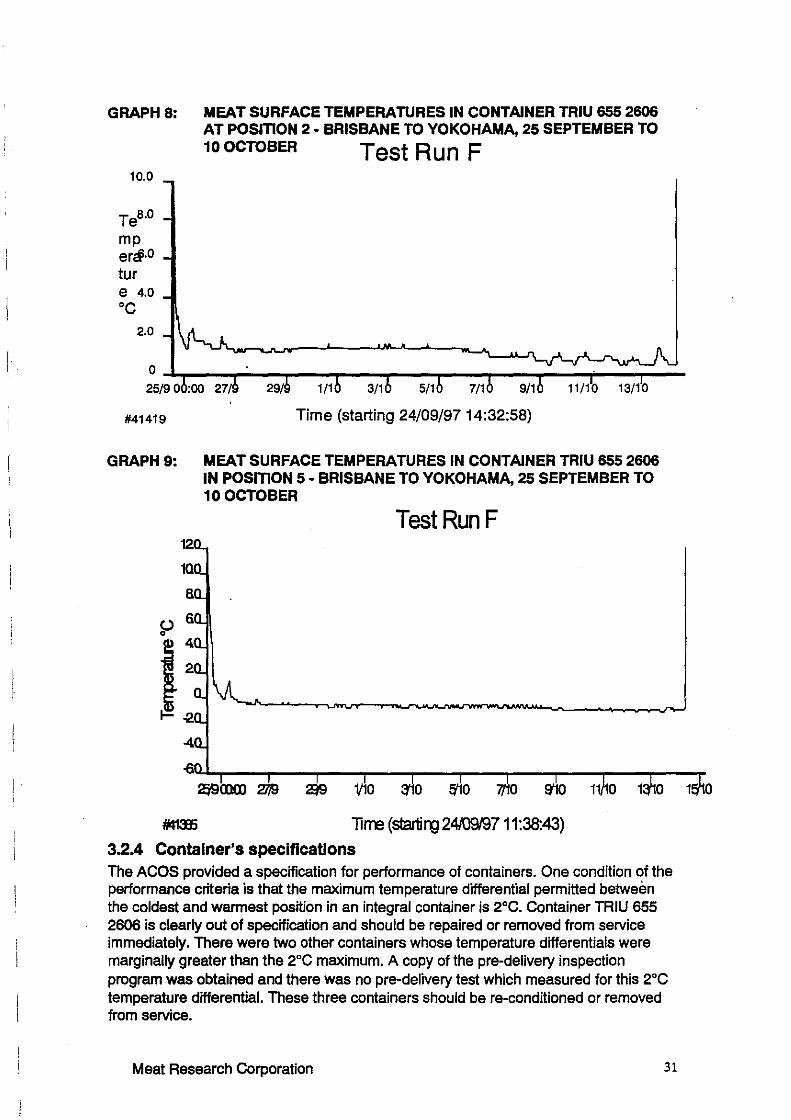
Note that the thermocouples were placed adjacent to the door-floor interface (position 1) and the door-roof interface (position 2). There was an air gap ranging from 50 mm at position 1 to 120 mm at position 2 which separated these thermocouples from the stack of meat cartons. This gap will act as an insulator to the meat. From Graphs 7, 8 & 9 and from Table 7, the various air and meat temperatures within the container can be viewed. At the coldest point (position 5) the air and meat temperatures are -0.7'C and -0.2'C respectively. At the warmest position, position 2, they range from +5.1 'C to + 17.0'C and +0.6'C to +2.4'C respectively.
The rate at which air entered the container was slower than the rate at which it circulated around the load of meat. With this temperature differential of 14.6°C between the maximum incoming air and maximum meat temperature in positions 2, it would be reasonable to estimate that the leak would not have to be much greater for there to be quite serious trouble with the temperature/shelf life of this load. The meat (and air) temperatures in position 1 & 5 are shown in Table 7 and Graphs 7 & 8.
Again, from an analysis of Graphs 7, 8 & 9 something happened on or about the 6111 of October to reduce this leak. The air temperatures at positions 1 & 2 were reduced by about 3°C and 5°C respectively. This resulted in a reduction of the meat temperature at position 2 by about 0.5°C. It is difficult to notice any significant change, but a slight change can be seen in the meat temperature at position 5 (Graph 9).
Meat Research Corporation 30
I I.
GRAPH 8: MEAT SURFACE TEMPERATURES IN CONTAINER TRIU 655 2606 AT POSITION 2 • BRISBANE TO YOKOHAMA, 25 SEPTEMBER TO
10.0
Tes.a
mp ercii·O tur e 4.0 oc
2.0
0
#41419
GRAPH9:
1oocToBER Test Run F
11/10 13/10
Time (starting 24/09/97 14:32:58)
MEAT SURFACE TEMPERATURES IN CONTAINER TRIU 655 2606 IN POSmON 5 • BRISBANE TO YOKOHAMA, 25 SEPTEMBER TO 100CTOBER
TestRunF
~ 1/10 a-10 S'!O 7/10 !¥10
1irre (startirg 24/09/9711:38:43) 3.2.4 Container's specifications The ACOS provided a specification for performance of containers. One condition of the performance criteria is that the maximum temperature differential permitted between the coldest and warmest position in an integral container is 2°C. Container TRIU 655 2606 is clearly out of specification and should be repaired or removed from service immediately. There were two other containers whose temperature differentials were marginally greater than the 2°C maximum. A copy of the pre-delivery inspection program was obtained and there was no pre-delivery test which measured for this 2°C temperature differential. These three containers should be re-conditioned or removed from service.
Meat Research Corporation 31
! I . '.
3.3 Domestic Distribution within Japan
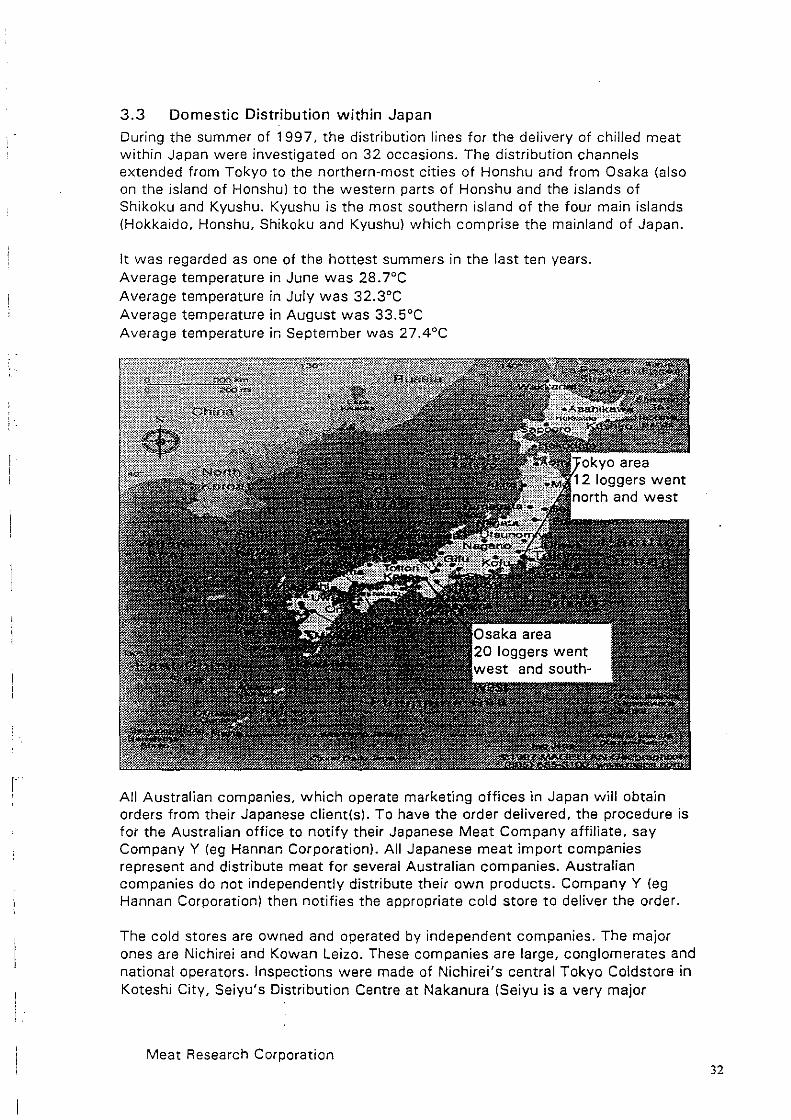
During the summer of 1997, the distribution lines for the delivery of chilled meat within Japan were investigated on 32 occasions. The distribution channels extended from Tokyo to the northern-most cities of Honshu and from Osaka (also on the island of Honshu) to the western parts of Honshu and the islands of Shikoku and Kyushu. Kyushu is the most southern island of the four main islands (Hokkaido, Honshu, Shikoku and Kyushu) which comprise the mainland of Japan.
It was regarded as one of the hottest summers in the last ten years. Average temperature in June was 28. 7°C Average temperature in July was 32.3°C Average temperature in August was 33.5°C Average temperature in September was 27.4°C
All Australian companies, which operate marketing offices in Japan will obtain orders from their Japanese client(s). To have the order delivered, the procedure is for the Australian office to notify their Japanese Meat Company affiliate, say Company Y (eg Hannan Corporation). All Japanese meat import companies represent and distribute meat for several Australian companies. Australian companies do not independently distribute their own products. Company Y (eg Hannan Corporation) then notifies the appropriate cold store to deliver the order.
The cold stores are owned and operated by independent companies. The major ones are Nichirei and Kowan Leizo. These companies are large, conglomerates and national operators. Inspections were made of Nichirei's central Tokyo Coldstore in Koteshi City, Seiyu's Distribution Centre at Nakanura (Seiyu is a very major
Meat Research Corporation 32
I
supermarket) & Zenchiku's Kawasaki City, all on the fringe of Tokyo, as well as Nichirei's Coldstore in Osaka, Zennoh's cold store in Kobe and Prima Ham's cold store in Fukuoka. An inspection was also made of a local cold store, Prime Beef Coldstore in Koriyama City, Fukushima Prefecture. At the local level these cold stores are small companies, such as Prime Beef Coldstore, and they handle many company brands. While independent, refrigerated delivery vehicles are available, the major distributors are predominantly owned by the major meat companies. When local butchers, restaurants and supermarkets place an order with Company X (say, Nippon Ham) at their regional office, it will be delivered from the local cold store, not from the central one in either Tokyo or Osaka. This procedure is very similar to that operating here in Australia.
Cultural differences made it impossible to send temperature recorders randomly within chilled cartons unannounced to end-users in Japan either direct from Australia which was the preferred method or from the central cold stores in Tokyo or Osaka. Special c:Jelivery procedures were implemented to ensure that the marked carton which contained a Tiny Tag logger was delivered and then returned by the selected end-user.
The central cold stores in Tokyo which were inspected, had good procedures for receival and unstuffing of containers and for load-out of cartons. Surface temperatures within the stores were usually well below 2°C, usually below 0°C and only "appeared" to rise to 5°C during load-out if the spikes are included in the analysis, see Graphs below. Orders were assembled on the loading dock where air temperatures were 8 to 9°C. At the cold stores in Osaka, Kobe and Fukuoka there was no refrigeration at the load-out area but large awnings provided shade. Maximum air temperatures on the days of inspection ranged from 29 to 35°C. Regional and local cold stores can be very variable with respect to the provision of refrigeration and/or shaded areas for the loading dock.
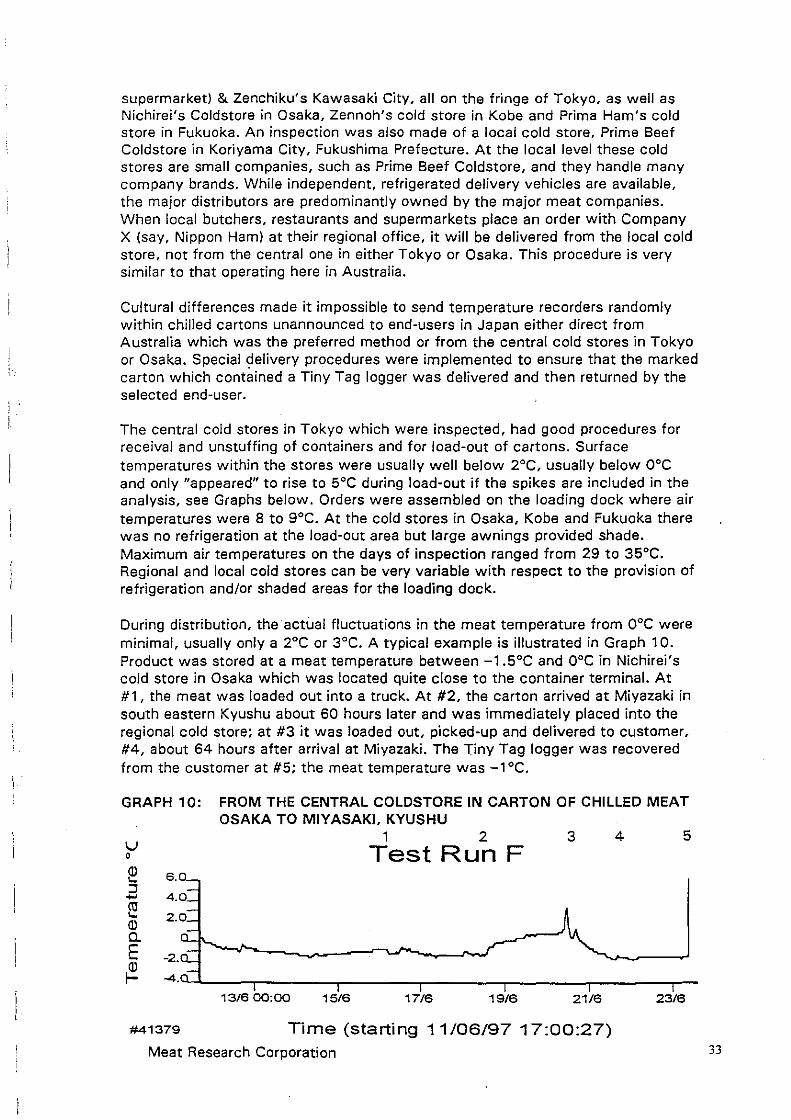
During distribution, the actual fluctuations in the meat temperature from 0°C were minimal, usually only a 2°C or 3°C. A typical example is illustrated in Graph 10. Product was stored at a meat temperature between -1.5°C and 0°C in Nichirei's cold store in Osaka which was located quite close to the container terminal. At # 1, the meat was loaded out into a truck. At #2, the carton arrived at Miyazaki in south eastern Kyushu about 60 hours later and was immediately placed into the regional cold store; at #3 it was loaded out, picked-up and delivered to customer, #4, about 64 hours after arrival at Miyazaki. The Tiny Tag logger was recovered from the customer at #5; the meat temperature was -1°C.
GRAPH 10:
v 0
~ :::; -~ Q) c. E -2.
FROM THE CENTRAL COLDSTORE IN CARTON OF CHILLED MEAT OSAKA TO MIYASAKI, KYUSHU
1 2 3 4 5 Test Run F
~ -4."'-"-~~-r-~~~~...-~~~--,~~~~-,.~~~~....,..~~~~..,...~
13/6 00:00 15/6 17/6 19/6 21/6 23/6
#41379 Time (starting 11 /06/97 17:00:27) Meat Research Corporation 33
' I.·· r-
i
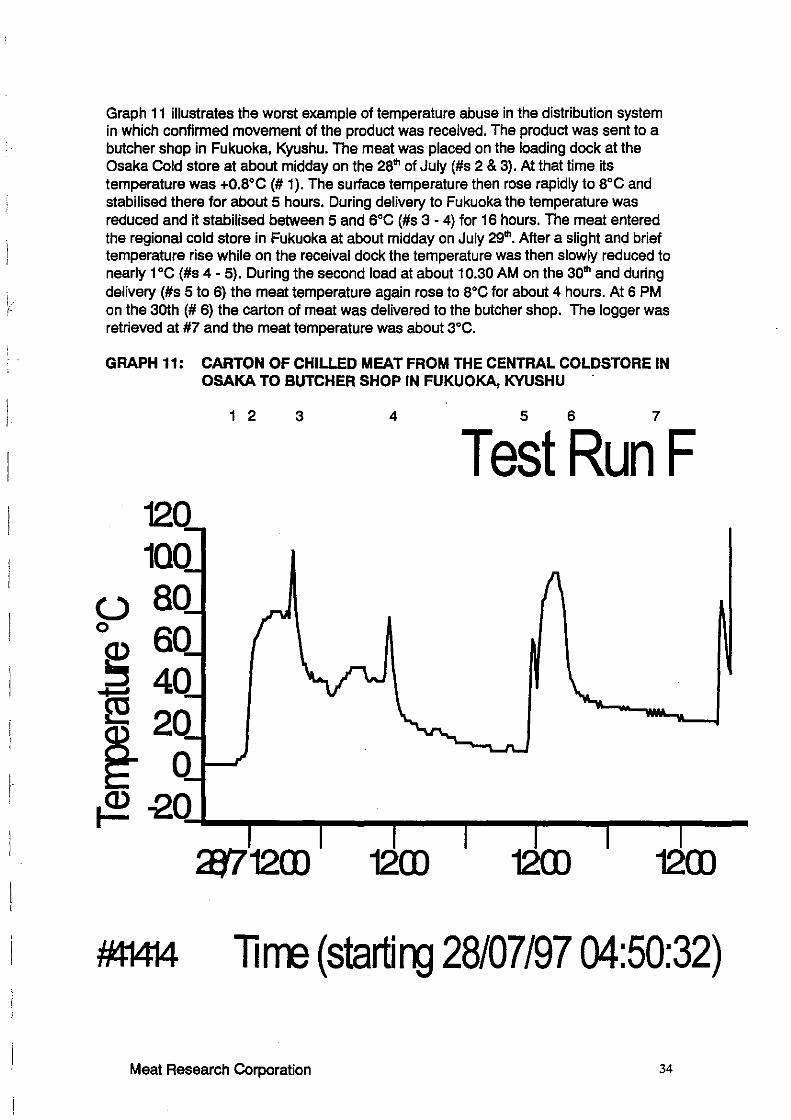
Graph 11 illustrates the worst example of temperature abuse in the distribution system in which confirmed movement of the product was received. The product was sent to a butcher shop in Fukuoka, Kyushu. The meat was placed on the loading dock at the Osaka Cold store at about midday on the 28"' of July (#s 2 & 3). At that time its temperature was +o.a•c (# 1). The surface temperature then rose rapidly to s·c and stabilised there for about 5 hours. During delivery to Fukuoka the temperature was reduced and it stabilised between 5 and 6°C (#s 3 - 4) for 16 hours. The meat entered the regional cold store in Fukuoka at about midday on July 29"'. After a slight and brief temperature rise while on the receival dock the temperature was then slowly reduced to nearly 1 •c (#s 4 - 5). During the second load at about 10.30 AM on the 30"' and during delivery (#s 5 to 6) the meat temperature again rose to s•c for about 4 hours. At 6 PM on the 3oth (# 6) the carton of meat was delivered to the butcher shop. The logger was retrieved at #7 and the meat temperature was about 3°C.
GRAPH 11: CARTON OF CHILLED MEAT FROM THE CENTRAL COLDSTORE IN OSAKA TO BUTCHER SHOP IN FUKUOKA, KYUSHU
120 100 80 60 40 20
0
1 2 3 4 5 6 7
Test Run F
~0 ............... --............. --...... --..-..... --...... --'J1712CD 12CD 12CD 12CD
#41414 lirre (startirg 28/07/97 04:50:32)
Meat Research Corporation 34
! .
i
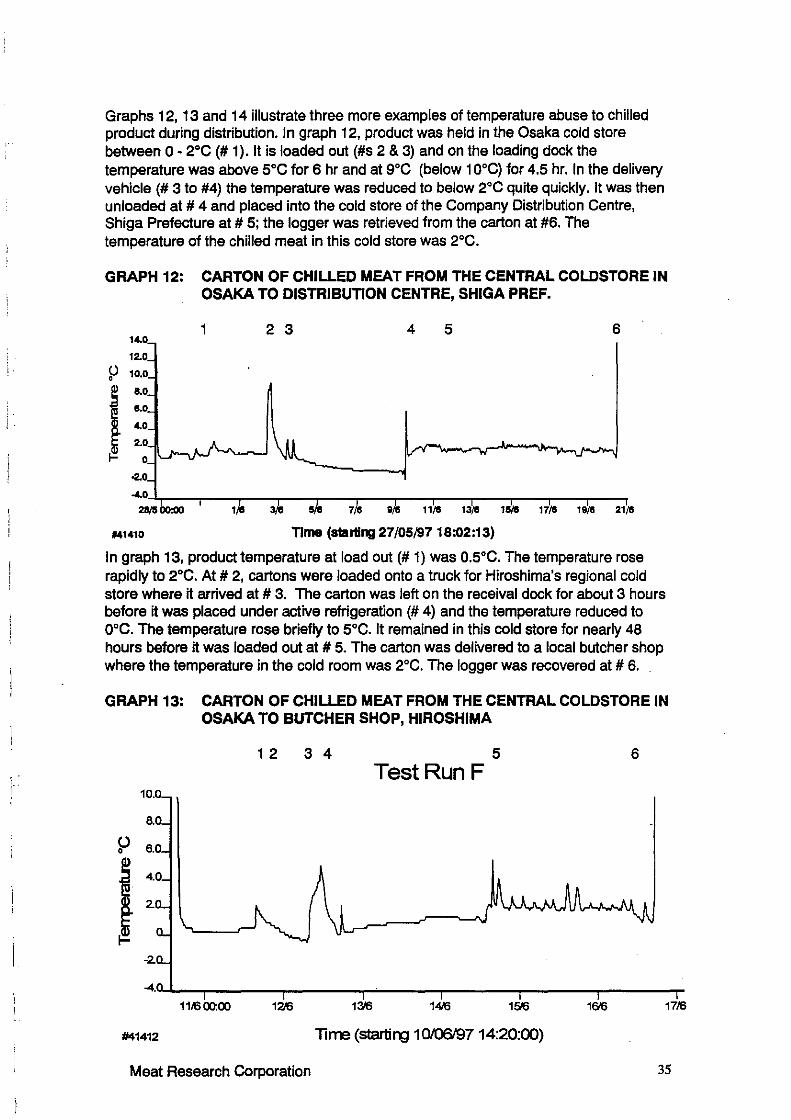
Graphs 12, 13 and 14 illustrate three more examples of temperature abuse to chilled product during distribution. In graph 12, product was held in the Osaka cold store between O - 2°c (# 1 ). It is loaded out (#s 2 & 3) and on the loading dock the temperature was above 5°C for 6 hr and at 9°C (below 10°C) for 4.5 hr. In the delivery vehicle (# 3 to #4) the temperature was reduced to below 2°C quite quickly. It was then unloaded at # 4 and placed into the cold store of the Company Distribution Centre, Shiga Prefecture at # 5; the logger was retrieved from the carton at #6. The temperature of the chilled meat in this cold store was 2°C.
GRAPH 12: CARTON OF CHILLED MEAT FROM THE CENTRAL COLDSTORE IN OSAKA TO DISTRIBUTION CENTRE, SHIGA PREF.
1 2 3 4 5 6 14.0
12.0 (.) 10.0 0
i 8.0
o.o
j 4.0
2.0
0
-2.0
-4.0
28/800:00 11/0 13/0 10/0 17/0 19/0 21/0
#41410 Time (1111111ing 27/05/97 18:02:13)
In graph 13, product temperature at load out(# 1) was 0.5°C. The temperature rose rapidly to 2°C. At # 2, cartons were loaded onto a truck for Hiroshima's regional cold store where it arrived at # 3. The carton was left on the receival dock for about 3 hours before it was placed under active refrigeration (# 4) and the temperature reduced to 0°C. The temperature rose briefly to 5°C. It remained in this cold store for nearly 48 hours before it was loaded out at # 5. The carton was delivered to a local butcher shop where the temperature in the cold room was 2°C. The logger was recovered at # 6.
GRAPH 13: CARTON OF CHILLED MEAT FROM THE CENTRAL COLDSTORE IN OSAKA TO BUTCHER SHOP, HIROSHIMA
10.
a
f? 6.0
111600.00
1 2 3 4
1216
5 Test Run F
1416 1516
#41412 lime (startirg 10/06/9714:20:00)
6
1516 1716
Meat Research Corporation 35
i.
I
I I
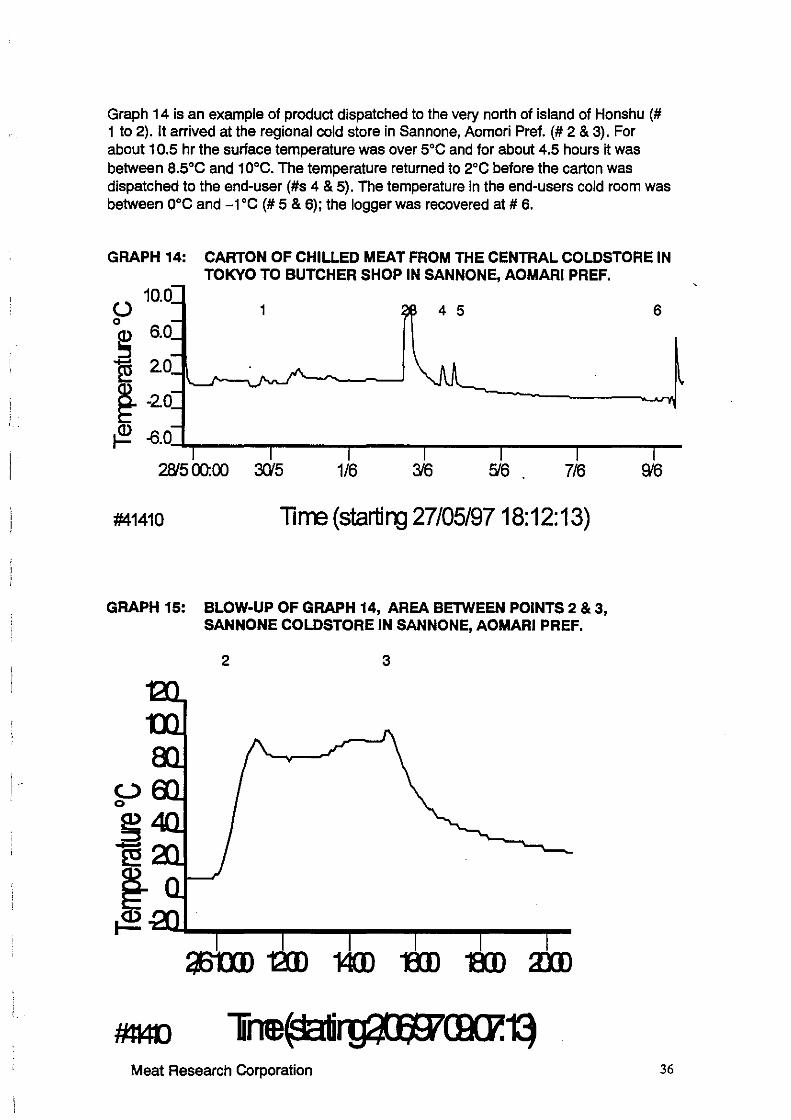
Graph 14 is an example of product dispatched to the very north of island of Honshu (# 1 to 2). It arrived at the regional cold store in Sannone, Aomori Pref. (# 2 & 3). For about 10.5 hr the surface temperature was over 5°C and for about 4.5 hours it was between 8.5°C and 10°C. The temperature returned to 2°c before the carton was dispatched to the end-user (#s 4 & 5). The temperature in the end-users cold room was between 0°c and -1°C (# 5 & 6); the logger was recovered at# 6.
GRAPH 14: CARTON OF CHILLED MEAT FROM THE CENTRAL COLDSTORE IN TOKYO TO BUTCHER SHOP IN SANNONE, AOMARI PREF.
() 10.0
1 4 5 0
6.0 ~ 1§ 2.0
~ -2.0
~ -6.0
2&'500:00 3G'5 1/6 216 5'6 716
#41410 lirre (startirg 27/05/9718:12:13)
GRAPH 15: BLOW-UP OF GRAPH 14, AREA BETWEEN POINTS 2 & 3, SANNONE COLDSTORE IN SANNONE, AOMARI PREF.
2 3
0 0
Meat Research Corporation
6
S'6
36
i •-:.
j.
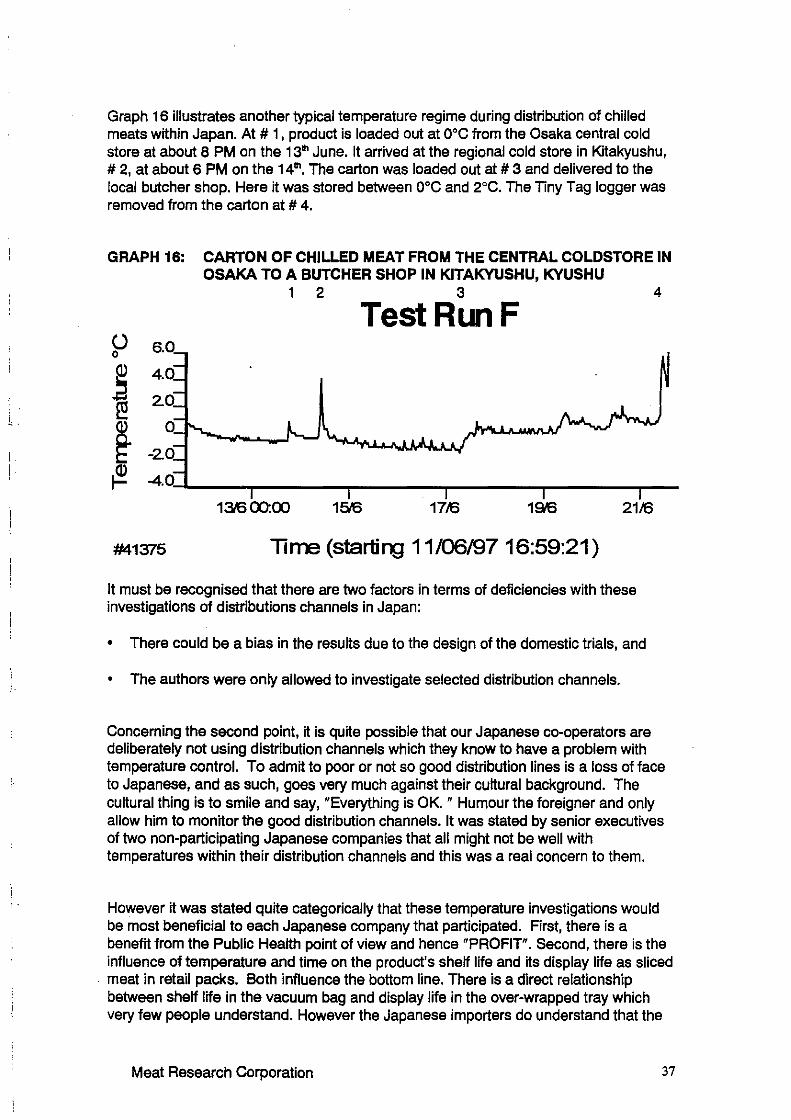
Graph 16 illustrates another typical temperature regime during distribution of chilled meats within Japan. At # 1 , product is loaded out at 0°C from the Osaka central cold store at about 8 PM on the 13111 June. It arrived at the regional cold store in Kitakyushu, # 2, at about 6 PM on the 14111• The carton was loaded out at# 3 and delivered to the local butcher shop. Here it was stored between 0°C and 2°c. The Tiny Tag logger was removed from the carton at # 4.
GRAPH 16: CARTON OF CHILLED MEAT FROM THE CENTRAL COLDSTORE IN OSAKA TO A BUTCHER SHOP IN KITAKYUSHU, KYUSHU
1 2 3 4
TestRunF u 0
~ ~
2.0
~ 0
-2.0
~ -4.0
131600:00 15'6 1716 19t'6 2116
#41375 1ime (startill;J 11/06/9716:59:21)
It must be recognised that there are two factors in terms of deficiencies with these investigations of distributions channels in Japan:
• There could be a bias in the results due to the design of the domestic trials, and
• The authors were only allowed to investigate selected distribution channels.
Concerning the second point, it is quite possible that our Japanese co-operators are deliberately not using distribution channels which they know to have a problem with temperature control. To admit to poor or not so good distribution lines is a loss of face to Japanese, and as such, goes very much against their cultural background. The cultural thing is to smile and say, "Everything is OK. " Humour the foreigner and only allow him to monitor the good distribution channels. It was stated by senior executives of two non-participating Japanese companies that all might not be well with temperatures within their distribution channels and this was a real concern to them.
However it was stated quite categorically that these temperature investigations would be most beneficial to each Japanese company that participated. First, there is a benefit from the Public Health point of view and hence "PROFIT". Second, there is the influence of temperature and time on the product's shelf life and its display life as sliced
. meat in retail packs. Both influence the bottom line. There is a direct relationship between shelf life in the vacuum bag and display life in the over-wrapped tray which very few people understand. However the Japanese importers do understand that the
Meat Research Corporation 37
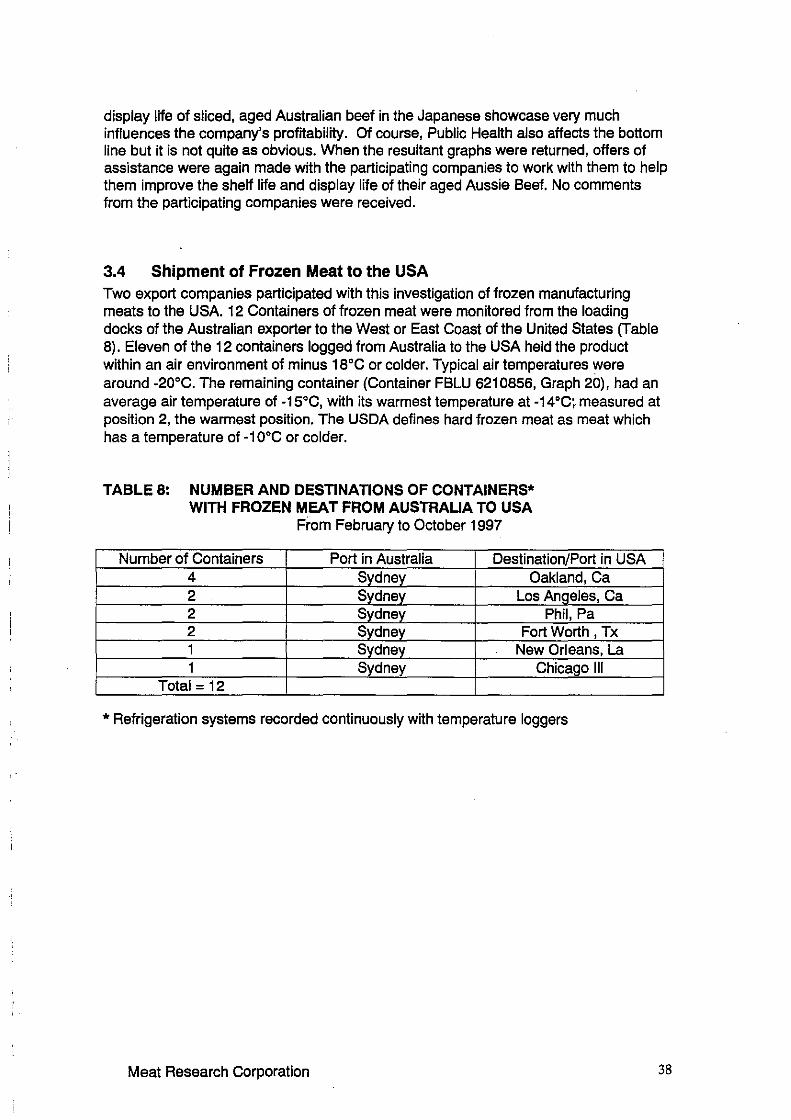
display life of sliced, aged Australian beef in the Japanese showcase very much influences the company's profitability. Of course, Public Health also affects the bottom line but it is not quite as obvious. When the resultant graphs were returned, offers of assistance were again made with the participating companies to work with them to help them improve the shelf life and display life of their aged Aussie Beef. No comments from the participating companies were received.
3.4 Shipment of Frozen Meat to the USA Two export companies participated with this investigation of frozen manufacturing meats to the USA. 12 Containers of frozen meat were monitored from the loading docks of the Australian exporter to the West or East Coast of the United States (Table 8). Eleven of the 12 containers logged from Australia to the USA held the product within an air environment of minus 18°C or colder. Typical air temperatures were around -20°C. The remaining container (Container FBLU 6210856, Graph 20), had an average air temperature of -15°C, with its warmest temperature at -14 °C; measured at position 2, the warmest position. The USDA defines hard frozen meat as meat which has a temperature of -10°C or colder.
TABLE 8: NUMBER AND DESTINATIONS OF CONTAINERS* WITH FROZEN MEAT FROM AUSTRALIA TO USA
From February to October 1997
Number of Containers Port in Australia Destination/Port in USA 4 Sydney Oakland, Ca 2 Svdnev Los Anaeles, Ca 2 Sydney Phil, Pa 2 Sydney Fort Worth , Tx 1 Svdney New Orleans, La 1 Sydney Chicago Ill
Total=12
* Refrigeration systems recorded continuously with temperature loggers
Meat Research Corporation 38
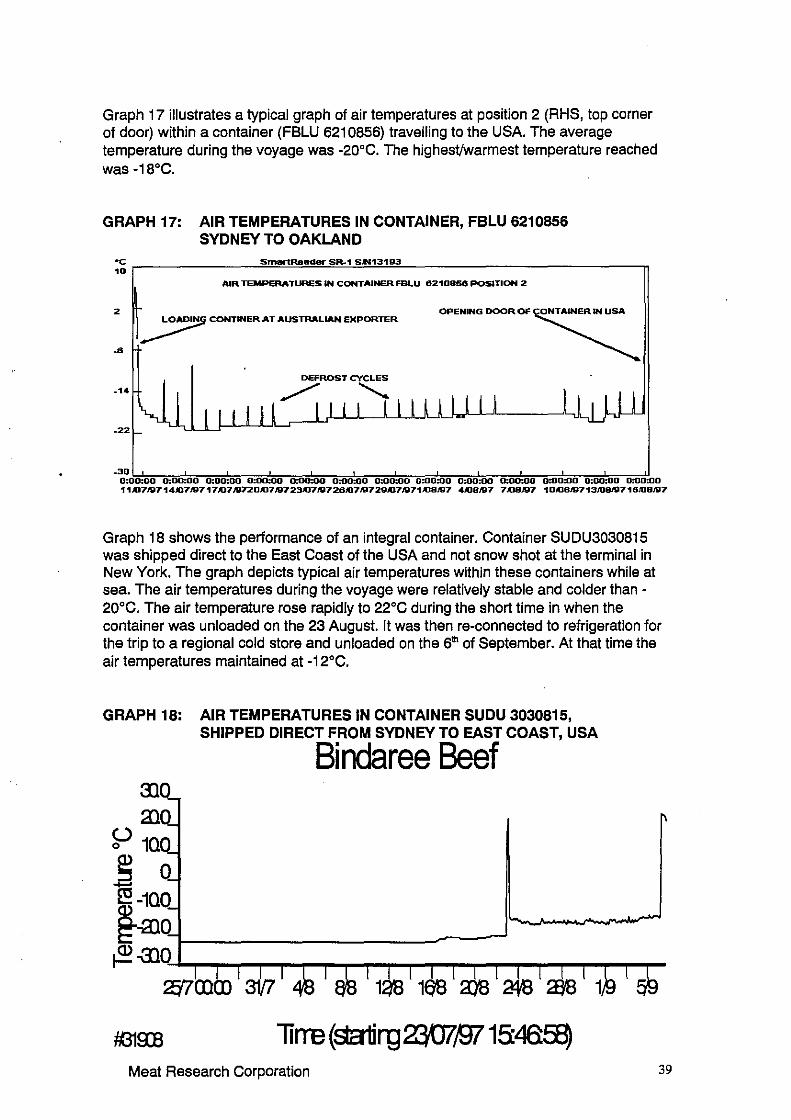
Graph 17 illustrates a typical graph of air temperatures at position 2 (RHS, top corner of door) within a container (FBLU 6210856) travelling to the USA. The average temperature during the voyage was -20°C. The highest/warmest temperature reached was -18°C.
GRAPH 17: AIR TEMPERATURES IN CONTAINER, FBLU 6210856 SYDNEY TO OAKLAND
•c SmartRaader Sft.1 SiN13193 10
AIR TEMPERATURES IN CONTAINER FBLU 6210856 POSITION 2
2 OPENING DOOR OF ~ CONTINER AT AUSTRALIAN E>CPORTER
.6
DEFROST CYCLES
.,/""' ..........
• 30 o:o°'.,,'=oo~.,,=.!MkO"'=o~o,=o.,,"'.o=o"'==· =a,a'=o~o=~"'=~o.,=o""'.,=o"'°'=.o=.,,=oo~o.,=o"'"'=o...,o=.,=o'-="'°~a,oo=<,..a~=o.,==oS· =o"'o=,u=u,"'uo"'""'o"'="'='··•o 11.0719714.0719717.07 .19720.07 197 23.4117 JD7 26.t07 .197 29.07 $71 AJ8J97 4.08197 7J08197 1 O.C8J9713I08/g716JOBJV7
Graph 18 shows the performance of an integral container. Container SUDU3030815 was shipped direct to the East Coast of the USA and not snow shot at the terminal in New York. The graph depicts typical air temperatures within these containers while at sea. The air temperatures during the voyage were relatively stable and colder than -20°C. The air temperature rose rapidly to 22°C during the short time in when the container was unloaded on the 23 August. It was then re-connected to refrigeration for the trip to a regional cold store and unloaded on the 6"' of September. At that time the air temperatures maintained at -12°c.
GRAPH 18: AIR TEMPERATURES IN CONTAINER SUDU 3030815, SHIPPED DIRECT FROM SYDNEY TO EAST COAST, USA
Bindaree Beef
lirre (s:atirg 'lJ'(Jlf.Jl 15:46:~ Meat Research Corporation 39
More examples of air temperatures during shipment to the US are discussed and illustrated in the next section 3.5 - Transport of Frozen meat within USA.
3.5 Transport of Frozen meat within USA American distribution lines were investigated from the West Coast cold stores to the Eastern and Southern Coasts of the United States as well as from New York to an enduser on the East Coast.
The shipping companies control all aspects of shipments to the USA. Under the shipping companies direction a sealed container is taken off the vessel and "transloaded". Containers usually take 4 days to reach the hub in Chicago by rail and up to 7 days for delivery by rail to the Philadelphia market on the East Coast. The quantity of C02 which is added at the West Coast facilities is designed to keep the cold chain intact to Chicago.
A major problem with the conduct of trials of any sort with the imported frozen beef market in the United States is the fact that exporters and meatworks are largely unaware of the final end-user of the product. Even more to the point, they are unaware of the eventual port of entry or the final destination. While frozen product is processed and shipped to a port nominated by the exporter or importer, this port can change almost immediately the container is packed. In one instance, the container was ordered for Canada but the destination changed to the USA East Coast within 12 hours.
In fact the shipping lines are now offering importers in the US complete flexibility. The ultimate destination for a container can be nominated as late as when the vessel arrives in the USA. Meatworks and exporters largely view USA meat shipments as commodities, which they are. This means that the product loses its identity and can be traded a number of times before the cargo arrives in the USA. It is frequently placed on board a vessel destined for the USA still unsold by the exporter and is often placed in store in the USA unsold. This appears to be most of the time and increasing with the number of incidents happening constantly, eg. currency fluctuations in SE Asia, product recalls, eg, Hudson Foods in the USA, oversupply of USA beef, etc.
North American Processing Company (Napro) is a large USA importer and distributor. They are a key supplier to most USA based hamburger chains including Burger King. They are also specialist logistic operators who assist to move product from Australia and New Zealand direct to hamburger processors as well as other meat processors in the USA. Napro is the only USA importer who has a quality assurance department with a highly skilled QA manager involved in all facets of imported meat shipment, inspection and distribution. Napro also provided an introduction to Cooltainers shipping who agreed to participate in the trials.
It is now apparent that the American distribution pattern for frozen beef has changed quite dramatically in recent years. ANZDL Line now claim to have a 28% share of the USA frozen beef trade out of Australia. Coupled with the use of the West to East Coast transfer system also used by Columbus Line and Blue Star line, it is possible that as much as 40% of imported meat is now transloaded.
The standard of cold store varied considerably within the USA. Transmode in Los Angeles was the most sophisticated. Weighmasters Murphy handled a large share of
Meat Research Corporation 40
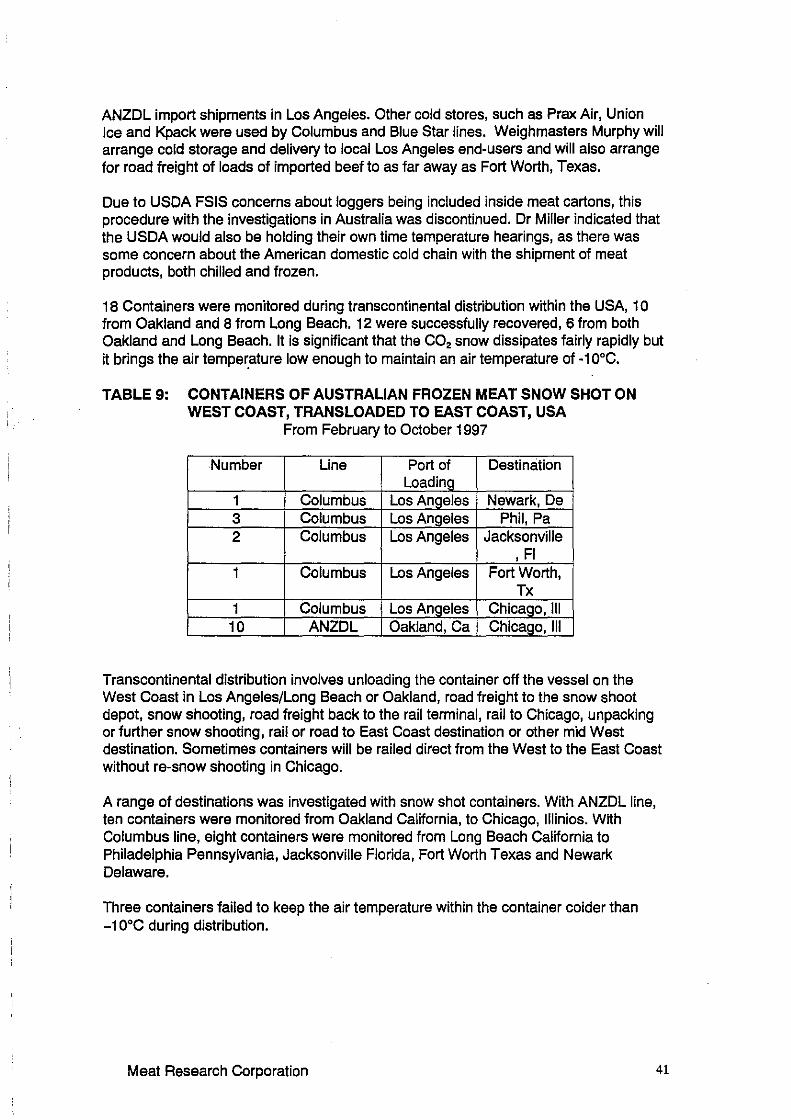
ANZDL import shipments in Los Angeles. Other cold stores, such as Prax Air, Union Ice and Kpack were used by Columbus and Blue Star lines. Weighmasters Murphy will arrange cold storage and delivery to local Los Angeles end-users and will also arrange for road freight of loads of imported beef to as far away as Fort Worth, Texas.
Due to USDA FSIS concerns about loggers being included inside meat cartons, this procedure with the investigations in Australia was discontinued. Dr Miller indicated that the USDA would also be holding their own time temperature hearings, as there was some concern about the American domestic cold chain with the shipment of meat products, both chilled and frozen.
18 Containers were monitored during transcontinental distribution within the USA, 1 O from Oakland and 8 from Long Beach. 12 were successfully recovered, 6 from both Oakland and Long Beach. It is significant that the C02 snow dissipates fairly rapidly but it brings the air temper.ature low enough to maintain an air temperature of -10°c.
TABLE 9: CONTAINERS OF AUSTRALIAN FROZEN MEAT SNOW SHOT ON WEST COAST, TRANSLOADED TO EAST COAST, USA
From February to October 1997
Number Line Port of Destination Loadina
1 Columbus Los Angeles Newark, De 3 Columbus Los Angeles Phil, Pa 2 Columbus Los Angeles Jacksonville
, Fl 1 Columbus Los Angeles Fort Worth,
Tx 1 Columbus LosAnaeles Chicaao, Ill 10 ANZDL Oakland, Ca Chicago, Ill
Transcontinental distribution involves unloading the container off the vessel on the West Coast in Los Angeles/Long Beach or Oakland, road freight to the snow shoot depot, snow shooting, road freight back to the rail terminal, rail to Chicago, unpacking or further snow shooting, rail or road to East Coast destination or other mid West destination. Sometimes containers will be railed direct from the West to the East Coast without re-snow shooting in Chicago.
A range of destinations was investigated with snow shot containers. With ANZDL line, ten containers were monitored from Oakland California, to Chicago, lllinios. With Columbus line, eight containers were monitored from Long Beach California to Philadelphia Pennsylvania, Jacksonville Florida, Fort Worth Texas and Newark Delaware.
Three containers failed to keep the air temperature within the container colder than -10°C during distribution.
Meat Research Corporation 41
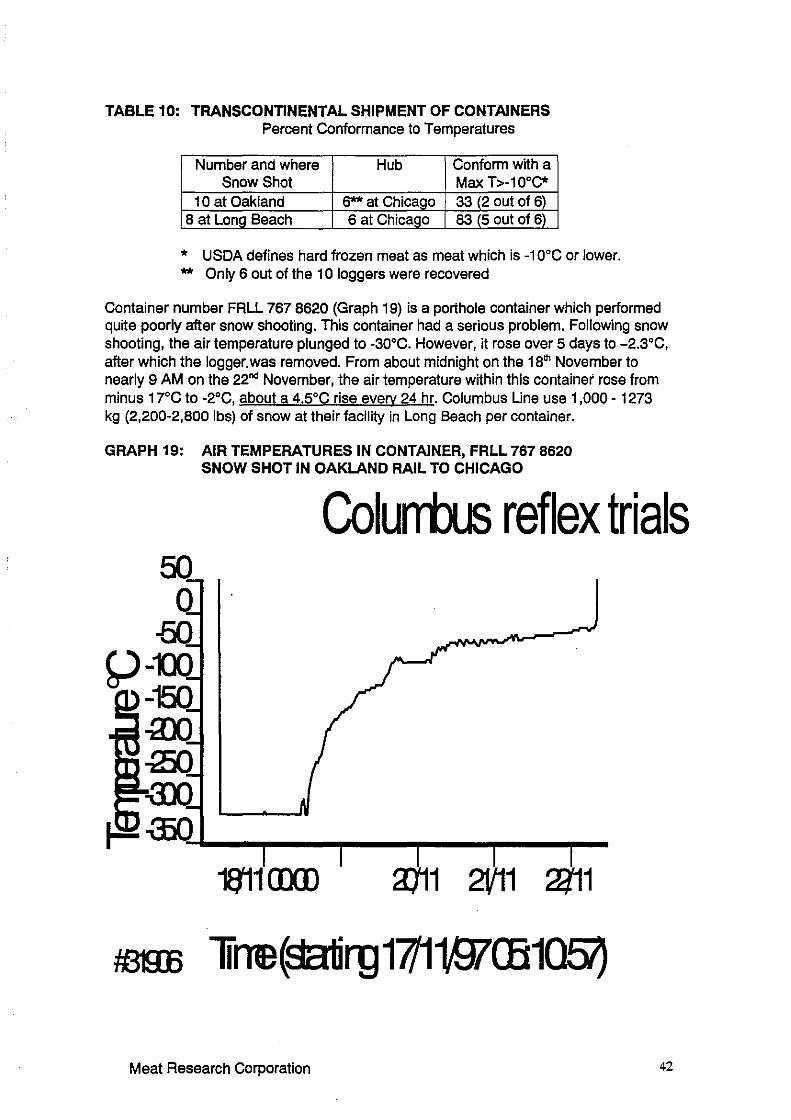
TABLE 10: TRANSCONTINENTAL SHIPMENT OF CONTAINERS Percent Conformance to Temperatures
Number and where Hub Conform with a Snow Shot MaxT>-10°C*
1 o at Oakland 6** at Chicago 33 (2 out of 6l 8 at Lona Beach 6 at Chicago 83 (5 out of 6)
* USDA defines hard frozen meat as meat which is -10°C or lower. ** Only 6 out of the 1 O loggers were recovered
Container number FALL 767 8620 (Graph 19) is a porthole container which performed quite poorly after snow shooting. This container had a serious problem. Following snow shooting, the air temperature plunged to -30°C. However, it rose over 5 days to -2.3°C, after which the logger. was removed. From about midnight on the 18'" November to nearly 9 AM on the 22nd November, the air temperature within this container rose from minus 17°C to -2°C, about a 4.5°C rise every 24 hr. Columbus Line use 1,000 - 1273 kg (2,200-2,800 lbs) of snow at their facility in Long Beach per container.
GRAPH 19: AIR TEMPERATURES IN CONTAINER, FRLL 767 8620 SNOW SHOT IN OAKLAND RAIL TO CHICAGO
Colurrbus reflex trials
2V11
/001) lirre(satirg 1mwrn1057J
Meat Research Corporation 42
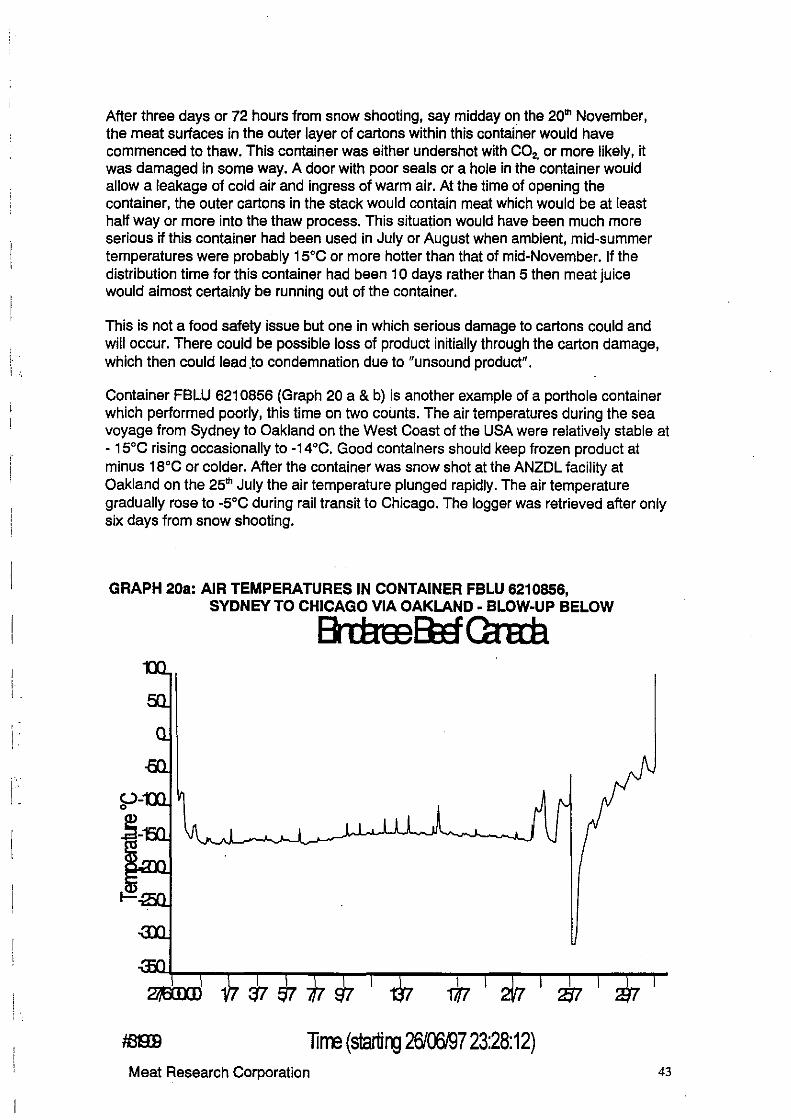
I I I.
' !
; .
After three days or 72 hours from snow shooting, say midday on the 20" November, the meat surfaces in the outer layer of cartons within this container would have commenced to thaw. This container was either undershot with C02, or more likely, it was damaged in some way. A door with poor seals or a hole in the container would allow a leakage of cold air and ingress of warm air. At the time of opening the container, the outer cartons in the stack would contain meat which would be at least half way or more into the thaw process. This situation would have been much more serious if this container had been used in July or August when ambient, mid-summer temperatures were probably 15°C or more hotter than that of mid-November. If the distribution time for this container had been 1 O days rather than 5 then meat juice would almost certainly be running out of the container.
This is not a food safety issue but one in which serious damage to cartons could and will occur. There could be possible loss of product initially through the carton damage, which then could lead .to condemnation due to "unsound product".
Container FBLU 6210856 (Graph 20 a & b) is another example of a porthole container which performed poorly, this time on two counts. The air temperatures during the sea voyage from Sydney to Oakland on the West Coast of the USA were relatively stable at • 15°C rising occasionally to • 14 °C. Good containers should keep frozen product at minus 18°C or colder. After the container was snow shot at the ANZDL facility at Oakland on the 25" July the air temperature plunged rapidly. The air temperature gradually rose to -5°C during rail transit to Chicago. The logger was retrieved after only six days from snow shooting.
GRAPH 20a: AIR TEMPERATURES IN CONTAINER FBLU 6210856, SYDNEY TO CHICAGO VIA OAKLAND· BLOW-UP BELOW
e rm:eB:Hca a:a
lirre (startirg 26/00/97 23:28:12) Meat Research Corporation 43
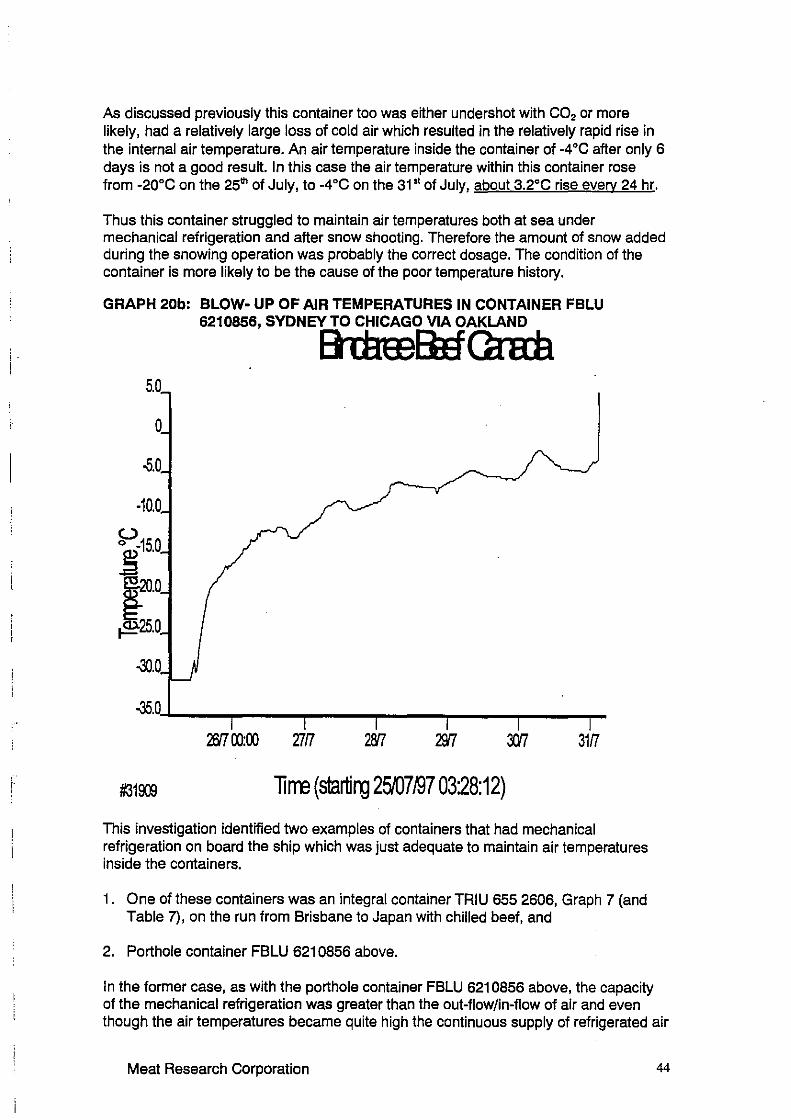
f· :
As discussed previously this container too was either undershot with C02 or more likely, had a relatively large loss of cold air which resulted in the relatively rapid rise in the internal air temperature. An air temperature inside the container of -4°C after only 6 days is not a good result. In this case the air temperature within this container rose from -20°C on the 25111 of July, to -4°C on the 31" of July, about 3.2°C rise everv 24 hr.
Thus this container struggled to maintain air temperatures both at sea under mechanical refrigeration and after snow shooting. Therefore the amount of snow added during the snowing operation was probably the correct dosage. The condition of the container is more likely to be the cause of the poor temperature history.
GRAPH 20b: BLOW· UP OF AIR TEMPERATURES IN CONTAINER FBLU 6210856, SYDNEY TO CHICAGO VIA OAKLAND
BlHeEB:Ef Cd ail 5.0
0
-5.0
-10.0 (.)
~-15.0
~20.0 ~25.0
~.a
-35.0
'ifl1 CO:OO 'llrT 28f1 22f1 m 31(1
#31003 lirre (startirg 25/07~7 03:28:12)
This investigation identified two examples of containers that had mechanical refrigeration on board the ship which was just adequate to maintain air temperatures inside the containers.
1 . One of these containers was an integral container TRIU 655 2606, Graph 7 (and Table 7), on the run from Brisbane to Japan with chilled beef, and
2. Porthole container FBLU 6210856 above.
In the former case, as with the porthole container FBLU 6210856 above, the capacity of the mechanical refrigeration was greater than the out-flow/in-flow of air and even though the air temperatures became quite high the continuous supply of refrigerated air
Meat Research Corporation 44
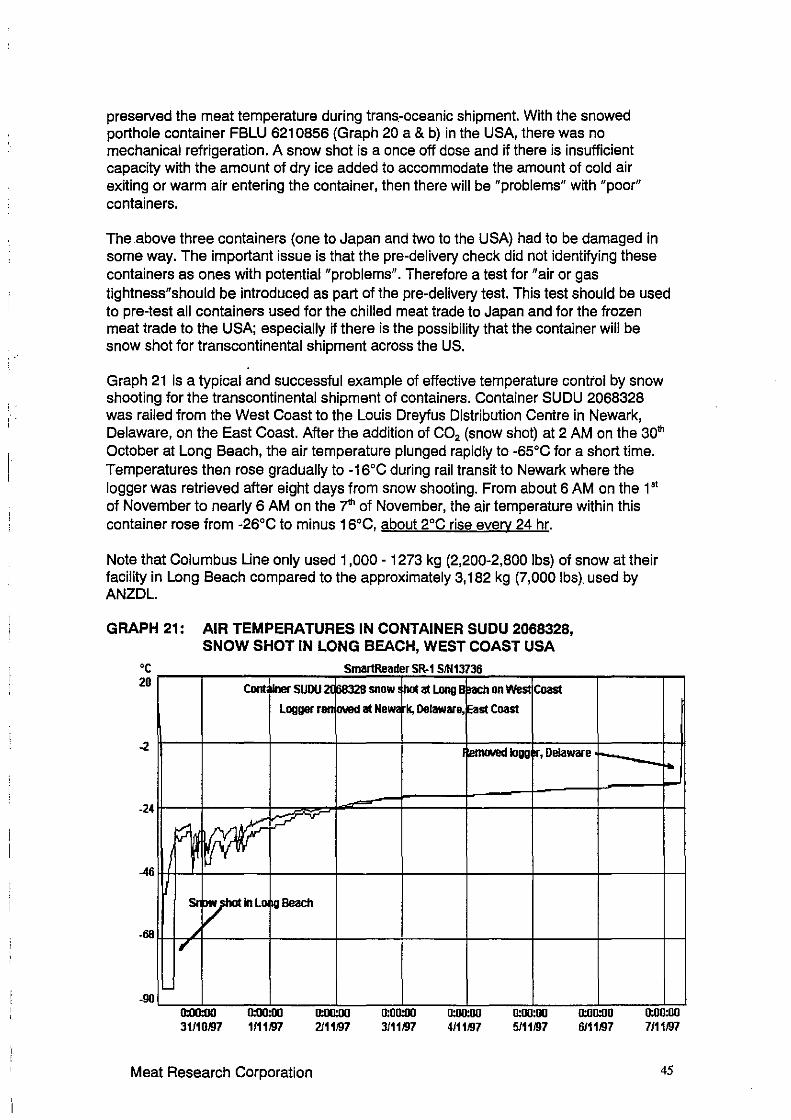
preserved the meat temperature during trans.-oceanic shipment. With the snowed porthole container FBLU 6210856 (Graph 20 a & b) in the USA, there was no mechanical refrigeration. A snow shot is a once off dose and if there is insufficient capacity with the amount of dry ice added to accommodate the amount of cold air exiting or warm air entering the container, then there will be "problems" with "poor" containers.
The.above three containers (one to Japan and two to the USA) had to be damaged in some way. The important issue is that the pre-delivery check did not identifying these containers as ones with potential "problems". Therefore a test for "air or gas tightness" should be introduced as part of the pre-delivery test. This test should be used to pre-test all containers used for the chilled meat trade to Japan and for the frozen meat trade to the USA; especially if there is the possibility that the container will be snow shot for transcontinental shipment across the US.
Graph 21 is a typical and successful example of effective temperature control by snow shooting for the transcontinental shipment of containers. Container SUDU 2068328 was railed from the West Coast to the Louis Dreyfus Distribution Centre in Newark, Delaware, on the East Coast. After the addition of C02 (snow shot) at 2 AM on the 30th October at Long Beach, the air temperature plunged rapidly to -65°C for a short time. Temperatures then rose gradually to -16°C during rail transit to Newark where the logger was retrieved after eight days from snow shooting. From about 6 AM on the 1" of November to nearly 6 AM on the ?"' of November, the air temperature within this container rose from -26°C to minus 16°C, about 2°c rise every 24 hr.
Note that Columbus Line only used 1,000 - 1273 kg (2,200-2,800 lbs) of snow at their facility in Long Beach compared to the approximately 3, 182 kg (7,000 lbs). used by ANZDL.
GRAPH 21: AIR TEMPERATURES IN CONTAINER SUDU 2068328, SNOW SHOT IN LONG BEACH, WEST COAST USA
'C SmartReaderSR-1 SJN13736 20 Cont inerSUDU21 68328snOW! ~atlongB each on Wes1 Coast
Logger r at New• k, Delaware, E•st Coast
-2 I ll!rnowd logg ~.Delaware
-24
v -,., --46
SI nw""'111nlo l{IBeach
/ -68 ,
~
-90
-
0:00:00 0:00:00 31110197 1111197
0:00:00 2111197
0:00:00 3111197
0:00:00 4111197
11:00:00 5111197
0:00:00 6111197
0:00:00 7111197
Meat Research Corporation 45
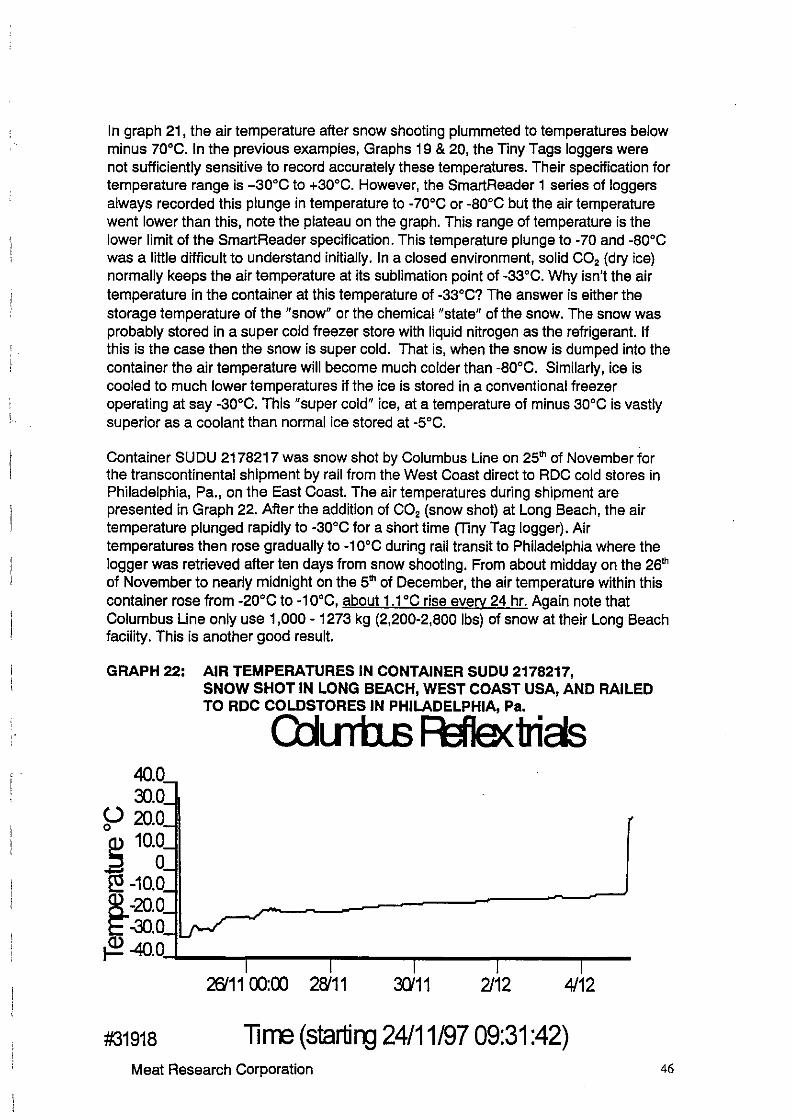
\ ..
In graph 21, the air temperature after snow shooting plummeted to temperatures below minus 70°C. In the previous examples, Graphs 19 & 20, the Tiny Tags loggers were not sufficiently sensitive to record accurately these temperatures. Their specification for temperature range is -30°C to +30°C. However, the SmartReader 1 series of loggers always recorded this plunge in temperature to -70°C or -80°C but the air temperature went lower than this, note the plateau on the graph. This range of temperature is the lower limit of the SmartReader specification. This temperature plunge to -70 and -80°C was a little difficult to understand initially. In a closed environment, solid C02 (dry ice) normally keeps the air temperature at its sublimation point of -33°C. Why isn't the air temperature in the container at this temperature of -33°C? The answer is either the storage temperature of the "snow" or the chemical "state" of the snow. The snow was probably stored in a super cold freezer store with liquid nitrogen as the refrigerant. If this is the case then the snow is super cold. That is, when the snow is dumped into the container the air temperature will become much colder than -80°C. Similarly, ice is cooled to much lower temperatures if the ice is stored in a conventional freezer operating at say -30°C. This "super cold" ice, at a temperature of minus 30°C is vastly superior as a coolant than normal ice stored at -5°C.
Container SUDU 2178217 was snow shot by Columbus Line on 25"' of November for the transcontinental shipment by rail from the West Coast direct to ADC cold stores in Philadelphia, Pa., on the East Coast. The air temperatures during shipment are presented in Graph 22. After the addition of CO, (snow shot) at Long Beach, the air temperature plunged rapidly to -30°C for a short time (Tiny Tag logger). Air temperatures then rose gradually to -10°C during rail transit to Philadelphia where the logger was retrieved after ten days from snow shooting. From about midday on the 26"' of November to nearly midnight on the 5"' of December, the air temperature within this container rose from -20°C to -10°C, about 1.1°C rise everv 24 hr. Again note that Columbus Line only use 1,000 - 1273 kg (2,200-2,800 lbs) of snow at their Long Beach facility. This is another good result.
GRAPH 22: AIR TEMPERATURES IN CONTAINER SUDU 2178217,
40.0 30.0
~ 20.0
-= 10.~ ~ -10.0 ~ -20.0 ~-30.0
SNOW SHOT IN LONG BEACH, WEST COAST USA, AND RAILED TO RDC COLDSTORES IN PHILADELPHIA, Pa.
ruuin.s F£fle<trias
~ -40.0'-'-------.------------25'11 00:00 2S'11 3G'11 2/12 4112
#31918 lirre (startirg 24/11/97 09:31 :42) Meat Research Corporation 46
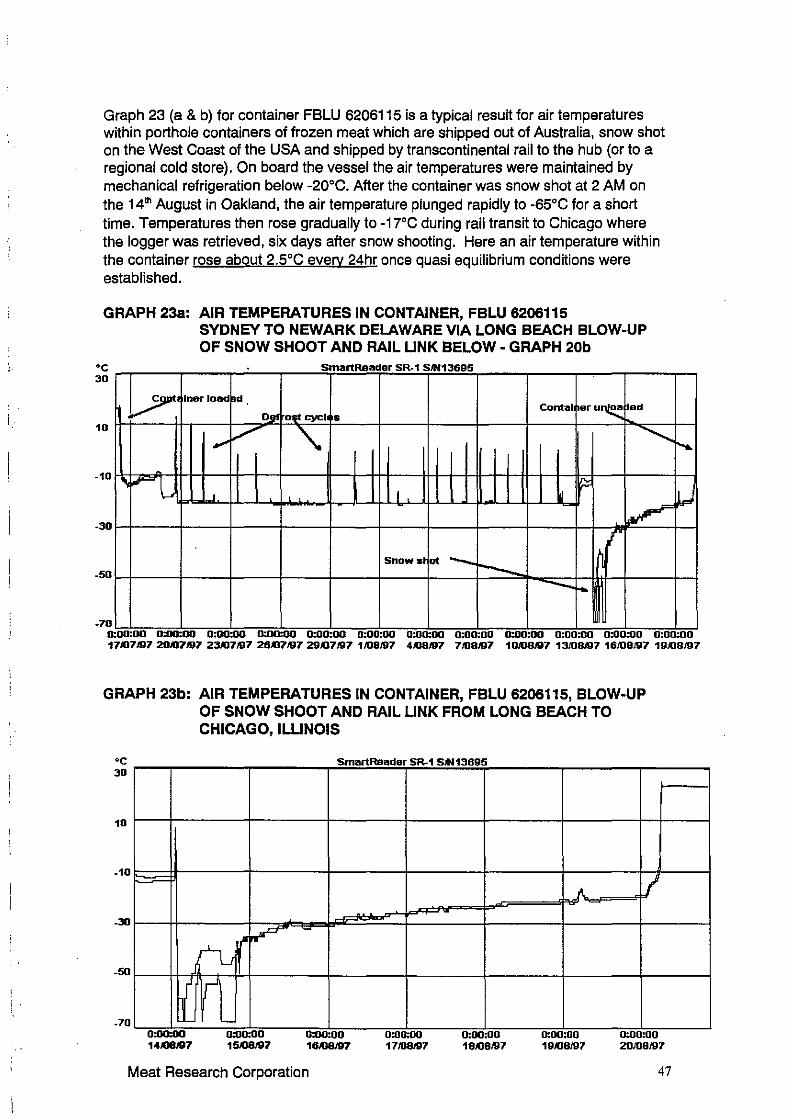
i
Graph 23 (a & b) for container FBLU 6206115 is a typical result for air temperatures within porthole containers of frozen meat which are shipped out of Australia, snow shot on the West Coast of the USA and shipped by transcontinental rail to the hub (or to a regional cold store). On board the vessel the air temperatures were maintained by mechanical refrigeration below -20°C. After the container was snow shot at 2 AM on the 14'" August in Oakland, the air temperature plunged rapidly to -65°C for a short time. Temperatures then rose gradually to -17°C during rail transit to Chicago where the logger was retrieved, six days after snow shooting. Here an air temperature within the container rose about 2.5°C everv 24hr once quasi equilibrium conditions were established.
GRAPH 23a: AIR TEMPERATURES IN CONTAINER, FBLU 6206115
•c 30
10
-10
-30
-50
-70
~· -·-(
SYDNEY TO NEWARK DELAWARE VIA LONG BEACH BLOW-UP OF SNOW SHOOT AND RAIL LINK BELOW - GRAPH 20b
SmartReader SR-1 SJN13695
Iner load Bd Contal ~eru~ led
D'" fnmcycl • ,,... / ' -...........
~
' ' ' I ,
~ I
Snow st ot - ---- ---~
.......
"""'
0.00.00 0:00:00 0:00:00 0:00:00 0:00:00 0.00.00 o:no:oo 0.00:00 0:00.00 0.00.00 0.00:00 0.00:00 17/07197 2007197 231117197 261117197 291117197 1/08197 4.0S/97 71118197 10/08197 13I081D7 16/08197 19I08197
GRAPH 23b: AIR TEMPERATURES IN CONTAINER, FBLU 6206115, BLOW-UP OF SNOW SHOOT AND RAIL LINK FROM LONG BEACH TO CHICAGO, ILLINOIS
•c 30
10
-10
-30
-50
-70 -
:'Li~ ~
-
SmartReader SR-1 S_..13695
~
-.rz-
0:00:00 141118197
0:00:00 15.oel97
0:00.00 16IOlll97
0:00:00 17/08197
0.00.00 181118197
0:00.00 191118'97
0.00.00 20/08197
Meat Research Corporation 47
Graph 18 depicted typical air temperatures within an integral container SUDU3030815, from Australia to the American cold store where it was unstuffed. It was shipped direct to the East Coast of the USA and not snow shot at the terminal. The air temperatures during the voyage were relatively stable, lower than -20°C. The air temperature rose rapidly to 22°C when the container was unloaded at New York on the 23 August. When it was re-connected to power the air temperature dropped rapidly to -20°c. During the trip from New York to the cold store where it was unloaded on the 6" of September the air temperatures remained relatively stable at -12°C. On board the ship the air temperatures ranged from minus 22°C to -20°C but after New York, the air temperatures ranged from -14°C to -12°C. Container SUDU3030815 is an integral container. The only explanation for this difference in air temperature between that on board the ship and that during overland transport by rail or road, has to be a change in the set point.
3.5.1 Amount of Snow used in snow shooting The shipping companies clearly use different amounts of C02 for snowing the containers. Dependent on the chemical "state" of the snow, liquid or solid, the snow supplier recommends to the shipping lines that they use different amounts of snow.
Columbus Line uses porthole containers where the snow is added through the porthole of the container and the doors are not opened. Columbus also stated that they used only 1,000 - 1,273 kg (2,200-2,800 lbs) per container at their Prax Air facility in Long Beach.
Here containers SUDU 2068328 (Graph 21), SUDU 2178217 (Graph 22) and FBLU 6206115 (Graph 23b) were snow shot for the transcontinental shipment by rail from the West Coast to Newark, Philadelphia and Chicago where the loggers were retrieved after eight, ten and six days respectively from snow shooting. Note that the air temperatures within these containers rose by 2°C, 1.1°c and 2.3°C respectively every 24 hr. These three examples demonstrated that a charge of 1,000 - 1,273 kg of snow in these containers was adequate for eight, ten and five days storage below -10°C respectively, if the porthole container is in good condition.
Yet container FALL 767 8620 (Graph 19) was also a porthole container, on the Columbus Line which performed quite poorly after snow shooting. In this case the increase in air temperature every 24 hr was 4.5°C, almost double the rate of container FBLU 6206115 (Graph 23b) above.
Blue Star Line stated that 1,364 kg (3,000 lbs) of snow was sufficient for 1 O days transit but no examples of containers on the Blue star line were available.
Container FBLU 6210856 (Graph 20 a & b) was also a poor porthole container which was snow shot at Oakland (ANZDL), supposedly with approximately 3, 182 kg (7,000 lbs) of snow. Yet after 6 days the air temperature inside the container was -5°C, an increase in air temperature of 3.2°C every 24 hr, with at face value, triple the amount of snow.
The shipping lines certainly have different views on the amount of snow that is required for transcontinental shipment. As part of the shipping company's QA at the snow shoot
Meat Research Corporation 48
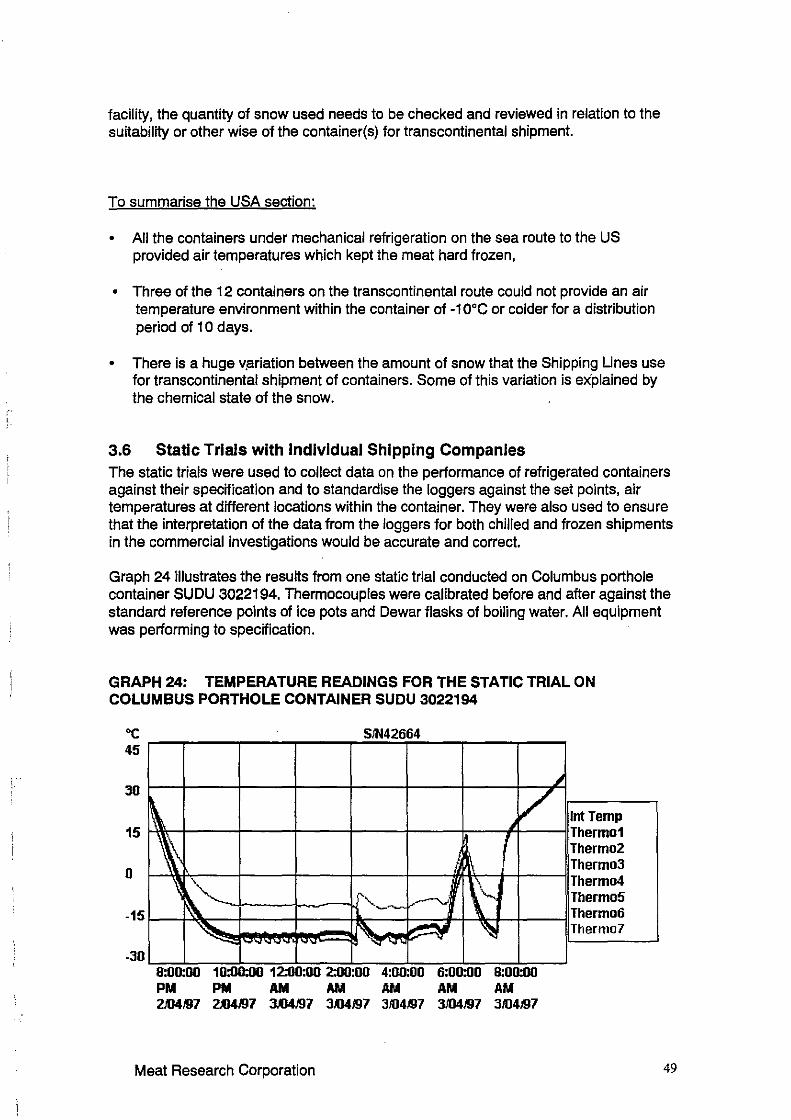
facility, the quantity of snow used needs to be checked and reviewed in relation to the suitability or other wise of the container(s) for transcontinental shipment.
To summarise the USA section:
• All the containers under mechanical refrigeration on the sea route to the US provided air temperatures which kept the meat hard frozen,
• Three of the 12 containers on the transcontinental route could not provide an air temperature environment within the container of -10°C or colder for a distribution period of 1 O days.
• There is a huge v.ariation between the amount of snow that the Shipping Lines use for transcontinental shipment of containers. Some of this variation is explained by the chemical state of the snow.
3.6 Static Trials with Individual Shipping Companies The static trials were used to collect data on the performance of refrigerated containers against their specification and to standardise the loggers against the set points, air temperatures at different locations within the container. They were also used to ensure that the interpretation of the data from the loggers for both chilled and frozen shipments in the commercial investigations would be accurate and correct.
Graph 24 illustrates the results from one static trial conducted on Columbus porthole container SUDU 3022194. Thermocouples were calibrated before and after against the standard reference points of ice pots and Dewar flasks of boiling water. All equipment was performing to specification.
GRAPH 24: TEMPERATURE READINGS FOR THE STATIC TRIAL ON COLUMBUS PORTHOLE CONTAINER SUDU 3022194
oc 45
30
15
0 ~ ~ '
S!N42664
' I
• '
~ ~, ,,....--.... ~ --15
' -30 8:00:00 PM 2JU4197
l - - - -
10:00:00 12:00:00 2:00:00 PM AM AM 2AJ4/97 3Al4197 3Al4197
Meat Research Corporation
~ ~
4:00:00 AM 3!04197
~ ~
6:00:00 AM 3Jll4197
8:00:00 AM 3Jll4197
• Int Temp Thermo1 Thermo2 Thermo3 Thermo4 Thermo5 Thermo6 Thermo7
49
Several shipping lines queried the ACOS about the relevance of these trials. They were concerned that these static trials would not be strictly valid, as they would not be carried out under controlled conditions as per those conducted by the Institute in London. They were of the opinion that we were not a recognised body and that the static trials should stop forthwith. Fortunately, several integral and porthole containers were tested prior to the ACOS terminating the trials.
The static trials, which were completed, confirmed that the porthole containers and integral refrigeration units which were investigated, were operating to specification. They also confirmed that the interpretations of logger data for both chilled and frozen shipments in the commercial investigations were accurate and correct.
A copy of the Protocol and Quality Assurance document that had been prepared for fruit by the ACOS as well as a copy of the final report on container packing prepared by Barry Johnson of AMT, were obtained.
3.7 Other Issues Through ANZDL a copy of Roy Gaynor's report on his earlier USA visit which examined missing shipping marks and associated transportation/carton damage was obtained. The report had been prepared for the AMC and was based on assistance provided by ANZDL in the USA. The report canvassed such issues as the need for shipping marks and the possibility of the marks being applied during carton bar coding in the boning room rather than at load out at the cold store via a stamp. The report also looked at the preferred method of stowing cartons in containers so as to avoid damage as well as other associated issues. Apparently, a number of container doors have been opened and cartons have fallen out due to inferior stowage of the cartons at loadout. The report provided useful data on the overall issues of transportation damage.
The Technical Committee of ACOS at a special meeting on November 24, 1997 reviewed a number of charts which were put forward for their interpretation. Lines represented at the meeting included Blue Star Line, NYK, Columbus Line, Barbican Marine, Maersk Line, and Five Star Shipping. The members stated that integral containers are occasionally turned off at sea during transit. These events are believed to be isolated and caused by bad weather at sea or electrical fires. Some of the charts for the Australia Japan sector could be interpreted that containers were re-stowed after loading of the vessels and that containers may have been placed for periods in a terminal without power.
None of the Technical committee members represented lines whose containers had showed anomalies and were reluctant to comment definitively. The members indicated the practice of "double plugging" no longer took place. Double plugging was a situation that occurred when there was insufficient container plugs on an integral container vessel and the containers were plugged in and then the plugs taken out and transferred to another container.
ACOS were asked to make available a large numbers of Partlow charts from voyages both to Japan and USA for an analysis of cold chain integrity. The lines advised that the charts are landed with the container in an overseas port and are not returned to
Meat Research Corporation 50
Australia. The agent for each line keeps the charts for five years at the port of discharge in case there is a claim. In the case of porthole containers, such as Columbus Line they remain in the vessel's custody. Columbus centrally monitor porthole containers on board the vessel from the ship's bridge and an alarm sounds if any container in off power. Similar systems are operated by Blue Star Line.
Blue Star Line advised that they do not download loggers for every single shipment but routinely check them at the time of pre-trip inspection if there was a claim.
A number of lines also mentioned that stowing above the "red line" continued to be a problem.
The lines servicing Korea complained about container damage caused by poor unloading practises of frozen quarter beef in Korea. Container walls and other fittings are constantly being damaged by unloading crews throwing heavy beef quarters during unloading. ·
This is certainly the case. After the doors are opened, crews use meat hooks and to hook the hessian covers and drag the quarters. There is no attempt to lift and carry them. The quarters tumble down onto the floor from whence they are dragged along the floor and then lifted onto a rickshaw style of cart. They are carted away and then manually dragged and stacked one on top of the other, commencing on the floor within a large room in the cold store facility. They stop depositing quarters on top of the stack when it is no longer safe to walk up the stack of frozen quarter beef and deposit more quarters on the top. Men have been killed or severely maimed when a stack of frozen quarters becomes unstable and slides.
3.7.1 Container Age Profile Survey Only four lines, Blue Star, Five Star, Columbus and Maersk replied to the survey on the age profile of the container fleet.
3.7.2 Blue Star Line: Japan integral containers 900 20ft reefers, 150 40ft high cube integral reefers 40ft containers average age is 4 years old 400 new 20ft containers and 500 average 4 years old. North America 500 integral containers 6000 porthole containers. 350 new 40ft high cube containers for carcases and south bound citrus cargo. No data was supplied on average age but integral containers are generally expected to be new and porthole containers up to several years old, with the majority late 1980s to early 1990s. Middle East All integrals (no porthole containers). 500 20ft integrals, 50 % 2.5 years old and balance 4 years old. 140 40ft high cube integrals with Carrier refrigeration units. All less than 12 months old.
Meat Research Corporation 51
3.7.3 Five Star Shipping (COSCO) Five Star Shipping replied by telephone. This line services the meat trade worldwide but focuses on Hong Kong, China, Japan and Korea as well as South East Asia. They use both 20ft and 40ft integral containers with Carrier and Mitsubishi refrigeration units. The container fleet ranges in age from 1984 until 1996 with an average of 1990/91. No container numbers were provided.
3.7.4 Columbus Line Columbus operates 6000 porthole containers in the American service and 300 20fl integral containers and 200 40ft integral containers in the same service. Columbus expects the integral fleet will continue to grow in numbers. They estimate that the average age of the 20ft porthole insulated fleet is less than 8 years old, whereas the 20ft and 40ft integral fleet would average 2 years. Columbus US containers operate with R134a and MP66 refrigerants. The newest integral containers are not fitted with Partlow charts and all relevant data is held in dataloggers in the refrigeration units.
3.7.5 Maersk Line Maersk operate 6000 20ft integral containers and around 600 45ft integrals both 8'6" and 9'6". The average fleet age is 4-5. years old, with the range from less than one year to 16 years old. Maersk containers are not dedicated in one trade lane and are used on a global needs basis. Some 40fl containers are dedicated to the Korean quarter beef trade.
3.7.6 ANZDL ANZDL operate integral containers in the USA trade and their 1 O container ships transport a total fleet of 8,000 plus containers for all cargo. No details are available for their reefer container fleet but containers as old as 1988 construction (almost 1 O years) were seen in use.
3.8 AQIS Plant Data AQIS was approached to provide detailed information on specific works with respect to a full range of USDA rejections including their description of temperature abuse called "unsound condition". Other reasons for rejection include the overall issue of transportation damage and missing shipping marks. AOIS have categorically declined to provide the data in spite of receiving a letter supporting our request for individual works data from Caroline Sparks from MAC.
For future work, AQIS should be convinced to use Confidentiality Agreements for the release of sensitive data on individual works. Confidentiality Agreements are an everyday occurrence in industry and they should work here with AQIS and the individual plants to guarantee security of the data.
A copy of selected pages from a report Project M888 was provided from the Australian Meat Council/MAC. It itemised USDA rejections due to Transportation Damage and
Meat Research Corporation 52
Joss of/or damaged Shipping Marks.
Letters from ANZDL, ACOS and other interested parties were received during this work which summarised the rejection data from the USDA. This data in various forms was available to the MRC from other sources and were attached in the Appendix in an earlier report.
3.9 AUTHOR'S NOTE: While not in the brief for this project, the importation, distribution, handling and processing of Australian Meats in Korea is an issue of Food Safety. From the author's previous experience in Korea (see MRC Report CS 156 "Processing of Frozen Australian Quarter Beef and bone-in Full Sets to Pre-packaged Meat for Retail Sale in Korea") there are two.issues of concern with Food Safety of Australian Beef in Korea.
From observations of work-practices in Korea, it is clear that new procedures and the use of mechanical aids will minimise damage to containers and make the area a safer place to work. Unloading frozen quarter beef in Korea is quite hazardous and unhygienic. Korean labourers unloading containers of frozen Quarter beef should receive training and instruction on the use of mechanical aids to minimise the amount of damage to the containers. Then the cold storage companies should be instructed/trained how to transport, carry and store quarter beef hygienically.
Within all Korean processing plants and even retail operations, there are quite serious deficiencies with respect to Food Safety during handling, thawing and processing of Australian frozen boneless & bone-in cuts and frozen quarter beef. There are many opportunities for contamination and cross contamination to take place every day, in every plant, large and small. The issues need to be quantified and demonstrated to the Koreans before a major outbreak of illness occurs and the illness can be traced to the consumption of Australian meats.
Meat Research Corporation 53
4. CONCLUSIONS
4.1 From Australia to Japan Thirty-five of the 36 integral containers logged from Australia to Japan performed basically to specification; there were some minor variations in performance. There was nothing of concern to food safety.
At the container terminals both here in Australia but mainly in Japan there were too many instances of containers being off power for up to 1 O hours with air temperatures rising to 10°C for most of that time. Some containers on board ships were also off power from time to time (up to 1 O hr in one case) for a variety of reasons, usually due to bad weather or electrical faults. Where meat temperature records were available for these cases, meat temperatures did not rise above 2°C.
4.2 Japanese Distribution System During summer some poor practices were identified at an independently owned cold store in Osaka and give rise to some concern.
Of the 32 cases, which were investigated during domestic distribution in Japan, three cases of temperature abuse are noteworthy. The first case had surface temperatures of the meat above 5°C but below 9°C for 25 hr. The two other cases had temperatures (1) over 5°C for 1 O hr (at 10°C for 4.5 hr) and (2) over 5°C for 6 hr (at 9°C but below 10°C for 4.5 hr).
While neither of the above situations is a major Food Safety issue, together they will influence shelf life and display life of vacuum packaged meats.
A repeat exercise of the 1997 summer trials in Japan should be attempted again in 1998 in much more detail with the investigator working with the cold stores through the importers to seek out those elusive "not so good" distribution channels.
It is quite possible that ltoham HO in Tokyo will cooperate directly with the author in the 1998 northern summer.
Hannan Corporation and Zenchiku would probably participate again.
Nippon will probably refuse to participate in any proposed work.
The other major distributor, Prima Ham (probably ranked No 4 meat operator in Japan) may cooperate in 1998.
Meat Research Corporation 54
4.3 From Australia to USA Eleven of the 12 containers, both integral and porthole, logged from Australia to the USA, had air temperatures colder than -20°C. Only one had air temperatures which rose to -14°C as the maximum or hottest temperature. Since USDA defines hard frozen meat as meat with a temperature of -10°C or less, all these containers performed satisfactorily.
4.4 American Distribution System Domestically in the USA, 18 containers were investigated. Of the 12 containers successfully monitored 9 held their internal air temperatures at -10°C or colder. Three had air temperatures which rose above -5°C, one in three days and two within six days. The air temperature within these three containers at the time of unloading was between -5°C and -2°C.
No damage to cartons and no loss of product due to unsound condition were found.
The quantity of snow in the snow shooting operation is very variable.
USDA stated that Australia was the best supplier of imported meat entering the United States.
A pre-delivery inspection test for "air or gas tightness" or an alternative test of porthole and integral containers which are used for the chilled meat trade to Japan and the frozen meat trade to the United States should be developed.
It will be difficult to attract interest by US importers as they typically are not hands on and rely on the shipping company to transfer the container to their nominated cold store on either East or West Coasts for inspection. Similarly it will be difficult to attract attention with the Australian exporters. As mentioned earlier in the report, Australian exporters frequently do not know and have no control over movement of containers and merely pack the container at the works and transport it to the container terminal in Australia. The product may be port marked Philadelphia or another destination but this is rarely the final destination. The cargo is routinely diverted to other destinations while the container is at sea and/or when it arrives in the USA.
Meat Research Corporation 55
5. RECOMMENDATIONS
• From data obtained and with food safety as the primary focus, a series of international seminars to recommend distribution procedures, etc, is not the preferred option,
• From this snapshot of temperatures within containers in the international chilled and frozen meat trade, awareness brochures for exporters and for the ACOS should be prepared,
• A short pamphlet or brochure translated into Japanese on the best practice for the distribution of chilled meat may be a useful information document,
• At the container terminals both here in Australia but mainly in Japan, procedures should be implemented so that containers are connected to power as soon as possible,
• Work with individ1:1al Japanese companies to improve their distribution and handling practices,
• The independently owned cold store in Osaka needs to be approached with the objective of improving their handling operations during the northern summer.
• A short brochure on the USA cold chain incorporating the inland transfer of snow shot containers,
• Resolve the "problems" either with the quantity of snow or the quality of the containers used for transcontinental shipping. The preferred approach is to work with the ACOS to develop and introduce an "air or gas tightness" test or an alternative test to the pre-delivery check-off program for containers to remove the "problem" containers from service,
• The Set Point on all integral containers to be packed with chilled meat should be pre-set to minus 1°C; the Set Point of containers with frozen beef should be set to -18°C or lower,
• Inspection of a container's Set Point must be a part of the exporter's QA program, • Exporters should check the doors on the all containers, integral and porthole, for a
tight seal, ie there should be a vacuum like hold/grip on the door when one attempts to open the doors. A check for worn rubber seals, buckled doors, etc, must be a part of the exporter's QA program,
• Do not pre-cool the container prior to loading, • Dry or wipe the water from the walls, the roof and the floor of the container before
loading commences, • Do not load cartons above the "red" load line, • When the containers are despatched, loaded, to the Australian container terminal,
terminal personnel should have "Set Points" on their "check off' of things to do, • If other researchers wish to target the reasons for USDA rejections of Australian
frozen meats for "unsound condition", then AQIS should be persuaded to be more cooperative and to make available for research purposes the confidential USDA data on specific works. Confidentiality Agreements are an everyday occurrence in industry and they should work here to guarantee security of the data.
• The 1997 summer trials in Japan should be implemented again in 1998 or in 1999 building on the experiences, contacts and procedures now established,
• In conjunction with the shipping lines, conduct more trials of the Columbus Reflex and ANZDL system in the 1998 or 1999 Northern Hemisphere summer.
• The potential Food Safety problems with Australian Beef handled, distributed and processed in Korea should be investigated.
Meat Research Corporation 56
6. EXTENSION ACTIVITIES
6.1 Containers from Australia to Japan
From this snapshot of temperatures within containers in the international chilled and frozen meat trade, awareness brochures for exporters and for the ACOS should be prepared,
With the ACOS develop and introduce an "air or gas tightness" test or an alternative test to the pre-delivery check-off program for containers to remove the "problem" containers from service.
At the container terminals both here in Australia but mainly in Japan, work with the ACOS to implement the connection of containers to power as soon as poss.ible,
6.2 Domestic Distribution within Japan From the data obtained so far and from a food safety point of view we do not recommend a series of international seminars to promote better handling/distribution procedures.
A series of meetings with discussion papers prepared from the data, particularly for individual Japanese companies and their affiliated companies involved in the Japanese distribution and cold storage could be held and follow-up work implemented.
The independently owned cold store in Osaka needs to be approached with the objective of improving their handling operations during the northern summer.
6.3 Containers from Australia to USA Eleven of the 12 containers, both integral and porthole, logged from Australia to the USA, had air temperatures colder than -20°C. Only one had air temperatures which rose to -15°C as the maximum or hottest temperature. No extension activity is required here.
6.4 Domestic Distribution within the USA It is clear that the USA trade is radically different from the Japanese trade due to the commodity nature of the business and the central role of shipping companies in delivering containers to the point of inspection.
A short brochure on the USA cold chain incorporating the inland transfer of snow shot containers may be a useful information document,
Work with the shipping lines, in particular Columbus and ANZDL the ones which were most helpful with this investigation to assist them to become leaders and to develop QA procedures for assessing the quantity of snow and the quality of the container for transcontinental shipments. In Australia the pre-delivery test which includes a test for the "air or gas tightness" or an alternative test of porthole and integral containers should be implemented as discussed above.
Meat Research Corporation 57
7. REFERENCES
Heap, R.D. Rev. Int. Froid. (1989). Design and performance of Isolated and refrigerated ISO intermodal containers.1£, 137
Heap, R.D. & Pryor G.J. 1993. Refrigerated Science and Technology Proceedings. 1.1.F - I.LR. - Commissions 81, 82, 01, 02/3. Cargo Temperatures in containerised Transport.
Dellacasa, A. 1987. Rev. Int. Froid. Refrigerated Transport by Sea.1.Q., 349.
Serine, G.R. (1982). 1.1.F - I.I.A. - Commissions 81, 82, 01, 02/3. Factors Affecting the Carriage of Heat in Containers. 255
Irving, A.A., Sharp, A.K, McPhail, N.M. and Powell, V.H. (1991). Shipment of hung chilled beef under carbon dioxide generated from dry ice: Brisbane to Japan. MAC 95/03, May 1991.
In addition, Sharp. A.K. from CSIRO at North Ryde has published a list of 12 Confidential papers concerned with the testing of refrigerated containers.
Meat Research Corporation 58