Embed Size (px)
Citation preview

34Centrum Equity Research is available on Bloomberg, Thomson Reuters and FactSet
Key ‘flow control’ of RHI; initiate with Buy We initiate coverage on Orient Refractories Ltd (ORL) with a Buy rating on the back of superior earnings trajectory vis-a-vis peers, industry leading ROIC, robust margins, brownfield expansion scope and parentage from RHI - second largest refractory producer globally. RHI’s revenue growth track record in India has been very strong (~20% CAGR) and we expect clearly articulated strategy of RHI for ORL to i) help diversify revenues and expand client base across domestic and export markets, ii) lead to new product developments through technology sharing and iii) allow further leverage of low capital and operational cost base of ORL for pursuing accelerated growth.
� Low capital and operational costs key strengths: ORL boasts of higher turnover ratios (more than double of peers’) on the back of very low capital costs and its leadership position in ‘tundish’ management of steel flow control segment with a niche in servicing mini steel mills. An existing plant of ORL spread over 27 acres with a dedicated R&D centre still has ~50% free land which ensures continuation of growth at a low capex. In addition, ORL’s gross margins are 300-600bps higher than that of domestic peers due to much larger proportion of raw material procurement from local sources.
� Focus of RHI and change in sales mix to add glow to revenue growth: RHI, in its clearly articulated strategy for ORL intends to i) double ORL’s revenues by 2020 and increase exports to emerging markets, ii) share R&D to leverage the low cost base of ORL and iii) realise complementary benefits from ORL for RHI’s existing business in India. ORL’s sales mix is likely to change with new revenue from sales to RHI group starting FY15E and growth in exports using RHI’s sales network. This will diversify ORL’s revenues, which have largely been dependent on mini steel mills with ~70% share in domestic manufactured sales. We expect overall revenue CAGR of 17.1% during FY14-17E led by robust volumes in the shaped segment.
� Superior return ratios led by operating leverage; free cash flow improving: ORL surpasses peers in terms of return ratios both at global and domestic levels due to low capital costs, locally developed R&D and strong margins in its product segment of shaped refractories. While ROE for ORL is 30%+, for other domestic peers it is below 20%. In terms of ROIC, ORL stands out with post tax ROIC of 40%+ while domestic peers have ROIC in the range of 20-25%. We see free cash flow yield improving to ~4.5% and free cash flow/EBITDA going up to 0.4x by FY17E.
� Valuation and risks – deserves premium: We expect earnings momentum to continue with an EBITDA/PAT CAGR of 15.2%/15.9% during FY14-17E led by volume growth from expansions, new revenue streams and sales support from RHI. Despite rerating in the past 9-12 months, we believe that it deserves premium to peers on fundamentals (based on our calculations of ‘justified P/BV’ – see page 14) as well as the exciting prospects on account of clear focus of its parent, RHI. We value the stock at an average of 18x P/E and 9x EV/EBITDA on FY17E earnings to arrive at a TP of Rs110. Key risks are sharp drop in margins due to change in revenue mix and extreme stress in the steel industry in India.
Target Price Rs110 Key Data
Bloomberg Code ORIENT IN
CMP* Rs87.2 Curr Shares O/S (mn) 120.1
Diluted Shares O/S(mn) 120.1
Upside 26.1% Mkt Cap (Rsbn/USDmn) 10.5/171.3
Price Performance (%)* 52 Wk H / L (Rs) 102.2/24.5
1M 6M 1Yr 5 Year H / L (Rs) 102/21.1
ORIENT IN (0.7) 48.2 229.1 Daily Vol. (3M NSE Avg.) 100524
Nifty 0.2 19.0 36.6
*as on 26 September 2014; Source: Bloomberg, Centrum Research
Shareholding pattern (%) *
Jun-14 Mar-13 Dec-13 Sep-13
Promoter 69.6 69.6 69.6 69.6
FIIs 0.0 0.4 0.0 0.2
DIIs 1.9 0.0 0.0 0.0
Others 28.4 29.9 30.4 30.2
Source: BSE, *as on 26 September 2014
Turnover(net sales/gross block) ratios superior
Source: Company, Centrum Research Estimates
ROIC well above peers
Source: Company, Centrum Research Estimates, * CY07 = FY08
Centrum vs. Bloomberg Consensus*
Particulars (Rs mn)
FY15E FY16E
Centrum BBG Var (%) Centrum BBG Var (%)
Sales 4,569 4,666 (2.1) 5,333 5,538 (3.7)
EBITDA 846 905 (6.5) 981 1,072 (8.5)
PAT 572 585 (2.2) 666 701 (4.9)
Bloomberg Consensus Centrum Target Price (Rs)
Variance (%) BUY SELL HOLD
Target Price (Rs)
4 0 0 116 110 (5.2)
*as on 26 September 2014; Source: Bloomberg, Centrum Research Estimates
Abhisar Jain, CFA, [email protected]; 91 22 4215 9928
Y/E Mar(Rs mn) Rev YoY (%) EBITDA EBITDA (%) PAT YoY (%) EPS (Rs) RoE (%) RoCE (%) P/E (x) EV/EBITDA (x)
FY13 3,606 20.0 671 18.6 414 34.3 3.4 40.4 40.5 25.3 15.7
FY14 4,035 11.9 792 19.6 528 27.7 4.4 38.4 36.9 19.8 13.1
FY15E 4,569 13.2 846 18.5 572 8.2 4.8 32.7 32.7 18.3 12.0
FY16E 5,333 16.7 981 18.4 666 16.5 5.5 30.6 30.6 15.7 10.1
FY17E 6,478 21.5 1,210 18.7 823 23.5 6.8 30.4 30.4 12.7 8.0
Source: Company, Centrum Research Estimates
7.2 7.5 7.27.6 8.0
2.7 2.8 2.9 3.0 3.1
2.5 2.3 2.3 2.4 2.6
0
2
4
6
8
10
FY13 FY14 FY15E FY16E FY17E(x)
ORL IFGL VIL
37.341.0 42.2 40.9 41.6 42.4
22.820.6 22.4 23.2
25.728.1
14.1
8.7
17.9 17.920.2
22.5
0
10
20
30
40
50
FY12 FY13 FY14 FY15E FY16E FY17E
(%)
Orient Refractories Vesuvius India (CY)
IFGL Refractories
Buy Refractories
Initiating Coverage 29 September 2014
INDIA
Orient Refractories Ltd

2 Orient Refractories Ltd
Table of Content
Low capital and operational costs key strengths .................................................................. 3
ORL boasts of higher asset turnover than peers ........................................................................................................ 3
Existing free land ensures continued growth at low capex; capacity addition underway ........................ 3
Higher gross margins due to local raw material sourcing ..................................................................................... 4
Change in sales mix and focus of RHI to add glow to growth ............................................. 5
RHI plans to double ORL’s revenue by 2020 ................................................................................................................ 5
RHI sees complimentary benefits for ORL and its unlisted subsidiaries in India ........................................... 7
RHI focussed on plant optimization, lowering costs and being closer to customers ................................. 8
Sales mix change likely – sales to RHI group and exports to drive growth ..................................................... 9
ORL’s share in large integrated steel mills can increase with RHI’s presence ............................................... 10
Superior return ratios, free cash flow improving .............................................................. 11
Return ratios well ahead of peers – benefit of low capital costs ....................................................................... 11
Free cash flow yield, cash to improve .......................................................................................................................... 11
Du Pont analysis ................................................................................................................................................................... 11
Financials .............................................................................................................................. 12
Revenue growth to be led by exports and sales to RHI group ........................................................................... 12
EBITDA growth to remain strong ................................................................................................................................... 12
Key Assumptions and Sensitivity ....................................................................................... 13
Valuation - deserves premium to peers, initiate with a buy ............................................. 14
Reason why we ascribe premium to ORL for valuation ........................................................................................ 14
Peer valuation comparison............................................................................................................................................... 15
Our stance on the overall domestic refractories space and listed stocks ...................................................... 15
Key risks to our thesis .......................................................................................................... 16
Company Background ......................................................................................................... 17
Comments on recent quarterly results ........................................................................................................................ 18
Annexure – Refractory Industry .......................................................................................... 19
About refractories – consumables for manufacturing processes with high temperatures .................... 19
Applications of refractories – largely used in steel industry for furnace linings .......................................... 20
Global refractory market size at ~US$25bn, expected to grow at ~3.5% CAGR ......................................... 21
Domestic refractory demand-supply indicates low industry growth & import pressure ........................ 22
Financials .............................................................................................................................. 23

3 Orient Refractories Ltd
Low capital and operational costs key strengths
ORL boasts of higher asset turnover than peers
ORL boasts of high asset turnover ratios which are well above that of domestic peers and also the highest at the global level. Although refractory business is ‘ low on capital costs, high on technology and is a relationship type of business’ ORL has far higher asset turnover ratios than industry as it has been able to leverage on its local technology and low cost land of 27 acres at Bhiwadi, Rajasthan for expansions in the past at a low capex. ORL’s net sales/gross block ratio is above 7x (more than twice that of domestic peers) while net sales/net fixed assets is very high at above 12x.
Exhibit 1: Net sales/Gross block well above peers for ORL Exhibit 2: Net sales/net fixed assets also very high
Source: Company, Centrum Research Estimates Source: Company, Centrum Research Estimates
Existing free land ensures continued growth at low capex; capacity addition underway
ORL has ~50% unutilised land (out of total 27 acres) at its plant at Bhiwadi and is currently expanding capacity by ~15% at a capex of ~Rs120mn. We see gross block expansion of ~50% in the next three years as RHI has plans to double the revenue of ORL by 2020. On the back of lower capital costs and leadership position of ORL in tundish and ladle management systems as part of steel flow control segment of refractories, we expect ORL to continue to invest further for revenue growth. Capacity utilization in ORL’s bread and butter segment of shaped refractories was ~100% in FY14 and thus further expansion is currently underway.
Exhibit 3: Gross block to be 1.5x by FY17E Exhibit 4: Capacity utilization high especially in shaped segment, capacity additions underway
Source: Company, Centrum Research Estimates Source: Company, Centrum Research
7.2 7.5 7.27.6
8.0
2.7 2.8 2.9 3.0 3.1
2.5 2.3 2.3 2.4 2.6
0
2
4
6
8
10
FY13 FY14 FY15E FY16E FY17E
(x)
ORL IFGL VIL
12.112.6
11.512.3 12.5
2.9 3.0 3.2 3.53.9
4.0 4.3 4.5 5.0 5.5
0
2
4
6
8
10
12
14
FY13 FY14 FY15E FY16E FY17E
(x)
ORL IFGL VIL
502540
636700
812
59 48120
80140
4
8
12
16
20
0
225
450
675
900
FY13 FY14 FY15E FY16E FY17E
(Rs mn)
Gross Block Capex % Increase in gross block (RHS)
50%
60%
70%
80%
90%
100%
110%
FY10 FY11 FY12 FY13 FY14
Shaped Unshaped
ORL’s low capital costs ensures higher operating leverage with turnover ratios more than double vs peers
ORL has large unutilised land at existing plant for brownfield expansion at a low capex

4 Orient Refractories Ltd
Higher gross margins due to local raw material sourcing
ORL enjoys higher gross margins in manufacturing as compared to other domestic peers due to much higher proportion of raw material sourced locally and lower dependence on imports. ORL is able to use more local raw materials on account of i) in house R&D support, ii) requirement of lower quality refractory products by mini mills (ORL’s main customer segment) which can be manufactured from locally available raw materials and iii) ability and expertise in recycling refractories and customising cost effective products for mini mills. Due to its strong capabilities in conversion and customizing refractory products, ORL enjoys better gross margins despite lower product realizations.
Exhibit 5: Local RM sourcing and gross margins of refractory producers (FY14)
Source: Company, Centrum Research
76.1
44.3
31.1
56.5
53.4
50.0
46
48
50
52
54
56
58
20
40
60
80
100
ORL IFGL VIL
Local RM sourcing % Gross Margins % (Manufacturing)-RHS
Gross margins for ORL are higher by 300-600bps vs peers
Change in sales mix and focus of RHI to add glow to growth
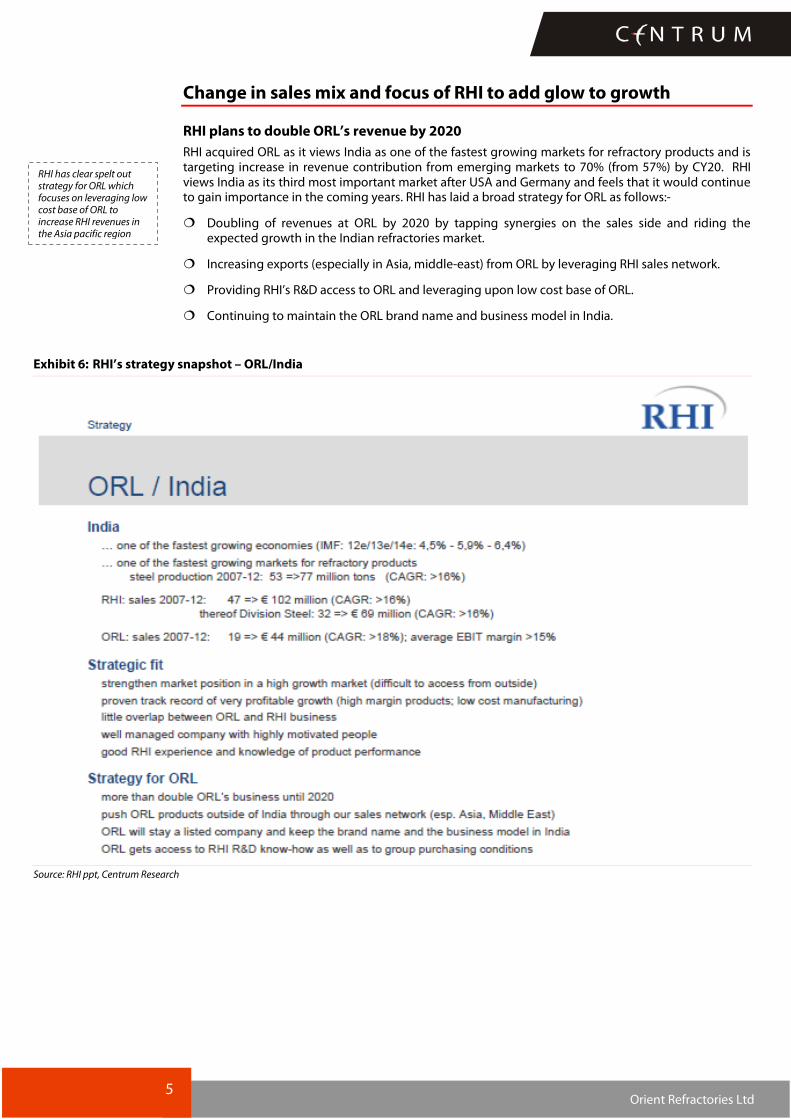
RHI plans to double ORL’s revenue by 2020 RHI acquired ORL as it views India as one of the fastest growing markets for refractory products and is targeting increase in revenue contribution from emerging markets to 70% (from 57%) by CY20. RHI views India as its third most important market after USA and Germany and feels that it would continue to gain importance in the coming years. RHI has laid a broad strategy for ORL as follows:-
Doubling of revenues at ORL by 2020 by tapping synergies on the sales side and riding the expected growth in the Indian refractories market.
Increasing exports (especially in Asia, middle-east) from ORL by leveraging RHI sales network.
Providing RHI’s R&D access to ORL and leveraging upon low cost base of ORL.
Continuing to maintain the ORL brand name and business model in India.
Exhibit 6: RHI’s strategy snapshot – ORL/India
Source: RHI ppt, Centrum Research
RHI has clear spelt out strategy for ORL which focuses on leveraging low cost base of ORL to increase RHI revenues in the Asia pacific region
5 Orient Refractories Ltd

6 Orient Refractories Ltd
RHI’s strategy - growing in emerging markets and increasing flow control sales
RHI views ORL as a strategic fit with its business and target increase in steel flow control sales through ORL. RHI drives ~16% of its revenues globally through sales in the steel flow control segment and is the second largest player behind Vesuvius PLC. ORL derives most of its revenues (>60%) from steel flow control business and has ~30% share in the domestic steel flow control market with strong presence in ladle and tundish management. RHI plans to increase its steel flow control sales to Euro400mn by CY20 (from euro290mn in CY13) by leveraging the strength of ORL and increasing revenues from emerging markets.
Exhibit 7: RHI segment wise revenue share – CY13 Exhibit 8: RHI geography wise revenue share – CY13
Source: RHI, Centrum Research Source: RHI, Centrum Research
Exhibit 9: Revenue target by RHI for flow control sales Exhibit 10: Emerging market share target increase set by RHI
Source: RHI, Centrum Research Source: RHI, Centrum Research
Lining, 47%
Steel Flow Control, 16%
Industrial, 35%
Raw Material, 2% Asia, 18%
South America & Mexico, 14%
Middle-east & Africa, 13%
Eastern Europe, 7%CIS, 5%
Western Europe, 29%
USA & Canada, 13%
Australia & Japan, 1%
290
400
0
100
200
300
400
500
CY13 CY20
(Euros mn)
57%
70%
1.8%
2.8%
1%
2%
2%
3%
3%
4%
4%
30%
40%
50%
60%
70%
80%
CY13 CY20
Emerging market share ORL Share (RHS)

7 Orient Refractories Ltd
RHI sees complimentary benefits for ORL and its unlisted subsidiaries in India
RHI sees complimentary benefits for its unlisted subs in India (RHI Clasil and RHI India Pvt Ltd) and ORL. RHI through its unlisted subs has been catering to the requirements of clients with monolithics and brick linings offered mainly through RHI Clasil and other refractory requirements of shaped/unshaped products through its import subsidiary RHI India Pvt Ltd. We see better co-ordination going ahead between the three units of RHI in India and portfolio led approach being followed for offering all kinds of refractory solutions to clients. This could lead to the sale of some shaped products (for tundish and ladle management) by ORL to RHI units while ORL could benefit by being able to bid for large turnkey projects from domestic consumers.
Exhibit 11: RHI’s refractory business units in India – synergies in store
ORL RHI India Pvt Ltd (RIPL) RHI Clasil Ltd(RCL)
Refractory products Shaped (85%), Unshaped (15%) Shaped, unshaped, monolithics Monolithics, Bricks
Company profile Low cost producer of shaped refractories
Trader of refractories Producer with focus on exports due to lower costs and port based location
Area of specialization/refractory application Tundish & ladle Trading of all types of refractories Furnace, linings
Key Strength Low costs, strong relationship with mini steel mills
Imports refractories from global RHI facilities, strong domestic customer relationships
Low cost export base, port based location
Turnover * Rs4035mn (FY14) Rs977mn (FY11) Not available
RHI Stake 69.6% 60.0% 53.7%
Source: Company, Centrum Research, * Combined turnover of RHI Clasil and RHI India pvt Ltd was ~Rs7.5bn in CY13
Our analysis of RHI’s geography-wise revenue break-up points towards sharp increase in revenues from India (refer exhibits 12, 13 below) and more than doubling of the revenue share from India in the past 5 years while revenues from other geographies have remained largely stagnant (except US & China). RHI has mentioned in its CY13 annual report about India becoming its third most important market after US and Germany and views it as one of the fastest growing markets in refractories business globally.
Exhibit 12: RHI’s sales* from India has grown fastest Exhibit 13: RHI’s revenue share from India has increased
Source: RHI annual reports, Centrum Research, *indexed to 100 in CY08 Source: RHI annual reports, Centrum Research
50
100
150
200
250
CY08 CY09 CY10 CY11 CY12 CY13
RHI geography wise revenue trend
US Germany India Mexico
Italy China Canada Russia
8.6
10.5
3.5
6.7
6.5
3.5
5.4
3.6
8.9
8.8
7.3
6.0
5.3
5.1
3.9
2.9
0
2
4
6
8
10
12
US
Germany
India
Mexico
Italy
China
Canada
Russia
(%)
RHI geography wise revenue share - %
CY08 CY13
RHI has two other unlisted companies in India with a combined turnover of ~Rs8bn and views the acquisition of ORL as complementary to RHI’s existing business

8 Orient Refractories Ltd
RHI focussed on plant optimization, lowering costs and being closer to customers
RHI in its CY13 annual report has stated its operational strategy: “In order to stay competitive in the market in the long term, all business processes have to be adapted continuously in order to better serve the customer and to optimize costs. In addition, it is necessary to adjust production capacities and to bring them closer to the customer to ensure shorter lead times, to keep the required working capital low and to optimize transport and logistics costs”. In line with the above stated strategy, RHI closed one of its largest production facilities in Europe (Duisburg, Germany) in CY13 due to weak capacity utilization and lower growth rates in Europe. This was done to ensure better utilization of the production facilities and a corresponding reduction of fixed costs.
We see RHI focussing on growth from its plants which have lower costs and present in/close to high growth markets and thus see immense growth opportunities for ORL as costs are one of the lowest globally and RHI is looking to increase its revenue share from emerging economies. We also note that combined revenue of RHI’s two unlisted subs in India has grown at a CAGR of ~20% during CY09-13. This points to the focus of the group on the Indian market which provides low cost advantage and faster growth and hence we believe that ORL is set to play a major role in RHI’s growth from India going forward.
Exhibit 14: Revenue of RHI’s two unlisted subs have grown at ~20% CAGR during CY09-CY13
Source: RHI annual reports, Centrum Research
0
1000
2000
3000
4000
5000
6000
7000
8000
CY09 CY10 CY11 CY12 CY13
(Rs mn)
We note that RHI’s revenue in India has grown at a CAGR of ~20% during CY09-13. This points to the focus of the group on the Indian market which provides low cost advantage and faster growth and hence we believe that ORL is set to play a major role in RHI’s growth from India going forward

9 Orient Refractories Ltd
Sales mix change likely – sales to RHI group and exports to drive growth
ORL’s sales mix is likely to change with new revenue segment through sales to RHI group starting from FY15E (management has guided for finalization of RHI’s sourcing plans by Nov’14) and likely growth in exports through leverage from sales network of RHI. We expect sales to RHI group to comprise ~12% of ORL’s sales by FY17E. Exports are expected to grow at 15% CAGR over FY14-17E and form ~15% of sales in FY17E. We expect net sales CAGR of 17.1% during FY14-17E and new revenue streams and increased supplies to large steel mills to help diversify the revenues of ORL (which have long been largely dependent on mini steel mills). ORL specializes in supplying shaped products for tundish management and we expect strong sales trajectory to continue in the shaped segment led by robust volumes.
Exhibit 15: New revenue stream by sale to RHI group Exhibit 16: Export sales growth to be maintained
Source: Company, Centrum Research Estimates Source: Company, Centrum Research Estimates
Exhibit 17: Strong volumes and sales trajectory in shaped segment to continue
Exhibit 18: Manufactured sales to remain at ~85%, growth to accelerate from FY16E
Source: Company, Centrum Research Estimates Source: Company, Centrum Research Estimates
3025 3385 3571 39734739
580650 748
860
989
00
250500
750
36064035
4569
5333
6478
0
1000
2000
3000
4000
5000
6000
7000
FY13 FY14 FY15E FY16E FY17E
(Rs mn)
Domestic Export Sales to RHI group
580650
748860
989
25.8
12.115.0 15.0 15.0
0
5
10
15
20
25
30
0
200
400
600
800
1000
1200
FY13 FY14 FY15E FY16E FY17E
(%)
(Rs mn)
Exports YoY %
5000
10000
15000
20000
25000
30000
200
1200
2200
3200
4200
5200
6200
FY12 FY13 FY14 FY15E FY16E FY17E
(tonne)
(Rs mn)
Shaped Sales (LHS) Unshaped Sales (LHS)
Shaped Volumes (RHS) Unshaped Volumes (RHS)
26503245
36164098
4827
5956
8.022.5
11.413.3 17.8
23.4
82.6 83.4 83.2 83.4 84.2 85.5
0
20
40
60
80
100
0
1000
2000
3000
4000
5000
6000
7000
FY12 FY13 FY14 FY15E FY16E FY17E
(%)
(Rs mn)
Manufacturing Sales - LHS YoY growth % % share in total
Sales mix diversification on the cards with new revenue stream by way of sales of RHI group.

10 Orient Refractories Ltd
ORL’s share in large integrated steel mills can increase with RHI’s presence
ORL’s manufacturing sales are primarily to mini steel mills as it has i) strong relations with small steel plants with more than 250 people deployed on customer sites and 8 sales offices across India, ii) niche in supplying low cost and effective refractories customised to the demand of small mills (including recycled refractories as per customer demand) and iii) local raw material availability and in house technology suited to cost effective specialized products. Mini steel mills account for ~70% of ORL’s manufacturing sales in the domestic market and ~50% of overall turnover (including exports and trading). ORL’s sales to large integrated steel mills is ~30% of its domestic manufactured sales but is expected to gradually increase with the ownership of the company going to RHI as they have strong relations with big integrated mills.
We expect the share of integrated steel mills in the overall steel production to increase gradually as most new plant commissioning’s are expected from big steelmakers and hence believe that ORL’s sales to large mills will increase while its niche with mini steel mills would largely be maintained as other domestic peers are not focused on mini steel mills due to lower margins.
We note that ORL has maintained a strong earnings track record in line or above peers despite over dependence on mini mills. We believe that revenue diversification of ORL through higher sales to large steel mills and RHI group is a positive sign as we expect much higher growth from large mills while mini steel mills are struggling with stable raw material supplies and lower margins. We also note that receivables risk is almost negligible with larger steel mills although ORL has not faced any major issue on receivables from mini steel mills in the past.
Exhibit 19: Integrated steel mills share rising in domestic steel production
Exhibit 20: ORL’s manufacturing sales to large integrated mills low
Source: Company, Centrum Research Estimates Source: Company, Centrum Research Estimates
Exhibit 21: ORL has shown strong earnings track record
Net Sales CAGR - % EBIT CAGR - %
3 year 5 year 10 year 3 year 5 year 10 year
Vesuvius 10.7 11.1 16.2 9.8 15.0 13.5
ORL 14.2 13.9 18.5 20.0 12.5 18.0
IFGL 15.8 14.4 13.4 38.0 9.0 11.0
Source: Company, Centrum Research
6976
82 85 8995
101
34 37 39 43 48 54 61
49
49
48
51
54
57
60
40
45
50
55
60
65
0
20
40
60
80
100
120
FY11 FY12 FY13 FY14 FY15E FY16E FY17E
(%)
(MT)
Steel Production Large Integrated steel mills
% share of integrated mills - RHS
30%
65%
90%
0%
20%
40%
60%
80%
100%
ORL IFGL Vesuvius
ORL’s over dependence on mini steel mills could reduce with higher sales to large integrated steel mills

11 Orient Refractories Ltd
Superior return ratios, free cash flow improving
Return ratios well ahead of peers – benefit of low capital costs
ORL surpasses peers in terms of return ratios both at global and domestic levels due to its low capital costs, locally developed R&D and strong margins in its product segment. While ROE for ORL is 30%+, other domestic peers lag far behind with figures below 20%. In terms of ROIC also, ORL stands out with post tax ROIC at 40%+ while domestic peers have ROIC in the range of 20-25%.
Exhibit 22: ROE well above peers globally Exhibit 23: ROIC (post tax) much higher than peers
Source: Company, Centrum Research Estimates Source: Company, Centrum Research Estimates
Free cash flow yield, cash to improve
We see free cash flow yield improving to ~4.5% and free cash flow/EBITDA going up to 0.4x by FY17E. Balance sheet remains strong and we expect the cash/share to be at Rs6 by FY17E as capex requirements would remain on the lower side due to brownfield expansions at lower capital costs.
Exhibit 24: Free cash flow to improve Exhibit 25: Free cash flow yield of 4.5% in FY17E
Source: Company, Centrum Research Estimates Source: Company, Centrum Research Estimates
Du Pont analysis
ORL’s Du Pont analysis shows the reasons for strong ROE are on account of stability in margins and sound operating efficiency (high asset turnover ratio). ORL is almost debt free and financial leverage is low with equity multiplier ratio at ~1x. We see margins remaining strong and operating leverage is expected to stay robust.
Exhibit 26: Du Pont analysis of ORL’s ROE
FY12 FY13 FY14 FY15E FY16E FY17E
PAT / Sales (X) 0.10 0.11 0.13 0.13 0.12 0.13
Sales / Assets (X) 3.2 3.3 2.8 2.6 2.4 2.4
Assets / Equity (X) 1.2 1.1 1.0 1.0 1.0 1.0
ROE (%) 41.1 40.4 38.4 32.7 30.6 30.4
Source: Company, Centrum Research Estimates
0
10
20
30
40
50
60
CY11/FY12 CY12/FY13 CY13/FY14 CY14/FY15E CY15/FY16E
(xxx)
Orient Refractories (FY) Vesuvius India IFGL Refractories (FY) Vesuvius PLCRHI AG Cie de St-GobainMagnesita Refratarios SA
37.341.0 42.2 40.9 41.6 42.4
22.820.6
22.4 23.225.7
28.1
14.1
8.7
17.9 17.920.2
22.5
0
10
20
30
40
50
FY12 FY13 FY14 FY15E FY16E FY17E(%)
Orient Refractories Vesuvius India (CY) IFGL Refractories
(100)
0
100
200
300
400
500
600
700
FY12 FY13 FY14 FY15E FY16E FY17E
(Rs mn)
OCF Capex Free Cash Flow
0.3
0.4
0.4
0.5
0.5
0.6
0.6
2.0
2.5
3.0
3.5
4.0
4.5
5.0
FY12 FY13 FY14 FY15E FY16E FY17E(x)
Free Cash Flow yield Free Cash Flow/EBITDA (RHS)
ROE for ORL is strong and though we expect moderation going ahead it is on account of increasing cash and capex

12 Orient Refractories Ltd
Financials
Revenue growth to be led by exports and sales to RHI group
We expect net sales CAGR of 17.1% for ORL during FY14-17E. This is expected to be led by ~19% CAGR in revenues from the shaped segment which would in turn be driven by sales to existing domestic customers and to the RHI group (new revenue stream). Exports are expected to grow at 15% CAGR during the period.
Exhibit 27: Net sales CAGR of 11.2% during FY14-17E
Source: Company, Centrum Research Estimates
EBITDA growth to remain strong
Backed by strong revenue traction, we expect EBITDA CAGR of 15.2% during FY14-17E. Margins are expected to moderate slightly as we expect sales to RHI group to fetch lower margins (management has guided for arm’s length transfer pricing in sales made to RHI group entities). We also expect ORL’s supplies to large integrated mills increasing which might lead to higher imported (high quality) raw materials and lower margins due to competition from domestic peers like Vesuvius and IFGL. We expect margin of 18.5% as compared to 19.6% in FY14.
Exhibit 28: EBITDA margin to remain strong despite moderation
Source: Company, Centrum Research Estimates
3,004 3,606
4,035 4,569 5,333
6,478
22.4
20.0
11.9
13.2
16.7
21.5
11
13
15
17
19
21
23
200
1,200
2,200
3,200
4,200
5,200
6,200
7,200
FY12 FY13 FY14 FY15E FY16E FY17E
(%)
(Rs mn)
Net Sales (Rs mn) YoY % (RHS)
484
671
792
846
981
1,210
16.1
18.6
19.6
18.518.4
18.7
15
16
17
18
19
20
200
400
600
800
1,000
1,200
1,400
FY12 FY13 FY14 FY15E FY16E FY17E
(%)
(Rs mn)
EBITDA (Rs mn) EBITDA Margin - %

13 Orient Refractories Ltd
Key Assumptions and Sensitivity
Exhibit 29: Key Assumptions
(Rs mn) FY12 FY13 FY14 FY15E FY16E FY17E
Shaped Refractories 2,254 2,756 3,136 3,586 4,258 5,324
Unshaped Refractories 397 489 481 512 570 631
Total Manufacturing Sales 2,650 3,245 3,616 4,098 4,827 5,956
Trading Sales 495 567 657 736 824 923
Sale of Services 63 68 68 71 75 78
Exports 461 580 650 748 860 989
Exports - % share 15.4 16.1 16.1 16.4 16.1 15.3
Source: Company, Centrum Research Estimates
Exhibit 30: EPS sensitivity to shaped refractory segment
EPS - FY16E (Rs) Realizations
-10% -5% Base 5% 10%
Volu
mes
-10% 4.2 4.5 4.8 5.2 5.5
-5% 4.5 4.9 5.2 5.5 5.9
Base 4.8 5.2 5.5 5.9 6.3
5% 5.2 5.5 5.9 6.3 6.7
10% 5.5 5.9 6.3 6.7 7.0
Source: Centrum Research Estimates
Exhibit 31: EPS sensitivity to unshaped refractory segment
EPS - FY16E (Rs) Realizations
-10% -5% Base 5% 10%
Volu
mes
-10% 5.4 5.4 5.5 5.5 5.5
-5% 5.4 5.5 5.5 5.5 5.6
Base 5.5 5.5 5.5 5.6 5.6
5% 5.5 5.5 5.6 5.6 5.7
10% 5.5 5.6 5.6 5.7 5.7
Source: Centrum Research Estimates
14 Orient Refractories Ltd
Valuation - deserves premium to peers, initiate with a buy
Reason why we ascribe premium to ORL for valuation
To value ORL and ascribe a justified premium/discount to other domestic peers (Vesuvius and IFGL are under our coverage already), we calculate the justified P/BV for the company (on the basis of trailing P/E and Gordon growth model formulas) and compare the same with other two domestic refractory peers. We note that based on FY17E ROE, the justified P/BV for ORL stands almost double that of justified P/BV of Vesuvius and IFGL.
Exhibit 32: Justified P/BV calculations shows premium for ORL
ORL Vesuvius IFGL
FY17E ROE (%) 30.4 16.2 17.2
Long term growth rate (g) 3.0 3.0 3.0
Cost of Equity (Ke) 15.0 15.0 15.0
Justified P/BV = (ROE - g)/(Ke-g) 2.3 1.1 1.2
Source: Company, Centrum Research Estimates
We have undertaken the above exercise not to ascribe the P/BV multiples to the stocks as valuations for the refractories sector are driven by many other factors such as i) consistent and non-cyclical growth trends from leading domestic companies in the last decade, ii) MNC parentage and technological capabilities, iii) customer relationships and experience, and iv) expected uptick in domestic steel industry going ahead. However, the above exercise helps us in concluding that ORL deserves premium to domestic peers on fundamentals. Also, since ORL is now owned by MNC parent RHI (global leader in refractories just behind Vesuvius PLC) we expect the company to benefit tremendously through faster revenue growth as well as much needed revenue diversification (reduced dependence on mini mills). Leadership position of ORL in tundish management in domestic steel flow control segment coupled with technological support from RHI and low cost base are further positives. We have been concerned on the high share of revenues from mini mills for ORL but believe that as revenue diversification is expected to happen going forward and ORL has an impressive track record in generating strong margins and returns through supply to mini mills, the concerns are largely addressed.
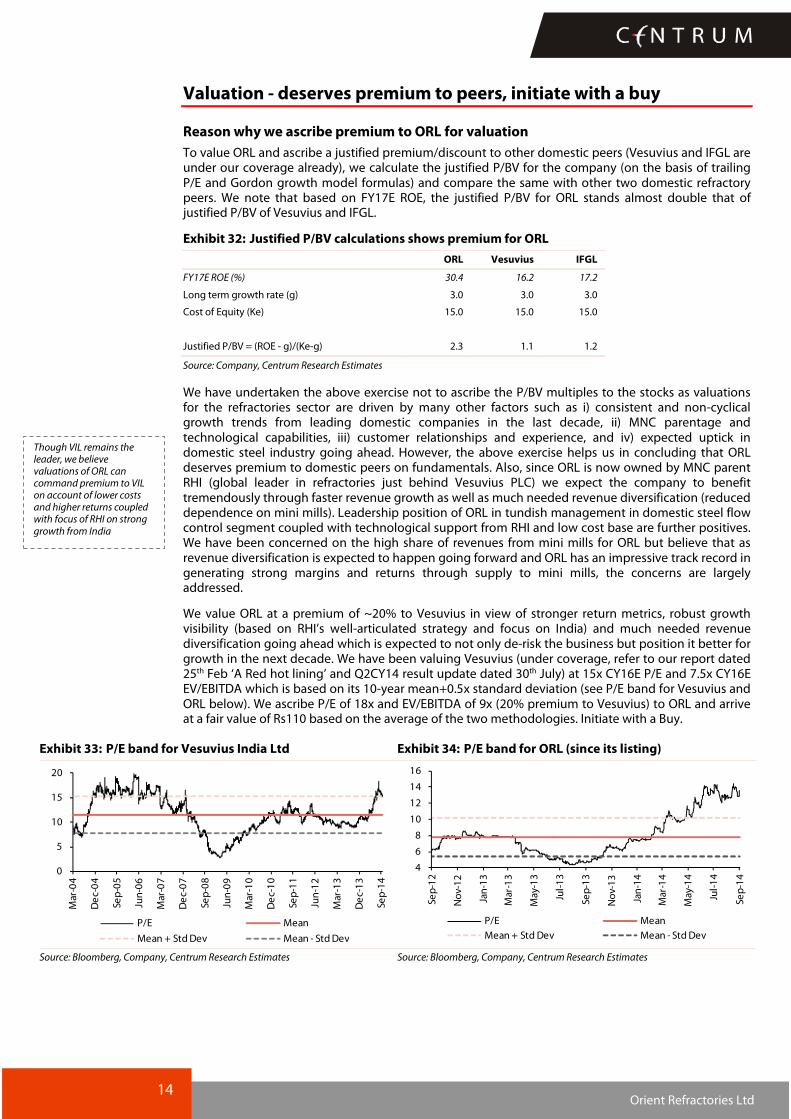
We value ORL at a premium of ~20% to Vesuvius in view of stronger return metrics, robust growth visibility (based on RHI’s well-articulated strategy and focus on India) and much needed revenue diversification going ahead which is expected to not only de-risk the business but position it better for growth in the next decade. We have been valuing Vesuvius (under coverage, refer to our report dated 25th Feb ‘A Red hot lining’ and Q2CY14 result update dated 30th July) at 15x CY16E P/E and 7.5x CY16E EV/EBITDA which is based on its 10-year mean+0.5x standard deviation (see P/E band for Vesuvius and ORL below). We ascribe P/E of 18x and EV/EBITDA of 9x (20% premium to Vesuvius) to ORL and arrive at a fair value of Rs110 based on the average of the two methodologies. Initiate with a Buy.
Exhibit 33: P/E band for Vesuvius India Ltd Exhibit 34: P/E band for ORL (since its listing)
Source: Bloomberg, Company, Centrum Research Estimates Source: Bloomberg, Company, Centrum Research Estimates
0
5
10
15
20
Mar-04
Dec-04
Sep-05
Jun-06
Mar-07
Dec-07
Sep-08
Jun-09
Mar-10
Dec-10
Sep-11
Jun-12
Mar-13
Dec-13
Sep-14
P/E Mean
Mean + Std Dev Mean - Std Dev
4
6
8
10
12
14
16
Sep-12
Nov-12
Jan-13
Mar-13
May-13
Jul-13
Sep-13
Nov-13
Jan-14
Mar-14
May-14
Jul-14
Sep-14
P/E Mean
Mean + Std Dev Mean - Std Dev
Though VIL remains the leader, we believe valuations of ORL can command premium to VIL on account of lower costs and higher returns coupled with focus of RHI on strong growth from India

15 Orient Refractories Ltd
Exhibit 35: Valuation for ORL
EV/EBITDA Valuation FY17E
EBITDA (Rs mn) 1,210
EV/EBITDA (x) 9.0
EV (Rs mn) 10,890
Add: Net Cash (Rs mn) 771
Fair value mkt cap (Rs mn) 11,661
No. of shares (mn) 120.1
Fair Value/share (Rs) 97
P/E Valuation FY17E
EPS (Rs) 6.8
P/E (x) 18
Fair Value/share (Rs) 123
Avg. of P/E & EV/EBITDA (Rs) 110
Source: Company, Centrum Research Estimates
Peer valuation comparison
ORL scores above domestic and global peers on margins and return ratios while in terms of revenue CAGR it is largely similar to domestic peers. The stock has seen rerating in the past and trades at par with Vesuvius on P/E multiples.
Exhibit 36: Valuation– Peer comparison
Company Mkt. Cap (US$ mn)
CAGR CY13-CY15E (%) EBITDA Margin (%) P/E (x) EV/EBITDA (x) RoE (%) Div Yield (%)
Rev. EBITDA PAT CY13 CY14E CY15E CY13 CY14E CY15E CY13 CY14E CY15E CY13 CY14E CY15E CY13 CY14E CY15E
Orient Refractories# 171.3 17.1 15.2 15.9 19.6 18.5 18.4 19.8 18.3 15.7 13.1 12.0 10.1 38.4 32.7 30.6 1.4 1.6 1.9
IFGL Refractories# 100.5 11.1 14.1 12.0 14.1 14.4 14.9 9.9 9.1 7.9 6.4 5.4 4.3 19.5 17.7 17.5 1.0 1.1 1.2
Vesuvius India Ltd 232.4 11.0 11.5 12.6 18.4 17.8 18.6 22.0 20.8 17.4 12.0 10.9 9.0 16.4 15.2 15.8 0.6 0.7 0.9
Global Peers*
Vesuvius PLC 2059.9 (0.7) 4.3 (15.1) 11.9 12.5 13.1 9.5 14.4 12.9 9.5 8.0 7.4 15.9 10.2 11.2 2.9 3.4 3.6
RHI AG 1134.4 2.1 (10.8) 28.3 16.8 12.2 12.8 14.2 9.9 8.6 4.5 5.8 5.5 13.1 17.0 17.2 3.3 3.4 3.6
Magnesita SA 435.7 10.1 4.7 35.9 16.5 14.0 14.9 19.1 52.0 9.8 7.2 5.3 5.0 1.9 0.8 3.1 0.8 0.8 3.9
Cie de St(Gobain 25745.1 1.6 13.0 67.6 9.0 10.4 11.1 32.4 14.9 11.8 7.9 6.0 5.4 3.4 7.6 8.9 3.1 3.6 3.8
Source: *Bloomberg Estimates, Centrum Research Estimates, #CY13=FY14 and so on for Orient & IFGL
Our stance on the overall domestic refractories space and listed stocks
We have remained positive on the domestic refractories sector since initiating coverage on Vesuvius (refer to our report ‘Red Hot Lining’ dated 25 Feb’14) which was followed by initiation on IFGL (refer to our report ‘Lining up for growth and margin expansion’ dated 24 June’14). With the initiation report on ORL, we now have all three listed stocks under coverage in the domestic refractories space. Our key investment rationale points for positive view on refractories are i) expected pick up in domestic steel production during the next 5-10 years with the new government’s focus on infrastructure development, ii) strong positioning of organised refractory players to capitalise on growth, iii) non-cyclical earnings track record with healthy balance sheets, iv) low capex and high asset turnover nature of the business and v) support from global MNCs with regards to technology and global customer relationships.
With regard to our relative preference among listed players in the domestic refractories space, we maintain our Hold stance on Vesuvius India Ltd as we believe upside is limited in the medium term though the long term story remains intact and prefer ORL on account of changes being brought about by RHI coupled with low costs and strong returns. We remain positive on IFGL on account of margin expansion through expansion at higher margin subsidiaries and more than justified discount to peers which make valuations attractive.

Key risks to our thesis
Over dependence on smaller steel mills: ORL derives ~70% of its domestic manufacturing revenues and ~50% of its overall revenues from mini steel mills and we see risk on receivables as well as stable business from mini mills for ORL as they continue to struggle in a fiercely competitive domestic steel industry. Also, addition of new steel capacities by large integrated steel mills would further squeeze the margins of mini steel mills and we expect most of the incremental growth to be driven by large integrated mills and not mini steel mills. We expect revenue diversification and higher sales to large integrated mills from ORL as it is now owned by RHI and over dependence on mini steel mills to reduce gradually.
Higher than expected margin drop due to change in sales mix: We expect ORL’s sales mix to change with new revenue segment of sales to RHI group and higher sales to large integrated sales mills. We expect margins to be lower in these revenue segments and have factored in the same. However, more than expected margin squeeze from new revenue segments can lead to downward risk to our estimates.
Low pricing power due to excess domestic supply and import pressure: The industry suffers from low capacity utilization of ~60% with excess installed capacities (~2.2 MTPA) and as a result pricing power is low for refractory makers who are squeezed between raw material suppliers and steel makers. Cheap refractory imports from China have also kept prices in check. ORL provides cost effective refractories to its customers and is thus a price taker. Further, increase in competitive intensity can lead to lower pricing for ORL in both domestic and export markets.
Sharp slowdown in steel industry leading to lower volumes: Like any other refractory company, ORL’s fortunes depend on the steel industry and any slowdown in global economy may hamper the steel industry’s growth and ORL’s volume growth. Sharp slowdown in the steel industry (vs expectations of recovery) in coming years could lead to lower capacity utilization and lower than expected volumes.
16 Orient Refractories Ltd

17 Orient Refractories Ltd
Exhibit 37: Shareholding pattern (%)
Q1FY15 Q4FY14 Q3FY14 Q2FY14
Promoter 69.6 69.6 69.6 69.6
FIIs 0.0 0.4 0.0 0.2
DIIs 1.9 0.0 0.0 0.0
Others 28.4 29.9 30.4 30.2
Source: BSE
Company Background
Orient Refractories Ltd. (ORL) is a manufacturer of specialised refractories and monolithics for the iron and steel industry, serving both domestic and international customers. Headquartered in New Delhi, ORL has manufacturing as well as research and development facilities, along with eight sales offices across India. The manufacturing and R&D facility is located in Bhiwadi Rajasthan; it also has a franchisee manufacturing facility in Salem, Tamil Nadu for manufacturing monolithics. ORL currently has capacity of ~20000 tpa of shaped refractories and ~13500 tpa of unshaped refractories.
Orient group started refractory business under Orient Abrasives Limited in 1974. Orient Refractories Ltd was incorporated on November 26, 2010, as a wholly owned subsidiary of Orient Abrasives Limited and the refractory business has been transferred in it. In April 2011, ORL was demerged as a separate listed company. RHI (global No. 2 in refractory business) acquired 69.6% in ORL in April’13 through a mix of open offer and from ex-promoters for strengthening its global market position in flow control segment and pursuing its growth strategy focused on emerging markets. RHI’s stake purchase was concluded at Rs43/share.
Exhibit 38: Key management personnel
Name Position Profile
Mr. Pramod Sagar Managing Director
He is aged 47 years, and did his Diploma in Mechanical Engineering from Amritsar Polytechnic in 1984 and further pursued his off- campus programme in B-Tech (Mechanical) from Vivekananda College, Secundrabad in 2004. He has experience of 29 years and joined Orient Refractories Limited (de-merged from Orient Abrasives Ltd.) on 15th April 1992 as Marketing Manager.
Mr. Gopal Rajgharia Executive Director (ex-promoter)
He is aged 65 years and is a chemical engineer by profession. He completed his Bachelor in Technology (B. Tech) (Hons.) from IIT, Khragpur and Master of Science from Massachusetts Institute of Technology, USA. He began his career promoting Orient Abrasives Limited since it was incorporated in 1971. Mr. Rajgarhia has an industry experience of over 40 years.
Mr. Subhash Chander Sarin Executive Director
Mr. S C Sarin is a qualified engineer with B. Tech. (Hons.) from IIT, Kharagpur and has been associated with Orient Abrasives Limited since 1990. He has an overall industry experience of about 43 years. He has extensive knowledge in the field of refractories. Previously he was employed with Steel Strips Limited.
Source: Company

18 Orient Refractories Ltd
Exhibit 39: Quarterly financials
Particulars (Rs mn) Q1FY13 Q2FY13 Q3FY13 Q4FY13 Q1FY14 Q2FY14 Q3FY14 Q4FY14 Q1FY15
Net sales 911 910 881 897 953 970 1,057 1,050 1,081
Other Operating Income 1 2 3 2 1 1 1 1 2
Total Income 912 912 884 898 954 972 1,058 1,052 1,083
Accretion to Stocks in trade & work in progress (25) (15) (8) (23) 24 (24) (23) (8) 32
Cost of Raw materials consumed 376 397 374 386 373 400 411 420 411
Purchase of traded goods 161 129 113 118 130 136 154 150 155
Staff cost 68 65 68 66 79 82 89 86 92
Other operational expenses 171 166 175 176 171 181 212 201 193
Operating Profit (Core EBITDA) 161 170 161 176 178 197 215 202 199
Depreciation 8 9 10 11 9 10 10 8 18
EBIT 154 161 151 165 169 187 205 194 182
Interest 6 4 3 1 0 0 0 0 0
Other Revenue/Income 6 0 7 5 16 14 6 5 12
Exceptional items (18) 0 0 0 0 0 0 0 0
Profit Before Tax 135 157 154 168 185 201 211 199 194
Tax 44 51 51 55 62 68 71 67 64
Profit After Tax 92 105 104 113 123 134 140 132 129
Growth (%)
Revenue NA NA NA NA 4.6 6.7 19.9 17.1 13.4
EBITDA NA NA NA NA 10.4 15.8 33.2 15.0 11.8
PAT NA NA NA NA 33.8 26.9 35.1 16.5 5.1
Margin (%)
EBITDA 17.7 18.6 18.2 19.6 18.7 20.3 20.3 19.2 18.4
EBIT 16.9 17.6 17.1 18.4 17.7 19.3 19.4 18.5 16.8
PAT 10.1 11.5 11.7 12.6 12.9 13.7 13.3 12.6 11.9
Source: Company, Centrum Research
Comments on recent quarterly results
Q1FY15 witnessed a healthy growth with revenue up 13.4% YoY. EBITDA went up by 11.8% YoY and margins remained strong at 18.4%. PAT growth was lower at 5.1% Yoy due to increase in depreciation expenses on account of change in schedule 2 of the companies act.

19 Orient Refractories Ltd
Annexure – Refractory Industry
About refractories – consumables for manufacturing processes with high temperatures
Refractories are inorganic, non-metallic and heterogeneous materials having very high melting points which make them suitable to be used as heat-resisting barriers consumed within various production processes, providing heat, chemical and mechanical resistance. Refractories are mainly of two types – shaped and unshaped (monolithics) and are used mainly by the steel industry as a consumable product in the internal linings of furnaces, kilns, reactors and other vessels for holding and transporting metal and slag.
Shaped refractories are those which have fixed shapes with most common form being rectangular brick. Brick shapes may be divided into two: standard shapes and special shapes. Standard shapes have dimensions that are conformed to by most refractory manufacturers and are generally applicable to kilns and furnaces of the same type. Special shapes are specifically made for particular kilns and furnaces. Shaped refractories are almost always machine-pressed and possess high uniformity in properties are expected.
Unshaped refractories are without definite form and are only given shape upon application. It forms joint less lining and are better known as monolithic refractories. They are manufactured in powder form as granular material and known as plastic refractories, ramming mixes, castables, gunning mixes, fettling mixes and mortars.
The raw materials used to manufacture refractories are broadly classified into clay and non-clay. Clay refractories consist of naturally occurring alumina silicate like fireclay, flint clay, flint brick and high alumina and are used to produce bricks and insulating refractories. Non-clay refractories are made from non-clay materials and are further classified into basic (made in the form of bricks from magnesia, dolomite, chrome etc), extra high alumina, mullite (made from kyanite, bauxite, alumina), silicon carbide and zircon.
Exhibit 40: Refractory share by form Exhibit 41: Refractory share by raw material
Source: Industry data, Centrum Research Source: Industry data, Centrum Research
Unshaped, 45%Shaped, 55%
Clay, 65%
Non Clay, 35%

20 Orient Refractories Ltd
Applications of refractories – largely used in steel industry for furnace linings
Steel industry accounts for ~60% of refractory consumption globally and ~75% in the domestic market. In non-metallurgical industries (cement, glass, lime), the refractories are mostly installed on fired heaters, hydrogen reformers, cracking furnaces, incinerators, utility boilers, air heaters, ducting, stacks, etc. The different areas of the steel manufacturing processes are exposed to different temperatures, slag and sulphur gases. Refractory selection for the lining of a furnace is invariably built upon a combination of material qualities, and brick size to maximize performance. Steel industry uses refractory for diverse applications in blast furnaces, coke ovens, torpedo ladles and secondary refining ladles.
In cement industry, refractories are used in the kiln, the preheating system, and the cooler which operate in a very high temperature to protect against heat, abrasion and chemical attack. Common refractory materials used are Dolomite, Magnesia-Chrome Spinel, Magnesia-Alumina Spinel, Fireclay and High Alumina. The cement kiln clinker area is usually provided with Dolomite refractories.
Non(-errous industries like copper and aluminium require high performance refractories in several equipments like anode baking furnaces, induction furnaces, reduction pots, slag cleaning surfaces etc. Glass industry also requires refractories in refiner, regenerator, dog-house and ports of furnace.
Exhibit 42: Refractories consumption in steel making process
Source: Magnesita ppt
Exhibit 43: Refractories consumption in steel making process
Source: Vesuvius PLC ppt

21 Orient Refractories Ltd
Steel industry accounts for ~60% of refractory consumption globally and ~75% in the domestic market. In non-metallurgical industries (cement, glass, lime), refractories are mostly installed on fired heaters, hydrogen reformers, cracking furnaces, incinerators, utility boilers, air heaters, ducting, stacks, etc.
Exhibit 44: Sector wise refractories demand - Global Exhibit 45: Sector wise refractories demand - India
Source: Industry data, Centrum Research Source: Industry data, Centrum Research
Refractory application, consumption and replacement dynamics are shown in the table below. Steelmaking requires maximum amount of refractories (10-15kgs/tonne) with replacement required in a time period of 20 minutes to 2months. Cement industry is the next biggest user with annual replacement requirement while non-ferrous and glass industries have longer replacement cycles.
Exhibit 46: Refractory consumption dynamics across user industries
Key Industry Application Replacement Per tonne consumption Refractory requirements
Steel
BF(BOF, EAF, Casting Ladles, Induction Furnaces, Pellet rotary Kilns
20 minutes to 2 months
Global avg - 10-15Kgs. India avg - 15 Kgs
Consumable product ( Systems and solutions for complete refractory management
Cement Kilns annually 1 Kgs
Investment goods ( Longer replacement cycles, Customized solutions based on the specific requirements of various industrial production processes, complete lining concepts
Glass Glass Furnace upto 10 years 4 Kgs
Non(Ferrous Converters 1(10 years Aluminium - 6 Kgs, Copper - 3 Kgs
Source: RHI ppt, Centrum Research
Global refractory market size at ~US$25bn, expected to grow at ~3.5% CAGR
According to various industry studies, global refractories’ market size is ~US$25bn with production of 41.5MT in CY12. According to industry estimates, the global refractories industry is expected to witness CAGR of 3.5% during CY13-16E and grow to 46MT with a market value of US$29bn. China accounted for ~70% of the market by volume and ~60% by value in CY12 whereas India accounts for ~3% of the global refractories market by volume.
Exhibit 47: Global refractory market size at ~US$25bn Exhibit 48: China accounts for ~70% of the market
CY12 Production (MT) Value (US$ bn)
World 41.5 25
China 29.5 14.3
EU 4.1 3.9
North America 1.4 1.4
India 1.3 0.9
Source: Industry, Centrum Research Source: Industry, Centrum Research
60%15%
15%
10%Steel
Non-Metallic (Cement, Glass, Lime)
Non-Ferrous (Aluminium, Copper, Zinc, Silver)
Others (paper, ceramics, petrochemicals)
75%
12%
6%
3%4%
Steel
Cement
Non-Ferrous
Glass
Others
41.5
46.3
25
29
0
10
20
30
40
50
CY12 CY16
Volume (MT) Mkt Value ($ bn)
22 Orient Refractories Ltd
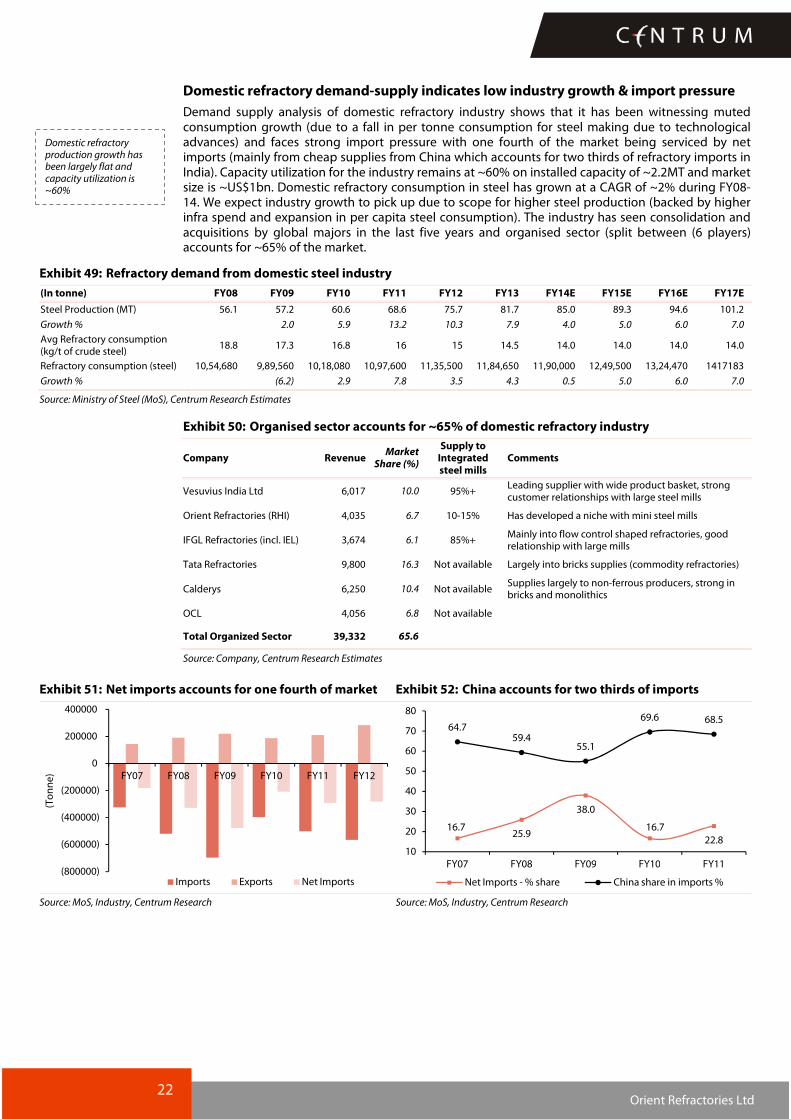
Domestic refractory demand-supply indicates low industry growth & import pressure
Demand supply analysis of domestic refractory industry shows that it has been witnessing muted consumption growth (due to a fall in per tonne consumption for steel making due to technological advances) and faces strong import pressure with one fourth of the market being serviced by net imports (mainly from cheap supplies from China which accounts for two thirds of refractory imports in India). Capacity utilization for the industry remains at ~60% on installed capacity of ~2.2MT and market size is ~US$1bn. Domestic refractory consumption in steel has grown at a CAGR of ~2% during FY08-14. We expect industry growth to pick up due to scope for higher steel production (backed by higher infra spend and expansion in per capita steel consumption). The industry has seen consolidation and acquisitions by global majors in the last five years and organised sector (split between (6 players) accounts for ~65% of the market.
Exhibit 49: Refractory demand from domestic steel industry
(In tonne) FY08 FY09 FY10 FY11 FY12 FY13 FY14E FY15E FY16E FY17E
Steel Production (MT) 56.1 57.2 60.6 68.6 75.7 81.7 85.0 89.3 94.6 101.2
Growth % 2.0 5.9 13.2 10.3 7.9 4.0 5.0 6.0 7.0
Avg Refractory consumption (kg/t of crude steel)
18.8 17.3 16.8 16 15 14.5 14.0 14.0 14.0 14.0
Refractory consumption (steel) 10,54,680 9,89,560 10,18,080 10,97,600 11,35,500 11,84,650 11,90,000 12,49,500 13,24,470 1417183
Growth % (6.2) 2.9 7.8 3.5 4.3 0.5 5.0 6.0 7.0
Source: Ministry of Steel (MoS), Centrum Research Estimates
Exhibit 50: Organised sector accounts for ~65% of domestic refractory industry
Company Revenue Market
Share (%)
Supply to Integrated steel mills
Comments
Vesuvius India Ltd 6,017 10.0 95%+ Leading supplier with wide product basket, strong customer relationships with large steel mills
Orient Refractories (RHI) 4,035 6.7 10-15% Has developed a niche with mini steel mills
IFGL Refractories (incl. IEL) 3,674 6.1 85%+ Mainly into flow control shaped refractories, good relationship with large mills
Tata Refractories 9,800 16.3 Not available Largely into bricks supplies (commodity refractories)
Calderys 6,250 10.4 Not available Supplies largely to non-ferrous producers, strong in bricks and monolithics
OCL 4,056 6.8 Not available
Total Organized Sector 39,332 65.6
Source: Company, Centrum Research Estimates
Exhibit 51: Net imports accounts for one fourth of market Exhibit 52: China accounts for two thirds of imports
Source: MoS, Industry, Centrum Research Source: MoS, Industry, Centrum Research
(800000)
(600000)
(400000)
(200000)
0
200000
400000
FY07 FY08 FY09 FY10 FY11 FY12
(Tonne)
Imports Exports Net Imports
16.725.9
38.0
16.7
22.8
64.759.4
55.1
69.6 68.5
10
20
30
40
50
60
70
80
FY07 FY08 FY09 FY10 FY11
Net Imports - % share China share in imports %
Domestic refractory production growth has been largely flat and capacity utilization is ~60%
23 Orient Refractories Ltd
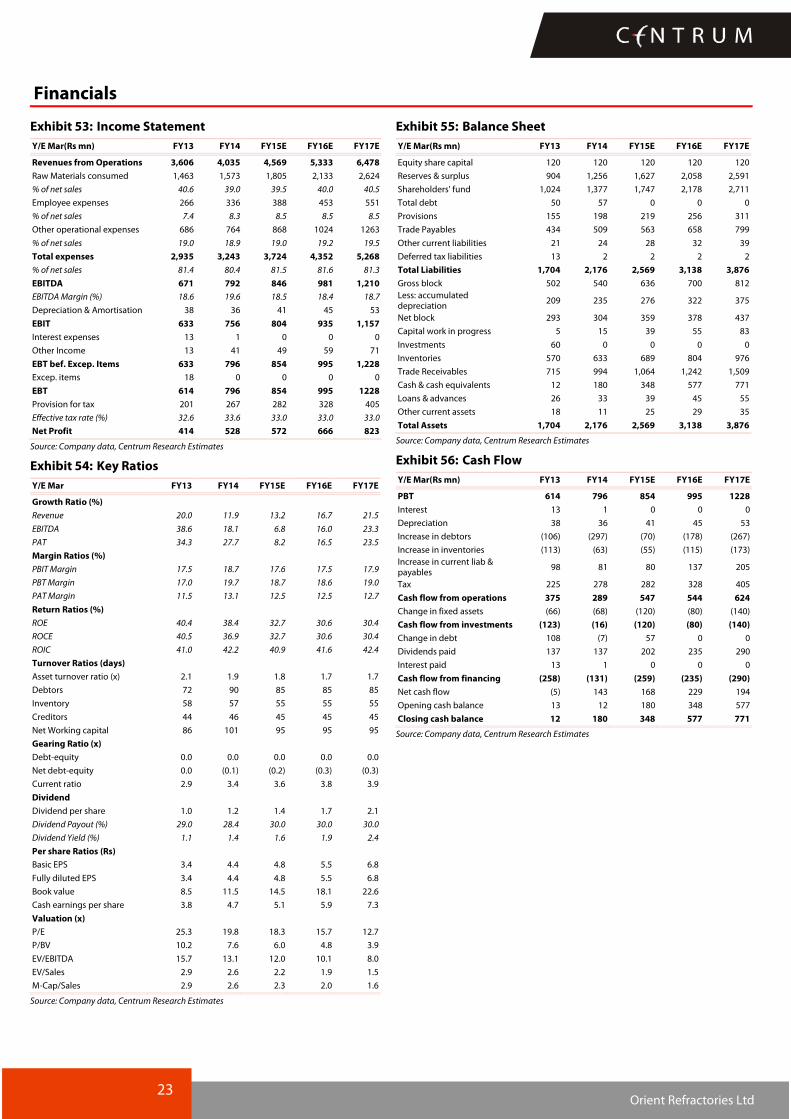
Financials
Exhibit 53: Income Statement
Y/E Mar(Rs mn) FY13 FY14 FY15E FY16E FY17E
Revenues from Operations 3,606 4,035 4,569 5,333 6,478
Raw Materials consumed 1,463 1,573 1,805 2,133 2,624
% of net sales 40.6 39.0 39.5 40.0 40.5
Employee expenses 266 336 388 453 551
% of net sales 7.4 8.3 8.5 8.5 8.5
Other operational expenses 686 764 868 1024 1263
% of net sales 19.0 18.9 19.0 19.2 19.5
Total expenses 2,935 3,243 3,724 4,352 5,268
% of net sales 81.4 80.4 81.5 81.6 81.3
EBITDA 671 792 846 981 1,210
EBITDA Margin (%) 18.6 19.6 18.5 18.4 18.7
Depreciation & Amortisation 38 36 41 45 53
EBIT 633 756 804 935 1,157
Interest expenses 13 1 0 0 0
Other Income 13 41 49 59 71
EBT bef. Excep. Items 633 796 854 995 1,228
Excep. items 18 0 0 0 0
EBT 614 796 854 995 1228
Provision for tax 201 267 282 328 405
Effective tax rate (%) 32.6 33.6 33.0 33.0 33.0
Net Profit 414 528 572 666 823
Source: Company data, Centrum Research Estimates
Exhibit 54: Key Ratios
Y/E Mar FY13 FY14 FY15E FY16E FY17E
Growth Ratio (%)
Revenue 20.0 11.9 13.2 16.7 21.5
EBITDA 38.6 18.1 6.8 16.0 23.3
PAT 34.3 27.7 8.2 16.5 23.5
Margin Ratios (%)
PBIT Margin 17.5 18.7 17.6 17.5 17.9
PBT Margin 17.0 19.7 18.7 18.6 19.0
PAT Margin 11.5 13.1 12.5 12.5 12.7
Return Ratios (%)
ROE 40.4 38.4 32.7 30.6 30.4
ROCE 40.5 36.9 32.7 30.6 30.4
ROIC 41.0 42.2 40.9 41.6 42.4
Turnover Ratios (days)
Asset turnover ratio (x) 2.1 1.9 1.8 1.7 1.7
Debtors 72 90 85 85 85
Inventory 58 57 55 55 55
Creditors 44 46 45 45 45
Net Working capital 86 101 95 95 95
Gearing Ratio (x)
Debt-equity 0.0 0.0 0.0 0.0 0.0
Net debt-equity 0.0 (0.1) (0.2) (0.3) (0.3)
Current ratio 2.9 3.4 3.6 3.8 3.9
Dividend
Dividend per share 1.0 1.2 1.4 1.7 2.1
Dividend Payout (%) 29.0 28.4 30.0 30.0 30.0
Dividend Yield (%) 1.1 1.4 1.6 1.9 2.4
Per share Ratios (Rs)
Basic EPS 3.4 4.4 4.8 5.5 6.8
Fully diluted EPS 3.4 4.4 4.8 5.5 6.8
Book value 8.5 11.5 14.5 18.1 22.6
Cash earnings per share 3.8 4.7 5.1 5.9 7.3
Valuation (x)
P/E 25.3 19.8 18.3 15.7 12.7
P/BV 10.2 7.6 6.0 4.8 3.9
EV/EBITDA 15.7 13.1 12.0 10.1 8.0
EV/Sales 2.9 2.6 2.2 1.9 1.5
M-Cap/Sales 2.9 2.6 2.3 2.0 1.6
Source: Company data, Centrum Research Estimates
Exhibit 55: Balance Sheet
Y/E Mar(Rs mn) FY13 FY14 FY15E FY16E FY17E
Equity share capital 120 120 120 120 120
Reserves & surplus 904 1,256 1,627 2,058 2,591
Shareholders' fund 1,024 1,377 1,747 2,178 2,711
Total debt 50 57 0 0 0
Provisions 155 198 219 256 311
Trade Payables 434 509 563 658 799
Other current liabilities 21 24 28 32 39
Deferred tax liabilities 13 2 2 2 2
Total Liabilities 1,704 2,176 2,569 3,138 3,876
Gross block 502 540 636 700 812
Less: accumulated depreciation
209 235 276 322 375
Net block 293 304 359 378 437
Capital work in progress 5 15 39 55 83
Investments 60 0 0 0 0
Inventories 570 633 689 804 976
Trade Receivables 715 994 1,064 1,242 1,509
Cash & cash equivalents 12 180 348 577 771
Loans & advances 26 33 39 45 55
Other current assets 18 11 25 29 35
Total Assets 1,704 2,176 2,569 3,138 3,876
Source: Company data, Centrum Research Estimates
Exhibit 56: Cash Flow
Y/E Mar(Rs mn) FY13 FY14 FY15E FY16E FY17E
PBT 614 796 854 995 1228
Interest 13 1 0 0 0
Depreciation 38 36 41 45 53
Increase in debtors (106) (297) (70) (178) (267)
Increase in inventories (113) (63) (55) (115) (173)
Increase in current liab & payables
98 81 80 137 205
Tax 225 278 282 328 405
Cash flow from operations 375 289 547 544 624
Change in fixed assets (66) (68) (120) (80) (140)
Cash flow from investments (123) (16) (120) (80) (140)
Change in debt 108 (7) 57 0 0
Dividends paid 137 137 202 235 290
Interest paid 13 1 0 0 0
Cash flow from financing (258) (131) (259) (235) (290)
Net cash flow (5) 143 168 229 194
Opening cash balance 13 12 180 348 577
Closing cash balance 12 180 348 577 771
Source: Company data, Centrum Research Estimates

24 Orient Refractories Ltd
Appendix A
Disclaimer
Centrum Broking Limited (“Centrum”) is a full(service, Stock Broking Company and a member of The Stock Exchange, Mumbai (BSE) and National Stock Exchange of India Ltd. (NSE). Our holding company, Centrum Capital Ltd, is an investment banker and an underwriter of securities. As a group Centrum has Investment Banking, Advisory and other business relationships with a significant percentage of the companies covered by our Research Group. Our research professionals provide important inputs into the Group's Investment Banking and other business selection processes.
Recipients of this report should assume that our Group is seeking or may seek or will seek Investment Banking, advisory, project finance or other businesses and may receive commission, brokerage, fees or other compensation from the company or companies that are the subject of this material/report. Our Company and Group companies and their officers, directors and employees, including the analysts and others involved in the preparation or issuance of this material and their dependants, may on the date of this report or from, time to time have "long" or "short" positions in, act as principal in, and buy or sell the securities or derivatives thereof of companies mentioned herein. Centrum or its affiliates do not own 1% or more in the equity of this company Our sales people, dealers, traders and other professionals may provide oral or written market commentary or trading strategies to our clients that reflect opinions that are contrary to the opinions expressed herein, and our proprietary trading and investing businesses may make investment decisions that are inconsistent with the recommendations expressed herein. We may have earlier issued or may issue in future reports on the companies covered herein with recommendations/ information inconsistent or different those made in this report. In reviewing this document, you should be aware that any or all of the foregoing, among other things, may give rise to or potential conflicts of interest. We and our Group may rely on information barriers, such as "Chinese Walls" to control the flow of information contained in one or more areas within us, or other areas, units, groups or affiliates of Centrum. Centrum or its affiliates do not make a market in the security of the company for which this report or any report was written. Further, Centrum or its affiliates did not make a market in the subject company’s securities at the time that the research report was published.
This report is for information purposes only and this document/material should not be construed as an offer to sell or the solicitation of an offer to buy, purchase or subscribe to any securities, and neither this document nor anything contained herein shall form the basis of or be relied upon in connection with any contract or commitment whatsoever. This document does not solicit any action based on the material contained herein. It is for the general information of the clients of Centrum. Though disseminated to clients simultaneously, not all clients may receive this report at the same time. Centrum will not treat recipients as clients by virtue of their receiving this report. It does not constitute a personal recommendation or take into account the particular investment objectives, financial situations, or needs of individual clients. Similarly, this document does not have regard to the specific investment objectives, financial situation/circumstances and the particular needs of any specific person who may receive this document. The securities discussed in this report may not be suitable for all investors. The securities described herein may not be eligible for sale in all jurisdictions or to all categories of investors. The countries in which the companies mentioned in this report are organized may have restrictions on investments, voting rights or dealings in securities by nationals of other countries. The appropriateness of a particular investment or strategy will depend on an investor's individual circumstances and objectives. Persons who may receive this document should consider and independently evaluate whether it is suitable for his/ her/their particular circumstances and, if necessary, seek professional/financial advice. Any such person shall be responsible for conducting his/her/their own investigation and analysis of the information contained or referred to in this document and of evaluating the merits and risks involved in the securities forming the subject matter of this document.
The projections and forecasts described in this report were based upon a number of estimates and assumptions and are inherently subject to significant uncertainties and contingencies. Projections and forecasts are necessarily speculative in nature, and it can be expected that one or more of the estimates on which the projections and forecasts were based will not materialize or will vary significantly from actual results, and such variances will likely increase over time. All projections and forecasts described in this report have been prepared solely by the authors of this report independently of the Company. These projections and forecasts were not prepared with a view toward compliance with published guidelines or generally accented accounting principles. No independent accountants have expressed an opinion or any other form of assurance on these projections or forecasts. You should not regard the inclusion of the projections and forecasts described herein as a representation or warranty by or on behalf of the Company, Centrum, the authors of this report or any other person that these projections or forecasts or their underlying assumptions will be achieved. For these reasons, you should only consider the projections and forecasts described in this report after carefully evaluating all of the information in this report, including the assumptions underlying such projections and forecasts.
The price and value of the investments referred to in this document/material and the income from them may go down as well as up, and investors may realize losses on any investments. Past performance is not a guide for future performance. Future returns are not guaranteed and a loss of original capital may occur. Actual results may differ materially from those set forth in projections. Forward (looking statements are not predictions and may be subject to change without notice. Centrum does not provide tax advice to its clients, and all investors are strongly advised to consult regarding any potential investment. Centrum and its affiliates accept no liabilities for any loss or damage of any kind arising out of the use of this report. Foreign currencies denominated securities are subject to fluctuations in exchange rates that could have an adverse effect on the value or price of or income derived from the investment. In addition, investors in securities such as ADRs, the value of which are influenced by foreign currencies effectively assume currency risk. Certain transactions including those involving futures, options, and other derivatives as well as non(investment(grade securities give rise to substantial risk and are not suitable for all investors. Please ensure that you have read and understood the current risk disclosure documents before entering into any derivative transactions.
This report/document has been prepared by Centrum, based upon information available to the public and sources, believed to be reliable. No representation or warranty, express or implied is made that it is accurate or complete. Centrum has reviewed the report and, in so far as it includes current or historical information, it is believed to be reliable, although its accuracy and completeness cannot be guaranteed. The opinions expressed in this document/material are subject to change without notice and have no obligation to tell you when opinions or information in this report change.
This report or recommendations or information contained herein do/does not constitute or purport to constitute investment advice in publicly accessible media and should not be reproduced, transmitted or published by the recipient. The report is for the use and consumption of the recipient only. This publication may not be distributed to the public used by the public media without the express written consent of Centrum. This report or any portion hereof may not be printed, sold or distributed without the written consent of Centrum.
The distribution of this document in other jurisdictions may be restricted by law, and persons into whose possession this document comes should inform themselves about, and observe, any such restrictions. Neither Centrum nor its directors, employees, agents or representatives shall be liable for any damages whether direct or indirect, incidental, special or consequential including lost revenue or lost profits that may arise from or in connection with the use of the information.
This document does not constitute an offer or invitation to subscribe for or purchase or deal in any securities and neither this document nor anything contained herein shall form the basis of any contract or commitment whatsoever. This document is strictly confidential and is being furnished to you solely for your information, may not be distributed to the press or other media and may not be reproduced or redistributed to any other person. The distribution of this report in other jurisdictions may be restricted by law and persons into whose possession this report comes should inform themselves about, and observe any such restrictions. By accepting this report, you agree to be bound by the fore going limitations. No representation is made that this report is accurate or complete.

25 Orient Refractories Ltd
The opinions and projections expressed herein are entirely those of the author and are given as part of the normal research activity of Centrum Broking and are given as of this date and are subject to change without notice. Any opinion estimate or projection herein constitutes a view as of the date of this report and there can be no assurance that future results or events will be consistent with any such opinions, estimate or projection.
This document has not been prepared by or in conjunction with or on behalf of or at the instigation of, or by arrangement with the company or any of its directors or any other person. Information in this document must not be relied upon as having been authorized or approved by the company or its directors or any other person. Any opinions and projections contained herein are entirely those of the authors. None of the company or its directors or any other person accepts any liability whatsoever for any loss arising from any use of this document or its contents or otherwise arising in connection therewith.
Centrum and its affiliates have not managed or co(managed a public offering for the subject company in the preceding twelve months. Centrum and affiliates have not received compensation from the companies mentioned in the report during the period preceding twelve months from the date of this report for service in respect of public offerings, corporate finance, debt restructuring, investment banking or other advisory services in a merger/acquisition or some other sort of specific transaction.
As per the declarations given by them, Mr. Abhisar Jain, research analyst and and/or any of his family members do not serve as an officer, director or any way connected to the company/companies mentioned in this report. Further, as declared by him, he has not received any compensation from the above companies in the preceding twelve months. He does not hold any shares by him or through his relatives or in case if holds the shares then will not to do any transactions in the said scrip for 30 days from the date of release such report. Our entire research professionals are our employees and are paid a salary. They do not have any other material conflict of interest of the research analyst or member of which the research analyst knows of has reason to know at the time of publication of the research report or at the time of the public appearance.
While we would endeavour to update the information herein on a reasonable basis, Centrum, its associated companies, their directors and employees are under no obligation to update or keep the information current. Also, there may be regulatory, compliance or other reasons that may prevent Centrum from doing so.
Non(rated securities indicate that rating on a particular security has been suspended temporarily and such suspension is in compliance with applicable regulations and/or Centrum policies, in circumstances where Centrum is acting in an advisory capacity to this company, or any certain other circumstances.
This report is not directed to, or intended for distribution to or use by, any person or entity who is a citizen or resident of or located in any locality, state, country or other jurisdiction where such distribution, publication, availability or use would be contrary to law or regulation or which would subject Centrum Broking Limited or its group companies to any registration or licensing requirement within such jurisdiction. Specifically, this document does not constitute an offer to or solicitation to any U.S. person for the purchase or sale of any financial instrument or as an official confirmation of any transaction to any U.S. person unless otherwise stated, this message should not be construed as official confirmation of any transaction. No part of this document may be distributed in Canada or used by private customers in United Kingdom.
The information contained herein is not intended for publication or distribution or circulation in any manner whatsoever and any unauthorized reading, dissemination, distribution or copying of this communication is prohibited unless otherwise expressly authorized. Please ensure that you have read “Risk Disclosure Document for Capital Market and Derivatives Segments” as prescribed by Securities and Exchange Board of India before investing in Indian Securities Market.
Rating Criteria
Rating Market cap < Rs20bn Market cap > Rs20bn but < 100bn Market cap > Rs100bn
Buy Upside > 25% Upside > 20% Upside > 15%
Hold Upside between (25% to +25% Upside between (20% to +20% Upside between (15% to +15%
Sell Downside > 25% Downside > 20% Downside > 15%
Member (NSE, BSE, MCX(SX), Depository Participant (CDSL) and SEBI registered Portfolio Manager
Registration Nos.
CAPITAL MARKET SEBI REGN. NO.: BSE: INB011454239, NSE: INB231454233
DERIVATIVES SEBI REGN. NO.: NSE: INF231454233 (TRADING & SELF CLEARING MEMBER)
CDSL DP ID: 12200. SEBI REGISTRATION NO.: IN(DP(CDSL(661(2012
PMS REGISTRATION NO.: INP000004383
MCX – SX (Currency Derivative segment) REGN. NO.: INE261454230
Website: www.centrum.co.in
Investor Grievance Email ID: [email protected]
Compliance Officer Details:
Tel: (022) 4215 9413; Email ID: [email protected]
Centrum Broking Limited
Registered Office Address
Bombay Mutual Building ,
2nd Floor,
Dr. D. N. Road, Fort, Mumbai ( 400 001
Correspondence Address
Centrum House
6th Floor, CST Road, Near Vidya Nagari Marg, Kalina,
Santacruz (E), Mumbai 400 098.
Tel: (022) 4215 9000