Embed Size (px)
Citation preview
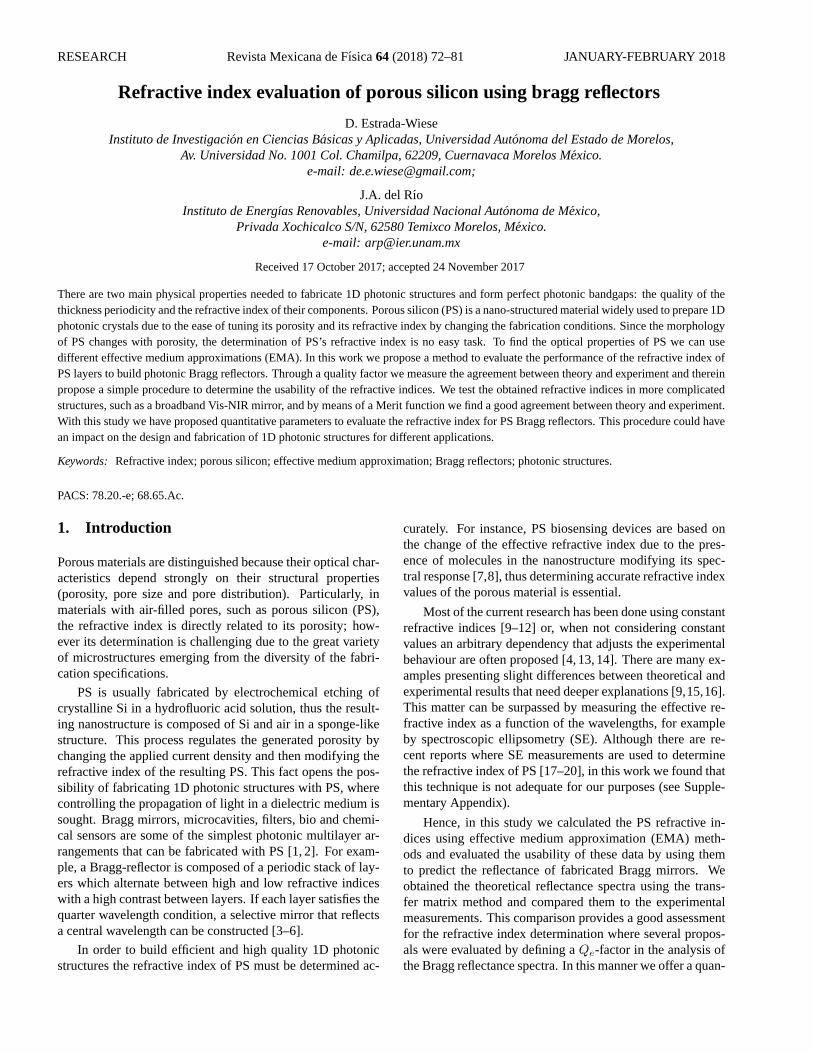
RESEARCH Revista Mexicana de Fısica64 (2018) 72–81 JANUARY-FEBRUARY 2018
Refractive index evaluation of porous silicon using bragg reflectors
D. Estrada-WieseInstituto de Investigacion en Ciencias Basicas y Aplicadas, Universidad Autonoma del Estado de Morelos,
Av. Universidad No. 1001 Col. Chamilpa, 62209, Cuernavaca Morelos Mexico.e-mail: [email protected];
J.A. del RıoInstituto de Energıas Renovables, Universidad Nacional Autonoma de Mexico,
Privada Xochicalco S/N, 62580 Temixco Morelos, Mexico.e-mail: [email protected]
Received 17 October 2017; accepted 24 November 2017
There are two main physical properties needed to fabricate 1D photonic structures and form perfect photonic bandgaps: the quality of thethickness periodicity and the refractive index of their components. Porous silicon (PS) is a nano-structured material widely used to prepare 1Dphotonic crystals due to the ease of tuning its porosity and its refractive index by changing the fabrication conditions. Since the morphologyof PS changes with porosity, the determination of PS’s refractive index is no easy task. To find the optical properties of PS we can usedifferent effective medium approximations (EMA). In this work we propose a method to evaluate the performance of the refractive index ofPS layers to build photonic Bragg reflectors. Through a quality factor we measure the agreement between theory and experiment and thereinpropose a simple procedure to determine the usability of the refractive indices. We test the obtained refractive indices in more complicatedstructures, such as a broadband Vis-NIR mirror, and by means of a Merit function we find a good agreement between theory and experiment.With this study we have proposed quantitative parameters to evaluate the refractive index for PS Bragg reflectors. This procedure could havean impact on the design and fabrication of 1D photonic structures for different applications.
Keywords: Refractive index; porous silicon; effective medium approximation; Bragg reflectors; photonic structures.
PACS: 78.20.-e; 68.65.Ac.
1. Introduction
Porous materials are distinguished because their optical char-acteristics depend strongly on their structural properties(porosity, pore size and pore distribution). Particularly, inmaterials with air-filled pores, such as porous silicon (PS),the refractive index is directly related to its porosity; how-ever its determination is challenging due to the great varietyof microstructures emerging from the diversity of the fabri-cation specifications.
PS is usually fabricated by electrochemical etching ofcrystalline Si in a hydrofluoric acid solution, thus the result-ing nanostructure is composed of Si and air in a sponge-likestructure. This process regulates the generated porosity bychanging the applied current density and then modifying therefractive index of the resulting PS. This fact opens the pos-sibility of fabricating 1D photonic structures with PS, wherecontrolling the propagation of light in a dielectric medium issought. Bragg mirrors, microcavities, filters, bio and chemi-cal sensors are some of the simplest photonic multilayer ar-rangements that can be fabricated with PS [1, 2]. For exam-ple, a Bragg-reflector is composed of a periodic stack of lay-ers which alternate between high and low refractive indiceswith a high contrast between layers. If each layer satisfies thequarter wavelength condition, a selective mirror that reflectsa central wavelength can be constructed [3–6].
In order to build efficient and high quality 1D photonicstructures the refractive index of PS must be determined ac-
curately. For instance, PS biosensing devices are based onthe change of the effective refractive index due to the pres-ence of molecules in the nanostructure modifying its spec-tral response [7,8], thus determining accurate refractive indexvalues of the porous material is essential.
Most of the current research has been done using constantrefractive indices [9–12] or, when not considering constantvalues an arbitrary dependency that adjusts the experimentalbehaviour are often proposed [4,13,14]. There are many ex-amples presenting slight differences between theoretical andexperimental results that need deeper explanations [9,15,16].This matter can be surpassed by measuring the effective re-fractive index as a function of the wavelengths, for exampleby spectroscopic ellipsometry (SE). Although there are re-cent reports where SE measurements are used to determinethe refractive index of PS [17–20], in this work we found thatthis technique is not adequate for our purposes (see Supple-mentary Appendix).
Hence, in this study we calculated the PS refractive in-dices using effective medium approximation (EMA) meth-ods and evaluated the usability of these data by using themto predict the reflectance of fabricated Bragg mirrors. Weobtained the theoretical reflectance spectra using the trans-fer matrix method and compared them to the experimentalmeasurements. This comparison provides a good assessmentfor the refractive index determination where several propos-als were evaluated by defining aQe-factor in the analysis ofthe Bragg reflectance spectra. In this manner we offer a quan-
REFRACTIVE INDEX EVALUATION OF POROUS SILICON USING BRAGG REFLECTORS 73
titative strategy to select adequate effective refractive indicesfor the construction of high reflective and broadband Braggmirrors.
In what follows we present the fabrication procedure ofPS and its porosity characterization. With these values weapproach different refractive indices using several EMAs.Subsequently, we evaluate the performance of the refractiveindices by fabricating Bragg reflectors centered at differentwavelengths and calculating theQe-factor for each one. Af-terwards we examine the use of the most adequate refractiveindices and fabricate a broadband mirror to ultimately testtheir usability. Finally we present the concluding remarks.
2. Experimental details
In this section we present the fabrication procedure of thePS samples and detail the method we used to characterize itsporosity and thickness. These values were later used for thedetermination of the refractive index of PS. The PS samplesfor this study were fabricated by an anodic electrochemicaldissolution of highly boron-doped p+-type (100) crystallinesilicon (c-Si) wafers with resistivity< 0.005 Ω·cm. In orderto ensure electrical conduction during anodization, an alu-minum film was deposited on the backside of the c-Si sub-strates and then heated at 500C during 30 min in nitrogenatmosphere. The substrates were electrochemicaly etched inan electrolyte composed of ethanol, HF and glycerin in a vol-ume ratio of 7:3:1 (if the total volume of the electrolyte is55 ml then we use 35 ml of ethanol, 15ml of HF and 5 mlof glicerol). We fabricated single high porosity layers by ap-plying a current density of 40.0 mA/cm2 and low porositylayers by using 3.0 mA/cm2. After electrochemical etching,the samples were rinsed in ethanol for 10 minutes and driedunder a nitrogen stream. We subsequently oxidized the sam-ples for stabilization of the PS at 300 C during 15 minutes.
To measure the porosity produced with these current den-sities we fabricated 5000 nm thick films and used the gravi-metric method [21] where the silicon wafer to be etchedis weighted before anodization (m1), immediately after an-odization (m2), and after dissolving the PS layer in an aque-ous solution of sodium hydroxide (m3) using the formula:
P =(m1 −m2)(m1 −m3)
. (1)
In this manner, measuring the corresponding sampleswith a Sartorius Microbalance (model MC 5) with a preci-sion of 0.0005 mg, we calculated porosities ofPa = 79.2%and Pb = 59.4% (from standard error propagation the er-ror percentage is less than0.15% for each different porositysample), where the subscripta andb stand for high and lowporosity layers. In addition, we characterized the thickness ofthe formed PS films using cross sectional SEM images usinga Hitachi S5500 electron microscope (see Fig. 1) and deter-mined the etch rate asva = 14.49 nm/s andvb = 1.72 nm/s.With these values we calculated the time at which each cur-
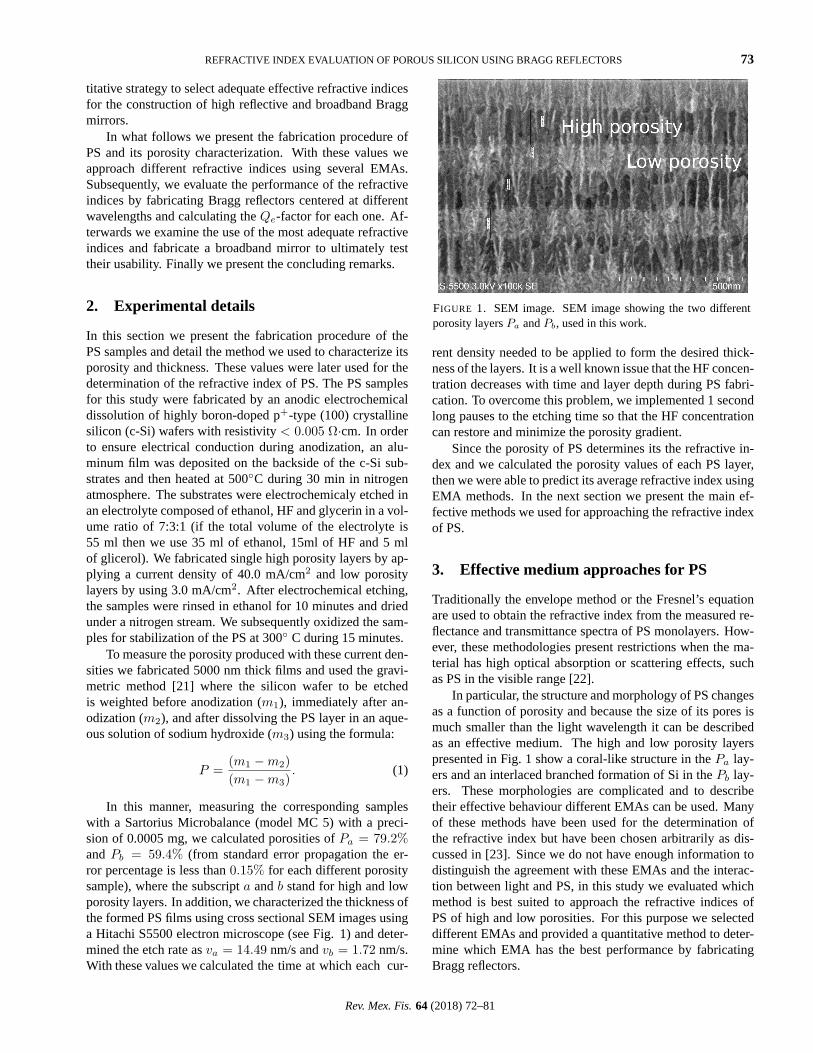
FIGURE 1. SEM image. SEM image showing the two differentporosity layersPa andPb, used in this work.
rent density needed to be applied to form the desired thick-ness of the layers. It is a well known issue that the HF concen-tration decreases with time and layer depth during PS fabri-cation. To overcome this problem, we implemented 1 secondlong pauses to the etching time so that the HF concentrationcan restore and minimize the porosity gradient.
Since the porosity of PS determines its the refractive in-dex and we calculated the porosity values of each PS layer,then we were able to predict its average refractive index usingEMA methods. In the next section we present the main ef-fective methods we used for approaching the refractive indexof PS.
3. Effective medium approaches for PS
Traditionally the envelope method or the Fresnel’s equationare used to obtain the refractive index from the measured re-flectance and transmittance spectra of PS monolayers. How-ever, these methodologies present restrictions when the ma-terial has high optical absorption or scattering effects, suchas PS in the visible range [22].
In particular, the structure and morphology of PS changesas a function of porosity and because the size of its pores ismuch smaller than the light wavelength it can be describedas an effective medium. The high and low porosity layerspresented in Fig. 1 show a coral-like structure in thePa lay-ers and an interlaced branched formation of Si in thePb lay-ers. These morphologies are complicated and to describetheir effective behaviour different EMAs can be used. Manyof these methods have been used for the determination ofthe refractive index but have been chosen arbitrarily as dis-cussed in [23]. Since we do not have enough information todistinguish the agreement with these EMAs and the interac-tion between light and PS, in this study we evaluated whichmethod is best suited to approach the refractive indices ofPS of high and low porosities. For this purpose we selecteddifferent EMAs and provided a quantitative method to deter-mine which EMA has the best performance by fabricatingBragg reflectors.
Rev. Mex. Fis.64 (2018) 72–81
74 D. ESTRADA-WIESE AND J.A. DEL RIO
The effective medium approaches were developed to ob-tain theoretical values of the effective dielectric function,whose real partεr relates to the real effective refractive in-dex asεr ∼ n2
eff when considering low absorption. The fol-lowing EMAs have been expressed in terms ofneff [24–26],from which the Maxwell-Garnett [27], Looyenga [28], theformula of del Rıo et al. [29] and Bruggeman [30] stand outamong others like the simple linear [25] or parallel interpola-tions [24]. The linear approximation is calculated using theporosityP that indicates the volume fraction of air in silicon:
neff (λ) = Pnair(λ) + (1− P )nSi(λ), (2)
wherenSi is the refractive index of silicon andnair the re-fractive index of air. Whereas the parallel interpolation iscalculated as:
1neff (λ)
=P
nair(λ)+
1− P
nSi(λ). (3)
The Looyenga model is best suited for high porosities andis defined as:
n2/3eff (λ) = (1− P )n2/3
Si (λ) + Pn2/3air (λ). (4)
Because the Maxwell-Garnett formula considers isolatedspherical particles, where percolation of PS is not contem-plated, this model is not relevant for this material [25,31]. Asan alternative to this methods we used the formula proposedby del Rıo et al. (dRZW) based on the Keller reciprocity the-orem for effective conductivity in a composed material [29].dRZW considers no particular inclusion shape, so it could beapplied to materials with arbitrary microstructure. We usedthis formula for the effective refractive index as:
neff (λ) = nSi(λ)1 + P (
√nair(λ)nSi(λ) − 1)
1 + P (√
nSi(λ)nair(λ) − 1)
. (5)
The Bruggeman approximation is one of the most usedEMA for the refractive index determination of PS [24, 32].The symmetric Bruggeman considers different sizes of spher-ical inclusions embedded in a continuos medium and is ap-plicable to any porosity:
Pn2
air(λ)− n2eff (λ)
n2air(λ) + 2n2
eff (λ)
+ (1− P )n2
Si(λ)− n2eff (λ)
n2Si(λ) + 2n2
eff (λ)= 0. (6)
The complex refractive index is defined asη(λ)=n(λ)−ik(λ) where absorption is related to the ex-tinction coefficientk(λ). The nonsymmetric Bruggemanapproximation can be used for the calculation ofk(λ) ofPS [24]:
k2(λ)k2
Si(λ)− k2
air(λ)k2
Si(λ)
= (1− P )
[(1− k2
air(λ)k2
Si(λ)
)(k2(λ)k2
Si
) 13]. (7)
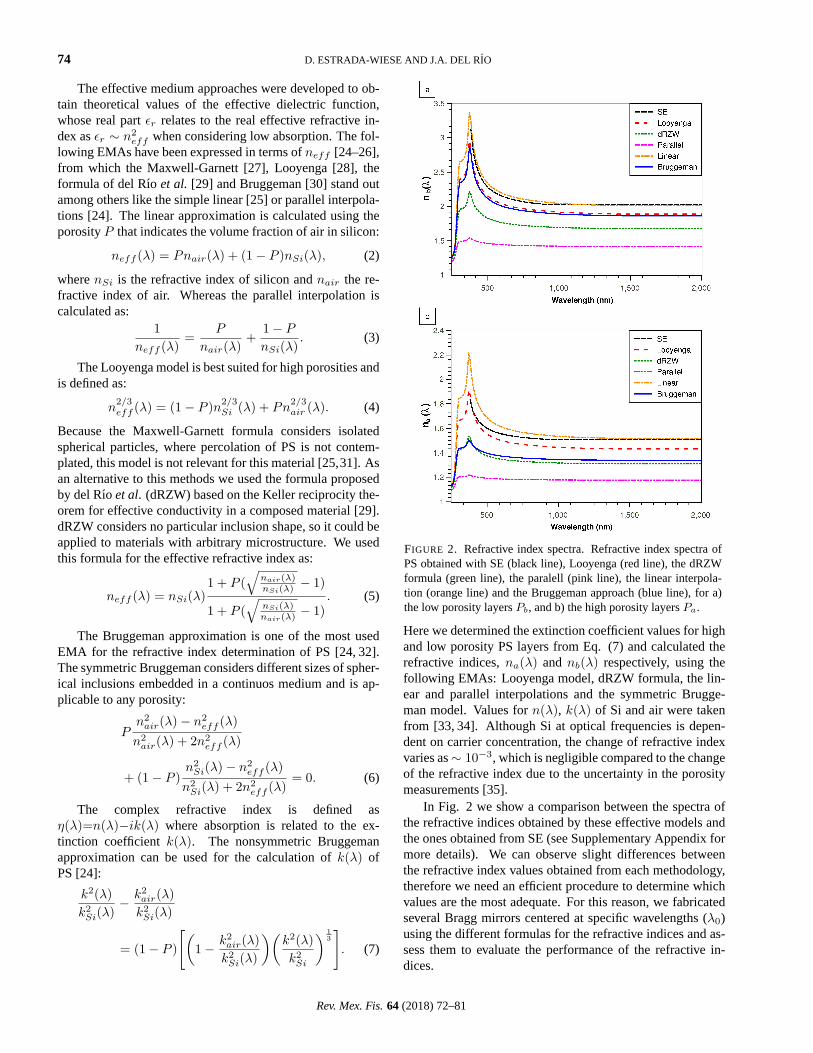
FIGURE 2. Refractive index spectra. Refractive index spectra ofPS obtained with SE (black line), Looyenga (red line), the dRZWformula (green line), the paralell (pink line), the linear interpola-tion (orange line) and the Bruggeman approach (blue line), for a)the low porosity layersPb, and b) the high porosity layersPa.
Here we determined the extinction coefficient values for highand low porosity PS layers from Eq. (7) and calculated therefractive indices,na(λ) and nb(λ) respectively, using thefollowing EMAs: Looyenga model, dRZW formula, the lin-ear and parallel interpolations and the symmetric Brugge-man model. Values forn(λ), k(λ) of Si and air were takenfrom [33, 34]. Although Si at optical frequencies is depen-dent on carrier concentration, the change of refractive indexvaries as∼ 10−3, which is negligible compared to the changeof the refractive index due to the uncertainty in the porositymeasurements [35].
In Fig. 2 we show a comparison between the spectra ofthe refractive indices obtained by these effective models andthe ones obtained from SE (see Supplementary Appendix formore details). We can observe slight differences betweenthe refractive index values obtained from each methodology,therefore we need an efficient procedure to determine whichvalues are the most adequate. For this reason, we fabricatedseveral Bragg mirrors centered at specific wavelengths (λ0)using the different formulas for the refractive indices and as-sess them to evaluate the performance of the refractive in-dices.
Rev. Mex. Fis.64 (2018) 72–81
REFRACTIVE INDEX EVALUATION OF POROUS SILICON USING BRAGG REFLECTORS 75
4. PS Bragg reflectors
Bragg reflectors are the simplest 1D photonic structures,since they are formed of alternating layers of high (na) andlow (nb) refractive index and repeating thicknessda anddb
respectively. When an electromagnetic wave with a specificwavelengthλ0 enters the structure, it is partially reflectedat each layer interface and satisfies the optical path relation:nidi = λ0/4, wherei = a for thePa layers andi = b forthePb layers. Due to the periodicity of the refractive indices,these multiple reflections interfere destructively avoiding thefurther propagation of the wave. In this manner a forbiddenband gap around a central wavelengthλ0 is formed, i.e. aperfect mirror atλ0. The multilayered structure that satisfiesthese properties is called a Bragg reflector. The procedure tofabricate these mirrors constrains the need of a low index rate(na/nb) between the layers in order to have a periodic poten-tial and consequently an increased band gap [6, 36, 37]. Weknow from our experimental experience that ourPa andPb
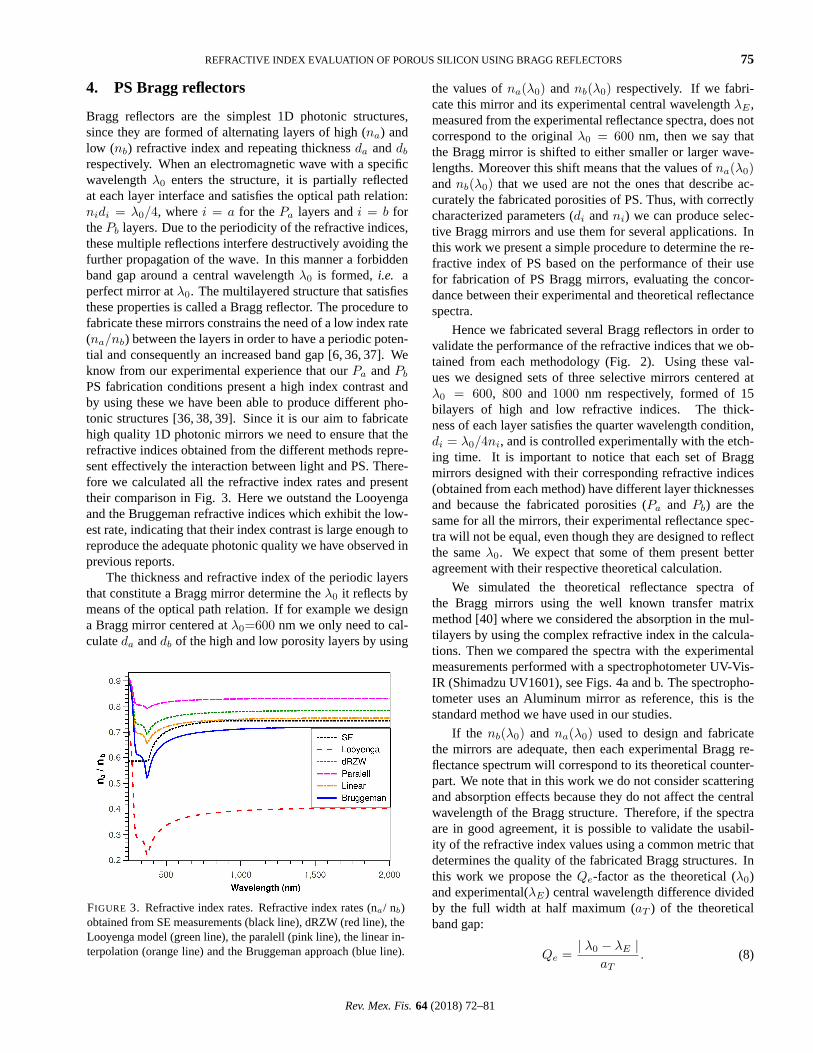
PS fabrication conditions present a high index contrast andby using these we have been able to produce different pho-tonic structures [36, 38, 39]. Since it is our aim to fabricatehigh quality 1D photonic mirrors we need to ensure that therefractive indices obtained from the different methods repre-sent effectively the interaction between light and PS. There-fore we calculated all the refractive index rates and presenttheir comparison in Fig. 3. Here we outstand the Looyengaand the Bruggeman refractive indices which exhibit the low-est rate, indicating that their index contrast is large enough toreproduce the adequate photonic quality we have observed inprevious reports.
The thickness and refractive index of the periodic layersthat constitute a Bragg mirror determine theλ0 it reflects bymeans of the optical path relation. If for example we designa Bragg mirror centered atλ0=600 nm we only need to cal-culateda anddb of the high and low porosity layers by using
FIGURE 3. Refractive index rates. Refractive index rates (na/ nb)obtained from SE measurements (black line), dRZW (red line), theLooyenga model (green line), the paralell (pink line), the linear in-terpolation (orange line) and the Bruggeman approach (blue line).
the values ofna(λ0) andnb(λ0) respectively. If we fabri-cate this mirror and its experimental central wavelengthλE ,measured from the experimental reflectance spectra, does notcorrespond to the originalλ0 = 600 nm, then we say thatthe Bragg mirror is shifted to either smaller or larger wave-lengths. Moreover this shift means that the values ofna(λ0)andnb(λ0) that we used are not the ones that describe ac-curately the fabricated porosities of PS. Thus, with correctlycharacterized parameters (di andni) we can produce selec-tive Bragg mirrors and use them for several applications. Inthis work we present a simple procedure to determine the re-fractive index of PS based on the performance of their usefor fabrication of PS Bragg mirrors, evaluating the concor-dance between their experimental and theoretical reflectancespectra.
Hence we fabricated several Bragg reflectors in order tovalidate the performance of the refractive indices that we ob-tained from each methodology (Fig. 2). Using these val-ues we designed sets of three selective mirrors centered atλ0 = 600, 800 and 1000 nm respectively, formed of 15bilayers of high and low refractive indices. The thick-ness of each layer satisfies the quarter wavelength condition,di = λ0/4ni, and is controlled experimentally with the etch-ing time. It is important to notice that each set of Braggmirrors designed with their corresponding refractive indices(obtained from each method) have different layer thicknessesand because the fabricated porosities (Pa and Pb) are thesame for all the mirrors, their experimental reflectance spec-tra will not be equal, even though they are designed to reflectthe sameλ0. We expect that some of them present betteragreement with their respective theoretical calculation.
We simulated the theoretical reflectance spectra ofthe Bragg mirrors using the well known transfer matrixmethod [40] where we considered the absorption in the mul-tilayers by using the complex refractive index in the calcula-tions. Then we compared the spectra with the experimentalmeasurements performed with a spectrophotometer UV-Vis-IR (Shimadzu UV1601), see Figs. 4a and b. The spectropho-tometer uses an Aluminum mirror as reference, this is thestandard method we have used in our studies.
If the nb(λ0) and na(λ0) used to design and fabricatethe mirrors are adequate, then each experimental Bragg re-flectance spectrum will correspond to its theoretical counter-part. We note that in this work we do not consider scatteringand absorption effects because they do not affect the centralwavelength of the Bragg structure. Therefore, if the spectraare in good agreement, it is possible to validate the usabil-ity of the refractive index values using a common metric thatdetermines the quality of the fabricated Bragg structures. Inthis work we propose theQe-factor as the theoretical (λ0)and experimental(λE) central wavelength difference dividedby the full width at half maximum (aT ) of the theoreticalband gap:
Qe =| λ0 − λE |
aT. (8)
Rev. Mex. Fis.64 (2018) 72–81
76 D. ESTRADA-WIESE AND J.A. DEL RIO
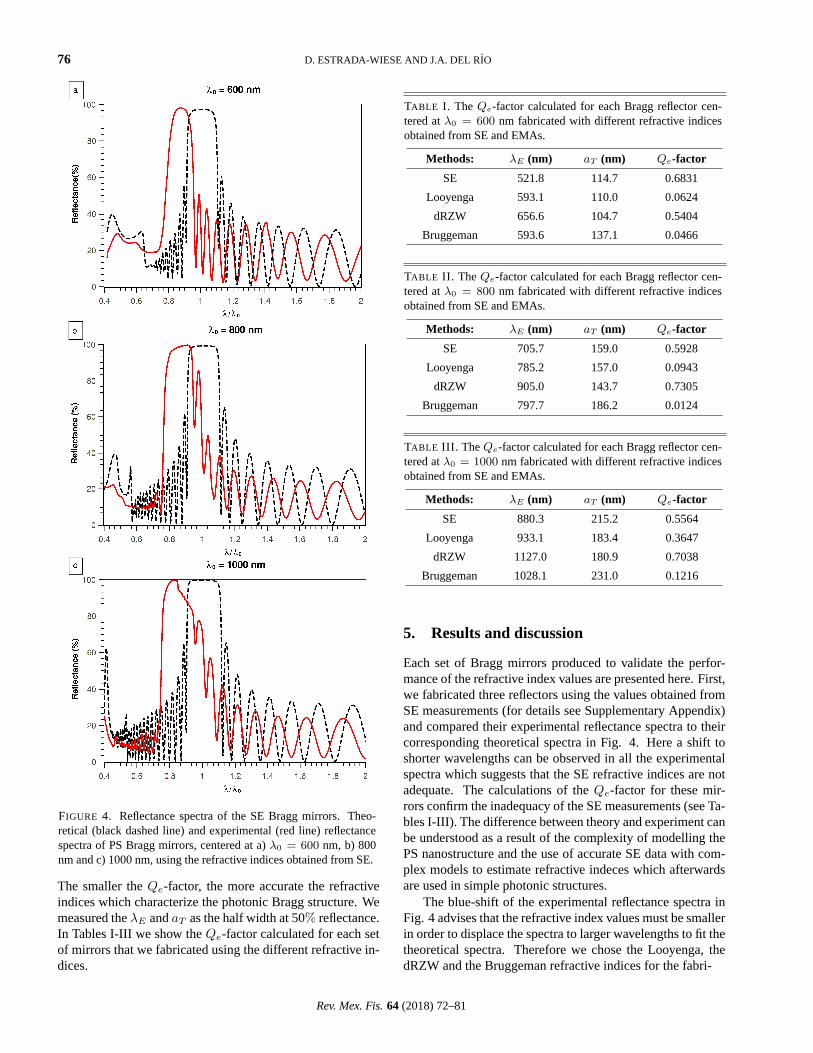
FIGURE 4. Reflectance spectra of the SE Bragg mirrors. Theo-retical (black dashed line) and experimental (red line) reflectancespectra of PS Bragg mirrors, centered at a)λ0 = 600 nm, b) 800nm and c) 1000 nm, using the refractive indices obtained from SE.
The smaller theQe-factor, the more accurate the refractiveindices which characterize the photonic Bragg structure. Wemeasured theλE andaT as the half width at 50% reflectance.In Tables I-III we show theQe-factor calculated for each setof mirrors that we fabricated using the different refractive in-dices.
TABLE I. The Qe-factor calculated for each Bragg reflector cen-tered atλ0 = 600 nm fabricated with different refractive indicesobtained from SE and EMAs.
Methods: λE (nm) aT (nm) Qe-factor
SE 521.8 114.7 0.6831
Looyenga 593.1 110.0 0.0624
dRZW 656.6 104.7 0.5404
Bruggeman 593.6 137.1 0.0466
TABLE II. TheQe-factor calculated for each Bragg reflector cen-tered atλ0 = 800 nm fabricated with different refractive indicesobtained from SE and EMAs.
Methods: λE (nm) aT (nm) Qe-factor
SE 705.7 159.0 0.5928
Looyenga 785.2 157.0 0.0943
dRZW 905.0 143.7 0.7305
Bruggeman 797.7 186.2 0.0124
TABLE III. TheQe-factor calculated for each Bragg reflector cen-tered atλ0 = 1000 nm fabricated with different refractive indicesobtained from SE and EMAs.
Methods: λE (nm) aT (nm) Qe-factor
SE 880.3 215.2 0.5564
Looyenga 933.1 183.4 0.3647
dRZW 1127.0 180.9 0.7038
Bruggeman 1028.1 231.0 0.1216
5. Results and discussion
Each set of Bragg mirrors produced to validate the perfor-mance of the refractive index values are presented here. First,we fabricated three reflectors using the values obtained fromSE measurements (for details see Supplementary Appendix)and compared their experimental reflectance spectra to theircorresponding theoretical spectra in Fig. 4. Here a shift toshorter wavelengths can be observed in all the experimentalspectra which suggests that the SE refractive indices are notadequate. The calculations of theQe-factor for these mir-rors confirm the inadequacy of the SE measurements (see Ta-bles I-III). The difference between theory and experiment canbe understood as a result of the complexity of modelling thePS nanostructure and the use of accurate SE data with com-plex models to estimate refractive indeces which afterwardsare used in simple photonic structures.
The blue-shift of the experimental reflectance spectra inFig. 4 advises that the refractive index values must be smallerin order to displace the spectra to larger wavelengths to fit thetheoretical spectra. Therefore we chose the Looyenga, thedRZW and the Bruggeman refractive indices for the fabri-
Rev. Mex. Fis.64 (2018) 72–81
REFRACTIVE INDEX EVALUATION OF POROUS SILICON USING BRAGG REFLECTORS 77
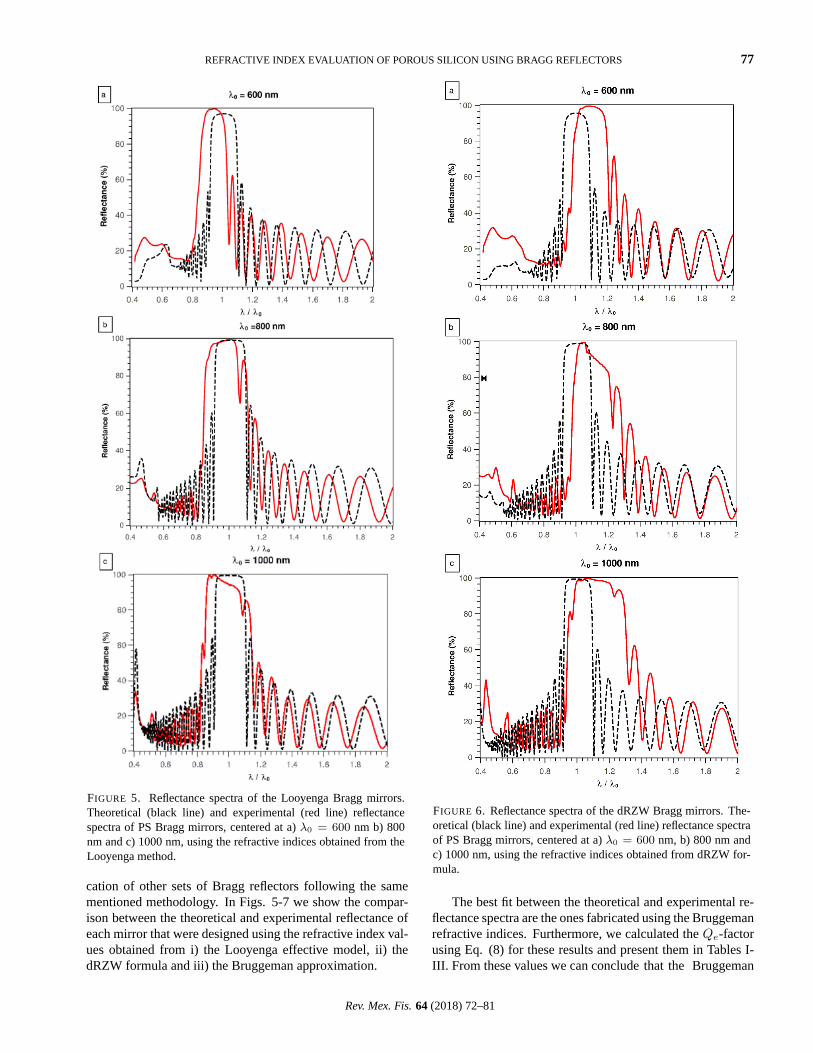
FIGURE 5. Reflectance spectra of the Looyenga Bragg mirrors.Theoretical (black line) and experimental (red line) reflectancespectra of PS Bragg mirrors, centered at a)λ0 = 600 nm b) 800nm and c) 1000 nm, using the refractive indices obtained from theLooyenga method.
cation of other sets of Bragg reflectors following the samementioned methodology. In Figs. 5-7 we show the compar-ison between the theoretical and experimental reflectance ofeach mirror that were designed using the refractive index val-ues obtained from i) the Looyenga effective model, ii) thedRZW formula and iii) the Bruggeman approximation.
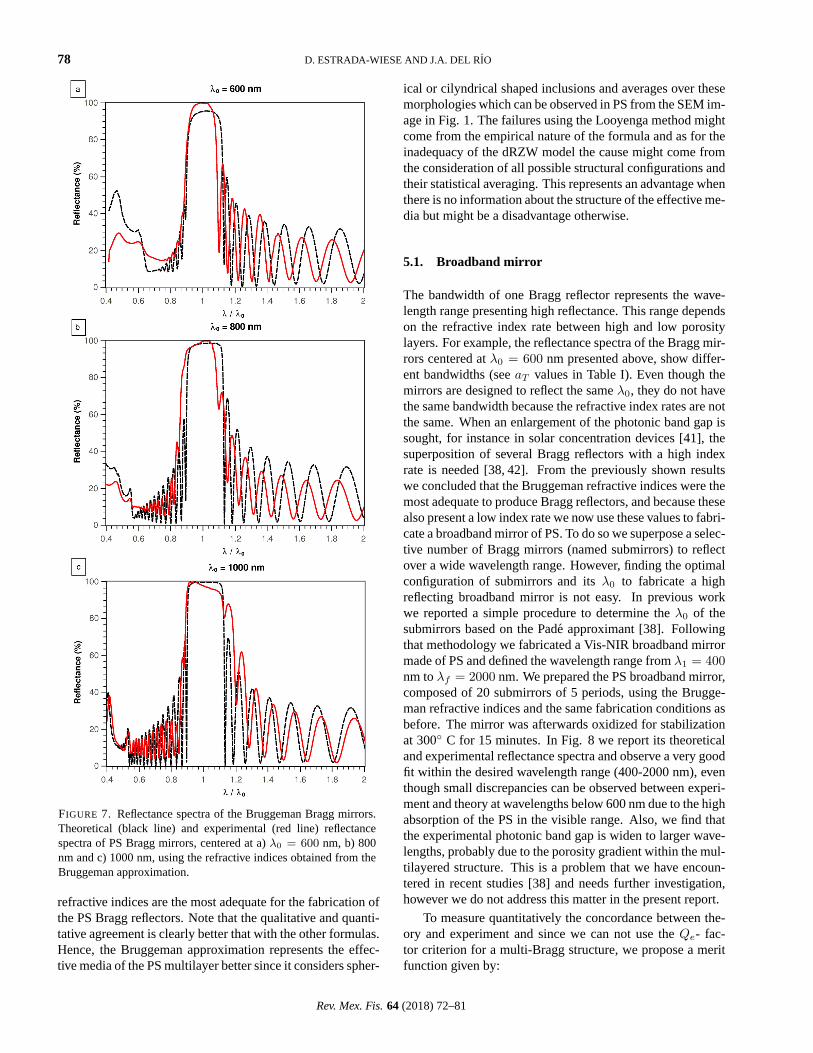
FIGURE 6. Reflectance spectra of the dRZW Bragg mirrors. The-oretical (black line) and experimental (red line) reflectance spectraof PS Bragg mirrors, centered at a)λ0 = 600 nm, b) 800 nm andc) 1000 nm, using the refractive indices obtained from dRZW for-mula.
The best fit between the theoretical and experimental re-flectance spectra are the ones fabricated using the Bruggemanrefractive indices. Furthermore, we calculated theQe-factorusing Eq. (8) for these results and present them in Tables I-III. From these values we can conclude that the Bruggeman
Rev. Mex. Fis.64 (2018) 72–81
78 D. ESTRADA-WIESE AND J.A. DEL RIO
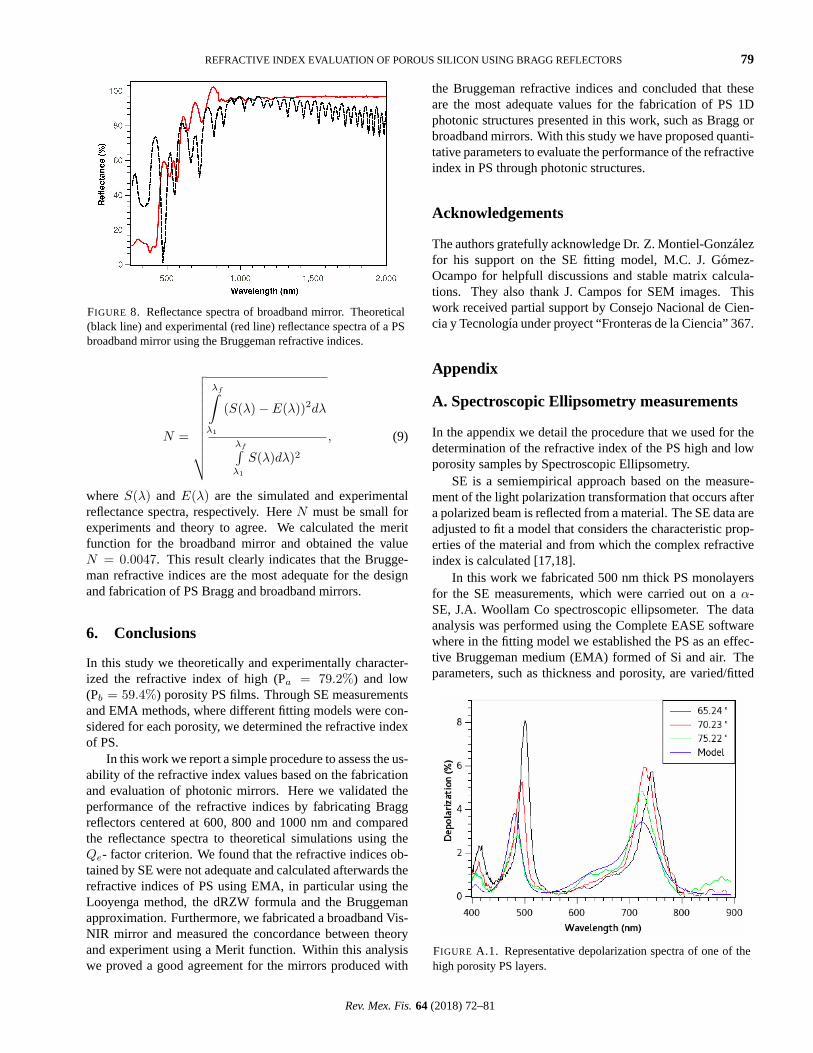
FIGURE 7. Reflectance spectra of the Bruggeman Bragg mirrors.Theoretical (black line) and experimental (red line) reflectancespectra of PS Bragg mirrors, centered at a)λ0 = 600 nm, b) 800nm and c) 1000 nm, using the refractive indices obtained from theBruggeman approximation.
refractive indices are the most adequate for the fabrication ofthe PS Bragg reflectors. Note that the qualitative and quanti-tative agreement is clearly better that with the other formulas.Hence, the Bruggeman approximation represents the effec-tive media of the PS multilayer better since it considers spher-
ical or cilyndrical shaped inclusions and averages over thesemorphologies which can be observed in PS from the SEM im-age in Fig. 1. The failures using the Looyenga method mightcome from the empirical nature of the formula and as for theinadequacy of the dRZW model the cause might come fromthe consideration of all possible structural configurations andtheir statistical averaging. This represents an advantage whenthere is no information about the structure of the effective me-dia but might be a disadvantage otherwise.
5.1. Broadband mirror
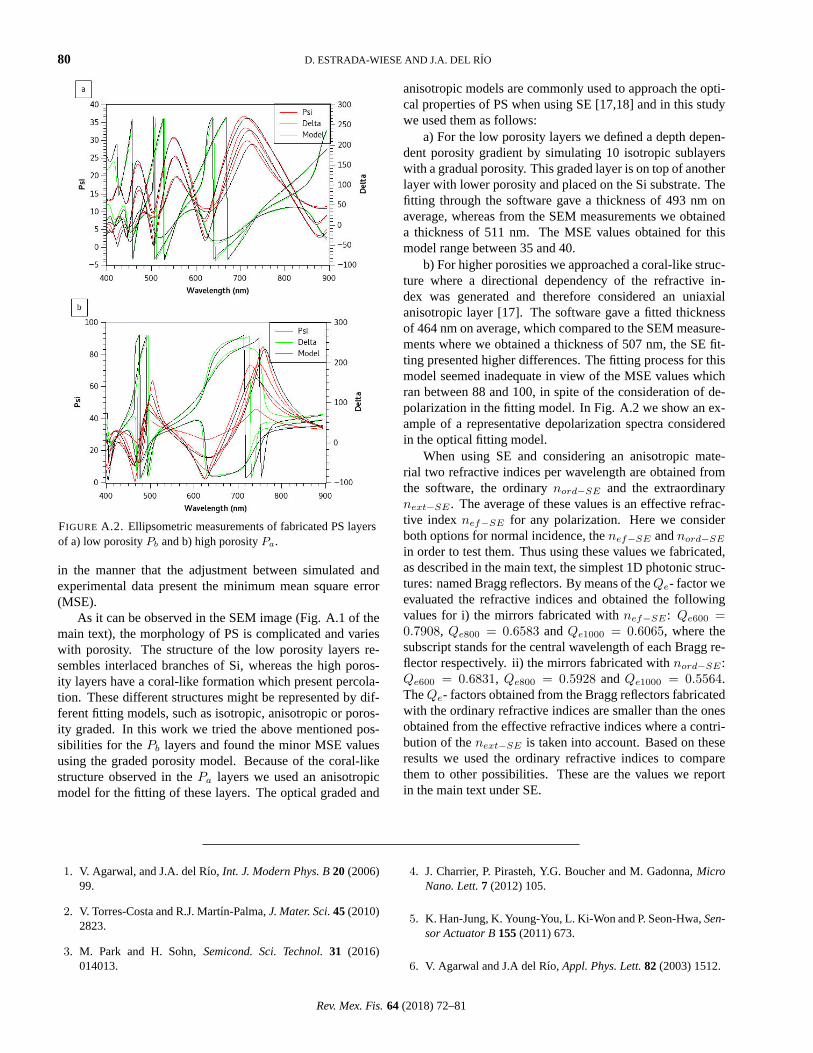
The bandwidth of one Bragg reflector represents the wave-length range presenting high reflectance. This range dependson the refractive index rate between high and low porositylayers. For example, the reflectance spectra of the Bragg mir-rors centered atλ0 = 600 nm presented above, show differ-ent bandwidths (seeaT values in Table I). Even though themirrors are designed to reflect the sameλ0, they do not havethe same bandwidth because the refractive index rates are notthe same. When an enlargement of the photonic band gap issought, for instance in solar concentration devices [41], thesuperposition of several Bragg reflectors with a high indexrate is needed [38, 42]. From the previously shown resultswe concluded that the Bruggeman refractive indices were themost adequate to produce Bragg reflectors, and because thesealso present a low index rate we now use these values to fabri-cate a broadband mirror of PS. To do so we superpose a selec-tive number of Bragg mirrors (named submirrors) to reflectover a wide wavelength range. However, finding the optimalconfiguration of submirrors and itsλ0 to fabricate a highreflecting broadband mirror is not easy. In previous workwe reported a simple procedure to determine theλ0 of thesubmirrors based on the Pade approximant [38]. Followingthat methodology we fabricated a Vis-NIR broadband mirrormade of PS and defined the wavelength range fromλ1 = 400nm toλf = 2000 nm. We prepared the PS broadband mirror,composed of 20 submirrors of 5 periods, using the Brugge-man refractive indices and the same fabrication conditions asbefore. The mirror was afterwards oxidized for stabilizationat 300 C for 15 minutes. In Fig. 8 we report its theoreticaland experimental reflectance spectra and observe a very goodfit within the desired wavelength range (400-2000 nm), eventhough small discrepancies can be observed between experi-ment and theory at wavelengths below 600 nm due to the highabsorption of the PS in the visible range. Also, we find thatthe experimental photonic band gap is widen to larger wave-lengths, probably due to the porosity gradient within the mul-tilayered structure. This is a problem that we have encoun-tered in recent studies [38] and needs further investigation,however we do not address this matter in the present report.
To measure quantitatively the concordance between the-ory and experiment and since we can not use theQe- fac-tor criterion for a multi-Bragg structure, we propose a meritfunction given by:
Rev. Mex. Fis.64 (2018) 72–81
REFRACTIVE INDEX EVALUATION OF POROUS SILICON USING BRAGG REFLECTORS 79
FIGURE 8. Reflectance spectra of broadband mirror. Theoretical(black line) and experimental (red line) reflectance spectra of a PSbroadband mirror using the Bruggeman refractive indices.
N =
√√√√√√√√√√√
λf∫
λ1
(S(λ)− E(λ))2dλ
λf∫λ1
S(λ)dλ)2, (9)
whereS(λ) and E(λ) are the simulated and experimentalreflectance spectra, respectively. HereN must be small forexperiments and theory to agree. We calculated the meritfunction for the broadband mirror and obtained the valueN = 0.0047. This result clearly indicates that the Brugge-man refractive indices are the most adequate for the designand fabrication of PS Bragg and broadband mirrors.
6. Conclusions
In this study we theoretically and experimentally character-ized the refractive index of high (Pa = 79.2%) and low(Pb = 59.4%) porosity PS films. Through SE measurementsand EMA methods, where different fitting models were con-sidered for each porosity, we determined the refractive indexof PS.
In this work we report a simple procedure to assess the us-ability of the refractive index values based on the fabricationand evaluation of photonic mirrors. Here we validated theperformance of the refractive indices by fabricating Braggreflectors centered at 600, 800 and 1000 nm and comparedthe reflectance spectra to theoretical simulations using theQe- factor criterion. We found that the refractive indices ob-tained by SE were not adequate and calculated afterwards therefractive indices of PS using EMA, in particular using theLooyenga method, the dRZW formula and the Bruggemanapproximation. Furthermore, we fabricated a broadband Vis-NIR mirror and measured the concordance between theoryand experiment using a Merit function. Within this analysiswe proved a good agreement for the mirrors produced with
the Bruggeman refractive indices and concluded that theseare the most adequate values for the fabrication of PS 1Dphotonic structures presented in this work, such as Bragg orbroadband mirrors. With this study we have proposed quanti-tative parameters to evaluate the performance of the refractiveindex in PS through photonic structures.
Acknowledgements
The authors gratefully acknowledge Dr. Z. Montiel-Gonzalezfor his support on the SE fitting model, M.C. J. Gomez-Ocampo for helpfull discussions and stable matrix calcula-tions. They also thank J. Campos for SEM images. Thiswork received partial support by Consejo Nacional de Cien-cia y Tecnologıa under proyect “Fronteras de la Ciencia” 367.
Appendix
A. Spectroscopic Ellipsometry measurements
In the appendix we detail the procedure that we used for thedetermination of the refractive index of the PS high and lowporosity samples by Spectroscopic Ellipsometry.
SE is a semiempirical approach based on the measure-ment of the light polarization transformation that occurs aftera polarized beam is reflected from a material. The SE data areadjusted to fit a model that considers the characteristic prop-erties of the material and from which the complex refractiveindex is calculated [17,18].
In this work we fabricated 500 nm thick PS monolayersfor the SE measurements, which were carried out on aα-SE, J.A. Woollam Co spectroscopic ellipsometer. The dataanalysis was performed using the Complete EASE softwarewhere in the fitting model we established the PS as an effec-tive Bruggeman medium (EMA) formed of Si and air. Theparameters, such as thickness and porosity, are varied/fitted
FIGURE A.1. Representative depolarization spectra of one of thehigh porosity PS layers.
Rev. Mex. Fis.64 (2018) 72–81
80 D. ESTRADA-WIESE AND J.A. DEL RIO
FIGURE A.2. Ellipsometric measurements of fabricated PS layersof a) low porosityPb and b) high porosityPa.
in the manner that the adjustment between simulated andexperimental data present the minimum mean square error(MSE).
As it can be observed in the SEM image (Fig. A.1 of themain text), the morphology of PS is complicated and varieswith porosity. The structure of the low porosity layers re-sembles interlaced branches of Si, whereas the high poros-ity layers have a coral-like formation which present percola-tion. These different structures might be represented by dif-ferent fitting models, such as isotropic, anisotropic or poros-ity graded. In this work we tried the above mentioned pos-sibilities for thePb layers and found the minor MSE valuesusing the graded porosity model. Because of the coral-likestructure observed in thePa layers we used an anisotropicmodel for the fitting of these layers. The optical graded and
anisotropic models are commonly used to approach the opti-cal properties of PS when using SE [17,18] and in this studywe used them as follows:
a) For the low porosity layers we defined a depth depen-dent porosity gradient by simulating 10 isotropic sublayerswith a gradual porosity. This graded layer is on top of anotherlayer with lower porosity and placed on the Si substrate. Thefitting through the software gave a thickness of 493 nm onaverage, whereas from the SEM measurements we obtaineda thickness of 511 nm. The MSE values obtained for thismodel range between 35 and 40.
b) For higher porosities we approached a coral-like struc-ture where a directional dependency of the refractive in-dex was generated and therefore considered an uniaxialanisotropic layer [17]. The software gave a fitted thicknessof 464 nm on average, which compared to the SEM measure-ments where we obtained a thickness of 507 nm, the SE fit-ting presented higher differences. The fitting process for thismodel seemed inadequate in view of the MSE values whichran between 88 and 100, in spite of the consideration of de-polarization in the fitting model. In Fig. A.2 we show an ex-ample of a representative depolarization spectra consideredin the optical fitting model.
When using SE and considering an anisotropic mate-rial two refractive indices per wavelength are obtained fromthe software, the ordinarynord−SE and the extraordinarynext−SE . The average of these values is an effective refrac-tive indexnef−SE for any polarization. Here we considerboth options for normal incidence, thenef−SE andnord−SE
in order to test them. Thus using these values we fabricated,as described in the main text, the simplest 1D photonic struc-tures: named Bragg reflectors. By means of theQe- factor weevaluated the refractive indices and obtained the followingvalues for i) the mirrors fabricated withnef−SE : Qe600 =0.7908, Qe800 = 0.6583 andQe1000 = 0.6065, where thesubscript stands for the central wavelength of each Bragg re-flector respectively. ii) the mirrors fabricated withnord−SE :Qe600 = 0.6831, Qe800 = 0.5928 andQe1000 = 0.5564.TheQe- factors obtained from the Bragg reflectors fabricatedwith the ordinary refractive indices are smaller than the onesobtained from the effective refractive indices where a contri-bution of thenext−SE is taken into account. Based on theseresults we used the ordinary refractive indices to comparethem to other possibilities. These are the values we reportin the main text under SE.
1. V. Agarwal, and J.A. del Rıo, Int. J. Modern Phys. B20 (2006)99.
2. V. Torres-Costa and R.J. Martın-Palma,J. Mater. Sci.45 (2010)2823.
3. M. Park and H. Sohn,Semicond. Sci. Technol.31 (2016)014013.
4. J. Charrier, P. Pirasteh, Y.G. Boucher and M. Gadonna,MicroNano. Lett.7 (2012) 105.
5. K. Han-Jung, K. Young-You, L. Ki-Won and P. Seon-Hwa,Sen-sor Actuator B155(2011) 673.
6. V. Agarwal and J.A del Rıo, Appl. Phys. Lett.82 (2003) 1512.
Rev. Mex. Fis.64 (2018) 72–81
REFRACTIVE INDEX EVALUATION OF POROUS SILICON USING BRAGG REFLECTORS 81
7. U.C. Hasar, I.Y. Ozbek, E.A. Oral, T. Karacali and H. Efeoglu,Opt. Express20 (2012) 22208.
8. S.M. Weiss, G. Rong and J.L. Lawrie,Physica E41 (2009)1071.
9. R.S. Dubey and D.K. Gautam,Optik 122(2011) 494.
10. N.H. Maniya, S.R. Patel and Z.V.P. Murthy,Supperlatic. Mi-crost.55 (2013) 144.
11. J.E. Lugo,et al., Opt. Express17 (2009) 3042.
12. E. Xifre- Perez, L.F. Marsal, J. Ferr-Borrull and J. Pallares,Appl. Phys. B95 (2009) 169.
13. S. Chappel, L. DeLouise and B. Gersten, NSTI-Nanotech.3(2006) 487.
14. H. Zhang, A. Jia, X. Lv and Y. Liu,Optik 125(2014) 557.
15. R. Cisneros, C. Ramırez and Ch. Wang,J. Phys.: Condens.Matter.19 (2007) 395010.
16. A. Shokrollahi, M. Zare, A. Mortezaali and S. Ramezani Sani,J. Appl. Phys.112(2012) 053506.
17. Z. Montiel-Gonzalez, S. Escobar, R. Nava, J.A. del Rıo and J.Taguena-Martınez,Sci. Rep6 (2016) 24798.
18. E. Xifre-Perez, E. Garcia-Caurel, J. Pallares, J. Ferre-Borrulland L.F. Marsal,Mater. Sci. Eng. B147(2008) 205.
19. P.Petrik,et al., J. Appl. Phys.105(2009) 024908.
20. B. Fodor,et al., Micropor. Mesopor. Mat. 227(2016) 112.
21. F.A. Harraz,Sens. Actuator. B-Chem.202(2014) 897.
22. M.C. Arenas, H. Hu, R. Nava and J.A. del Rıo, Int. J. Mod.Phys. B24 (2010) 4835.
23. N. Hutchinson, T. Coquil, E.K. Richman, S.H. Tolbert and L.Pilon,Thin Solid Films518(2010) 2134.
24. N.J. Hutchinson, T. Coquil, A. Navid and L. Pilon,Thin SolidFilms 518(2010) 2141.
25. A. Wolf, B. Terheiden, and R. Brendel,J. Appl. Phys.104(2008) 033106.
26. H. Sohn, Handbook of Porous Silicon:Refractive Index ofPorous Silicon, (Springer International Publishing Switzerland2014), pp. 1-10.
27. J.C. Maxwell-Garnett,Philos. Trans. R. Soc. Lond. A203(1904) 359.
28. H. Looyenga,Physica (Amsterdam)31 (1965) 401.
29. J.A. del Rıo, R.W. Zimmerman, and R.A. Dawe,Soli. S. Com-muni.106(1998) 183.
30. D.A.G. Bruggeman,Ann. Phys.416(1935) 636.
31. W. Theifl,Surf. Sci. Rep.29 (1997) 91.
32. M. Khardani, M. Bouaıcha and B. Bessaıs,Phys. Stat. Sol. (C)4 (2007) 1986.
33. C. Honsberg and S. Bowden,Optical Properties of Silicon
http://www.pveducation.org/pvcdrom/materials/optical-properties-of-silicon(accessed 04/07/2017).
34. M. Polyanskiy,Refractive index of Air(2008). http://refract/ive
index.info?shelf=other&book=air&page=Ciddor(accessed 04/07/2017)
35. G.T. Reed,Silicon Photonics. The state of the art, (Wiley, 105University of Surrey UK 2008) pp. 105.
36. R. Nava, M.B. de la Mora, J. Taguena- Martınez and J.A. delRıo, Phys. Status. Solidi. C6 (2009) 1721.
37. A. Birner, R.B. Wehrspohn, U.M. Gosele and K. Busch,Adv.Mater.13 (2001) 377.
38. D. Estrada-Wiese,et al., Sol. Energ. Mater. Sol. Cells141(2015) 315.
39. C.N. Sanchezet al., Mesoporous Biomater3 (2016) 15.
40. E. Hecht,Optica. 4th ed. (Adelphi University 2002) pp. 425-428.
41. M.B. de la Mora, O.A. Jaramillo, R. Nava, J. Taguena Martınezand J.A. del Rıo, Sol. Energ. Mater. Sol. Cells93 (2009) 1218.
42. A. Bruyant, G. Lerondel, P.J. Reece and M. Gal,Appl. Phys.Lett.82 (2003) 3327.
Rev. Mex. Fis.64 (2018) 72–81