Embed Size (px)
Citation preview

Reflections on School Redesigns
Report to the Board of EducationSept. 25, 2012

Overview:
2
• Plan Review• Plan Goals based on Guiding Principles• Efficiency
• Utilization: Building Utilization and Student Enrollment• Capital Expenditures• Cost of Operations: Cost Review
• Effectiveness• Student Outcomes:
• Academic Growth and Proficiency• Educational Environments:
• Attendance, Disciplinary and Parental Involvement Data• Summary and Next Steps

Plan Goals based on Guiding Principles• After a nine-month review in 2010, CMS closed 11 facilities to become more effective
and efficient in the following manner:
– Efficiency
• Better utilize facilities
• Decrease capital expenditures
• Reduce cost of operations
• Minimize impacts on the classroom
– Effectiveness
• Improve student outcomes
• Improve educational environments
• This presentation represents a year-one view of the performance of impacted students and schools. A minimum of four years of trend data will need to be collected before determining the outcome.
3

Goal Status Comment
Become More Efficient Cost impacts are positive. Utilization varies by location, some facilities are fully utilized and mobile units are needed
• Better utilize facilities • 2010-11 FY: Most facilities were underutilized and in poor condition
• 2012-13 FY: Most facilities are now fully utilizeddue to enrollment growth, return from magnet programs, increase in 6th graders, and Title I Choice
• Decrease capital expenditures
• Redesign efforts generated a cost avoidance of $138M ($118M K-12, $20M Pre-K)
• Reduce cost of operations • $6.9 M one-time investment; $5.2M/yr recurring savings
4
Efficiency: Progress to Date (Minimum of 4 years of data needed for full outcome assessment)

Effectiveness: Progress to Date (Minimum of 4 years of data needed for full outcome assessment)
Goal Status Comment
Become More Effective • Student outcomes vary by subject and grade; achievement changes vary from school to school, similar to prior years
• Improve student outcomes
Impacted (Pre K-8):• Grades 3-5 Proficiency: Most schools’ reading proficiency
increased. Ashley Park and Walter G. Byers had substantial increases in proficiency rates; most remaining schools decreased.
• Grades 6-8: Only baseline data is available• Growth: Cohort analysis show mixed results
• Improve educational environments
• Attendance patterns are consistent
5

Efficiency: Building Utilization* • J.T. Williams, Spaugh and Wilson middle school closures and (Pre K-8) school redesigns
impacted building utilization and student enrollment for several schools in the surrounding areas.
*Appendix pages 40-42 include a listing of building utilization by year and building
6

Efficiency: Building Utilization* 2010-11• In 2010-11, three schools were within the desired utilization range of 80-100%.
•Davidson IB 111%• (Closed, moved to Alexander MS)
Overutilized: > 100% Utilization
•Reid Park (Pre K-8): 89%•Bruns Avenue (Pre K-8) 82%•Druid Hills (Pre K-8) 86%
Desired Utilization:
80%-100% Utilization
•Ashley Park (Pre K-8) 54%•Berryhill (Pre K-8) 63%•Thomasboro (Pre K-8) 67%•Walter G. Byers (Pre K-8) 75%•Westerly Hills (Pre K-8) 72%• J.T. Williams (closed) 63%• Spaugh MS (closed) 66%•Wilson MS (closed) 74%• J.M. Alexander MS 52%•Whitewater MS 46%
Underutilized:
<80% Utilization
7
*Utilization without mobiles
*Staff building capacity calculation: Total # of teachers (based on teacher allocation) /# of Building Classrooms

Efficiency: Building Utilization* 2011-12
• In 2011-12, actual enrollment exceeded planned enrollment. The majority of schools were over utilized. Whitewater and JM Alexander middle schools were within the desired utilization range.
•Ashley Park (Pre K-8) 139%•Berryhill (Pre K-8) 125%•Bruns Avenue (Pre K-8) 118%•Druid Hills (Pre K-8) 109%•Reid Park (Pre K-8) 140%•Thomasboro (Pre K-8) 141%•Walter G. Byers (Pre K-8) 103%•Westerly Hills (Pre K-8) 103%
Overutilized: > 100% Utilization*
•Whitewater MS 93% • J.M. Alexander MS 84%
Desired Utilization:
80%-100% Utilization*
•N/AUnderutilized:
<80% Utilization
8
*Utilization without mobiles
*Staff building capacity calculation: Total # of teachers (based on teacher allocation) /# of Building Classrooms

Efficiency: Student Enrollment Data* 2011-12 Actual v. Planned
• School staffing and resource allocation are largely based on projections completed in the prior school year. 2011-12 enrollment was significantly larger than projected in 2010.
• Schools not listed were within 30 students of enrollment projections
• Berryhill (Pre K-8)
• Reid Park (Pre K-8)
• Thomasboro (Pre K-8)
• Marie G. Davis (-)
>100 Outside of Plan
• Ashley Park (Pre K-8)
• Bruns Avenue (Pre K-8)
• Billingsville ES
• Rama Rd ES
• Dilworth ES
• Alexander Graham MS
50-100Outside of Plan
• Druids Hills Pre K-8
• Whitewater MS
• Nathanial Alexander ES
Enrollment Exceeded Projections
30 – 49 Outside of Plan
*Appendix pages 43-46 include a listing of student enrollment by building.
9
Efficiency: Factors Impacting 2011-12 Enrollment
• Factors for actual enrollment exceeding projection:
– Enrollment growth
– Increase in 6th graders
– Return from closed magnet programs
– Title I Choice options eliminated
10

Efficiency: Building Utilization*• Redesign efforts, including the closure of E.E. Waddell High School, directly impacted building
utilization and student enrollment at other schools in the surrounding areas.
*Appendix pages 40-42 include a listing of building utilization by year and building
11

Efficiency: Building Utilization* 2010-11• In 2010-11, West Charlotte and West Mecklenburg high schools with 84% student building
capacity utilization rates, were the only impacted schools within desired utilization range.
•Garinger HS 108%Overutilized: > 100% Utilization
•West Charlotte HS 84% •West Mecklenburg HS 84%
Desired Utilization:
80%-100% Utilization
•Cochrane Collegiate Academy 6-12 57%•Harding University HS 52%•Phillip O. Berry Academy 72%• South Mecklenburg HS 72%•E.E. Waddell HS (closed) 72%
Underutilized:
<80% Utilization
12
*Staff building capacity calculation: Total # of teachers (based on teacher allocation) /# of Building Classrooms

Efficiency: Building Utilization* 2011-12
• In 2011-12, three schools are within the desired utilization range and four schools are over utilized.
*Staff building capacity calculation: Total # of teachers (based on teacher allocation) /# of Building Classrooms
•Garinger HS 122%•Harding HS 131%•Phillip O. Berry Academy of Technology 103%• South Mecklenburg HS 113%•E.E. Waddell Language Academy 104%
Overutilized: > 100% Utilization
•Cochrane Collegiate Academy 6-12 81%•West Charlotte HS 99% •West Mecklenburg HS 98%
Desired Utilization:
80%-100% Utilization
•N/AUnderutilized:
<80% Utilization
13

Efficiency: Student Enrollment Data*
• School staffing and resource allocation are largely based on projections completed in the prior school year. 2011-12 enrollment was significantly larger than projected in 2010.
• Schools not listed were within 30 students of enrollment projection.
• Cochrane Collegiate Academy
• Phillip O. Berry Academy
• West Mecklenburg HS
>100 Outside of Plan
• Harding University HS
50-100Outside of Plan
• South Mecklenburg HS
Enrollment Exceeded Projections
30 – 49 Outside of Plan
*Appendix pages 43-46 include a listing of student enrollment by building.
14

Efficiency: Capital Cost Avoidance• The 2008 Capital Needs Assessment (most current Board-approved CNA before the 2010
decision) included estimates for capital expenditure projects.• The redesign efforts removed the need for these projects, generating a cost avoidance of $138M
($118M K-12, $20M Pre-K).
2007 Bond Projects $ MillionsAmay James 5.2Davidson IB 5.5
Subtotal 10.7
10-Year Plan ProjectsWilson MS 29.0
Pawtuckett ES 16.5Bishop Spaugh MS 20.1
Villa Heights 4.7Smith K-8 16.7
J.T. Williams MS 20.6Subtotal 107.6
K-12 PROJECT TOTAL 118.3
Pre K Facilities $ MillionsDouble Oaks 7.8Tryon Hills 5.3Starmount 1.0Plaza Road 5.6PRE K PROJECT TOTAL 19.7
Capital Cost Avoidance
15

Efficiency: Reduce Cost of Operations
One Time Investment
Construction/Design Costs $4.8 M
Mobile Unit Moves/Setup .7 M
Move Management/Staff Move Support .8 M
Telecommunications/Technology .5 M
Other Contracted Services/Materials .1 M
Total $6.9 M
• A one-time investment of $6.9 M was made to support the school redesign effort • $6.5M from 2010-11 and $.4M from 2011-12
• Beginning in FY 2011-12, the school redesigns began generating an annual recurring savings of $5.2M - reflected as a reduction in 2011-12 budget
Annual Recurring Savings(Ongoing from FY2011-2012)
Staffing $4.3 M
Utilities 0.7 M
Maintenance/Custodial 0.2 M
Total $5.2 M
Investment and Savings Overview
16

Effectiveness:• Student Outcomes:
• (Pre K-8) Analysis
• Academic Proficiency
• Academic Growth
• Cohort Analysis
• Elementary, Middle and High Schools:
• School-wide Growth Data
• High School Subject Proficiency Data
• Educational Environments: Attendance Data
17
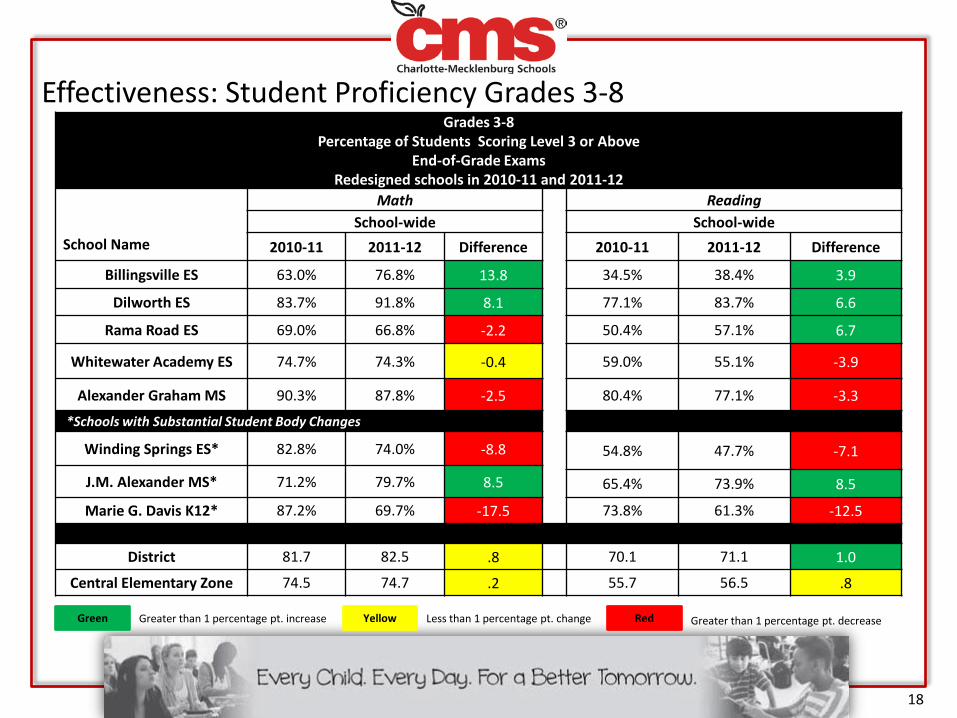
Grades 3-8Percentage of Students Scoring Level 3 or Above
End-of-Grade ExamsRedesigned schools in 2010-11 and 2011-12
School Name
Math ReadingSchool-wide School-wide
2010-11 2011-12 Difference 2010-11 2011-12 Difference
Billingsville ES 63.0% 76.8% 13.8 34.5% 38.4% 3.9
Dilworth ES 83.7% 91.8% 8.1 77.1% 83.7% 6.6
Rama Road ES 69.0% 66.8% -2.2 50.4% 57.1% 6.7
Whitewater Academy ES 74.7% 74.3% -0.4 59.0% 55.1% -3.9
Alexander Graham MS 90.3% 87.8% -2.5 80.4% 77.1% -3.3
*Schools with Substantial Student Body Changes
Winding Springs ES* 82.8% 74.0% -8.8 54.8% 47.7% -7.1
J.M. Alexander MS* 71.2% 79.7% 8.5 65.4% 73.9% 8.5
Marie G. Davis K12* 87.2% 69.7% -17.5 73.8% 61.3% -12.5
District 81.7 82.5 .8 70.1 71.1 1.0
Central Elementary Zone 74.5 74.7 .2 55.7 56.5 .8
Effectiveness: Student Proficiency Grades 3-8
18
Greater than 1 percentage pt. decrease Green Greater than 1 percentage pt. increase Yellow Less than 1 percentage pt. change Red
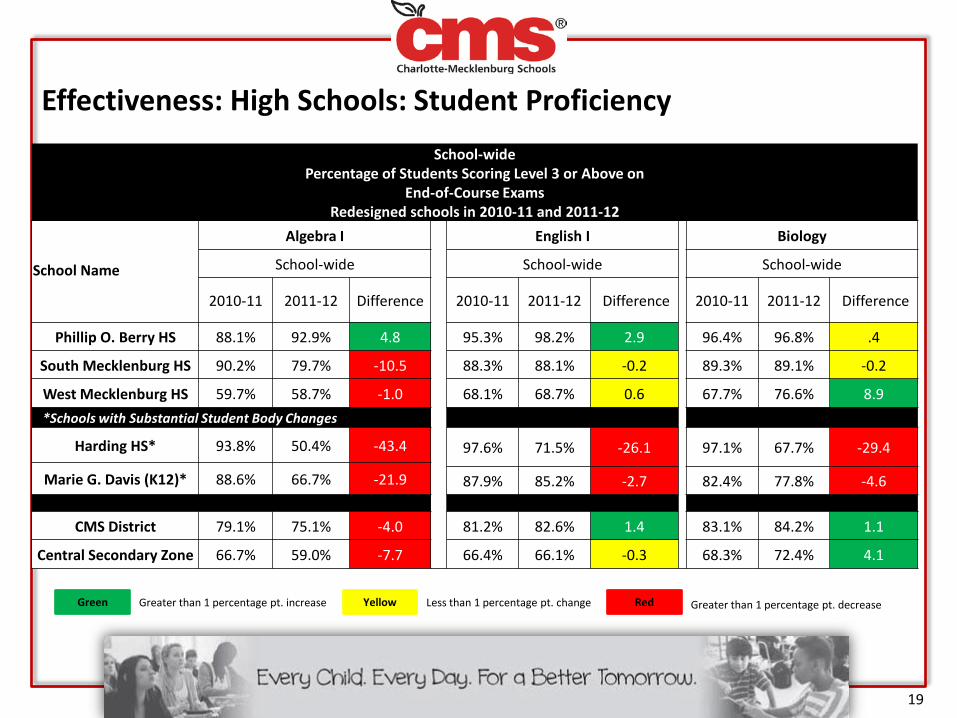
School-wide Percentage of Students Scoring Level 3 or Above on
End-of-Course ExamsRedesigned schools in 2010-11 and 2011-12
School Name
Algebra I English I Biology
School-wide School-wide School-wide
2010-11 2011-12 Difference 2010-11 2011-12 Difference 2010-11 2011-12 Difference
Phillip O. Berry HS 88.1% 92.9% 4.8 95.3% 98.2% 2.9 96.4% 96.8% .4
South Mecklenburg HS 90.2% 79.7% -10.5 88.3% 88.1% -0.2 89.3% 89.1% -0.2
West Mecklenburg HS 59.7% 58.7% -1.0 68.1% 68.7% 0.6 67.7% 76.6% 8.9
*Schools with Substantial Student Body Changes
Harding HS* 93.8% 50.4% -43.4 97.6% 71.5% -26.1 97.1% 67.7% -29.4
Marie G. Davis (K12)* 88.6% 66.7% -21.9 87.9% 85.2% -2.7 82.4% 77.8% -4.6
CMS District 79.1% 75.1% -4.0 81.2% 82.6% 1.4 83.1% 84.2% 1.1
Central Secondary Zone 66.7% 59.0% -7.7 66.4% 66.1% -0.3 68.3% 72.4% 4.1
Effectiveness: High Schools: Student Proficiency
19
Greater than 1 percentage pt. decrease Green Greater than 1 percentage pt. increase Yellow Less than 1 percentage pt. change Red

Growth for Redesigned schools in 2010-11 and 2011-12
School Name
2010-11 2011-12Achieved
Expected GrowthAchieved
High GrowthAchieved
Expected GrowthAchieved
High Growth
Billingsville ES Yes Yes Yes Yes
Dilworth ES Yes Yes Yes Yes
Rama Road ES Yes Yes Yes No
Whitewater Academy ES
Yes Yes Yes No
Alexander Graham MS Yes Yes Yes Yes
Phillip O. Berry HS Yes No Yes Yes
South Mecklenburg HS Yes No Yes No
West Mecklenburg HS
Yes No Yes No
*Schools with Substantial Student Body Changes
Winding Springs ES* Yes No No No
J.M. Alexander MS* No No Yes No
Marie G. Davis K12* Yes Yes No No
Harding HS* Yes Yes No No
Effectiveness: Elementary, Middle, and High School Growth
209/25/2012

Effectiveness: Pre K-8: 3rd – 5th Grade Proficiency Levels
Greater than 1 percentage pt. decrease Green Greater than 1 percentage pt. increase Yellow Less than 1 percentage pt. change Red
School Name
Grades 3-5 Percentage of Students Scoring Level 3 or Above
End-of-Grade ExamsPre K-8 Schools
Reading2010-11 2011-12 Difference
Ashley Park Pre K-8 46.2% 47.6% 1.4Berryhill Pre K-8 60.5% 68.1% 7.6
Bruns Avenue Pre K-8 43.9% 40.5% -3.4Druid Hills Pre K-8 35.2% 37.3% 2.1Reid Park Pre K-8 37.6% 31.3% -6.3
Thomasboro Pre K-8 44.6% 43.7% -0.9Walter G. Byers Pre K-8 33.7% 43.7% 10.0Westerly Hills Pre K-8 48.5% 55.4% 6.9
District 70.0% 71.1% 1.1Central Elementary Zone 55.7% 56.7% 1.0
• Five of eight schools increased the percentage of students scoring proficient in reading:
–Walter G. Byers increased by 10 percentage points and Berryhill increased by 7.6 percentage points.
–Bruns Avenue decreased by 3.4 percentage points and Reid Park decreased by 6.3 percentage points.
21

Effectiveness: Pre K-8 3rd – 5th Grade Proficiency Levels• Three of eight (3 of 8) schools increased the percentage of students proficient in math:
– Ashley Park increased by 15.8 percentage points and Walter G. Byers increased by 20.5 percentage points.
Greater than 1 percentage pt. decrease Green Greater than 1 percentage pt. increase Yellow Less than 1 percentage pt. change Red
School Name
Grades 3-5 Percentage of Students Scoring Level 3 or Above
End-of-Grade ExamsPre K-8 Schools
Math2010-11 2011-12 Difference
Ashley Park Pre K-8 60.1% 75.9% 15.8Berryhill Pre K-8 83.8% 83.0% -0.8
Bruns Avenue Pre K-8 67.2% 61.3% -5.9Druid Hills Pre K-8 57.4% 53.8% -3.6Reid Park Pre K-8 61.9% 50.7% -11.2
Thomasboro Pre K-8 68.4% 68.9% 0.5Walter G. Byers Pre K-8 48.5% 69.0% 20.5Westerly Hills Pre K-8 72.0% 64.3% -7.7
District 82.3% 82.5% .2Central Elementary Zone 74.5% 75.5% 1.0
229/25/2012
School Name
Grades 6-8 Percentage of Students Scoring Level 3 or Above on
End-of-Grade ExamsPre K-8 Schools
Math Reading
2010-11 2011-12 2010-11 2011-12Ashley Park Pre K-8
N/A: Grades6-8 added 2011-12
77.9%
N/A: Grades6-8 added 2011-12
52.5%Berryhill Pre K-8 82.6% 67.4%
Bruns Avenue Pre K-8 45.7% 38.9%Druid Hills Pre K-8 52.4% 41.1%Reid Park Pre K-8 51.3% 39.6%
Thomasboro Pre K-8 77.2% 45.6%Walter G. Byers Pre K-8 60.9% 48.7%Westerly Hills Pre K-8 37.4% 41.3%
Bishop Spaugh MS 60.2% Closed 38.6% ClosedJ.T. Williams MS 49.5% Closed 33.1% Closed
Wilson MS 66.7% Closed 51.6% Closed
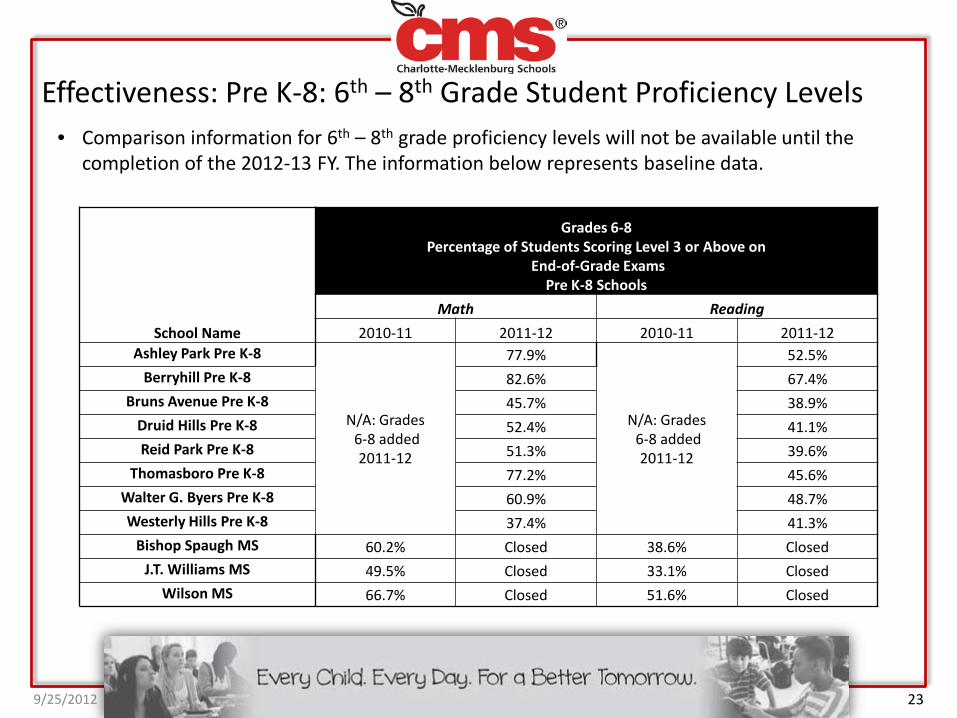
Effectiveness: Pre K-8: 6th – 8th Grade Student Proficiency Levels• Comparison information for 6th – 8th grade proficiency levels will not be available until the
completion of the 2012-13 FY. The information below represents baseline data.
239/25/2012

Growth for closed and (Pre K-8) schools in 2010-11 and 2011-12
2010-11 2011-12
School NameAchievedExpected Growth
AchievedHigh Growth
AchievedExpected Growth
AchievedHigh Growth
Ashley Park (Pre K-8) Yes Yes Yes Yes
Berryhill (Pre K-8) Yes Yes Yes No
Bruns (Pre K-8) Yes Yes Yes No
Druid Hills (Pre K-8) Yes No Yes No
Reid Park (Pre K-8) Yes No No No
Thomasboro (Pre K-8) Yes No Yes Yes
Walter G. Byers (Pre K-8) No No Yes No
Westerly Hills (Pre K-8) Yes Yes No No
Irwin Avenue Yes No N/A N/A
Lincoln Heights Yes No N/A N/A
Bishop Spaugh MS Yes No N/A N/A
J.T. Williams MS Yes No N/A N/A
Wilson MS Yes Yes N/A N/A
Effectiveness: Pre K-8: School-wide Growth
24
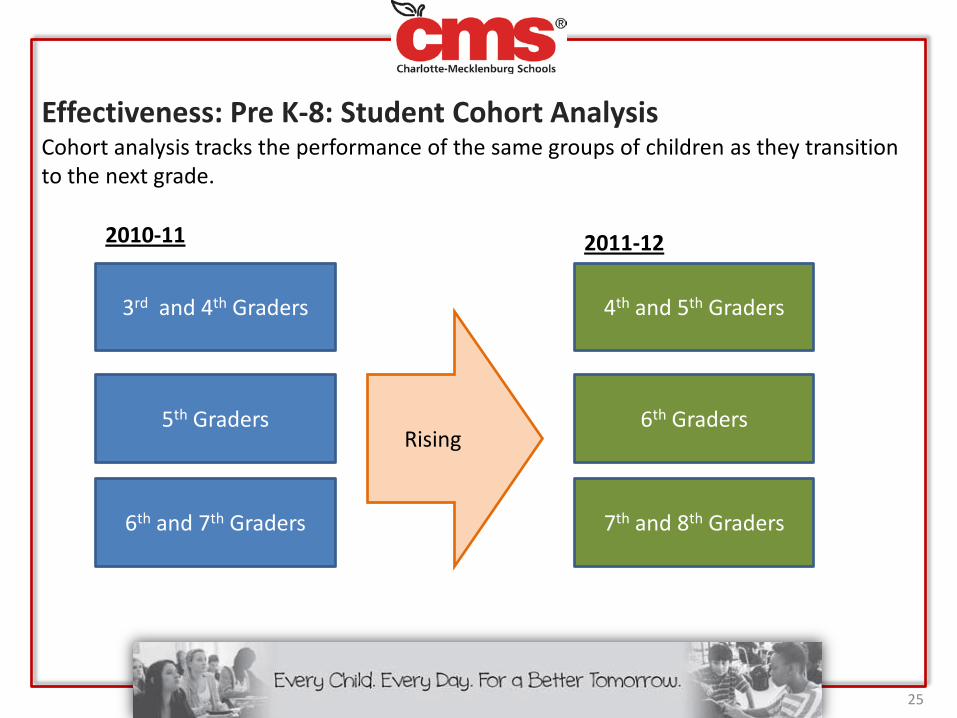
Effectiveness: Pre K-8: Student Cohort Analysis
3rd and 4th Graders 4th and 5th Graders
5th Graders 6th Graders
6th and 7th Graders 7th and 8th Graders
Rising
2010-11 2011-12
Cohort analysis tracks the performance of the same groups of children as they transition to the next grade.
25

Effectiveness: Pre K-8: Improve Student OutcomesDistribution of Math and Reading Achievement Levels for Rising 4th and 5th Graders in Pre K-8
Math
LevelExcluding Retests Including Retests
2010-11 2011-12 Difference 2010-11 2011-12 Difference1 10.0% 8.7% -1.3 6.7% 6.2% -0.52 32.6% 28.6% -4.0 27.7% 24.2% -3.53 47.4% 52.8% 5.4 55.9% 59.8% 3.94 10.0% 9.9% -0.1 9.7% 9.7% 0.0
3&4 57.4% 62.5% 5.3 65.6% 69.5% 3.9
Reading
LevelExcluding Retests Including Retests
2010-11 2011-12 Difference 2010-11 2011-12 Difference1 32.8% 27.1% -5.7 24.0% 21.7% -2.32 34.6% 36.2% 1.6 33.0% 32.6% -0.43 28.3% 32.0% 3.7 38.9% 40.7% 1.84 4.2% 4.7% 0.5 4.1% 5.0% 0.9
3&4 32.6% 36.7% 4.1 43.0% 45.7% 2.7
MathGrowth Mean
2010-11 2011-120.329 0.14
ReadingGrowth Mean
2010-11 2011-120.031 -0.083
Greater than 1 percentage pt. decrease Green Greater than 1 percentage pt .increase Yellow Less than 1 percentage pt change Red
26

Effectiveness: Pre K-8: Improve Student Outcomes
Math
LevelExcluding Retests Including Retests
2010-11 2011-12 Difference 2010-11 2011-12 Difference1 4.4% 8.8% 4.4 3.4% 5.4% 2.02 35.0% 37.8% 2.8 27.9% 34.7% 6.83 51.3% 47.9% -3.4 59.5% 54.5% -5.04 9.4% 5.5% -3.9 9.2% 5.4% -3.8
3&4 60.7% 53.4% -7.2 68.7% 59.9% -8.8
Reading
Level
Excluding Retests Including Retests2010-11 2011-12 Difference 2010-11 2011-12 Difference
1 25.9% 21.2% -4.7 16.6% 16.2% -0.42 34.6% 31.0% -3.6 35.1% 27.7% -7.43 36.8% 42.2% 5.4 45.2% 50.6% 5.44 2.8% 5.6% 2.8 3.1% 5.4% 2.3
3&4 39.6% 47.7% 8.1 48.3% 56.1% 7.8
Reading Growth Mean
2010-11 2011-12.074 .137
Math Growth Mean
2010-11 2011-12.224 -.112
27
Distribution of Math and Reading Achievement Levels for Rising 6th Graders in Pre K-8
Greater than 1 percentage pt. decrease Green Greater than 1 percentage pt .increase Yellow Less than 1 percentage pt change Red

Effectiveness: Pre K-8: Improve Student Outcomes
Math
LevelExcluding Retests Including Retests
2010-11 2011-12 Difference 2010-11 2011-12 Difference1 16.2% 12.3% -3.9 10.2% 8.6% -1.62 40.1% 37.0% -3.1 36.8% 32.2% -4.63 38.2% 41.7% 3.5 47.6% 50.5% 2.94 5.5% 9.0% 3.5 5.3% 8.7% 3.4
3&4 43.7% 50.7% 7.0 53.0% 59.2% 6.2Reading
LevelExcluding Retests Including Retests
2010-11 2011-12 Difference 2010-11 2011-12 Difference1 35.7% 28.8% -6.9 31.1% 23.9% -7.22 34.6% 41.6% 7.0 30.0% 37.1% 7.13 25.2% 25.6% 0.4 34.2% 35.0% 0.84 4.5% 4.1% -0.4 4.7% 4.0% -0.7
3&4 29.7% 29.6% -0.1 38.9% 38.9% 0.0
Reading Growth Mean
2010-11 2011-12.029 .062
Math Growth Mean
2010-11 2011-12-.079 .110
28
Greater than 1 percentage pt. decrease Green Greater than 1 percentage pt .increase Yellow Less than 1 percentage pt change Red
Distribution of Math and Reading Achievement Levels for Rising 7th and 8th Graders in Pre K-8

Average Daily Attendance Rates by schoolFor closed and Pre K-8 schools in 2010-11 and 2011-12
Attendance Rates2010-11 2011-12
Ashley Park (Pre K-8) 95.56 94.86
Berryhill (Pre K-8) 95.73 96.16Bruns Avenue (Pre K-8) 94.19 93.79
Druid Hills (Pre K-8) 93.39 93.69
Reid Park (Pre K-8) 94.12 93.95
Thomasboro (Pre K-8) 95.30 94.51
Walter G Byers (Pre K-8) 93.95 94.05
Westerly Hills (Pre K-8) 95.06 96.18
Irwin Ave 97.29 N/A
Lincoln Heights 97.08 N/A
Spaugh MS 90.68 N/A
JT Williams MS 91.25 N/A
Wilson MS 94.13 N/A
District 94.85 95.28
Effectiveness: Attendance Rates
29

Average Daily Attendance Rates Redesigned schools in 2010-11 and 2011-12
School Name
Attendance Rates
2010-11 2011-12
Billingsville ES 95.16 95.89
Dilworth ES 95.98 96.30
Rama Road ES 94.32 94.54
Whitewater Academy ES 95.32 95.86
Alexander Graham MS 95.64 95.42
Community House MS 96.26 96.72
South Mecklenburg HS 92.28 93.19
West Mecklenburg HS
90.30 92.90
Winding Springs ES 96.38 96.19
JM Alexander MS 94.88 95.60
Harding HS 95.71 90.93
Marie G. Davis K12 96.31 96.20
Effectiveness: Improve Educational Environments: Attendance
30

A Principal’s Perspective
• Jan McIver of Thomasboro Academy Pre K8
31

Summary• A key indicator comparison reflects that:
– Academic proficiency and growth varies by subject and grade level – with some areas increasing and others decreasing. Student attendance patterns are consistent.
– Many facilities were underutilized and in poor condition in 2010-11. Current facilities are in better condition; some are now overutilized.
– The redesign efforts required a one-time investment of $6.9M and result in an annual recurring savings of $5.2M.
– Redesign efforts generated a cost avoidance of $138M ($118M K-12, $20M Pre-K)
• CMS students, parents, community members, Board of Education and employees have demonstrated agility and dedication to increasing student achievement. All of the hard work and efforts are appreciated.
32

• Enhance PreK-8 elective options
• Review additional athletic opportunities
• Review discipline data as part of a district initiative
Next Steps: Opportunities:
33
Appendix
• Summary of School Changes p. 35-39
• Building Utilization Data p. 40-42
• Student Enrollment p. 43-45
34

Closings
35
2013-14

Relocations
36

Expansions and New Home Schools
37

Boundary Shifts
38

Other Changes
39
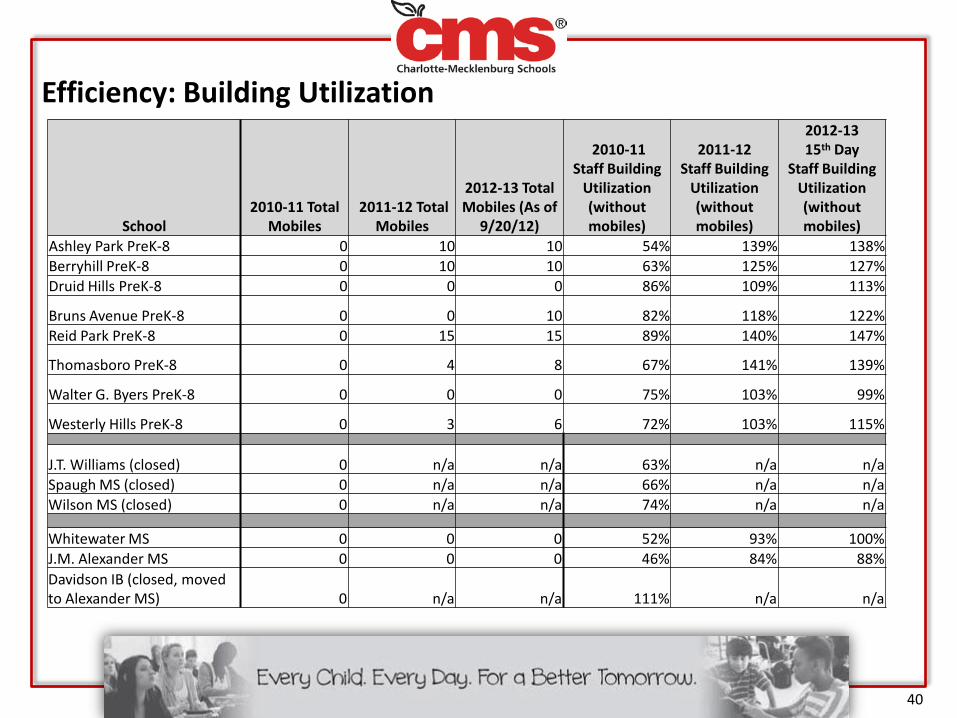
Efficiency: Building Utilization
School2010-11 Total
Mobiles2011-12 Total
Mobiles
2012-13 Total Mobiles (As of
9/20/12)
2010-11 Staff Building
Utilization (without mobiles)
2011-12 Staff Building
Utilization (without mobiles)
2012-13 15th Day
Staff Building Utilization (without mobiles)
Ashley Park PreK-8 0 10 10 54% 139% 138%Berryhill PreK-8 0 10 10 63% 125% 127%Druid Hills PreK-8 0 0 0 86% 109% 113%
Bruns Avenue PreK-8 0 0 10 82% 118% 122%Reid Park PreK-8 0 15 15 89% 140% 147%
Thomasboro PreK-8 0 4 8 67% 141% 139%
Walter G. Byers PreK-8 0 0 0 75% 103% 99%
Westerly Hills PreK-8 0 3 6 72% 103% 115%
J.T. Williams (closed) 0 n/a n/a 63% n/a n/aSpaugh MS (closed) 0 n/a n/a 66% n/a n/aWilson MS (closed) 0 n/a n/a 74% n/a n/a
Whitewater MS 0 0 0 52% 93% 100%J.M. Alexander MS 0 0 0 46% 84% 88%Davidson IB (closed, moved to Alexander MS) 0 n/a n/a 111% n/a n/a
40

Efficiency: Building Utilization
School2010-11 Total
Mobiles2011-12 Total
Mobiles
2012-13 Total Mobiles (As of
9/20/12)
2010-11 Staff Building
Utilization (without mobiles)
2011-12 Staff Building
Utilization (without mobiles)
2012-13 15th Day
Staff Building Utilization (without mobiles)
Billingsville ES 0 0 0 83% 109% 111%Rama Rd ES 2 2 7 97% 108% 115%Oakhurst ES (closed) 0 n/a n/a 95% n/a n/a
Dilworth ES 0 0 0 75% 93% 100%
Lincoln Heights ES (closed) 0 n/a n/a 44% n/a n/aIrwin ES (closed, Villa Heights move) 0 n/a n/a 81% 68%** 70%**
Hornets Nest ES 15 0 0 136% 92% 92%Nathaniel Alexander ES 2 3 4 108% 102% 100%Winding Springs ES 4 4 6 133% 119% 131%
Marie G. Davis 0 16 16 75%* 75% 72%
Whitewater Academy 0 2 2 67% 108% 108%Pawtuckett ES (closed) 0 n/a n/a 57% n/a n/a
Alexander Graham MS 0 0 0 73% 105% 112%Sedgefield MS 0 0 0 55% 86% 81%
Community House MS 4 6 6 93% 118% 123%South Charlotte MS 0 1 1 84% 111% 116%
*Occupied the new school building only 2010-11. **Villa Heights moved to Irwin facility 2011-12
41

Efficiency: Building Utilization
School
2010-11 Total
Mobiles
2011-12 Total
Mobiles
2012-13 Total
Mobiles (As of 9/20/12)
2010-11 Staff
Building Utilization (without mobiles)
2011-12 Staff
Building Utilization (without mobiles)
2012-13 15th Day
Staff Building
Utilization (withoutmobiles
Garinger HS 23 27 27 105% 122% 114%Cochrane Collegiate Academy 6-12 0 0 0 56% 81% 83%
Harding HS 0 17 17 52% 131% 128%
Phillip O. Berry Academy 0 0 0 72% 103% 101%
South Mecklenburg HS 0 0 0 71% 113% 116%
West Charlotte HS 20 20 20 81% 99% 102%
West Mecklenburg HS 11 11 11 86% 98% 100%
E.E. Waddell HS (closed) 0 n/a n/a 69% 104%*** 108%******Smith Language Academy moved to Waddell facility 2011-12
42

Efficiency: Student Enrollment DataEnrollment: John Taylor Williams, Spaugh and Wilson School Closures, PreK-8
School2010-11
Enrollment
2011-12 Projected from 11/9/10 Report
2011-12 20th Day
Enrollment
Difference Actual and Projected
2012-13 15th Day
Enrollment Change
from 2011 to 2012
Ashley Park PreK-8 264 500 587 87 582 -5Berryhill PreK-8 326 425 549 124 620 71Druid Hills PreK-8 381 572 609 37 659 50
Bruns Avenue PreK-8 522 665 737 72 812 75Reid Park PreK-8 434 536 714 178 790 76Thomasboro PreK-8 340 555 710 155 780 70
Walter G. Byers PreK-8 407 560 569 9 559 -10
Westerly Hills PreK-8 277 504 514 10 585 71
J.T. Williams (closed) 481 n/a n/a n/a n/a n/aSpaugh MS (closed) 526 n/a n/a n/a n/a n/aWilson MS (closed) 538 n/a n/a n/a n/a n/a
Whitewater MS 587 818 860 42 889 29J.M. Alexander MS 604 862 847 -15 888 41Davidson IB (closed, moved to Alexander MS) 258 n/a n/a n/a n/a n/a
43

Efficiency: Student Enrollment Data
School2010-11
Enrollment
2011-12 Projected from 11/9/10 Report
2011-12 20th Day
Enrollment
Difference Actual and Projected
2012-13 15th Day
Enrollment Change from 2011 to 2012
Billingsville ES 480 593 532 -61 535 3Rama Rd ES 610 669 604 -65 613 9Oakhurst ES (closed) 582 n/a n/a n/a n/a n/a
Dilworth ES 374 397 487 90 537 50Lincoln Heights ES (closed) 278 n/a n/a n/a n/a n/aIrwin ES (closed) 485 n/a n/a n/a n/a n/a
Hornets Nest ES 852 598 576 -22 591 15Nathaniel Alexander ES 1,049 795 828 33 869 41Winding Spring ES 644 713 721 8 772 51
Marie G. Davis 348 980 713 -267 729 16
Whitewater Academy 453 668 692 24 889 197Pawtucket ES (closed) 215 n/a n/a n/a n/a n/a
Alexander Graham MS 1,235 1,280 1,361 81 1,440 79Sedgefield MS 483 531 540 9 598 58
Community House MS 1,522 1,477 1,488 11 1,581 93South Charlotte MS 895 1,075 931 -144 940 9
Enrollment: John Taylor Williams, Spaugh, and Wilson School Closures, PreK-8
44
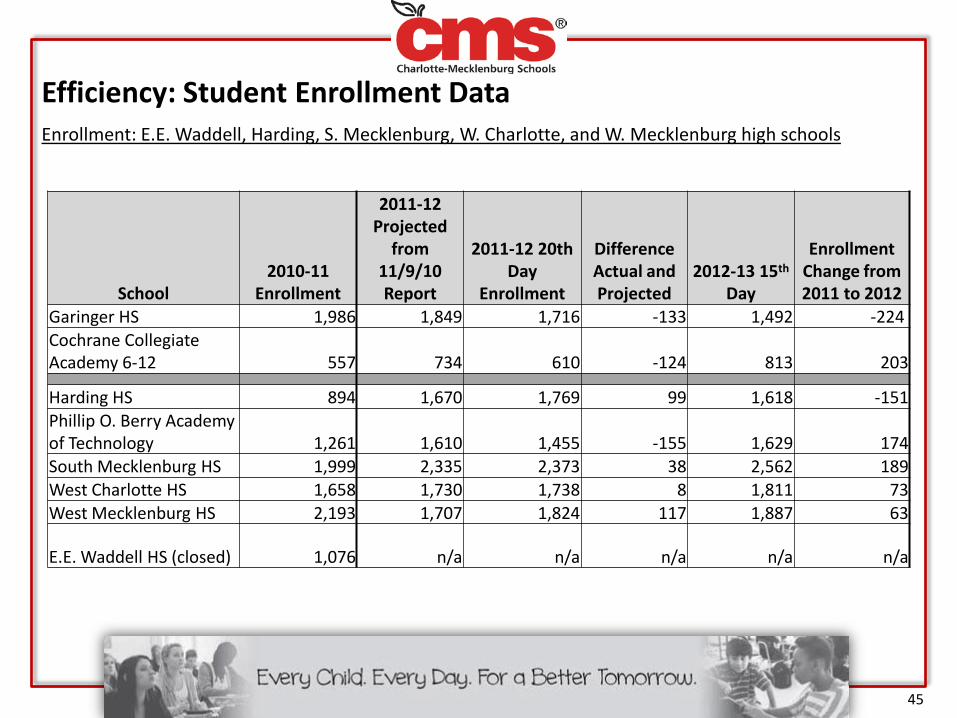
Efficiency: Student Enrollment DataEnrollment: E.E. Waddell, Harding, S. Mecklenburg, W. Charlotte, and W. Mecklenburg high schools
School2010-11
Enrollment
2011-12 Projected
from 11/9/10 Report
2011-12 20th Day
Enrollment
Difference Actual and Projected
2012-13 15th
Day
EnrollmentChange from 2011 to 2012
Garinger HS 1,986 1,849 1,716 -133 1,492 -224Cochrane Collegiate Academy 6-12 557 734 610 -124 813 203
Harding HS 894 1,670 1,769 99 1,618 -151Phillip O. Berry Academy of Technology 1,261 1,610 1,455 -155 1,629 174South Mecklenburg HS 1,999 2,335 2,373 38 2,562 189West Charlotte HS 1,658 1,730 1,738 8 1,811 73West Mecklenburg HS 2,193 1,707 1,824 117 1,887 63
E.E. Waddell HS (closed) 1,076 n/a n/a n/a n/a n/a
45