Embed Size (px)
Citation preview
www.elsevier.com/locate/jneuroim
Journal of Neuroimmunology 143 (2003) 53–59
Refining the analysis of a whole genome linkage disequilibrium
association map: the United Kingdom results
Tai Wai Yeoa, Richard Roxburgha, Mel Maraniana, Sara Singlehursta, Julia Graya,Anke Hensieka, Efrosini Setakisb, Alastair Compstona, Stephen Sawcera,*
aUniversity of Cambridge Neurology Unit, Addenbrook’s Hospital, Hills Road, Cambridge, CB2 2QQ, UKbMRC Biostatistics Unit, Institute of Public Health, University Forvie site, Robinson Way, Cambridge, CB10 1SB, UK
Abstract
Individual genotyping of the 10 most promising markers identified in our previously reported screen for linkage disequilibrium (LD) in
multiple sclerosis identified a number of effects which confound the analysis and are of general importance in the interpretation of results
obtained using microsatellite markers typed in pooled DNA. In order to identify and characterise these effects, we individually genotyped 529
promising markers in 16 trio families. We then devised adapting factors, which were designed to correct for these confounders. This more
extensive analysis of the previously published UK data set and the repeat analyses incorporating these adaptations led to the identification of
two novel markers that may be associated with multiple sclerosis in this population, providing a close correlation between the results of
pooled analysis and individual typing.
D 2003 Elsevier B.V. All rights reserved.
Keywords: Genome screen; Linkage disequilibrium; Multiple sclerosis; Microsatellites; DNA pooling
1. Introduction
In 1997, Barcellos et al. (1997) proposed an efficient
method for screening for linkage disequilibrium (LD) in
complex traits based on typing a dense map of micro-
satellite markers in pooled DNA. We have previously used
an adapted version of this method to perform two system-
atic screens for LD in multiple sclerosis. Preliminary
results were reported in 2002 (Sawcer et al., 2002). In
this screen, allele image patterns (AIPs) generated from
separately pooled cases and controls were normalised
according to the number of alleles in the corresponding
pools. Resulting allele counts were then compared statis-
tically using a chi squared test (alleles with a frequency of
less than 5% were grouped together). The first screen
employed unrelated cases (n = 216) and controls (n = 219),
while the second was based on 745 trio families (an affected
individual and their parents) and used the un-transmitted
parental alleles as controls, resulting in an analysis equiv-
alent to the AFBAC method proposed by Thomson (1995).
0165-5728/$ - see front matter D 2003 Elsevier B.V. All rights reserved.
doi:10.1016/j.jneuroim.2003.08.011
* Corresponding author. Tel.: +44-1223-217091; fax: +44-1223-
336941.
E-mail address: [email protected] (S. Sawcer).
Because pooling introduces additional sources of error,
above and beyond sampling variance, it is impossible to
establish absolute p-values for the calculated chi squared
statistics. However, by using the observed distribution of
these statistics, we established significance empirically and
thereby ranked markers in terms of their apparent evidence
for association—as reflected in the observed difference in
case-control AIPs (Setakis, 2003). In order to reduce the
effect of additional sources of variance on the final ranking
of markers, extra-AIPs were generated for those markers
(n = 520) showing the most extreme results.
This approach was adopted generically by the GAMES
collaborative and used to screen a variety of additional
populations. Results from the majority of these screens
are reported in this issue. This article describes our
efforts to refine results of the previously reported UK
screen.
2. Materials and methods
2.1. Samples and markers
The patients and controls employed in this study are as
previously described (Sawcer et al., 2002). All are Cauca-
Table 1
Number of markers by repeat class
Total
(6000)
N (%)
Most promising
(659)
N (%)a
Typed novel
(7)
N (%)
Dinucleotides 4723 (79) 463 (70) 1 (14)
Trinucleotides 258 (4) 45 (7) 3 (43)
Tetranucleotides 1019 (17) 151 (23) 3 (43)
a Markers showing empirical p-values of < 5% in either (or both)
cohorts (n= 659) in the original UK screen (Sawcer et al., 2002).
T.W. Yeo et al. / Journal of Neuroimmunology 143 (2003) 53–5954
sians of British descent and all gave informed consent for
genetic analysis. Each patient satisfied Poser criteria for the
diagnosis of multiple sclerosis (Poser et al., 1983). The
number and specificity of markers are as previously de-
scribed (Sawcer et al., 2002). Full details are available from
our web site (http://www-gene.cimr.cam.ac.uk/MSgenetics/
GAMES).
2.2. Genotyping
DNA extraction and pooling are as previously described
(Sawcer et al., 2002). Briefly, PCR amplification was
performed using TrueAllele PCR premix (Applied Biosys-
tems) according to the manufacturers recommended meth-
ods on 9700 thermal cyclers (Applied Biosystems).
Electrophoresis was performed on a 3700 DNA analyser
(Applied Biosystems). Both pooled and individual geno-
typing were performed according to the same conditions,
although limited multiplexing was employed for individual
genotyping of the best markers. Individual genotyping of
the 16 trio families was performed without multiplexing.
Analysis of electropherograms was performed using the
GENESCAN and GENOTYPER software packages (Ap-
plied Biosystems).
Where additional AIPs were required a total of four
PCR replicates was generated from case-control pools,
after which each PCR product was electrophoresed twice
in order to generate up to eight new AIP replicates from
each pool. Double this number of PCR replicates was
generated from the trio family pools, each being electro-
phoresed twice; the greater number of individuals making
up the trio family pools demands more replicate AIPs
(Barratt et al., 2002).
2.3. Statistical analysis
The adapting factors were incorporated into the statis-
tical analysis of AIP data, as follows. First, signal from
peaks determined to be erroneous were excluded from the
raw AIP data. Secondly, when required, correction for
length dependent amplification was achieved by multiply-
ing the signal from each retained peak in each AIP by an
appropriate factor. For the ith allele in each AIP, this
factor=(1 + f*li), where f= the calculated proportional re-
duction factor for that marker and li = the difference in
length (in base pairs) between the ith allele and the
shortest allele included in the AIP (allele 1). Finally, these
edited data were analysed using the method developed by
Setakis (2003) but with each marker normalised according
to the ‘‘effective’’ number of alleles in the corresponding
pools. This is the actual number reduced by the estimated
proportion of alleles not contributing to the AIP. For
example, in the analysis of a marker where the AIP
captures only 90% of the observed alleles, peak heights
would be normalised to 90% of the allele counts in the
respective pools.
3. Results
3.1. Analysis by repeat class
Inspection of our previously published analysis (Sawcer
et al., 2002) reveals a statistically significant under-repre-
sentation of dinucleotide markers amongst those at the
extreme end of the ranking (see Table 1). This distortion
in the expected proportions suggests that markers behave
differently in a pooling experiment according to repeat
class. It therefore follows that estimating the empirical
significance from a distribution including all classes of
repeats is likely to favour those classes of repeats showing
the greatest variance. This problem is further compounded
by the fact that the proportion of dinucleotides varies
according to the number of degrees of freedom; that is,
the number of common alleles identified for each micro-
satellite. Amongst markers with low degrees of freedom the
proportion of dinucleotides was 40–50%, compared with
80–90% amongst those showing high degrees of freedom.
The dinucleotides with low degrees of freedom are thus
particularly under represented in the list of extreme results
identified in our previous analysis.
Separate analysis of the data from each class of repeat
confirms the marked difference in error structure between
the repeat classes and substantially changes the overall
marker ranking. A total of 104 markers not previously
included amongst those for which we have already gener-
ated refining AIPs emerged as interesting in this repeat class
specific analysis. Additional AIPs were therefore generated
for these markers and added to the existing UK data.
3.2. Individual typing of markers emerging from the
original UK screens
We individually genotyped the 10 most promising
markers identified in our previous report (Sawcer et al.,
2002) in all samples used to create the original pools still
available: 207 cases (96%), 160 controls (73%) and all 745
trio families. The results are shown in Table 2. In line with the
statistical analysis performed in our original study alleles
with a frequency of < 5% were combined and global chi-
squared statistics calculated for each marker in both cohorts.
In the trio families, index cases were compared with the un-
transmitted parental alleles using the AFBAC program
Table 2
p-values from individual typing of top UK markers
Marker Case-controls Trio families
D1S1590 0.81 0.13
GGAA30B06 0.002 0.47
D2S2739 0.01 0.79
D4S416 0.25 0.10
D6S1615a 0.03 6.12E� 12
D6S2444a 6.15E� 05 6.59E� 14
TNFaa 0.02 3.87E� 09
D17S1535 0.60 0.39
GCT6E11 0.56 0.34
D19S585 0.12 0.77
a These three markers are all from the HLA region on 6p21.
Table 3
Mean and standard deviation (S.D.) for adapting factors estimated from
consecutive 16 family subsets of the 745 UK trio families
Missed allele
proportion
Relative signal reduction per
base pair
Mean S.D.a Mean S.D.
D1S1590 0.082 0.035 0.051 0.004
GGAA30B06 0.001 0.003 0.015 0.003
D2S2739 0.196 0.053 0.019 0.003
D4S416 0.001 0.004 0.039 0.006
D6S1615 0.106 0.044 0.037 0.002
D6S2444 0.001 0.003 0.059 0.004
TNFa 0.027 0.018 0.028 0.009
D17S1535 0 NAb 0.025 0.005
GCT6E11 0.416 0.12 0.053 0.017
D19S585 0.043 0.025 0.04 0.006
a As expected, these SD estimates are in close agreement with those
predicted for a binomial distribution.b As no missed alleles were seen in any of the replicate data sets for this
marker, no deviation was observed and therefore no S.D. estimate can be
calculated.
T.W. Yeo et al. / Journal of Neuroimmunology 143 (2003) 53–59 55
(Thomson, 1995). As expected, association with the three
HLA makers was confirmed. However, after correction for
multiple testing, none of the seven novel markers retain
evidence for association. A number of un-anticipated effects
were observed, providing an explanation for these reduction-
ist results.
Two of the seven novel markers were found to have
genotype frequencies, which deviated significantly from
Hardy Weinberg equilibrium (D19S585 and GGAA30B06).
In the trio family analysis, the presence of null or very
poorly amplified alleles could be inferred for these markers,
indicating that a proportion of alleles in each pool failed to
contribute to the observed AIPs. Since peak heights in an
AIP are normalised on the assumption that they reflect all
alleles in a pool, allele count differences will be over
estimated when a substantial proportion do not contribute
to the measured AIPs. Other effects also result in alleles
failing to contribute to AIPs. For marker GCT6E11, length
dependant amplification resulted in the longest common
allele being missed from the AIP. This allele did generate a
peak in the electropherogram but so small that it was only
measurable in a proportion of replicates and therefore was
not included amongst peaks considered to make up the AIP
for this marker. Similarly, for marker D2S2739, a total of 16
peaks were included in the AIP although various smaller
peaks could be seen in some electropherograms. Individual
typing, however, revealed a total of 41 different alleles
indicating that some 61% of the possible alleles had not
been included in the AIP.
As well as missed alleles, we also observed that some of
the peaks included in AIPs had no corresponding allele. For
marker D1S1590, the majority of individual genotypes
included an additional fragment, presumably arising from
non-specific amplification. Because of its position, this
fragment had mistakenly been labelled as an allele in the
AIPs. For marker D4S416, a number of peaks included in
the AIP had no corresponding allele being purely stutter
bands from other alleles. The erroneous inclusion of these
additional peaks as alleles increases the number of degrees
of freedom in testing these markers. Since significance is
judged against the distribution of markers with the same
number of degrees of freedom, this effect distorts the result
for that marker and all others in the class. Finally, re-
inspection of the AIP data for marker D17S1535 revealed
a genotyping error which, when corrected, left this marker
showing no statistically significant difference in the AIPs
from either the case-control or trio family cohorts, in
agreement with individual typing results.
3.3. Estimating adapting factors to correct for these
phenomena
The phenomena described above can be expected vari-
ably to affect the remaining 5990 markers employed in our
original LD screen. In an effort to estimate the scale of these
effects, and thereby appropriately correct for them, we
individually genotyped a selection of markers in 16 trio
families. This number of families provides a total of 64
independent chromosomes (from 32 unrelated individuals)
and thereby a >80% power to observe alleles with a
frequency of >2.5% (and at least 50% power to detect
alleles with a >1% frequency). Trio families were typed
rather than unrelated individuals in order more easily to
identify null alleles and contaminating artefacts. Compari-
son of alleles seen in the individual genotyping with the
pattern suggested by the AIP allowed easy identification of
peaks erroneously included in the AIP, and provided an
estimate of the proportion of alleles not contributing to the
measured AIP. Knowledge of this proportion enables an
appropriate reduction in the normalisation of AIPs, restrict-
ing allele counts to just that faction influencing the AIP. As
well as excluding peaks that do not correspond to observed
alleles, we also excluded peaks where a corresponding allele
was identified but only accounted for less than a quarter of
the observed peak height. We reasoned that since such peaks
principally reflect stutter artefact from longer alleles, in-
cluding such data was more harmful than dropping the peak
and thereby failing to measure a rare allele.
Table 4
Marker Case-controls Trio families
(a) Markers with final empirical p-values < 10% in both case-control and trio family cohorts. Analysis was performed without correction for length dependant
amplification
D5S112 0.0281 0.0930
D6S1615a 0.0001 0.0395
D6S2444a 0.0310 0.0777
TNFaa 0.0180 0.0259
(b) Markers with final empirical p-values < 10% in both case-control and trio family cohorts. Analysis was performed with correction for length dependant
amplification
D5S112 0.0255 0.0926
D6S1615a 0.0001 0.0404
TNFaa 0.0148 0.0307
D10S1769 0.0664 0.0780
a These three markers are from the HLA region on 6p21.
Table 5
p-values from individual typing of the two new novel markers
Marker Case-controls Trio families
D5S112 0.1080 0.0535
D10S1769 0.0956 0.0903
T.W. Yeo et al. / Journal of Neuroimmunology 143 (2003) 53–5956
Assuming a linear relationship between allele length and
reduction in allele signal, we were also able to estimate the
extent of length dependant amplification for the typed
markers. Expressing this as the proportionate reduction in
peak height per base pair of extra length, we could then use
this value as a crude correction for length dependant
amplification by inflating the signal for longer alleles
accordingly (prior to normalisation).
A total of 529 markers were typed in the 16 trio families.
These markers were mostly chosen from the extreme (most
promising) end of the original UK study, the remainder
having given extreme results in other GAMES screens. The
mean missing allele proportion was found to be 9.2% and
the mean length-dependent amplification factor (proportion-
ate signal reduction per base pair) was 2.9%. Interestingly,
this factor was almost double for dinucleotides (3.5%)
compared to longer repeats (2.0%), suggesting that length
dependent amplification is principally determined by repeat
number rather than absolute length. Peaks not corresponding
to observed alleles were seen in 72% of markers, 22%
having just one aberrant peak, 21% two such peaks and 29%
three or more such peaks. As expected, the first peak in the
AIP was the most often considered aberrant (corresponding
to a stutter band).
In order to test the stability of the adapting factors
estimated by typing just 16 trio families, we used the data
from individual typing of the 10 markers listed in Table 1,
each of which had been genotyped in the 745 UK trio family
cohort. By considering consecutive 16 family subsets, we
were able to generate multiple estimates for the adapting
factors and thereby calculate their mean and standard
deviation (see Table 3). We were also able to test how often
peaks corresponding to relatively common alleles (those
with a frequency of >10% in the 745 trio families) are
inadvertently excluded when just 16 trio families are typed.
No such alleles were excluded when only those strictly
absent from the 16 trio family genotyping were considered.
However, such alleles were occasionally dropped when their
frequency was under estimated such that the estimated
frequency contributed less than a quarter of the corres-
ponding peak height. This was observed once for an allele
with a frequency of 16%, once for an allele with a frequency
of 11% and twice for an allele with a frequency of 10%. No
other high frequency alleles were excluded through adop-
tion of this rule. Thus, it is clear that our policy of excluding
peaks when the estimated allele frequency contributes less
than one quarter of the peak height results in only a very low
probability ( < 0.1%) that data from important alleles will be
inadvertently ignored. We feel that the advantage of exclud-
ing peaks that are essentially (>75%) stutter bands far
outweighs this small risk.
3.4. Refined analysis
Employing these adapting factors, we reanalysed all
available UK data. This reanalysis was performed both with
and without crude correction for length dependant amplifi-
cation. In each case the di-, tri- and tetra-nucleotides were
analysed independently. In the analysis with correction for
length dependant amplification, the mean value of 2.9% (per
base pair) was applied to all markers not included amongst
the 529 specifically typed. In the analysis without correction
for length-dependent amplification, we identified a total of 34
markers with empirical p-values < 10% in both screens.
Thirty-five such markers were identified in the analysis
employing the correction for length-dependent amplification.
Results from these two analyses are very similar and sub-
stantially overlap, such that in total just 48 extreme markers
were identified. This list of extreme markers includes 35 for
which no extra AIPs had previously been generated, as well
as 28 that were not amongst the 529 for which adapting
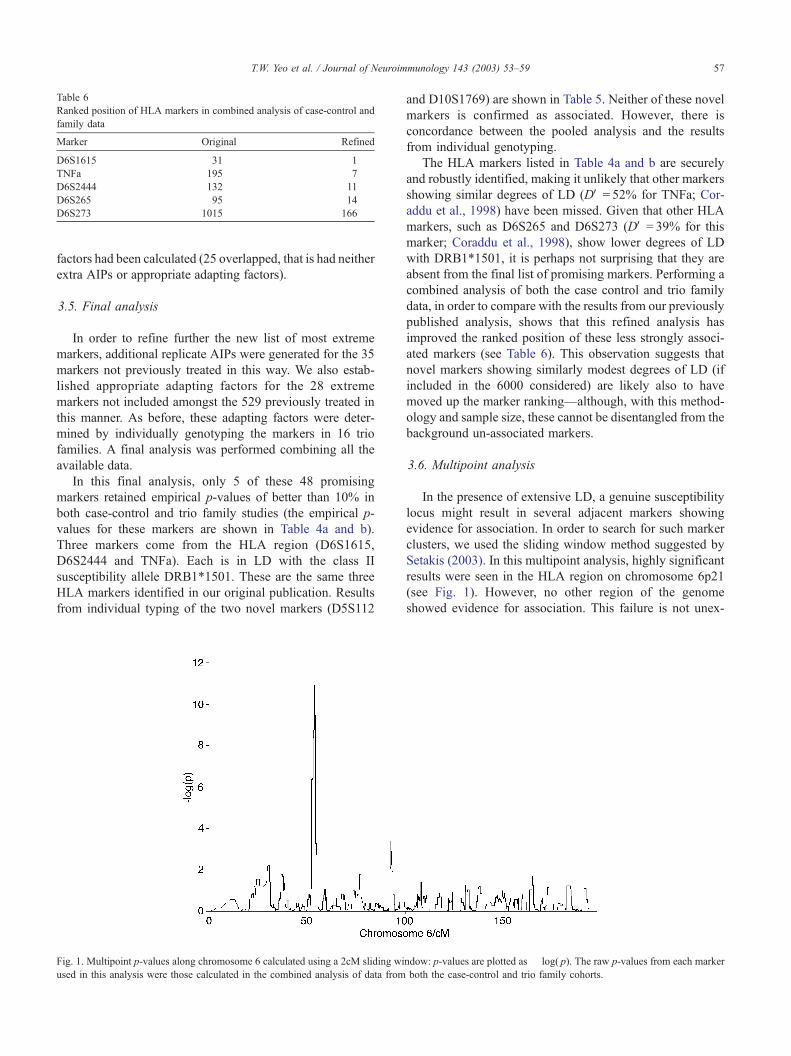
Table 6
Ranked position of HLA markers in combined analysis of case-control and
family data
Marker Original Refined
D6S1615 31 1
TNFa 195 7
D6S2444 132 11
D6S265 95 14
D6S273 1015 166
T.W. Yeo et al. / Journal of Neuroimmunology 143 (2003) 53–59 57
factors had been calculated (25 overlapped, that is had neither
extra AIPs or appropriate adapting factors).
3.5. Final analysis
In order to refine further the new list of most extreme
markers, additional replicate AIPs were generated for the 35
markers not previously treated in this way. We also estab-
lished appropriate adapting factors for the 28 extreme
markers not included amongst the 529 previously treated in
this manner. As before, these adapting factors were deter-
mined by individually genotyping the markers in 16 trio
families. A final analysis was performed combining all the
available data.
In this final analysis, only 5 of these 48 promising
markers retained empirical p-values of better than 10% in
both case-control and trio family studies (the empirical p-
values for these markers are shown in Table 4a and b).
Three markers come from the HLA region (D6S1615,
D6S2444 and TNFa). Each is in LD with the class II
susceptibility allele DRB1*1501. These are the same three
HLA markers identified in our original publication. Results
from individual typing of the two novel markers (D5S112
Fig. 1. Multipoint p-values along chromosome 6 calculated using a 2cM sliding wi
used in this analysis were those calculated in the combined analysis of data from
and D10S1769) are shown in Table 5. Neither of these novel
markers is confirmed as associated. However, there is
concordance between the pooled analysis and the results
from individual genotyping.
The HLA markers listed in Table 4a and b are securely
and robustly identified, making it unlikely that other markers
showing similar degrees of LD (DV = 52% for TNFa; Cor-
addu et al., 1998) have been missed. Given that other HLA
markers, such as D6S265 and D6S273 (DV = 39% for this
marker; Coraddu et al., 1998), show lower degrees of LD
with DRB1*1501, it is perhaps not surprising that they are
absent from the final list of promising markers. Performing a
combined analysis of both the case control and trio family
data, in order to compare with the results from our previously
published analysis, shows that this refined analysis has
improved the ranked position of these less strongly associ-
ated markers (see Table 6). This observation suggests that
novel markers showing similarly modest degrees of LD (if
included in the 6000 considered) are likely also to have
moved up the marker ranking—although, with this method-
ology and sample size, these cannot be disentangled from the
background un-associated markers.
3.6. Multipoint analysis
In the presence of extensive LD, a genuine susceptibility
locus might result in several adjacent markers showing
evidence for association. In order to search for such marker
clusters, we used the sliding window method suggested by
Setakis (2003). In this multipoint analysis, highly significant
results were seen in the HLA region on chromosome 6p21
(see Fig. 1). However, no other region of the genome
showed evidence for association. This failure is not unex-
ndow: p-values are plotted as � log( p). The raw p-values from each marker
both the case-control and trio family cohorts.
T.W. Yeo et al. / Journal of Neuroimmunology 143 (2003) 53–5958
pected. Average LD in the human genome is estimated to be
very much less than 100 kb (Gabriel et al., 2002) while the
markers employed in this screen have an average separation
of some 500 kb. These parameters make it very unlikely that
adjacent markers will all be in LD with a local susceptibility
locus. The HLA region is a notable exception, in that the
marker map employed in this region is denser than the
average while the LD is known to be more extensive.
4. Discussion
In order to refine the analysis of data generated in our
GAMES experiment, we have developed adapting factors
for 529 microsatellites that substantially improve the corre-
lation with results obtained from individual genotyping.
After individual genotyping, none of the novel (non-HLA)
markers identified in the UK screen have been confirmed as
associated with multiple sclerosis.
Microsatellites from the HLA region, which have high
levels of LD with DRB1*1501, are robustly identified
confirming that our experiment can detect markers in LD
with genuine susceptibility alleles. Conversely, our failure to
detect HLA markers with established but lesser degrees of
genuine LD (e.g. D6S265 and D6S273) indicates limitations
of the study. Three factors limit the study’s power.
First is the sample size. This is modest in the UK case-
control cohort, like most of the other GAMES studies
reported in this issue (c200 cases and c200 controls). Even
with full and accurate individual genotyping, such cohorts
have only modest power to detect effects as strong as TNFa,
and little or no power to detect weaker effects such as those
for markers like D6S265 and D6S273. This limitation is
well illustrated by results obtained after individually typing
the available UK case control samples for markers TNFa
and D6S1615. These are only just nominally significant,
and do not survive correction for multiple testing. It is
therefore expected that markers such as TNFa, D6S1615
and D6S2444 will be identified in many but not all GAMES
screens. On the other hand markers such as D6S265 and
D6S273 may be seen in a few but not the majority of
screens. Considering these positive control markers pro-
vides great insight into the expected behaviour of these
modestly powered screens.
The second factor limiting power is our use of pooling
methodology. This introduces additional sources of error
over and above sampling variance and thereby reduces the
effective sample size of the cohorts considered (Barratt et
al., 2002). Replicating pool construction, PCR and signal
detection improves the signal-to-noise ratio but reduces the
efficiency that pooling seeks to achieve. Barratt et al. (2002)
have shown that the need for replication increases with pool
size. The UK trio family cohort was analysed as two
particularly large pools (745 individuals in the index pool
and 1490 individuals in the parents pool). Compensating for
additional errors in the analysis of these pools would require
significantly more replication than we have performed. At
the level of replication employed in the study, the UK trio
cohort behaves with an effective sample size similar to that
seen for the UK case-control cohort (Sawcer et al., 2002).
The difference is that, in the case-control cohort, the
dominant source of variance is sampling variance while in
the trio family cohort the principal source of variance results
from the pooling process (the larger sample size having
essentially minimised the effects of sampling variance). This
difference in the contribution from the various sources of
variance explains why individual genotyping results (Tables
1 and 5) show a better correlation for the case-control than
for the trio family cohort. Promising but false positive
markers identified in the trio family analysis are more likely
to be the result of pooling induced errors than sampling
variance, which has a much smaller effect in a sample of this
size.
The third and final factor determining the power of our
study, and each of the other GAMES screens, is the number
of markers considered. The figure of 6000 proposed by
Barcellos et al. (1997) and utilised in GAMES, derived from
the most optimistic estimate of LD available at the time
(Jorde, 1995) and was commensurate with the number of
markers then available. It is now clear however that LD is
far less extensive. Current best estimates suggest that the
average length of so-called haplotype blocks is just 22 kb
(Gabriel et al., 2002). Assuming that our markers are
uniformly distributed (so that no one block includes more
than one marker), it is clear that we have markers in no more
than 4% of the haplotype blocks making up the human
genome. The extent to which a single microsatellite is able
to interrogate a block is unknown but it is clear that this is
limited by allele frequency mismatch and other confounding
effects (Muller-Myhsok and Abel, 1997). Assuming that
five tagging SNPs are able to extract most of the informa-
tion from a block (Johnson et al., 2001), it seems likely that,
on average, a single microsatellite will extract no more than
50% of the available information (the greater heterozygosity
of a microsatellite making it equivalent to approximately 2.5
SNPs (Kruglyak, 1997)). The greater mutation rate of
microsatellites increases the rate at which LD with suscep-
tibility variants is whittled down over time. But, in an
expanding and relatively young population such as Cauca-
sians Europeans, this is unlikely to have much effect
(Thompson and Neel, 1997). Allowing for these various
issues, it seems clear that no more than 1% of the genome
will have been tested in a typical GAMES screen (even
without allowing for incomplete marker typing). The num-
ber of markers employed is clearly the major limiting factor.
When comparing results obtained by individual genotyp-
ing with the pooled DNA analysis, it is important to
remember that not all samples included in the pools were
individually genotyped. Some samples used to construct
pools were no longer available when individual genotyping
was performed (27% for the controls pool) and genotyping
was also incomplete (success rate was 92% for D5S112 and
T.W. Yeo et al. / Journal of Neuroimmunology 143 (2003) 53–59 59
88% for D10S1769). As a result, there is only partial
overlap in samples contributing to the pooled and individual
typing results. Whilst the overlap is substantial, some
difference would be expected even if pooling was perfect
and true tests of significance rather than empirical p-values
obtained in the analysis. This comparison is further con-
founded when it is remembered that, although individual
genotyping is dogmatically considered as a gold standard, it
is not without error.
Under the null hypothesis of no associated markers, it
would be expected that approximately 60 markers would
have p-values of < 10% in both the case-control and trio
family cohorts (10% of 10% of 6000). However, in our final
analysis, there are only five such markers and three of these
are from the HLA region. This marked deficit in the
expected number of ‘‘positive in both’’ markers is a result
of our recursive concentration on this over-lapping group. In
each stage of our experiment, the refining methods have
only been applied to these overlapping markers—the most
interesting end of the distribution. Since our refining meth-
ods are conservative and, designed to reduce variance, they
have the tendency to reduce the number of markers falling
within the overlapped group. In effect, by concentrating on
just the extreme of the distribution, we have improved the
specificity of results for markers in this group but have had
very little effect on sensitivity of the experiment. Associated
markers, where the evidence for association was initially
under estimated, will not have been included amongst those
for which adapting factors and additional AIPs were gener-
ated. Thus, these have a low probability of being included in
the final analysis.
Although our UK GAMES screen has failed to find any
non-HLA markers showing evidence for association, it has
enabled us to substantially improve the quality of the analysis
and thereby enhanced the power of other GAMES screens.
Acknowledgements
We thank Aslaug Jonasdottir, Ragnheidur Fossdal and
Jeffrey Gulcher from deCODE for giving us access to their
genetic map, which was used in the multipoint analysis of
our data. We are grateful to the members of the Association
of British Neurologists for notifying patients participating in
this study.
This study represents one component of the GAMES
project designed and coordinated by DASC and SJS
(Cambridge, UK) with funding from the Wellcome Trust
(grant 057097) supplemented by the Multiple Sclerosis
Societies of the United States and Great Britain, and MS
International Federation.
References
Barcellos, L.F., Klitz, W., Field, L.L., Tobias, R., Bowcock, A.M., Wilson,
R., Nelson, M.P., Nagatomi, J., Thomson, G., 1997. Association map-
ping of disease loci using a pooled DNA genomic screen. American
Journal of Human Genetics 61, 734–747.
Barratt, B.J., Payne, F., Rance, H.E., Nutland, S., Todd, J.A., Clayton,
D.G., 2002. Identification of the sources of error in allele frequency
estimations from pooled DNA indicates an optimal experimental de-
sign. Annals of Human Genetics 66, 393–405.
Coraddu, F., Sawcer, S., Feakes, R., Chataway, J., Broadley, S., Jones,
H.B., Clayton, D., Gray, J., Smith, S., Taylor, C., Goodfellow, P.N.,
Compston, D.A.S., 1998. HLA typing in the United Kingdom multiple
sclerosis genome screen. Neurogenetics 2, 24–33.
Gabriel, S.B., Schaffner, S.F., Nguyen, H., Moore, J.M., Roy, J., Blumen-
stiel, B., Higgins, J., DeFelice, M., Lochner, A., Faggart, M., Liu-Cor-
dero, S.N., Rotimi, C., Adeyemo, A., Cooper, R., Ward, R., Lander, E.,
Daly, M.J., Altshuler, D., 2002. The structure of haplotype blocks in the
human genome. Science 296, 2225–2229.
Johnson, G.C., Esposito, L., Barratt, B.J., Smith, A.N., Heward, J.,
Di Genova, G., Ueda, H., Cordell, H.J., Eaves, I.A., Dudbridge, F.,
Twells, R.C., Payne, F., Hughes, W., Nutland, S., Stevens, H., Carr,
P., Tuomilehto-Wolf, E., Tuomilehto, J., Gough, S.C., Clayton, D.G.,
Todd, J.A., 2001. Haplotype tagging for the identification of common
disease genes. Nature Genetics 29, 233–237.
Jorde, L.B., 1995. Linkage disequilibrium as a gene-mapping tool. Amer-
ican Journal of Human Genetics 56, 11–14.
Kruglyak, L., 1997. The use of a genetic map of biallelic markers in linkage
studies. Nature Genetics 17, 21–24.
Muller-Myhsok, B., Abel, L., 1997. Genetic analysis of complex diseases.
Science 275, 1328–1329.
Poser, C.M., Paty, D.W., Scheinberg, L., McDonald, W.I., Davis, F.A.,
Ebers, G.C., Johnson, K.P., Sibley, W.A., Silberberg, D.H., Tourtellotte,
W.W., 1983. New diagnostic criteria for multiple sclerosis: guidelines
for research protocols. Annals of Neurology 13, 227–231.
Sawcer, S., Maranian, M., Setakis, E., Curwen, V., Eva Akesson, E., Hen-
siek, A., Coraddu, F., Roxburgh, R., Sawcer, D., Gray, J., Deans, J.,
Goodfellow, P.N., Walker, N., Clayton, D., Compston, A., 2002. A
whole genome screen for linkage disequilibrium in multiple sclerosis
confirms disease associations with regions previously linked to suscep-
tibility. Brain 125, 1337–1347.
Setakis, E., 2003. Statistical analysis of the GAMES studies. Journal of
Neuroimmunology 143, 47–52 (this issue).
Thompson, E.A., Neel, J.V., 1997. Alleleic disequilibrium and allele fre-
quency distribution as a function of social and demographic history.
American Journal of Human Genetics 60, 197–204.
Thomson, G., 1995. Mapping disease genes: family-based association stud-
ies. American Journal of Human Genetics 57, 487–498.