Embed Size (px)
Citation preview

8/3/2019 Refinery Per to Chemical 2004
http://slidepdf.com/reader/full/refinery-per-to-chemical-2004 1/90
Refinery
Petrochemical Integration
8/3/2019 Refinery Per to Chemical 2004
http://slidepdf.com/reader/full/refinery-per-to-chemical-2004 2/90
• Returns on refining assets fallen to inadequate
levels due to
- Low growth for major refined products
- Poor upgrading margins
- Increased competition
8/3/2019 Refinery Per to Chemical 2004
http://slidepdf.com/reader/full/refinery-per-to-chemical-2004 3/90
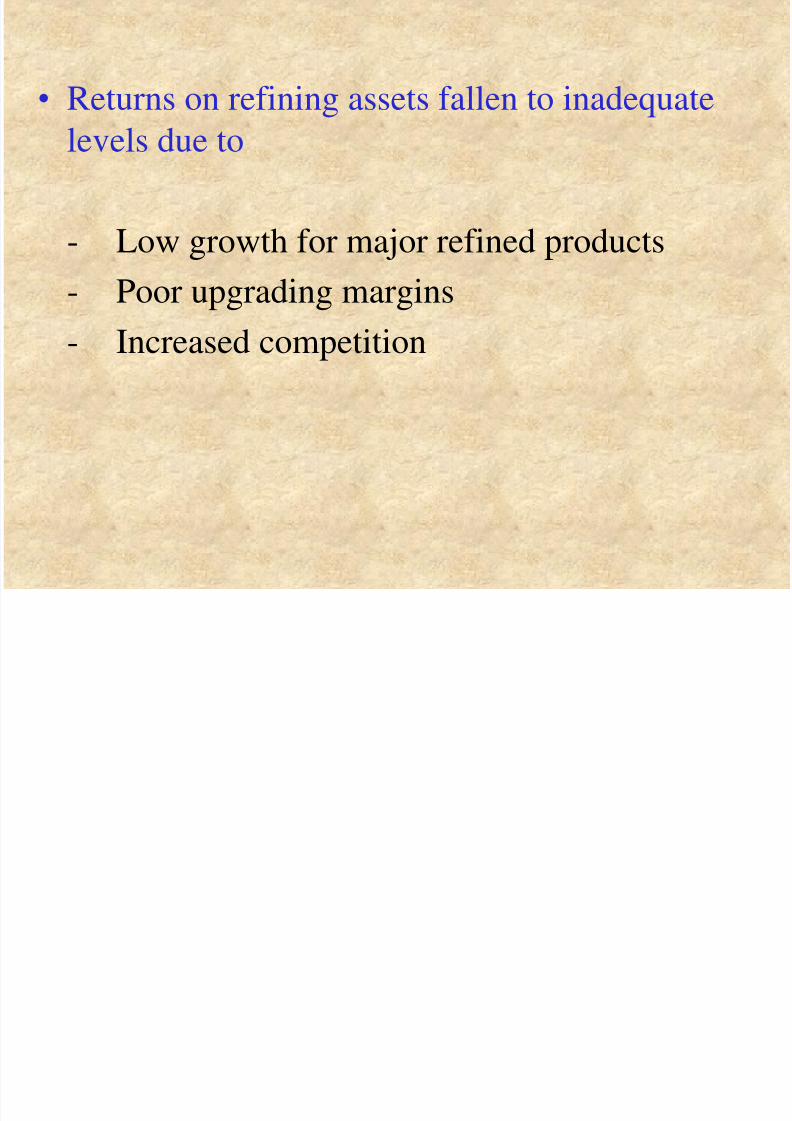
The drivers to these issues are:
• Refinery/ Petrochemical Integration
• Business diversification challenges (e.g. power
generation, retail marketing)• Process technology developments
• Regulatory issues
8/3/2019 Refinery Per to Chemical 2004
http://slidepdf.com/reader/full/refinery-per-to-chemical-2004 4/90
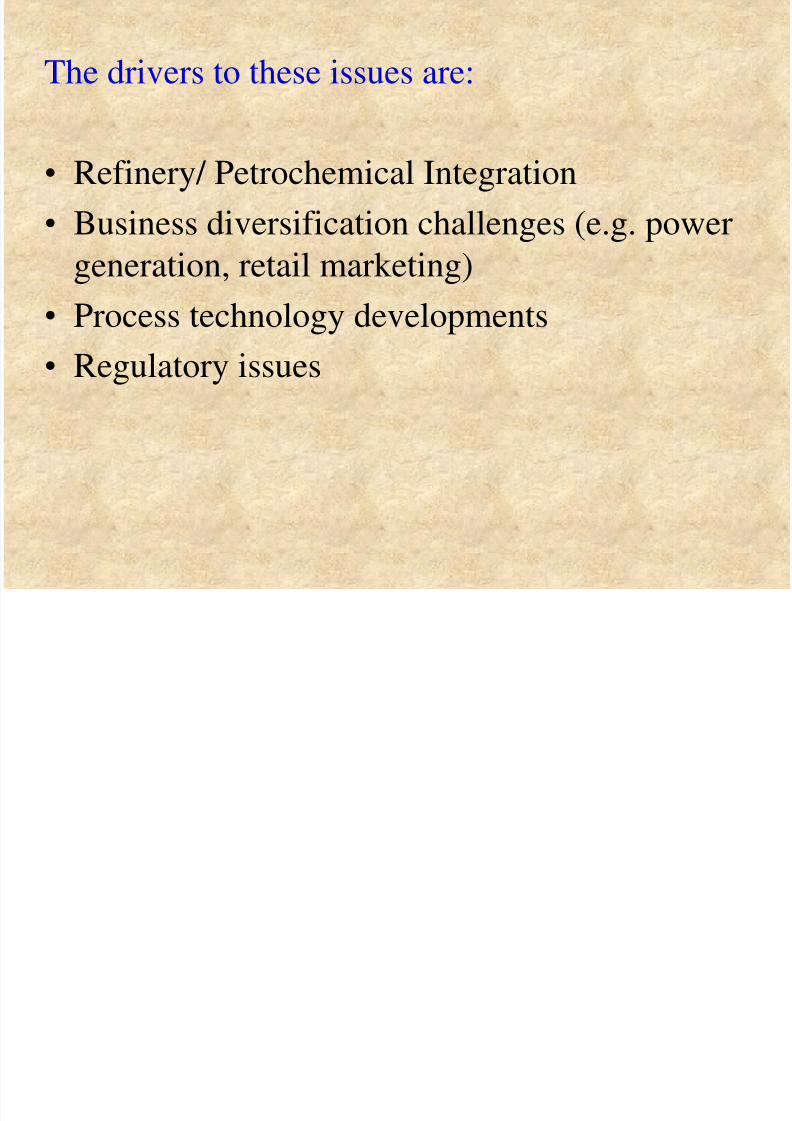
Growth Rate
• Global Petroleum demand is expected to
average 2.2% during next 10 years
• Global demand for major petrochemical
will grow twice as fast.
8/3/2019 Refinery Per to Chemical 2004
http://slidepdf.com/reader/full/refinery-per-to-chemical-2004 5/90
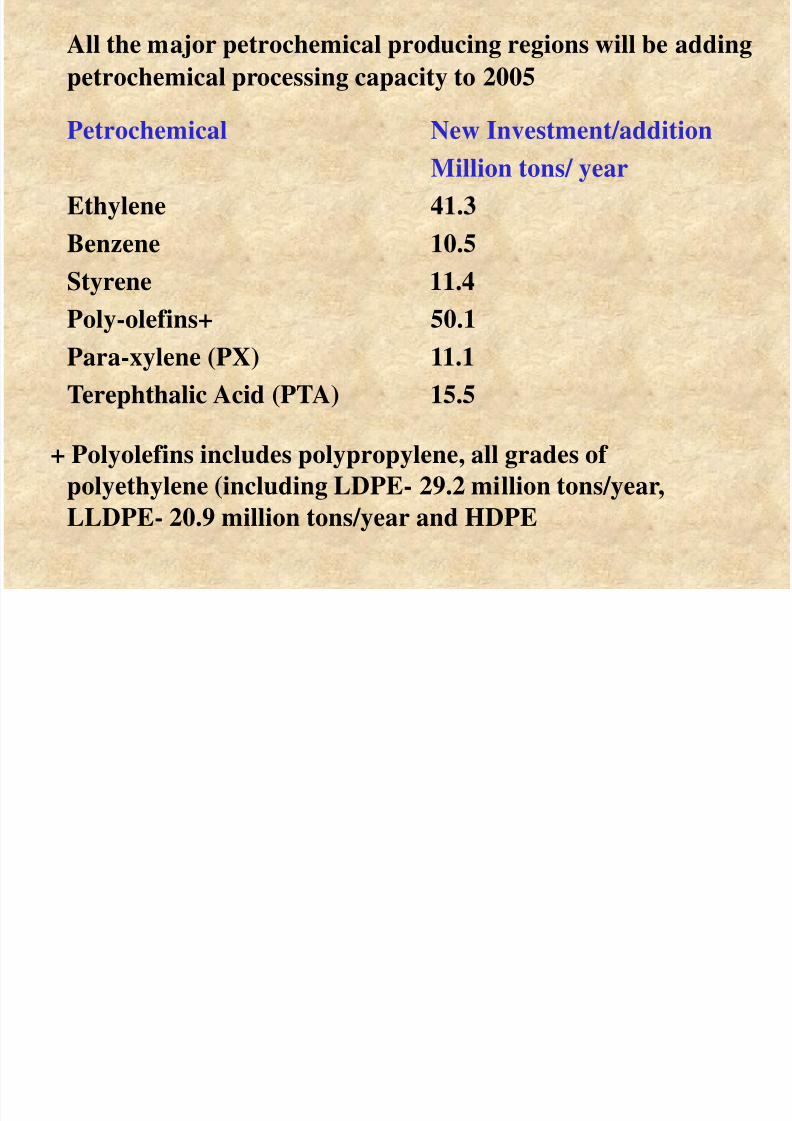
All the major petrochemical producing regions will be adding
petrochemical processing capacity to 2005
Petrochemical New Investment/additionMillion tons/ year
Ethylene 41.3
Benzene 10.5
Styrene 11.4
Poly-olefins+ 50.1
Para-xylene (PX) 11.1
Terephthalic Acid (PTA) 15.5
+ Polyolefins includes polypropylene, all grades of
polyethylene (including LDPE- 29.2 million tons/year,
LLDPE- 20.9 million tons/year and HDPE
8/3/2019 Refinery Per to Chemical 2004
http://slidepdf.com/reader/full/refinery-per-to-chemical-2004 6/90
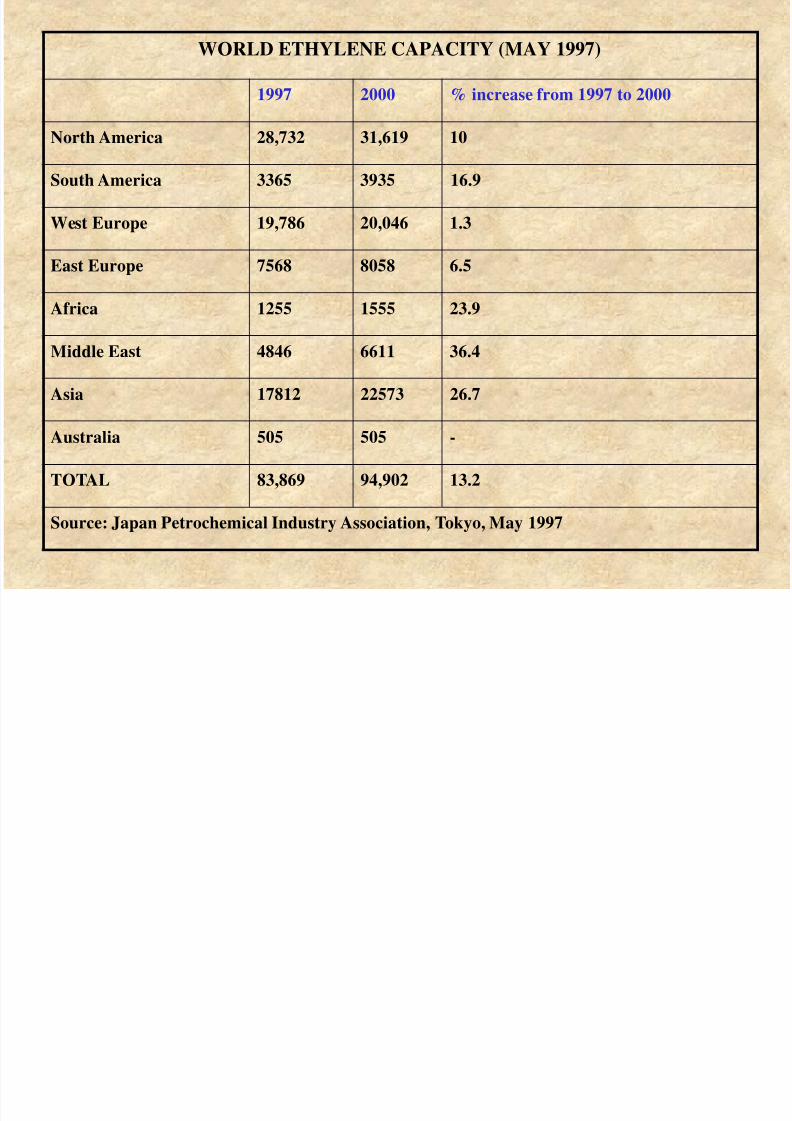
WORLD ETHYLENE CAPACITY (MAY 1997)
1997 2000 % increase from 1997 to 2000
North America 28,732 31,619 10
South America 3365 3935 16.9
West Europe 19,786 20,046 1.3
East Europe 7568 8058 6.5
Africa 1255 1555 23.9
Middle East 4846 6611 36.4
Asia 17812 22573 26.7
Australia 505 505 -
TOTAL 83,869 94,902 13.2
Source: Japan Petrochemical Industry Association, Tokyo, May 1997
8/3/2019 Refinery Per to Chemical 2004
http://slidepdf.com/reader/full/refinery-per-to-chemical-2004 7/90
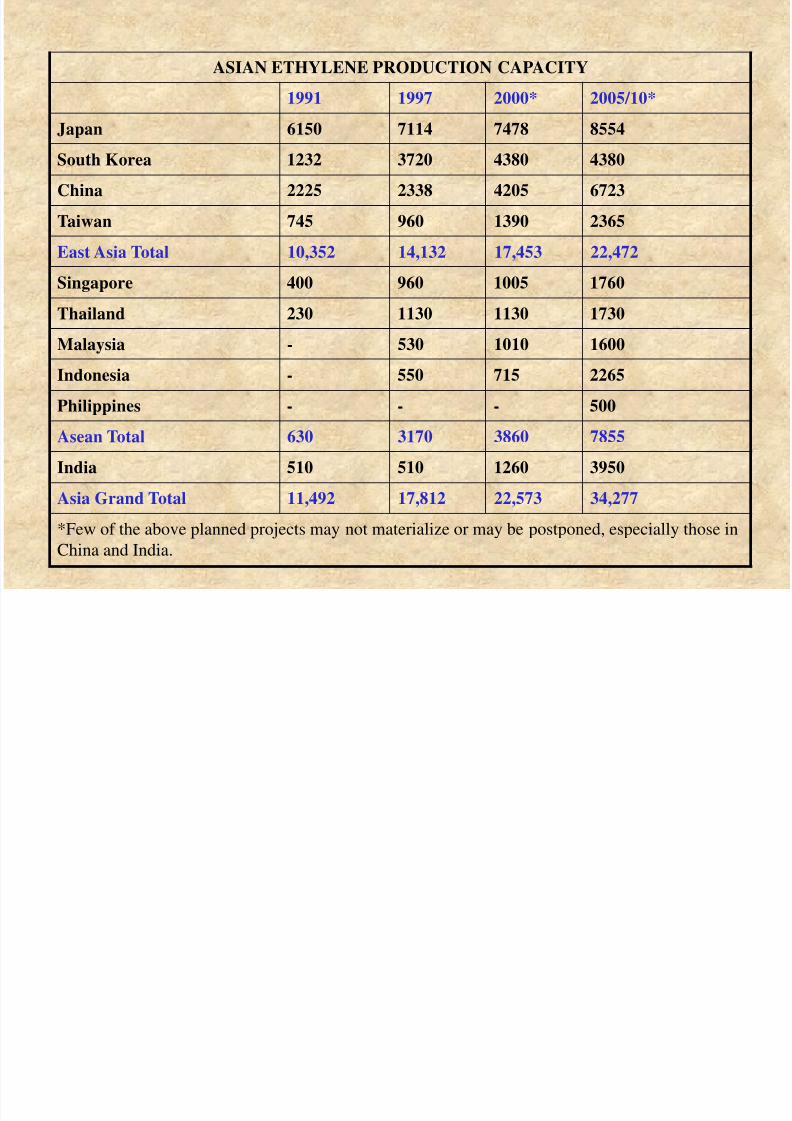
ASIAN ETHYLENE PRODUCTION CAPACITY
1991 1997 2000* 2005/10*
Japan 6150 7114 7478 8554
South Korea 1232 3720 4380 4380
China 2225 2338 4205 6723
Taiwan 745 960 1390 2365
East Asia Total 10,352 14,132 17,453 22,472
Singapore 400 960 1005 1760
Thailand 230 1130 1130 1730
Malaysia - 530 1010 1600
Indonesia - 550 715 2265
Philippines - - - 500Asean Total 630 3170 3860 7855
India 510 510 1260 3950
Asia Grand Total 11,492 17,812 22,573 34,277
*Few of the above planned projects may not materialize or may be postponed, especially those in
China and India.
8/3/2019 Refinery Per to Chemical 2004
http://slidepdf.com/reader/full/refinery-per-to-chemical-2004 8/90
Propylene demand continues to exceedgrowth in production from steam
crackers
Projects to produce additional
propylene from Refinery FCC units are
being considered.
8/3/2019 Refinery Per to Chemical 2004
http://slidepdf.com/reader/full/refinery-per-to-chemical-2004 9/90
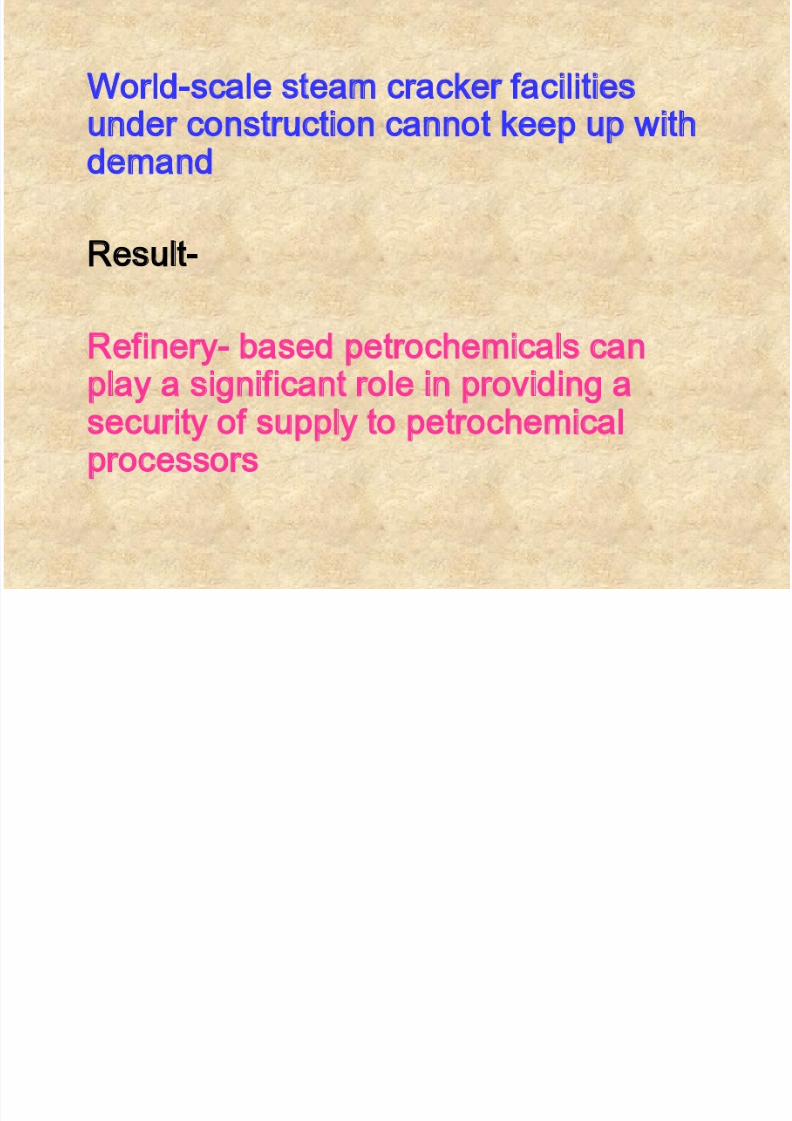
World-scale steam cracker facilities
under construction cannot keep up withdemand
Result-
Refinery- based petrochemicals canplay a significant role in providing a
security of supply to petrochemicalprocessors
8/3/2019 Refinery Per to Chemical 2004
http://slidepdf.com/reader/full/refinery-per-to-chemical-2004 10/90
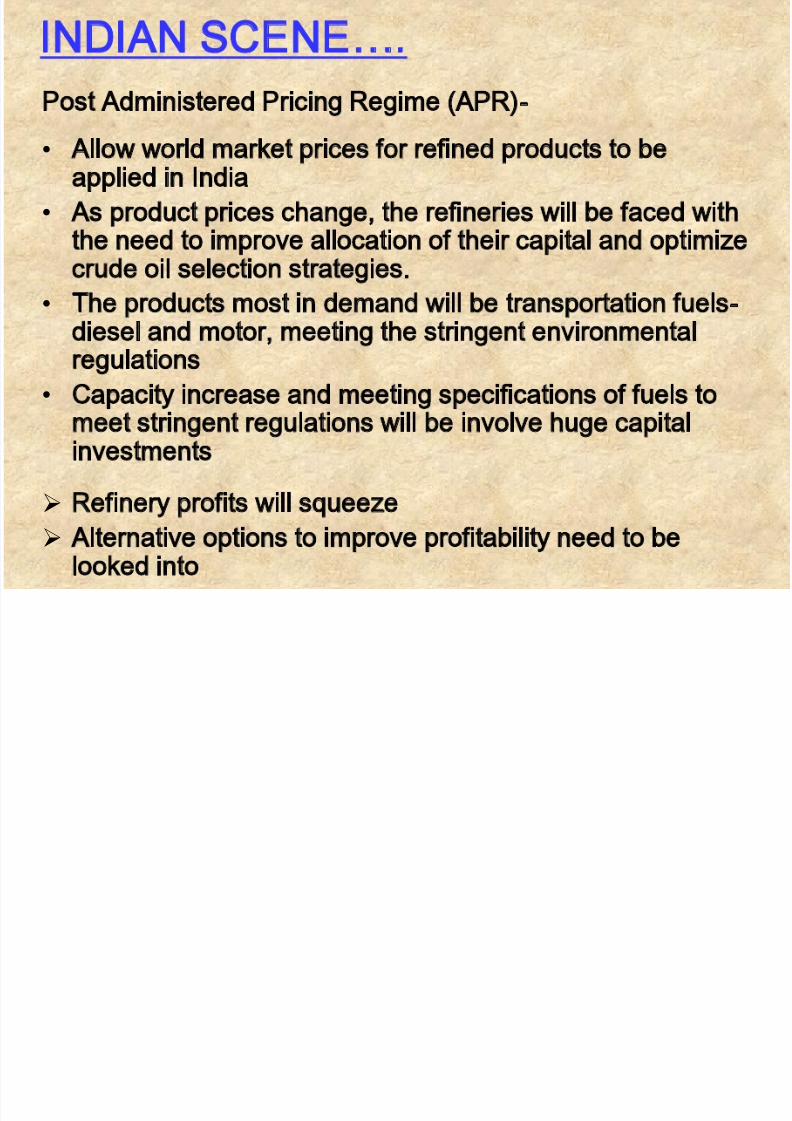
INDIAN SCENE….
Post Administered Pricing Regime (APR)-
• Allow world market prices for refined products to beapplied in India
• As product prices change, the refineries will be faced withthe need to improve allocation of their capital and optimize
crude oil selection strategies.• The products most in demand will be transportation fuels-
diesel and motor, meeting the stringent environmentalregulations
• Capacity increase and meeting specifications of fuels tomeet stringent regulations will be involve huge capitalinvestments
Refinery profits will squeeze
Alternative options to improve profitability need to belooked into
8/3/2019 Refinery Per to Chemical 2004
http://slidepdf.com/reader/full/refinery-per-to-chemical-2004 11/90
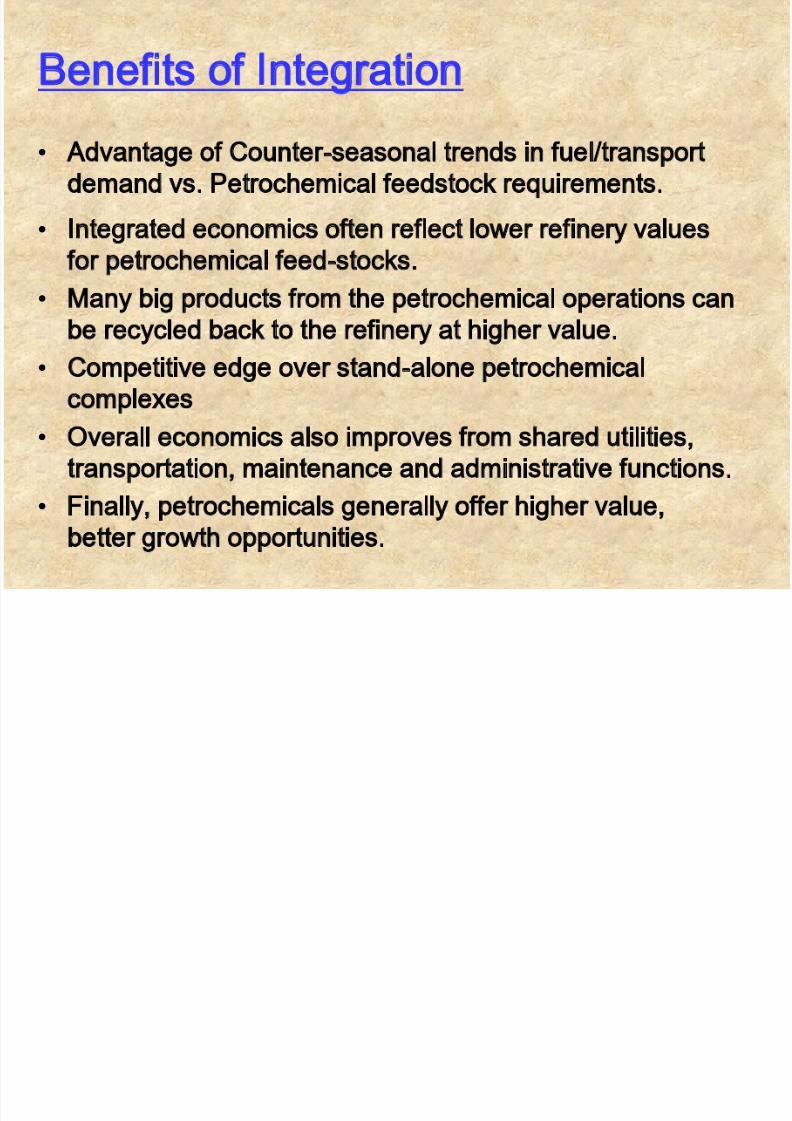
Benefits of Integration
• Advantage of Counter-seasonal trends in fuel/transport
demand vs. Petrochemical feedstock requirements.
• Integrated economics often reflect lower refinery values
for petrochemical feed-stocks.
• Many big products from the petrochemical operations can
be recycled back to the refinery at higher value.
• Competitive edge over stand-alone petrochemical
complexes
• Overall economics also improves from shared utilities,
transportation, maintenance and administrative functions.
• Finally, petrochemicals generally offer higher value,
better growth opportunities.
8/3/2019 Refinery Per to Chemical 2004
http://slidepdf.com/reader/full/refinery-per-to-chemical-2004 12/90
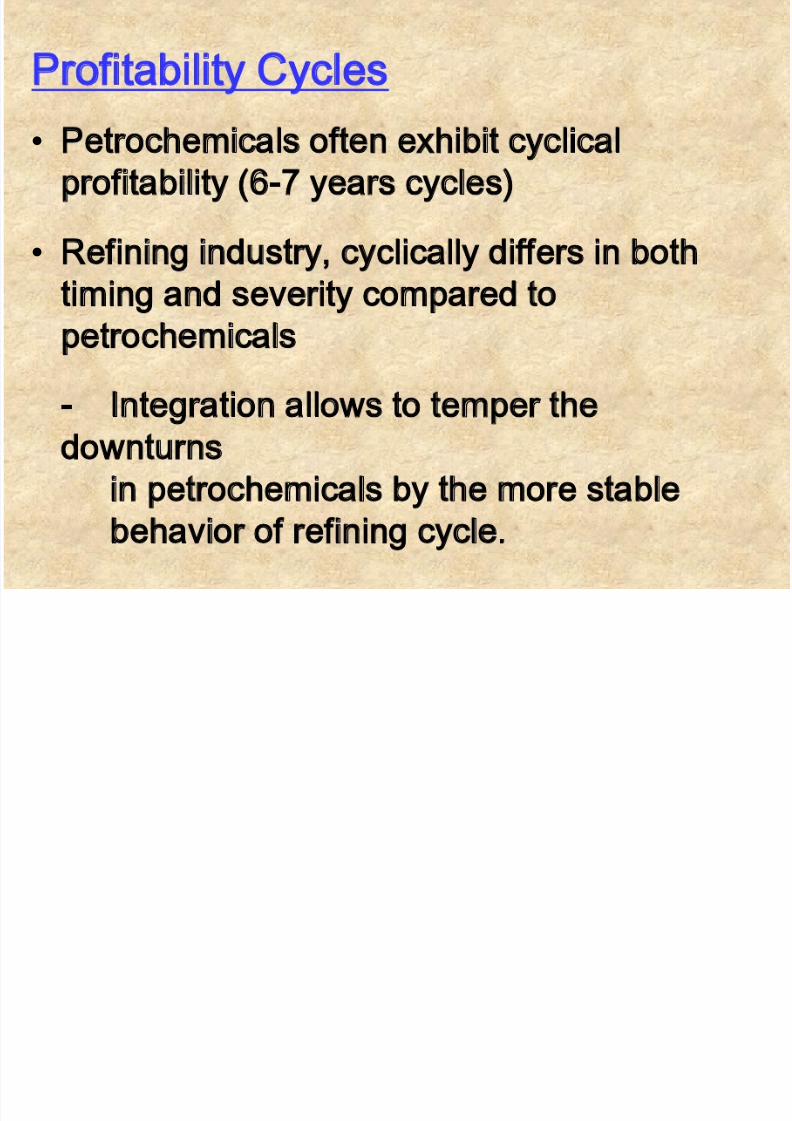
Profitability Cycles
• Petrochemicals often exhibit cyclicalprofitability (6-7 years cycles)
• Refining industry, cyclically differs in both
timing and severity compared to
petrochemicals
- Integration allows to temper thedownturns
in petrochemicals by the more stable
behavior of refining cycle.
8/3/2019 Refinery Per to Chemical 2004
http://slidepdf.com/reader/full/refinery-per-to-chemical-2004 13/90
Refinery/ Petrochemical integration also
brings other synergistic opportunities
- Energy optimization and cogeneration
- Recycling H2 from integrated
petrochemical complexes to refinery for
increased demand in hydroprocessing inreformulated products.
8/3/2019 Refinery Per to Chemical 2004
http://slidepdf.com/reader/full/refinery-per-to-chemical-2004 14/90
Obstacles that can deter investments in extending
refinery operations into petro-chemical operations
include:
• High capital costs of new petrochemical units
• Product/intermediate transfer costs between
refinery and petrochemical divisions• Refiners may see a higher rate of return in
other| business such as retail marketing
• In contrast to refiners, many chemical industryplayers prefer to make smaller acquisitions to
fit existing portfolios and minimize risks
8/3/2019 Refinery Per to Chemical 2004
http://slidepdf.com/reader/full/refinery-per-to-chemical-2004 15/90
•
The trend towards refinery/ petrochemicalintegration is clear as one of the options to
improve the profitability .
•
Already been implemented by – Exxon, Shell, Mobil, & BP
8/3/2019 Refinery Per to Chemical 2004
http://slidepdf.com/reader/full/refinery-per-to-chemical-2004 16/90
Some Grass root refineries in Asia are being
driven by petrochemical feedstock
considerations:
RIL, India
- Catalytic Reformer with 4 p-xylene units- FCC unit for high yield of C3, C4 and C5
olefins
•Aromatics complexes have been added to two ofthe four major Singapore refineries.

8/3/2019 Refinery Per to Chemical 2004
http://slidepdf.com/reader/full/refinery-per-to-chemical-2004 17/90
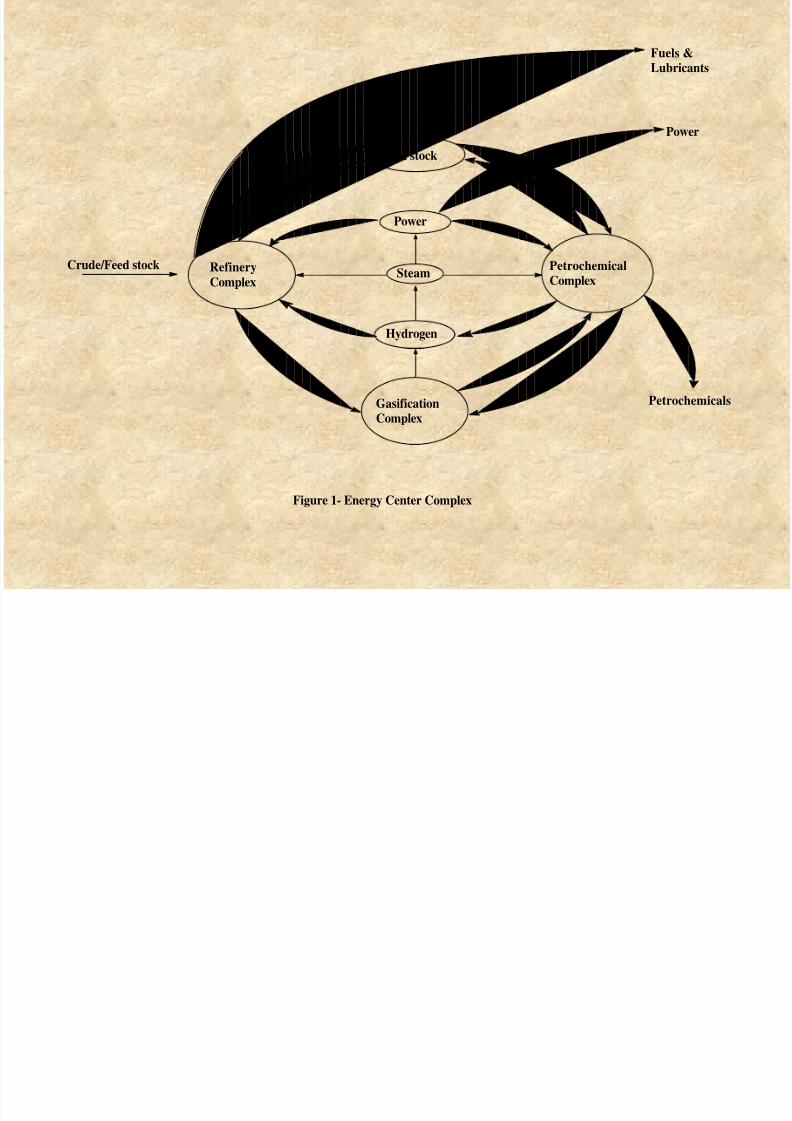
Broader outlook of refinery – petrochemicalsintegration
1. Energy Center Complex
2. Utilities Island integration
8/3/2019 Refinery Per to Chemical 2004
http://slidepdf.com/reader/full/refinery-per-to-chemical-2004 18/90
Crude/Feed stock
Fuels &
Lubricants
Hydrogen
Gasification
Complex
Petrochemical
Complex
Petrochemicals
Refinery
Complex
Power
Feed stock
Power
Steam
Figure 1- Energy Center Complex
8/3/2019 Refinery Per to Chemical 2004
http://slidepdf.com/reader/full/refinery-per-to-chemical-2004 19/90
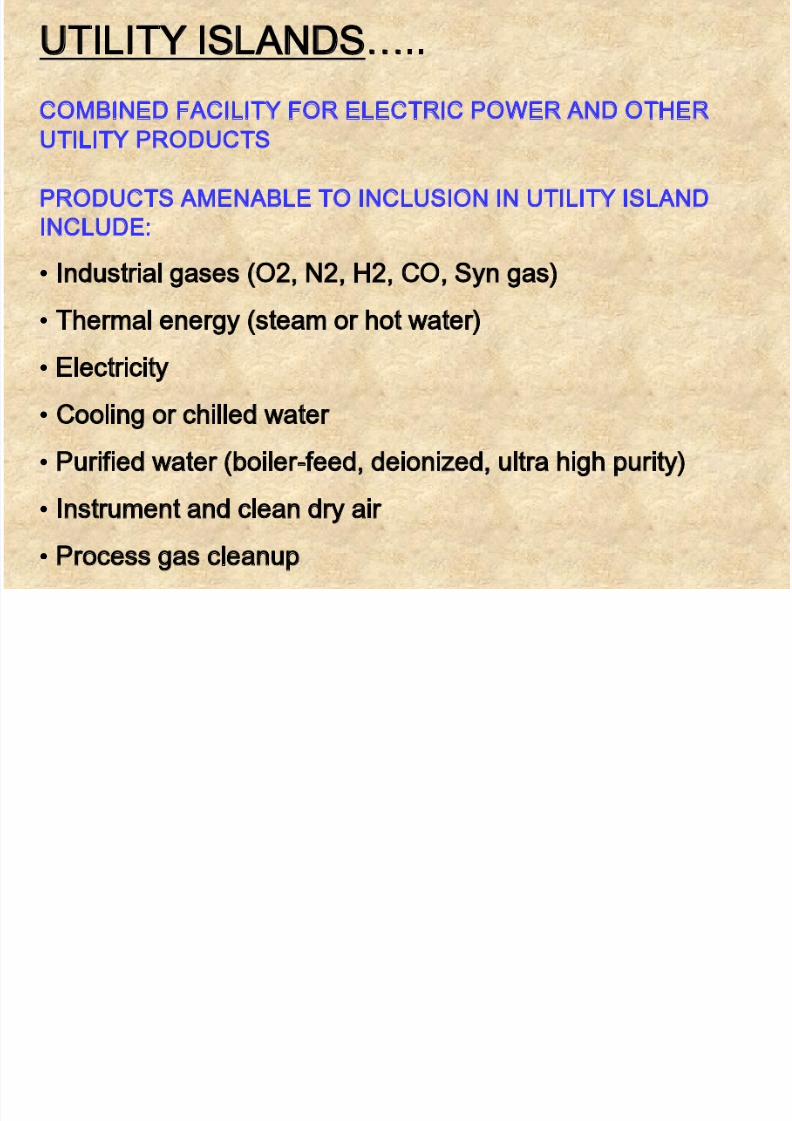
UTILITY ISLANDS…..
COMBINED FACILITY FOR ELECTRIC POWER AND OTHER
UTILITY PRODUCTS
PRODUCTS AMENABLE TO INCLUSION IN UTILITY ISLAND
INCLUDE:
•Industrial gases (O2, N2, H2, CO, Syn gas)
• Thermal energy (steam or hot water)
• Electricity
• Cooling or chilled water
• Purified water (boiler-feed, deionized, ultra high purity)
• Instrument and clean dry air
• Process gas cleanup
8/3/2019 Refinery Per to Chemical 2004
http://slidepdf.com/reader/full/refinery-per-to-chemical-2004 20/90
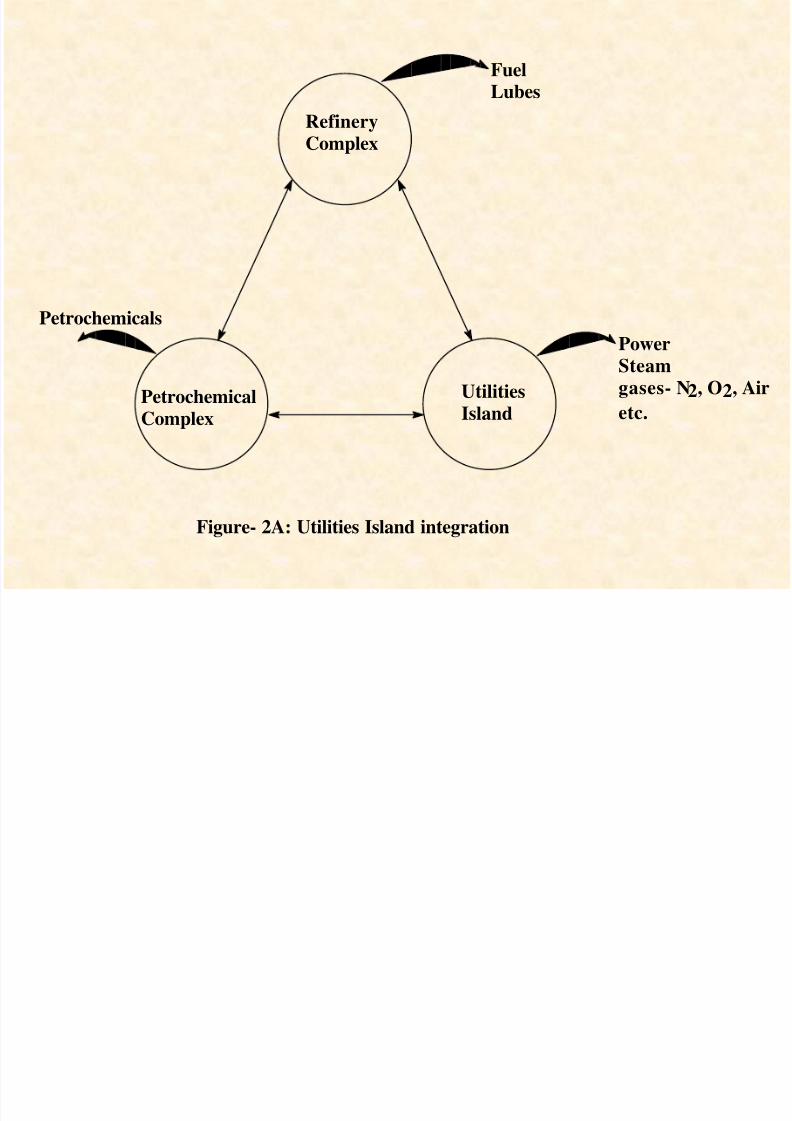
Figure- 2A: Utilities Island integration
Petrochemicals
Refinery
Complex
Petrochemical
Complex
Utilities
Island
Fuel
Lubes
Power
Steam
gases- N2, O2, Air
etc.
8/3/2019 Refinery Per to Chemical 2004
http://slidepdf.com/reader/full/refinery-per-to-chemical-2004 21/90
The future of petrochemical integration into
the refinery cannot be characterized insimple terms. It must first be recognized
that petrochemical industry is a large
industry with many products and more
than 500 processes.

8/3/2019 Refinery Per to Chemical 2004
http://slidepdf.com/reader/full/refinery-per-to-chemical-2004 22/90
If an existing refining facility does not
already produce a sizable quantity ofpetrochemical products, can it ever
hope to achieve an acceptable return
on petrochemical projects?
8/3/2019 Refinery Per to Chemical 2004
http://slidepdf.com/reader/full/refinery-per-to-chemical-2004 23/90
Refiners produce a wide range of
chemical feedstocks depending on
crude type, refinery complexity, and
other operating conditions.
Typically a limited number of refinery
processes/ streams provide the
primary feedstocks to supportcompetitively sized petrochemical
production.
8/3/2019 Refinery Per to Chemical 2004
http://slidepdf.com/reader/full/refinery-per-to-chemical-2004 24/90
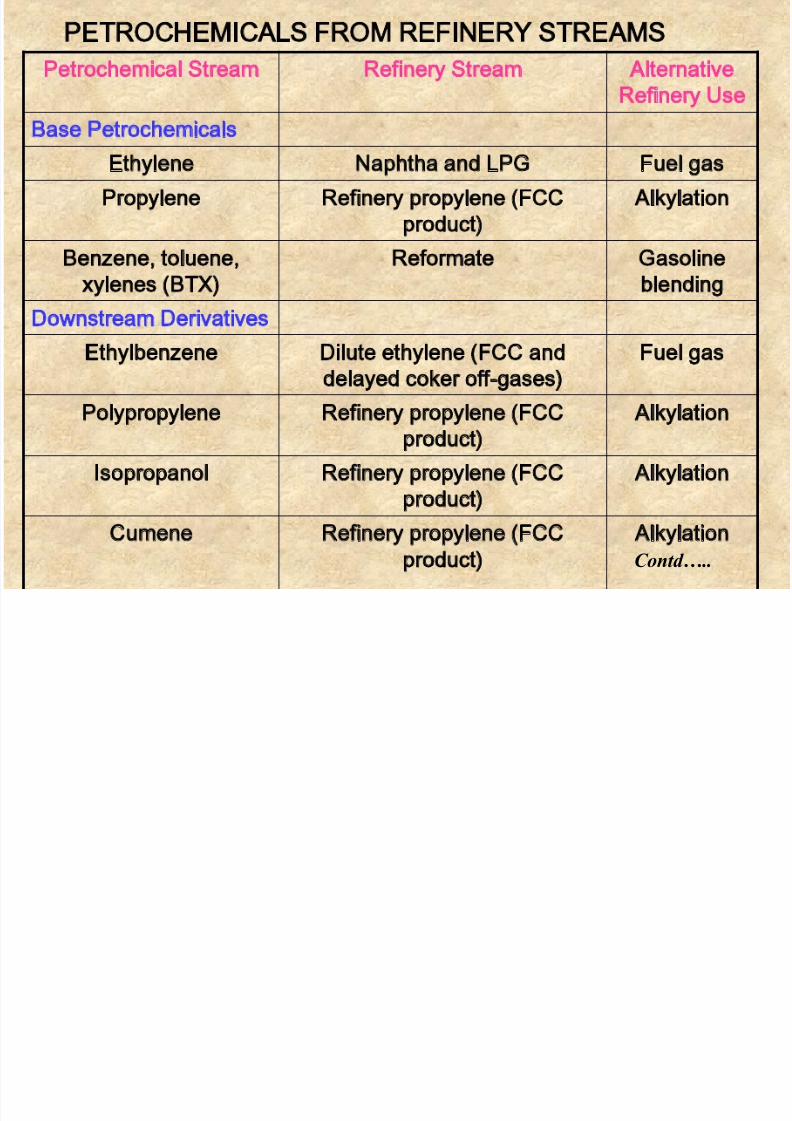
PETROCHEMICALS FROM REFINERY STREAMS
Petrochemical Stream Refinery Stream Alternative
Refinery Use
Base PetrochemicalsEthylene Naphtha and LPG Fuel gas
Propylene Refinery propylene (FCC
product)
Alkylation
Benzene, toluene,
xylenes (BTX)
Reformate Gasoline
blending
Downstream Derivatives
Ethylbenzene Dilute ethylene (FCC and
delayed coker off-gases)
Fuel gas
Polypropylene Refinery propylene (FCCproduct)
Alkylation
Isopropanol Refinery propylene (FCC
product)
Alkylation
Cumene Refinery propylene (FCC
product)
Alkylation
Contd…..
8/3/2019 Refinery Per to Chemical 2004
http://slidepdf.com/reader/full/refinery-per-to-chemical-2004 25/90
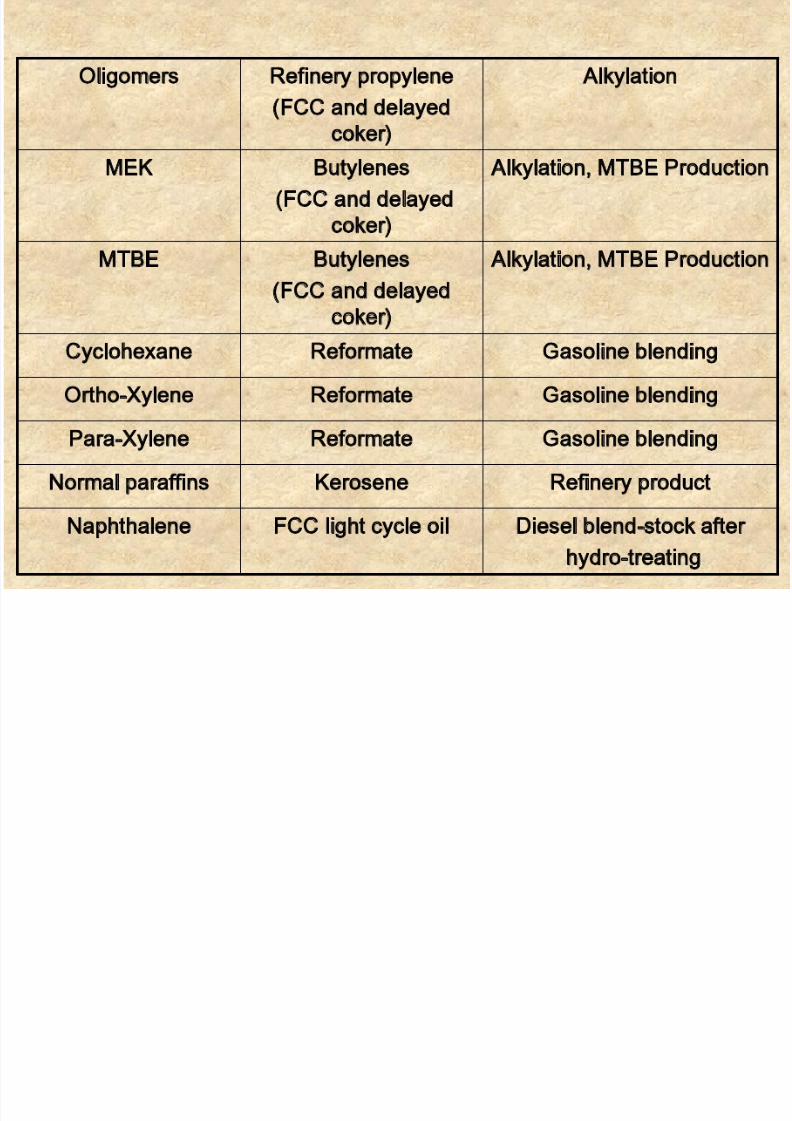
Oligomers Refinery propylene
(FCC and delayed
coker)
Alkylation
MEK Butylenes
(FCC and delayed
coker)
Alkylation, MTBE Production
MTBE Butylenes
(FCC and delayed
coker)
Alkylation, MTBE Production
Cyclohexane Reformate Gasoline blending
Ortho-Xylene Reformate Gasoline blending
Para-Xylene Reformate Gasoline blending
Normal paraffins Kerosene Refinery product
Naphthalene FCC light cycle oil Diesel blend-stock after
hydro-treating
8/3/2019 Refinery Per to Chemical 2004
http://slidepdf.com/reader/full/refinery-per-to-chemical-2004 26/90
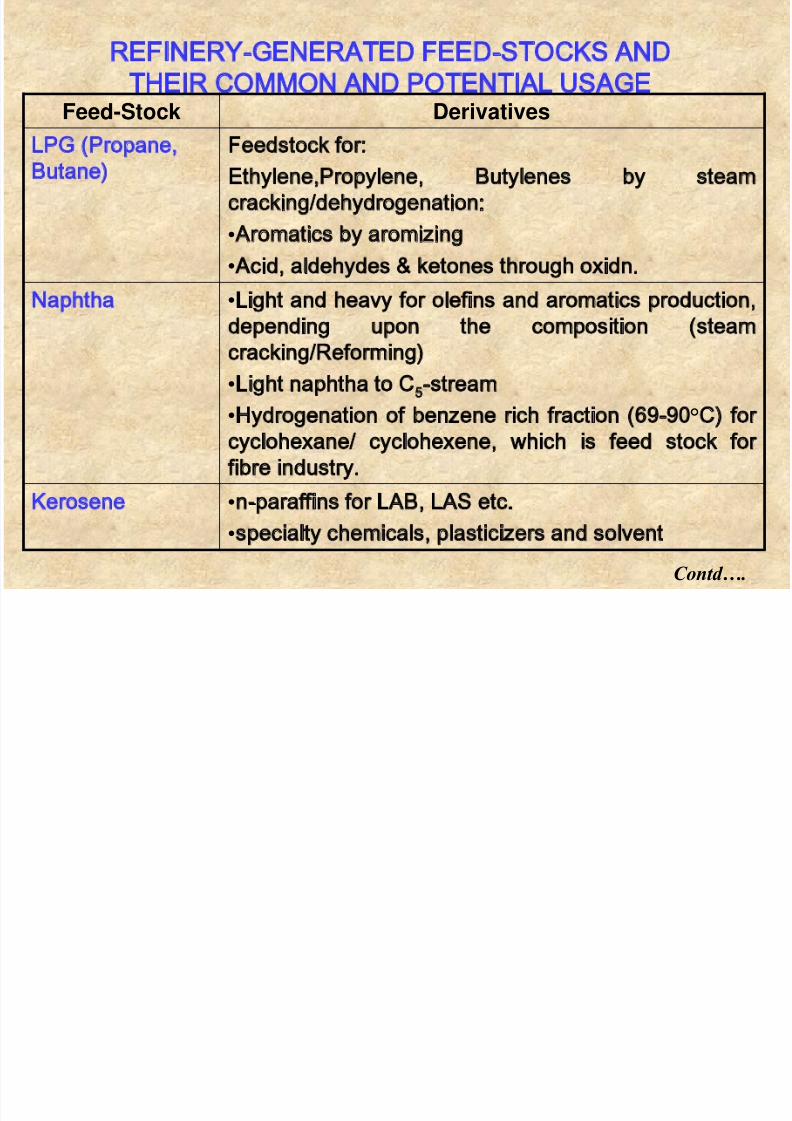
REFINERY-GENERATED FEED-STOCKS AND
THEIR COMMON AND POTENTIAL USAGEFeed-Stock Derivatives
LPG (Propane,Butane)
Feedstock for:
Ethylene,Propylene, Butylenes by steam
cracking/dehydrogenation:
•Aromatics by aromizing
•Acid, aldehydes & ketones through oxidn.
Naphtha •Light and heavy for olefins and aromatics production,
depending upon the composition (steam
cracking/Reforming)
•Light naphtha to C5-stream
•Hydrogenation of benzene rich fraction (69-90°C) for
cyclohexane/ cyclohexene, which is feed stock for
fibre industry.
Kerosene •n-paraffins for LAB, LAS etc.
•specialty chemicals, plasticizers and solvent
Contd….
8/3/2019 Refinery Per to Chemical 2004
http://slidepdf.com/reader/full/refinery-per-to-chemical-2004 27/90
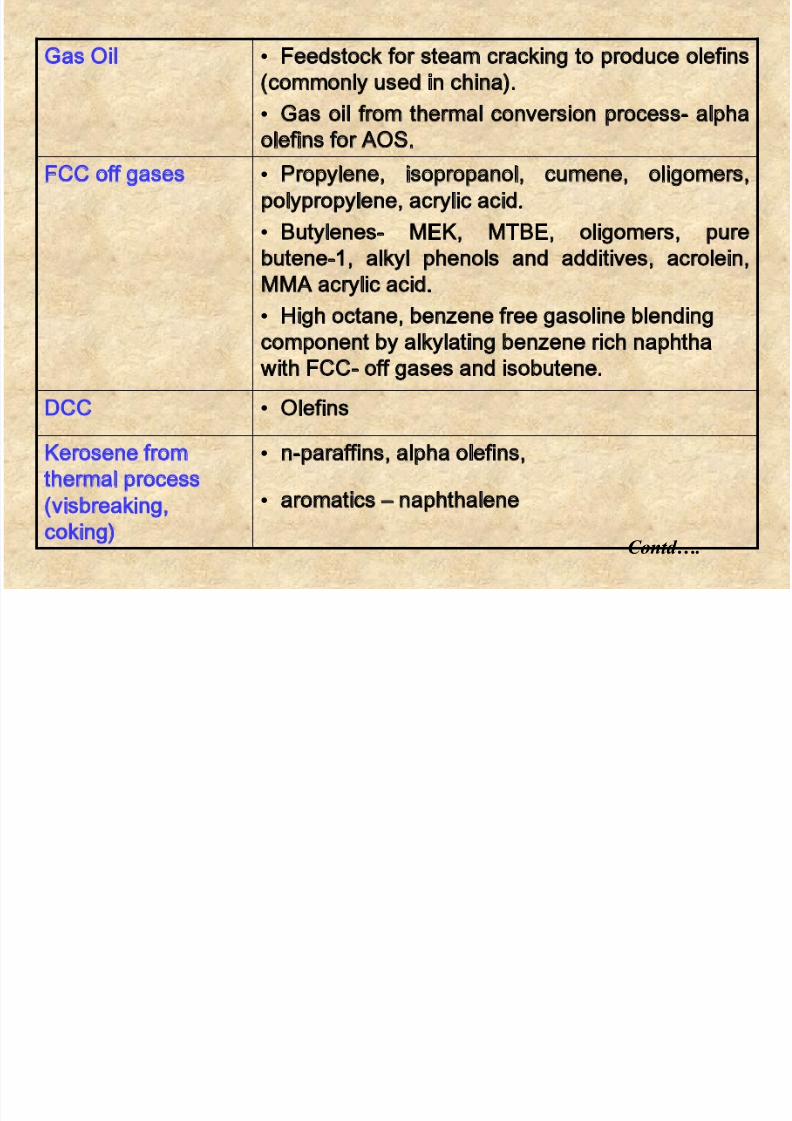
Gas Oil • Feedstock for steam cracking to produce olefins
(commonly used in china).
• Gas oil from thermal conversion process- alpha
olefins for AOS.FCC off gases • Propylene, isopropanol, cumene, oligomers,
polypropylene, acrylic acid.
• Butylenes- MEK, MTBE, oligomers, pure
butene-1, alkyl phenols and additives, acrolein,
MMA acrylic acid.
• High octane, benzene free gasoline blending
component by alkylating benzene rich naphtha
with FCC- off gases and isobutene.
DCC•
Olefins
Kerosene from
thermal process
(visbreaking,
coking)
• n-paraffins, alpha olefins,
• aromatics – naphthalene
Contd….
8/3/2019 Refinery Per to Chemical 2004
http://slidepdf.com/reader/full/refinery-per-to-chemical-2004 28/90
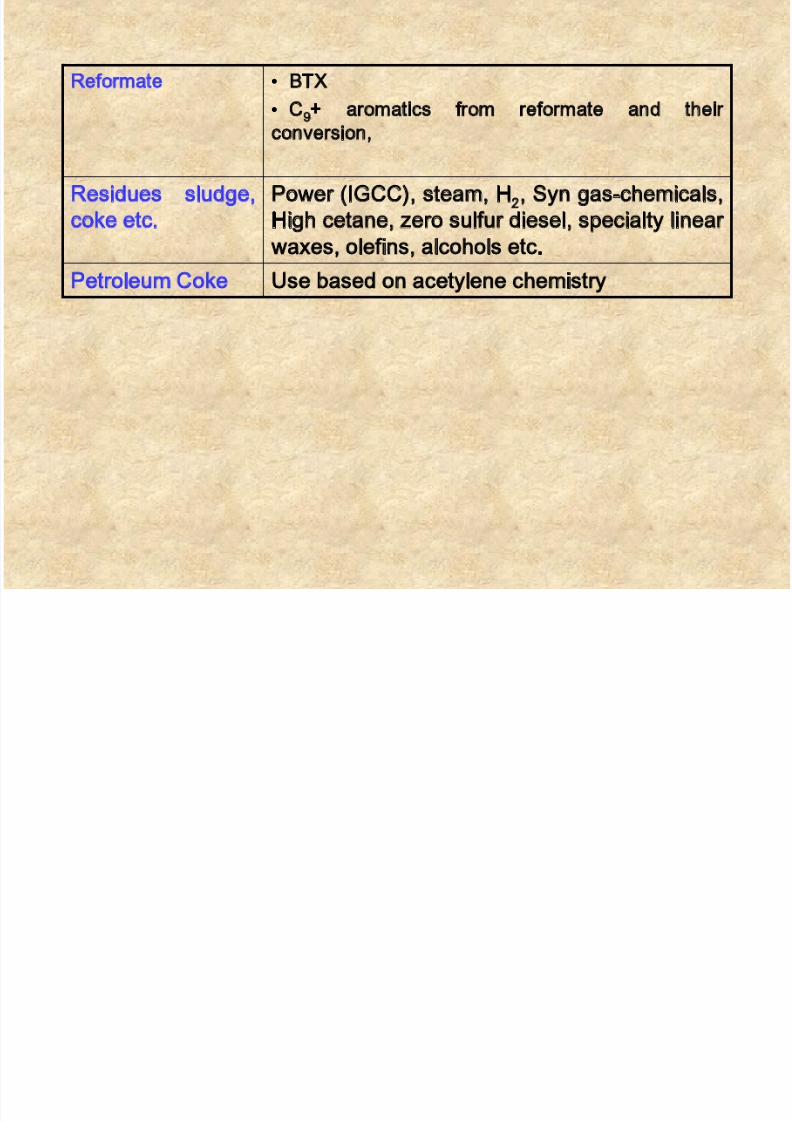
Reformate • BTX
• C9+ aromatics from reformate and their
conversion,
Residues sludge,
coke etc.
Power (IGCC), steam, H2, Syn gas-chemicals,
High cetane, zero sulfur diesel, specialty linear
waxes, olefins, alcohols etc.
Petroleum Coke Use based on acetylene chemistry
8/3/2019 Refinery Per to Chemical 2004
http://slidepdf.com/reader/full/refinery-per-to-chemical-2004 29/90
Changing fuel specifications willhave an impact on the interfaces or
synergies of refining and
petrochemical operations.
8/3/2019 Refinery Per to Chemical 2004
http://slidepdf.com/reader/full/refinery-per-to-chemical-2004 30/90
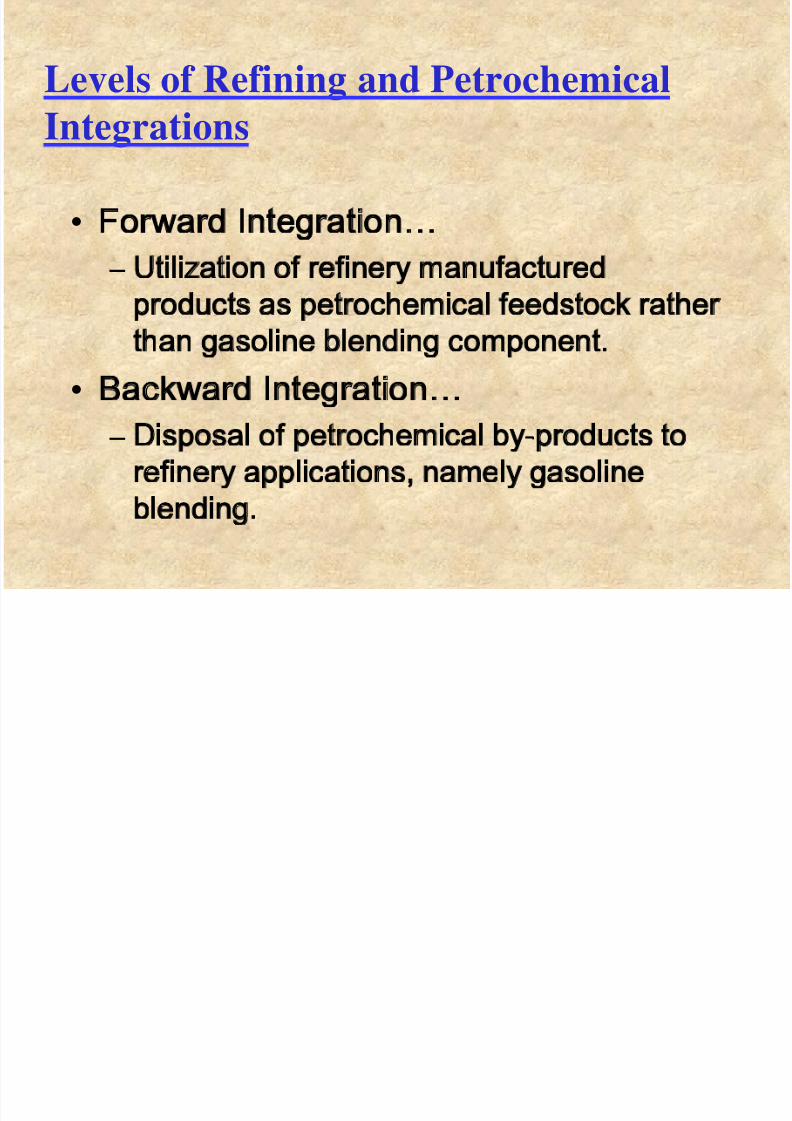
Levels of Refining and Petrochemical
Integrations
• Forward Integration…
–
Utilization of refinery manufacturedproducts as petrochemical feedstock rather
than gasoline blending component.
• Backward Integration…
– Disposal of petrochemical by-products to
refinery applications, namely gasoline
blending.
8/3/2019 Refinery Per to Chemical 2004
http://slidepdf.com/reader/full/refinery-per-to-chemical-2004 31/90
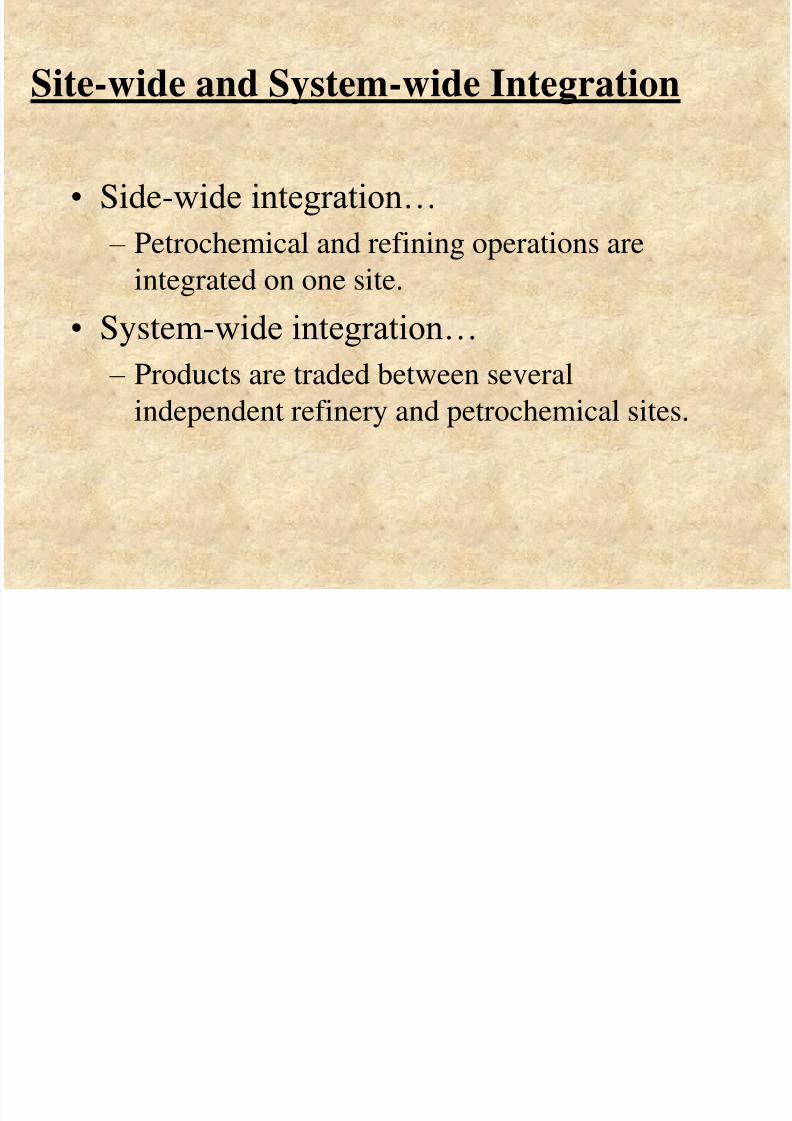
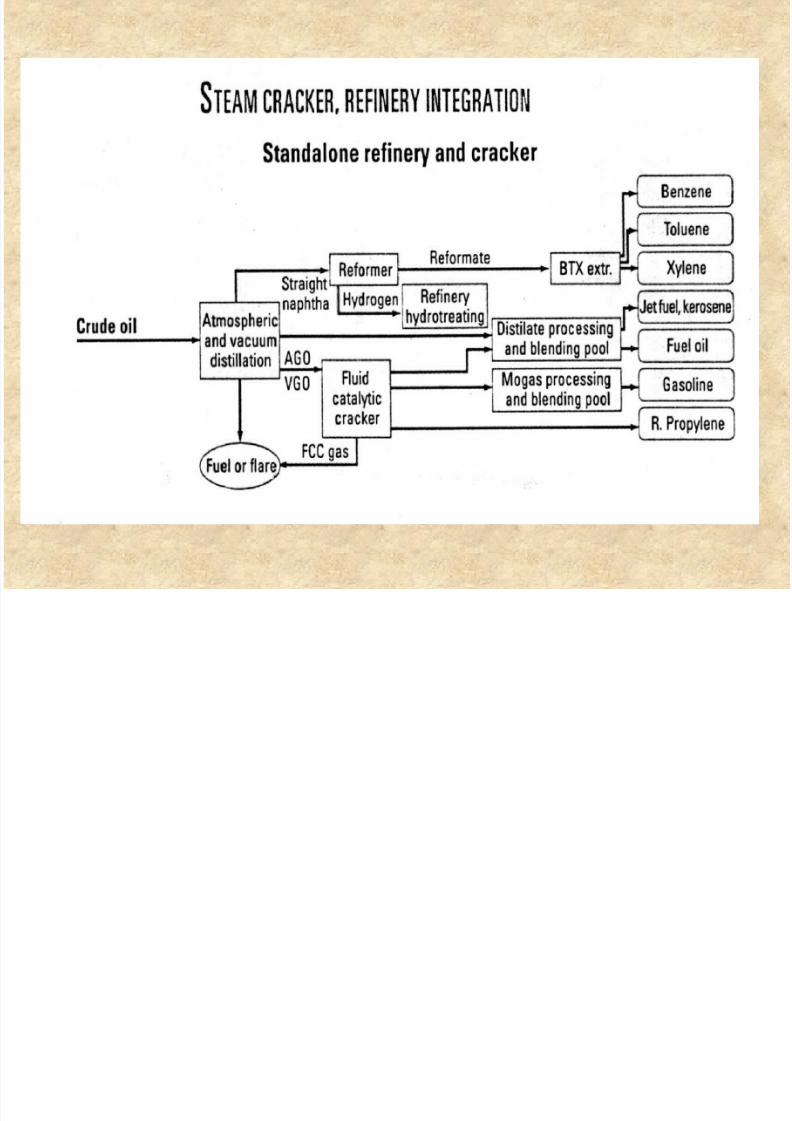
Site-wide and System-wide Integration
• Side-wide integration…
– Petrochemical and refining operations are
integrated on one site.• System-wide integration…
– Products are traded between several
independent refinery and petrochemical sites.
8/3/2019 Refinery Per to Chemical 2004
http://slidepdf.com/reader/full/refinery-per-to-chemical-2004 32/90
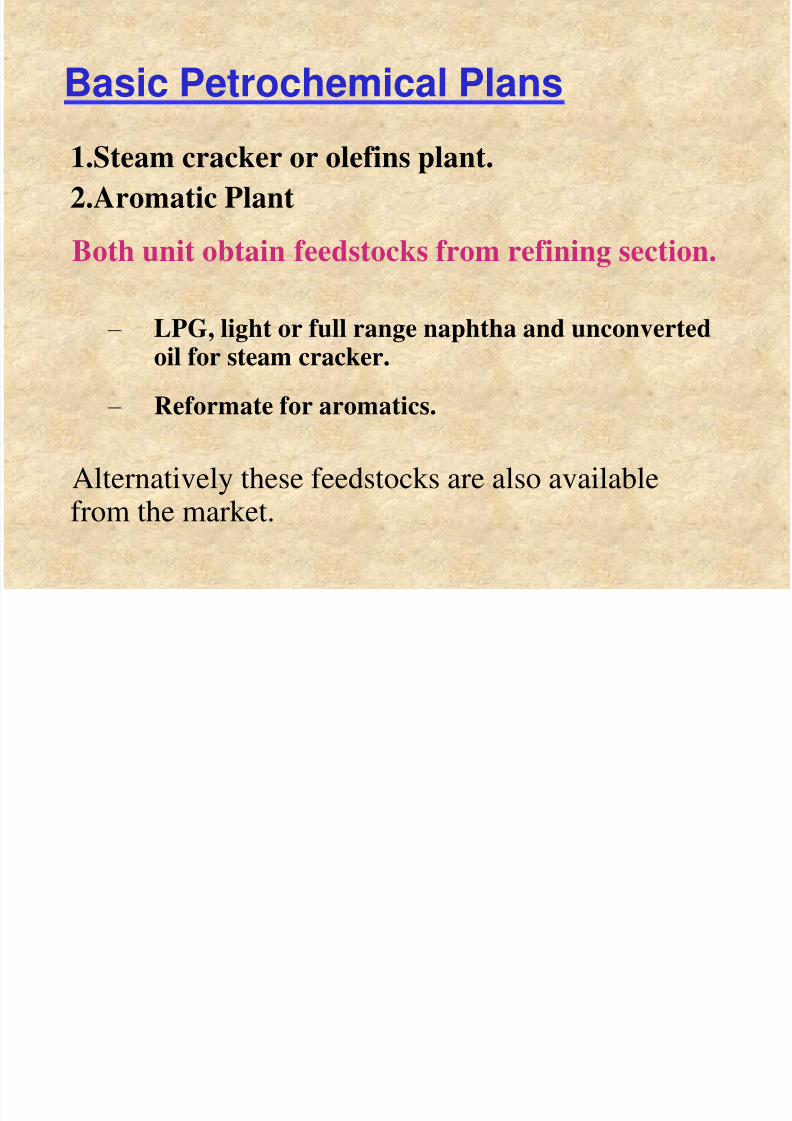
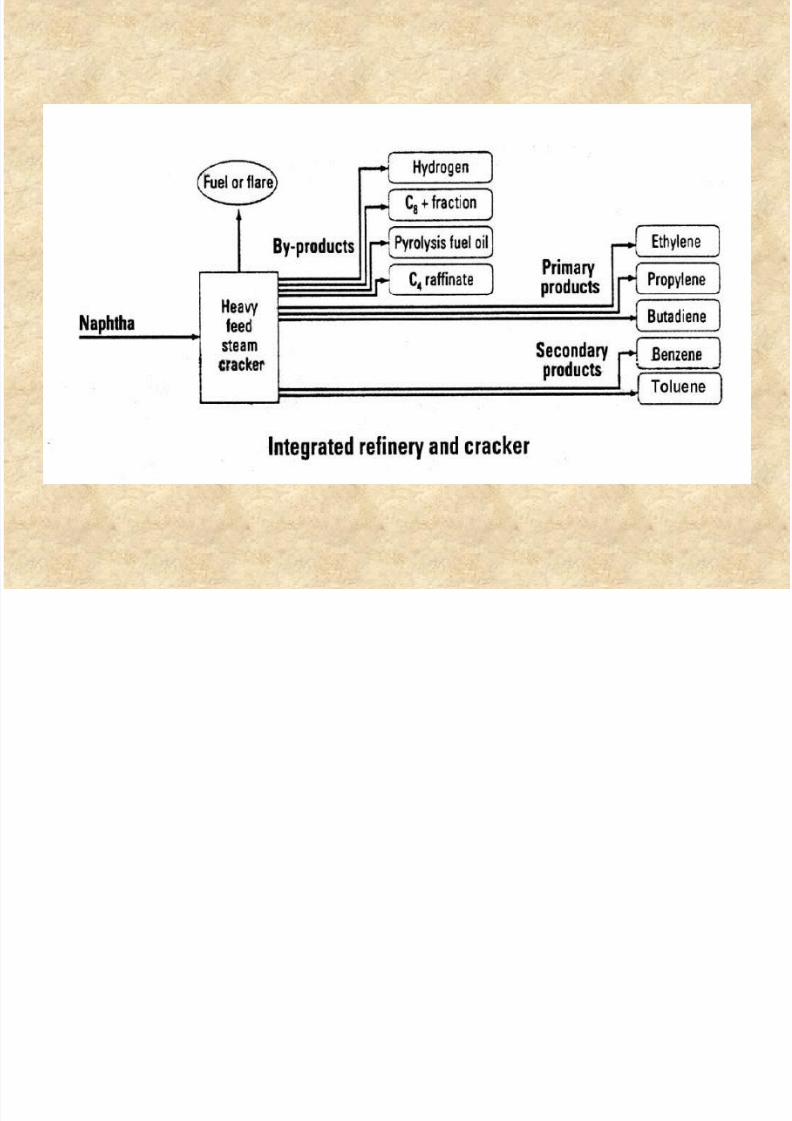
Basic Petrochemical Plans
1.Steam cracker or olefins plant.
2.Aromatic Plant
Both unit obtain feedstocks from refining section.
– LPG, light or full range naphtha and unconvertedoil for steam cracker.
– Reformate for aromatics.
Alternatively these feedstocks are also availablefrom the market.
8/3/2019 Refinery Per to Chemical 2004
http://slidepdf.com/reader/full/refinery-per-to-chemical-2004 33/90
Alternatives for light naphtha
1. Feedstock for steam cracker
2. Feed stock for isomerisationunit

8/3/2019 Refinery Per to Chemical 2004
http://slidepdf.com/reader/full/refinery-per-to-chemical-2004 34/90
Alternatives for Reformate
1. Feedstock for Aromatics
2. Gasoline Blending Component
8/3/2019 Refinery Per to Chemical 2004
http://slidepdf.com/reader/full/refinery-per-to-chemical-2004 35/90
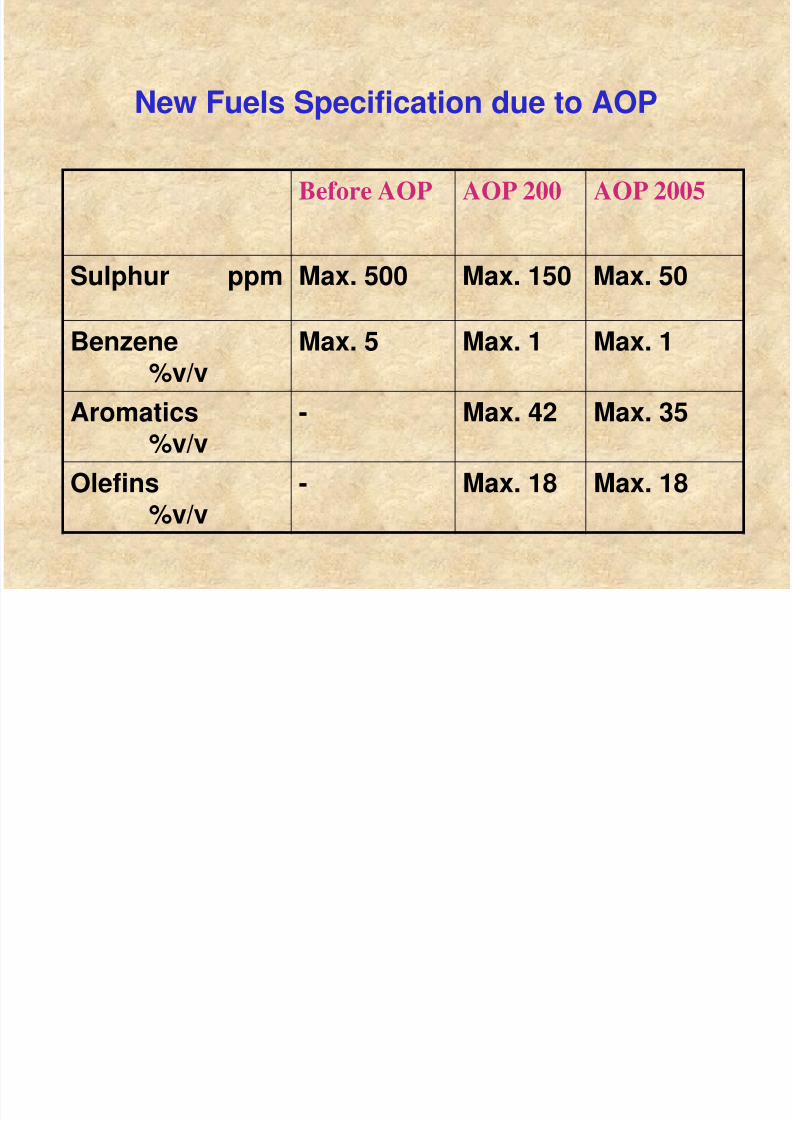
New Fuels Specification due to AOP
Before AOP AOP 200 AOP 2005
Sulphur ppm Max. 500 Max. 150 Max. 50
Benzene%v/v
Max. 5 Max. 1 Max. 1
Aromatics%v/v
- Max. 42 Max. 35
Olefins%v/v
- Max. 18 Max. 18
8/3/2019 Refinery Per to Chemical 2004
http://slidepdf.com/reader/full/refinery-per-to-chemical-2004 36/90
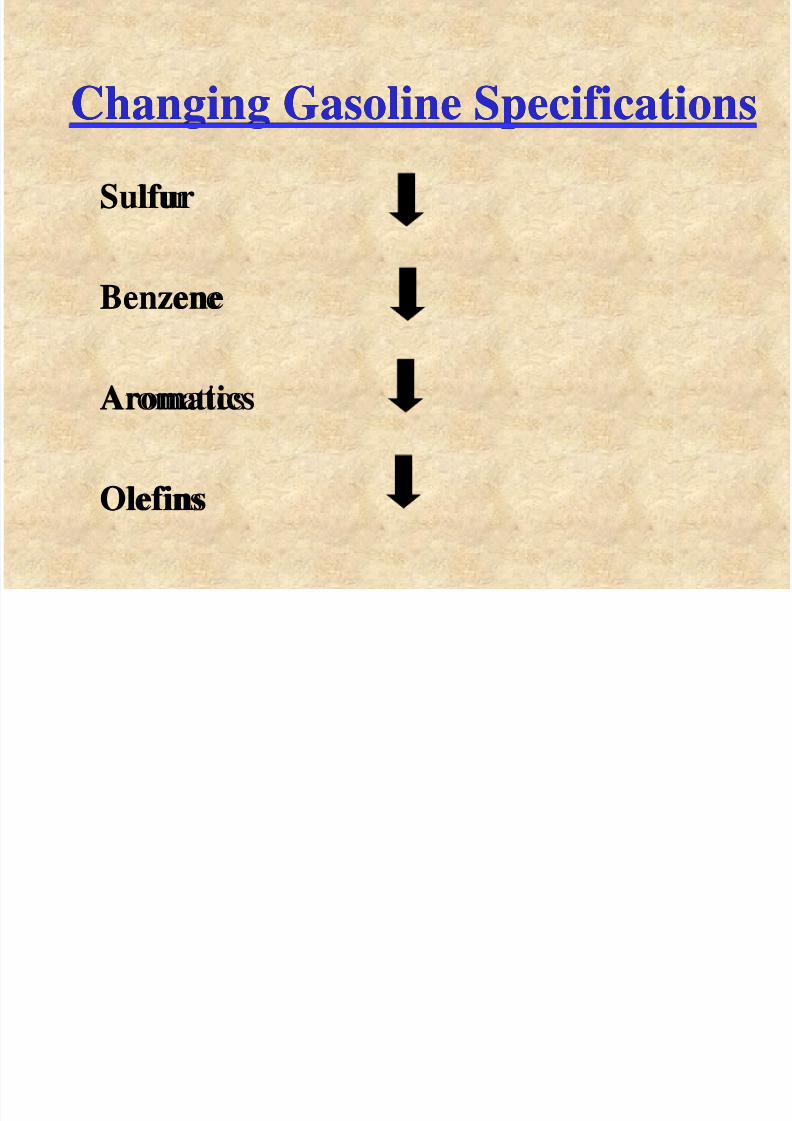
Changing Gasoline Specifications
Sulfur
Benzene
Aromatics
Olefins
Changing Gasoline Specifications
Sulfur
Benzene
Aromatics
Olefins
8/3/2019 Refinery Per to Chemical 2004
http://slidepdf.com/reader/full/refinery-per-to-chemical-2004 37/90
AOP will Affect…
• Recipe for gasoline blending
• Choice for feedstocks for steamcracking and aromatics unit.

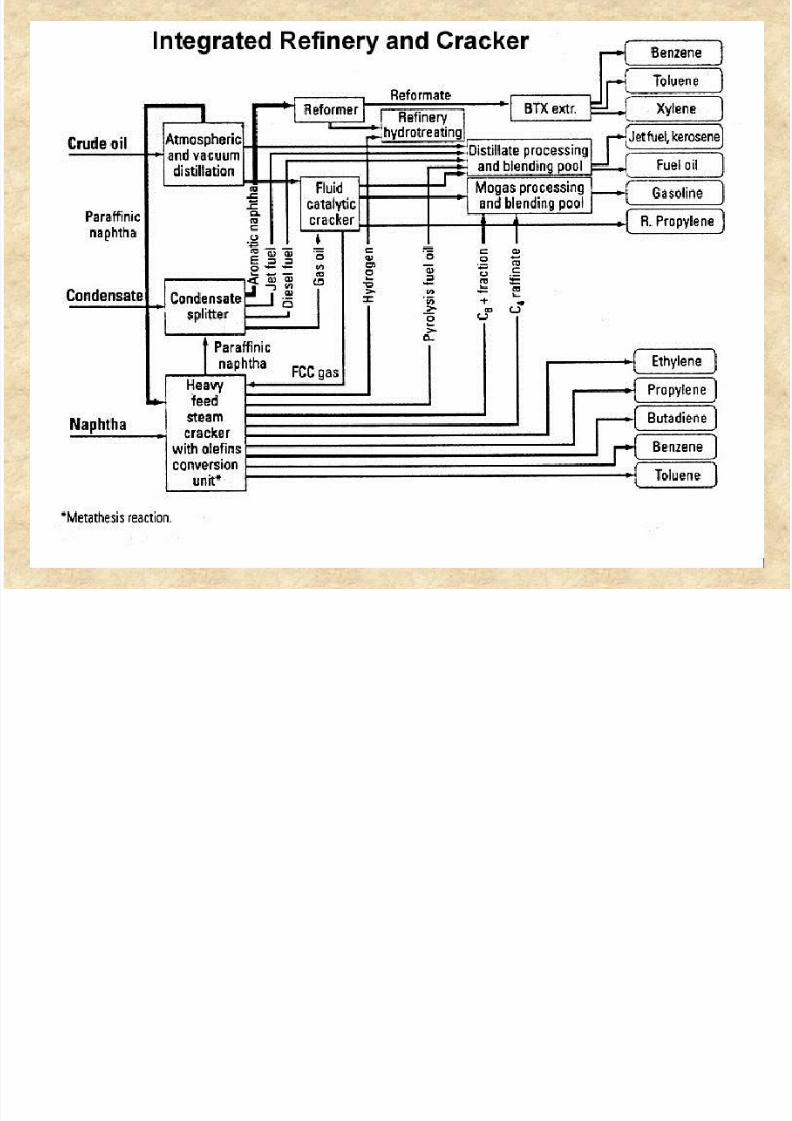
8/3/2019 Refinery Per to Chemical 2004
http://slidepdf.com/reader/full/refinery-per-to-chemical-2004 38/90
•
Both steam crackers and aromaticsunits produce by-products inaddition to C2H4, C3H6 or aromatics.
• Some of these by-products return tothe refinery as gasoline blend stockscalled “Chemical Returns ”.
8/3/2019 Refinery Per to Chemical 2004
http://slidepdf.com/reader/full/refinery-per-to-chemical-2004 39/90
• Chemical returns from steam crackerinclude : pyrolysis gasoline, followingbenzene extraction
Pygas split - Light & heavy
• Chemical returns from aromatic unit
consists of C9 or C8 (xylenes)aromatics.
8/3/2019 Refinery Per to Chemical 2004
http://slidepdf.com/reader/full/refinery-per-to-chemical-2004 40/90
The fuel regulations being enacted will
change the blending values andopportunities for chemical returns aswell as the availability of light naphtha
as cracker feed.
This affect will be increased by the
fact that gasoline demand is expectedto increase at low pace than demandfor C2H4 and C3H6.
8/3/2019 Refinery Per to Chemical 2004
http://slidepdf.com/reader/full/refinery-per-to-chemical-2004 41/90
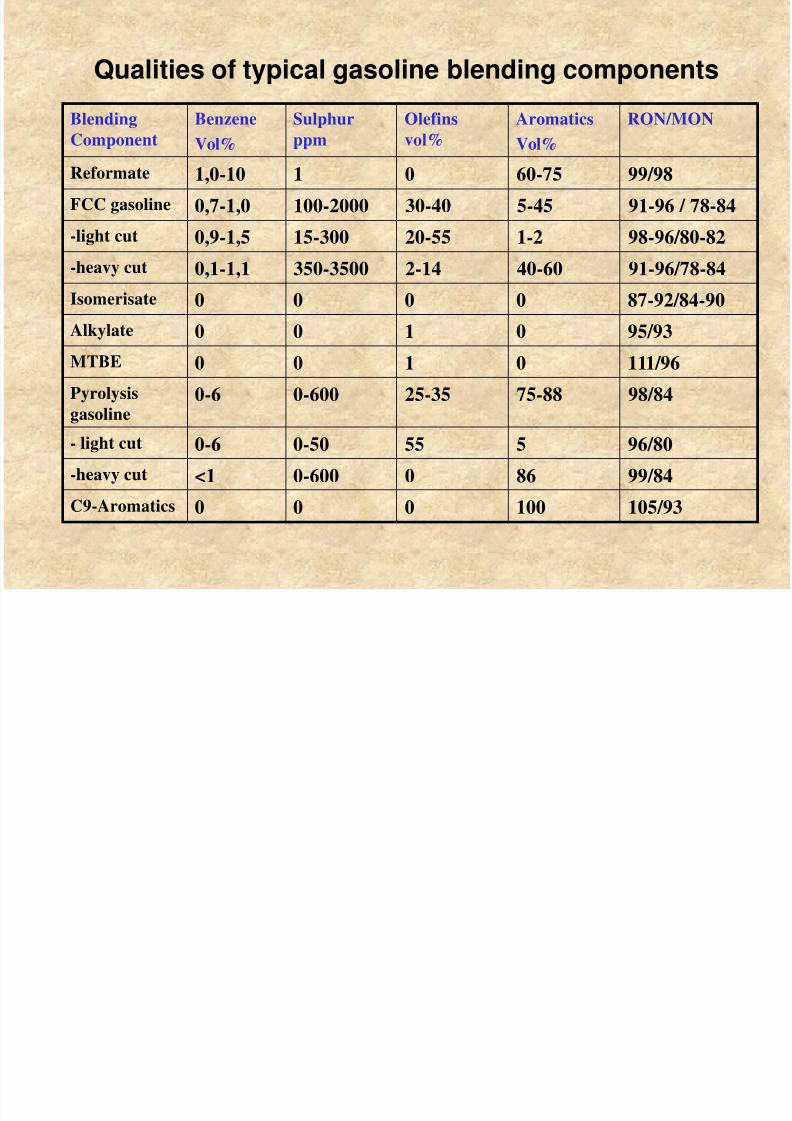
Qualities of typical gasoline blending components
Blending
Component
Benzene
Vol%
Sulphur
ppm
Olefins
vol%
Aromatics
Vol%
RON/MON
Reformate 1,0-10 1 0 60-75 99/98
FCC gasoline 0,7-1,0 100-2000 30-40 5-45 91-96 / 78-84
-light cut 0,9-1,5 15-300 20-55 1-2 98-96/80-82
-heavy cut 0,1-1,1 350-3500 2-14 40-60 91-96/78-84
Isomerisate 0 0 0 0 87-92/84-90
Alkylate 0 0 1 0 95/93
MTBE 0 0 1 0 111/96
Pyrolysis
gasoline
0-6 0-600 25-35 75-88 98/84
- light cut 0-6 0-50 55 5 96/80
-heavy cut <1 0-600 0 86 99/84
C9-Aromatics 0 0 0 100 105/93
8/3/2019 Refinery Per to Chemical 2004
http://slidepdf.com/reader/full/refinery-per-to-chemical-2004 42/90
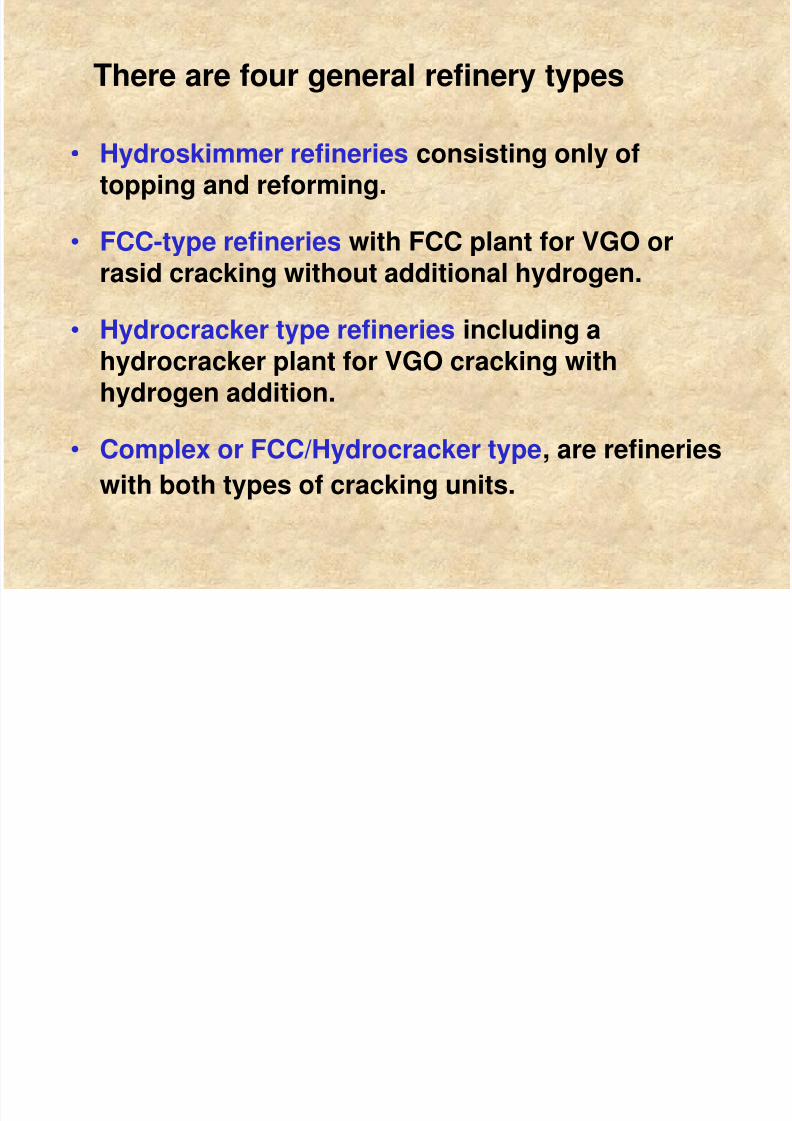
There are four general refinery types
• Hydroskimmer refineries consisting only oftopping and reforming.
• FCC-type refineries with FCC plant for VGO or
rasid cracking without additional hydrogen.
• Hydrocracker type refineries including ahydrocracker plant for VGO cracking withhydrogen addition.
• Complex or FCC/Hydrocracker type, are refineries
with both types of cracking units.
8/3/2019 Refinery Per to Chemical 2004
http://slidepdf.com/reader/full/refinery-per-to-chemical-2004 43/90
The reduction in aromatics content of
gasoline will have major impact onrefining-petrochemical synergies.
All other parameters also needs to beconsidered; these will limit theblending returns into gasoline pool
and restrict the availability of lightnaphtha as petrochemical feedstock.
8/3/2019 Refinery Per to Chemical 2004
http://slidepdf.com/reader/full/refinery-per-to-chemical-2004 44/90
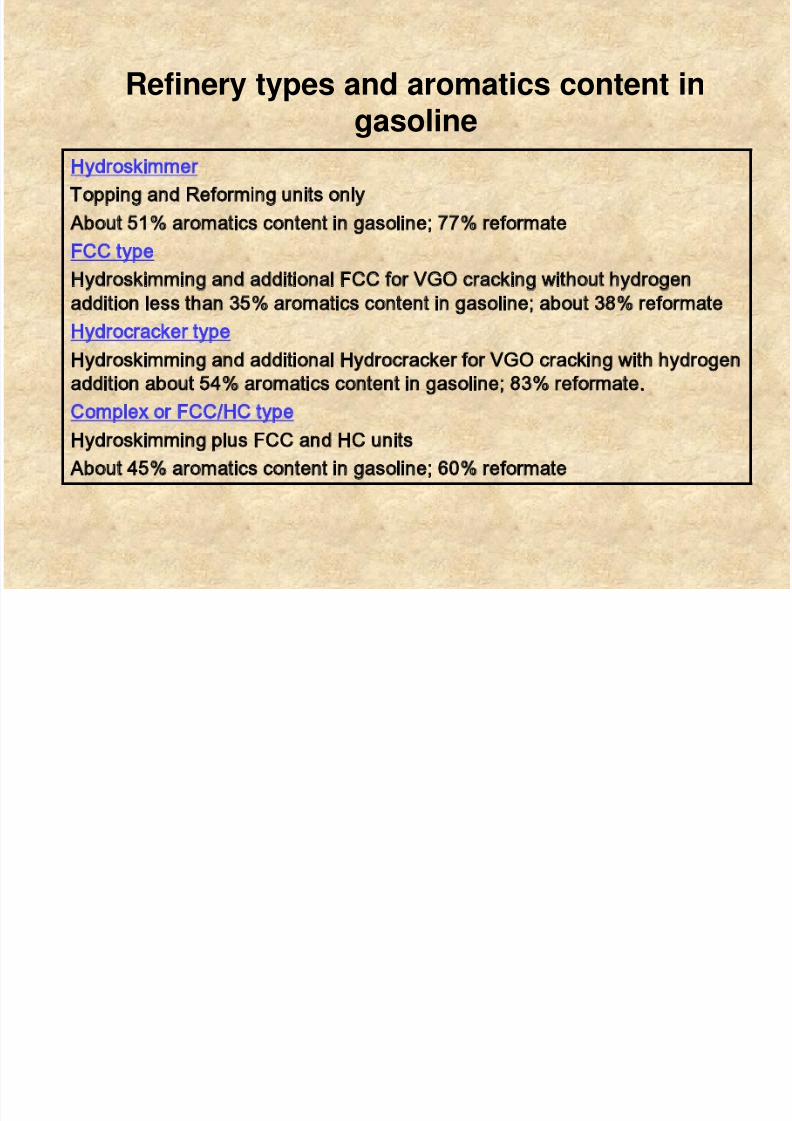
Refinery types and aromatics content ingasoline
Hydroskimmer
Topping and Reforming units only
About 51% aromatics content in gasoline; 77% reformate
FCC type
Hydroskimming and additional FCC for VGO cracking without hydrogenaddition less than 35% aromatics content in gasoline; about 38% reformate
Hydrocracker type
Hydroskimming and additional Hydrocracker for VGO cracking with hydrogen
addition about 54% aromatics content in gasoline; 83% reformate.
Complex or FCC/HC typeHydroskimming plus FCC and HC units
About 45% aromatics content in gasoline; 60% reformate
8/3/2019 Refinery Per to Chemical 2004
http://slidepdf.com/reader/full/refinery-per-to-chemical-2004 45/90
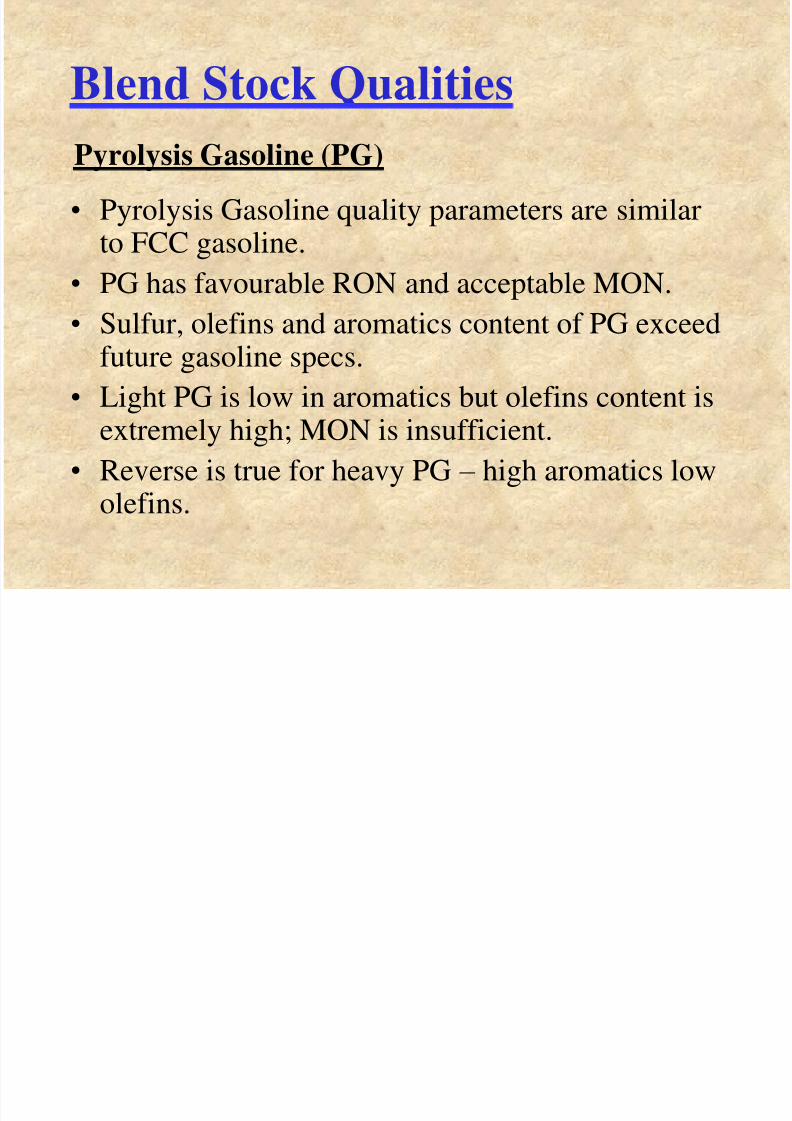
Blend Stock Qualities
• Pyrolysis Gasoline quality parameters are similarto FCC gasoline.
• PG has favourable RON and acceptable MON.• Sulfur, olefins and aromatics content of PG exceed
future gasoline specs.
• Light PG is low in aromatics but olefins content is
extremely high; MON is insufficient.
• Reverse is true for heavy PG – high aromatics lowolefins.
Pyrolysis Gasoline (PG)
8/3/2019 Refinery Per to Chemical 2004
http://slidepdf.com/reader/full/refinery-per-to-chemical-2004 46/90
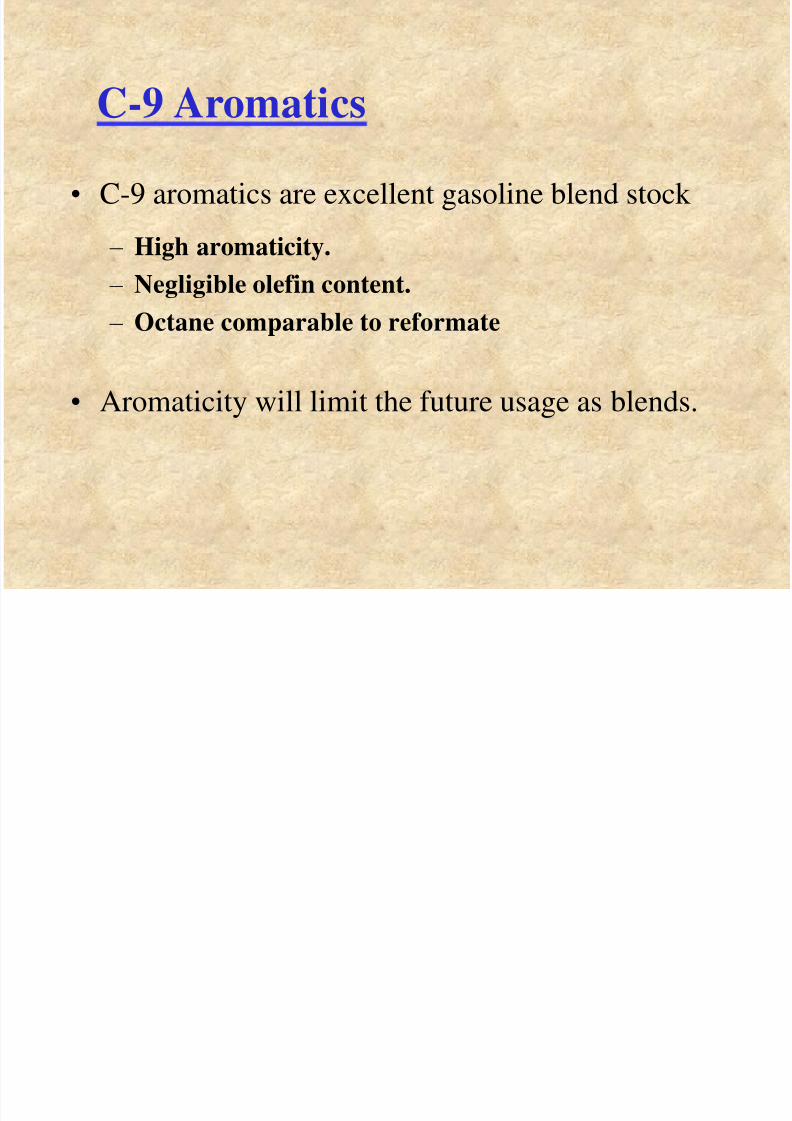
C-9 Aromatics
• C-9 aromatics are excellent gasoline blend stock
– High aromaticity.
– Negligible olefin content. – Octane comparable to reformate
• Aromaticity will limit the future usage as blends.
8/3/2019 Refinery Per to Chemical 2004
http://slidepdf.com/reader/full/refinery-per-to-chemical-2004 47/90
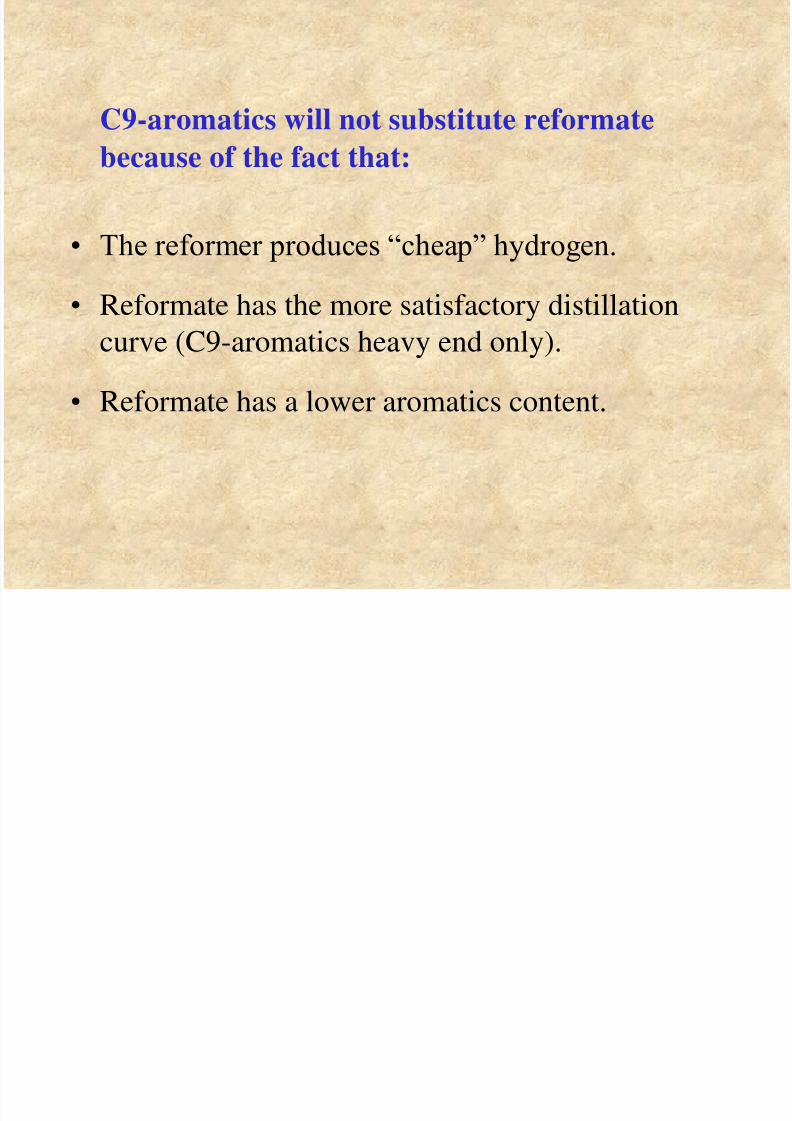
C9-aromatics will not substitute reformate
because of the fact that:
• The reformer produces “cheap” hydrogen.
• Reformate has the more satisfactory distillation
curve (C9-aromatics heavy end only).
• Reformate has a lower aromatics content.
8/3/2019 Refinery Per to Chemical 2004
http://slidepdf.com/reader/full/refinery-per-to-chemical-2004 48/90
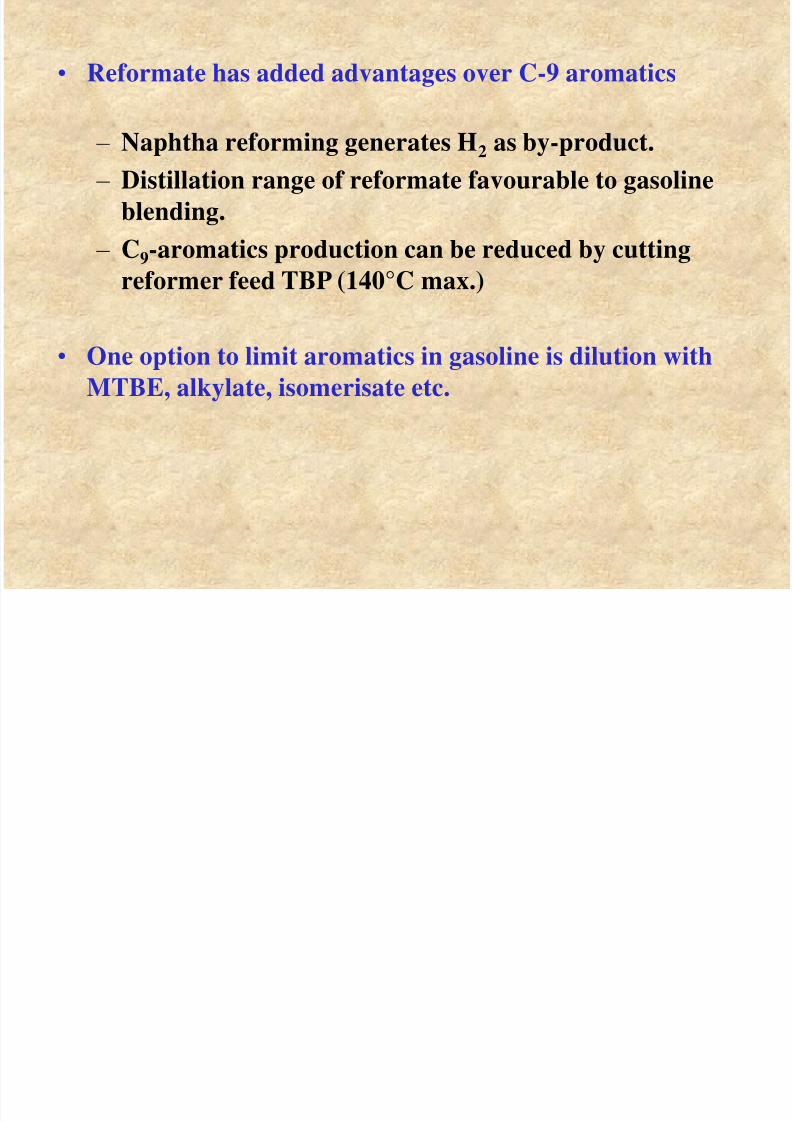
• Reformate has added advantages over C-9 aromatics
– Naphtha reforming generates H2 as by-product. – Distillation range of reformate favourable to gasoline
blending.
– C9-aromatics production can be reduced by cutting
reformer feed TBP (140°C max.)
• One option to limit aromatics in gasoline is dilution with
MTBE, alkylate, isomerisate etc.

8/3/2019 Refinery Per to Chemical 2004
http://slidepdf.com/reader/full/refinery-per-to-chemical-2004 49/90
Impact of Diesel Quality
If only further sulfur reduction is involved,
there is likely no impact on petro-chemicals.
8/3/2019 Refinery Per to Chemical 2004
http://slidepdf.com/reader/full/refinery-per-to-chemical-2004 50/90
More stringent gasoline specifications will
change refining and petrochemical synergies,
as they will have an impact on
refinery/petrochemical interfaces.
8/3/2019 Refinery Per to Chemical 2004
http://slidepdf.com/reader/full/refinery-per-to-chemical-2004 51/90
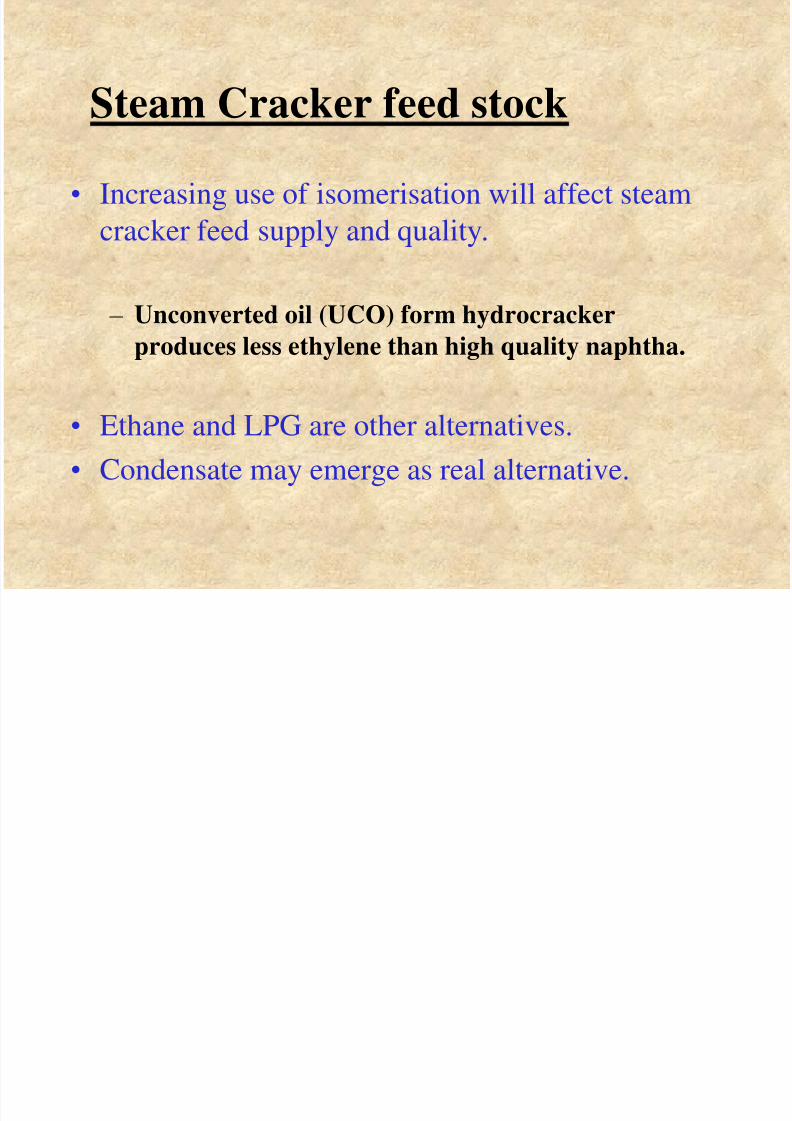
Steam Cracker feed stock
• Increasing use of isomerisation will affect steam
cracker feed supply and quality.
– Unconverted oil (UCO) form hydrocracker
produces less ethylene than high quality naphtha.
• Ethane and LPG are other alternatives.• Condensate may emerge as real alternative.
8/3/2019 Refinery Per to Chemical 2004
http://slidepdf.com/reader/full/refinery-per-to-chemical-2004 52/90
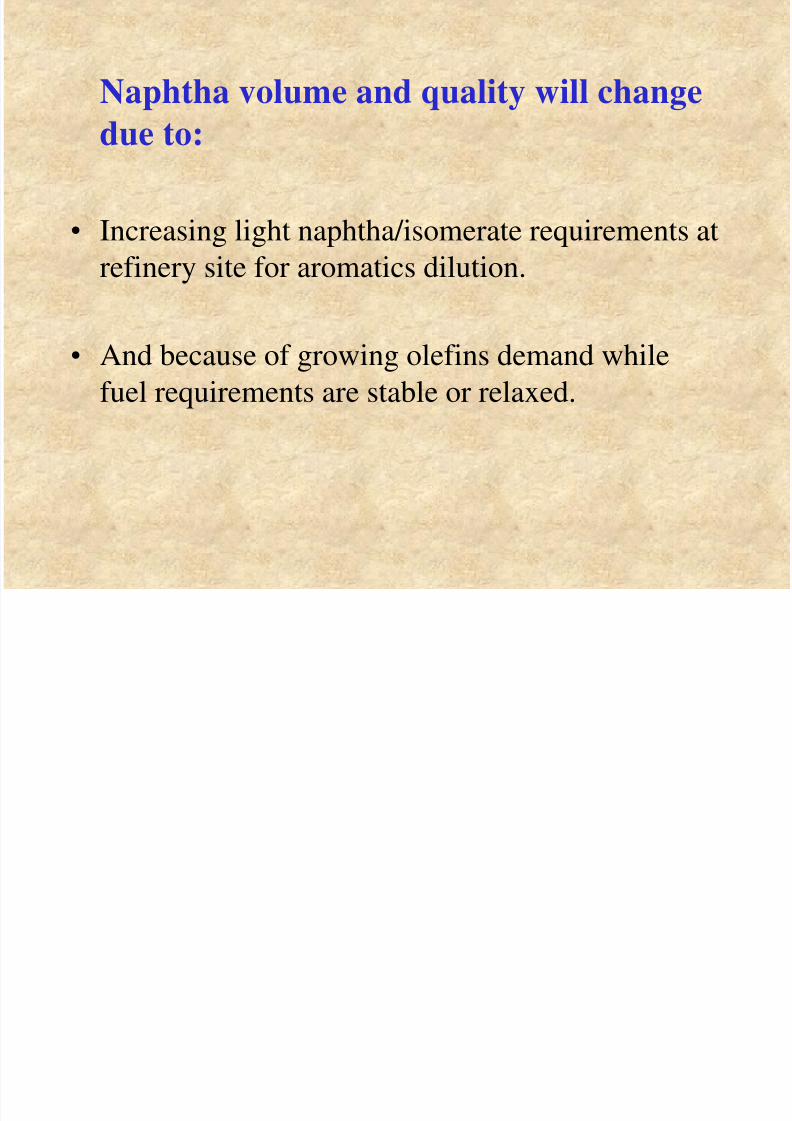
Naphtha volume and quality will change
due to:
• Increasing light naphtha/isomerate requirements at
refinery site for aromatics dilution.
• And because of growing olefins demand while
fuel requirements are stable or relaxed.
8/3/2019 Refinery Per to Chemical 2004
http://slidepdf.com/reader/full/refinery-per-to-chemical-2004 53/90
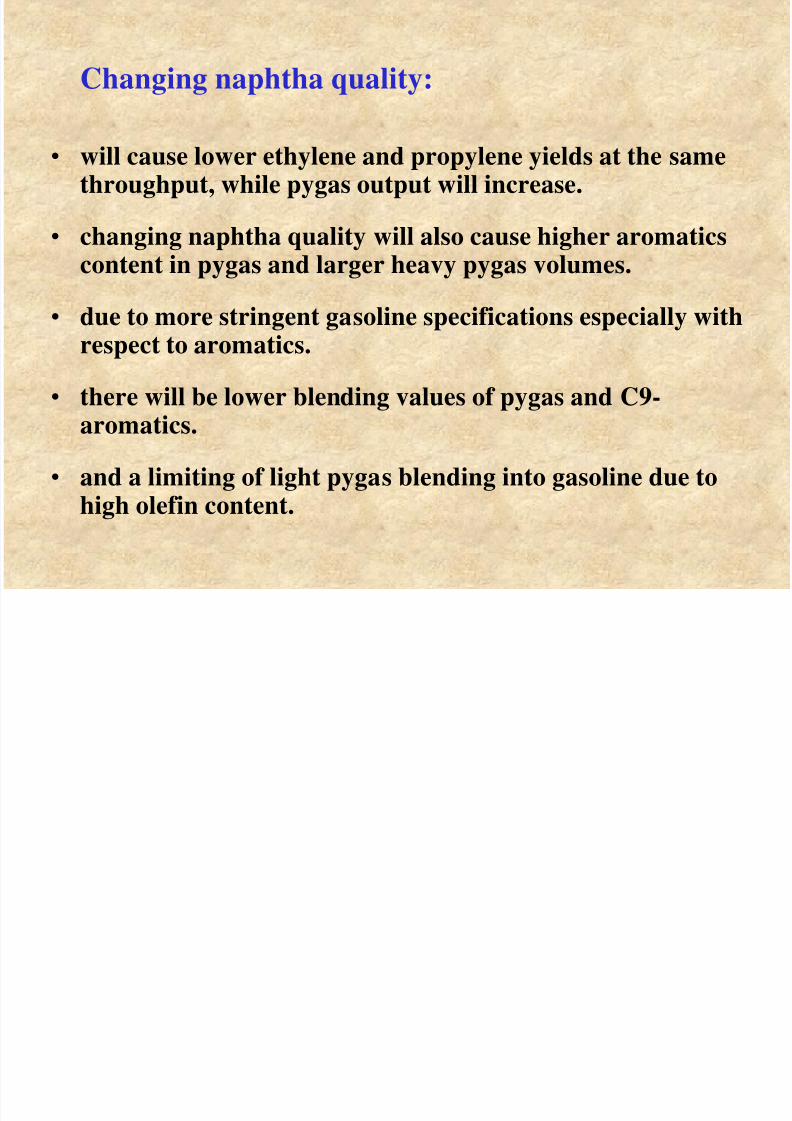
Changing naphtha quality:
• will cause lower ethylene and propylene yields at the samethroughput, while pygas output will increase.
• changing naphtha quality will also cause higher aromaticscontent in pygas and larger heavy pygas volumes.
• due to more stringent gasoline specifications especially withrespect to aromatics.
• there will be lower blending values of pygas and C9-
aromatics.
• and a limiting of light pygas blending into gasoline due tohigh olefin content.
8/3/2019 Refinery Per to Chemical 2004
http://slidepdf.com/reader/full/refinery-per-to-chemical-2004 54/90
Synergies between FCC and olefin
production
Catalytic Cracking can be a supplementary
source for olefins.
8/3/2019 Refinery Per to Chemical 2004
http://slidepdf.com/reader/full/refinery-per-to-chemical-2004 55/90
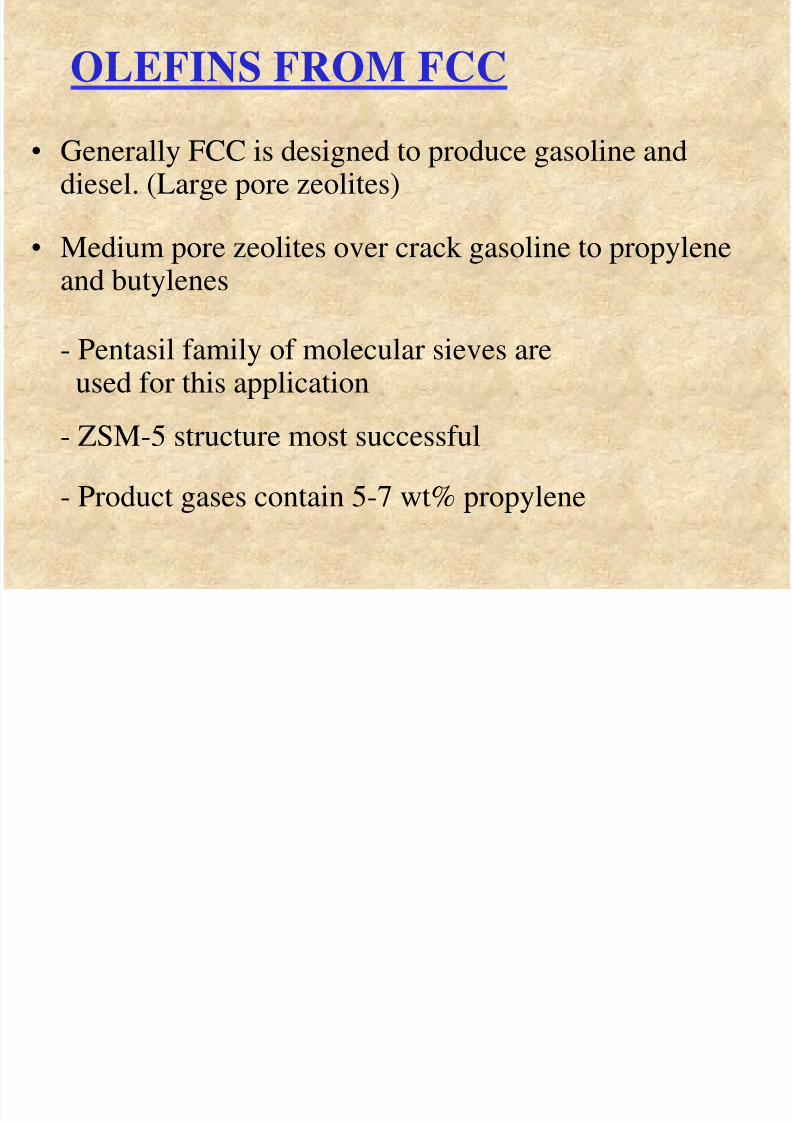
• Generally FCC is designed to produce gasoline anddiesel. (Large pore zeolites)
• Medium pore zeolites over crack gasoline to propylene
and butylenes
- Pentasil family of molecular sieves areused for this application
- ZSM-5 structure most successful
- Product gases contain 5-7 wt% propylene
OLEFINS FROM FCC
8/3/2019 Refinery Per to Chemical 2004
http://slidepdf.com/reader/full/refinery-per-to-chemical-2004 56/90
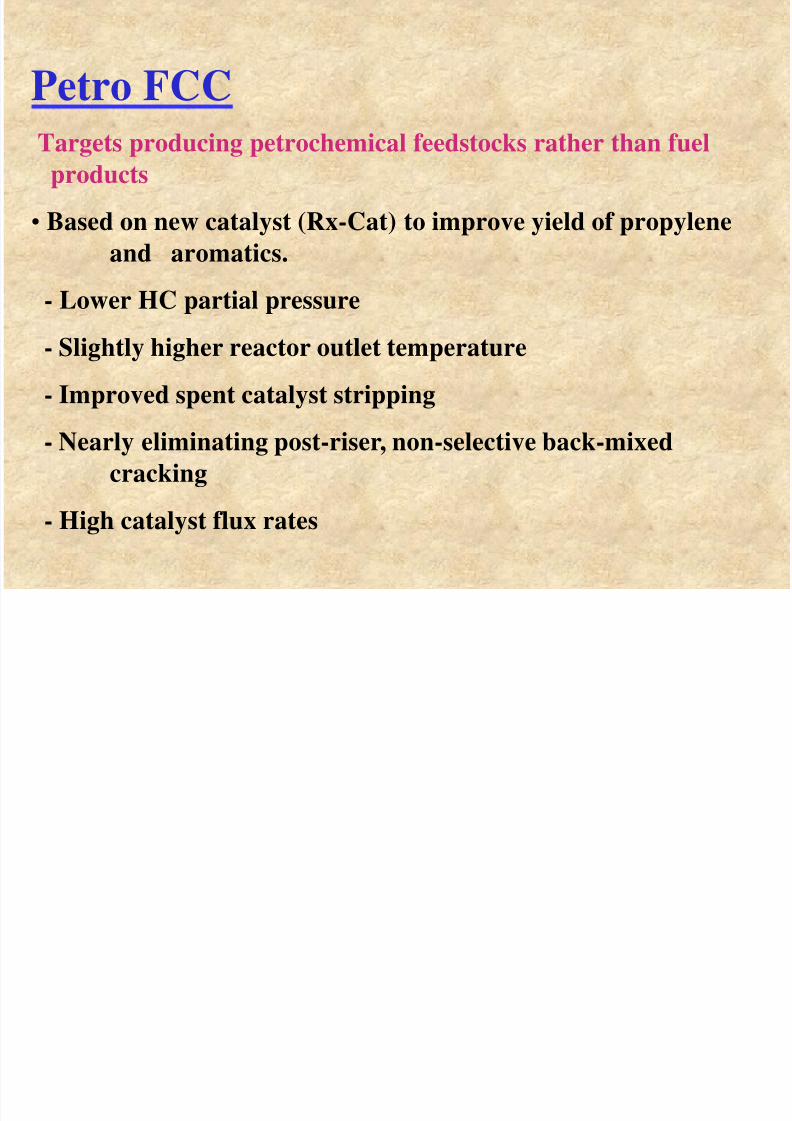
Petro FCC
Targets producing petrochemical feedstocks rather than fuelproducts
• Based on new catalyst (Rx-Cat) to improve yield of propylene
and aromatics.
- Lower HC partial pressure
- Slightly higher reactor outlet temperature
- Improved spent catalyst stripping
- Nearly eliminating post-riser, non-selective back-mixed
cracking
- High catalyst flux rates
Yi ld P
8/3/2019 Refinery Per to Chemical 2004
http://slidepdf.com/reader/full/refinery-per-to-chemical-2004 57/90
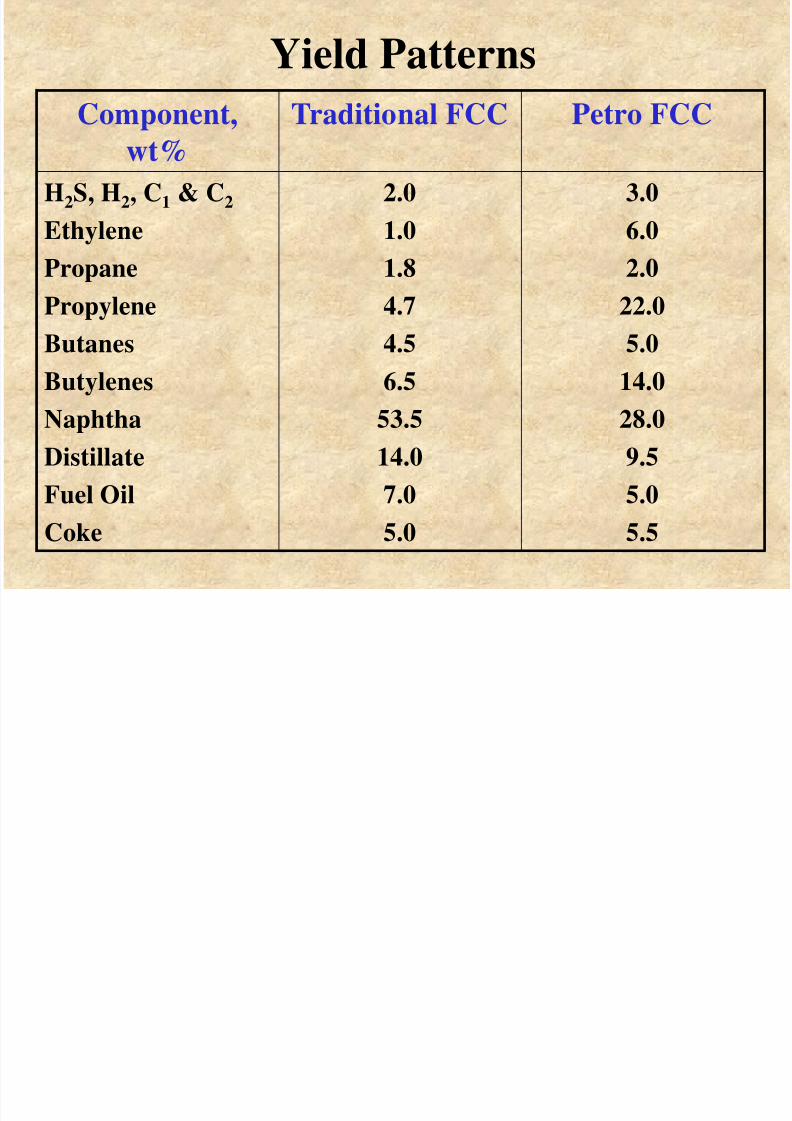
Yield Patterns
Component,
wt%
Traditional FCC Petro FCC
H2S, H2, C1 & C2
Ethylene
Propane
Propylene
Butanes
Butylenes
NaphthaDistillate
Fuel Oil
Coke
2.0
1.0
1.8
4.7
4.5
6.5
53.514.0
7.0
5.0
3.0
6.0
2.0
22.0
5.0
14.0
28.09.5
5.0
5.5
DEEP CATALYTIC CRACKING (DCC)
8/3/2019 Refinery Per to Chemical 2004
http://slidepdf.com/reader/full/refinery-per-to-chemical-2004 58/90
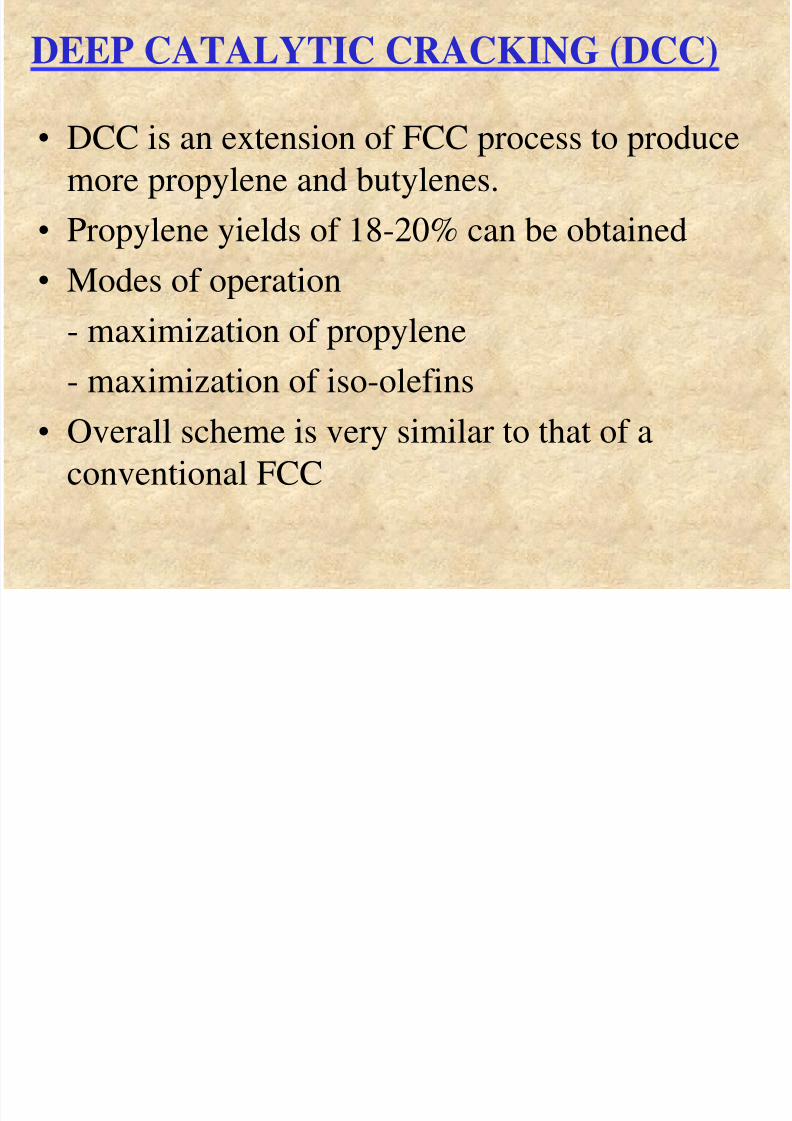
DEEP CATALYTIC CRACKING (DCC)
• DCC is an extension of FCC process to producemore propylene and butylenes.
• Propylene yields of 18-20% can be obtained
• Modes of operation- maximization of propylene
- maximization of iso-olefins
• Overall scheme is very similar to that of aconventional FCC
8/3/2019 Refinery Per to Chemical 2004
http://slidepdf.com/reader/full/refinery-per-to-chemical-2004 59/90
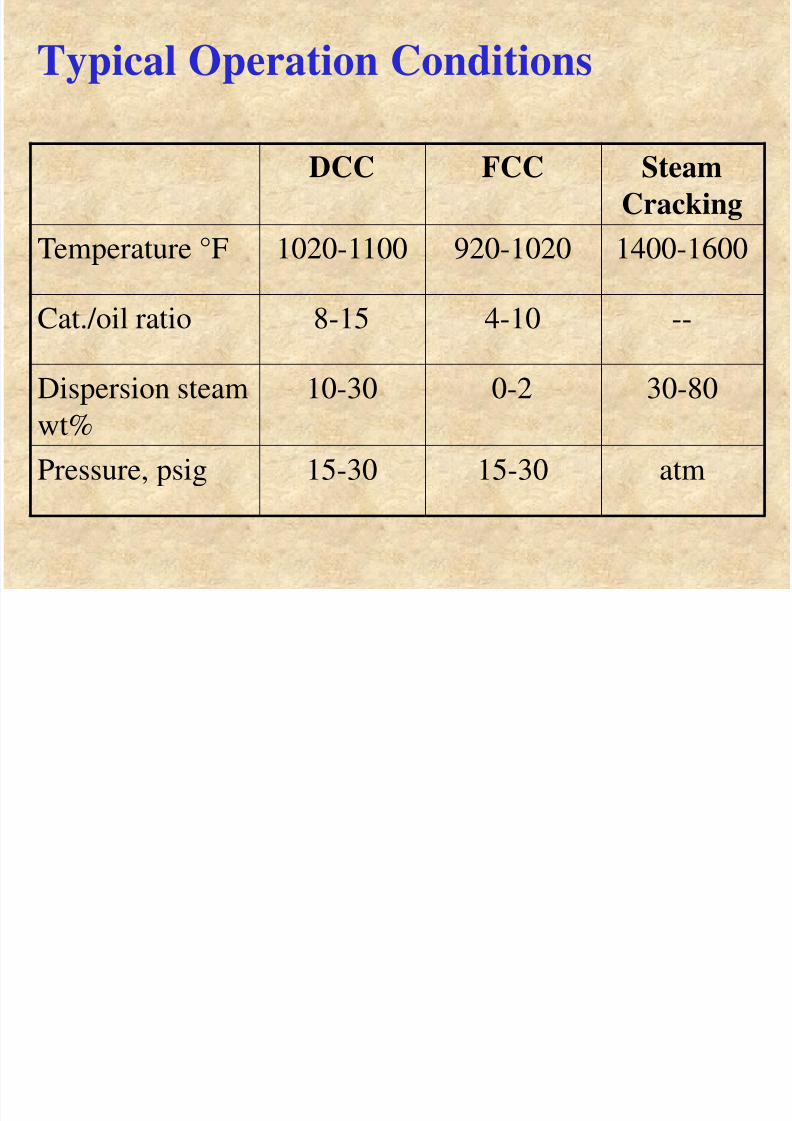
Typical Operation Conditions
DCC FCC Steam
Cracking
Temperature °F 1020-1100 920-1020 1400-1600
Cat./oil ratio 8-15 4-10 --
Dispersion steam
wt%
10-30 0-2 30-80
Pressure, psig 15-30 15-30 atm
8/3/2019 Refinery Per to Chemical 2004
http://slidepdf.com/reader/full/refinery-per-to-chemical-2004 60/90
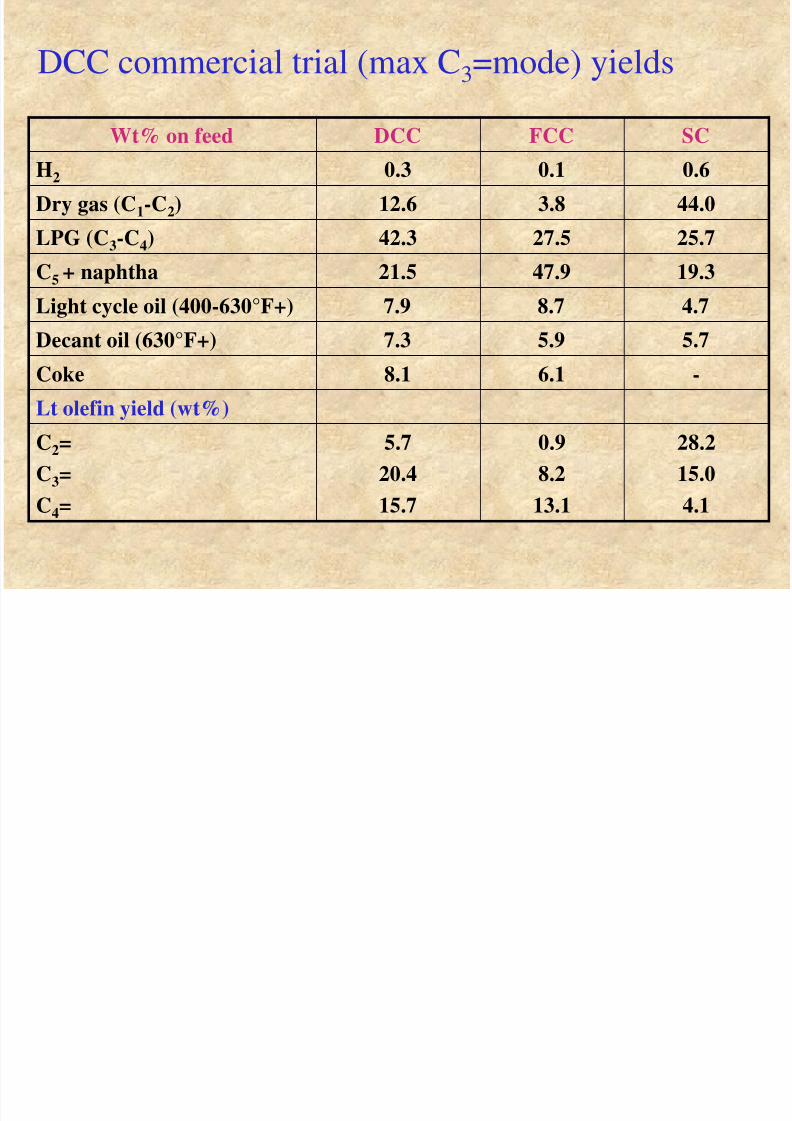
DCC commercial trial (max C3=mode) yields
Wt% on feed DCC FCC SC
H2 0.3 0.1 0.6
Dry gas (C1-C2) 12.6 3.8 44.0
LPG (C3-C4) 42.3 27.5 25.7
C5
+ naphtha 21.5 47.9 19.3
Light cycle oil (400-630°F+) 7.9 8.7 4.7
Decant oil (630°F+) 7.3 5.9 5.7
Coke 8.1 6.1 -
Lt olefin yield (wt%)
C2=
C3=
C4=
5.7
20.4
15.7
0.9
8.2
13.1
28.2
15.0
4.1
TABLECOMPARISON OF DCC FCC SC N h h PONA
8/3/2019 Refinery Per to Chemical 2004
http://slidepdf.com/reader/full/refinery-per-to-chemical-2004 61/90
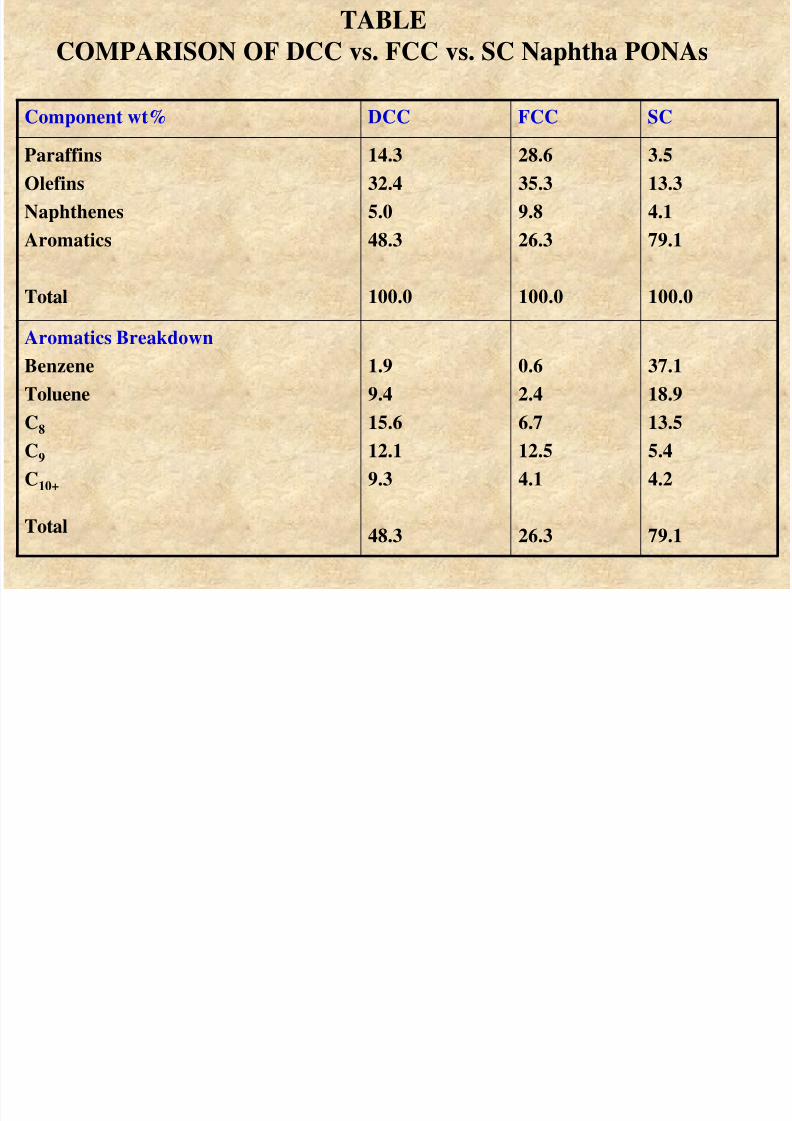
COMPARISON OF DCC vs. FCC vs. SC Naphtha PONAs
Component wt% DCC FCC SC
Paraffins
Olefins
Naphthenes
Aromatics
Total
14.3
32.4
5.0
48.3
100.0
28.6
35.3
9.8
26.3
100.0
3.5
13.3
4.1
79.1
100.0
Aromatics Breakdown
Benzene
Toluene
C8
C9
C10+
Total
1.9
9.4
15.612.1
9.3
48.3
0.6
2.4
6.712.5
4.1
26.3
37.1
18.9
13.55.4
4.2
79.1
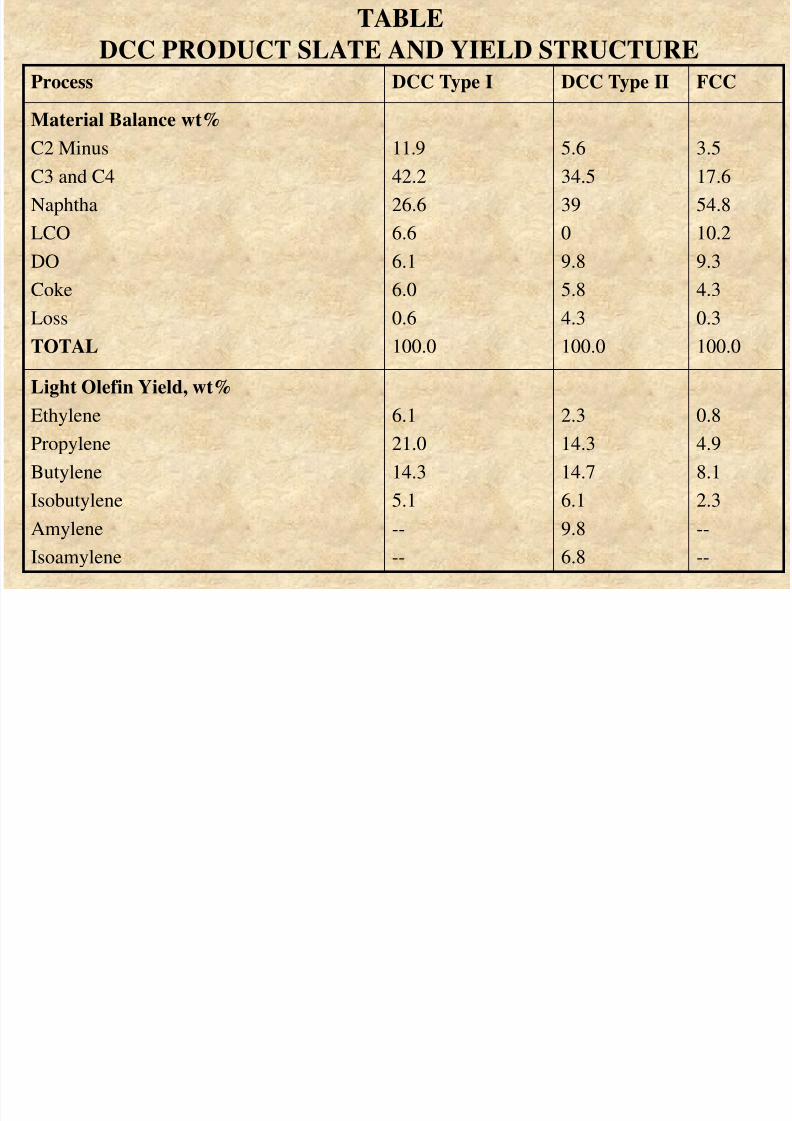
TABLEDCC PRODUCT SLATE AND YIELD STRUCTURE
8/3/2019 Refinery Per to Chemical 2004
http://slidepdf.com/reader/full/refinery-per-to-chemical-2004 62/90
DCC PRODUCT SLATE AND YIELD STRUCTUREProcess DCC Type I DCC Type II FCC
Material Balance wt%
C2 MinusC3 and C4
Naphtha
LCO
DO
Coke
Loss
TOTAL
11.942.2
26.6
6.6
6.1
6.0
0.6
100.0
5.634.5
39
0
9.8
5.8
4.3
100.0
3.517.6
54.8
10.2
9.3
4.3
0.3
100.0
Light Olefin Yield, wt%
EthylenePropylene
Butylene
Isobutylene
Amylene
Isoamylene
6.121.0
14.3
5.1
--
--
2.314.3
14.7
6.1
9.8
6.8
0.84.9
8.1
2.3
--
--
8/3/2019 Refinery Per to Chemical 2004
http://slidepdf.com/reader/full/refinery-per-to-chemical-2004 63/90
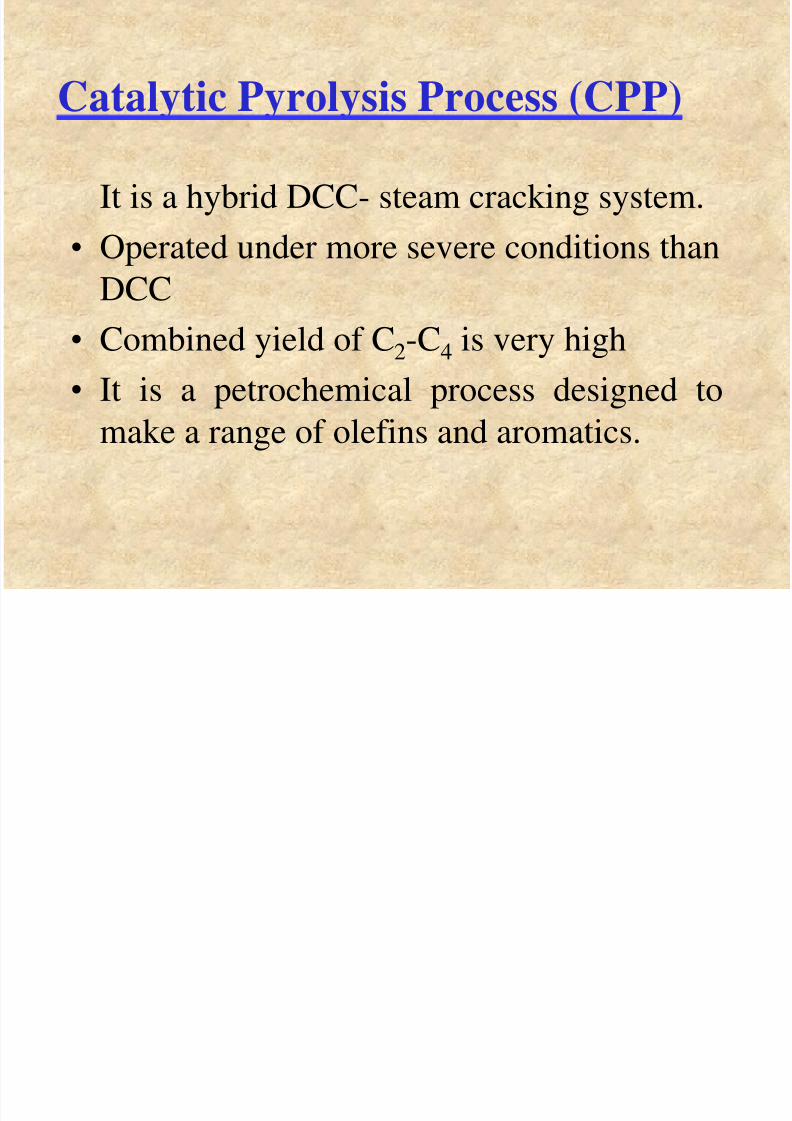
Catalytic Pyrolysis Process (CPP)
It is a hybrid DCC- steam cracking system.
• Operated under more severe conditions than
DCC• Combined yield of C2-C4 is very high
• It is a petrochemical process designed to
make a range of olefins and aromatics.
CATALYTIC PYROLYSIS PROCESS TYPICAL
8/3/2019 Refinery Per to Chemical 2004
http://slidepdf.com/reader/full/refinery-per-to-chemical-2004 64/90
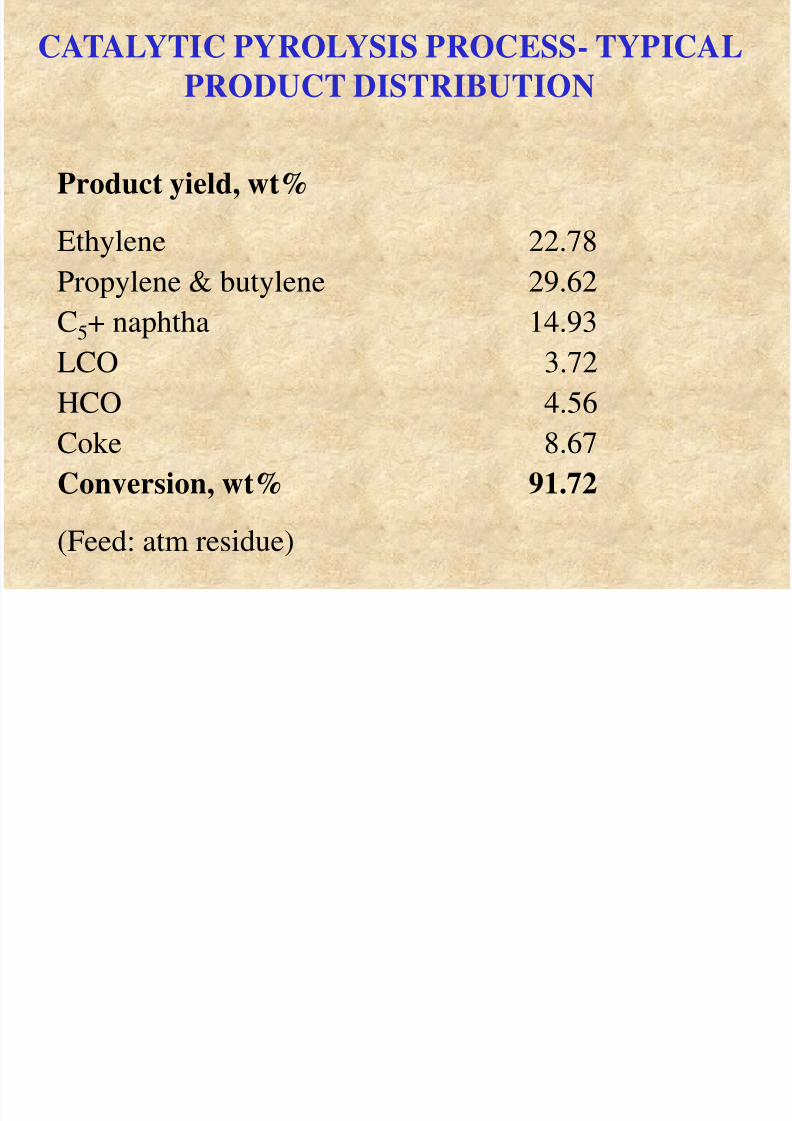
CATALYTIC PYROLYSIS PROCESS- TYPICAL
PRODUCT DISTRIBUTION
Product yield, wt%
Ethylene 22.78
Propylene & butylene 29.62C5+ naphtha 14.93
LCO 3.72
HCO 4.56
Coke 8.67
Conversion, wt% 91.72
(Feed: atm residue)
8/3/2019 Refinery Per to Chemical 2004
http://slidepdf.com/reader/full/refinery-per-to-chemical-2004 65/90
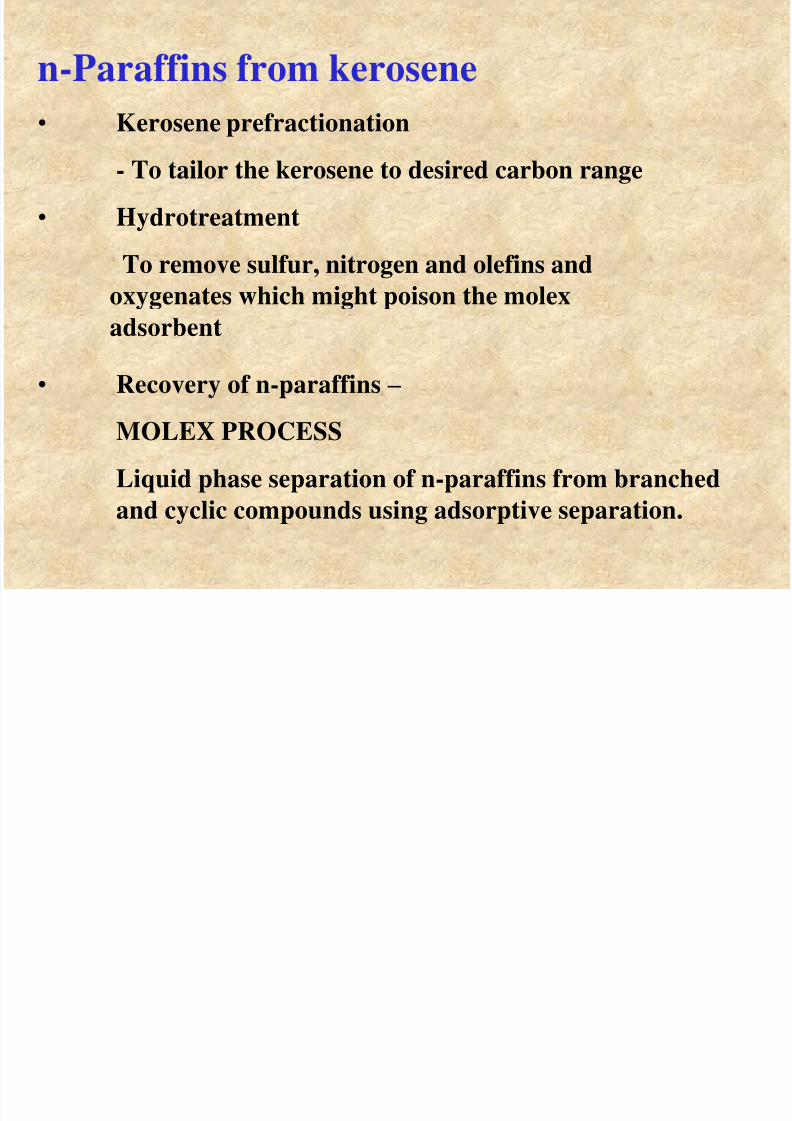
n-Paraffins from kerosene
• Kerosene prefractionation
- To tailor the kerosene to desired carbon range
• Hydrotreatment
To remove sulfur, nitrogen and olefins and
oxygenates which might poison the molexadsorbent
• Recovery of n-paraffins –
MOLEX PROCESS
Liquid phase separation of n-paraffins from branched
and cyclic compounds using adsorptive separation.

8/3/2019 Refinery Per to Chemical 2004
http://slidepdf.com/reader/full/refinery-per-to-chemical-2004 66/90
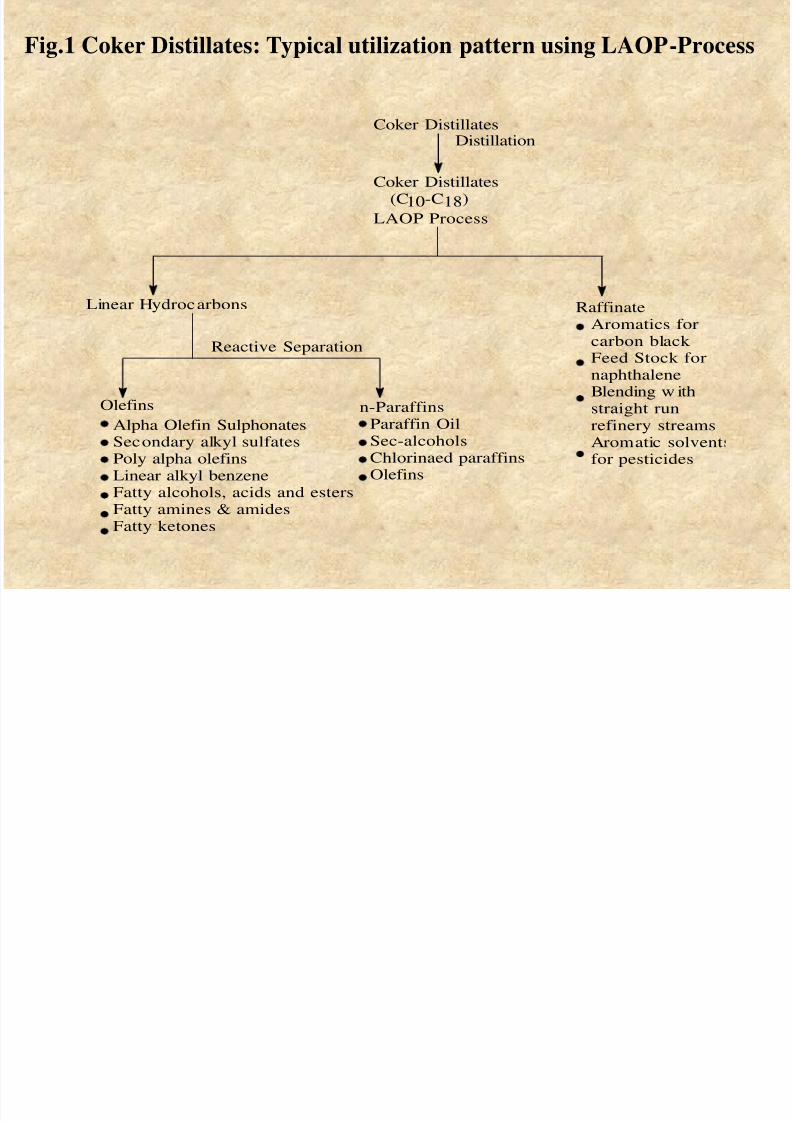
PETRO-CHEMICALS FROM COKER
DISTILLATES
Available from coking operations in refinery
• Excellent starting for host of chemicals,especially detergents
Fig 1 Coker Distillates: Typical utilization pattern using LAOP-Process
8/3/2019 Refinery Per to Chemical 2004
http://slidepdf.com/reader/full/refinery-per-to-chemical-2004 67/90
Linear Hydrocarbons
Coker DistillatesDistillation
Coker Distillates(C10-C18)
LAOP Process
Reactive Separation
RaffinateAromatics forcarbon black Feed Stock fornaphthaleneBlending w ithstraight run
refinery streamsAromatic solventfor pesticides
n-Paraffins
Alpha Olefin SulphonatesSecondary alkyl sulfatesPoly alpha olefinsLinear alkyl benzeneFatty alcohols, acids and estersFatty amines & amidesFatty ketones
Olefins
Paraffin OilSec-alcoholsChlorinaed paraffinsOlefins
Fig.1 Coker Distillates: Typical utilization pattern using LAOP-Process
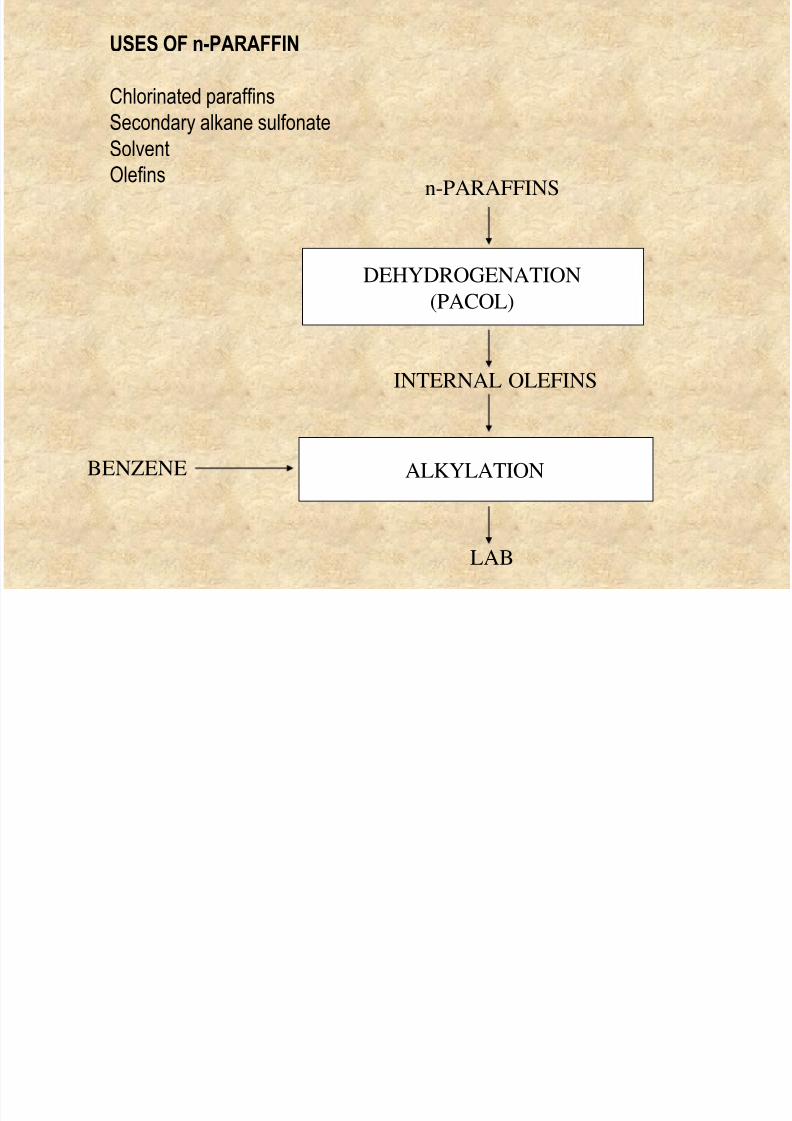
USES OF n-PARAFFIN
8/3/2019 Refinery Per to Chemical 2004
http://slidepdf.com/reader/full/refinery-per-to-chemical-2004 68/90
USES OF n PARAFFIN
Chlorinated paraffins
Secondary alkane sulfonate
SolventOlefins
n-PARAFFINS
DEHYDROGENATION
(PACOL)
INTERNAL OLEFINS
ALKYLATIONBENZENE
LAB
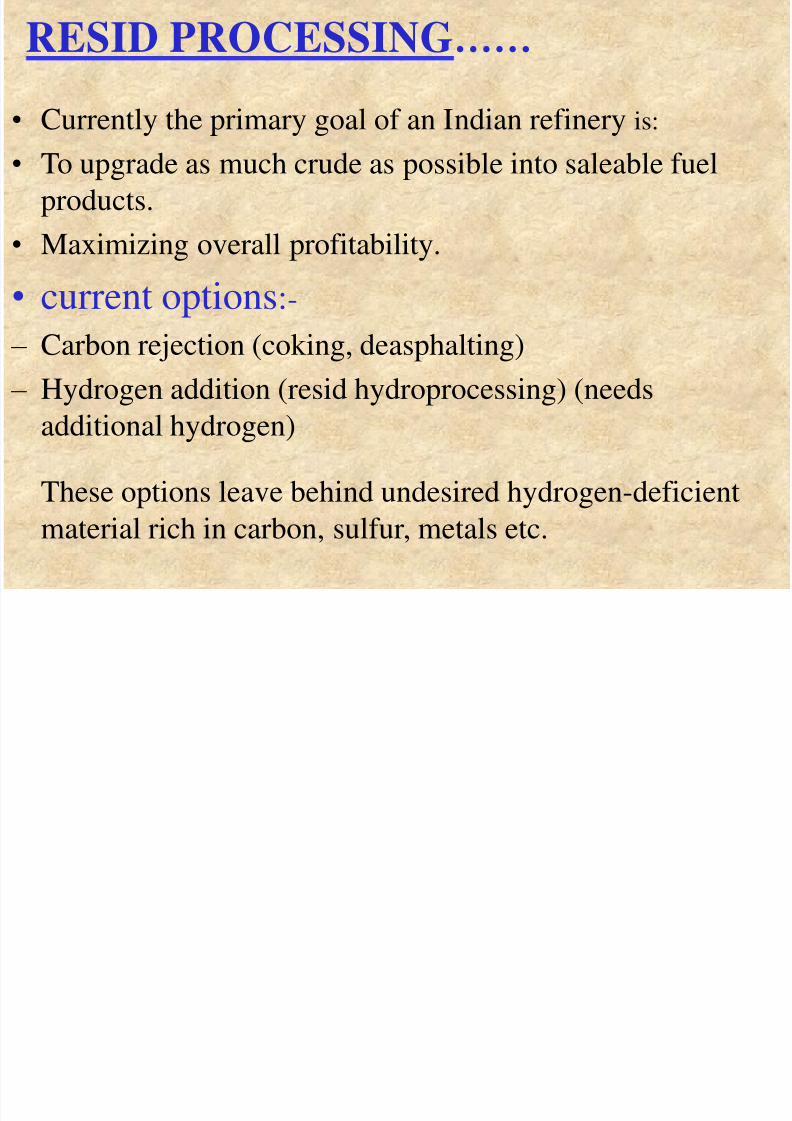
RESID PROCESSING……
8/3/2019 Refinery Per to Chemical 2004
http://slidepdf.com/reader/full/refinery-per-to-chemical-2004 69/90
RESID PROCESSING……
• Currently the primary goal of an Indian refinery is:
• To upgrade as much crude as possible into saleable fuel
products.
• Maximizing overall profitability.
• current options:-
– Carbon rejection (coking, deasphalting)
– Hydrogen addition (resid hydroprocessing) (needs
additional hydrogen)
These options leave behind undesired hydrogen-deficient
material rich in carbon, sulfur, metals etc.
8/3/2019 Refinery Per to Chemical 2004
http://slidepdf.com/reader/full/refinery-per-to-chemical-2004 70/90
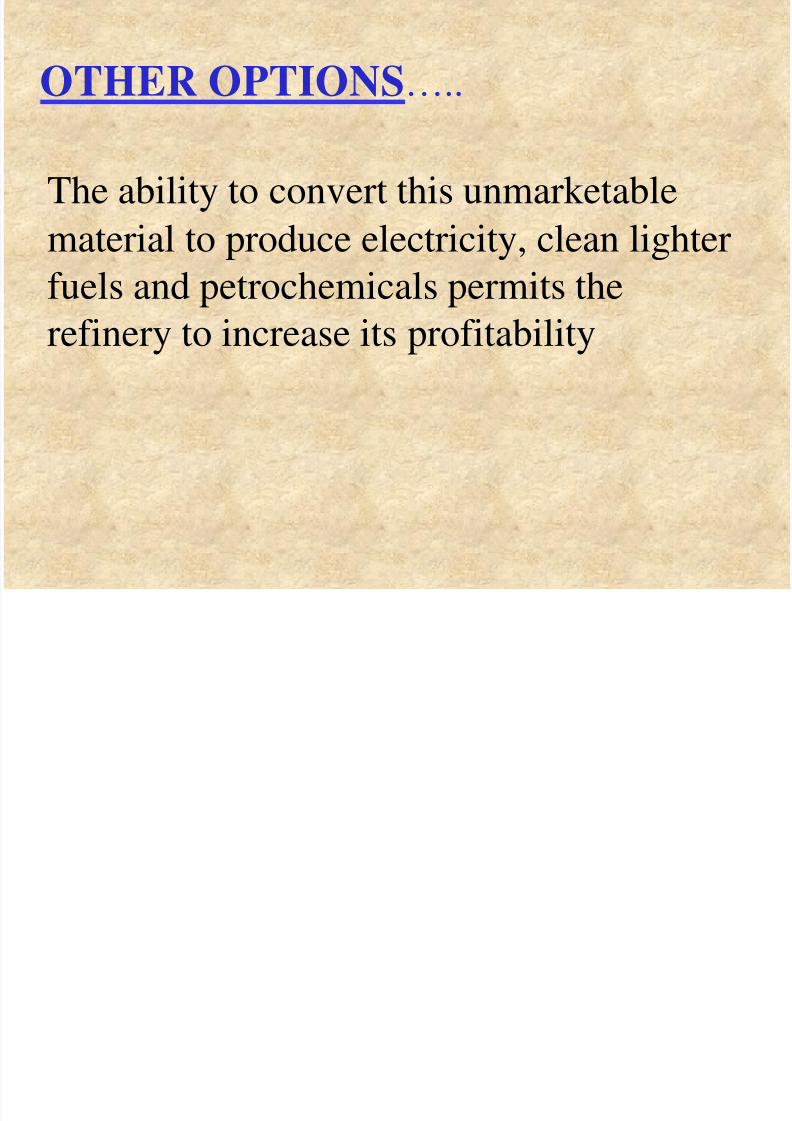
OTHER OPTIONS…..
The ability to convert this unmarketable
material to produce electricity, clean lighter
fuels and petrochemicals permits therefinery to increase its profitability
8/3/2019 Refinery Per to Chemical 2004
http://slidepdf.com/reader/full/refinery-per-to-chemical-2004 71/90
The refiner can choose among three electric-
power-generation methods:
• Circulating-fluidized beds (CFB)
• Boilers with flue gas desulfurization (FGD)
• Integrated gasification combined cycle (IGCC)
8/3/2019 Refinery Per to Chemical 2004
http://slidepdf.com/reader/full/refinery-per-to-chemical-2004 72/90
Primary factors affecting the selection for
power generation need balancing
- Environmental issues
- Efficiency- Economics while preserving strategic options
for future investments.
RESIDUE CONVERSION
8/3/2019 Refinery Per to Chemical 2004
http://slidepdf.com/reader/full/refinery-per-to-chemical-2004 73/90
RESIDUE CONVERSION
GASIFICATION
• Gasification
Power, hydrogen
Syn gas petro-chemicals
• Offers an alternative to handle high sulfur and metal
containing residues in a refinery with value addition
• Alternative economically attractive option for many of
the problems associated with changing scenario in thepetroleum refining industry
• Great advantage in co-generation and petro-chemicals
via syn gas
GASIFICATION
8/3/2019 Refinery Per to Chemical 2004
http://slidepdf.com/reader/full/refinery-per-to-chemical-2004 74/90
• FLEXIBLE PROCESS
CAN HANDLE WIDER FEED STOCKS INCLUDING
RESIDUES AND COKE
• MEETS ENVIRONMENTAL
REGULATIONS
• WIDE RANGE OF PRODUCTS
- ELECTRICITY
- HYDROGEN
- CHEMICALS
8/3/2019 Refinery Per to Chemical 2004
http://slidepdf.com/reader/full/refinery-per-to-chemical-2004 75/90
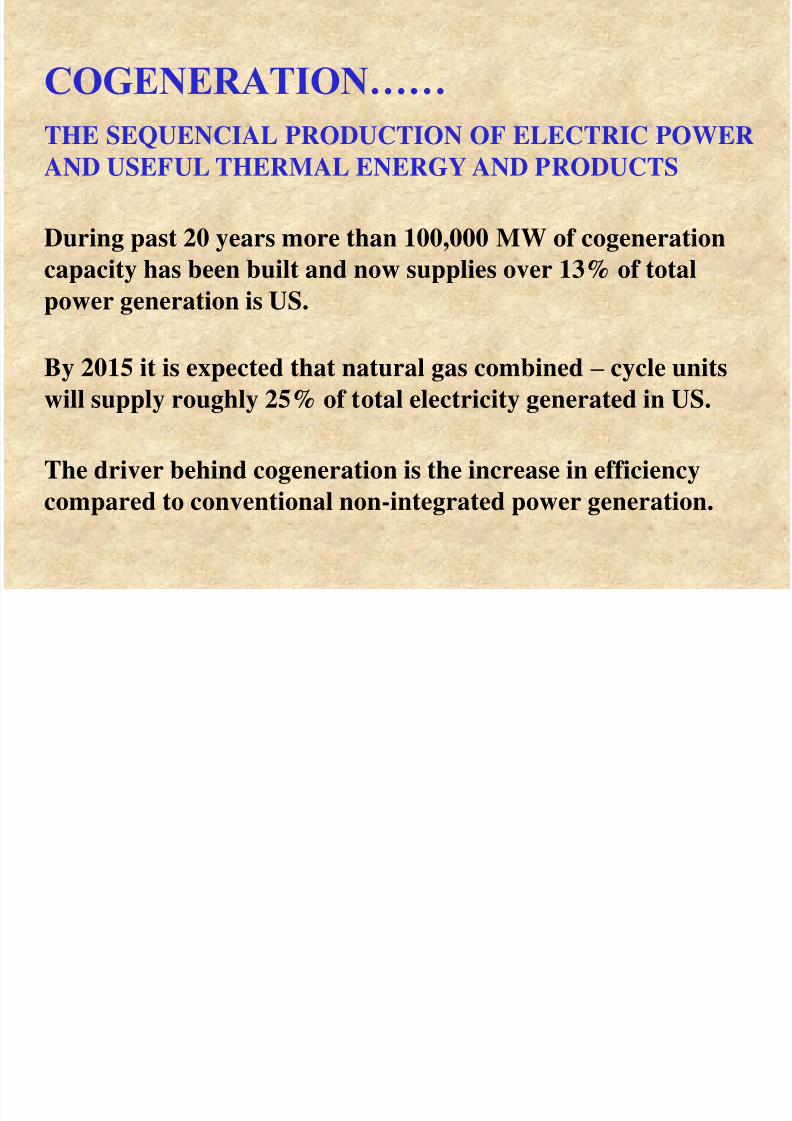
COGENERATION……
THE SEQUENCIAL PRODUCTION OF ELECTRIC POWER
AND USEFUL THERMAL ENERGY AND PRODUCTS
During past 20 years more than 100,000 MW of cogeneration
capacity has been built and now supplies over 13% of total
power generation is US.
By 2015 it is expected that natural gas combined – cycle units
will supply roughly 25% of total electricity generated in US.
The driver behind cogeneration is the increase in efficiency
compared to conventional non-integrated power generation.
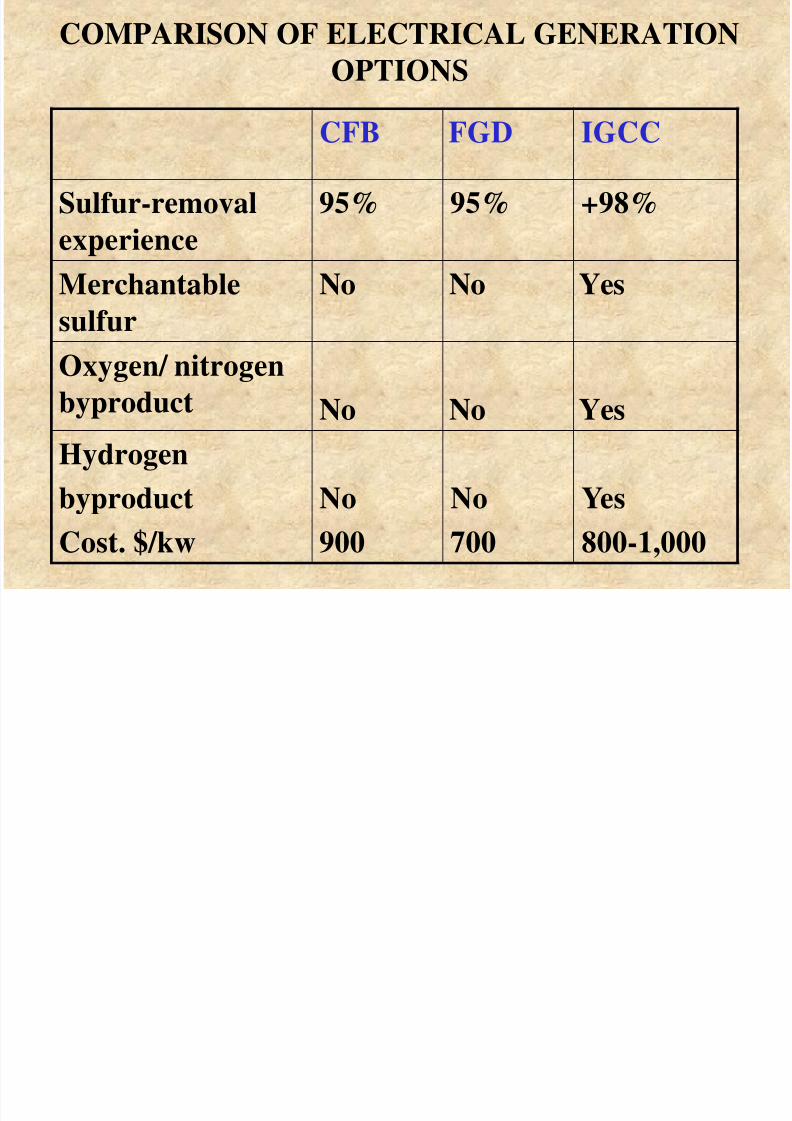
COMPARISON OF ELECTRICAL GENERATION
8/3/2019 Refinery Per to Chemical 2004
http://slidepdf.com/reader/full/refinery-per-to-chemical-2004 76/90
OPTIONS
CFB FGD IGCC
Sulfur-removal
experience
95% 95% +98%
Merchantablesulfur
No No Yes
Oxygen/ nitrogen
byproduct No No Yes
Hydrogen
byproduct
Cost. $/kw
No
900
No
700
Yes
800-1,000
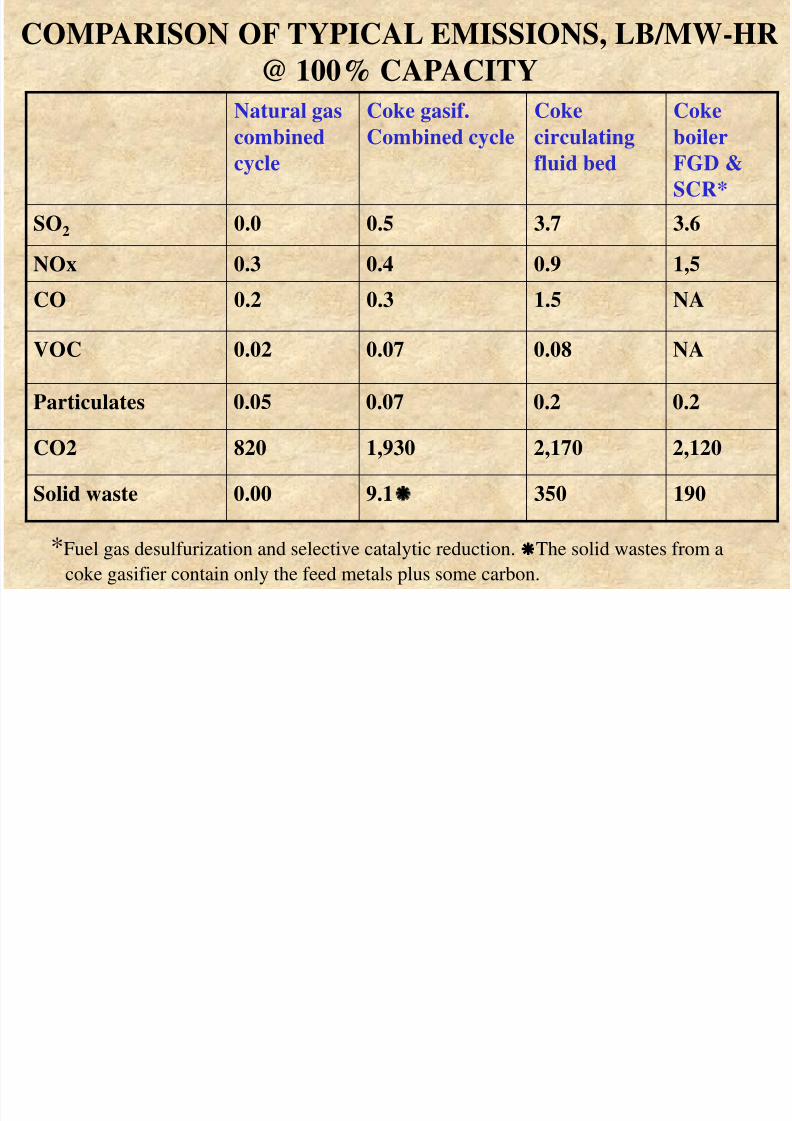
COMPARISON OF TYPICAL EMISSIONS, LB/MW-HR
8/3/2019 Refinery Per to Chemical 2004
http://slidepdf.com/reader/full/refinery-per-to-chemical-2004 77/90
@ 100% CAPACITY
Natural gas
combined
cycle
Coke gasif.
Combined cycle
Coke
circulating
fluid bed
Coke
boiler
FGD &
SCR*
SO2 0.0 0.5 3.7 3.6
NOx 0.3 0.4 0.9 1,5
CO 0.2 0.3 1.5 NA
VOC 0.02 0.07 0.08 NA
Particulates 0.05 0.07 0.2 0.2
CO2 820 1,930 2,170 2,120
Solid waste 0.00 9.1 350 190
*Fuel gas desulfurization and selective catalytic reduction. The solid wastes from a
coke gasifier contain only the feed metals plus some carbon.
8/3/2019 Refinery Per to Chemical 2004
http://slidepdf.com/reader/full/refinery-per-to-chemical-2004 78/90
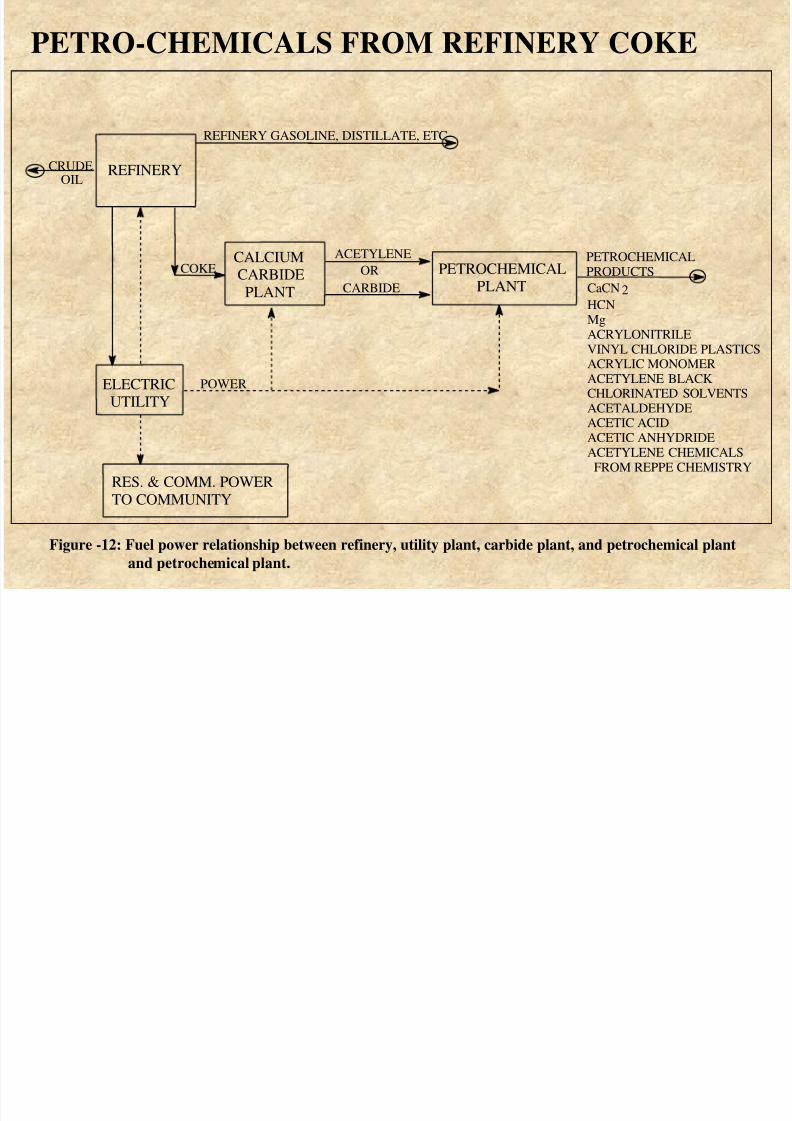
PETRO-CHEMICALS FROM
REFINERY COKE
• Valuable material for producing petro- chemicals
• Excellent source for high purity acetylene which
is a useful starting material for host of petro-
chemicals such as acrylonitrile, vinylchloride,acrylic monomer etc.
PETRO-CHEMICALS FROM REFINERY COKE
8/3/2019 Refinery Per to Chemical 2004
http://slidepdf.com/reader/full/refinery-per-to-chemical-2004 79/90
CRUDEOIL
REFINERY GASOLINE, DISTILLATE, ETC
REFINERY
CALCIUMCARBIDE
PLANT
PETROCHEMICAL
PLANT
ELECTRICUTILITY
RES. & COMM. POWERTO COMMUNITY
COKEACETYLENE
OR
CARBIDE
PETROCHEMICALPRODUCTS
POWER
CaCN 2HCNMgACRYLONITRILEVINYL CHLORIDE PLASTICSACRYLIC MONOMERACETYLENE BLACKCHLORINATED SOLVENTSACETALDEHYDE
ACETIC ACIDACETIC ANHYDRIDEACETYLENE CHEMICALS
FROM REPPE CHEMISTRY
Figure -12: Fuel power relationship between refinery, utility plant, carbide plant, and petrochemical plant
and petrochemical plant.
I i R fi / A i l
8/3/2019 Refinery Per to Chemical 2004
http://slidepdf.com/reader/full/refinery-per-to-chemical-2004 80/90
Integrating Refinery/ Aromatic complex
Case study by Chem Systems, NY.
Existing refineries
- North America (USGC)
- Western Europe (Roterdam)- Asia (Singapore)
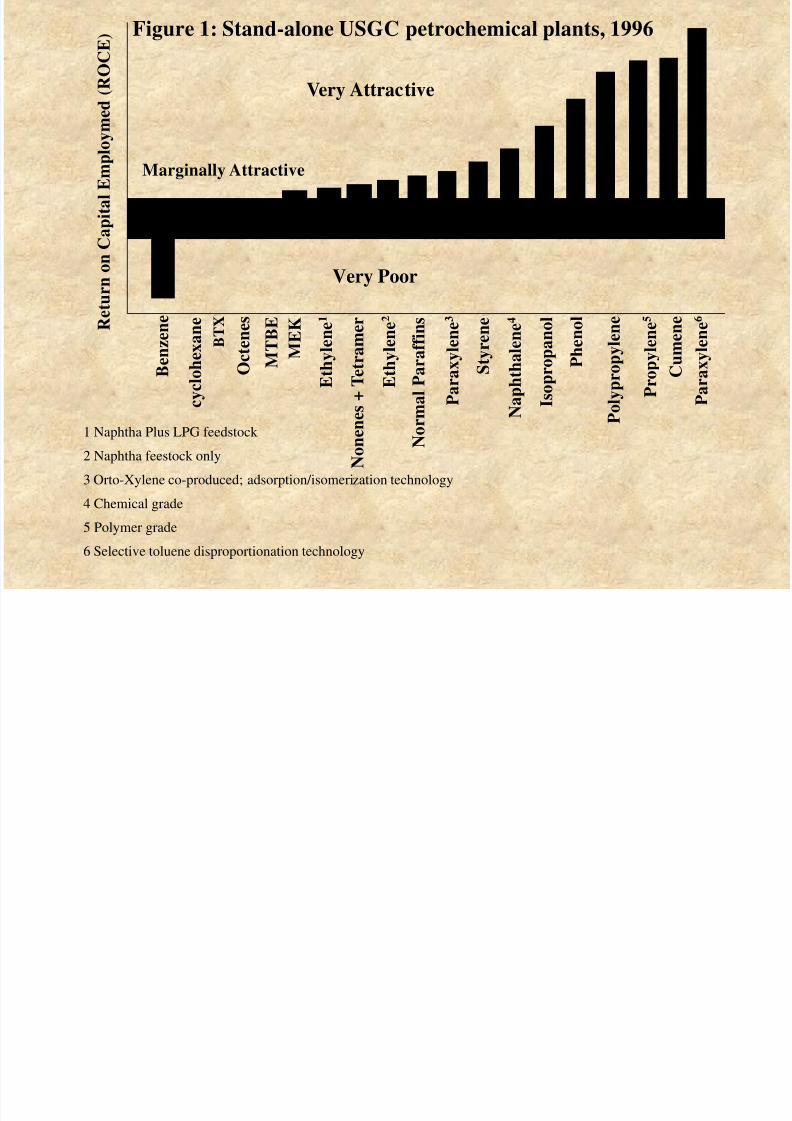
C E ) Figure 1: Stand-alone USGC petrochemical plants, 1996
8/3/2019 Refinery Per to Chemical 2004
http://slidepdf.com/reader/full/refinery-per-to-chemical-2004 81/90
N o n e n
e s + T e t r a m e r
P a r a x y l e n e 6
C u m e n e
P r o p y l e n e 5
P o l y p r o p y l e n e
P h e n o l
I s o p r o p a n o l
N a p h t h a l e n e 4
S t y r e n e
P a r a x y l e n e 3
N o r m a l P a r a f f i n s
E t h y l e n e 2
E t h y l e n e 1
M E K
M T B E
O c t e n e s
B T X
c y c l o h e x a n e
B e n z e n e
Very Poor
Very Attractive
R e t u r n o n C a p i t a l E m p l o y m e d ( R O C
1 Naphtha Plus LPG feedstock
2 Naphtha feestock only
3 Orto-Xylene co-produced; adsorption/isomerization technology
4 Chemical grade
5 Polymer grade
6 Selective toluene disproportionation technology
Marginally Attractive
8/3/2019 Refinery Per to Chemical 2004
http://slidepdf.com/reader/full/refinery-per-to-chemical-2004 82/90
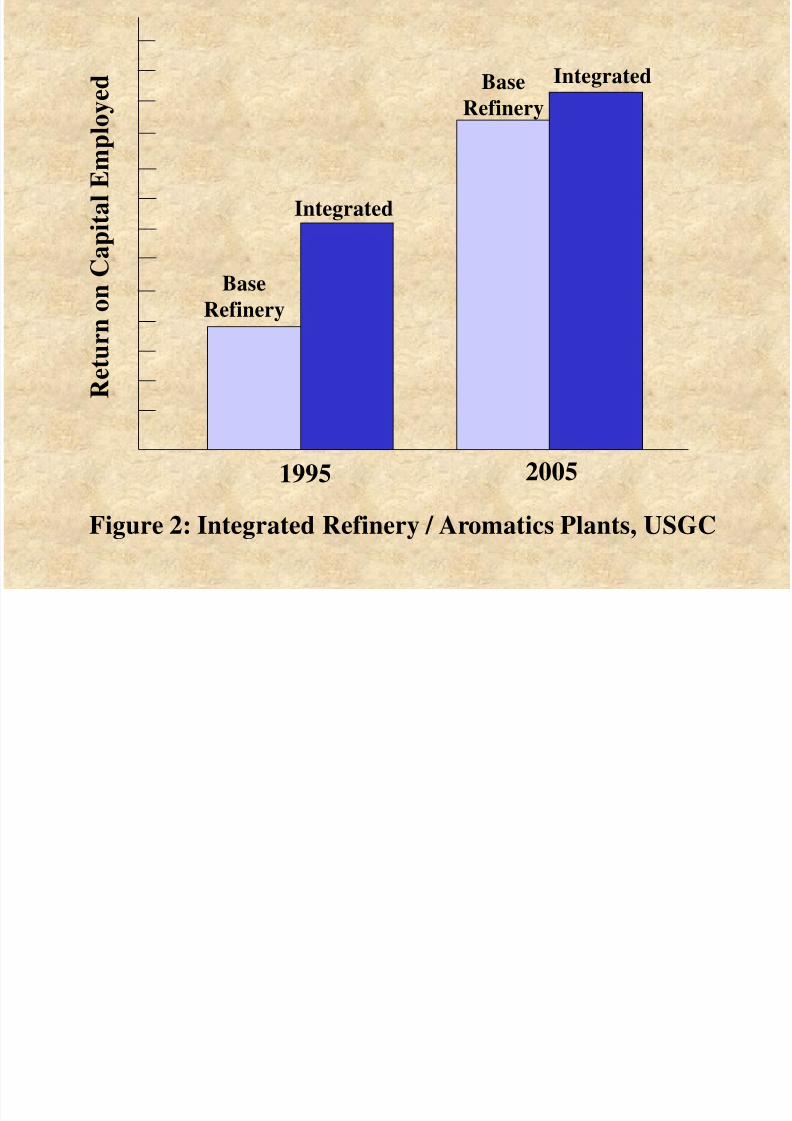
BaseRefinery
Base
Refinery
Integrated
Integrated
R e t u r n o n
C a p i t a l E m p l o y e d
1995 2005
Figure 2: Integrated Refinery / Aromatics Plants, USGC
8/3/2019 Refinery Per to Chemical 2004
http://slidepdf.com/reader/full/refinery-per-to-chemical-2004 83/90
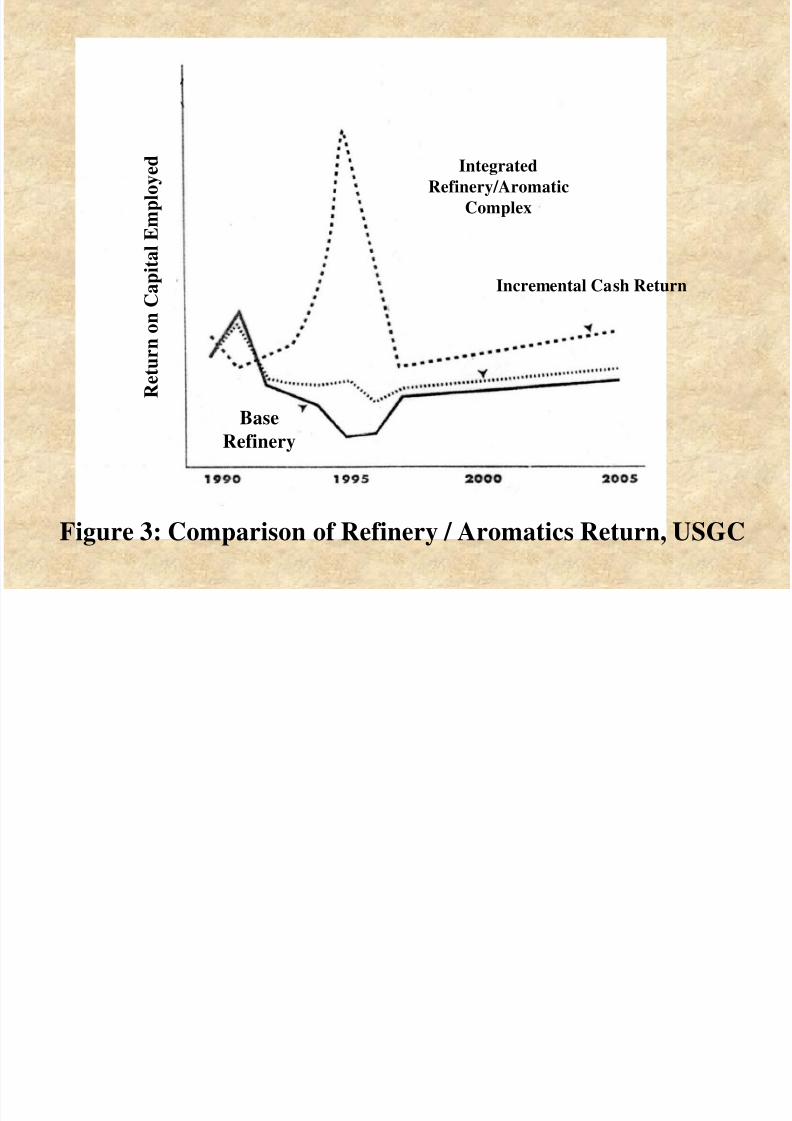
Integrated
Refinery/Aromatic
Complex
Incremental Cash Return
R e t u r n o n C a
p i t a l E m p l o y e d
Figure 3: Comparison of Refinery / Aromatics Return, USGC
BaseRefinery
8/3/2019 Refinery Per to Chemical 2004
http://slidepdf.com/reader/full/refinery-per-to-chemical-2004 84/90
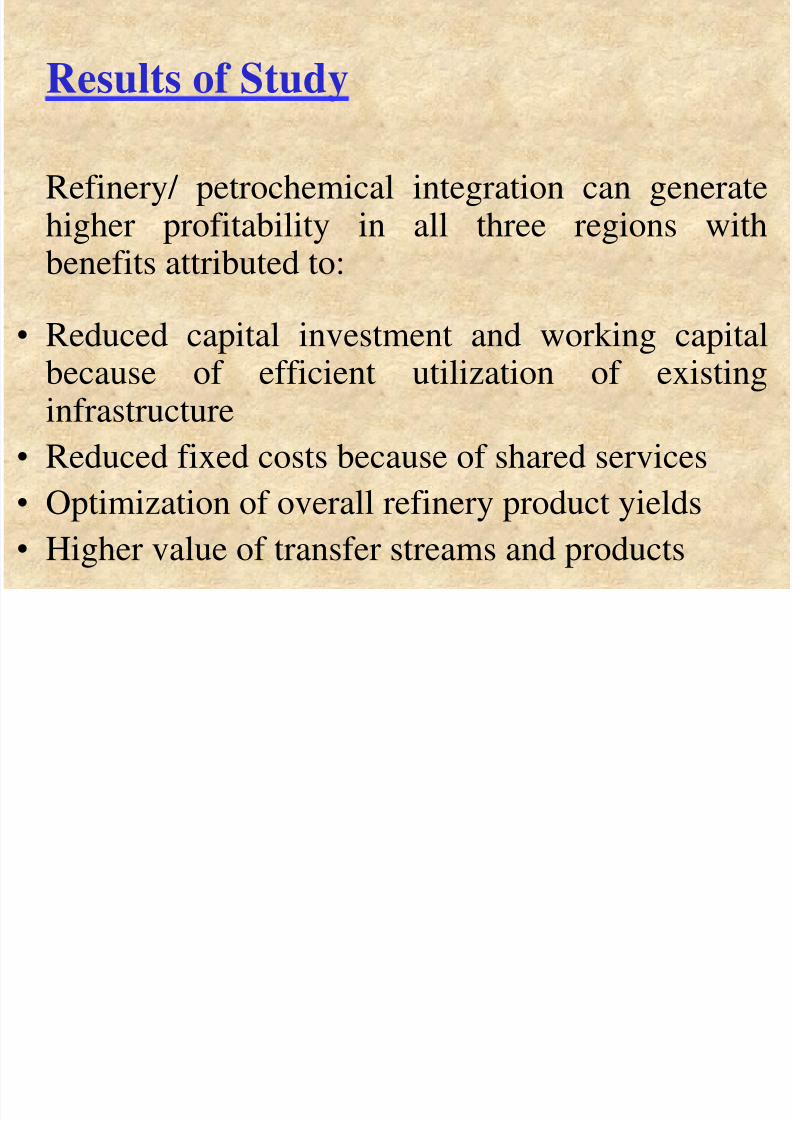
Results of Study
Refinery/ petrochemical integration can generatehigher profitability in all three regions withbenefits attributed to:
• Reduced capital investment and working capitalbecause of efficient utilization of existing
infrastructure• Reduced fixed costs because of shared services
• Optimization of overall refinery product yields
• Higher value of transfer streams and products
8/3/2019 Refinery Per to Chemical 2004
http://slidepdf.com/reader/full/refinery-per-to-chemical-2004 85/90
POWER GENERATION INTEGRATION
WITH HYDROGEN PLANT…….
It is profitable to integrate power generation with
other products say H2
.
The cost of power is substantially reduced.
8/3/2019 Refinery Per to Chemical 2004
http://slidepdf.com/reader/full/refinery-per-to-chemical-2004 86/90
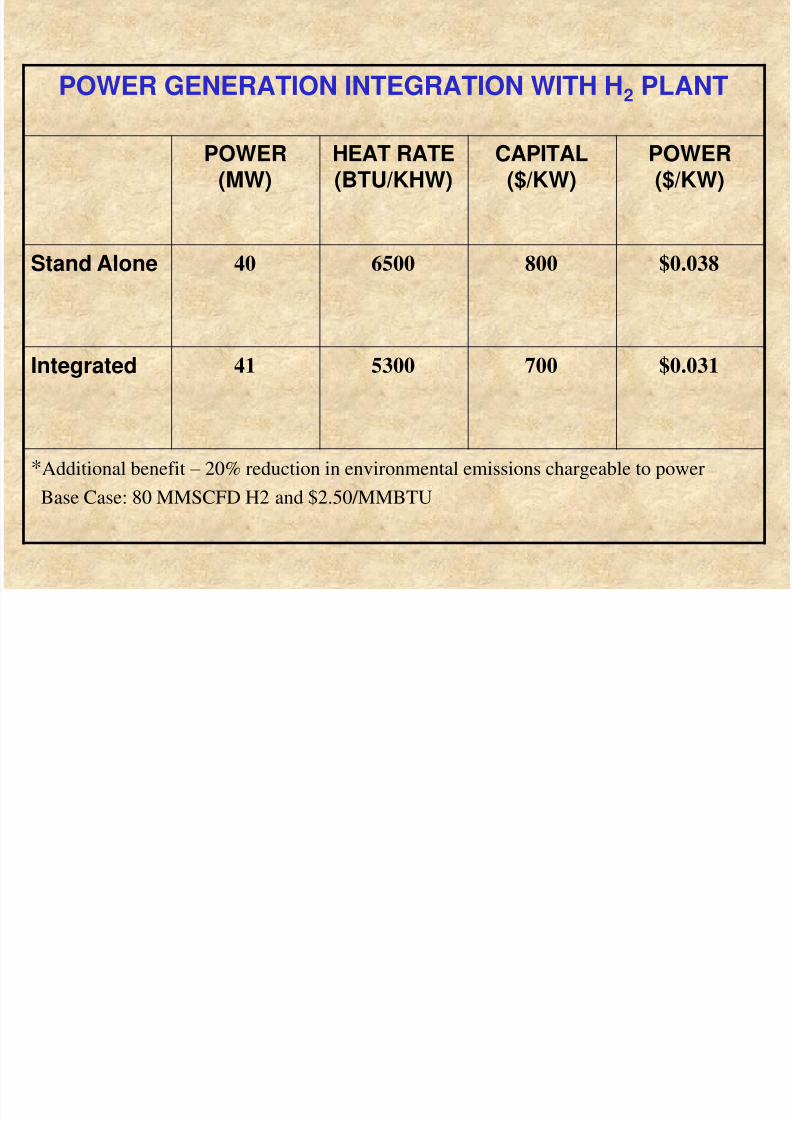
POWER GENERATION INTEGRATION WITH H2 PLANT
POWER(MW)
HEAT RATE(BTU/KHW)
CAPITAL($/KW)
POWER($/KW)
Stand Alone 40 6500 800 $0.038
Integrated 41 5300 700 $0.031
*Additional benefit – 20% reduction in environmental emissions chargeable to power
Base Case: 80 MMSCFD H2 and $2.50/MMBTU
8/3/2019 Refinery Per to Chemical 2004
http://slidepdf.com/reader/full/refinery-per-to-chemical-2004 87/90
8/3/2019 Refinery Per to Chemical 2004
http://slidepdf.com/reader/full/refinery-per-to-chemical-2004 88/90
8/3/2019 Refinery Per to Chemical 2004
http://slidepdf.com/reader/full/refinery-per-to-chemical-2004 89/90

8/3/2019 Refinery Per to Chemical 2004
http://slidepdf.com/reader/full/refinery-per-to-chemical-2004 90/90