Embed Size (px)
Citation preview
Protein Science (1997). 61248-1263. Cambridge University Press. Printed in the USA Copyright 0 1997 The Protein Society
Refined solution structure and backbone dynamics of HIV-1 Nef
STEPHAN GRZESIEK,'.3 AD BAX,' JIN-SHAN HU,' JOSHUA KAUFMAN,2 IRA PALMER,2 STEPHEN J. STAHL? NICO TJANDRA,' AND PAUL T. WINGFIELD' 'Laboratory of Chemical Physics, Building 5 , National Institute of Diabetes and Digestive and Kidney Diseases,
*Protein Expression Laboratory, Building 6B, National Institute of Arthritis and Musculoskeletal Diseases, National Institutes of Health, Bethesda, Maryland 20892-0520
National Institutes of Health, Bethesda, Maryland 20892-0620
(RECEIVED January 6, 1997; ACCEPTED March 6, 1997)
Abstract
The tendency of HIV-I Nef to form aggregates in solution, particularly at pH values below 8, together with its large fraction of highly mobile residues seriously complicated determination of its three-dimensional structure, both for heteronuclear solution NMR (Grzesiek et al., 1996a, Nut Struct Biol 3:340-345) and for X-ray crystallography (Lee et a]., 1996, Cell 85931-942). Methods used to determine the Nef structure by NMR at pH 8 and 0.6 mM concentration are presented, together with a detailed description of Nef's secondary and tertiary structure. The described techniques have general applicability for the NMR structure determination of proteins that are aggregating and/or have limited stability at low pH values. Extensive chemical shift assignments are reported for backbone and side chain 'H, I3C, and 15N resonances of the HN-1 Nef deletion mutants NEFA2-39, NEFA2-393A'59-'73,
with the SH3 domain of the Hck tyrosine protein kinase. Besides a type I1 polyproline helix, Nef's structure consists of three a-helices, a 310 helix, and a five-stranded anti-parallel &sheet. The analysis of I5N relaxation parameters of the backbone amide sites reveals that all the secondary structure elements are non-mobile on the picosecond to nanosecond and on the millisecond time scale. A large number of slowly exchanging amide protons provides evidence for the stability of the Nef core even on the time scale of hours. Significant internal motions on the ps to ns time scale are detected for residues 60 to 71 and for residues 149 to 180, which form solvent-exposed loops. The residues of the HIV-1 protease cleavage site (W57/L58) do not exhibit large amplitude motions on the sub-nanosecond time scale, and their side chains insert themselves into a hydrophobic crevice formed between the C-terminus of helix 1 and the N-terminus of helix 2. A refined structure has been determined based on additional constraints for side-chain and backbone dihedral angles derived from a large number of three-bond J-couplings and ROE data.
Keywords: heteronuclear NMR; HIV-1; multi-dimensional NMR; Nee protein dynamics; protein structure
and of NEFA2-39,Al59-l73 ~n ' complex
HIV-1 Nef is a 206 amino acid, N-terminal myristoylated and membrane-associated protein that is expressed at high levels in the early stages of H N infection (Cullen, 1994). Although early re- ports suggested a negative role on viral replication (Luciw et al., 1987; Ahmad & Venkatesan, 1988; Cheng-Mayer et al., 1989; Niederman et al., 1989), the following evidence suggests a positive role of Nef on viral replication and disease pathogenesis: first, macaques infected with the simian immuno-deficiency virus strain SIVmac239Anef bearing a deletion in the Nef gene show only poor
Reprint requests to: Stephan Grzesiek, Laboratory of Chemical Physics, Building 5 , National Institute of Diabetes and Digestive and Kidney Dis- eases, National Institutes of Health, Bethesda, Maryland 20892-0520 e-mail: [email protected].
3Present address: IBI-2, Forschungszentrum Julich, Postfach 1913, D-52425 Julich, Germany; e-mail: [email protected].
viral replication, do not develop disease, and are protected from infection by pathogenic SIV (Kestler et al., 1991; Daniel et al., 1992). Moreover, in animals infected with an SIV strain containing a premature stop codon (Kestler et al., 1991) or a 12 bp deletion (Whatmore et al., 1995) in the Nef gene, restoration of the intact and complete Nef reading frame is observed and correlates with disease progression. Second, sequencing of the HIV genome of several groups of long-term (>lo years) survivors of HIV infec- tion, with no clinical signs of disease progression and normal cluster determinant 4 (CD4) counts, revealed the presence of dis- crete and stable deletions in the Nef gene in at least nine individ- uals (Deacon et al., 1995; Kirchhoff et al., 1995; Mariani et al., 1996; Prekumar et al., 1996). Full-length sequencing, which was carried out for one of these individuals, showed no other abnor- malities in the entire H N genome (Deacon et al., 1995). Third, Nef was shown to increase HN-1 replication in primary human
1248
High resolution NMR of HN-1 Nef 1249
peripheral blood lymphocytes and in certain cell lines in vitro (deRonde et al., 1992; Skowronski et al., 1993; Chowers et al., 1994; Miller et al., 1994; Spina et al., 1994).
The role of Nef at a molecular level remains unclear. Nef down- regulates cell-surface CD4 even in the absence of other viral gene products by post-translational endocytosis (Guy et al., 1987; Gar- cia & Miller, 1991; Benson et al., 1993; Garcia et al., 1993; Skow- ronski et al., 1993; Foster et al., 1994). However, this function seems to be dissociated from the viral infectivity enhancement (Goldsmith et al., 1995; Chowers et al., 1995; Saksela et al., 1995). This latter activity of Nef is linked to a conserved polyproline repeat from residues 69-78 (Goldsmith et al., 1995; Saksela et al., 1995). The polyproline motif is reminiscent of an SH3 target site (Shugars et al., 1993; Saksela et al., 1995), and Nef has been shown to bind specifically and with sub-micromolar affinity to the SH3 domains of a subset of Src family kinases (Lee et al., 1995, 1996; Saksela et al., 1995).
Recently, we have determined the Nef (NEFA2-39.A159”73) struc- ture by heteronuclear NMR (Grzesiek et al., 1996a). In this con- struct, residues 2-39 of the unstructured N-terminus (Freund et al., 1994a) and residues 159-173 of a long solvent exposed loop had been removed without altering the structure of the remaining Nef core domain. Chemical shift changes induced by the binding of SH3 Hck to Nef allowed us to model the Nef-SH3 complex (Grze- siek et al., 1996a). Independently, the structure of Nef (residues 54-205) in complex with a mutated SH3 domain of Fyn tyrosine kinase has been solved by X-ray crystallography (Lee et al., 1996). The two structures of the Nef core domain are identical within the experimental resolution of the two studies, and the position of the SH3 domain relative to Nef in the X-ray structure agrees with our model of the complex. In addition to the Nef-SH3 interaction, chemical shift changes induced by binding to a peptide from the C-terminal tail of CD4 provide evidence for a direct Nef-CD4 interaction and delineate a well-defined binding surface for this peptide (Grzesiek et al., 1996b). This binding site is located in the vicinity of the W57/L58 HIV-1 protease cleavage site and is dis- tinct from the SH3 binding site.
Efforts to determine the structure of Nef by either NMR or crystallography have long been hampered by its large fraction of unstructured residues and Nef’s tendency to form aggregates at millimolar concentrations, especially at pH values below 8. Be- cause of sensitivity considerations, NMR structures are usually determined at concentrations 2 1 mM. Furthermore, the fast ex-
change of amide protons with water can be a serious source of line broadening and information loss at basic pH values. Here, we give a detailed description of the methods that were used to determine the structure of Nef by NMR at 0.6 mM concentration and at pH 8. NMR evidence is presented that defines the various structural el- ements and I5N relaxation data provide a measure of the degree of local backbone mobility on the pico- to nanosecond time scale. Based on a substantial number of additional distance and dihedral restraints, a refined structure of Nef has been calculated and its coordinates have been deposited in the Brookhaven data base (ac- cession code 2NEF).
Results and discussion
Backbone resonance assignments
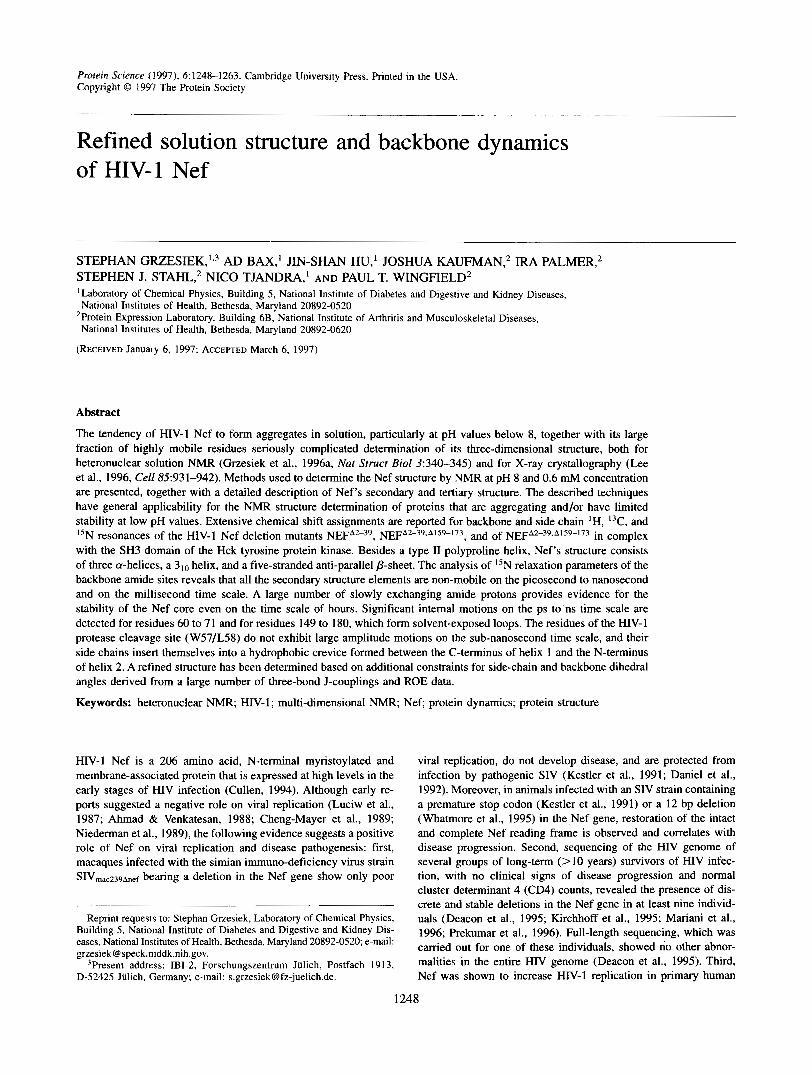
A summary of the Nef constructs and samples used for this NMR study is given in Table 1 . Preliminary NMR measurements on full-length Nef indicated a large unstructured region of -40 res- idues (Freund et al., 1994a; A. Bax & P. Wingfield, unpubl. obs.). Limited digestion of Nef with trypsin resulted in the removal of many of the unstructured residues in the NMR spectrum. Trypsin cleaves Nef rapidly and completely between residue 39 and 40 (Freund et al., 1994a; A. Bax & P. Wingfield, unpubl. obs.), and a Nef deletion mutant was constructed where residues 2-39 are re- moved (NEFA2-39). This mutant expresses as a soluble product at high levels in E. coli (Grzesiek et al., 1996a).
The backbone assignment was first carried out on this NEFA2-39 construct. For the assignment of the backbone and Hp and Cp resonances, data from the HNCO, HNCA, HNCACB, CBCA- (CO)NH, HBHA(CO)NH, ”N-edited HOHAHA, I5N-edited NOESY for samples of NEFA2-39 dissolved in 95% H20/5% D20 were used according to Table 2. As Nef forms aggregates at con- centrations of -1 mM and is predominantly monomeric only at -0.1 mM (see below), for all the experiments in Table 2 a com- promise value of 0.6 mM was used. This set of experiments and the associated assignment process are very similar to a previously applied strategy (Anglister et al., 1994). However, special care was taken to minimize the effects of resonance overlap and fast amide hydrogen exchange caused by the high pH value.
In brief, the assignment strategy consists of classifying all the HN, N-frequency pairs according to cross-peaks in the HNCO spectrum, which is the most well resolved and most sensitive of the
Table 1. Sample preparations a
No. Nef construct Labeling Solvent
U-I’N U-”N, U-I3C U-I’N, U-’H U-I’N, U-I3C. Phe- U-l’N U-I’N, U-I3C U-I’N, U-I3C U-I’N, U-I3C
aAll samples were prepared as 0.6 mM solutions in 5 mM Tris-HCI, 5 mM dithiothreitol at pH 8.0
bLyophilized and redissolved in D20. (uncorrected meter reading).
1250 S. Grzesiek et al.
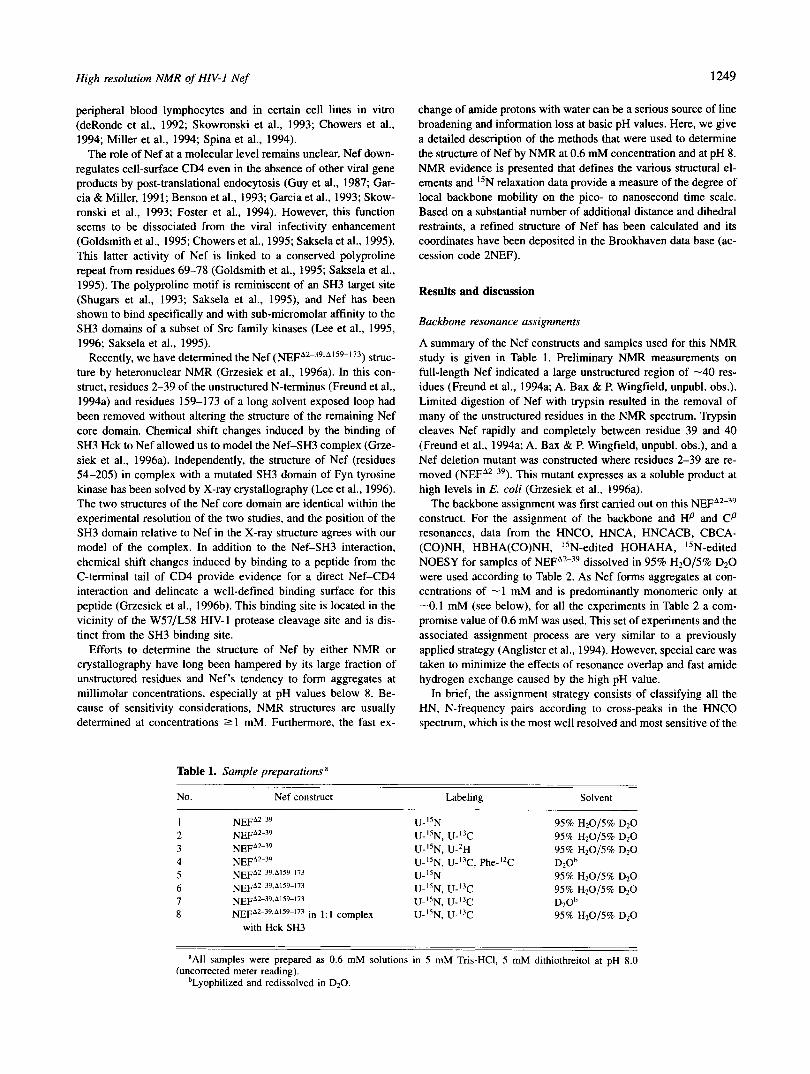
Table 2a. Assignment experiments a
Time Experiment Sampleb (ms) constraints' (h)
HOHAHA 1 5Nd 1 35 15.4 (H) 39.6 (N) 55.3 (HN) HOHAHA 1 2Ce 4 2 50.4 (Hl) 145.1 (H2) NOESY 12C' 4 15 51.O(H1) 141.3 (H2) HNCAg 2, 8 33 11.0 (CA) 26.8 (N) 55.3 (HN)
HNCO' 2 14 49.6 (CO) 26.3 (N) 55.3 (HN)
Acquisition times No. of
HNCACB~ 2,6 83 7.2 (CACB) 26.8 (N) 55.3 (HN)
H B H A C ~ 2 63 13.0 (HAHB) 19.8 (N) 55.3 (HN) CBCACO~ 2.6.8 62 6.2 (CACB) 19.8 (N) 55.3 (HN) 133 CH3COSY' 4 12 12.8 (CI) 25.8 (C-MET) 52.6 (H-MET) CH3DIPSI"' 4 46 6.2 (C) 25.6 (C-MET) 79.8 (H-MET)
NOESY 12C). aThese experiments were used to derive assignments based solely on J-coupling connectivities (with the exception of
bThe experiments were carried out on all of the listed samples. Numbers correspond to Table 1. 'Number of constraints derived from the experiment and used in structure calculation. d'5N-separated HOHAHA (Marion et al., 1989). mixing time 32 ms. e2D HOHAHA selective for "C-attached protons (Bax et al., 1994), mixing time 32 ms. '2D NOESY selective for "C-attached protons (Vuister et ai., 1994). mixing time 85 ms. 9Constant-time HNCA (Grzesiek & Bax, 1992a) with water flip-back modifications (Grzesiek & Bax, 1993b; Kay et al.,
hConstant-time HNCACB (Wittekind & Mueller, 1993) with water flip-back modifications (Grzesiek & Bax, 1993b; Kay
'Constant-time HNCO (Grzesiek & Bax, 1992a) with water flip-back modifications (Grzesiek & Bax, 1993b; Kay et al.,
JHBHA(C0)NH (Grzesiek & Bax, 1993a) with WATERGATE (Piotto et al., 1992). kCBCA(CO)NH (Grzesiek & Bax, 1992b) with WATERGATE (Piotto et al., 1992). 'HCCH-COSY (Bax et al., 1990a) optimized for methyl group detection by using constant-time HSQC-type I3C evolution
"'HCCH-TOCSY (Bax et al., 1990b) optimized for methyl group detection by using constant-time HSQC-type I3C
1994).
et al., 1994).
1994).
(Vuister & Bax, 1992).
evolution.
Table 2b. J-coupling experiments a
Time Experiment Sample (h)
Acquisition times (ms)
No. of constraints
H N H A ~ 5 87 15.4 (H) 38.2 (N) 55.3 (HN) 91
H A H B ~ I 24 11.0 (HAHB) 24.2 (CA) 54.7 (HA) 37
HN(CG)' 6 18 88.8 (N) 47.1 (HN)
HNCOCOc 6 69 26.9 (CO) 26.6 (N) 48.3 (HN) 78
CH3CO/CNe 7 36 25.9 (C-MET) 79.5 (H-MET) 9
HN(CO)(CG)g 6 19 50.0 (N) 47.4 (HN) 19
aExperiments that were used to derive dihedral angle restraints from 3J-couplings. bWater flip-back HNHA (Kuboniwa et al., 1994). 'HNCOCO quantitative 3 J ~ , ~ r correlation (Hu & Bax, 1996; Grzesiek & Bax, 1997). dHACAHB-COSY (Grzesiek et al., 1995b). e2D constant-time spin-echo difference I3C-HSQC for measurement of l3C-I5N (Vuister et al., 1993) and 13C-13C'
'2D constant-time spin-echo difference "N-HSQC for measurement of aromatic I3C-l5N J-couplings (Hu et al., 1997). 92D constant-time spin-echo difference experiment for measurement of aromatic I3C-l5C' J-couplings (Hu et al., 1997).
(Grzesiek et al., 1993) J-couplings.
Constraints are derived from a combined analysis with the HN(CG) experiment.
above set of experiments. Corresponding Cf , CEl, cf, Cf-,, ciated with each HNCO peak are then matched against all others Hf, Hf- I , Hf-, , H N i - I , HNi+ 1 frequencies are extracted from the for possible interresidue correlations to generate sequential stretches HNCA, HNCACB, CBCA(CO)NH, HBHA(CO)NH, I5N-edited of amino acid spin systems. These stretches are, in turn, assigned HOHAHA, "N-edited NOESY. These frequencies are associated to locations in the primary sequence of the protein based on the with one HNCO cross-peak, assuming that it represents a unique amino acid type probability of the Ca and Cp shifts (Grzesiek & amide bond within the protein backbone. The spin systems asso- Bax, 1993a).
High resolution NMR of HIV-I Nef 1251
Table 2c. NOESYIROESY experimentsa
Time Mix Experiment Sample (h) (ms)
Acquisition times (ms)
No. of constraints
NOE15N15Nh 3 108 200 20.8 (NI) 20.0 (HNI) 20.8 (N2) 55.3 (HN2) NOE15NC 1,s 73 70 16.9 (H) 39.6 ( N ) 55.3 (HN) 355 ROE I 5Nd 5 58 20 15.0 (H) 60.0 (N) 47.1 (HN) 128 NOE 13C' 7 67 74 27.4 (H) 7.0 (C) 49.1 (HC) 93 NOE13C' 7 76 80 12.0 (H) 26.8 (Cmet) 70.3 (Hmet) 73 NOE 13Cg 7 86 74 15.0 (H) 7.1 (Caro) 48.9 (Haro) 128 NOE13C12Ch 4 75 74 15.2 (HC) 6.3 (C) 70.0 (Haro)
'Experiments that were used to derive distance restraints from the nuclear Overhauser effect. '4D "N, "N-edited NOESY (Grzesiek et al., 1995a).
1995). "N-edited 3D NOESY with water-flip back (Grzesiek & Bax, 1993b) and radiation damping during mixing period (Lippens et al.,
"N-edited 3D ROESY with water-flip back (Grzesiek & Bax, 1993b). "'C-edited 3D NOESY (Ikura et al., 1990; Zuiderweg et al., 1990) optimized for detection of aliphatic lH-I3C groups. "'C-edited 3D NOESY optimized for methyl group detection with constant-time HSQC (Santoro & King, 1992; Van de Ven &
"'C-edited 3D NOESY optimized for detection of aromatic 'H-I3C groups. h17C-edited 3D NOESY (Vuister et al., 1994) with detection of "C-attached protons in U-I'N, U-"C, Phe-I2C sample.
Philippens, 1992; Vuister & Bax, 1992).
Table 2d. I5N relaxation experimentsa
Time Acquisition times Experiment Sample t (h) (ms)
I S N T h
ISN T b 5 22 96.3 (N) 55.1 (HN) 5 18 82.2 (N) 55.1 (HN)
( 'H}- 'sN NOEC 5 33 82.2 (N) 55.1 (HN)
"Experiments for the definition of protein dynamics on the ps- to ns-
'Kay et al., 1992. 'Grzesiek and Bax, 1993b.
time scale.
Determination of experimental variances of the chemical shifts
A large fraction of the cross-peaks in the 3D spectra listed in Table 2 are well resolved, even in the case of broad linewidths. During the assignment process cross-peaks from different 3D spec- tra are usually linked together by one or two common frequencies. However, in this one- or two-dimensional frequency sub-space of peak connections, crowding and peak overlap often is a serious problem. To decide whether two frequencies should be considered identical, it is critical to have an accurate estimate of the experi- mental variance of the peak positions. With frequency identity, the peaks can originate from the same nuclei or from nuclei with degenerate chemical shifts. If two frequencies differ by more than the sum of their experimental uncertainties, the respective cross- peaks very likely originate from different nuclei. If a spectrum contains multiple cross-peaks for a given nucleus, the reproduc- ibility of frequencies derived from the spectrum can be assessed a posteriori once the spectrum has been assigned. In practice, it is not necessary to assign the whole spectrum, but a good estimate can be obtained from a small number of representative cross- peaks. Figure 1 shows a histogram of deviations from the mean frequency of the assigned peaks for the "N-edited NOESY spec- hum of~~A2-39.AlS9-173 . ~h e root-mean-square deviations (RMSD)
of the peak positions are 8.4, 1.6, and 3.0 Hz for the indirect proton frequency (H), the nitrogen frequency (N), and the detected amide proton (HN) frequency, respectively. For sufficient zero-filling, to a first approximation these frequency variances are inversely pro- portional to the mean signal duration in the time domain. Besides the transverse relaxation time, TZ, this mean lifetime of the reso- nances is determined by the acquisition time and the digital filter function used. For all data sets listed in Table 1, we empirically determined that the variance in the peak positions is -20-30 times smaller than the inverse of this mean lifetime.
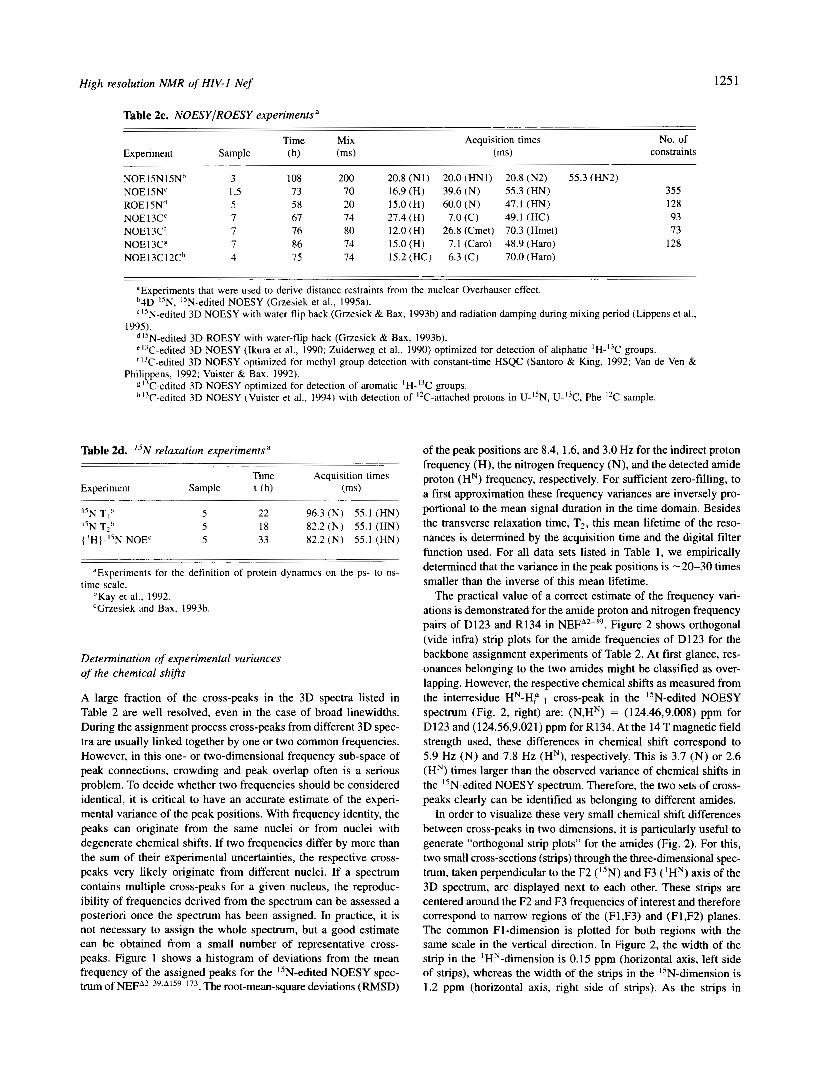
The practical value of a correct estimate of the frequency vari- ations is demonstrated for the amide proton and nitrogen frequency pairs of Dl23 and R134 in NEFA2-". Figure 2 shows orthogonal (vide infra) strip plots for the amide frequencies of Dl23 for the backbone assignment experiments of Table 2. At first glance, res- onances belonging to the two amides might be classified as over- lapping. However, the respective chemical shifts as measured from the interresidue H N - H r I cross-peak in the "N-edited NOESY spectrum (Fig. 2, right) are: (N,HN) = (124.46,9.008) ppm for Dl23 and (124.56,9.021) ppm for R134. At the 14 T magnetic field strength used, these differences in chemical shift correspond to 5.9 Hz (N) and 7.8 Hz (HN), respectively. This is 3.7 (N) or 2.6 (HN) times larger than the observed variance of chemical shifts in the "N-edited NOESY spectrum. Therefore, the two sets of cross- peaks clearly can be identified as belonging to different amides.
In order to visualize these very small chemical shift differences between cross-peaks in two dimensions, it is particularly useful to generate "orthogonal strip plots" for the amides (Fig. 2). For this, two small cross-sections (strips) through the three-dimensional spec- trum, taken perpendicular to the F2 (I5N) and F3 ('HN) axis of the 3D spectrum, are displayed next to each other. These strips are centered around the F2 and F3 frequencies of interest and therefore correspond to narrow regions of the (Fl,F3) and (Fl,F2) planes. The common F1-dimension is plotted for both regions with the same scale in the vertical direction. In Figure 2, the width of the strip in the 'HN-dimension is 0.15 pprn (horizontal axis, left side of strips), whereas the width of the strips in the "N-dimension is 1.2 pprn (horizontal axis, right side of strips). As the strips in

1252 S. Grzesiek et al.
A T n
L -I- -0.05 0.00 0.05 -0.1
B
N
0.0
C
HN
L 0.1 -0.015 0.000 0.015
deviatiodppm Fig. 1. Histogram of the relative probability of deviations from the mean frequency of assigned peaks, corresponding to individual nuclei for the "N-edited NOESY spectrum of NEFA2-39.A'59-173. A: Deviations of the assigned 'H frequencies in the indirect dimension. B: Same as A, for I5N dimension. C: Same as A for directly detected ' H N dimension.
Figure 2 are centered at the amide frequencies of D123, it is immediately recognized that the centers for the HNCO cross-peak and for the H E l peak in the I5N-edited NOESY for R134 are shifted downfield in both the "N and IHN frequencies. The dis- play of these chemical shift deviation patterns for several spectra in the same graphic makes it easy to classify the individual cross- peaks as belonging either to the amide of Dl23 or the amide of R134.
Problems associated with fast amide proton exchange
As all experiments are carried out at pH 8.0 and 35 "C, the intrinsic rates at which amide protons exchange with H20 are very fast (Bai et al., 1993). The H20 magnetization has a long TI relaxation time and, unless special care is taken, its net magnetization will be greatly reduced when the NMR experiment is repeated at a rate faster than l /T l . Rapid exchange of amide and hydroxyl protons with this largely saturated water resonance, followed by NOE mag- netization transfer within the protein, will then attenuate the pro- tein NMR signals. This problem can be solved by the incorporation of water flip-back pulses (Grzesiek & Bax, 1993b) into the amide proton out-and-back experiments (Kay et al., 1994), such as HNCO, HNCA, HNCACB, and by the use of radiation damping during the
NOESY mixing period (Lippens et al., 1995). Using such proce- dures, all protons except those that exchange faster than ca. 30 s- ' can be detected. Of the 155 backbone amide protons in NEFA2-39, only 18 could not be detected as a result of fast solvent exchange, and only three of these, Q104, R105, and H193, lie in the struc- tured core region of the protein. This core region is defined as the 102 residues (54-56,58,72,73,75-95,97-148, 181-203), which have a heteronuclear 15N-( 'H) NOE larger than 0.6 or, if the NOE could not be measured, are adjacent to these residues.
Deletion of residues 159 to 173
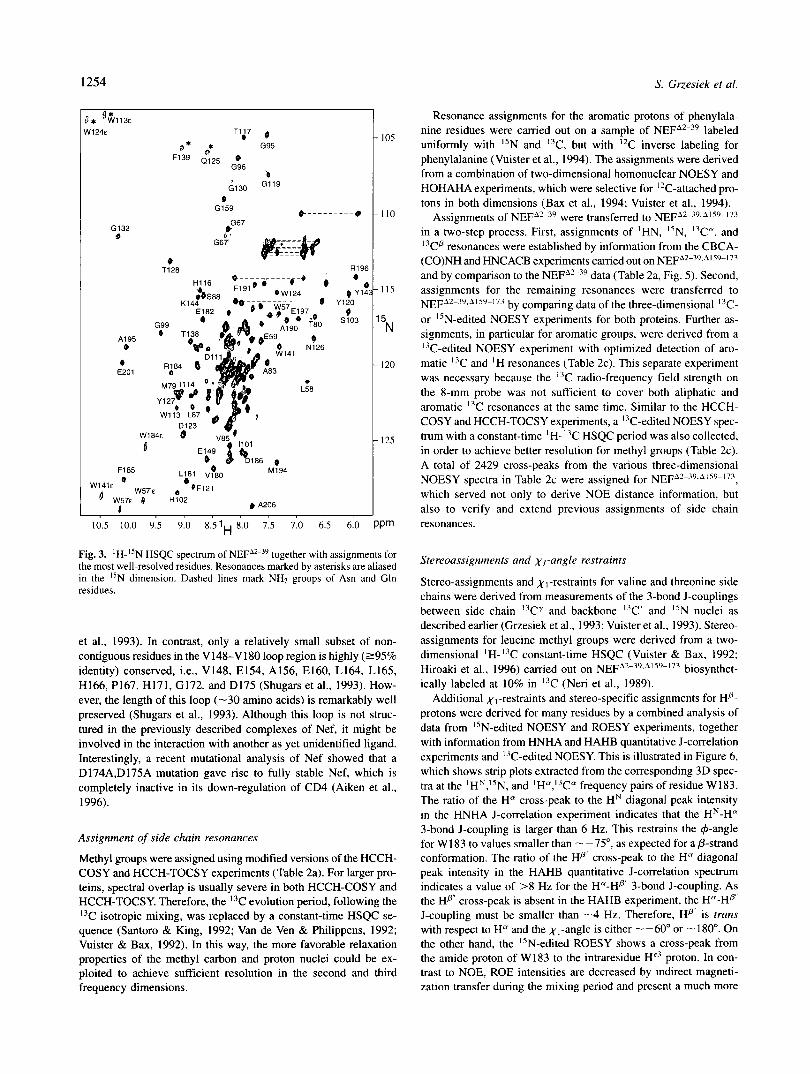
Figure 3 shows the 'H-I'N HSQC spectrum of NEFA2-39 together with assignments for the most well-resolved residues. Clearly, a large number of residues are located in the random coil region around 120 ppm (I5N) and 8.2 ppm ('H). A list of resonance assignments for NEFA*-39 is given in the Electronic Appendix. For residues K152 to Dl74 of NEFA2-", the deviations from random coil values for the C" and Cp shifts are considerably smaller than 1 ppm, indicating that this region does not adopt a defined sec- ondary structure. Furthermore, all of the assigned amide protons in this region show strong cross-peaks with the water resonance in the "N-edited NOESY spectrum (Fig. 4). The intensity of these
High resolution NMR of HN-1 Nef 1253
122cp e -
u
133Cp .?r La,
y
133Ca
122Ca
CBCACO
134Cp ... . .,
' 123Cp :'>$ .:... :x,*
123Cal 134Ca
e
B
HNCACB
- 20
- 30
-
- 40
. . -
123Cal 134Ca
- d
-
133Ca
1 2 i ~ a
:
-
- 60
k3Z.s
- 70
HNCA
122C'
133C'
HNCO
173
174
175
176
177
178
179
180
181
121H6 a 8
124HN
124H6 1
125HN b ' e
123HN/ 134HN
Q
SN-NOES
6
7
8
9
10
A
133HP Q J 1
122HP' <>'
6
133Ha 8
122Ha CD
[BHACO
e
Q
134Ha e @
a m 123Ha
IN-HOHA
133Hym
0.5
13.5
133Ha rn e - @ @
&+ -4.5 i e a a -
122Ha
t 5.5 I SN-NOESY
Fig. 2. Orthogonal strip plots (see text) for the backbone assignment experiments extracted from the three-dimensional data cubes at the 'H-lSN amide frequency pair of Dl23 of NEF"2-39. Individual experiments are marked at the bottom of each strip. The strip plots have a width of 0.15 ppm in the IHN dimension (left side of strips), and of 1.2 ppm in the "N dimension (right side of strips). Vertical axes correspond to 13C"/13Cp frequencies for CBCA(CO)NH, HNCACB, and HNCA, to I3C' frequencies for HNCO, and to ' H frequencies for the %edited NOESY, HBHA(C0)NH and "N-edited HOHAHA experiments, respectively.
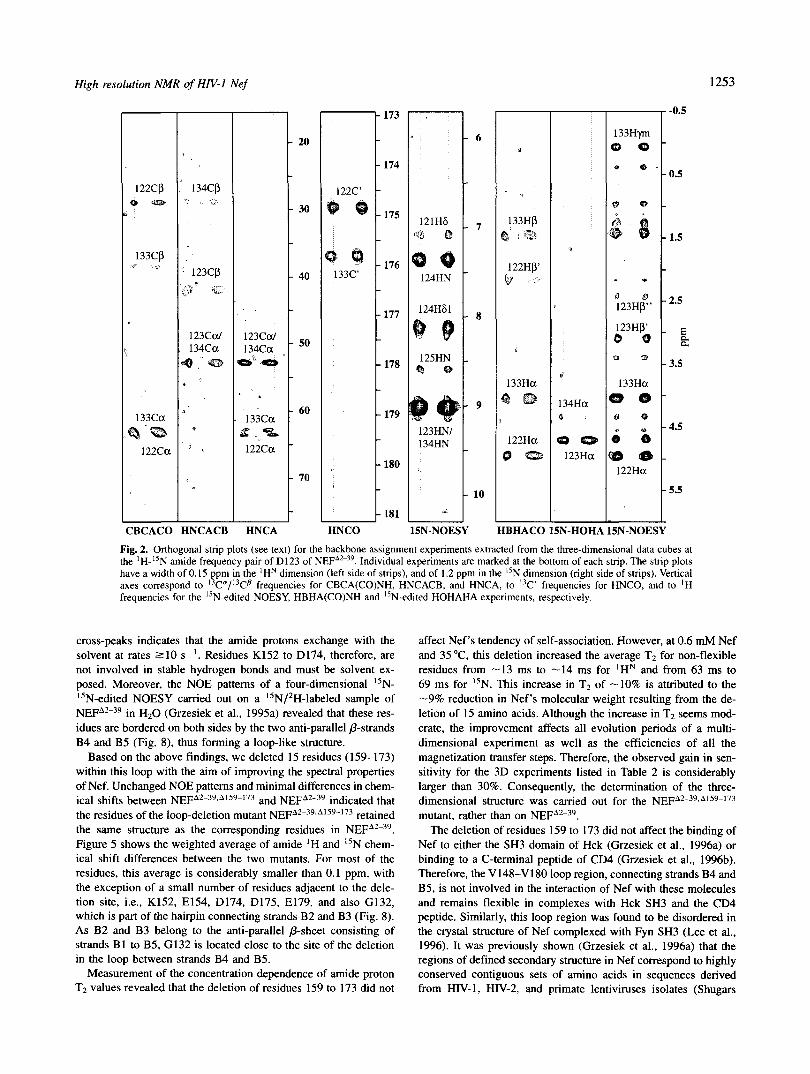
cross-peaks indicates that the amide protons exchange with the solvent at rates 2.10 s". Residues K152 to D174, therefore, are not involved in stable hydrogen bonds and must be solvent ex- posed. Moreover, the NOE patterns of a four-dimensional "N- "N-edited NOESY carried out on a I5N/*H-labeled sample of NEFA2-39 in H 2 0 (Grzesiek et al., 1995a) revealed that these res- idues are bordered on both sides by the two anti-parallel &strands B4 and B5 (Fig. 8), thus forming a loop-like structure.
Based on the above findings, we deleted 15 residues (159-173) within this loop with the aim of improving the spectral properties of Nef. Unchanged NOE patterns and minimal differences in chem- ical shifts between NEFA2-39,A159"73 and NEFA2-39 indicated that the residues of the loop-deletion mutant NEFA2-39~Ai59-i73 retained the same structure as the corresponding residues in NEFA2-39. Figure 5 shows the weighted average of amide 'H and "N chem- ical shift differences between the two mutants. For most of the residues, this average is considerably smaller than 0.1 ppm, with the exception of a small number of residues adjacent to the dele- tion site, i.e., K152, E154, D174, D175, E179, and also G132, which is part of the hairpin connecting strands B2 and B3 (Fig. 8). As B2 and B3 belong to the anti-parallel &sheet consisting of strands B1 to B5, GI32 is located close to the site of the deletion in the loop between strands B4 and B5.
Measurement of the concentration dependence of amide proton T2 values revealed that the deletion of residues 159 to 173 did not
affect Nef's tendency of self-association. However, at 0.6 mM Nef and 35 "C, this deletion increased the average T2 for non-flexible residues from - 13 ms to -14 ms for 'HN and from 63 ms to 69 ms for "N. This increase in T2 of -10% is attributed to the -9% reduction in Nef's molecular weight resulting from the de- letion of 15 amino acids. Although the increase in T2 seems mod- erate, the improvement affects all evolution periods of a multi- dimensional experiment as well as the efficiencies of all the magnetization transfer steps. Therefore, the observed gain in sen- sitivity for the 3D experiments listed in Table 2 is considerably larger than 30%. Consequently, the determination of the three- dimensional structure was carried out for the NEFA2-39,A'59"73 mutant, rather than on NEFA2-".
The deletion of residues 159 to 173 did not affect the binding of Nef to either the SH3 domain of Hck (Grzesiek et al., 1996a) or binding to a C-terminal peptide of CD4 (Grzesiek et al., 1996b). Therefore, the V148-Vl80 loop region, connecting strands B4 and B5, is not involved in the interaction of Nef with these molecules and remains flexible in complexes with Hck SH3 and the CD4 peptide. Similarly, this loop region was found to be disordered in the crystal structure of Nef complexed with Fyn SH3 (Lee et al., 1996). It was previously shown (Grzesiek et al., 1996a) that the regions of defined secondary structure in Nef correspond to highly conserved contiguous sets of amino acids in sequences derived from HIV-1, HW-2, and primate lentiviruses isolates (Shugars
1254
a * 3* G95
F139 0125 * G96
. ." 0
9 Y14 a
Y120
5103 8
os
10
15
N
20
2s
Fig. 3. 'H-I5N HSQC spectrum of NEF'2-39 together with assignments for the most well-resolved residues. Resonances marked by asterisks are aliased in the 15N dimension. Dashed lines mark NH2 groups of Asn and Gln residues.
et al., 1993). In contrast, only a relatively small subset of non- contiguous residues in the V148-Vl80 loop region is highly (295% identity) conserved, i.e., V148, E154, A156, E160, L164, L165, H166, P167, H171, G172, and Dl75 (Shugars et al., 1993). How- ever, the length of this loop (-30 amino acids) is remarkably well preserved (Shugars et al., 1993). Although this loop is not struc- tured in the previously described complexes of Nef, it might be involved in the interaction with another as yet unidentified ligand. Interestingly, a recent mutational analysis of Nef showed that a D174A,D175A mutation gave rise to fully stable Nef, which is completely inactive in its down-regulation of CD4 (Aiken et al., 1996).
Assignment of side chain resonances
Methyl groups were assigned using modified versions of the HCCH- COSY and HCCH-TOCSY experiments (Table 2 4 . For larger pro- teins, spectral overlap is usually severe in both HCCH-COSY and HCCH-TOCSY. Therefore, the I3C evolution period, following the I3C isotropic mixing, was replaced by a constant-time HSQC se- quence (Santoro & King, 1992; Van de ven & Philippens, 1992; Vuister & Bax, 1992). In this way, the more favorable relaxation properties of the methyl carbon and proton nuclei could be ex- ploited to achieve sufficient resolution in the second and third frequency dimensions.
S. Grzesiek et al.
Resonance assignments for the aromatic protons of phenylala- nine residues were carried out on a sample of NEFA2-'9 labeled uniformly with I5N and "C, but with "C inverse labeling for phenylalanine (Vuister et al., 1994). The assignments were derived from a combination of two-dimensional homonuclear NOESY and HOHAHA experiments, which were selective for I2C-attached pro- tons in both dimensions (Bax et al., 1994; Vuister et al., 1994).
Assignments of NEFA2-39 were transferred to NEFA2"9.A1s9-'73 in a two-step process. First, assignments of 'HN, "N, "C", and I7Cfi resonances were established by information from the CBCA- (C0)NH and HNCACB experiments carried out on NEFA2-39~A's"'73 and by comparison to the NEFA2"9 data (Table 2a, Fig. 5). Second, assignments for the remaining resonances were transferred to NEFA2-39xA's9-17' by comparing data of the three-dimensional "C- or "N-edited NOESY experiments for both proteins. Further as- signments, in particular for aromatic groups, were derived from a "C-edited NOESY experiment with optimized detection of aro- matic "C and ' H resonances (Table 2c). This separate experiment was necessary because the "C radio-frequency field strength on the 8-mm probe was not sufficient to cover both aliphatic and aromatic I3C resonances at the same time. Similar to the HCCH- COSY and HCCH-TOCSY experiments, a "C-edited NOESY spec- trum with a constant-time 'H-"C HSQC period was also collected, in order to achieve better resolution for methyl groups (Table 2c). A total of 2429 cross-peaks from the various three-dimensional NOESY spectra in Table 2c were assigned for NEFA"39~A's9-173, which served not only to derive NOE distance information, but also to verify and extend previous assignments of side chain resonances.
Stereoassignments and X,-angle restraints
Stereo-assignments and ,yI-restraints for valine and threonine side chains were derived from measurements of the 3-bond J-couplings between side chain I3CY and backbone "C' and "N nuclei as described earlier (Grzesiek et al., 1993; Vuister et al., 1993). Stereo- assignments for leucine methyl groups were derived from a two- dimensional 'H-I3C constant-time HSQC (Vuister & Bax, 1992; Hiroaki et al., 1996) carried out on NEFA2-3"A1s9"73 biosynthet- ically labeled at 10% in "C (Neri et al., 1989).
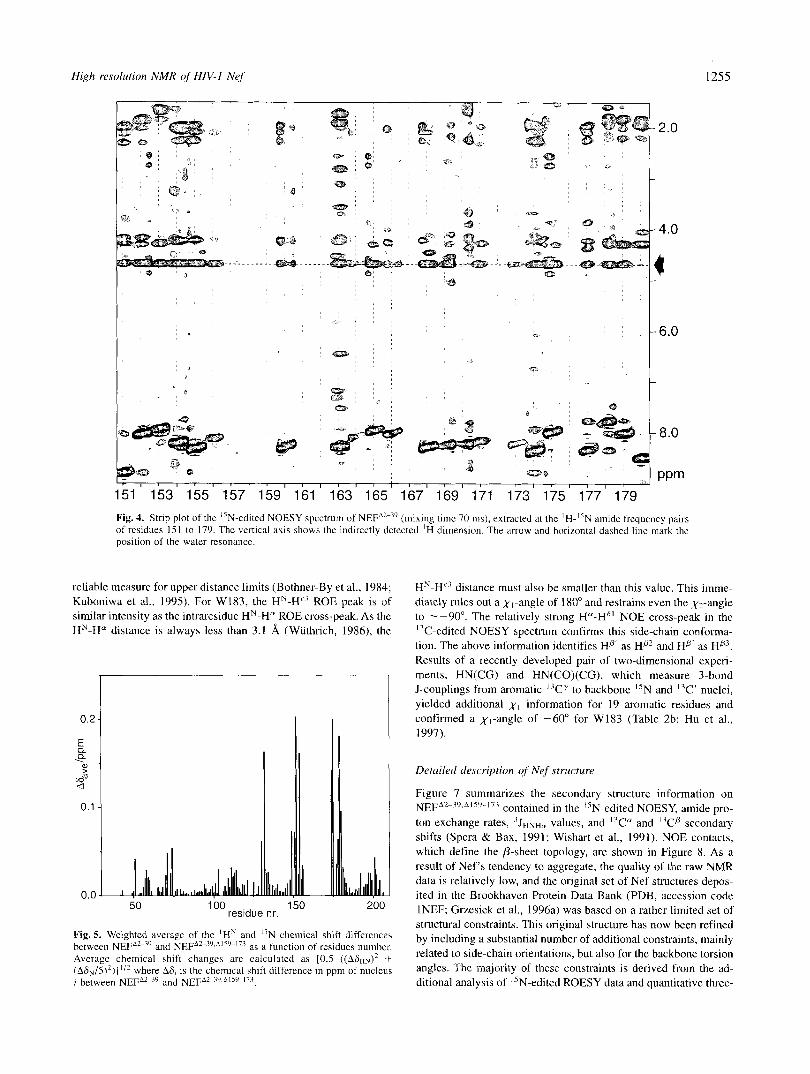
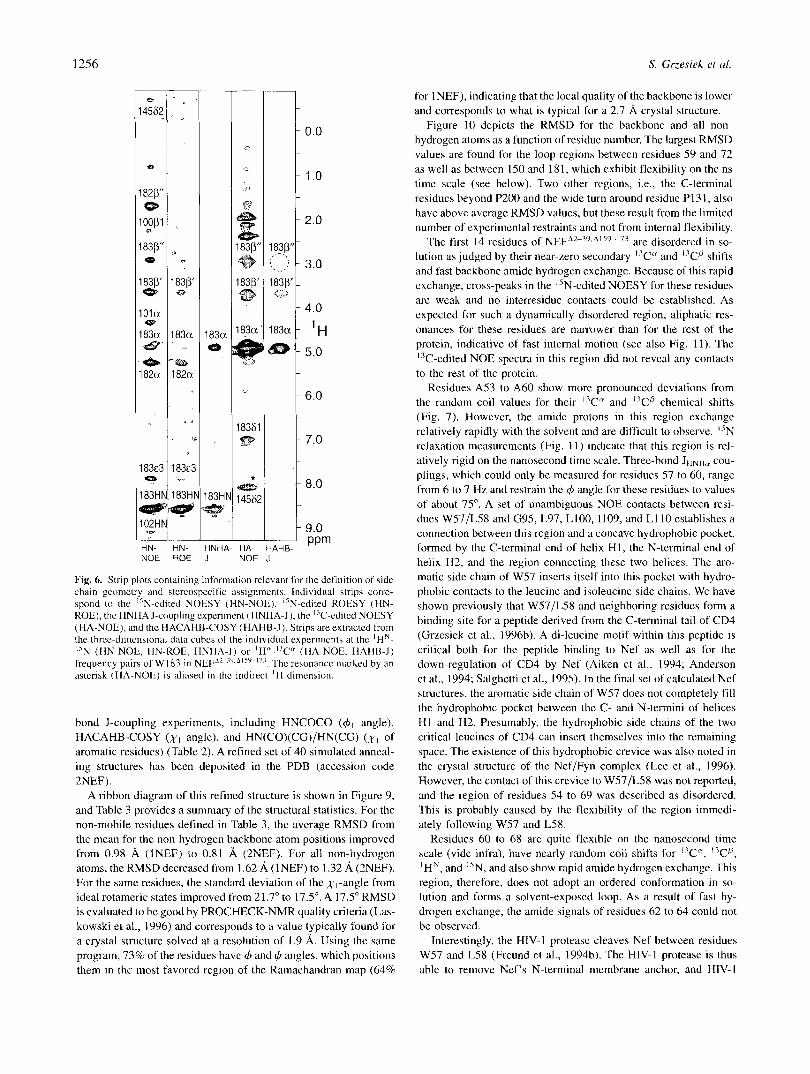
Additional xI-restraints and stereo-specific assignments for Ha- protons were derived for many residues by a combined analysis of data from "N-edited NOESY and ROESY experiments, together with information from HNHA and HAHB quantitative J-correlation experiments and "C-edited NOESY. This is illustrated in Figure 6, which shows strip plots extracted from the corresponding 3D spec- tra at the 'HN,"N, and 'H","C" frequency pairs of residue W183. The ratio of the H" cross-peak to the HN diagonal peak intensity in the HNHA J-correlation experiment indicates that the HN-H" 3-bond J-coupling is larger than 6 Hz. This restrains the +angle for W183 to values smaller than --75", as expected for aP-strand conformation. The ratio of the HP' cross-peak to the H" diagonal peak intensity in the HAHB quantitative J-correlation spectrum indicates a value of >8 Hz for the H"-Hp' 3-bond J-coupling. AS the H F cross-peak is absent in the HAHB experiment, the Ha-HB" J-coupling must be smaller than -4 Hz. Therefore, Hp' is trans with respect to H" and the XI-angle is either "60" or - 180". On the other hand, the "N-edited ROESY shows a cross-peak from the amide proton of W183 to the intraresidue H" proton. In con- trast to NOE, ROE intensities are decreased by indirect magneti- zation transfer during the mixing period and present a much more
High resolution NMR of HIV-I N e j 1255
Fig. 4. Strip plot of the "N-edited NOESY spectrum of NEFA2-'' (mixing timc 70 ms), extracted at thc 'H- '<N amide frequency pairs of rcsidues IS1 to 179. The vertical axis shows (he indirectly dctected 'H dimension. The arrow and horizontal dashcd line mark the position of the water resonance.
reliable measure for upper distance limits (Bothner-By et ai., 1984; Kuboniwa et al., 1995). For W183, the HN-H" ROE peak is of similar intensity as the intraresidue HN-H" ROE cross-peak. As the HN-H" distance is always less than 3.1 A (Wuthrich, 1986), the
0.2
E a a a, . a* d
0.1
0.c 50
O0 residue nr. 150
L
200
Fig. 5. Weighted avcrage of the 'HN and "N chemical shift differcnces as a function of residues number.
Averagc chemical shift changes are calculated as [ O S ((ASHN)' + (AS,/S)')] '" where A6i is the chemical shift difference in ppm of nuclcus
between NEF"2-19 and ~ J E F A Z - ~ ~ . - \ I ~ % I ~ ~
i between NEFA2-39 and pJEF.\2-19.-\lSg-l73
HN-Hf3 distance must also be smaller than this value. This imme- diately rules out a Xyangle of 180" and restrains even the Xz-angle to "90". The relatively strong H"-HS' NOE cross-peak in the I 'C-edited NOESY spectrum confirms this side-chain conforma- tion. The above information identifies HS' as HP2 and HV as HB3. Results of a recently developed pair of two-dimensional experi- ments, HN(CG) and HN(CO)(CG), which measure 3-bond J-couplings from aromatic "CY to backbone "N and I3C' nuclei, yielded additional X , information for 19 aromatic residues and confinned a XI-angle of -60" for W183 (Table 2b; Hu et al., 1997).
Detailed description of Nef structure
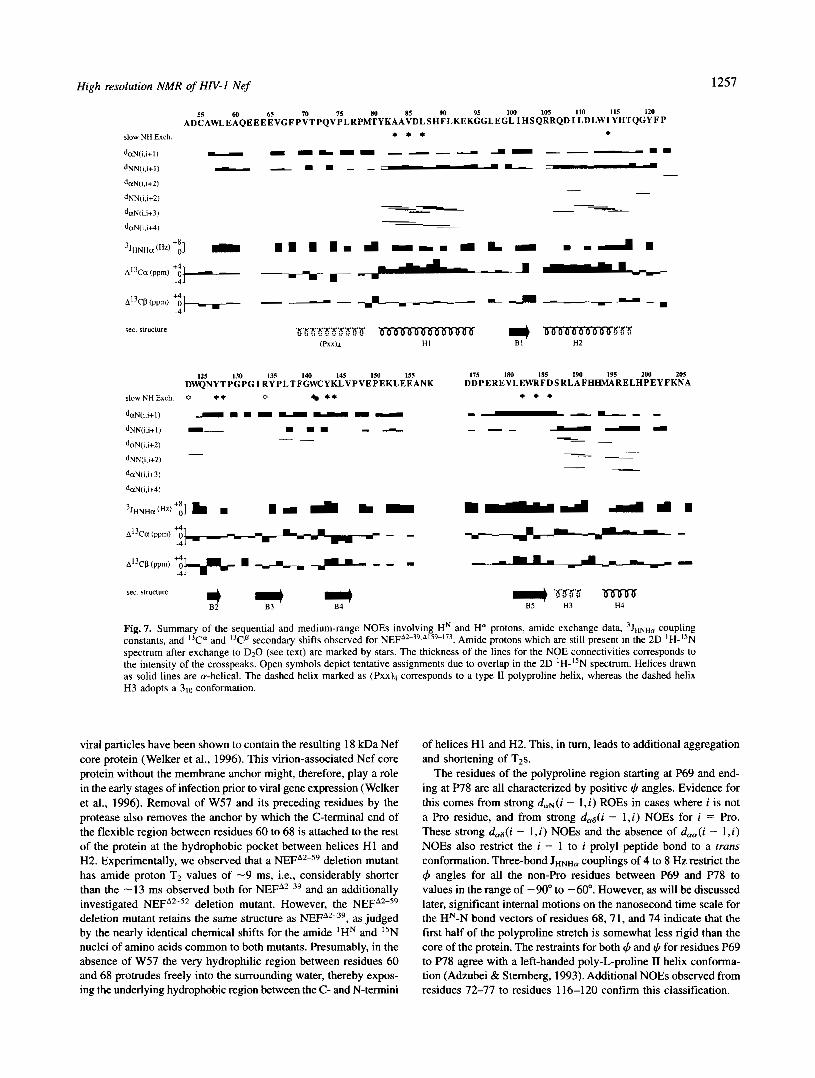
Figure 7 summarizes the secondary structure information on
ton exchange rates, 'JHNHa values, and "CC and "Cfl secondary shifts (Spera & Bax, 1991; Wishart et al., 1991). NOE contacts, which define the /?-sheet topology, are shown in Figure 8. As a result of Nef's tendency to aggregate, the quality of the raw NMR data is relatively low, and the original set of Nef structures depos- ited in the Brookhaven Protein Data Bank (PDB, accession code 1NEF; Grzesiek et al., 1996a) was based on a rather limited set of structural constraints. This original structure has now been refined by including a substantial number of additional constraints, mainly related to side-chain orientations, but also for the backbone torsion angles. The majority of these constraints is derived from the ad- ditional analysis of '%edited ROESY data and quantitative three-
NEFA2&3',"15%I7' contained in the I5N-edited NOESY, amide pro-
1256
I4582 rn
ea
182fi"
I oop1 iD
I 8 3 v em
1838'
lOlu
I83u &- *
I82u
e
183~3 * 183Hr
102Hr - ~
HN- NOE
e 0
1838
183a
-@
1820
,. .
1 8 3 ~
183k
- ..
-INHA- HA- HAHB . .. t ROE J NOE J
0.0
1 .o
2.0
3.0
4.0
'H 5.0
6.0
7.0
8.0
9.0 PPm
Fig. 6. Strip plots concaining information relevant for the definition of side chain geometry and stereospecilk assignments. Individual strips c o r w spond to the "N-edited NOESY (HN-NOT:), '%edited ROESY (HN- ROE), the HNHAJ-coupling experiment (HNHA-J), the "C-editrd NOESY (HA-NOE), and the HACAHR-COSY (HAHB-J). Strips are extracted from the thrce-dimensional data cubes of the individual experiment5 at the 'HN- "N (HN-NOE, HN-ROE, HNHA-J) or 'H"-"C" (HA-NOE, HAHR-J) frequency pairs of W I83 in NEFA2-".A15' 17'. The resonance marked by an asterisk (HA-NOE) i s aliased in the indirect 'H dimension.
bond J-coupling experiments, including HNCOCO (41 angle), HACAHB-COSY (xl angle), and HN(CO)(CG)/HN(CG) (xl of aromatic residues) (Table 2). A refined set of 40 simulated anneal- ing structures has been deposited in the PDB (accession code 2NEF).
A ribbon diagram of this refined structure is shown in Figure 9, and Table 3 provides a summary of the structural statistics. For the non-mobile residues defined in Table 3, the average RMSD from the mean for the non-hydrogen backbone atom positions improved from 0.98 A (INEF) to 0.81 A (2NEF). For all non-hydrogen atoms, the RMSD decreased from I .62 A (INEF) to 1.32 A (2NEF). For the same residues, the standard deviation of the xI-angle from ideal rotameric states improved from 21.7" to 17.5". A 17.5" RMSD is evaluated to he good by PROCHECK-NMR quality criteria (Las- kowski et al., 1996) and corresponds to a value typically found for a crystal structure solved at a resolution of 1.9 A. Using thc same program, 73% of the residues havc 4 and t,h angles, which positions them i n the most favored region of the Ramachandran map (64%
S. Grzesiek et al.
for INEF), indicating that the local quality of the backbone is lower and corresponds to what is typical for a 2.7 A crystal structure.
Figure 10 depicts the RMSD for the backbone and all non- hydrogen atoms as a function of residue number. The largest RMSD values are found for the loop regions between residues 59 and 72 as well as between 150 and 181, which exhibit flexibility on the ns time scale (see below). Two other rcgions, i.e., thc C-telminal residucs beyond P200 and the wide turn around residue P13 I , also have above average RMSD values, hut these result from the limited number of expcrimental restraints and not from internal flexibility.
The first 14 residues of NEFA2~3"~A1s0 are disordered in so- lution as judged by their near-zero secondary "CCr and "Cfi shifts and fast backbone amide hydrogen exchange. Because of this rapid cxchange, cross-peaks in the "N-cdited NOESY for these residues are wcak and no interresidue contacts could be established. As expected for such a dynamically disordered region, aliphatic res- onances for these residues are narrower than for the rest of the protein, indicative of fast internal motion (see also Fig. 11). The "C-edited NOE spectra in this region did not revcal any contacts to the rest of the protein.
Residues AS3 to A60 show more pronounced deviations from the random coil values for their I 'C" and "CO chemical shifts (Fig. 7). However, the amide protons in this region exchange relatively rapidly with the solvent and are difficult to observe. l5N relaxation measurements (Fig. 11) indicate that this rcgion is rel- atively rigid on the nanosecond time scale. Threc-bond .IHNHcr cou- plings, which could only be measured for residues 57 to 60, range from 6 to 7 Hz and restrain the 4 angle for these residues to values of about 75". A set of unambiguous NOE contacts between resi- dues W57/L58 and G95, L97, L100, 1109, and LI 10 establishes a connection between this region and a concavc hydrophobic pocket, formed by the C-terminal end of helix H I , the N-terminal end of helix H2, and the region connecting these two helices. The aro- matic sidc chain of W57 inserts itself into this pocket with hydro- phobic contacts to the leucine and isoleucine sidc chains. We have shown previously that W57/LS8 and neighboring residues form a binding site for a peptide derived from the C-terminal tail of CD4 (Grzesiek et al., 1996b). A di-leucine motif within this peptide is critical both for the peptide binding to Net' as well as for the down-regulation of CD4 by Nef (Aiken et al., 1994; Anderson et al., 1994; Salghetti et al., 1995). In the final set of calculated Nef structures, the aromatic side chain of W57 does not completely fill the hydrophobic pocket between the C- and N-termini of helices H1 and H2. Presumably, the hydrophobic side chains of the two critical leucines of CD4 can insert themselves into the remaining space. The existence of this hydrophobic crevice was also noted in the crystal structure of the Nef/Fyn complex (Lee et al., 1996). However, the conhct of this crevice to W57/L58 was not reported, and the region of residues 54 to 69 was described as disordered. This is probably caused by the tlexibility of the region immedi- ately following W57 and LS8.
Residues 60 to 68 are quite flexible on the nanosecond time scale (vide infra), have nearly random coil shifts for "CCr, "C@, 'HN, and "N, and also show rapid amide hydrogen exchange. This rcgion, therefore, does not adopt an ordered conformation in so- lution and forms a solvent-exposed loop. As a result of fast hy- drogen exchange, the amide signals of residues 62 to 64 could not be observed.
Interestingly, the HIV-1 proteasc cleaves Nef between residues W57 and L58 (Freund et al., 1994b). The HIV-1 protease is thus able to remove Nef's N-terminal membrane anchor, and HTV-1
High resolution NMR of HW-I Nef 1257
ADCAWLEAQEEEEVGFPVTPQVPLRPMTYKAAVDLSHFLKEKGGLEGLIHSQRRQDILDLWIYHTQGYFP 55 60 65 70 75 80 85 90 95 100 105 110 115 120
sec. structure
125 130 135 140 145 150 155 DWQNYTPGPGIRYPLTFGWCYKLVPVEPEKLEEANK DDPEREVLEWRFDSRLAFHHMARELHPEYFKNA
175 180 185 190 195 200 205
slow NHExch. 0 ** 0 ** * * *
sec. structure
B2 8 3 8 4
I-
Fig. 7. Summary of the sequential and medium-range NOEs involving HN and H" protons, amide exchange data, 3JHNHm coupling constants, and I3C" and I3Cp secondary shifts observed for NEFA2-39."159"73. Amide protons which are still present in the 2D 'H-I5N spectrum after exchange to D20 (see text) are marked by stars. The thickness of the lines for the NOE connectivities corresponds to the intensity of the crosspeaks. Open symbols depict tentative assignments due to overlap in the 2D lH-I5N spectrum. Helices drawn as solid lines are a-helical. The dashed helix marked as (Pxx)~ corresponds to a type I1 polyproline helix, whereas the dashed helix H3 adopts a 3 1 ~ conformation.
viral particles have been shown to contain the resulting 18 kDa Nef core protein (Welker et al., 1996). This virion-associated Nef core protein without the membrane anchor might, therefore, play a role in the early stages of infection prior to viral gene expression (Welker et al., 1996). Removal of W57 and its preceding residues by the protease also removes the anchor by which the C-terminal end of the flexible region between residues 60 to 68 is attached to the rest of the protein at the hydrophobic pocket between helices HI and H2. Experimentally, we observed that a NEFA2-59 deletion mutant has amide proton T2 values of -9 ms, i.e., considerably shorter than the -13 ms observed both for NEFA2-39 and an additionally investigated NEFA2-52 deletion mutant. However, the NEFA2-59 deletion mutant retains the same structure as NEFA"39, as judged by the nearly identical chemical shifts for the amide IHN and I5N nuclei of amino acids common to both mutants. Presumably, in the absence of W57 the very hydrophilic region between residues 60 and 68 protrudes freely into the surrounding water, thereby expos- ing the underlying hydrophobic region between the C- and N-termini
of helices HI and H2. This, in turn, leads to additional aggregation and shortening of T2s.
The residues of the polyproline region starting at P69 and end- ing at W8 are all characterized by positive $ angles. Evidence for this comes from strong daN(i - 1.i) ROES in cases where i is not a Pro residue, and from strong d,a(i - 1,i) NOEs for i = Pro. These strong d,a(i - 1, i ) NOEs and the absence of d,,(i - 1, i ) NOEs also restrict the i - 1 to i prolyl peptide bond to a trans conformation. Three-bond JmHa couplings of 4 to 8 Hz restrict the C,+ angles for all the non-Pro residues between P69 and W8 to values in the range of -90" to -60". However, as will be discussed later, significant internal motions on the nanosecond time scale for the HN-N bond vectors of residues 68,71, and 74 indicate that the first half of the polyproline stretch is somewhat less rigid than the core of the protein. The restraints for both C,+ and I) for residues P69 to W8 agree with a left-handed poly-L-proline I1 helix conforma- tion (Adzubei & Stemberg, 1993). Additional NOEs observed from residues 72-77 to residues 116-120 confirm this classification.
1258 S. Grzesiek et al.
\ >N-C
\c=o 0
o= c 0
\C=O H-N \c=o 0 0 0
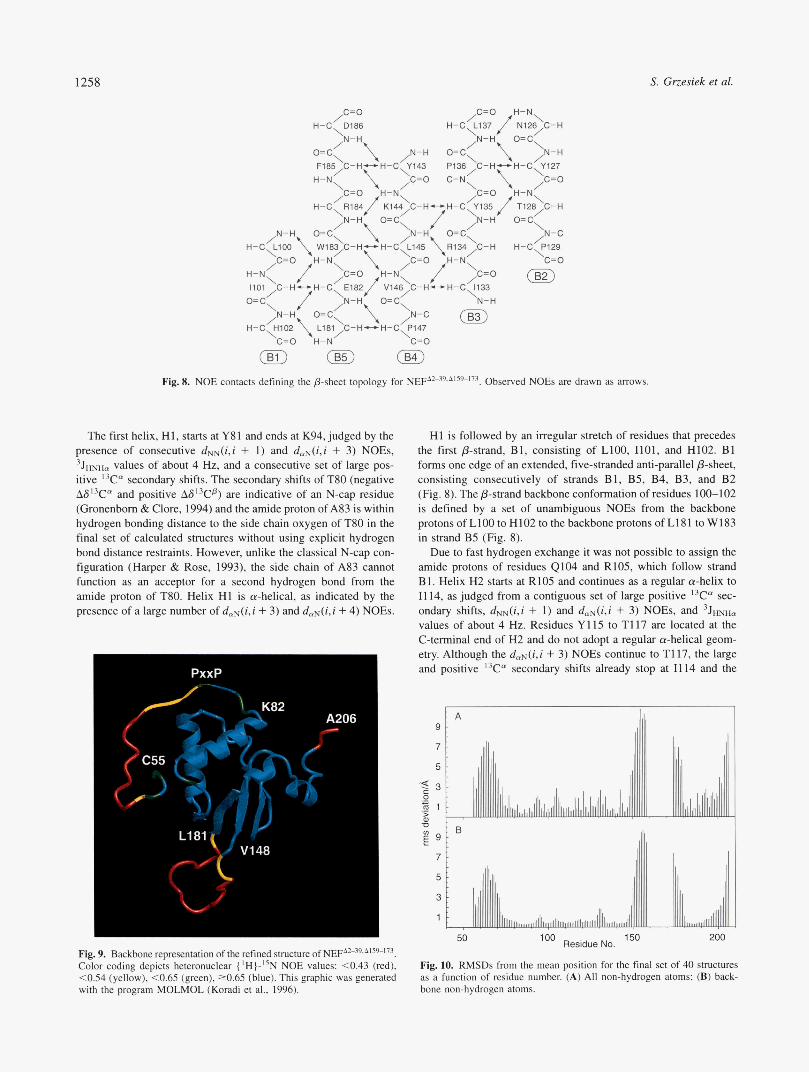
Fig. 8. NOE contacts defining the P-sheet topology for NEFA2-39,A'59-173. Observed NOEs are drawn as arrows.
The first helix, H1, starts at Y81 and ends at K94, judged by the presence of consecutive dNN(i.i + 1) and d,N(i,i + 3) NOEs, 3JmHn values of about 4 H z , and a consecutive set of large pos- itive I3Cn secondary shifts. The secondary shifts of T80 (negative AS'3Ca and positive are indicative of an N-cap residue (Gronenborn & Clore, 1994) and the amide proton of A83 is within hydrogen bonding distance to the side chain oxygen of T8O in the final set of calculated structures without using explicit hydrogen bond distance restraints. However, unlike the classical N-cap con- figuration (Harper & Rose, 1993), the side chain of A83 cannot function as an acceptor for a second hydrogen bond from the amide proton of T80. Helix HI is a-helical, as indicated by the presence of a large number of dmN(i,i + 3) and daN(i,i + 4) NOEs.
I PXXP
I1 48
HI is followed by an irregular stretch of residues that precedes the first @-strand, B1, consisting of LIOO, 1101, and H102. B1 forms one edge of an extended, five-stranded anti-parallel @-sheet, consisting consecutively of strands B1, B5, B4, B3, and B2 (Fig. 8). The @-strand backbone conformation of residues 100-102 is defined by a set of unambiguous NOEs from the backbone protons of LlOO to H102 to the backbone protons of L181 to W183 in strand B5 (Fig. 8).
Due to fast hydrogen exchange it was not possible to assign the amide protons of residues 4104 and R105, which follow strand B1. Helix H2 starts at R105 and continues as a regular a-helix to I1 14, as judged from a contiguous set of large positive I3Ca sec- ondary shifts, dNN(i,i + 1) and d&i,i + 3) NOEs, and 3J-, values of about 4 Hz. Residues Y115 to T117 are located at the C-terminal end of H2 and do not adopt a regular a-helical geom- etry. Although the daN(i,i + 3) NOEs continue to T117, the large and positive I3Ca secondary shifts already stop at I114 and the
50 Fig. 9. Backbone representation of the refined structure of NEF'"39*A'59"73. Color coding depicts heteronuclear [ 'H}-"N NOE values: c0.43 (red), c0.54 (yellow), <0.65 (green), 20.65 (blue). This graphic was generated with the program MOLMOL (Koradi et al., 1996).
O0 Residue No. 150 200
Fig. 10. RMSDs from the mean position for the final set of 40 structures as a function of residue number. (A) All non-hydrogen atoms; (B) back- bone non-hydrogen atoms.
High resolution NMR of HIV-1 Nef
Table 3. Structural statistics a
RMSDs from experimental distance restraints (A) All (818) 0.064 ? 0.003
Intraresidue (70) 0.042 ? 0.006 Interresidue sequential ( l i - j l = 1) (338) 0.069 ? 0.007 Interresidue short range (1 < I i - j l 5 5) (101) 0.088 -C 0.006 Interresidue long range ( l i - j l > 5) (245) 0.053 % 0.006 H-bonds (64)b 0.043 2 0.010
RMSDs from 3JHNH, coupling constants (Hz) (91) 0.61 ? 0.07 RMSDs from experimental dihedral restraints (") (157)' 0.40 2 0. I5 RMSDs from experimental secondary shifts (ppm)
1 T n (93) 1.31 ? 0.05 "CP (91) 1.29 ? 0.07
Bonds (A) (2270) 0.004 ? 0.0001 Angles (") (4101) 0.47 2 0.01 Impropers (") (1 260) 0.39 ? 0.02
Deviations from idealized covalent geometryd
Eu (kcal/mol)' -558 ? 16 Coordinate precision (A)f
Backbone non-hydrogen atoms 0.81 2 0.19 All non-hydrogen atoms 1.32 ? 0.18
Percentage of non-gly, non-pro residues in most favored region of Ramachandran plane 72.5
xI pooled standard deviation (") 17.5 x2 pooled standard deviation (") 15.6
PROCHECK quality indicators8
aThese statistics comprise the ensemble of the final 40 simulated an- nealing structures. Individual simulated annealing structures are fitted to each other using residues 76 to 94, 97 to 102, 106 to 147, 181 to 191, and 194 to 199. The number of the various constraints is given in parentheses.
bFor each backbone hydrogen bond constraint, there are two distance restraints: ~ H . o , 1.7-2.5 A, rN.0, 2.3-3.5 A.
'These comprise 78 #J restraints from I3C'-I3C' J couplings (which partially duplicate the 3JHNH,-derived restraints), 10 $, 55 XI. and 14 aromatic x2 angles.
dThe improper torsion restraints serve to maintain planarity and chirality. eEu is the Lennard-Jones van der Waals energy calculated with the
CHARMM empirical energy function (Brooks et al., 1983) and is not included in the target function for simulated annealing and restrained min- imization.
'The coordinate precision is defined as the average rms difference be- tween the individual simulated annealing structures and the mean coordi- nates. Values are reported for residues 58, 72-95, 97-102, 106-148, 181- 191, 194-202, Le., for residues that do not exhibit large amplitude internal motions on the nanosecond time scale (Fig. 9)
gThese values are calculated with the program PROCHECK-NMR (Laskowski et al., 1996). Values are reported for the non-mobile residues.'
3JHNHc, value of 9.2 Hz for T117 constrains the +-angle for this residue to - 120 ? 20".
Helix H2 is followed by a stretch of irregular structure contain- ing a helical turn at D123, which is immediately followed by the second /?-strand, B2. It consists of residues N126, Y127, and T128, and forms the other edge of the antiparallel /?-sheet (Fig. 8). Its /?-strand secondary structure is derived from a set of NOEs from its backbone protons to the backbone protons of B3 (Fig. 8), as well as from the strongly downfield-shifted I3Cp resonances of N126 and Y127 (Fig. 7). B2 is followed by an irregular, wide turn consisting of residues P129, (3130, P131, and G132.
The third anti-parallel /?-strand, B3, consists of residues I133 to L137, which are hydrogen bonded to both B2 and B4, as evidenced by a series of NOE connectivities between backbone protons in all three strands (Fig. 8). Only two to three residues per strand par-
1 .o
- (II - 0.5 F
0.0
(II
+ ;; 0.1
0.0
0.8 W
P 0.4
0.0
1259
I I
50 loo Residue No. 150 200
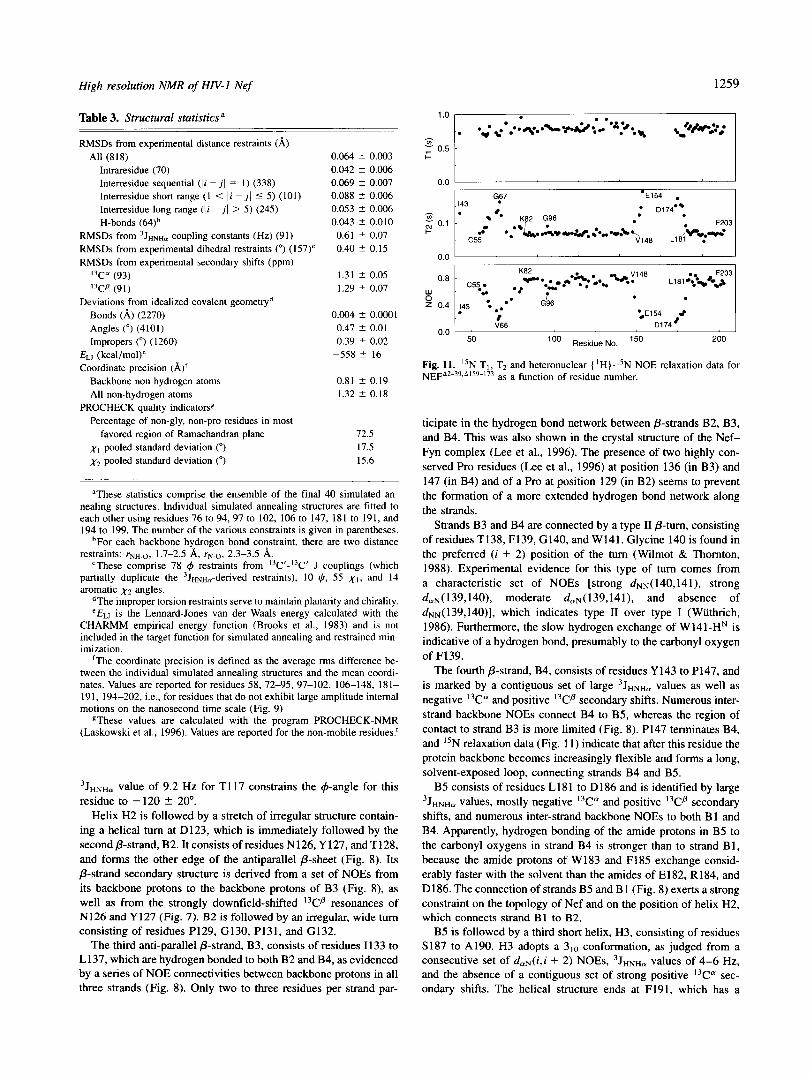
Fig. 11. "N T I , Tz and heteronuclear { 'H)-"N NOE relaxation data for NEFA2-39."159-173 as a function of residue number.
ticipate in the hydrogen bond network between P-strands B2, B3, and B4. This was also shown in the crystal structure of the Nef- Fyn complex (Lee et al., 1996). The presence of two highly con- served Pro residues (Lee et al., 1996) at position 136 (in B3) and 147 (in B4) and of a Pro at position 129 (in B2) seems to prevent the formation of a more extended hydrogen bond network along the strands.
Strands B3 and B4 are connected by a type I1 /?-turn, consisting of residues T138, F139, G140, and W141. Glycine 140 is found in the preferred (i + 2) position of the turn (Wilmot & Thornton, 1988). Experimental evidence for this type of turn comes from a characteristic set of NOEs [strong dNN(140,141), strong daN(139,14O), moderate daN(139,141), and absence of d,N(139,140)], which indicates type 11 over type I (Wiithrich, 1986). Furthermore, the slow hydrogen exchange of W141-HN is indicative of a hydrogen bond, presumably to the carbonyl oxygen of F139.
The fourth /?-strand, B4, consists of residues Y143 to P147, and is marked by a contiguous set of large 3 J ~ ~ ~ m values as well as negative I3Ca and positive I3Cp secondary shifts. Numerous inter- strand backbone NOEs connect B4 to B5, whereas the region of contact to strand B3 is more limited (Fig. 8). P147 terminates B4, and I5N relaxation data (Fig. 11) indicate that after this residue the protein backbone becomes increasingly flexible and forms a long, solvent-exposed loop, connecting strands B4 and B5.
B5 consists of residues L18 1 to Dl 86 and is identified by large 3 J ~ ~ ~ c , values, mostly negative I3Cc" and positive I3Cp secondary shifts, and numerous inter-strand backbone NOEs to both B1 and B4. Apparently, hydrogen bonding of the amide protons in B5 to the carbonyl oxygens in strand B4 is stronger than to strand B1, because the amide protons of W183 and F185 exchange consid- erably faster with the solvent than the amides of E182, R184, and D186. The connection of strands B5 and B1 (Fig. 8) exerts a strong constraint on the topology of Nef and on the position of helix H2, which connects strand B1 to B2.
B5 is followed by a third short helix, H3, consisting of residues S 187 to A190. H3 adopts a 310 conformation, as judged from a consecutive set of dnN(i.i + 2) NOEs, 3 J ~ ~ ~ c , values of 4-6 Hz, and the absence of a contiguous set of strong positive I3Cm sec- ondary shifts. The helical structure ends at F191, which has a
1260 S. Grzesiek et al.
3 J ~ ~ ~ n value of 9.9 Hz. This constrains the F191 &angle to -- 120”. Residues F191 to H193 form a kink connecting helix H3 to H4. The amide proton of H193 in this kink is readily accessible to water and could not be observed because of fast hydrogen exchange.
Helix H4 (M194 to L198) immediately follows this kink. The absence of dmN(i,i + 2) NOEs, two daN(i, i + 3) NOEs, and 3JmH, values of 4-6 Hz characterize it as a-helical. ”N relaxation data indicate that the backbone of the protein remains relatively rigid through residue 203 (Fig. 11).
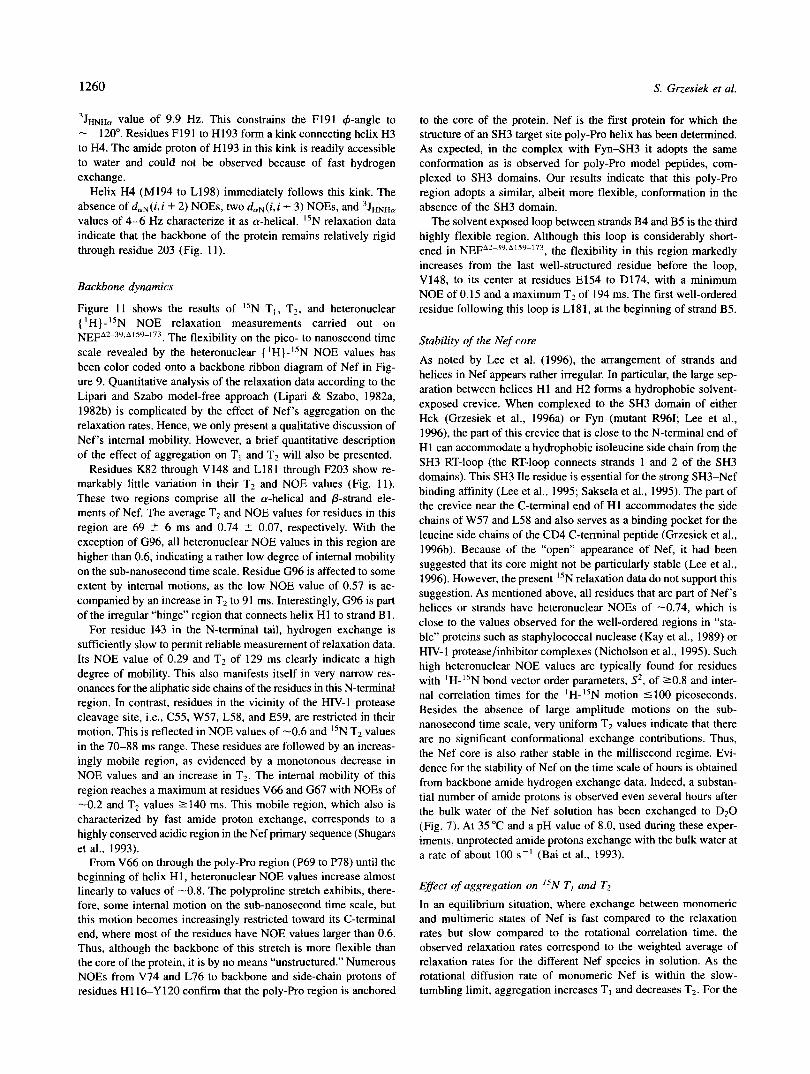
Backbone dynamics
Figure 11 shows the results of “N T I , T2, and heteronuclear ( ‘H)-I5N NOE relaxation measurements carried out on NEFA2-39,A’59”73. The flexibility on the pico- to nanosecond time scale revealed by the heteronuclear (‘H)-”N NOE values has been color coded onto a backbone ribbon diagram of Nef in Fig- ure 9. Quantitative analysis of the relaxation data according to the Lipari and Szabo model-free approach (Lipari & Szabo, 1982a, 1982b) is complicated by the effect of Nef’s aggregation on the relaxation rates. Hence, we only present a qualitative discussion of Nef’s internal mobility. However, a brief quantitative description of the effect of aggregation on TI and T2 will also be presented.
Residues K82 through V148 and L181 through F203 show re- markably little variation in their T2 and NOE values (Fig. 11). These two regions comprise all the a-helical and @-strand ele- ments of Nef. The average T2 and NOE values for residues in this region are 69 5 6 ms and 0.74 ? 0.07, respectively. With the exception of G96, all heteronuclear NOE values in this region are higher than 0.6, indicating a rather low degree of internal mobility on the sub-nanosecond time scale. Residue G96 is affected to some extent by internal motions, as the low NOE value of 0.57 is ac- companied by an increase in T2 to 91 ms. Interestingly, G96 is part of the irregular “hinge” region that connects helix HI to strand B 1.
For residue 143 in the N-terminal tail, hydrogen exchange is sufficiently slow to permit reliable measurement of relaxation data. Its NOE value of 0.29 and T2 of 129 ms clearly indicate a high degree of mobility. This also manifests itself in very narrow res- onances for the aliphatic side chains of the residues in this N-terminal region. In contrast, residues in the vicinity of the HIV-1 protease cleavage site, Le., C55, W57, L58, and E59, are restricted in their motion. This is reflected in NOE values of -0.6 and ”N T2 values in the 70-88 ms range. These residues are followed by an increas- ingly mobile region, as evidenced by a monotonous decrease in NOE values and an increase in T2. The internal mobility of this region reaches a maximum at residues V66 and G67 with NOEs of -0.2 and T2 values 2140 ms. This mobile region, which also is characterized by fast amide proton exchange, corresponds to a highly conserved acidic region in the Nef primary sequence (Shugars et al., 1993).
From V66 on through the poly-Pro region (P69 to P78) until the beginning of helix H1, heteronuclear NOE values increase almost linearly to values of -0.8. The polyproline stretch exhibits, there- fore, some internal motion on the sub-nanosecond time scale, but this motion becomes increasingly restricted toward its C-terminal end, where most of the residues have NOE values larger than 0.6. Thus, although the backbone of this stretch is more flexible than the core of the protein, it is by no means “unstructured.” Numerous NOEs from V74 and L76 to backbone and side-chain protons of residues H116-Y120 confirm that the poly-Pro region is anchored
to the core of the protein. Nef is the first protein for which the structure of an SH3 target site poly-Pro helix has been determined. As expected, in the complex with Fyn-SH3 it adopts the same conformation as is observed for poly-Pro model peptides, com- plexed to SH3 domains. Our results indicate that this poly-Pro region adopts a similar, albeit more flexible, conformation in the absence of the SH3 domain.
The solvent exposed loop between strands B4 and B5 is the third highly flexible region. Although this loop is considerably short-
increases from the last well-structured residue before the loop, V148, to its center at residues E154 to D174, with a minimum NOE of 0.15 and a maximum T2 of 194 ms. The first well-ordered residue following this loop is L181, at the beginning of strand B5.
ened in NEFA2-39.A159-173 , the flexibility in this region markedly
StabiliQ of the Nef core
As noted by Lee et al. (1996), the arrangement of strands and helices in Nef appears rather irregular. In particular, the large sep- aration between helices H1 and H2 forms a hydrophobic solvent- exposed crevice. When complexed to the SH3 domain of either Hck (Grzesiek et al., 1996a) or Fyn (mutant R96I; Lee et al., 1996), the part of this crevice that is close to the N-terminal end of H1 can accommodate a hydrophobic isoleucine side chain from the SH3 RT-loop (the RT-loop connects strands 1 and 2 of the SH3 domains). This SH3 Ile residue is essential for the strong SH3-Nef binding affinity (Lee et al., 1995; Saksela et al., 1995). The part of the crevice near the C-terminal end of H1 accommodates the side chains of W57 and L58 and also serves as a binding pocket for the leucine side chains of the CD4 C-terminal peptide (Grzesiek et al., 1996b). Because of the “open” appearance of Nef, it had been suggested that its core might not be particularly stable (Lee et al., 1996). However, the present ”N relaxation data do not support this suggestion. As mentioned above, all residues that are part of Nef‘s helices or strands have heteronuclear NOEs of -0.74, which is close to the values observed for the well-ordered regions in “sta- ble” proteins such as staphylococcal nuclease (Kay et al., 1989) or HIV-1 protease/inhibitor complexes (Nicholson et al., 1995). Such high heteronuclear NOE values are typically found for residues with ‘H-”N bond vector order parameters, S2, of 20.8 and inter- nal correlation times for the lH-”N motion 5100 picoseconds. Besides the absence of large amplitude motions on the sub- nanosecond time scale, very uniform T2 values indicate that there are no significant conformational exchange contributions. Thus, the Nef core is also rather stable in the millisecond regime. Evi- dence for the stability of Nef on the time scale of hours is obtained from backbone amide hydrogen exchange data. Indeed, a substan- tial number of amide protons is observed even several hours after the bulk water of the Nef solution has been exchanged to D 2 0 (Fig. 7). At 35 “C and a pH value of 8.0, used during these exper- iments, unprotected amide protons exchange with the bulk water at a rate of about 100 s - ’ (Bai et al., 1993).
Effect of aggregation on ‘’N T , and Tz
In an equilibrium situation, where exchange between monomeric and multimeric states of Nef is fast compared to the relaxation rates but slow compared to the rotational correlation time, the observed relaxation rates correspond to the weighted average of relaxation rates for the different Nef species in solution. As the rotational diffusion rate of monomeric Nef is within the slow- tumbling limit, aggregation increases TI and decreases T2. For the
High resolution NMR of H N - I Nef 1261
sake of simplicity, we assume isotropic tumbling with a rotational correlation time T , proportional to the molecular weight and a simple monomer-dimer equilibrium. Then the relaxation rates can be expressed as:
Robs = XR(Tc) + (1 - x)R(2Tc) (1)
where R corresponds to a relaxation rate, e.g., l / T I or 1/T2, Robs is the observed rate, x the fraction of molecules in the monomeric state, R(T,) the monomer relaxation rate, and R(27,) the dimer relaxation rate. An estimate of x and T , can then be obtained by solving Equation 1 simultaneously for observed values of TI and T2. The average of all measured TI and T2 values for residues in Nef with a heteronuclear lSN-( 'H) NOE of 20.7 are 790 and 69 ms, respectively. For such residues of the Nef core, the pre- dominant effect of internal motions on the relaxation rates l / T l and 1/T2 is a scaling by the factor S 2 (Kay et al., 1989). Using standard equations for T I and T2 (Kay et al., 1989), scaling by S 2 = 0.85 (which is typical for well-ordered residues in globular proteins), a value of - 160 ppm for the I5N chemical shielding anisotropy, and a IHN-IsN distance of 1.02 A, the simultaneous solution of Equation 1 for T I and T2 yields T , = 7.5 ns and x = 0.54. This T , value is consistent with the rotational correlation time expected for the 17.8 kDa monomeric NEFA2-39.A'59-'73 mutant at 35 "C. For a Nef concentration of 0.6 mM, the value of x corre- sponds to a dissociation constant for the Nef dimer of 0.7 mM. This agrees with the observation that the amide proton T2 values of NEFA2-399,A'"-'73 at 0.1 mM are in the range expected for a 18 kDa monomer, whereas values at a 1 mM concentration are approxi- mately twofold smaller. The value of the dimerization constant is close to the 0.6 mM concentration of Nef, which was used through- out the experiments. This means that -50% of the molecules are in the monomeric form, and 50% are dimeric. The apparent mo- lecular weight of Nef under those conditions is, therefore, -27 kDa. At this stage, it remains unclear whether Nef exerts its biological function(s) as a monomer, or whether the tendency to form dimers or higher order aggregates is functionally significant.
Materials and methods
Sample preparation
Expression, labeling, and purification of the various Nef con- structs, i.e., full-length Nef, deletion of residues 2-39 (NEFA2-"), 2-52 (NEFA2-"), 2-59 (NEFA2-59), and 2-39 + 159-173
siek et al., 1996a). A summary of the sample preparations is pro- vided in Table 1.
In order to identify slowly exchanging amide protons, a sample of "N-labeled NEFA2-39 was lyophilized at pH 8.0 and redissolved in D20. After a period of 19 h at 6 "C and 1 h at 35 "C, a 2D 'H-I5N spectrum with water flip-back (Grzesiek & Bax, 1993b) was re- corded. Amide resonances still present in this spectrum are marked by stars in Figure 7.
(m~A2-39.159-173 ) was carried out as described previously (Grze-
NMR spectroscopy
All NMR spectra were recorded at 35 "C on a Bruker AMX600 or DMX600 spectrometer, equipped with an 8 mm self-shielded z-gradient probe (Nalorac). Relevant parameters and literature ref- erences for the various experiments carried out on Nef are col- lected in Table 2.
All NMR data were processed with the software package NMRPipe (Delaglio et al., 1995). Manual peak picking of the processed spectra was achieved with the program PIPP (Garrett et al., 1991). Combination of the frequency information and anal- ysis of the intensity information contained in the cross-peaks of the various spectra was performed using in-house routines.
Structure calculation
Structures were calculated using a modified version (Garrett et al., 1994; Kuszewski et al., 1995) of the program X-PLOR (Briinger, 1992) and hybrid distance geometry/simulated annealing proto- cols (Nilges et al., 1988) as described previously (Grzesiek et al., 1996al.
Supplementary material in Electronic Appendiv
The electronic appendix contains three tables of chemical shift assignments for backbone and side chain 'H, 15N, and I3C reso- nances for the constructs HIV-1 NEFA2-39, NEFA2-39,A's9-'73, and NEFA2-39,A's9"73 in complex with Hck SH3.
Acknowledgments
This work was supported by the AIDS Targeted Anti-Viral Program of the Office of the Director of the National Institutes of Health. We thank Manus Clore for help with the structure calculation, Rolf Tschudin for technical support, and Frank Delaglio and Dan Garrett for software support. J.-S.H. is supported by a postdoctoral fellowship from the Cancer Research Insti- tute, New York, NY.
References
Adzubei AA, Sternberg MJE. 1993. Left-handed polyproline I1 helices com- monly occur in globular proteins. J Mol Biol 229472-493.
Ahmad N, Venkatesan S. 1988. Nef protein of HIV-1 is a transcriptional re- pressor of HIV-1 LTR. Science 241:1481-1485.
Aiken C, Konner J, Landau NR, Lenburg ME, Trono D. 1994. Nef induces CD4 endocytosis: Requirement for a critical di-leucine motif in the memhrane- proximal CD4 cytoplasmic domain. Cell 76:853-864.
Aiken C, Krause L, Chen YL, Trono D. 1996. Mutational analysis of HIV-1 Nef Identification of two mutants that are temperature-sensitive for CD4 down- regulation. Virology 217293-300.
Anderson SJ, Lenburg M, Landau NR, Garcia JV. 1994. The cytoplasmic do- main of CD4 is sufficient for its down-regulation from the cell surface by human immunodeficiency virus type 1 Nef. J virol 683092-3101.
Anglister J, Grzesiek S, Wang AC, Ren H, Klee CB, Bax A. 1994. 'H "C "N nuclear magnetic resonance backbone assignments and secondary structure of human calcineurin B. Biochemistry 33:3540-3547.
Bai Y, Milne JS, Mayne L, Englander SW. 1993. Primary structure effects on
Bax A, Clore GM, Driscoll PC, Gronenborn AM, Ikura M, Kay LE. 1990a. peptide group hydrogen exchange. Proteins Struct Funct Genet 1775-86.
Practical aspects of proton-carbon-carbon-proton three-dimensional corre- lation spectroscopy of "C-labeled proteins. J Mugn Reson 87620-627.
Bax A, Clore GM, Gronenborn AM. 1990b. 'H-'H correlation via isotropic mixing of "C magnetization: A new three-dimensional approach for as- signing 'H and "C spectra of I3C-enriched proteins. J Mugn Reson 88:425- 431.
Bax A, Grzesiek S, Gronenborn AM, Clore GM. 1994. Isotope-filtered 2D HOHAHA spectroscopy of a peptide-protein complex using heteronuclear Hartmann-Hahn dephasing. J Magn Reson Ser A 106269-273.
Benson RE, Sanfridson A, Ottinger JS, Doyle C, Cullen BR. 1993. Downreg- ulation of cell-surface CD4 expression by simian immunodeficiency virus Nef prevents viral super infection. J Exp Med 1771561-1566.
Bothner-By AA, Stephens RL, Lee J , Warren CD, Jeanloz RW. 1984. Structure determination of a Tetrasaccharide: Transient nuclear overhauser effects in the rotating frame. J Am Chem Soc 106:811-813.
Brooks BR, Bruccoleri RE, Olafson BD, States DJ, Swaminathan S, Karplus M.
dynamics calculations. J Comput Chem 4187-217. 1983. CHAR": A program for macromolecular energy minimization and
1262 S. Grzesiek et al.
Briinger AT. 1992. X-PLOR Version 3.1: A system for crystallography and NMR. New Haven, Connecticut: Yale University.
Cheng-Mayer C, Iannello P, Shaw K, Luciw PA, Levy JA. 1989. Differential effects of nef on HIV replication: Implications for viral pathogenesis in the host. Science 246 1629-1632.
Chowers MY, Spina CA, Kwoh TJ, Fitch NJ, Richman DD, Guatelli IC. 1994. Optimal infectivity in vitro of human immunodeficiency virus type 1 re- quires an intact nef gene. Virology 68:2906-2914.
Chowers MY, Pandori MW, Spina CA, Richman DD, Guatelli JC. 1995. The growth advantage conferred by HIV-I nef is determined at the level of viral DNA formation and is independent of CD4 downregulation. Wrology 212:45 1- 457.
Cullen BR. 1994. The role of Nef in the replication cycle of the human and simian immunodeficiency viruses. Wrology 205: 1-6.
Daniel MD, Kirchhoff F, Czajak SC, Sehgal PK, Desrosiers RC. 1992. Protec- tive effects of a live attenuated SIV vaccine with a deletion in the nef gene. Science 2581938-1941.
Deacon NJ, Tsykin A, Solomon A, Smith K, Ludford-Menting M, Hooker DJ, McPhee DA, Greenway AL, Ellett A, Chatfield C, Lawson VA, Crowe S, Maerz A, Sonza S, Learmont J, Sullivan JS, Cunnningham A, Dwyer D, Dowton D, Mills J. 1995. Genomic structure of an attenuated quasi species of HIV-l from a blood transfusion donor and recipients. Science 270:988- 991.
Delaglio F, Grzesiek S, Vuister GW, Zhu G, Pfeifer J, Bax A. 1995. NMRPipe: A multidimensional spectral processing system based on UNIX pipes. J Biomol NMR 6277-293.
deRonde A, Klaver B, Keulen W, Smit L, Goudsmit J. 1992. Natural HIV-1 Nef accelerates virus replication in primary human lymphocytes. Virology 188:391-395.
Foster JL, Anderson SJ, Frazier AL, Garcia JV. 1994. Specific suppression of human CD4 surface expression by Nef from the pathogenic simian immu- nodeficiency virus SIVmac239open. Virology 201:373-379.
Freund J, Kellner R, Houthaeve T, Kalhitzer HR. 1994a. Stability and proteo- . lytic domains of Nef protein from human immunodeficiency virus (HIV)
type I . Eur J Biochem 221:811-819. Freund J, Kellner R, Konvalinka J, Wolber V, Krausslich HG, Kalbitzer HR.
1994b. A possible regulation of negative factor (Nef) activity of human immunodeficiency virus type 1 by the viral protease. Eur J Biochem 223589- 593.
Garcia JV, Miller AD. 1991. Serine phosphorylation-independent downregula- tion of cell-surface CD4 by nef. Nature 350508-5 1 I.
Garcia JV, Alfano J, Miller AD. 1993. The negative effect of human immuno- deficiency virus type 1 Nef on cell surface CD4 expression is not species specific and requires the cytoplasmic domain of CD4. J Virol 6 7 15 11-1516.
Garrett DS, Powers R, Gronenbom AM, Clore GM. 1991. A common sense approach to peak picking in two-, three-, and four-dimensional spectra using automatic computer analysis of contour diagrams. J Magn Reson 95:214- 220.
Garrett DS, Kuszewski J, Hancock, TJ, Lodi PJ, Vuister GW, Gronenborn AM, Clore GM. 1994. The impact of direct refinement against three-bond HN- CaH coupling constants on protein structure determination by NMR. J Magn Reson 810499-103.
Goldsmith MA, Warmerdam MT, Atchison RE, Miller MD, Greene WC. 1995. Dissociation of the CD4 downregulation and viral infectivity enhancement functions of human immunodeficiency virus type 1 Nef. J Virol 69:4112- 4121.
Gronenbom AM, Clore GM. 1994. Identification of N-terminal helix capping boxes by means of 17C chemical shifts. J Biomol NMR 4:455-458.
Grzesiek S, Bax A. 1992a. Improved 3D triple-resonance NMR techniques applied to a 31 kDa protein. J Magn Reson 96:432-440.
Grzesiek S, Bax A. 1992b. Correlating backbone amide and side chain reso- nances in larger proteins by multiple relayed triple resonance NMR. J Am Chem Soc 1145291-6293.
Grzesiek S, Bax A. 1993a. Amino acid type determination in the sequential assignment procedure of uniformly "C/'5N-enriched proteins. J Biomol NMR 3: 185-204.
Grzesiek S, Bax A. 1993b. The importance of not saturating water in protein NMR. Application to sensitivity enhancement and NOE measurements. J Am Chem Sor 115:12593-12594.
Grzesiek S, Vuister GW, Bax A. 1993. A simple and sensitive experiment for measurement of JCC couplings between backbone carbonyl and methyl carbons in isotopically enriched proteins. J Biomol NMR 3487-493.
Grzesiek S, Wingfield P, Stahl S, Kaufman JD, Bax A. 1995a. Four-dimensional '%separated NOESY of slowly tumbling perdeuterated I5N-enriched pro- teins. Application to HIV-1 Nef. JArn Chem Soc 1179594-9595.
Grzesiek S, Kuboniwa H, Hinck AP, Bax A. 1995b. Multiple-quantum line narrowing for measurement of H"-HP J couplings in isotopically enriched proteins. JArn Chem Soc 1175312-5315.
Grzesiek S, Bax A, Clore GM, Gronenborn AM, Hu JS, Kaufman J, Palmer I, Stahl SJ, Wingfield F'T. 1996a. The solution structure of HIV-1 Nef reveals an unexpected fold and permits delineation of the binding surface for the SH3 domain of Hck tyrosine protein kinase. Nat Struct Biol 3340-345.
Grzesiek S, Stahl SJ, Wingfield F'T, Bax A. 1996b. The CD4 determinant for downregulation by HIV-I Nef directly binds to Nef. Mapping of the Nef binding surface by NMR. Biochemistry 35 10256-1 026 1.
Grzesiek S, Bax A. 1997. A three-dimensional NMR experiment with improved sensitivity for carbonyl-carbonyl J correlations in proteins. J Biomol NMR 9:207-2 1 I .
Guy B, Kieny MP, Riviere Y, Le Peuch C, Dott K, Girard M, Montagnier L, Lecocq JP. 1987. HIV F/3' orf encodes a phosphorylated GTP-binding protein resembling an oncogene product. Nature 330:266-269.
Harper ET, Rose GD. 1993. Helix stop signals in proteins and peptides: The capping box. Biochemistry 32:7605-7609.
Hiroaki H, Klaus W, Senn H. 1996. Determination of the solution structure of
Hu JS, Bax A. 1996. HNCOCO. Measurement of three-bond 13C-1'C J cou- the SH3 domain of human p56 Lck tyrosine kinase. JBiomol NMR 8: 105-122.
JArn Chem Soc 1188170-8171. plings between carbonyl/carboxyl carbons in isotopically enriched proteins.
Hu JS, Grzesiek S, Bax A. 1997. Two-dimensional NMR methods for deter- mining ,yl angles of aromatic residues in proteins from three-bond Jc,cI and
Ikura M, Kay LE, Bax A. 1990. Three-dimensional NOESY-HMQC spectros- JNCV couplings. JArn Chem Soc 119:1803-1804.
copy of a "C-labeled protein. J Magn Reson 86204-209. Kay LE, Torchia DA, Bax A. 1989. Backbone dynamics of proteins as studied
by "N inverse detected heteronuclear NMR spectroscopy: Application to staphylococcal nuclease. Biochemistry 288972-8979.
Kay LE, Nicholson LK, Delaglio F, Bax A, Torchia DA. 1992. The effects of cross-correlation between dipolar and chemical shift anisotropy relaxation mechanisms on the measurement of heteronuclear T I and Tz values in proteins: Pulse sequences for the removal of such effects. J Magn Reson 97:359-375.
Kay LE, Xu CY, Yamazaki T. 1994. Enhanced-sensitivity triple-resonance spec-
Kestler HW, Ringler DJ, Mori K, Panicali DL, Sehgal PK, Daniel MD, Desro- troscopy with minimal H 2 0 saturation. J Magn Reson A109:129-133.
siers RC. 1991. Importance of the nef gene for maintenance of high virus loads and for development of AIDS. Cell 65:651-662.
Kirchhoff F. Greenough TC, Brettler DB, Sullivan JL, Desrosiers RC. 1995. Absence of intact nef sequences in a long-term survivor with nonprogres-
Koradi R, Billeter M, Wuthrich K. 1996. MOLMOL: A program for display and sive HIV-I infection. N Engl J Med 332:228-232.
Kuboniwa H, Grzesiek S, Delaglio F, Bax A. 1994. Measurement of HN-H analysis of macromolecular structures. J Mol Graphics 14:51-55.
alpha J couplings in calcium-free calmodulin using new 2D and 3D water- flip-back methods. J Biomol NMR 4:871-878.
Kuboniwa H, Tjandra N. Grzesiek S, Ren H, Klee CB, Bax A. 1995. Solution structure of calcium-free calmodulin. Nat Struct Biol 2:768-776.
Kuszewski J, Qin J, Gronenborn AM, Clore GM. 1995. The impact of direct refinement against "C" and "CP chemical shifts on protein structure de-
Laskowski R, Rullmann JAC, MacArthur MW, Kaptein R, Thornton JM. 1996. termination by NMR. J M a p Reson B106:92-96.
AQUA and PROCHECK-NMR: Programs for checking the quality of pro- tein structures solved by NMR. J Biomol NMR 8:477-486.
Lee CH, Leung B, Lemmon MA, Zheng J, Cowbum D, Kuriyan J, Saksela K.
affinity and specificity in binding to HIV-I Nef protein. EMBO J 145006- 1995. A single amino acid in the SH3 domain of Hck determines its high
5015. Lee CH, Saksela K, Mirza UA, Chait BT, Kuriyan J. 1996. Crystal structure of
the conserved core of HIV-I Nef complexed with a Src family SH3 domain. Cell 85:931-942.
Lipari G, Szabo A. 1982a. Model-free approach to the interpretation of nuclear magnetic resonance relaxation in macromolecules. I . Theory and range of validity. J Am Chem Soc 104:4546-4559.
Lipari G, Szabo A. 1982b. Model-free approach to the interpretation of nuclear magnetic resonance relaxation in macromolecules. 1. Analysis of experi- mental results. J Am Chem Soc 1044559-4570.
Lippens G, Dhalluin C, Wieruszeski JM. 1995. Use of a water flip-hack pulse
Luciw PA, Cheng-Mayer C, Levy JA. 1987. Mutational analysis of the human in the homonuclear NOESY experiment. J Biomol NMR 5:327-331.
immunodeficiency virus: The orf-B region down-regulates virus replication. Proc Natl Acad Sci USA 841434-1438.
Mariani R, Kirchhoff F, Greenough TC, Sullivan JL, Desrosiers RC, Skowron- ski J. 1996. High frequency of defective nef alleles in a long-term survivor with nonprogressive human immunodeficiency virus type 1 infection. J Virol 707752-7764.
Marion D, Driscoll PC, Kay LE, Wingfield PT, Bax A, Gronenbom AM, Clore GM. 1989. Overcoming the overlap problem in the assignment of 'H NMR
High resolution NMR of HIV-1 Nef 1263
spectra of larger proteins by use of three-dimensional heteronuclear 'H-"N Hartmann-Hahn-multiple quantum coherence and nuclear Overhauser- multiple quantum coherence spectroscopy: Application to interleukin 1-p. Biochemistry 28:6150-6156.
Miller MD, Warmerdam MT, Gaston 1, Greene WC, Feinberg MB. 1994. The human immunodeficiency virus-1 nef gene product: A positive factor for viral infection and replication in primary lymphocytes and macrophages. J Exp Med 179101-113.
Neri D, Szyperski T, Otting G, Senn H, Wuethrich K. 1989. Stereospecific nuclear magnetic resonance assignments of the methyl groups of valine and leucine in the DNA-binding domain of the 434 repressor by biosynthetically directed fractional carbon-I3 labeling. Biochemistry 287510-7516.
Nicholson LK, Yamazaki T, Torchia DA, Grzesiek S, Bax A, Stahl SJ, Kaufman JD, Wingfield PT, Lam PY, Jadhav PK. 1995. Flexibility and function in HIV-1 protease. Nar Strucr Biol 2:274-280.
Niederman T M , Thielan BJ, Ratner L. 1989. Human immunodeficiency virus
86:1128-1132. type 1 negative factor is a transcriptional silencer. Proc Natl Acad Sci USA
Nilges M, Clore GM, Gronenborn AM. 1988. Determination of three-dimensional structures of proteins from interproton distance data by hybrid distance geometry-dynamical simulated annealing calculations. FEBS Lett 229:317- 324.
Piotto M, Saudek V, Sklenar V. 1992. Gradient-tailored excitation for single- quantum NMR spectroscopy of aqueous solutions. J Biomol NMR 2:661- 665.
Prekumar DRD, Ma XZ, Maitra RK, Chakrabarti BK, Salkowitz I, Yen- Lieberman B, Hirsch MS. Kestler HW. 1996. The nef gene from a long-term HIV type I nonprogressor. AIDS Res Hum Retroviruses 12:337-345.
Saksela K, Cheng G, Baltimore D. 1995. Proline-rich (PxxP) motifs in HIV-1 Nef bind to SH3 domains of a subset of Src kinases and are required for the enhanced growth of Nef+ viruses but not for down-regulation of CD4. EMBO J 14:484-491.
Salghetti S, Mariani R, Skowronski J. 1995. Human immunodeficiency virus type 1 Nef and p561ck protein-tyrosine kinase interact with a common element in CD4 cytoplasmic tail. Proc Natl Acad Sci USA 92349-353.
Santoro J, King GC. 1992. A constant-time 2D overbodenhausen experiment for inverse correlation of isotopically enriched species. J Magn Reson 97202- 207.
Shugars DC, Smith MS. Glueck DH, Nantermet PV, Seillier-Moiseiwitsch F, Swanstrom R. 1993. Analysis of human immunodeficiency virus type 1 nef gene sequences present in vivo. J Virol674639-4650.
Skowronski J, Parks D, Mariani R. 1993. Altered T cell activation and devel- opment in transgenic mice expressing the HIV-1 nef gene. EMBO J 12:703- 713.
Spera S, Bax A. 1991. Empirical correlation between protein backbone confor-
Am Chem Soc 1135490-5492. mation and C n and C p I3C nuclear magnetic resonance chemical shifts. J
Spina CA, Kwoh TJ, Chowers MY, Guatelli JC, Richman DD. 1994. The im- portance of nef in the induction of human immunodeficiency virus type 1 replication from primary quiescent CD4 lymphocytes. J Exp Med 1 7 9 1 15- 123.
Van de Ven FJM, Philippens MEP. 1992. Optimization of constant-time evolu- tion in multidimensional experiments. J Magn Reson 97637-644.
Vuister GW, Bax A. 1992. Resolution enhancement and spectral editing of uniformly carbon-'3-enriched proteins by homonuclear broadband carbon-13 decoupling. J Magn Reson 98428-435.
Vuister GW, Wang AC, Bax A. 1993. Measurement of three-bond nitrogen- carbon J couplings in proteins uniformly enriched in nitrogen-15 and carbon- 13. JAm Chem Soc 1155334-5335.
Vuister GW, Kim SJ, Wu C, Bax A. 1994. 2D and 3D NMR study of phenyl- alanine residues in proteins by reverse isotopic labeling. J Am Chem Soc 166:9206-9210.
Welker R, Kottler H. Kalbitzer HR, Krausslich HG. 1996. Human immunodefi- ciency virus type 1 Nef protein is incorporated into virus particles and specifically cleaved by the viral proteinase. virology 219228-236.
Wilmot CM, Thornton JM 1988. Analysis and prediction of the different types of b-turn in proteins. J Mol Bio[203:221-232.
Wishart DS, Sykes BD, Richards FM. 1991. Relationship between nuclear magnetic resonance chemical shift and protein secondary structure. J Mol
Wittekind M, Mueller L. 1993. HNCACB a high-sensitivity 3D NMR experi- Biol 22231 1-333.
ment to correlate amide-proton and nitrogen resonances with the alpha- and beta-carbon resonances in proteins. J Magn Reson Bl01:201-205.
Whatmore AM, Cook N, Hall GA, Sharpe S, Rud EW, Cranage MP. 1995. Repair and evolution of nef in vivo modulates simian immunodeficiency virus virulence. J Virol695117-5123.
Wuthrich K. 1986. NMR ofproteins and nucleic acids. New York: John Wiley & Sons.
Zuiderweg ERP, McIntosh LP, Dahlquist FW, Fesik SW. 1990. Three-dimensional "C-resolved proton NOE spectroscopy of uniformly "C-labeled proteins
Magn Reson 86~210-216. for the NMR assignment and structure determination of larger molecules. J