Embed Size (px)
Citation preview
Referendum Design and ContingentValuation: The NOAA Panel's No-VoteRecommendation
Richard T. Carson, W. Michael Hanemann,Raymond J. Kopp, Jon A. Krosnick, Robert C.Mitchell, Stanley Presser, Paul A. Ruud, andV. Kerry Smith, with Michael Conaway andKerry Martin
Discussion Paper 96-05
November 1995
Resources for the Future1616 P Street, NWWashington, DC 20036Telephone 202-328-5000Fax 202-939-3460
© 1995 Resources for the Future. All rights reserved.No portion of this paper may be reproduced withoutpermission of the author(s).
Discussion papers are research materials circulated by theirauthors for purposes of information and discussion. Theyhave not undergone formal peer review or the editorialtreatment accorded RFF books and other publications.
-ii-
Referendum Design and Contingent Valuation:The NOAA Panel's No-Vote Recommendation
Richard T. Carson, W. Michael Hanemann, Raymond J. Kopp,
Jon A. Krosnick, Robert C. Mitchell, Stanley Presser,
Paul A. Ruud, and V. Kerry Smith
withMichael Conaway and Kerry Martin
Abstract
In 1992 the National Oceanic and Atmospheric Administration (NOAA) convened apanel of prominent social scientists to assess the reliability of natural resource damageestimates derived from contingent valuation (CV). The product of the Panel's deliberationswas a report that laid out a set of recommended guidelines for CV survey design,administration, and data analysis.
One of the Panel's recommendations was that CV surveys should employ a referendumapproach. This method describes a choice mechanism that asks each respondent how theywould vote if faced with a particular program and the prospect of paying for the programthrough some means, such as higher taxes. The Panel also recommended that CV referendumquestions which commonly use only "for" or "against" answers should be expanded toexplicitly offer an "I would-not-vote" response.
The purpose of this paper is to consider the effects of such a "would-not-vote" option.In developing the test, we followed the important elements of the NOAA Panel guidelines forthe design and administration of a CV survey and use what was acknowledged(by the Panel) asthe most carefully developed CV questionnaire to that time, that is, the State of Alaska's studyof the Exxon Valdez oil spill. Our findings suggest that when those selecting the "would-not-vote" response are treated as having voted "against" the offered program, offering the optiondoes not alter: (a) the distribution of "for" and "against" responses, (b) the estimates of WTPderived from these choices, or (c) the construct validity of the results.
Key Words: contingent valuation, natural resource damages, passive use, Exxon Valdez, reliability
JEL Classification No(s).: D60, D61, K32, Q28
-iii-
Table of Contents
1. Introduction .................................................................................................................12. Hypotheses and Survey Procedures ..............................................................................4
A. Background ...........................................................................................................4B. Survey Procedures .................................................................................................5
3. Results .........................................................................................................................74. Implications ................................................................................................................13References .........................................................................................................................15
List of Tables
Table 1. Effects of Would-Not-Vote Option on Choices with Conservative Recoding .........8Table 2. Effects of Would-Not-Vote on WTP Estimates .....................................................9Table 3. Selecting Would-Not-Vote and Its Effect on Construct Validity of CV ...............10

Referendum Design and Contingent Valuation:The NOAA Panel's No-Vote Recommendation
Richard T. Carson, W. Michael Hanemann, Raymond J. Kopp,Jon A. Krosnick, Robert C. Mitchell, Stanley Presser,
Paul A. Ruud, and V. Kerry Smith
withMichael Conaway and Kerry Martin
1
1. INTRODUCTION
The increasing use of contingent valuation surveys to present respondents with
economic tradeoffs for proposed programs has generated debate over the validity of this
approach for measuring values for non-market environmental resources. As part of the efforts
to develop regulations for damage assessment under the Oil Pollution Act of 1990, the
National Oceanic and Atmospheric Administration (NOAA) appointed a Panel of leading social
scientists, co-chaired by Kenneth Arrow and Robert Solow [see Arrow et al. 1993], to assess
1 The authors are, respectively: Associate Professor of Economics, University of California (San Diego);
Associate Professor of Agricultural and Natural Resource Economics, University of California (Berkeley);Senior Fellow, Resources for the Future; Associate Professor of Psychology and Political Science, Ohio StateUniversity; Professor of Geography, Clark University; Professor of Sociology, University of Maryland (CollegePark); Professor of Economics, University of California (Berkeley); and Arts and Sciences Professor, DukeUniversity and University Fellow, Resources for the Future. Conaway and Martin are members of NaturalResource Damage Assessment, Inc. and made extensive contributions throughout the effort. The workdescribed in this paper was funded by the Damage Assessment Center of the National Oceanic andAtmospheric Administration as part of a natural resource damage assessment under contract number 50-DGNC-1-00007. Additional support to aid in the preparation of this paper was provided to Kopp by the AlfredP. Sloan Foundation through its support of the Welfare Economics Program at Resources for the Future, and toSmith by the UNC Sea Grant Program under Grant No. R/MRD-25. Thanks to Richard Bishop, TrudyCameron, Nicholas Flores, and Alan Randall for comments on aspects of this work. All opinions expressed inthis paper are those of the authors and should not be attributed to the National Oceanic and AtmosphericAdministration, the Alfred P. Sloan Foundation, or any persons or organizations acknowledged above.
-2- Carson, Hanemann, Kopp, Krosnick, Mitchell, Presser, Ruud, and Smith
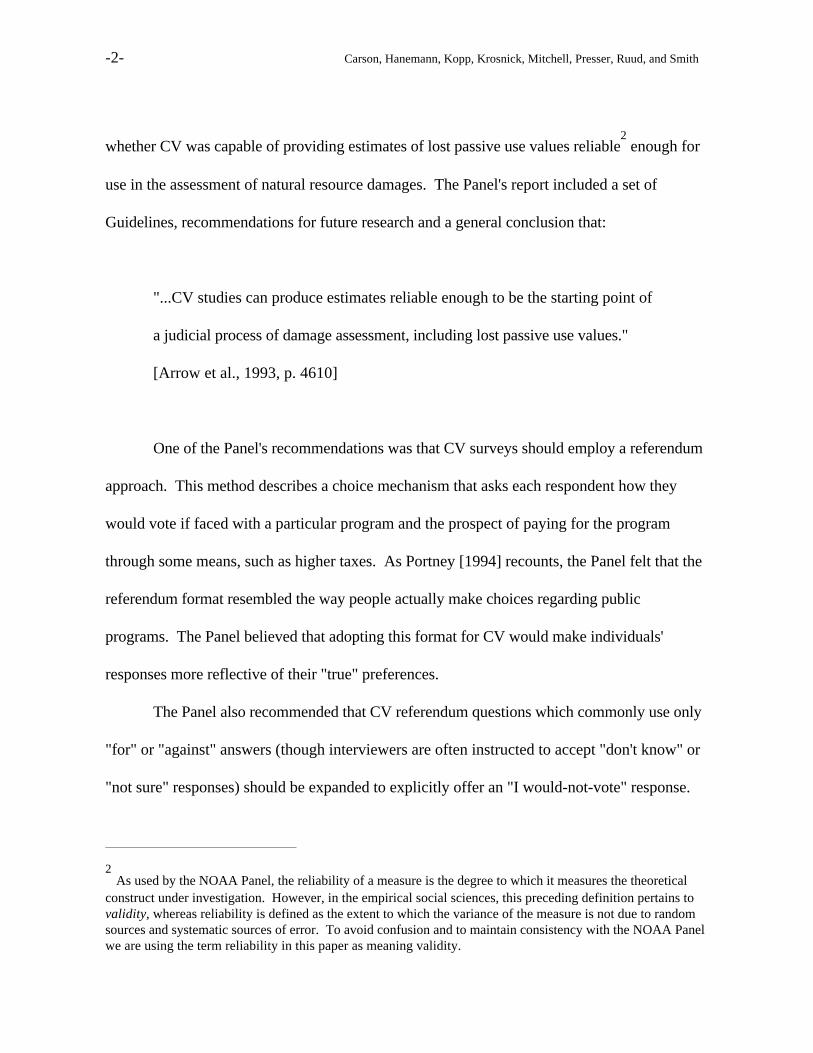
whether CV was capable of providing estimates of lost passive use values reliable2 enough for
use in the assessment of natural resource damages. The Panel's report included a set of
Guidelines, recommendations for future research and a general conclusion that:
"...CV studies can produce estimates reliable enough to be the starting point of
a judicial process of damage assessment, including lost passive use values."
[Arrow et al., 1993, p. 4610]
One of the Panel's recommendations was that CV surveys should employ a referendum
approach. This method describes a choice mechanism that asks each respondent how they
would vote if faced with a particular program and the prospect of paying for the program
through some means, such as higher taxes. As Portney [1994] recounts, the Panel felt that the
referendum format resembled the way people actually make choices regarding public
programs. The Panel believed that adopting this format for CV would make individuals'
responses more reflective of their "true" preferences.
The Panel also recommended that CV referendum questions which commonly use only
"for" or "against" answers (though interviewers are often instructed to accept "don't know" or
"not sure" responses) should be expanded to explicitly offer an "I would-not-vote" response.
2 As used by the NOAA Panel, the reliability of a measure is the degree to which it measures the theoretical
construct under investigation. However, in the empirical social sciences, this preceding definition pertains tovalidity, whereas reliability is defined as the extent to which the variance of the measure is not due to randomsources and systematic sources of error. To avoid confusion and to maintain consistency with the NOAA Panelwe are using the term reliability in this paper as meaning validity.
Referendum Design and Contingent Valuation: The NOAA Panel's No-Vote Recommendation -3-
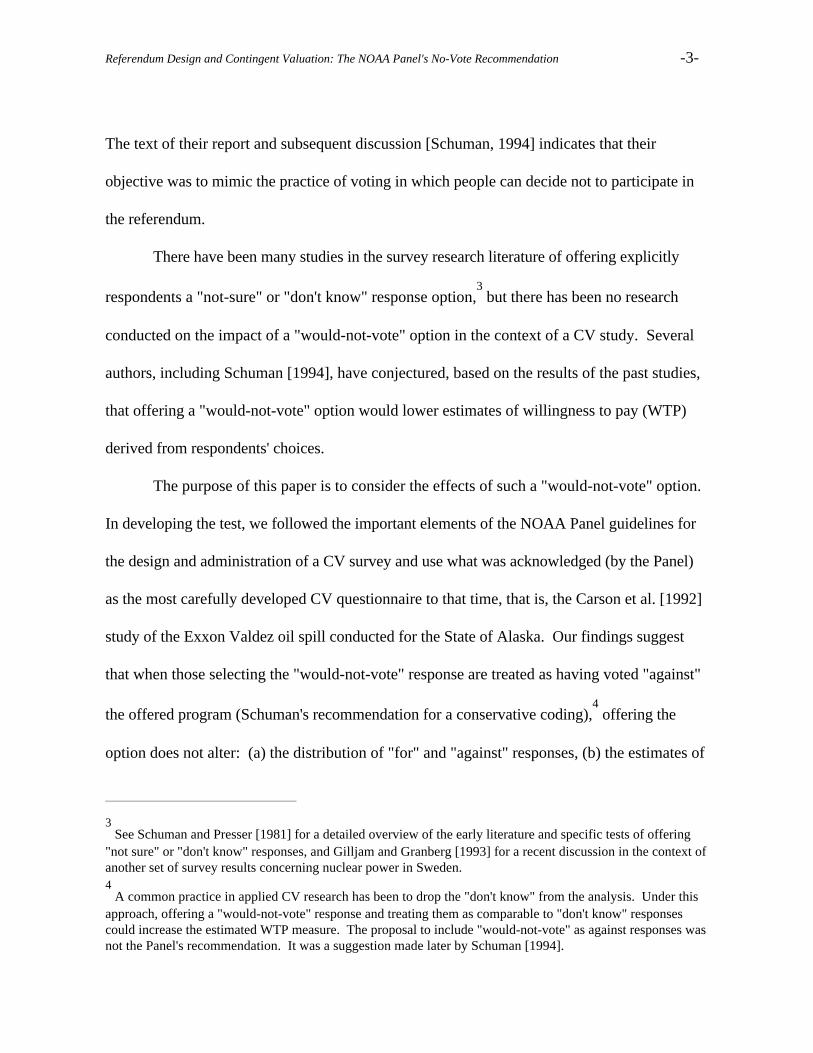
The text of their report and subsequent discussion [Schuman, 1994] indicates that their
objective was to mimic the practice of voting in which people can decide not to participate in
the referendum.
There have been many studies in the survey research literature of offering explicitly
respondents a "not-sure" or "don't know" response option,3 but there has been no research
conducted on the impact of a "would-not-vote" option in the context of a CV study. Several
authors, including Schuman [1994], have conjectured, based on the results of the past studies,
that offering a "would-not-vote" option would lower estimates of willingness to pay (WTP)
derived from respondents' choices.
The purpose of this paper is to consider the effects of such a "would-not-vote" option.
In developing the test, we followed the important elements of the NOAA Panel guidelines for
the design and administration of a CV survey and use what was acknowledged (by the Panel)
as the most carefully developed CV questionnaire to that time, that is, the Carson et al. [1992]
study of the Exxon Valdez oil spill conducted for the State of Alaska. Our findings suggest
that when those selecting the "would-not-vote" response are treated as having voted "against"
the offered program (Schuman's recommendation for a conservative coding),4 offering the
option does not alter: (a) the distribution of "for" and "against" responses, (b) the estimates of
3 See Schuman and Presser [1981] for a detailed overview of the early literature and specific tests of offering
"not sure" or "don't know" responses, and Gilljam and Granberg [1993] for a recent discussion in the context ofanother set of survey results concerning nuclear power in Sweden.4 A common practice in applied CV research has been to drop the "don't know" from the analysis. Under this
approach, offering a "would-not-vote" response and treating them as comparable to "don't know" responsescould increase the estimated WTP measure. The proposal to include "would-not-vote" as against responses wasnot the Panel's recommendation. It was a suggestion made later by Schuman [1994].
-4- Carson, Hanemann, Kopp, Krosnick, Mitchell, Presser, Ruud, and Smith
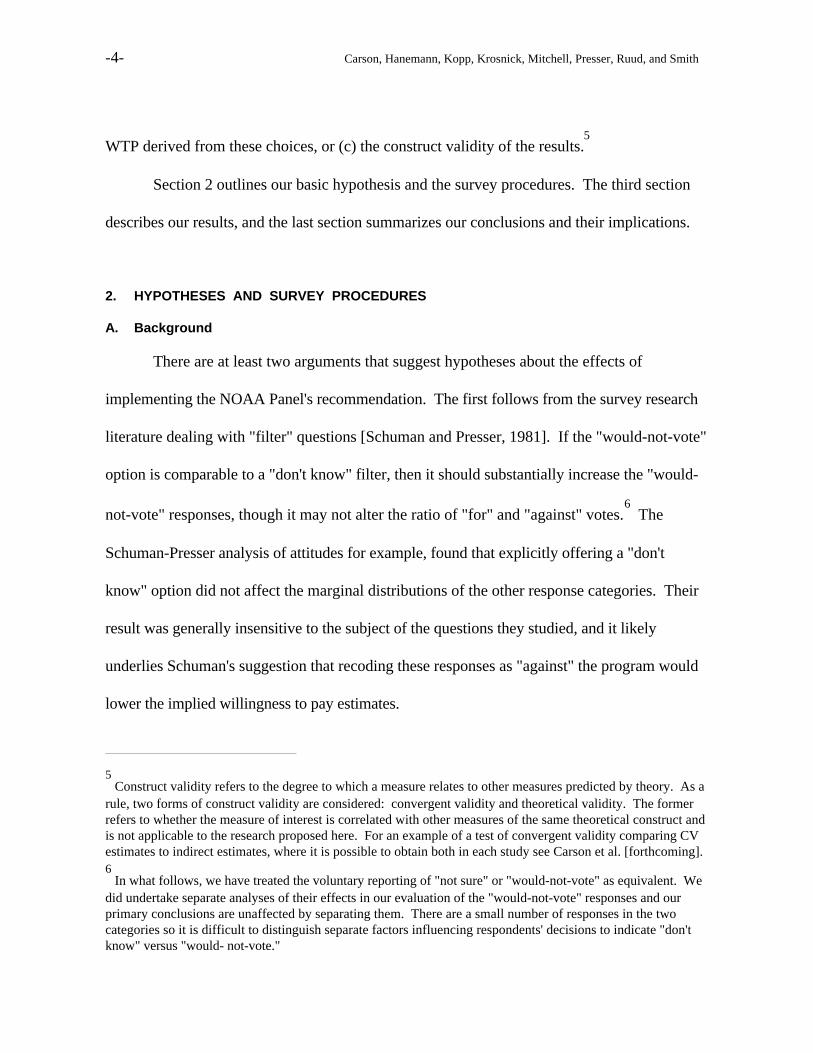
WTP derived from these choices, or (c) the construct validity of the results.5
Section 2 outlines our basic hypothesis and the survey procedures. The third section
describes our results, and the last section summarizes our conclusions and their implications.
2. HYPOTHESES AND SURVEY PROCEDURES
A. Background
There are at least two arguments that suggest hypotheses about the effects of
implementing the NOAA Panel's recommendation. The first follows from the survey research
literature dealing with "filter" questions [Schuman and Presser, 1981]. If the "would-not-vote"
option is comparable to a "don't know" filter, then it should substantially increase the "would-
not-vote" responses, though it may not alter the ratio of "for" and "against" votes.6 The
Schuman-Presser analysis of attitudes for example, found that explicitly offering a "don't
know" option did not affect the marginal distributions of the other response categories. Their
result was generally insensitive to the subject of the questions they studied, and it likely
underlies Schuman's suggestion that recoding these responses as "against" the program would
lower the implied willingness to pay estimates.
5 Construct validity refers to the degree to which a measure relates to other measures predicted by theory. As a
rule, two forms of construct validity are considered: convergent validity and theoretical validity. The formerrefers to whether the measure of interest is correlated with other measures of the same theoretical construct andis not applicable to the research proposed here. For an example of a test of convergent validity comparing CVestimates to indirect estimates, where it is possible to obtain both in each study see Carson et al. [forthcoming].6 In what follows, we have treated the voluntary reporting of "not sure" or "would-not-vote" as equivalent. We
did undertake separate analyses of their effects in our evaluation of the "would-not-vote" responses and ourprimary conclusions are unaffected by separating them. There are a small number of responses in the twocategories so it is difficult to distinguish separate factors influencing respondents' decisions to indicate "don'tknow" versus "would- not-vote."
Referendum Design and Contingent Valuation: The NOAA Panel's No-Vote Recommendation -5-
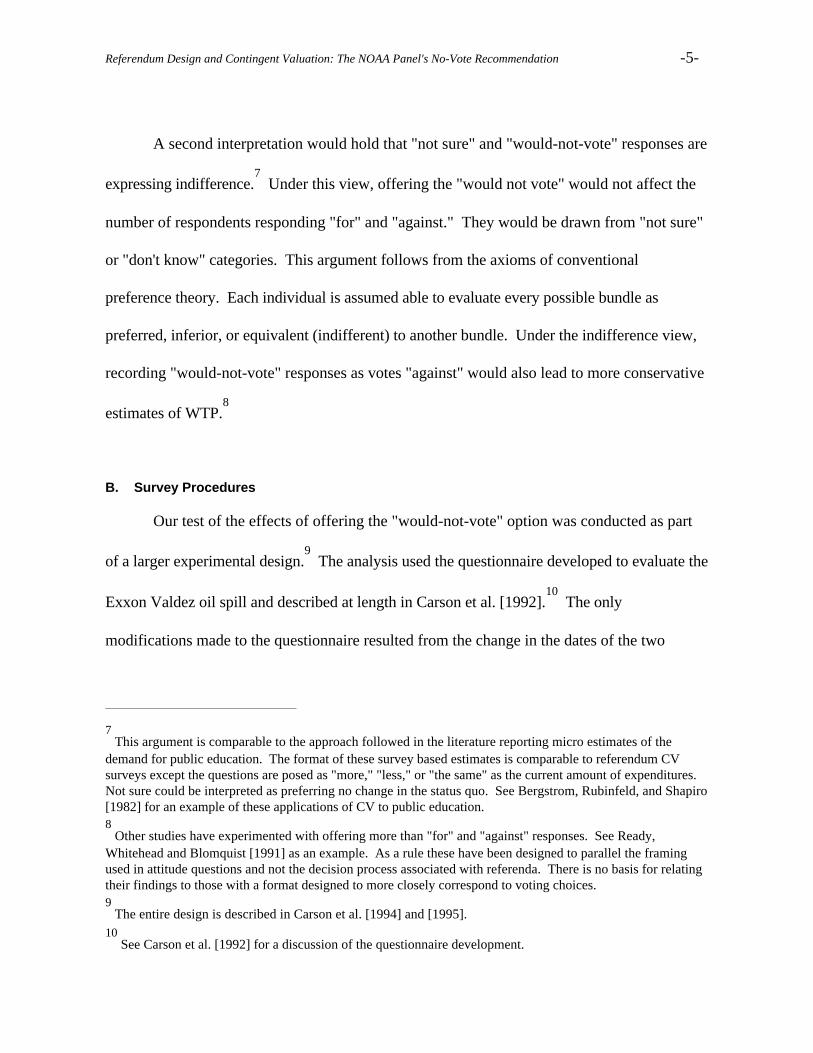
A second interpretation would hold that "not sure" and "would-not-vote" responses are
expressing indifference.7 Under this view, offering the "would not vote" would not affect the
number of respondents responding "for" and "against." They would be drawn from "not sure"
or "don't know" categories. This argument follows from the axioms of conventional
preference theory. Each individual is assumed able to evaluate every possible bundle as
preferred, inferior, or equivalent (indifferent) to another bundle. Under the indifference view,
recording "would-not-vote" responses as votes "against" would also lead to more conservative
estimates of WTP.8
B. Survey Procedures
Our test of the effects of offering the "would-not-vote" option was conducted as part
of a larger experimental design.9 The analysis used the questionnaire developed to evaluate the
Exxon Valdez oil spill and described at length in Carson et al. [1992].10
The only
modifications made to the questionnaire resulted from the change in the dates of the two
7 This argument is comparable to the approach followed in the literature reporting micro estimates of the
demand for public education. The format of these survey based estimates is comparable to referendum CVsurveys except the questions are posed as "more," "less," or "the same" as the current amount of expenditures.Not sure could be interpreted as preferring no change in the status quo. See Bergstrom, Rubinfeld, and Shapiro[1982] for an example of these applications of CV to public education.8 Other studies have experimented with offering more than "for" and "against" responses. See Ready,
Whitehead and Blomquist [1991] as an example. As a rule these have been designed to parallel the framingused in attitude questions and not the decision process associated with referenda. There is no basis for relatingtheir findings to those with a format designed to more closely correspond to voting choices.9 The entire design is described in Carson et al. [1994] and [1995].
10 See Carson et al. [1992] for a discussion of the questionnaire development.
-6- Carson, Hanemann, Kopp, Krosnick, Mitchell, Presser, Ruud, and Smith
surveys (1991 for Carson et al. and 1993 for our analysis). The National Opinion Research
Center (NORC) of the University of Chicago completed 1,182 nation-wide face-to-face
interviews of adult respondents in English speaking households in 34 counties throughout the
United States.11
Of the 1,182 total surveys completed, 622 households were randomly
assigned to either the original Alaska questionnaire or the version that included an explicit
"would-not-vote" option.
The two versions of the questionnaire used as the basis for the split sample analysis
described the condition of Prince William Sound before the Exxon Valdez spill, as well as the
damage caused by the spill. Respondents were then told that a plan had been proposed to
prevent a future oil spill causing the same magnitude of damage as the Exxon Valdez to Prince
William Sound. The plan involved setting up a fleet of escort ships that would guide oil
tankers into and out of the sound and could prevent the spread of oil if some were spilled.
Respondents were told that implementing the plan would cost their households a specified
dollar amount, to be paid as a one-time addition to their federal income tax (either $10, $30,
$60 or $120, randomly assigned to each respondent). In the standard version, respondents
were asked to answer the referendum vote question and were not given the explicit "would-
not-vote" option. Three hundred respondents received the standard version. Another 322
people were asked the same question with the addition of an explicit "would not vote" option.
11
Although the counties are both urban and rural from all regions of the US, they were chosen on the basis ofinterviewer availability from the NORC national master frame.
Referendum Design and Contingent Valuation: The NOAA Panel's No-Vote Recommendation -7-
3. RESULTS
Our analysis considers the effects of the "would-not-vote" option on: (a) the fraction
of respondents selecting answers other than "for" or "against" the proposal; (b) differences in
WTP estimates across the two samples; and (c) tests of construct validity. When the "would-
not-vote" option was offered, the percentage of the sample selecting other than a "for" or
"against" response significantly increased (p - value < 0.01) from 6.7% (20 of 300
respondents) to 17.7% (57 of 322 respondents). This confirms the Schuman conjecture that
this type of filter would lead to a significant increase in the proportion of respondents selecting
these types of answers.
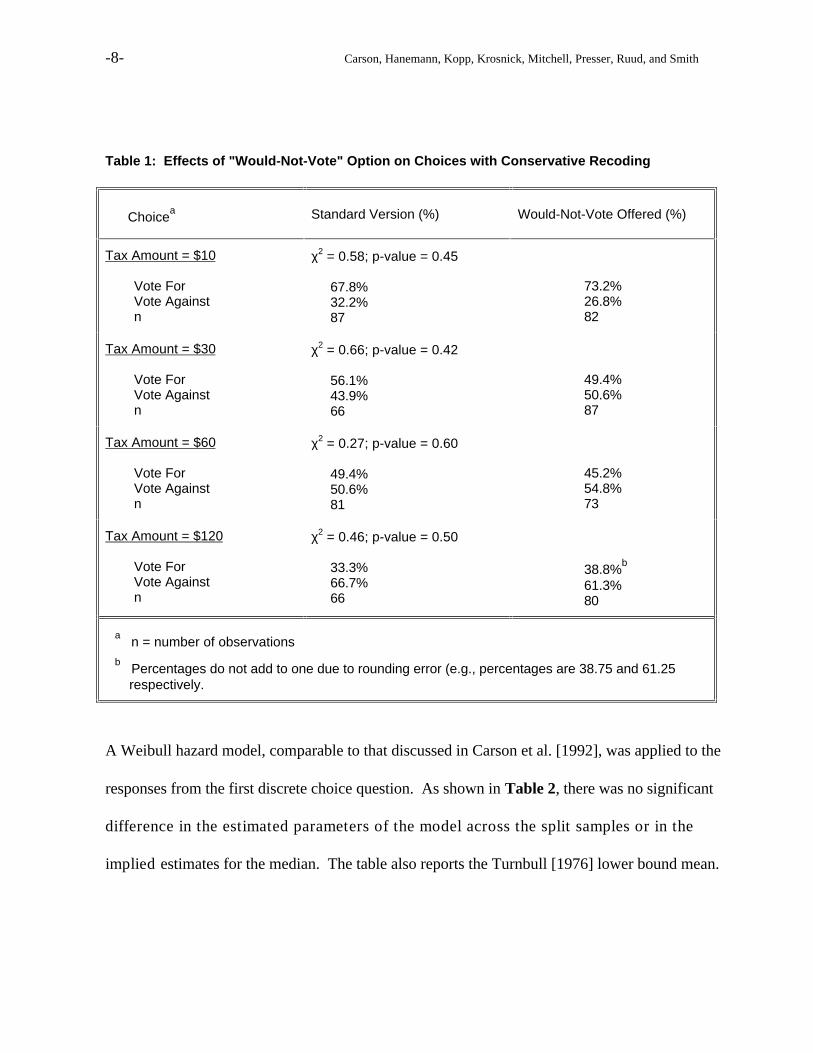
To evaluate the effect of a "would-not-vote" option on estimates of WTP, we first
consider the distribution of "for" and "against" responses by tax amount, conservatively
recoding the "not-sure" and "would-not-vote" responses as "against." If the distribution of
"for" and "against" votes is not affected by the inclusion of the "would-not-vote" option, then
the estimates of WTP should be similarly unaffected. Table 1 reports the results of this test
with the relevant chi-square tests. In contrast to the hypothesis suggested by both frameworks
described above, offering the "would-not-vote" option did not significantly affect the
distribution of respondent votes at any of the tax amounts.
Two different approaches were used to test for split sample differences in estimates of
WTP for the prevention program, a median WTP based on a Weibull hazard model specification
and a lower-bound estimate of mean WTP based on a Turnbull model specification.
-8- Carson, Hanemann, Kopp, Krosnick, Mitchell, Presser, Ruud, and Smith
Table 1: Effects of "Would-Not-Vote" Option on Choices with Conservative Recoding
Choicea Standard Version (%) Would-Not-Vote Offered (%)
Tax Amount = $10
Vote ForVote Againstn
χ2 = 0.58; p-value = 0.45
67.8%32.2%87
73.2%26.8%82
Tax Amount = $30
Vote ForVote Againstn
χ2 = 0.66; p-value = 0.42
56.1%43.9%66
49.4%50.6%87
Tax Amount = $60
Vote ForVote Againstn
χ2 = 0.27; p-value = 0.60
49.4%50.6%81
45.2%54.8%73
Tax Amount = $120
Vote ForVote Againstn
χ2 = 0.46; p-value = 0.50
33.3%66.7%66
38.8%b
61.3%80
a n = number of observations
b Percentages do not add to one due to rounding error (e.g., percentages are 38.75 and 61.25
respectively.
A Weibull hazard model, comparable to that discussed in Carson et al. [1992], was applied to the
responses from the first discrete choice question. As shown in Table 2, there was no significant
difference in the estimated parameters of the model across the split samples or in the
implied estimates for the median. The table also reports the Turnbull [1976] lower bound mean.
Referendum Design and Contingent Valuation: The NOAA Panel's No-Vote Recommendation -9-
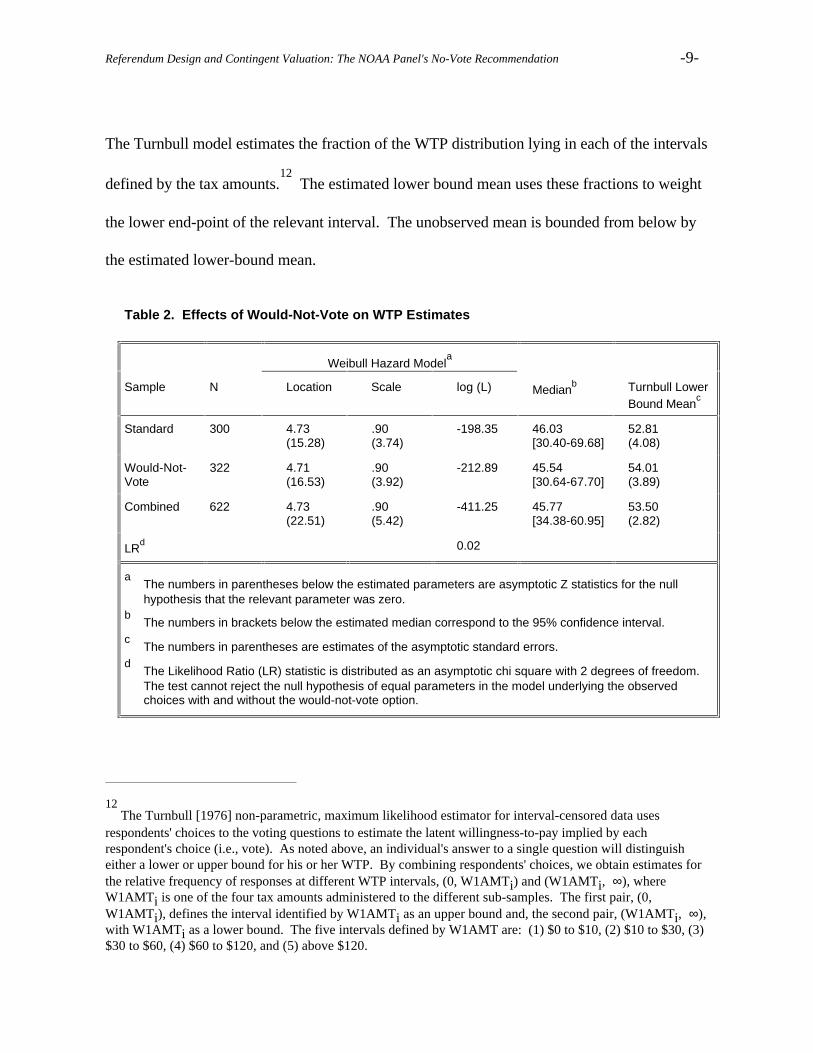
The Turnbull model estimates the fraction of the WTP distribution lying in each of the intervals
defined by the tax amounts.12
The estimated lower bound mean uses these fractions to weight
the lower end-point of the relevant interval. The unobserved mean is bounded from below by
the estimated lower-bound mean.
Table 2. Effects of Would-Not-Vote on WTP Estimates
Weibull Hazard Modela
Sample N Location Scale log (L) Medianb Turnbull Lower
Bound Meanc
Standard 300 4.73(15.28)
.90(3.74)
-198.35 46.03[30.40-69.68]
52.81(4.08)
Would-Not-Vote
322 4.71(16.53)
.90(3.92)
-212.89 45.54[30.64-67.70]
54.01(3.89)
Combined 622 4.73(22.51)
.90(5.42)
-411.25 45.77[34.38-60.95]
53.50(2.82)
LRd 0.02
a The numbers in parentheses below the estimated parameters are asymptotic Z statistics for the null
hypothesis that the relevant parameter was zero.b The numbers in brackets below the estimated median correspond to the 95% confidence interval.
c The numbers in parentheses are estimates of the asymptotic standard errors.
d The Likelihood Ratio (LR) statistic is distributed as an asymptotic chi square with 2 degrees of freedom.
The test cannot reject the null hypothesis of equal parameters in the model underlying the observedchoices with and without the would-not-vote option.
12
The Turnbull [1976] non-parametric, maximum likelihood estimator for interval-censored data usesrespondents' choices to the voting questions to estimate the latent willingness-to-pay implied by eachrespondent's choice (i.e., vote). As noted above, an individual's answer to a single question will distinguisheither a lower or upper bound for his or her WTP. By combining respondents' choices, we obtain estimates forthe relative frequency of responses at different WTP intervals, (0, W1AMTi) and (W1AMTi, ∞), whereW1AMTi is one of the four tax amounts administered to the different sub-samples. The first pair, (0,W1AMTi), defines the interval identified by W1AMTi as an upper bound and, the second pair, (W1AMTi, ∞),with W1AMTi as a lower bound. The five intervals defined by W1AMT are: (1) $0 to $10, (2) $10 to $30, (3)$30 to $60, (4) $60 to $120, and (5) above $120.
-10- Carson, Hanemann, Kopp, Krosnick, Mitchell, Presser, Ruud, and Smith
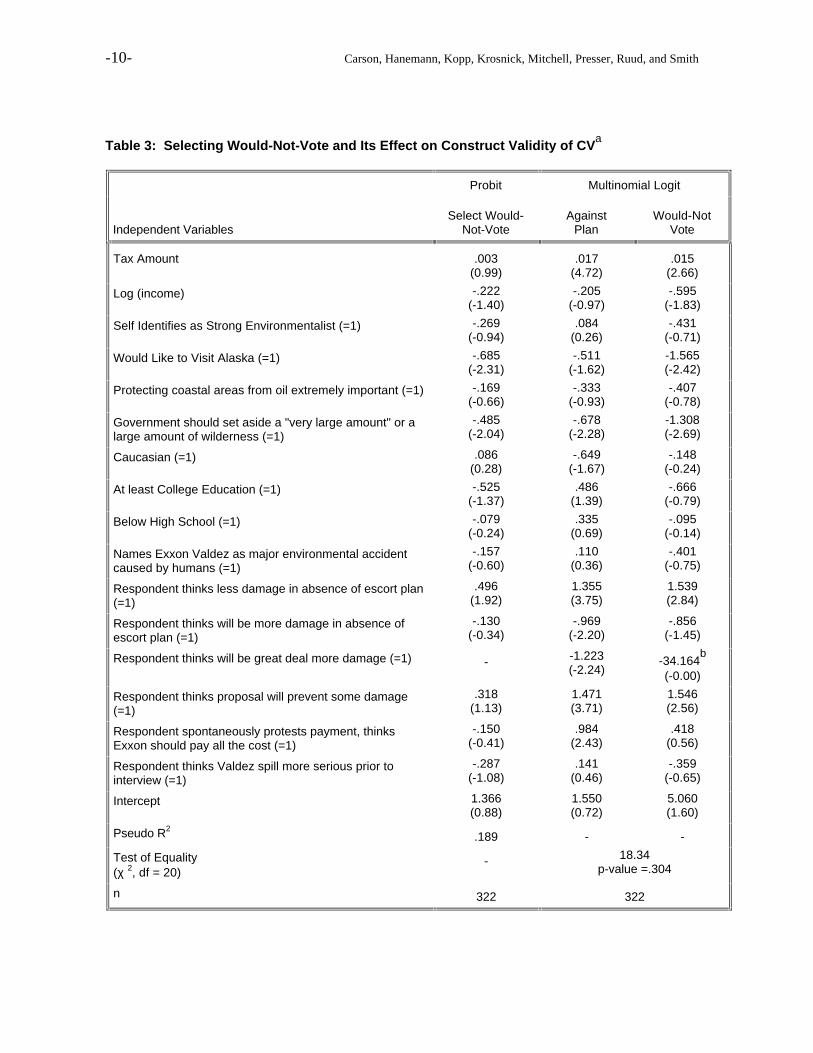
Table 3: Selecting Would-Not-Vote and Its Effect on Construct Validity of CVa
Probit Multinomial Logit
Independent VariablesSelect Would-
Not-VoteAgainst
PlanWould-Not
Vote
Tax Amount .003(0.99)
.017(4.72)
.015(2.66)
Log (income) -.222(-1.40)
-.205(-0.97)
-.595(-1.83)
Self Identifies as Strong Environmentalist (=1) -.269(-0.94)
.084(0.26)
-.431(-0.71)
Would Like to Visit Alaska (=1) -.685(-2.31)
-.511(-1.62)
-1.565(-2.42)
Protecting coastal areas from oil extremely important (=1) -.169(-0.66)
-.333(-0.93)
-.407(-0.78)
Government should set aside a "very large amount" or alarge amount of wilderness (=1)
-.485(-2.04)
-.678(-2.28)
-1.308(-2.69)
Caucasian (=1) .086(0.28)
-.649(-1.67)
-.148(-0.24)
At least College Education (=1) -.525(-1.37)
.486(1.39)
-.666(-0.79)
Below High School (=1) -.079(-0.24)
.335(0.69)
-.095(-0.14)
Names Exxon Valdez as major environmental accidentcaused by humans (=1)
-.157(-0.60)
.110(0.36)
-.401(-0.75)
Respondent thinks less damage in absence of escort plan(=1)
.496(1.92)
1.355(3.75)
1.539(2.84)
Respondent thinks will be more damage in absence ofescort plan (=1)
-.130(-0.34)
-.969(-2.20)
-.856(-1.45)
Respondent thinks will be great deal more damage (=1) - -1.223(-2.24)
-34.164b
(-0.00)
Respondent thinks proposal will prevent some damage(=1)
.318(1.13)
1.471(3.71)
1.546(2.56)
Respondent spontaneously protests payment, thinksExxon should pay all the cost (=1)
-.150(-0.41)
.984(2.43)
.418(0.56)
Respondent thinks Valdez spill more serious prior tointerview (=1)
-.287(-1.08)
.141(0.46)
-.359(-0.65)
Intercept 1.366(0.88)
1.550(0.72)
5.060(1.60)
Pseudo R2.189 - -
Test of Equality(χ 2, df = 20)
- 18.34p-value =.304
n 322 322
Referendum Design and Contingent Valuation: The NOAA Panel's No-Vote Recommendation -11-
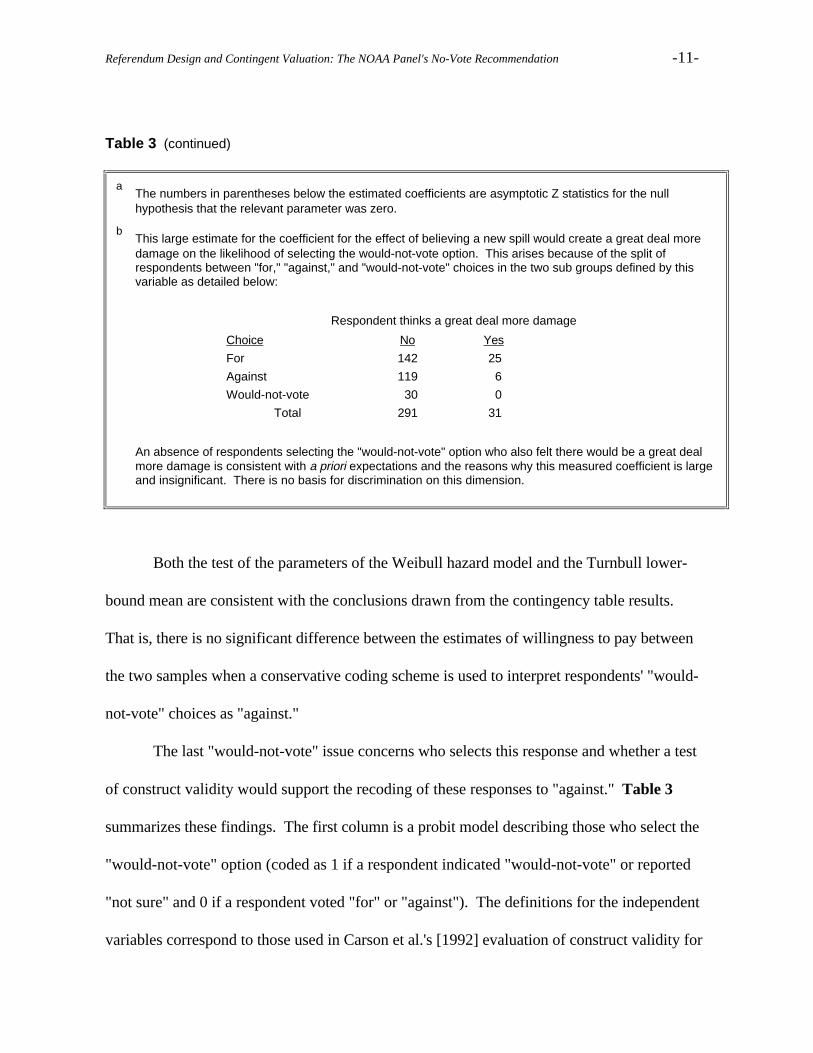
Table 3 (continued)
a The numbers in parentheses below the estimated coefficients are asymptotic Z statistics for the null
hypothesis that the relevant parameter was zero.
b This large estimate for the coefficient for the effect of believing a new spill would create a great deal more
damage on the likelihood of selecting the would-not-vote option. This arises because of the split ofrespondents between "for," "against," and "would-not-vote" choices in the two sub groups defined by thisvariable as detailed below:
Respondent thinks a great deal more damage
Choice No Yes
For 142 25
Against 119 6
Would-not-vote 30 0
Total 291 31
An absence of respondents selecting the "would-not-vote" option who also felt there would be a great dealmore damage is consistent with a priori expectations and the reasons why this measured coefficient is largeand insignificant. There is no basis for discrimination on this dimension.
Both the test of the parameters of the Weibull hazard model and the Turnbull lower-
bound mean are consistent with the conclusions drawn from the contingency table results.
That is, there is no significant difference between the estimates of willingness to pay between
the two samples when a conservative coding scheme is used to interpret respondents' "would-
not-vote" choices as "against."
The last "would-not-vote" issue concerns who selects this response and whether a test
of construct validity would support the recoding of these responses to "against." Table 3
summarizes these findings. The first column is a probit model describing those who select the
"would-not-vote" option (coded as 1 if a respondent indicated "would-not-vote" or reported
"not sure" and 0 if a respondent voted "for" or "against"). The definitions for the independent
variables correspond to those used in Carson et al.'s [1992] evaluation of construct validity for
-12- Carson, Hanemann, Kopp, Krosnick, Mitchell, Presser, Ruud, and Smith
the original Alaska survey. We added three variables associated with the respondent's
education and dropped two from the original set because there was no discrimination in those
selecting the "would-not-vote" answer.13
Overall, few variables appear to be associated with the decision to select a "would-not-
vote" response. The respondent's evaluation of the plan, interest in visiting Alaska, and belief
that the government should protect wilderness areas all had plausible effects on the selection.
None of the remaining variables were significant determinants of this decision. Thus, there was
little basis for determining the characteristics of those selecting the "would-not-vote" (or "not
sure") responses. One reason for this limited ability to explain these responses follows from the
model itself. Our coding of the responses includes the "for" or "against" choices in the same
category--as selecting the voting option. This is not likely to be correct. Indeed both the
original Carson et al. analysis and our analysis suggest that several variables are important
determinants of these different decisions. Often their effects arise in opposite directions for the
"for" and "against" choices. This confounds attempts to explain respondents selecting "would
not vote" over the choices associated with voting--either "for" or "against" decisions.
The next two columns of Table 3 relaxes the "for" and "against" comparability
assumption by using a three outcome, multinomial logit framework, distinguishing "for",
"against", and "would-not-vote" (with the "for" category serving as the base or reference
13
The two variables dropped correspond to qualitative variables (0,1) identifying those respondents who thinkthere would be no damage from another oil spill and those indicating the proposal will not reduce the damageat all. The education variables were added to take account of Krosnick's [1991] arguments that "not sure"responses may be related to satisficing behavior in answering attitude questions.
Referendum Design and Contingent Valuation: The NOAA Panel's No-Vote Recommendation -13-
outcome). This model confirms the earlier Carson et al. analysis. The economic, attitudinal,
and program related variables are significant determinants of respondents' choices. Moreover,
this formulation allows the proposed recoding of the "would-not-vote" (and "not sure")
responses as an "against" vote to be tested. This is accomplished by testing the restriction that
the coefficients of "against" and "would not vote" are equal for each variable. As the chi-
square statistic at the bottom of Table 3 indicates, this hypothesis cannot be rejected. Thus,
tests of the construct validity of CV responses for this survey would not be influenced by the
proposed conservative recoding of "would-not vote" and "not sure" responses.
4. IMPLICATIONS
Offering a "would-not vote" option in referendum format CV surveys significantly
increased the fraction of respondents who chose not to vote "for" or "against" a proposal
offered to them in a CV choice. However, it also seems that these respondents would have
voted "against" the proposal if the "would-not-vote" option had not been offered. This
conclusion follows from the results of three separate tests. The first considered the distribution
of "for" and "against" responses with the standard form of the question, recoding "would-not-
vote" and "not sure" responses as "against." The marginal distributions by tax amount were
not significantly different.
The second type of test considered how these responses would influence a simple
Weibull hazard model used to estimate willingness to pay. The estimated model's parameters
were not significantly different across the split samples. Median and lower bound mean
estimates for WTP were also found to be comparable in the two formulations for the
referendum question. Finally, we considered the effects of the recoding on judgments about
-14- Carson, Hanemann, Kopp, Krosnick, Mitchell, Presser, Ruud, and Smith
the construct validity of CV responses. Using the original construct validity specification
proposed by Carson et al. [1992] as the basis for an expanded model within a multinomial logit
framework, we cannot reject the null hypothesis that the coefficients for determinants of voting
"against" equal those of selecting the "would-not vote" (or "not sure") option.
Although these results relate to only one CV survey, taken together with Schuman and
Presser's findings that filter questions are generally insensitive to the subject of the question,
they suggest that offering a "would-not-vote" option in CV surveys (as proposed by the
NOAA Panel's guidelines) is not likely to alter the conclusions derived from such surveys in
relation to what they would be without them.
Referendum Design and Contingent Valuation: The NOAA Panel's No-Vote Recommendation -15-
REFERENCES
Arrow, K., R. Solow, P. R. Portney, E. E. Leamer, R. Radner and H. Schuman. 1993. "Report
of the NOAA Panel on Contingent Valuation," Federal Register, vol. 58, no. 10 (January
15), pp. 4601-4614.
Bergstrom, Theodore C., Daniel L. Rubinfeld, and Perry Shapiro. 1982. "Micro-Based
Estimates of Demand Functions for Local School Expenditures," Econometrica, vol. 50
(September), pp. 1183-1206.
Carson, Richard T., Nicholas E. Flores, Kerry M. Martin, and Jennifer L. Wright. Forthcoming.
"Contingent Valuation and Revealed Preference Methodologies: Comparing the Estimates
for Quasi Public Goods," Land Economics.
Carson, Richard T., W. Michael Hanemann, Raymond J. Kopp, Jon A. Krosnick, Robert C.
Mitchell, Stanley Presser, Paul A. Ruud, and V. Kerry Smith. 1994. Prospective Interim
Lost Use Value Due to DDT and PCB Contamination in the Southern California Bight.
Report to National Oceanic and Atmospheric Administration, Natural Resource Damage
Assessment, Inc., La Jolla, Calif., September.
Carson, Richard T., W. Michael Hanemann, Raymond J. Kopp, Jon A. Krosnick, Robert C.
Mitchell, Stanley Presser, Paul A. Ruud, and V. Kerry Smith, with M. Conaway and K.
Martin. 1995. "Temporal Reliability of Estimates From Contingent Valuation," Discussion
Paper 95-37, Resources for the Future, Washington, D.C., August.
Carson, R. T., R. C. Mitchell, W. M. Hanemann, R. J. Kopp, S. Presser and P. A. Ruud. 1992.
A Contingent Valuation Study of Lost Passive Use Values Resulting from the Exxon Valdez
Oil Spill. Report to the Attorney General of the State of Alaska, Natural Resource Damage
Assessment Inc., La Jolla, Calif., November 10.
-16- Carson, Hanemann, Kopp, Krosnick, Mitchell, Presser, Ruud, and Smith
Diamond, Peter A., and Jerry A. Hausman. 1994. "Contingent Valuation: Is Some Number
Better Than No Number?" Journal of Economic Perspectives, vol. 8 (Fall), pp. 45-64.
Gilljam, Mikael, and Donald Granberg. 1993. "Should We Take Don't Know for an Answer?"
Public Opinion Quarterly, vol. 57 (Fall), pp. 348-357.
Hanemann, W. Michael. 1994. "Valuing the Environment through Contingent Valuation,"
Journal of Economics Perspectives, vol. 8 (Fall), pp. 19-44.
Krosnick, Jon A. 1991. "Response Strategies for Coping With the Cognitive Demands of
Attitude Measures in Surveys," Applied Cognitive Psychology, vol. 5 (May/June), pp. 213-
236.
Mitchell, Robert Cameron, and Richard T. Carson. 1989. Using Surveys to Value Public
Goods: The Contingent Valuation Method (Washington, D.C., Resources for the Future).
Portney, Paul R. 1994. "The Contingent Valuation Debate: Why Economists Should Care,"
Journal of Economic Perspectives, vol. 8 (Fall), pp. 3-17.
Ready, Richard C., John Whitehead, and Glenn C. Blomquist. 1991. "Polychotomous Choice
Valuation Questions," paper presented at the U.S.D.A. W-133 Meeting, Monterey, Calif.,
February.
Schuman, Howard. 1994. "The Sensitivity of CV Outcomes to CV Survey Methods," paper
presented at DOE/EPA Workshop on Using Contingent Valuation to Measure Non-Market
Values, May 19-20.
Schuman, Howard, and Stanley Presser. 1981. Questions and Answers in Attitude Surveys:
Experiments on Question Form, Wording and Context (New York, N.Y., Academic Press).
Referendum Design and Contingent Valuation: The NOAA Panel's No-Vote Recommendation -17-
Turnbull, Bruce W. 1976. "The Empirical Distribution Function with Arbitrarily Grouped,
Censored and Truncated Data," Journal of the Royal Statistical Society, B38 (no. 3),
pp. 290-295.