Embed Size (px)
Citation preview
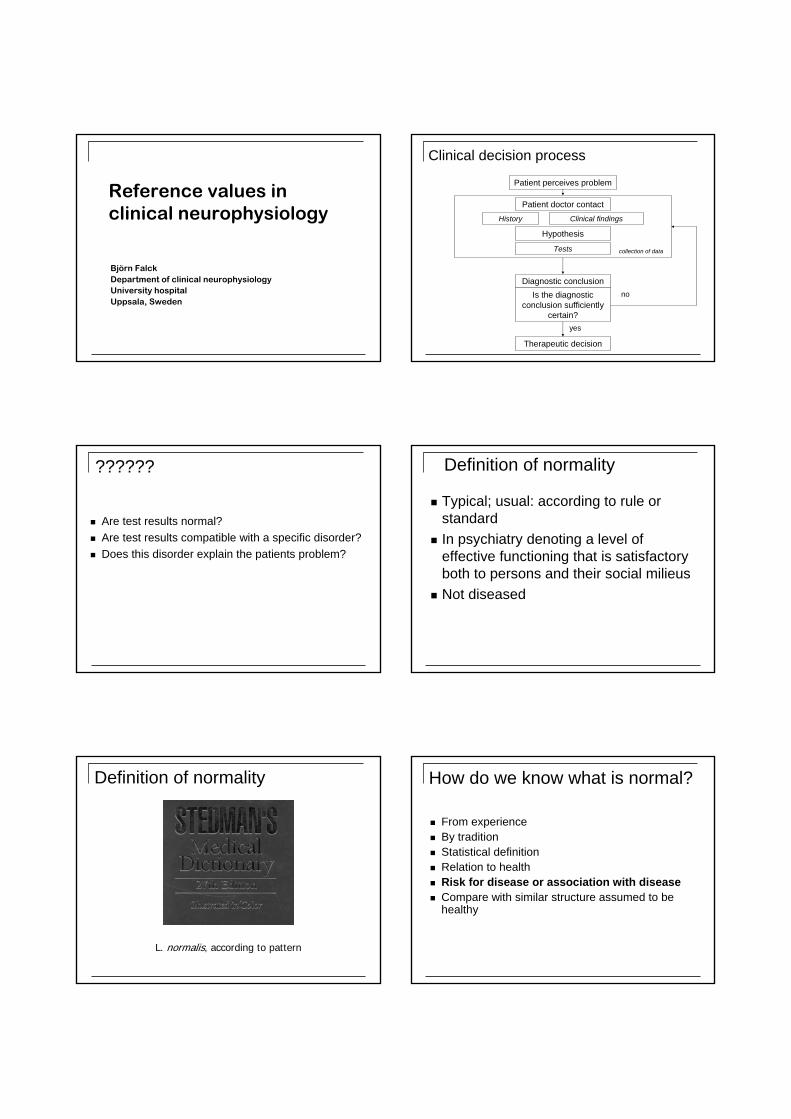
Björn FalckDepartment of clinical neurophysiologyUniversity hospitalUppsala, Sweden
Reference values in clinical neurophysiology
Clinical decision process
Patient doctor contactHistory Clinical findings
Tests
Diagnostic conclusionIs the diagnostic
conclusion sufficiently certain?
Therapeutic decision
Patient perceives problem
collection of data
Hypothesis
yes
no
??????
Are test results normal?Are test results compatible with a specific disorder?Does this disorder explain the patients problem?
Definition of normality
Typical; usual: according to rule or standardIn psychiatry denoting a level of effective functioning that is satisfactory both to persons and their social milieusNot diseased
Definition of normality
L. normalis, according to pattern
How do we know what is normal?
From experienceBy traditionStatistical definitionRelation to healthRisk for disease or association with diseaseCompare with similar structure assumed to be healthy
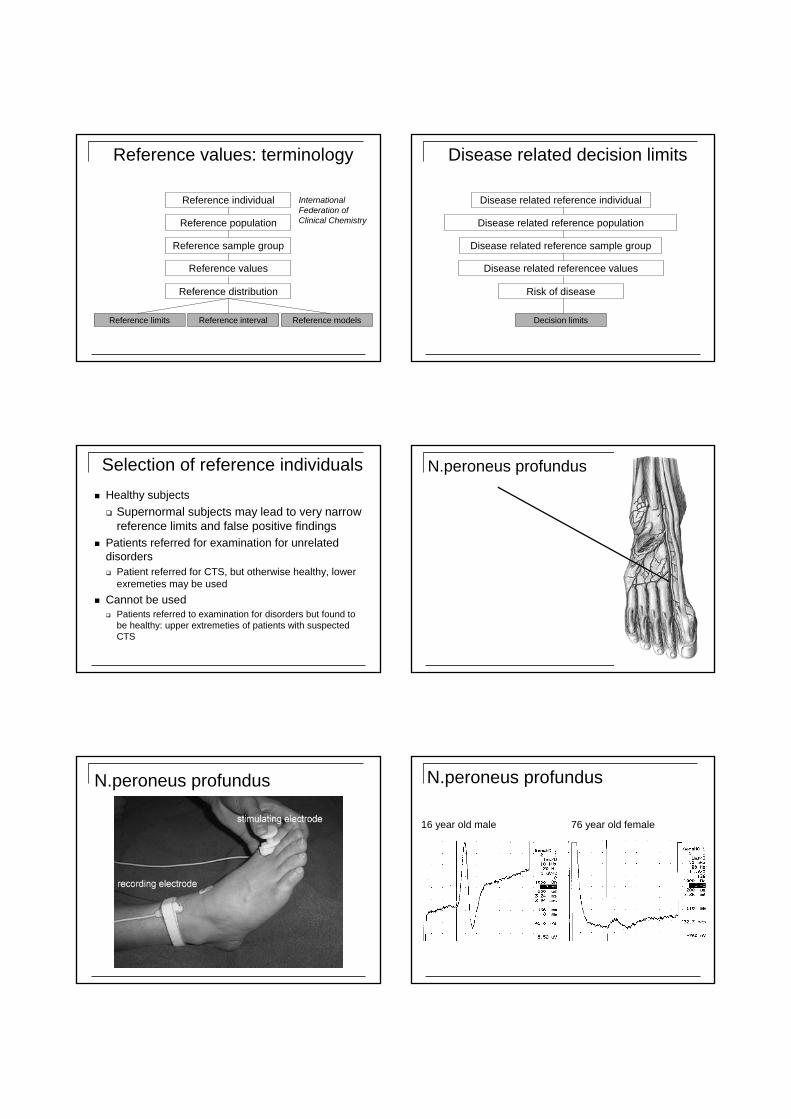
Reference values: terminology
International Federation of Clinical Chemistry
Reference individual
Reference population
Reference sample group
Reference values
Reference distribution
Reference limits Reference interval Reference models
Disease related decision limits
Disease related reference individual
Disease related reference population
Disease related reference sample group
Disease related referencee values
Risk of disease
Decision limits
Selection of reference individualsHealthy subjects
Supernormal subjects may lead to very narrow reference limits and false positive findings
Patients referred for examination for unrelated disorders
Patient referred for CTS, but otherwise healthy, lower exremeties may be used
Cannot be usedPatients referred to examination for disorders but found to be healthy: upper extremeties of patients with suspected CTS
N.peroneus profundus
N.peroneus profundus N.peroneus profundus
16 year old male 76 year old female
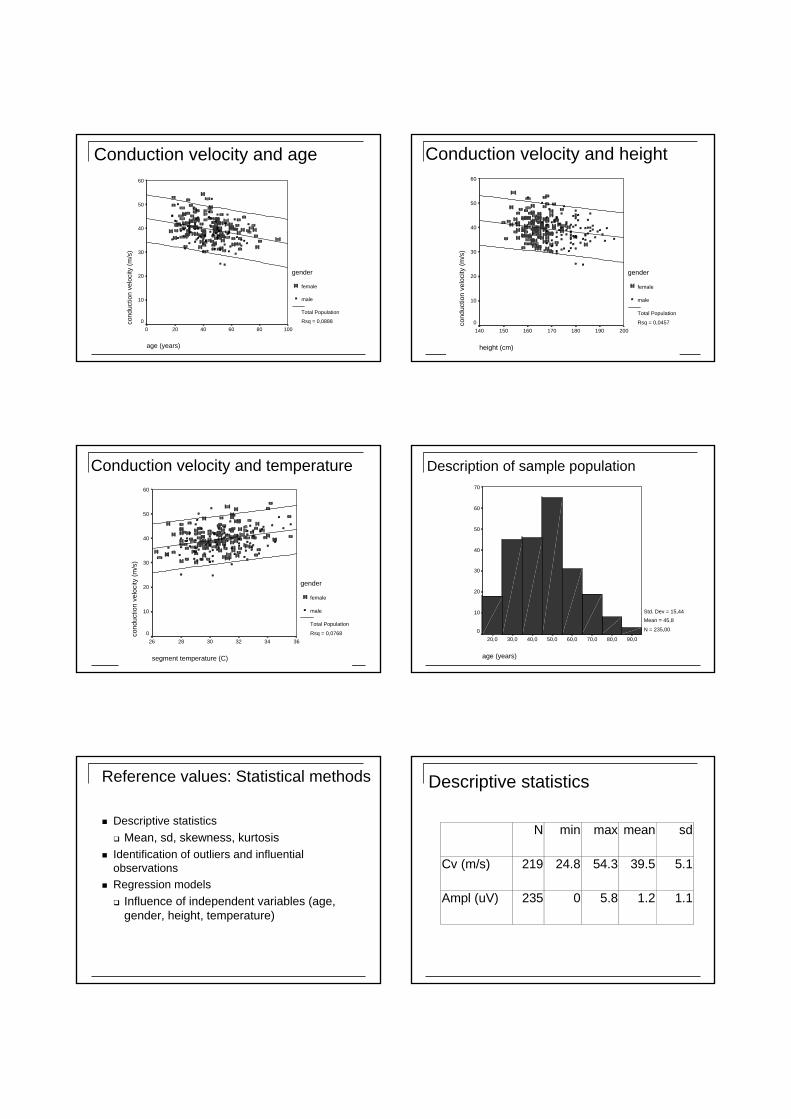
Conduction velocity and age
age (years)
100806040200
cond
uctio
n ve
loci
ty (m
/s)
60
50
40
30
20
10
0
gender
female
male
Total Population
Rsq = 0,0888
Conduction velocity and height
height (cm)
200190180170160150140
cond
uctio
n ve
loci
ty (m
/s)
60
50
40
30
20
10
0
gender
female
male
Total Population
Rsq = 0,0457
Conduction velocity and temperature
segment temperature (C)
363432302826
cond
uctio
n ve
loci
ty (m
/s)
60
50
40
30
20
10
0
gender
female
male
Total Population
Rsq = 0,0768
Description of sample population
age (years)
90,080,070,060,050,040,030,020,0
70
60
50
40
30
20
10
0
Std. Dev = 15,44 Mean = 45,8
N = 235,00
Reference values: Statistical methods
Descriptive statisticsMean, sd, skewness, kurtosis
Identification of outliers and influential observationsRegression models
Influence of independent variables (age, gender, height, temperature)
Descriptive statistics
N min max mean sd
Cv (m/s) 219 24.8 54.3 39.5 5.1
Ampl (uV) 235 0 5.8 1.2 1.1
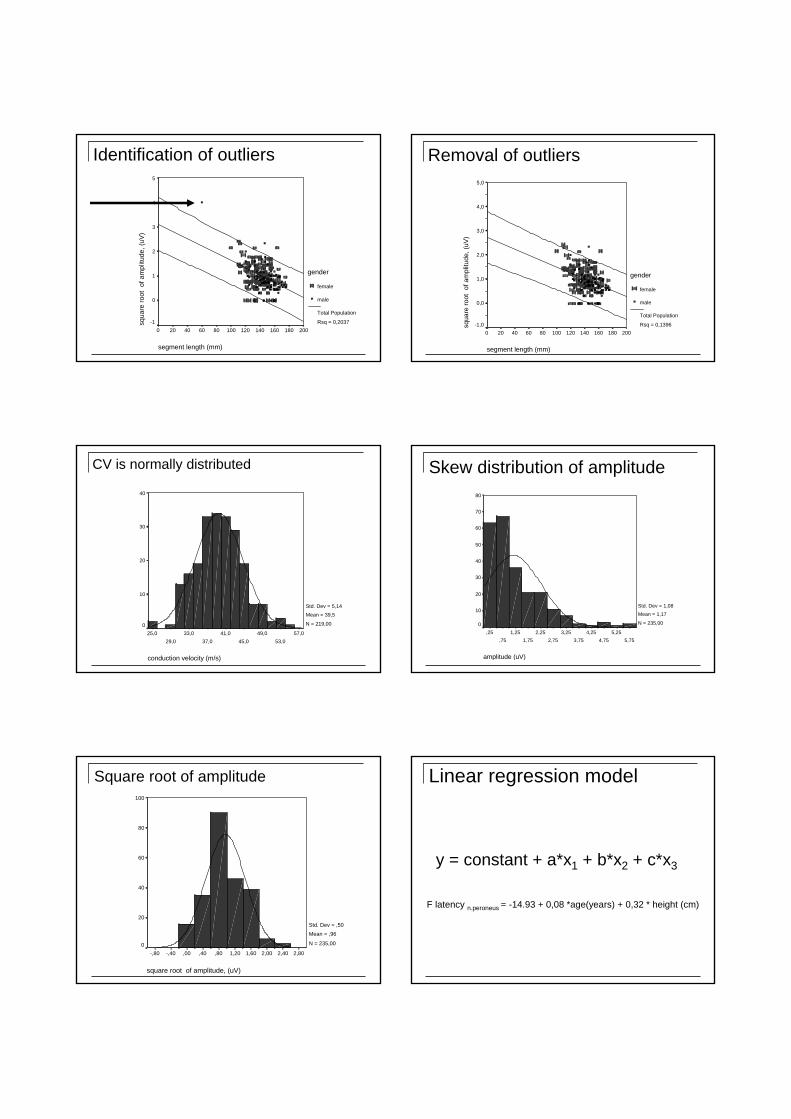
Identification of outliers
segment length (mm)
200180160140120100806040200
squa
re ro
ot o
f am
plitu
de, (
uV)
5
4
3
2
1
0
-1
gender
female
male
Total Population
Rsq = 0,2037
Removal of outliers
segment length (mm)
200180160140120100806040200
squa
re ro
ot o
f am
plitu
de, (
uV)
5,0
4,0
3,0
2,0
1,0
0,0
-1,0
gender
female
male
Total Population
Rsq = 0,1396
CV is normally distributed
conduction velocity (m/s)
57,053,0
49,045,0
41,037,0
33,029,0
25,0
40
30
20
10
0
Std. Dev = 5,14 Mean = 39,5
N = 219,00
Skew distribution of amplitude
amplitude (uV)
5,755,25
4,754,25
3,753,25
2,752,25
1,751,25
,75,25
80
70
60
50
40
30
20
10
0
Std. Dev = 1,08 Mean = 1,17
N = 235,00
Square root of amplitude
square root of amplitude, (uV)
2,802,402,001,601,20,80,40,00-,40-,80
100
80
60
40
20
0
Std. Dev = ,50 Mean = ,96
N = 235,00
Linear regression model
y = constant + a*x1 + b*x2 + c*x3
F latency n.peroneus = -14.93 + 0,08 *age(years) + 0,32 * height (cm)
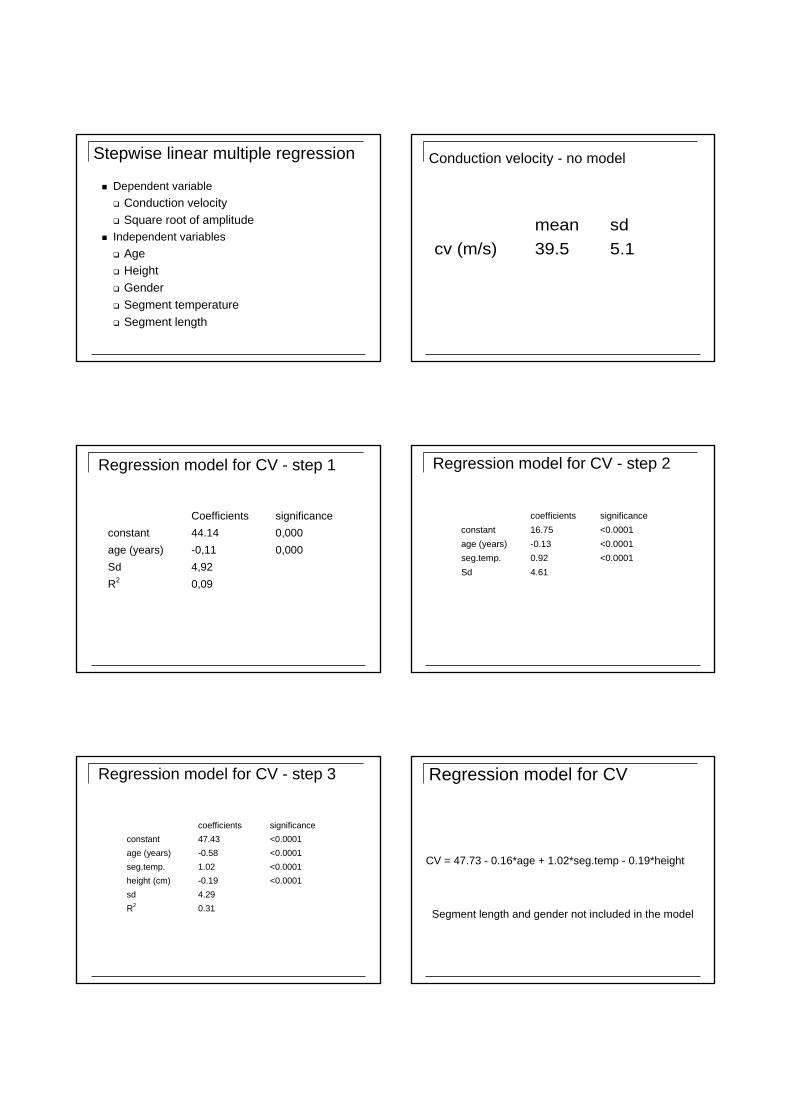
Stepwise linear multiple regression
Dependent variableConduction velocitySquare root of amplitude
Independent variablesAgeHeightGenderSegment temperatureSegment length
Conduction velocity - no model
mean sd cv (m/s) 39.5 5.1
Regression model for CV - step 1
Coefficients significance constant 44.14 0,000 age (years) -0,11 0,000 Sd 4,92 R2 0,09
Regression model for CV - step 2
coefficients significance constant 16.75 <0.0001 age (years) -0.13 <0.0001 seg.temp. 0.92 <0.0001 Sd 4.61
Regression model for CV - step 3
coefficients significance constant 47.43 <0.0001 age (years) -0.58 <0.0001 seg.temp. 1.02 <0.0001 height (cm) -0.19 <0.0001 sd 4.29 R2 0.31
Regression model for CV
CV = 47.73 - 0.16*age + 1.02*seg.temp - 0.19*height
Segment length and gender not included in the model
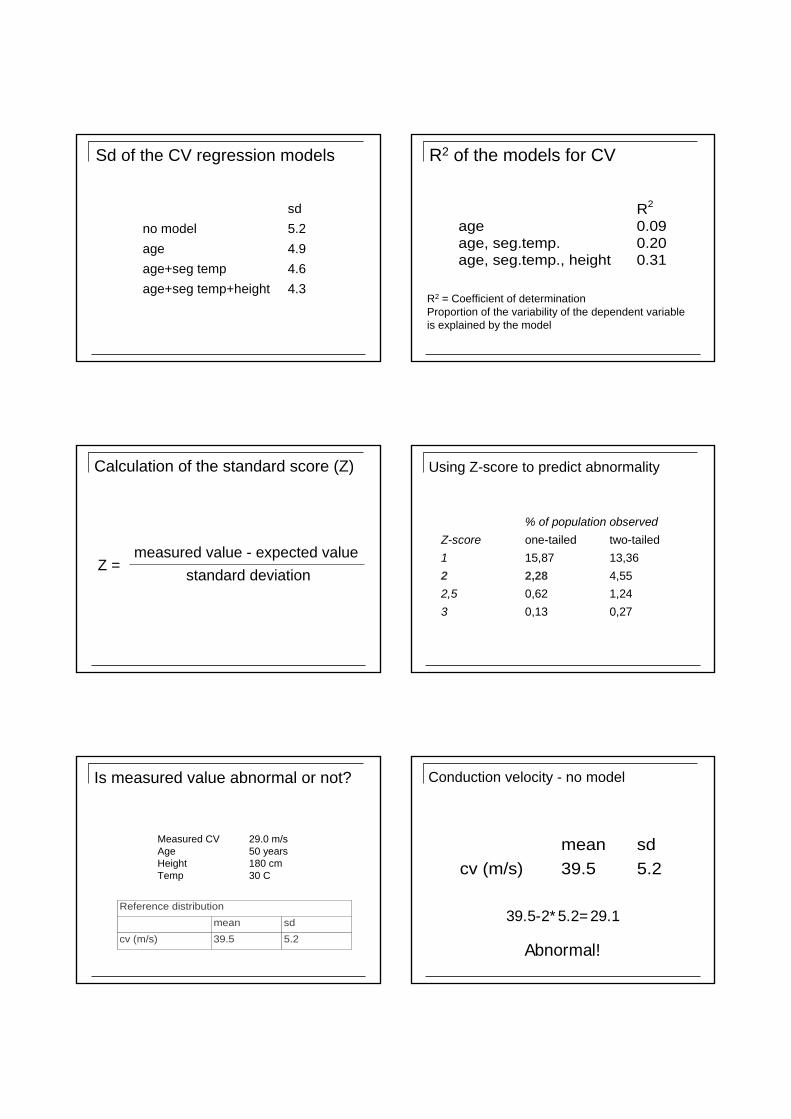
Sd of the CV regression models
sd no model 5.2 age 4.9 age+seg temp 4.6 age+seg temp+height 4.3
R2 of the models for CV
R2 age 0.09 age, seg.temp. 0.20 age, seg.temp., height 0.31
R2 = Coefficient of determinationProportion of the variability of the dependent variable is explained by the model
Calculation of the standard score (Z)
Z =measured value - expected value
standard deviation
Using Z-score to predict abnormality
% of population observed Z-score one-tailed two-tailed 1 15,87 13,36 2 2,28 4,55 2,5 0,62 1,24 3 0,13 0,27
Is measured value abnormal or not?
Reference distribution mean sd cv (m/s) 39.5 5.2
Measured CV 29.0 m/sAge 50 yearsHeight 180 cmTemp 30 C
Conduction velocity - no model
mean sd cv (m/s) 39.5 5.2
39.5-2*5.2=29.1
Abnormal!
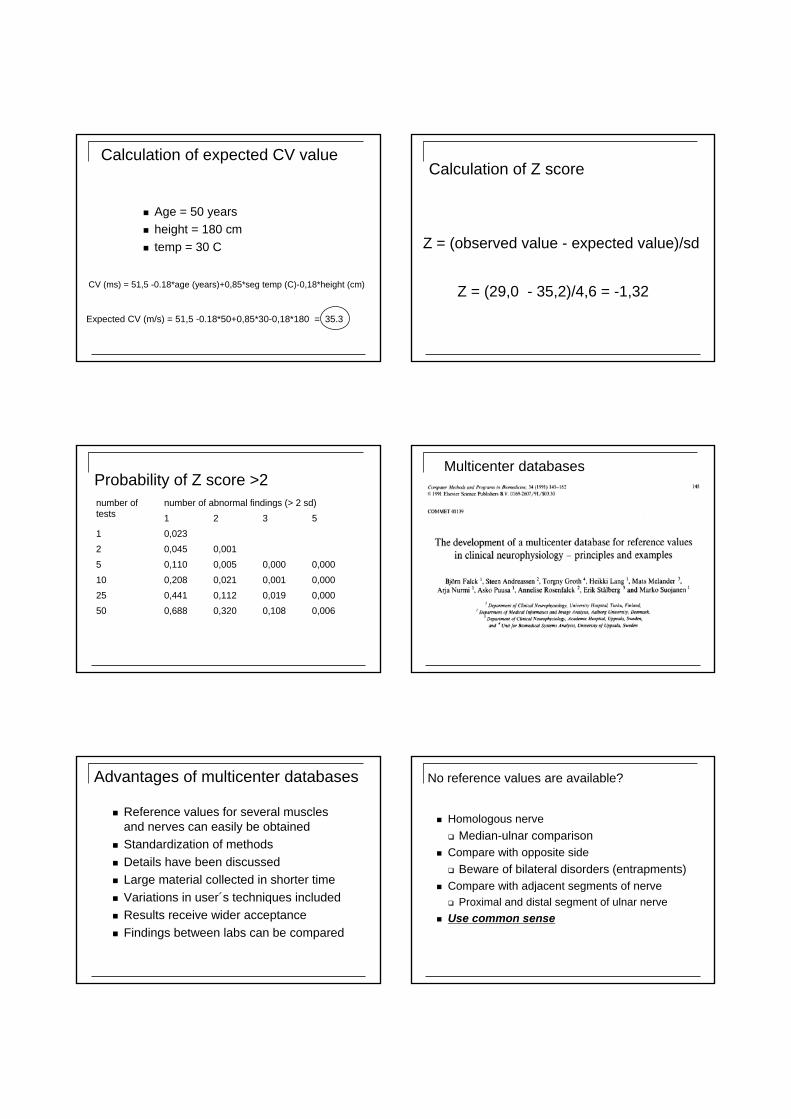
Calculation of expected CV value
Age = 50 yearsheight = 180 cmtemp = 30 C
Expected CV (m/s) = 51,5 -0.18*50+0,85*30-0,18*180 = 35.3
CV (ms) = 51,5 -0.18*age (years)+0,85*seg temp (C)-0,18*height (cm)
Calculation of Z score
Z = (observed value - expected value)/sd
Z = (29,0 - 35,2)/4,6 = -1,32
Probability of Z score >2 number of tests
number of abnormal findings (> 2 sd) 1 2 3 5
1 0,023 2 0,045 0,001 5 0,110 0,005 0,000 0,000 10 0,208 0,021 0,001 0,000 25 0,441 0,112 0,019 0,000 50 0,688 0,320 0,108 0,006
Multicenter databases
Advantages of multicenter databases
Reference values for several muscles and nerves can easily be obtainedStandardization of methodsDetails have been discussedLarge material collected in shorter timeVariations in user´s techniques includedResults receive wider acceptanceFindings between labs can be compared
No reference values are available?
Homologous nerveMedian-ulnar comparison
Compare with opposite sideBeware of bilateral disorders (entrapments)
Compare with adjacent segments of nerveProximal and distal segment of ulnar nerve
Use common sense
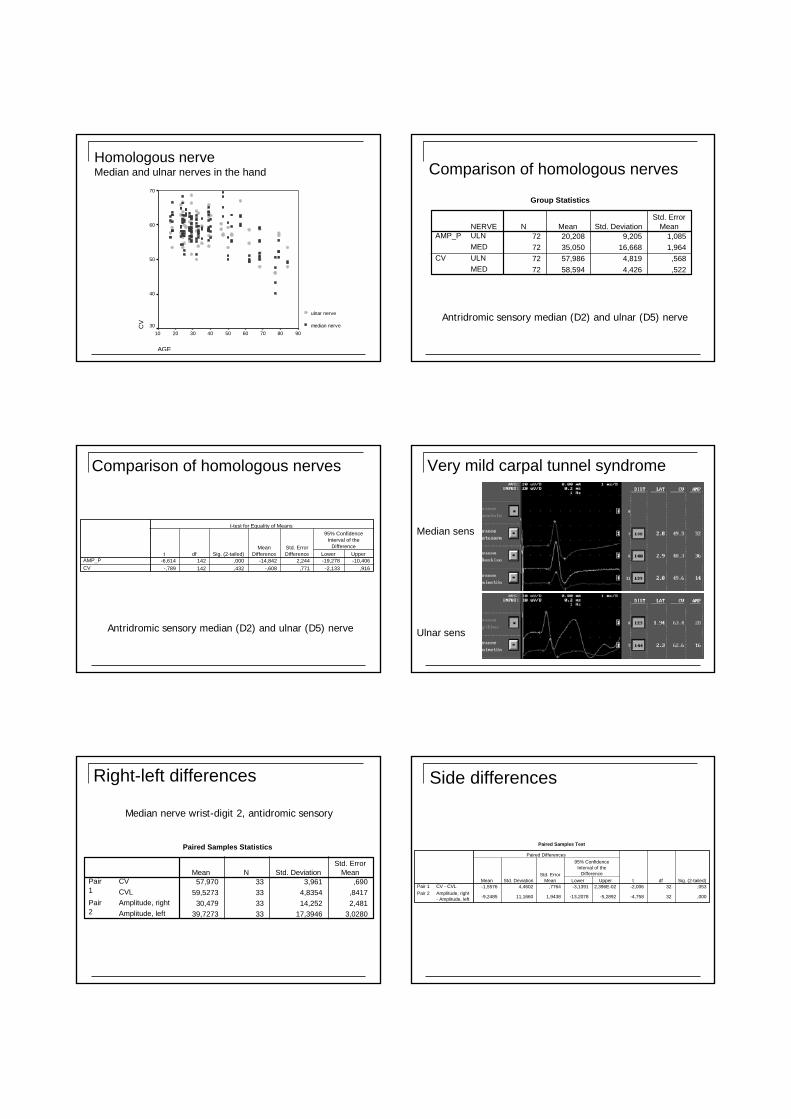
Homologous nerveMedian and ulnar nerves in the hand
AGE
908070605040302010
CV
70
60
50
40
30
ulnar nerve
median nerve
Comparison of homologous nerves
Group Statistics
72 20,208 9,205 1,08572 35,050 16,668 1,96472 57,986 4,819 ,56872 58,594 4,426 ,522
NERVEULNMEDULNMED
AMP_P
CV
N Mean Std. DeviationStd. Error
Mean
Antridromic sensory median (D2) and ulnar (D5) nerve
Comparison of homologous nerves
-6,614 142 ,000 -14,842 2,244 -19,278 -10,406-,789 142 ,432 -,608 ,771 -2,133 ,916
AMP_PCV
t df Sig. (2-tailed)Mean
DifferenceStd. ErrorDifference Lower Upper
95% ConfidenceInterval of the
Difference
t-test for Equality of Means
Antridromic sensory median (D2) and ulnar (D5) nerve
Very mild carpal tunnel syndrome
Median sens
Ulnar sens
Right-left differences
Paired Samples Statistics
57,970 33 3,961 ,69059,5273 33 4,8354 ,841730,479 33 14,252 2,481
39,7273 33 17,3946 3,0280
CVCVL
Pair1
Amplitude, rightAmplitude, left
Pair2
Mean N Std. DeviationStd. Error
Mean
Median nerve wrist-digit 2, antidromic sensory
Side differences
Paired Samples Test
-1,5576 4,4602 ,7764 -3,1391 2,396E-02 -2,006 32 ,053
-9,2485 11,1660 1,9438 -13,2078 -5,2892 -4,758 32 ,000
CV - CVLPair 1Amplitude, right- Amplitude, left
Pair 2
Mean Std. DeviationStd. Error
Mean Lower Upper
95% ConfidenceInterval of the
Difference
Paired Differences
t df Sig. (2-tailed)
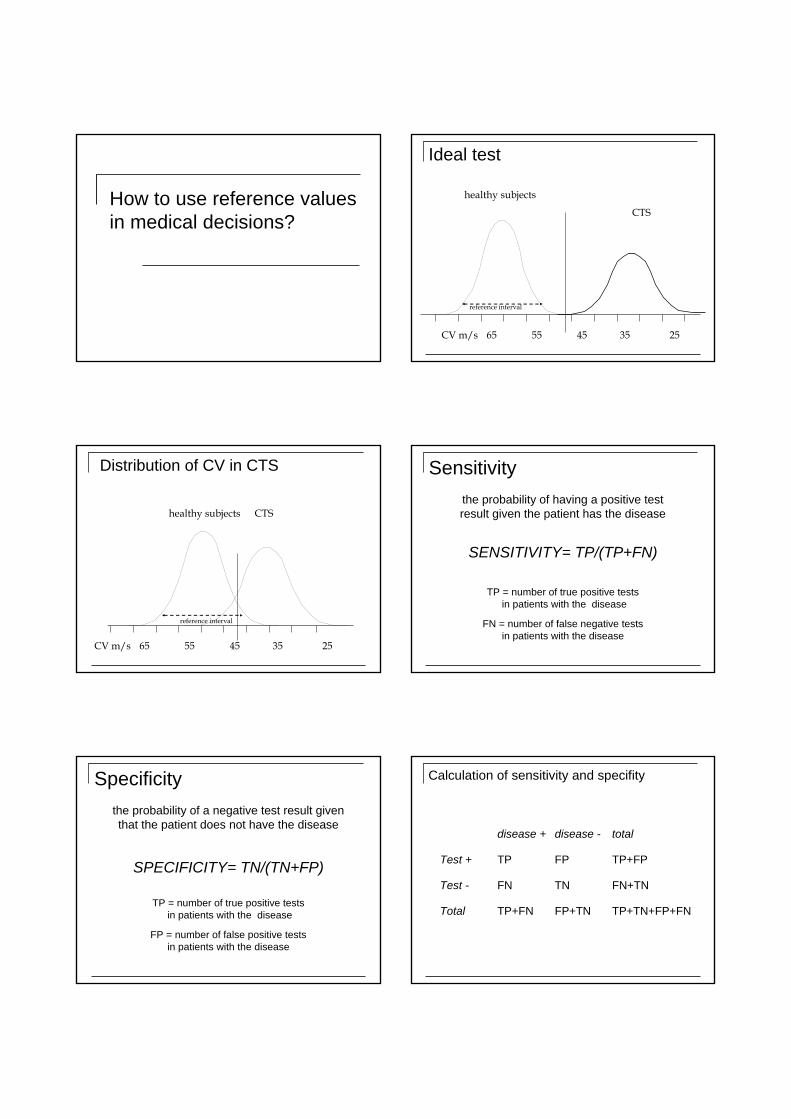
How to use reference values in medical decisions?
Ideal test
healthy subjects
CTS
CV m/s 4565 35 2555
reference interval
Distribution of CV in CTS
healthy subjects CTS
CV m/s 4565 35 2555
reference interval
Sensitivity
SENSITIVITY= TP/(TP+FN)
TP = number of true positive tests in patients with the disease
FN = number of false negative tests in patients with the disease
the probability of having a positive test result given the patient has the disease
Specificity
SPECIFICITY= TN/(TN+FP)
the probability of a negative test result given that the patient does not have the disease
TP = number of true positive tests in patients with the disease
FP = number of false positive tests in patients with the disease
Calculation of sensitivity and specifity
disease + disease - total
Test + TP FP TP+FP
Test - FN TN FN+TN
Total TP+FN FP+TN TP+TN+FP+FN
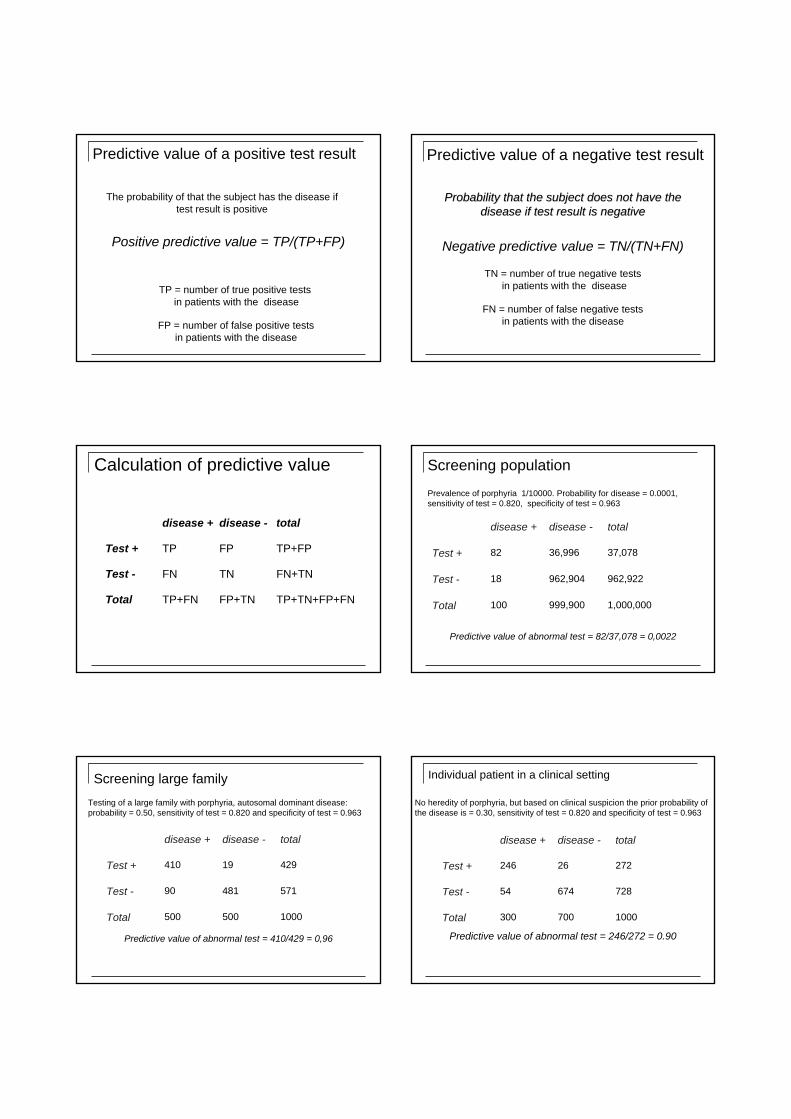
Predictive value of a positive test result
Positive predictive value = TP/(TP+FP)
The probability of that the subject has the disease if test result is positive
TP = number of true positive tests in patients with the disease
FP = number of false positive tests in patients with the disease
Predictive value of a negative test result
Negative predictive value = TN/(TN+FN)
Probability that the subject does not have the Probability that the subject does not have the disease if test result is negativedisease if test result is negative
TN = number of true negative tests in patients with the disease
FN = number of false negative tests in patients with the disease
Calculation of predictive value
disease + disease - total
Test + TP FP TP+FP
Test - FN TN FN+TN
Total TP+FN FP+TN TP+TN+FP+FN
Screening population
disease + disease - total
Test + 82 36,996 37,078
Test - 18 962,904 962,922
Total 100 999,900 1,000,000
Prevalence of porphyria 1/10000. Probability for disease = 0.0001, sensitivity of test = 0.820, specificity of test = 0.963
Predictive value of abnormal test = 82/37,078 = 0,0022
Screening large family
disease + disease - total
Test + 410 19 429
Test - 90 481 571
Total 500 500 1000
Testing of a large family with porphyria, autosomal dominant disease: probability = 0.50, sensitivity of test = 0.820 and specificity of test = 0.963
Predictive value of abnormal test = 410/429 = 0,96
Individual patient in a clinical setting
disease + disease - total
Test + 246 26 272
Test - 54 674 728
Total 300 700 1000
No heredity of porphyria, but based on clinical suspicion the prior probability of the disease is = 0.30, sensitivity of test = 0.820 and specificity of test = 0.963
Predictive value of abnormal test = 246/272 = 0.90
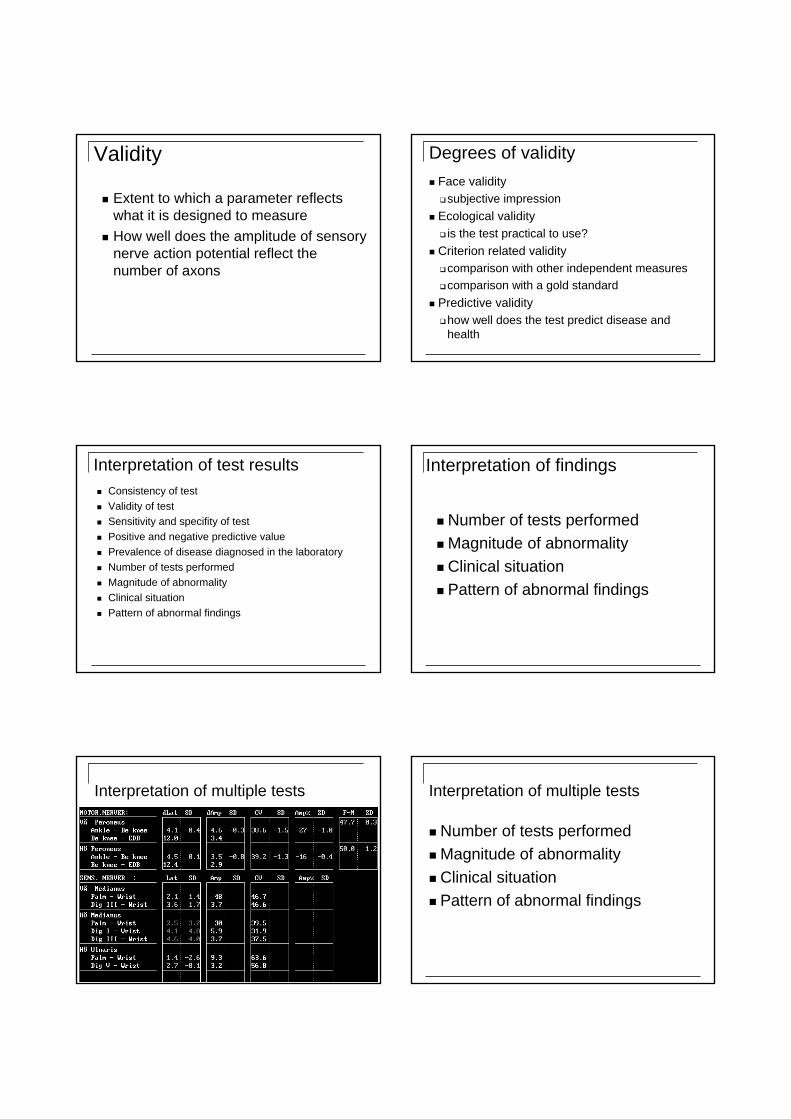
Validity
Extent to which a parameter reflects what it is designed to measureHow well does the amplitude of sensory nerve action potential reflect the number of axons
Degrees of validityFace validity
subjective impressionEcological validity
is the test practical to use?Criterion related validity
comparison with other independent measurescomparison with a gold standard
Predictive validityhow well does the test predict disease and health
Interpretation of test resultsConsistency of test Validity of testSensitivity and specifity of testPositive and negative predictive valuePrevalence of disease diagnosed in the laboratoryNumber of tests performedMagnitude of abnormalityClinical situationPattern of abnormal findings
Interpretation of findings
Number of tests performedMagnitude of abnormalityClinical situationPattern of abnormal findings
Interpretation of multiple tests Interpretation of multiple tests
Number of tests performedMagnitude of abnormalityClinical situationPattern of abnormal findings

Game over