Embed Size (px)
Citation preview
• Distinct ERP and CSD components were observed in a parallel temporal sequence for each modality, with modality-specific latencies and distinct topographies corresponding to the anatomy of visual and auditory pathways (Fig. 4C-E; Kayser et al., 2003). The reference-free CSD components provide a conservative, but systematic bridge between surface potentials and their underlying neuroanatomical generators.
• Given the longer response latencies to auditory than visual stimuli, differentially affecting old and new items (Fig. 1), the combined extraction of stimulus- and response-locked ERP/CSD components (i.e., their temporal and topographic characteristics) allowed a joint, direct evaluation of stimulus- and response-related old/new effects. Both stimulus and response onset triggered unique and common old/new effects.
• An unbiased statistical evaluation of topographical old/new effects was achieved through randomizations of complete component topographies (Fig. 5; Maris, 2004).
A A
AbstractAbstract
ReferenceReference--independent ERP old/new effects of auditory and visual word recoindependent ERP old/new effects of auditory and visual word recognition memory:gnition memory:Joint extraction of stimulusJoint extraction of stimulus-- and responseand response--locked neuronal generator patternslocked neuronal generator patterns
Jürgen KayserJürgen Kayser1,21,2, Craig E. Tenke, Craig E. Tenke1,21,2, Nathan A. Gates, Nathan A. Gates11, Gerard E. Bruder, Gerard E. Bruder1,21,2
1 Division of Cognitive Neuroscience, New York State Psychiatric Institute, New York, NY; 2 Department of Psychiatry, College of Physicians and Surgeons, Columbia University, New York, NY
http://http://psychophysiology.cpmc.columbia.edupsychophysiology.cpmc.columbia.edu
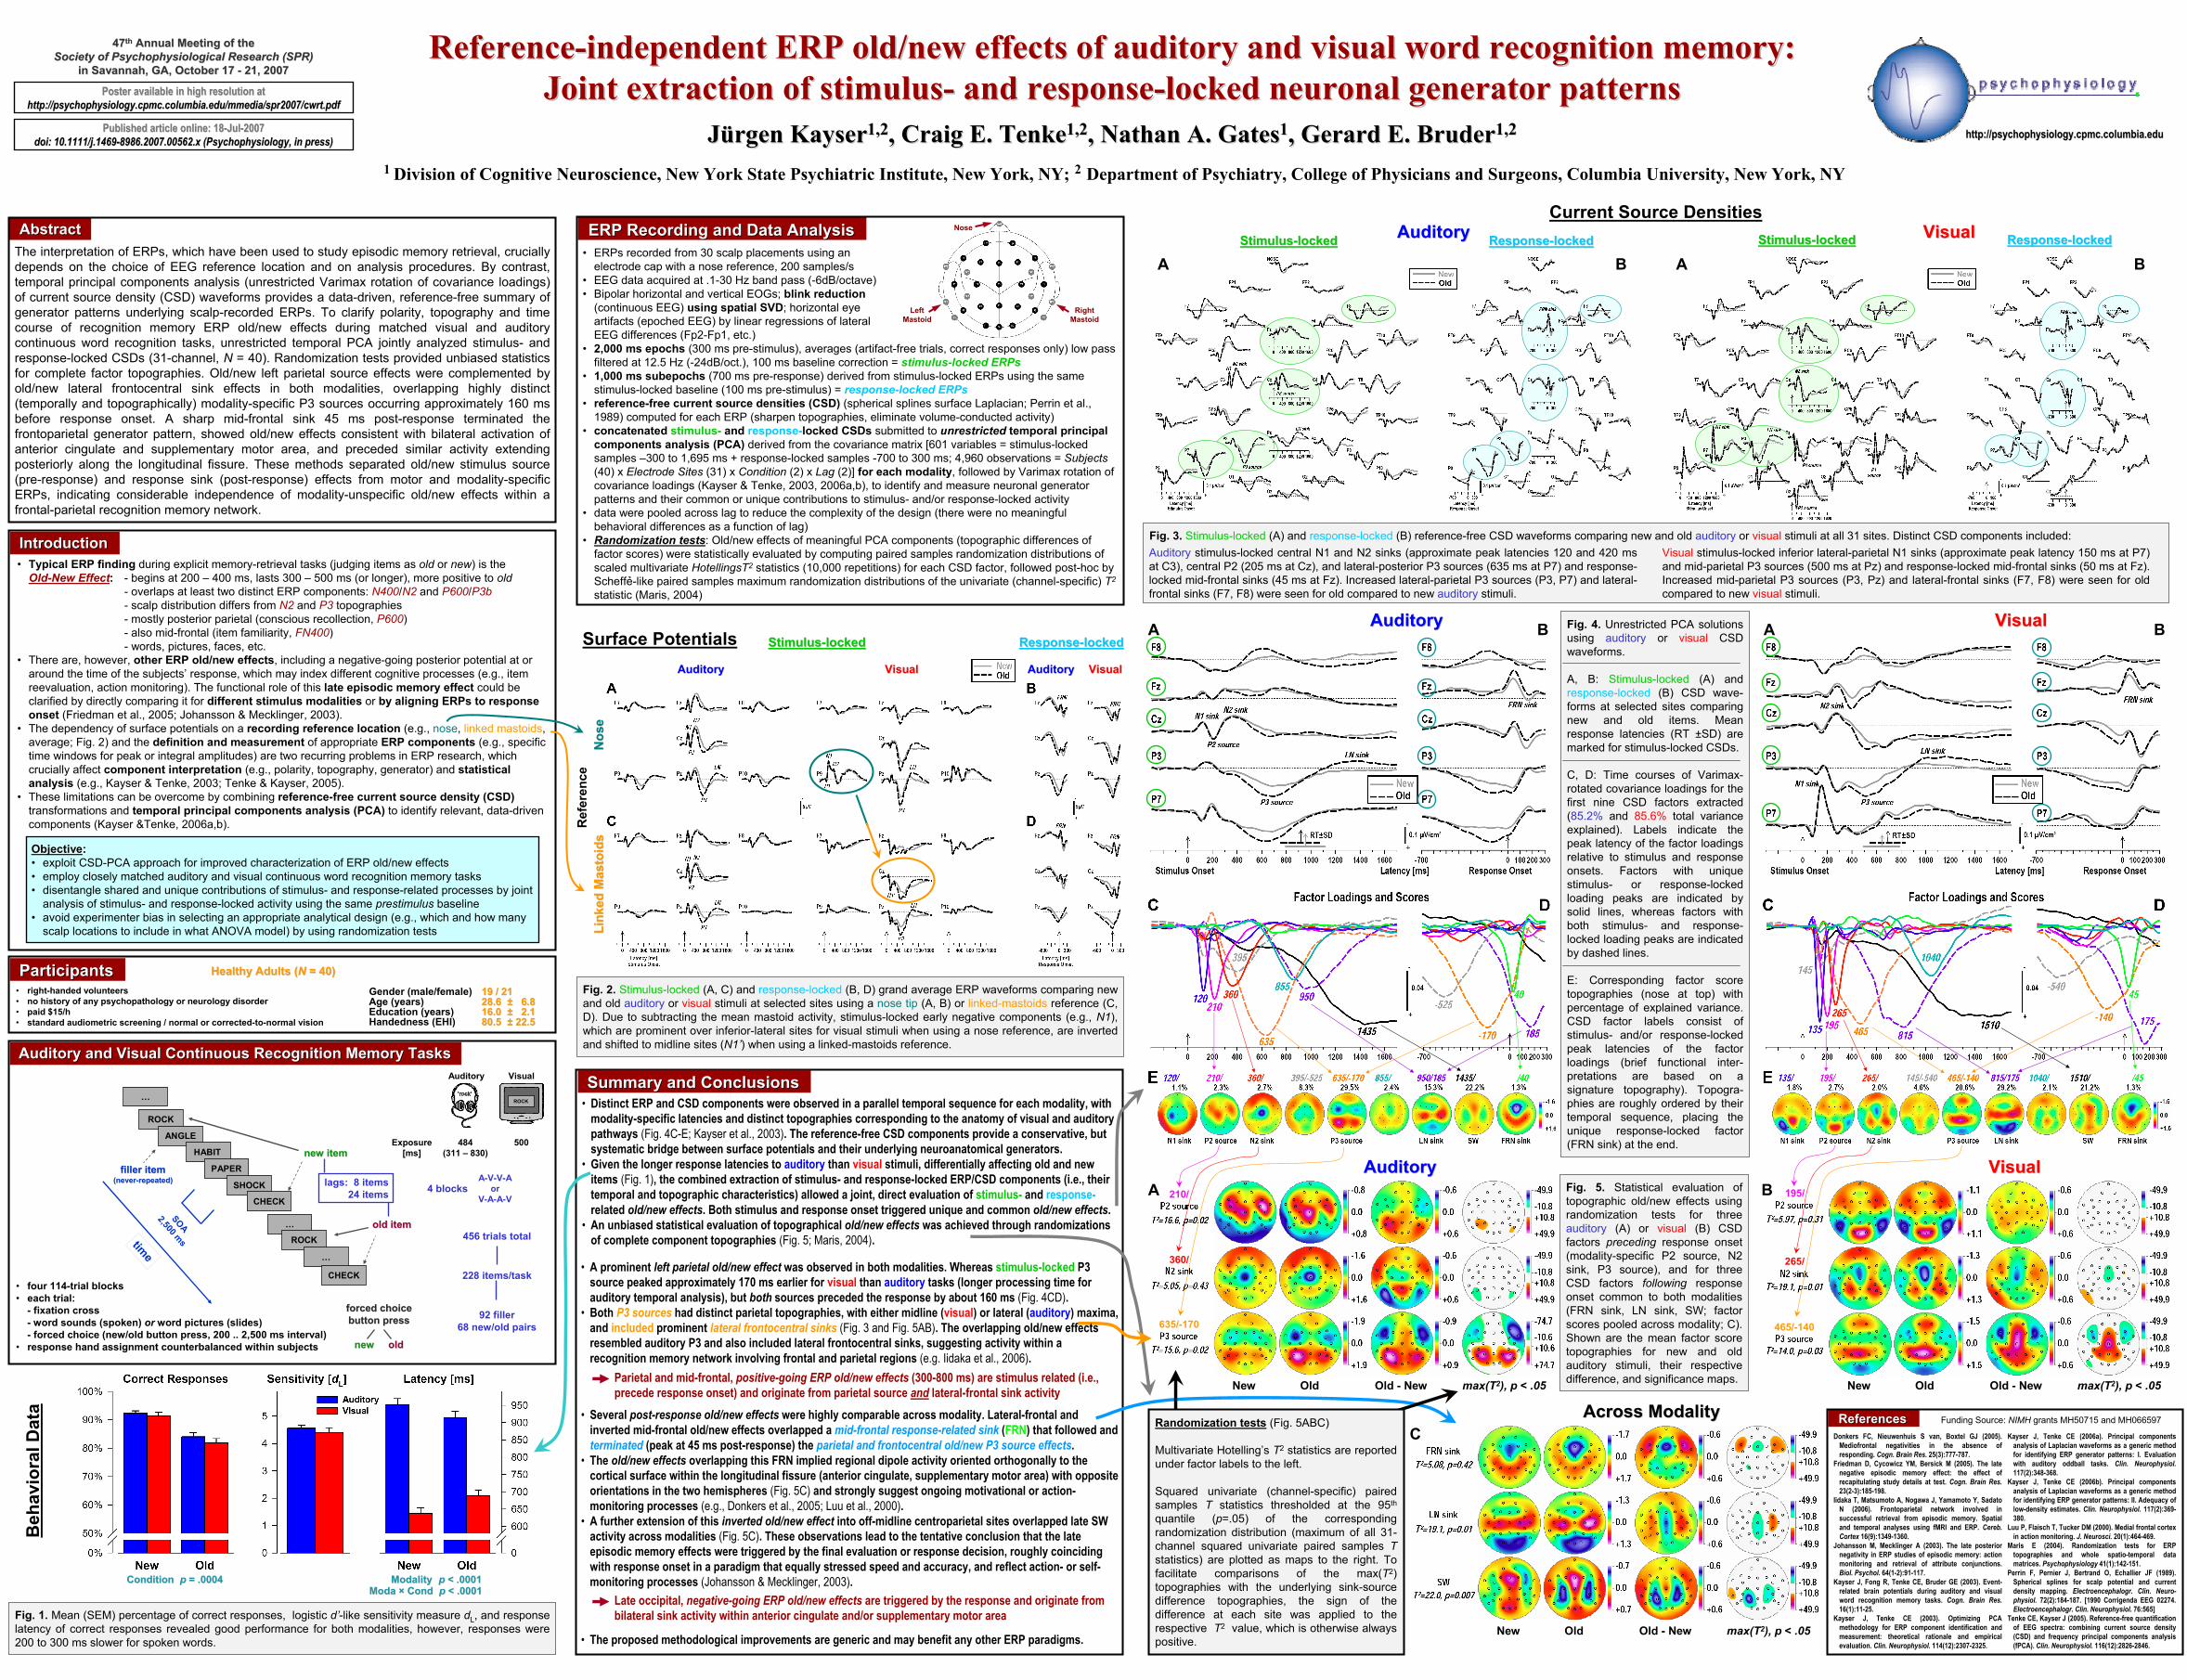
The interpretation of ERPs, which have been used to study episodic memory retrieval, crucially depends on the choice of EEG reference location and on analysis procedures. By contrast, temporal principal components analysis (unrestricted Varimax rotation of covariance loadings) of current source density (CSD) waveforms provides a data-driven, reference-free summary of generator patterns underlying scalp-recorded ERPs. To clarify polarity, topography and time course of recognition memory ERP old/new effects during matched visual and auditory continuous word recognition tasks, unrestricted temporal PCA jointly analyzed stimulus- and response-locked CSDs (31-channel, N = 40). Randomization tests provided unbiased statistics for complete factor topographies. Old/new left parietal source effects were complemented by old/new lateral frontocentral sink effects in both modalities, overlapping highly distinct (temporally and topographically) modality-specific P3 sources occurring approximately 160 ms before response onset. A sharp mid-frontal sink 45 ms post-response terminated the frontoparietal generator pattern, showed old/new effects consistent with bilateral activation of anterior cingulate and supplementary motor area, and preceded similar activity extending posteriorly along the longitudinal fissure. These methods separated old/new stimulus source (pre-response) and response sink (post-response) effects from motor and modality-specific ERPs, indicating considerable independence of modality-unspecific old/new effects within a frontal-parietal recognition memory network.
4747thth Annual Meeting of theAnnual Meeting of theSociety of Society of PsychophysiologicalPsychophysiological Research (SPR)Research (SPR)
in Savannah, GA, October 17 in Savannah, GA, October 17 -- 21, 2007 21, 2007
Poster available in high resolution atPoster available in high resolution athttp://psychophysiology.cpmc.columbia.edu/mmedia/spr2007/cwrt.pdhttp://psychophysiology.cpmc.columbia.edu/mmedia/spr2007/cwrt.pdff
Published article online: 18Published article online: 18--JulJul--20072007doidoi: 10.1111/j.1469: 10.1111/j.1469--8986.2007.00562.x (Psychophysiology, in press)8986.2007.00562.x (Psychophysiology, in press)
• four 114-trial blocks• each trial:
- fixation cross- word sounds (spoken) or word pictures (slides)- forced choice (new/old button press, 200 .. 2,500 ms interval)
• response hand assignment counterbalanced within subjects
• Typical ERP finding during explicit memory-retrieval tasks (judging items as old or new) is theOld-New Effect: - begins at 200 – 400 ms, lasts 300 – 500 ms (or longer), more positive to old
- overlaps at least two distinct ERP components: N400/N2 and P600/P3b- scalp distribution differs from N2 and P3 topographies- mostly posterior parietal (conscious recollection, P600)- also mid-frontal (item familiarity, FN400)- words, pictures, faces, etc.
• There are, however, other ERP old/new effects, including a negative-going posterior potential at or around the time of the subjects’ response, which may index different cognitive processes (e.g., item reevaluation, action monitoring). The functional role of this late episodic memory effect could be clarified by directly comparing it for different stimulus modalities or by aligning ERPs to response onset (Friedman et al., 2005; Johansson & Mecklinger, 2003).
• The dependency of surface potentials on a recording reference location (e.g., nose, linked mastoids, average; Fig. 2) and the definition and measurement of appropriate ERP components (e.g., specific time windows for peak or integral amplitudes) are two recurring problems in ERP research, which crucially affect component interpretation (e.g., polarity, topography, generator) and statistical analysis (e.g., Kayser & Tenke, 2003; Tenke & Kayser, 2005).
• These limitations can be overcome by combining reference-free current source density (CSD)transformations and temporal principal components analysis (PCA) to identify relevant, data-driven components (Kayser &Tenke, 2006a,b).
IntroductionIntroduction
ParticipantsParticipants
Auditory and Visual Continuous Recognition Memory TasksAuditory and Visual Continuous Recognition Memory Tasks
new itemnew item
old itemold item
lags: 8 items24 items
Exposure[ms]
484(311 – 830)
500
forced choiceforced choicebutton pressbutton press
newnew oldold
A-V-V-Aor
V-A-A-V4 blocks
228 items/task
92 filler68 new/old pairs
456 trials total
Auditory
time
SOA
2,500 ms
filler itemfiller item(never(never--repeated)repeated)
Visual
ROCK…
ROCK
ANGLE
HABIT
PAPER
SHOCK
CHECK
…
ROCK
…
CHECK
• right-handed volunteers• no history of any psychopathology or neurology disorder• paid $15/h• standard audiometric screening / normal or corrected-to-normal vision
Healthy Adults (Healthy Adults (NN = 40)= 40)
Gender (male/female) 19 / 2119 / 21
Education (years) 16.016.0 ± 2.1± 2.1Handedness (EHI) 80.580.5 ± 22.5± 22.5
Age (years) 28.628.6 ± 6.8± 6.8
ObjectiveObjective::• exploit CSD-PCA approach for improved characterization of ERP old/new effects• employ closely matched auditory and visual continuous word recognition memory tasks• disentangle shared and unique contributions of stimulus- and response-related processes by joint
analysis of stimulus- and response-locked activity using the same prestimulus baseline • avoid experimenter bias in selecting an appropriate analytical design (e.g., which and how many
scalp locations to include in what ANOVA model) by using randomization tests
StimulusStimulus--lockedlocked ResponseResponse--lockedlocked
AuditoryAuditory VisualVisual
Beh
avio
ral D
ata
Fig. 1. Mean (SEM) percentage of correct responses, logistic d’-like sensitivity measure dL, and response latency of correct responses revealed good performance for both modalities, however, responses were 200 to 300 ms slower for spoken words.
ConditionCondition pp = .0004= .0004 ModalityModality pp < .0001< .0001ModaModa × × CondCond pp < .0001< .0001
Parietal and mid-frontal, positive-going ERP old/new effects (300-800 ms) are stimulus related (i.e., precede response onset) and originate from parietal source and lateral-frontal sink activity
Summary and ConclusionsSummary and Conclusions
Donkers FC, Nieuwenhuis S van, Boxtel GJ (2005). Mediofrontal negativities in the absence of responding. Cogn. Brain Res. 25(3):777-787.
Friedman D, Cycowicz YM, Bersick M (2005). The late negative episodic memory effect: the effect of recapitulating study details at test. Cogn. Brain Res.23(2-3):185-198.
Iidaka T, Matsumoto A, Nogawa J, Yamamoto Y, SadatoN (2006). Frontoparietal network involved in successful retrieval from episodic memory. Spatial and temporal analyses using fMRI and ERP. Cereb. Cortex 16(9):1349-1360.
Johansson M, Mecklinger A (2003). The late posterior negativity in ERP studies of episodic memory: action monitoring and retrieval of attribute conjunctions. Biol. Psychol. 64(1-2):91-117.
Kayser J, Fong R, Tenke CE, Bruder GE (2003). Event-related brain potentials during auditory and visual word recognition memory tasks. Cogn. Brain Res.16(1):11-25.
Kayser J, Tenke CE (2003). Optimizing PCA methodology for ERP component identification and measurement: theoretical rationale and empirical evaluation. Clin. Neurophysiol. 114(12):2307-2325.
Kayser J, Tenke CE (2006a). Principal components analysis of Laplacian waveforms as a generic method for identifying ERP generator patterns: I. Evaluation with auditory oddball tasks. Clin. Neurophysiol. 117(2):348-368.
Kayser J, Tenke CE (2006b). Principal components analysis of Laplacian waveforms as a generic method for identifying ERP generator patterns: II. Adequacy of low-density estimates. Clin. Neurophysiol. 117(2):369-380.
Luu P, Flaisch T, Tucker DM (2000). Medial frontal cortex in action monitoring. J. Neurosci. 20(1):464-469.
Maris E (2004). Randomization tests for ERP topographies and whole spatio-temporal data matrices. Psychophysiology 41(1):142-151.
Perrin F, Pernier J, Bertrand O, Echallier JF (1989). Spherical splines for scalp potential and current density mapping. Electroencephalogr. Clin. Neuro-physiol. 72(2):184-187. [1990 Corrigenda EEG 02274. Electroencephalogr. Clin. Neurophysiol. 76:565]
Tenke CE, Kayser J (2005). Reference-free quantification of EEG spectra: combining current source density (CSD) and frequency principal components analysis (fPCA). Clin. Neurophysiol. 116(12):2826-2846.
ReferencesReferences Funding Source: NIMH grants MH50715 and MH066597
ERP Recording and Data AnalysisERP Recording and Data Analysis• ERPs recorded from 30 scalp placements using an
electrode cap with a nose reference, 200 samples/s• EEG data acquired at .1-30 Hz band pass (-6dB/octave)• Bipolar horizontal and vertical EOGs; blink reduction
(continuous EEG) using spatial SVD; horizontal eyeartifacts (epoched EEG) by linear regressions of lateralEEG differences (Fp2-Fp1, etc.)
• 2,000 ms epochs (300 ms pre-stimulus), averages (artifact-free trials, correct responses only) low pass filtered at 12.5 Hz (-24dB/oct.), 100 ms baseline correction = stimulus-locked ERPs
• 1,000 ms subepochs (700 ms pre-response) derived from stimulus-locked ERPs using the same stimulus-locked baseline (100 ms pre-stimulus) = response-locked ERPs
• reference-free current source densities (CSD) (spherical splines surface Laplacian; Perrin et al., 1989) computed for each ERP (sharpen topographies, eliminate volume-conducted activity)
• concatenated stimulus- and response-locked CSDs submitted to unrestricted temporal principal components analysis (PCA) derived from the covariance matrix [601 variables = stimulus-locked samples –300 to 1,695 ms + response-locked samples -700 to 300 ms; 4,960 observations = Subjects(40) x Electrode Sites (31) x Condition (2) x Lag (2)] for each modality, followed by Varimax rotation of covariance loadings (Kayser & Tenke, 2003, 2006a,b), to identify and measure neuronal generator patterns and their common or unique contributions to stimulus- and/or response-locked activity
• data were pooled across lag to reduce the complexity of the design (there were no meaningful behavioral differences as a function of lag)
• Randomization tests: Old/new effects of meaningful PCA components (topographic differences of factor scores) were statistically evaluated by computing paired samples randomization distributions of scaled multivariate HotellingsT2 statistics (10,000 repetitions) for each CSD factor, followed post-hoc by Scheffẻ-like paired samples maximum randomization distributions of the univariate (channel-specific) T2
statistic (Maris, 2004)
LeftMastoid
RightMastoid
Nose
Ref
eren
ceN
ose
Nos
eLi
nked
Mas
toid
sLi
nked
Mas
toid
s
Fig. 2. Stimulus-locked (A, C) and response-locked (B, D) grand average ERP waveforms comparing new and old auditory or visual stimuli at selected sites using a nose tip (A, B) or linked-mastoids reference (C, D). Due to subtracting the mean mastoid activity, stimulus-locked early negative components (e.g., N1), which are prominent over inferior-lateral sites for visual stimuli when using a nose reference, are inverted and shifted to midline sites (N1’) when using a linked-mastoids reference.
Surface PotentialsAuditoryAuditory VisualVisual AuditoryAuditory VisualVisual
Current Source DensitiesStimulusStimulus--lockedlocked ResponseResponse--lockedlocked StimulusStimulus--lockedlocked ResponseResponse--lockedlocked
AFig. 3. Stimulus-locked (A) and response-locked (B) reference-free CSD waveforms comparing new and old auditory or visual stimuli at all 31 sites. Distinct CSD components included:
A
Auditory stimulus-locked central N1 and N2 sinks (approximate peak latencies 120 and 420 ms at C3), central P2 (205 ms at Cz), and lateral-posterior P3 sources (635 ms at P7) and response-locked mid-frontal sinks (45 ms at Fz). Increased lateral-parietal P3 sources (P3, P7) and lateral-frontal sinks (F7, F8) were seen for old compared to new auditory stimuli.
Visual stimulus-locked inferior lateral-parietal N1 sinks (approximate peak latency 150 ms at P7) and mid-parietal P3 sources (500 ms at Pz) and response-locked mid-frontal sinks (50 ms at Fz). Increased mid-parietal P3 sources (P3, Pz) and lateral-frontal sinks (F7, F8) were seen for old compared to new visual stimuli.
A BB
Fig. 4. Unrestricted PCA solutions using auditory or visual CSD waveforms.
A, B: Stimulus-locked (A) and response-locked (B) CSD wave-forms at selected sites comparing new and old items. Mean response latencies (RT ±SD) are marked for stimulus-locked CSDs.
C, D: Time courses of Varimax-rotated covariance loadings for the first nine CSD factors extracted (85.2% and 85.6% total variance explained). Labels indicate the peak latency of the factor loadings relative to stimulus and response onsets. Factors with unique stimulus- or response-locked loading peaks are indicated by solid lines, whereas factors with both stimulus- and response-locked loading peaks are indicated by dashed lines.
E: Corresponding factor score topographies (nose at top) with percentage of explained variance. CSD factor labels consist of stimulus- and/or response-locked peak latencies of the factor loadings (brief functional inter-pretations are based on a signature topography). Topogra-phies are roughly ordered by their temporal sequence, placing the unique response-locked factor (FRN sink) at the end.
B BAuditoryAuditory VisualVisual
360/
210/
635/-170
New Old Old - New max(T2), p < .05
265/
195/
465/-140
New Old Old - New max(T2), p < .05
New Old Old - New max(T2), p < .05
Fig. 5. Statistical evaluation of topographic old/new effects using randomization tests for three auditory (A) or visual (B) CSD factors preceding response onset (modality-specific P2 source, N2 sink, P3 source), and for three CSD factors following response onset common to both modalities (FRN sink, LN sink, SW; factor scores pooled across modality; C). Shown are the mean factor score topographies for new and old auditory stimuli, their respective difference, and significance maps.
A B
CAcross ModalityAcross Modality
AuditoryAuditory VisualVisual
Late occipital, negative-going ERP old/new effects are triggered by the response and originate from bilateral sink activity within anterior cingulate and/or supplementary motor area
• The proposed methodological improvements are generic and may benefit any other ERP paradigms.
• Several post-response old/new effects were highly comparable across modality. Lateral-frontal and inverted mid-frontal old/new effects overlapped a mid-frontal response-related sink (FRN) that followed and terminated (peak at 45 ms post-response) the parietal and frontocentral old/new P3 source effects.
• The old/new effects overlapping this FRN implied regional dipole activity oriented orthogonally to the cortical surface within the longitudinal fissure (anterior cingulate, supplementary motor area) with opposite orientations in the two hemispheres (Fig. 5C) and strongly suggest ongoing motivational or action-monitoring processes (e.g., Donkers et al., 2005; Luu et al., 2000).
• A further extension of this inverted old/new effect into off-midline centroparietal sites overlapped late SW activity across modalities (Fig. 5C). These observations lead to the tentative conclusion that the late episodic memory effects were triggered by the final evaluation or response decision, roughly coinciding with response onset in a paradigm that equally stressed speed and accuracy, and reflect action- or self-monitoring processes (Johansson & Mecklinger, 2003).
• A prominent left parietal old/new effect was observed in both modalities. Whereas stimulus-locked P3 source peaked approximately 170 ms earlier for visual than auditory tasks (longer processing time for auditory temporal analysis), but both sources preceded the response by about 160 ms (Fig. 4CD).
• Both P3 sources had distinct parietal topographies, with either midline (visual) or lateral (auditory) maxima, and included prominent lateral frontocentral sinks (Fig. 3 and Fig. 5AB). The overlapping old/new effects resembled auditory P3 and also included lateral frontocentral sinks, suggesting activity within a recognition memory network involving frontal and parietal regions (e.g. Iidaka et al., 2006).
Randomization tests (Fig. 5ABC)
Multivariate Hotelling’s T2 statistics are reported under factor labels to the left.
Squared univariate (channel-specific) paired samples T statistics thresholded at the 95th
quantile (p=.05) of the corresponding randomization distribution (maximum of all 31-channel squared univariate paired samples Tstatistics) are plotted as maps to the right. To facilitate comparisons of the max(T2) topographies with the underlying sink-source difference topographies, the sign of the difference at each site was applied to the respective T2 value, which is otherwise always positive.