Embed Size (px)
Citation preview
BRIEFSERIES
OFFICE OF FINANCIAL RESEARCH
16-07 | July 20, 2016
Reference Guide to the OFR’s U.S. Money Market Fund Monitor by Viktoria Baklanova and Daniel Stemp1
The OFR’s online U.S. Money Market Fund (MMF) Monitor tracks the investment
portfolios of money market funds. It charts fund characteristics such as the types
of assets held, investments by country, and counterparties. Users of the monitor,
which is available on the OFR website, can track individual funds and market trends.
The U.S. MMF Monitor also tracks connections between money market funds and
securities issuers in the United States and internationally.
Money market funds are a type of mutual fund devel-oped in the 1970s as an option for savers to invest their cash more profitably than by putting it in bank savings accounts. Since the 1990s, institutional investors have used money market funds as a professional cash management option.
The run on money market funds in 2008 was a key event in the financial crisis. When the Reserve Primary Fund announced on Sept. 16, 2008, that the value of its shares had dropped to 97 cents to the dollar, inves-tors pulled hundreds of billions of dollars out of prime money market funds. At least 28 other funds had losses large enough that they could have similarly “broken the buck” — meaning the share price falling below $1.2 The Treasury responded with an unprecedented guar-antee for eligible money market funds.
At that time, a lack of detailed data about fund hold-ings prevented regulators from identifying potential risks in a timely way. Since then, regulators have made substantial progress in addressing vulnerabilities in the money market fund industry. In 2010, the Securities
Views and opinions expressed are those of the authors and do not necessarily represent official OFR or U.S. Department of the Treasury positions or policy. This brief and the online U.S. Money Market Fund Monitor are presented solely for informative purposes and are not intended to be, nor should they be, relied upon for financial decisions; they are not intended to provide investment advice or financial advice. Comments are welcome and should be directed to the authors. OFR briefs may be quoted without additional permission.
The OFR’s U.S. MMF Monitor can be found at: financialresearch.gov/money-market-funds
OFR Brief Series | 16-07 July 2016 | Page 2
and Exchange Commission (SEC) introduced new rules requiring money market funds to further limit credit risk and interest rate risk, and to hold more liquid securities.
Regulators also have moved to close the data gaps related to money market funds and now collect monthly information about fund portfolio holdings. Using these new data, the OFR has developed an interactive U.S. MMF Monitor that regulators and others can easily use to explore and display fund investments.
The monitor has six charts. Three charts allow users to track MMF investments by individual fund (drilling down to individual funds’ exposures to specific secu-rities), by fund category (drilling down to aggregate MMF industry holdings of specific securities), and by prime funds (drilling down to specific fund managers’ exposures to securities issuers). Three charts focus on MMF activities in the market for repurchase agree-ments, or repos. Repos are financial contracts in which one party sells a security to another with the promise to repurchase it at a later date for a previously specified price. Money market funds use repos as an investment that is secured by collateral.
This brief presents the monitor and explains its use and main features.
Data Sources
In its 2010 rules, the SEC required money market funds to report their portfolio holdings each month on Form N-MFP. This new data collection contains granular information about MMF portfolio holdings. All funds must file Form N-MFP, including funds not offered to the public. The funds send the form to the SEC within five business days after the end of each month. This information is available to the public on the SEC website immediately upon the filing. (Before April 2016, the information was available only with a 60-day lag.)
These filings give market participants and regulators access to complete information about fund holdings. Analysts and regulators can track market developments and identify emerging risks. However, the amount of data is large and the data are provided in separate indi-vidual filings.
The OFR analyzes more than 65,000 records of detailed data on MMF portfolio holdings each month – more than 4 million records to date. The OFR’s U.S. MMF Monitor presents the data promptly in a consolidated format that is easy to aggregate and use for comparison. The monitor displays the data online in an intuitive visual format with interactive features.
At present, the monitor contains more than five years of portfolio holdings data, beginning in January 2011. (Form N-MFP filings started in November 2010, but initial filings cannot be compared with later filings due to differences in data quality.)
The OFR receives the data directly from the SEC. The OFR validates the data, conducts data quality checks, and adds other data elements to round out the infor-mation. For example, the SEC does not require MMFs to file information about geographic regions or coun-tries where securities issuers are located. The OFR adds these elements for enhanced analysis.3
Inside the MMF Monitor
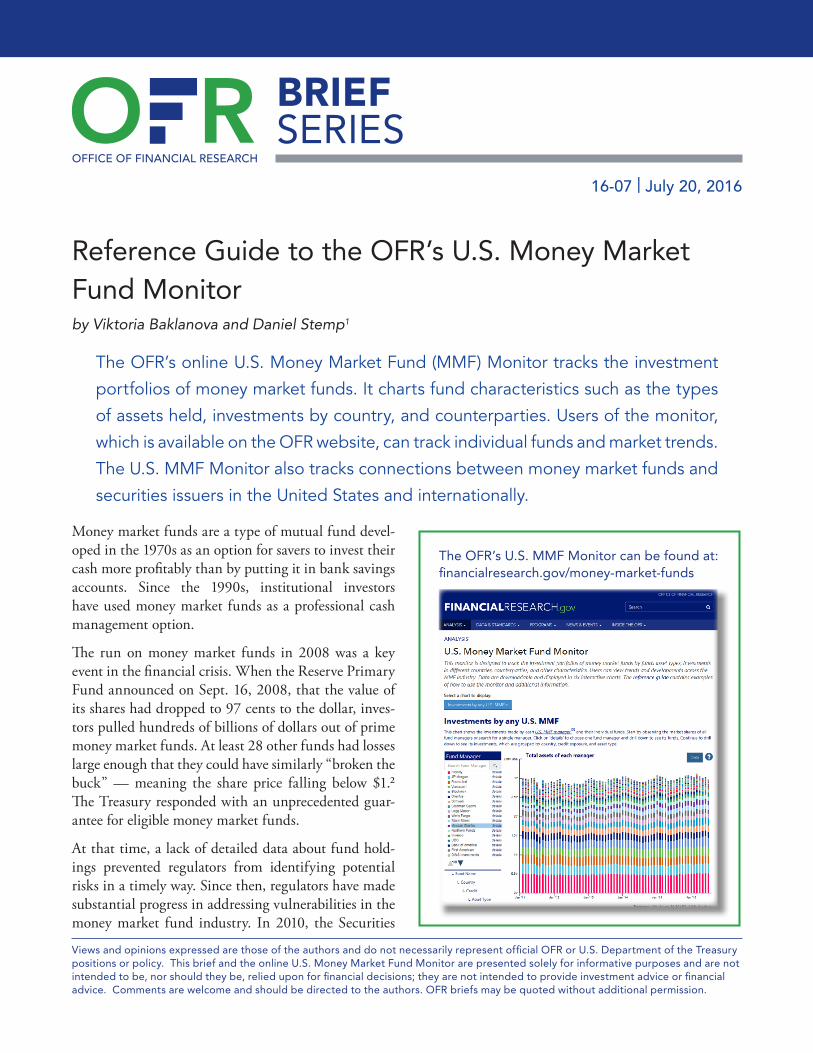
Each of the monitor’s six interactive charts permits users to explore the funds from a different perspective.
Drop-down list of all chart titles available in the U.S. MMF Monitor
OFR Brief Series | 16-07 July 2016 | Page 3
The six charts are:
1. Investments by Any U.S. MMF allows users to find specific funds and track investments (see Figure 1).
2. U.S. MMFs’ Investments by Fund Category allows users to track investments by all categories of money market funds (see Figure 2).
3. Investments by U.S. Prime MMFs tracks the exposures of funds to securities issuers (see Figure 3).
4. U.S. MMFs’ Investments in the Repo Market analyzes MMF investments in repos (see Figure 4 and Figure 5).
5. U.S. MMFs’ Repos with the Federal Reserve helps track investments by a specific fund in the Federal Reserve’s reverse repo (RRP) facility and with private counterparties (see Figure 6).
6. Federal Reserve Repo Facility Total Utilization and MMFs’ Participation shows MMF invest-ments in the Federal Reserve’s RRP by fund type (see Figure 7).
Investments by fund
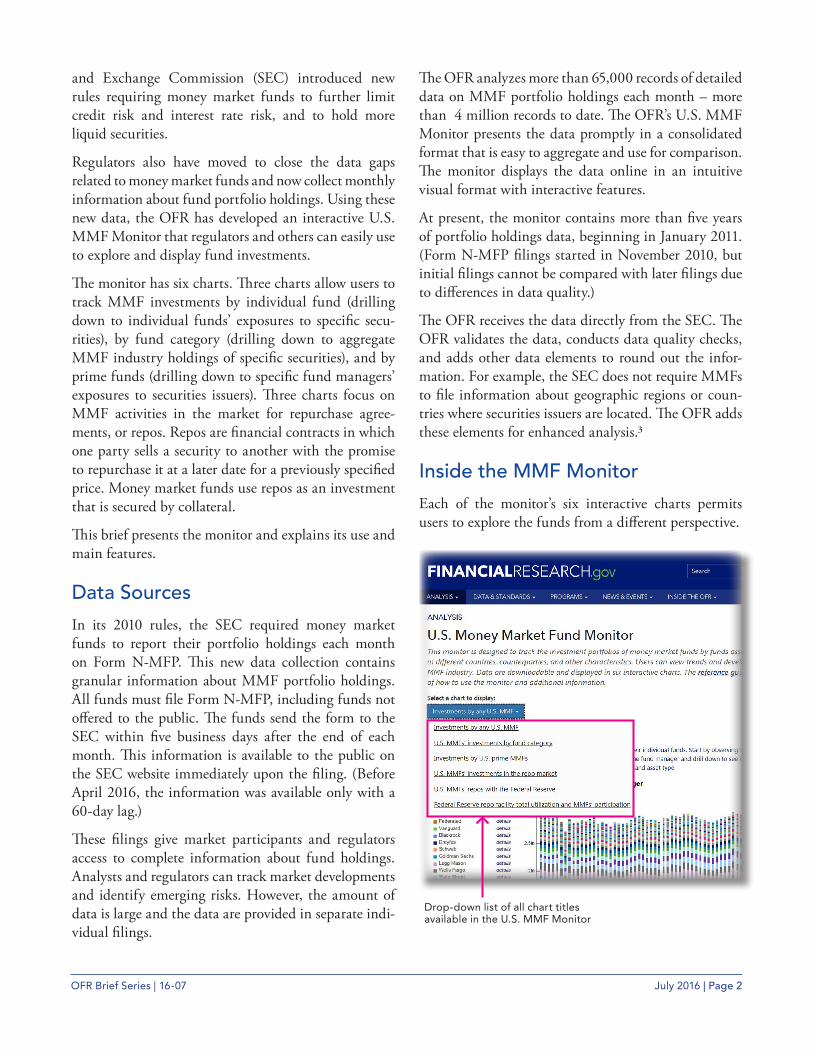
Users can find specific funds and track investments with the “Investments by Any U.S. MMF” chart (see
Figure 1). The top level of this chart, “Fund Manager,” shows all MMF fund managers and the historical trend in their market shares. Fund managers typically manage several funds. A user can find a fund by typing the name of the fund manager in the search box and then clicking “details” to open the details pane.
After the user has opened the details pane of the fund manager, the user can click “Drill Down” to show all the funds under that manager. The user can type the name of a specific fund in the search box and again open the details pane to drill down further and get more details on the fund’s investments and risks.
The user can track country risk, sector risk, and credit risk within a specific fund. The “Country” expo-sure level of the chart shows the fund’s investments in different countries. The “Credit” exposure level of the chart shows the names of debt issuers held by the fund in the country and sector previously selected. The lowest level of the chart, “Asset Type,” shows the types of financial instruments in the fund portfolio issued by the issuer the user selected at the credit exposure level.
Previous levels and filtered values are shown above the area chart, colored in light blue. To return to a previous level, the user can click the “Roll Up” button on the
Figure 1. Investments by Any U.S. MMF
Sources: SEC Form N-MFP, OFR analysis
OFR Brief Series | 16-07 July 2016 | Page 4
details pane or the white arrow button on the active level view. The text above the chart shows all the filters and previous selections that the user made. The “Data” button on the top right gives the user the option to download the data series in a usable format.
Investments by fund category
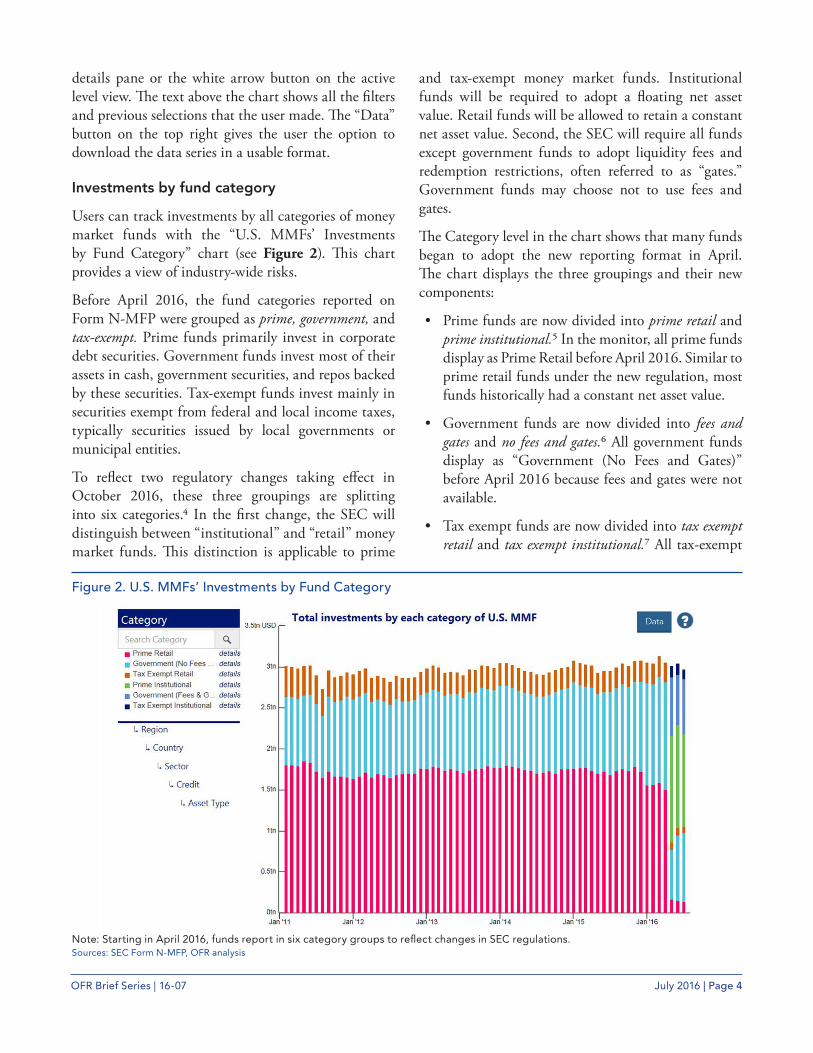
Users can track investments by all categories of money market funds with the “U.S. MMFs’ Investments by Fund Category” chart (see Figure 2). This chart provides a view of industry-wide risks.
Before April 2016, the fund categories reported on Form N-MFP were grouped as prime, government, and tax-exempt. Prime funds primarily invest in cor porate debt securities. Government funds invest most of their assets in cash, government securities, and repos backed by these securities. Tax-exempt funds invest mainly in securities exempt from federal and local income taxes, typically securities issued by local governments or municipal entities.
To reflect two regulatory changes taking effect in October 2016, these three groupings are splitting into six categories.4 In the first change, the SEC will distinguish between “institutional” and “retail” money market funds. This distinction is applicable to prime
and tax-exempt money market funds. Institutional funds will be required to adopt a floating net asset value. Retail funds will be allowed to retain a constant net asset value. Second, the SEC will require all funds except government funds to adopt liquidity fees and redemption restrictions, often referred to as “gates.” Government funds may choose not to use fees and gates.
The Category level in the chart shows that many funds began to adopt the new reporting format in April. The chart displays the three groupings and their new components:
• Prime funds are now divided into prime retail and prime institutional.5 In the monitor, all prime funds display as Prime Retail before April 2016. Similar to prime retail funds under the new regulation, most funds historically had a constant net asset value.
• Government funds are now divided into fees and gates and no fees and gates.6 All government funds display as “Government (No Fees and Gates)” before April 2016 because fees and gates were not available.
• Tax exempt funds are now divided into tax exempt retail and tax exempt institutional.7 All tax-exempt
Figure 2. U.S. MMFs’ Investments by Fund Category
Note: Starting in April 2016, funds report in six category groups to reflect changes in SEC regulations. Sources: SEC Form N-MFP, OFR analysis
OFR Brief Series | 16-07 July 2016 | Page 5
funds display as “Tax Exempt Retail” before April 2016.
Some observers expect institutional investors to migrate from prime funds to government funds because of the new requirements that institutional funds adopt a floating net asset value and introduce fees and gates. Such a migration is already visible in Figure 2.
Investments by U.S. prime MMFs
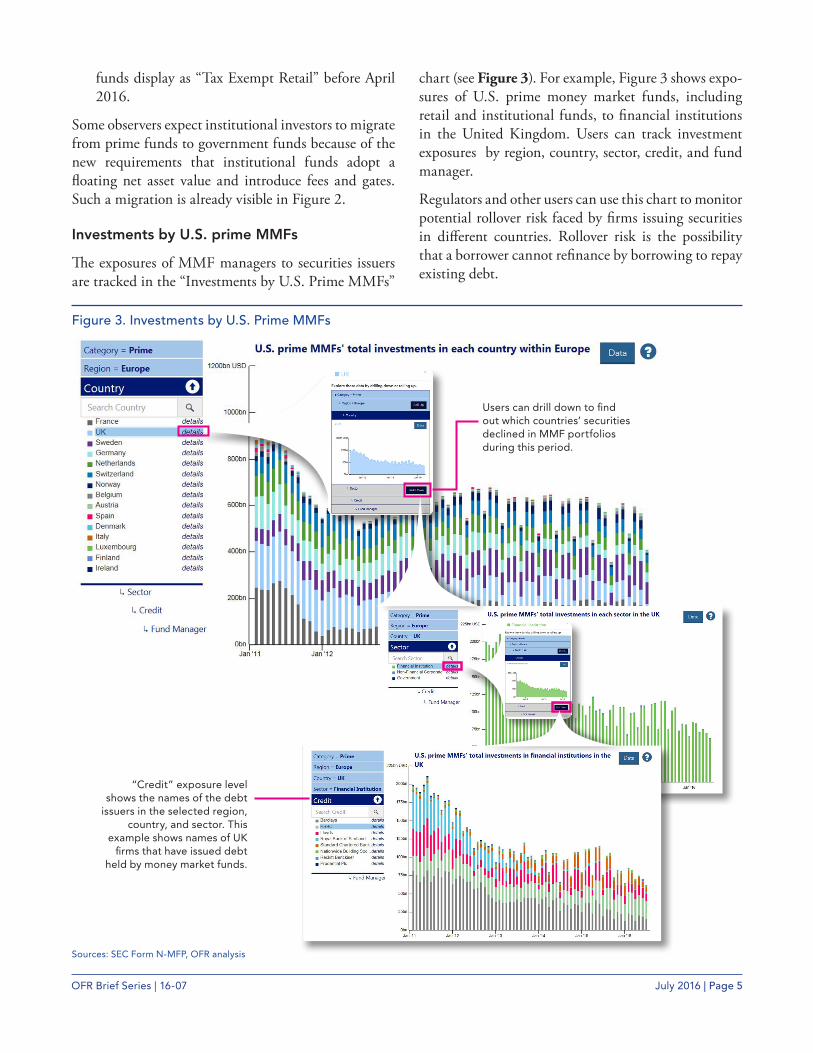
The exposures of MMF managers to securities issuers are tracked in the “Investments by U.S. Prime MMFs”
chart (see Figure 3). For example, Figure 3 shows expo-sures of U.S. prime money market funds, including retail and institutional funds, to financial institutions in the United Kingdom. Users can track investment exposures by region, country, sector, credit, and fund manager.
Regulators and other users can use this chart to monitor potential rollover risk faced by firms issuing securities in different countries. Rollover risk is the possibility that a borrower cannot refinance by borrowing to repay existing debt.
Figure 3. Investments by U.S. Prime MMFs
Users can drill down to find out which countries’ securities declined in MMF portfolios during this period.
“Credit” exposure level shows the names of the debt
issuers in the selected region, country, and sector. This
example shows names of UK firms that have issued debt
held by money market funds.
Sources: SEC Form N-MFP, OFR analysis
OFR Brief Series | 16-07 July 2016 | Page 6
The “Category” level of the chart is filtered to show only assets under management by prime MMFs. The next three levels of the chart display asset allocation by region, country, and sector. The “Credit” exposure level of the chart shows the names of firms that have issued debt held by money market funds. The “Fund Manager” level of the chart lists fund managers that manage funds with investments in securities issued by a particular firm.
If only one fund invests in the assets issued by a specific firm, then that firm could face greater rollover risk for its funding. This risk arises because of a potential lack of options for the firm to find replacement funding from other investors swiftly if the money market fund decides to stop holding its debt.
International regulators can also use the chart to monitor the funding links between foreign firms and U.S. money markets. For example, the monitor shows a decline in U.S. money market fund investments in some European countries during the 2011 European debt crisis (see Figure 3). Users can drill down to find out which issuers in which countries were affected.
MMF investments in the U.S. repo market
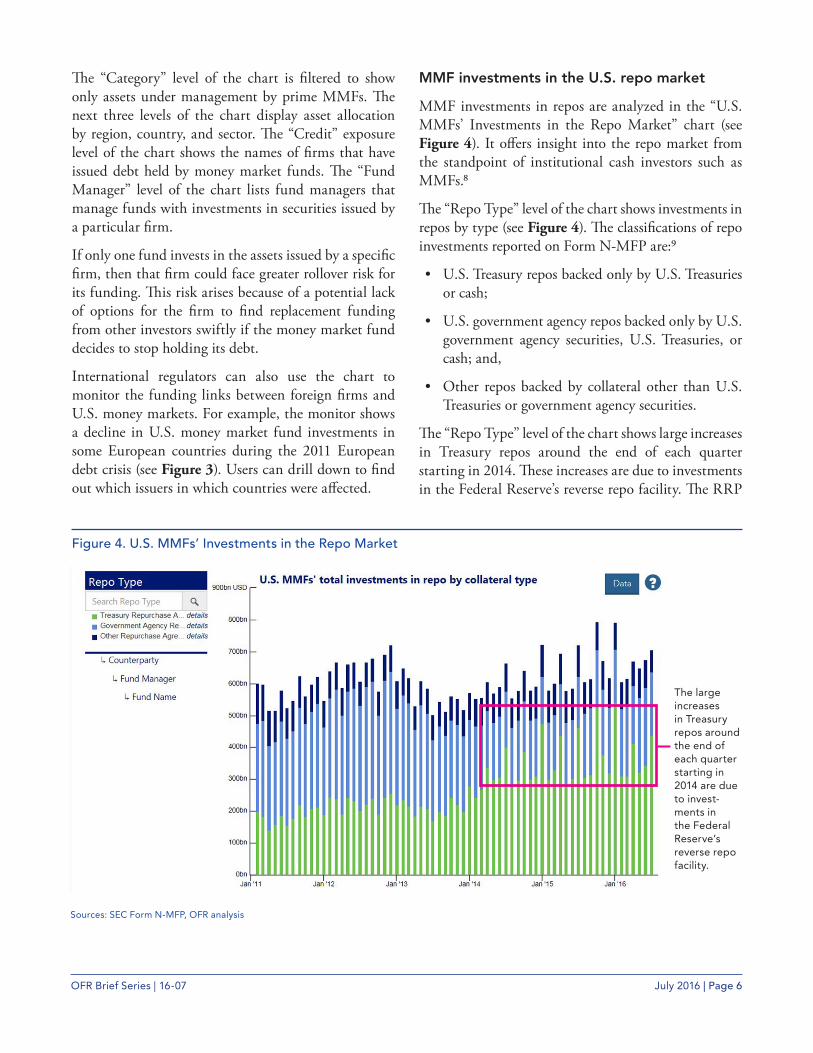
MMF investments in repos are analyzed in the “U.S. MMFs’ Investments in the Repo Market” chart (see Figure 4). It offers insight into the repo market from the standpoint of institutional cash investors such as MMFs.8
The “Repo Type” level of the chart shows investments in repos by type (see Figure 4). The classifications of repo investments reported on Form N-MFP are:9
• U.S. Treasury repos backed only by U.S. Treasuries or cash;
• U.S. government agency repos backed only by U.S. government agency securities, U.S. Treasuries, or cash; and,
• Other repos backed by collateral other than U.S. Treasuries or government agency securities.
The “Repo Type” level of the chart shows large increases in Treasury repos around the end of each quarter starting in 2014. These increases are due to investments in the Federal Reserve’s reverse repo facility. The RRP
Figure 4. U.S. MMFs’ Investments in the Repo Market
The large increases in Treasury repos around the end of each quarter starting in 2014 are due to invest-ments in the Federal Reserve’s reverse repo facility.
Sources: SEC Form N-MFP, OFR analysis

OFR Brief Series | 16-07 July 2016 | Page 7
is a program that the Federal Reserve uses to keep the federal funds rate in its target range.10
The next level of the chart, “Counterparty,” illus-trates that the Federal Reserve has become the largest Treasury repo counterparty to MMFs (see Figure 5). The potentially large demand for the RRP investments prompted the Federal Open Market Committee to increase the RRP capacity temporarily when it raised its interest rate target in December 2015. The current daily limit on individual fund investments in the over-night RRP is $30 billion.
The “Counterparty” level also lists all other firms that have repos with MMFs. The share held by each individual firm is relatively small. For some firms, it declines further around the end of each quarter.
The “Fund Manager” level of the chart lists fund managers with funds investing in repos with a partic-ular counterparty. If only one fund invests in repos with a specific firm, that firm could face more rollover risk.
The “Fund Name” level of the chart shows the specific fund under the management of the selected manager. Regulators and others can use this chart to monitor a fund’s counterparty risk.
Figure 5. U.S. MMFs’ Counterparties in the Repo Market
Federal Reserve (shown in blue) has become the largest Treasury repo counterparty to MMFs
Sources: SEC Form N-MFP, Federal Reserve Bank of New York, OFR analysis
U.S. MMFs’ use of the Federal Reserve’s reverse repo facility
The “U.S. MMFs’ Repos with the Federal Reserve” chart helps track investments by a specific fund in the Federal Reserve’s RRP and with private counterpar-ties (see Figure 6). By default, this chart is filtered to include only investments by MMFs in repos with the Federal Reserve. Regulators and other users can see detailed information about any specific fund partici-pating in the RRP program. The timeline of the chart is consistent with the other historical data series. The RRP facility became widely available to money market funds on Sept. 23, 2013.
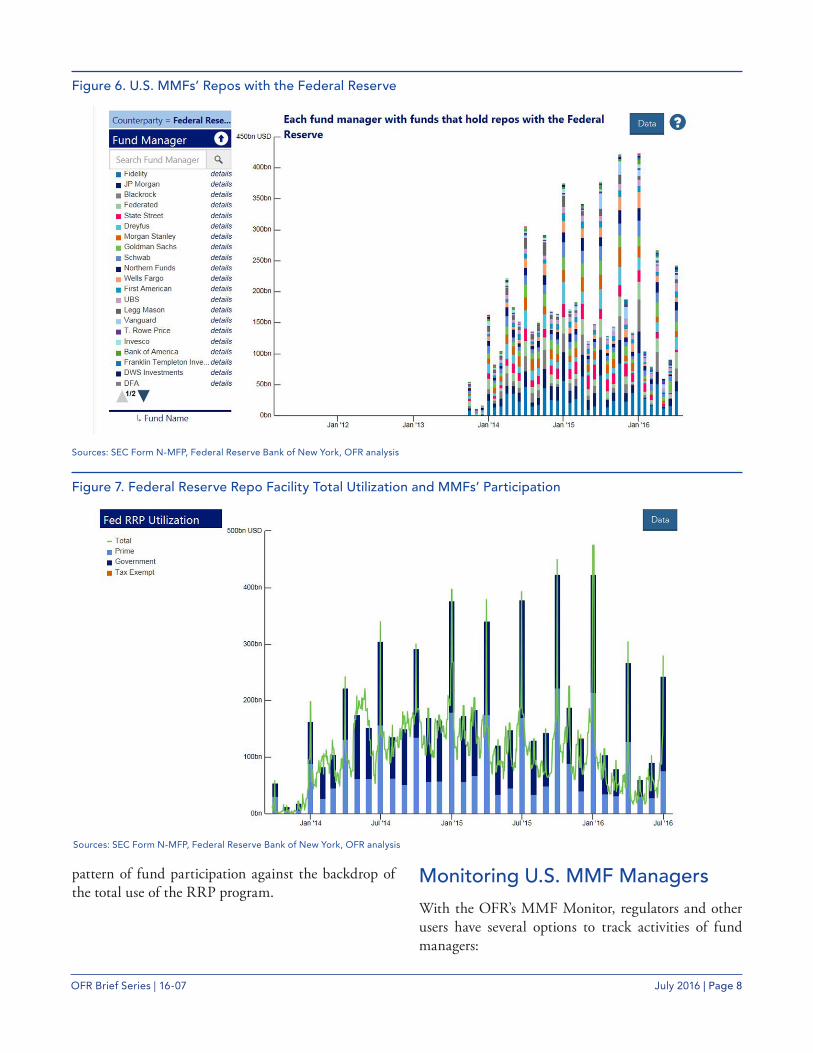
The “Fund Manager” level of the chart lists fund managers that have funds investing in repo agreements with the Federal Reserve. The “Fund Name” level of the chart shows individual funds of the selected manager and their holdings of repos with the Federal Reserve.
MMF investments in the Federal Reserve’s RRP facility by fund type are shown in the “Federal Reserve Repo Facility Total Utilization and MMFs’ Participation” chart (see Figure 7). It also shows the total RRP use by all other participants that are not money market funds. Regulators and other users can observe the historical
OFR Brief Series | 16-07 July 2016 | Page 8
Figure 6. U.S. MMFs’ Repos with the Federal Reserve
Sources: SEC Form N-MFP, Federal Reserve Bank of New York, OFR analysis
Figure 7. Federal Reserve Repo Facility Total Utilization and MMFs’ Participation
Sources: SEC Form N-MFP, Federal Reserve Bank of New York, OFR analysis
pattern of fund participation against the backdrop of the total use of the RRP program.
Monitoring U.S. MMF Managers
With the OFR’s MMF Monitor, regulators and other users have several options to track activities of fund managers:

OFR Brief Series | 16-07 July 2016 | Page 9
• Investments by any U.S. MMF (Figure 1) tracks country risk and credit risk within a specific fund.
• Investments by U.S. prime MMFs (Figure 3) tracks fund managers and their investments in different countries. The “Fund Manager” level of the chart lists managers that have funds investing in securities issued by a particular firm. That chart level can reveal risks to either the fund, if the firm’s credit quality deteriorates, or to the firm, if the fund decides not to hold the firm’s debt any longer.
• U.S. MMFs’ investments in the repo market (Figure 4) analyzes MMF investments in repos. The “Fund Manager” level of the chart lists fund managers that have funds with investments in repos with a particular counterparty. This chart illustrates counterparty risk taken by all of a manager’s funds.
• U.S. MMFs’ repos with the Federal Reserve (Figure 6) helps track the total volume of MMF investments in the Federal Reserve’s RRP. Users can click on the names of fund managers to view the volume of investments by each fund.
ConclusionThe financial crisis illustrated the vulnerability of money market funds to runs and prompted regula-tors to implement reforms in this market. Improving transparency was one important component of these reforms. The OFR has used data from the SEC about money market funds to build an interactive set of online charts to analyze key investments and drill down to detailed information. The U.S. MMF Monitor helps regulators and other users track portfolios and risk profiles of funds. It also examines investment trends in the industry. These interactive charts make the analysis of complex data more intuitive and accessible.
Endnotes1 Viktoria Baklanova, Senior Financial Analyst
([email protected]), and Daniel Stemp, Financial Analyst ([email protected]). The authors would like to thank Caleb Wesley, Chris Gill, and Jeff Kemble for their substantial technical contribution to this project.
2 See Marco Cipriani, Michael Holscher, Antoine Martin, and Patrick McCabe, “Twenty-Eight Money Market Funds That Could Have Broken the Buck: New Data on Losses during the 2008 Crisis,” Liberty Street Economics, Federal Reserve Bank of New York, Oct. 9, 2013 (available at libertystreeteconomics.newyorkfed.org/2013/10/twenty-eight-money-market-funds-that-could-have-broken-the-buck-new-data-on-losses-during-the-2008-c.html#.VvKRpmdf2FU, accessed March 23, 2016).
3 All data presented are OFR-derived aggregates on an ultimate parent basis of the original source data. The OFR staff makes its best effort to map each security issuer to an ultimate parent, sector, region, and country. The OFR staff relies upon source data such as regulatory filings, company disclosures, company websites, and commercial data containing information about the security issuer to link records related to the same security issuer. The OFR staff consolidates security issuers to an ultimate parent using publically available source data. In determining country of domicile, the OFR staff relies on either the address of the ultimate parent’s headquarters, or the country where the ultimate parent has a substantial operations or marketing presence.
The OFR staff aggregates all security issuers to a single generic entity, “Municipal” for securities issued or guaranteed by U.S. states, munici-palities, or associated authorities. Individual security issuers are assigned to a sector based on the primary business of their ultimate parent. Credit risk associated with a counterparty used for repurchase agreement transactions, including those backed by Treasury and Government Agency securities, is part of the total exposure to a specific country and region. Users should consult the source data and other references and perform their own analysis.
4 See Form N-MFP, Item A.10 (available at www.sec.gov/about/forms/formn-mfp.pdf, accessed May 9, 2016).
5 Retail funds are funds that have policies and procedures reasonably designed to limit all beneficial owners to “natural persons,” meaning individual investors, or human beings. This definition generally applies to prime and tax-exempt, or municipal money market mutual funds, and includes individuals investing through brokerage accounts, retirement, and other accounts sold through intermediaries, provided that the underlying account ownership meets the natural person definition. In the OFR’s U.S. Money Market Fund Monitor, retail and institutional funds are identified based on their Form N-MFP filing, Item A.10.a (available at www.sec.gov/about/forms/formn-mfp.pdf, accessed May 9, 2016).
6 Government funds include “Treasury,” “Government/Agency,” and “Exempt
Government” fund categories reported on Form N-MFP, Item A.10. “Exempt Government” fund category indicates that these funds did not adopt “fees and gates.”
7 Tax Exempt funds include “Single State” and “other Tax Exempt” fund categories reported on Form N-MFP, Item A.10.
8 See Viktoria Baklanova, Adam Copeland, and Rebecca McCaughrin, “Reference Guide to U.S. Repo and Securities Lending Markets,” OFR Working Paper no. 15-17, Sept. 9, 2015 (avail-able at financialresearch.gov/working-papers/files/OFRwp-2015-17_Reference-Guide-to-U.S.-Repo-and-Securities-Lending-Markets.pdf, accessed May 31, 2016).
9 See Form N-MFP, Item C.6 (available at www.sec.gov/about/forms/formn-mfp.pdf, accessed May 9, 2016).
10 The Federal Reserve conducts RRP operations by selling securities to eligible repo counter-parties with an agreement to buy the assets back on a later date. These operations may be for overnight maturity or for a specified term. The OFR uses the total of overnight and term operations for calculating money market fund investments in the Federal Reserve’s RRP. For details about the terms of the RRP, see Federal Reserve Bank of New York, “FAQs: Reverse Repurchase Agreement Operations,” Dec. 16, 2015 (available at www.newyorkfed.org/markets/rrp_faq.htm, accessed May 9, 2016).