Embed Size (px)
Citation preview

Reference guide May 2008
Net Waste Tool
Guide to Reference Data, Version 1.0
WRAP works in partnership to encourage and enable businesses and consumers to be more efficient in their use of materials and recycle more things more often. This helps to minimise landfill, reduce carbon emissions and improve our environment.
Written by: Emma Burton and Nick Friedrich (Arup)
Front cover photography: [Add description or title of image.] WRAP, Arup and Cyril Sweett believe the content of this report to be correct as at the date of writing. However, factors such as prices, wastage rates, levels of recycled content and regulatory requirements are subject to change and users of the report and the Net Waste Tool should check with their suppliers to confirm the current situation. In addition, care should be taken in using any of the cost information provided in the report and in the Net Waste Tool, as actual costs will depend on project-specific factors (such as scale, location, tender context, etc.). The report does not claim to be exhaustive, nor does it claim to cover all relevant products and specifications available on the market. While steps have been taken to ensure accuracy, WRAP cannot accept responsibility or be held liable to any person for any loss or damage arising out of or in connection with this information being inaccurate, incomplete or misleading. It is the responsibility of the potential user of a material or product to consult with the supplier or manufacturer and ascertain whether a particular product will satisfy their specific requirements. The listing or featuring of a particular product or company does not constitute an endorsement by WRAP and WRAP cannot guarantee the performance of individual products or materials. For more detail, please refer to WRAP’s Terms & Conditions on its web site: www.wrap.org.uk
Guide to Reference Data Version 1.0
Executive summary This report outlines the key sources of background data assembled for use in WRAP’s Net Waste Tool (NW Tool, freely accessible at www.wrap.org.uk/nwtool). This web-based tool has been developed to help construction project teams forecast and measure the amount of waste generated by their projects, identify actions to reduce waste and recover more waste, quantify cost savings, and report on waste management performance to their clients. It also calculates the opportunities to use more recovered materials (reused and recycled content). The NW Tool extends and replaces the ‘Evaluation Tool for Recycled Content in Construction Projects’ which enabled the user to assess the level of recycled material used in construction projects. The Recycled Content Tool contained over 1,000 different types of building component, for which data have now been gathered relating to the value and quantity of materials wasted in construction (known as the reference dataset). This report describes the data collection method used and comments upon the quality of the data gathered, in terms of availability and limitations of the data, assumptions made in applying the information gathered and results of the data validation work. The reference dataset contains eight categories of data:
Component Dimensions and Densities; Wastage Rates; Wastage Rates associated with Modern Methods of Construction (MMC); Mass of Packaging; Recovery Rates; Bulking Factors; Embodied Carbon of Primary Materials and Carbon Savings from Reduction of Waste and Recycling; and Cost of Waste Disposal and Take-Back Schemes.
The reference dataset has been compiled using a mix of primary and secondary sources of information. A desk-based study has been undertaken to identify pre-existing data in published sources of information, including previous WRAP research projects, articles from academic journals and online information from component manufacturers and industry associations. This has proved valuable in collating information for all data categories, but particularly for wastage rates, MMC wastage rates, recovery rates and carbon emission factors. Additional primary research has also been undertaken for bulking factors, container costs and take-back costs due to a lack, or absence, of available secondary information. Materials recycling facility (MRF) operators and construction companies have been approached to provide information, as well as some industry organisation such as British Gypsum, which has provided information on the cost of plasterboard take-back schemes. The data have been assembled by Arup and Cyril Sweett (on behalf of WRAP), with input from Responsible Solutions Ltd (who provided packaging data on behalf of Envirowise). All data have been compared against pre-existing information from the Building Research Establishment and WRAP Net Waste Trials and data gathered as part of the WRAP Net Waste Tool Consultation Group. Actual project information has also been received in response to a questionnaire sent out to various contractors and other members of the Net Waste Tool Consultation Group. The information used in the reference dataset does contain a number of limitations and these are described according to each data category. As a result of these limitations and the varying availability of data, options for further research are suggested. These recommendations are particularly important in light of the need to refine the data as standard waste management practices improve and better data become available. NW Tool users are also invited to submit relevant data from their own projects, or otherwise, that could be used to help refine the reference dataset. The NW Tool does not aim to forecast waste with complete accuracy – rather it is designed to help project teams quickly identify their major sources of waste and the most significant opportunities to take action. For this purpose, the user is able to over-write data with project-specific information (such as skip costs, which appear highly variable) and enter their own target wastage rates. Therefore the reference data aim to be representative, but will inevitably not be correct for individual projects.
Guide to Reference Data Version 1.0
Contents 1.0 Introduction ............................................................................................................................. 5 2.0 Data Gathering Methodology ................................................................................................... 6
2.1 The Net Waste Reference Dataset ..........................................................................................6 2.2 Data Requirements................................................................................................................8
2.2.1 Dimensions and Densities..........................................................................................8 2.2.2 Wastage Rates..........................................................................................................8 2.2.3 Wastage Rates Associated with Modern Methods of Construction.................................8 2.2.4 Packaging.................................................................................................................9 2.2.5 Recovery Rates.........................................................................................................9 2.2.6 Bulking Factors .........................................................................................................9 2.2.7 Cost of Waste Disposal and Take-Back Schemes.........................................................9 2.2.8 Embodied Carbon Impact Factors ..............................................................................9
2.3 Data Gathering....................................................................................................................10 2.4 Data Benchmarking and Validation .......................................................................................10 2.5 Data Entry and Data Update Process ....................................................................................11
3.0 Wastage Rates and Materials Allocation................................................................................ 12 3.1 Sources of Available Information ..........................................................................................12 3.2 Limitations of Data and Options for Further Research ............................................................13 3.3 Data Benchmarking and Validation .......................................................................................13 3.4 Wastage and MMC Wastage Rate Dataset and Assumptions...................................................14
4.0 MMC Wastage Rates............................................................................................................... 22 4.1 Sources of Available Information ..........................................................................................22 4.2 Limitations and Options for Further Research ........................................................................22 4.3 Data Benchmarking and Validation .......................................................................................22 4.4 MMC Wastage Rates Dataset and Assumptions......................................................................22
4.4.1 Balconies................................................................................................................23 4.4.2 Bathrooms and Toilets ............................................................................................23 4.4.3 Brickwork, Blockwork and Stonework .......................................................................23 4.4.4 Conservatories........................................................................................................24 4.4.5 Drainage and Services.............................................................................................24 4.4.6 Earthworks .............................................................................................................24 4.4.7 External Walls.........................................................................................................24 4.4.8 Fencing ..................................................................................................................24 4.4.9 Floors.....................................................................................................................24 4.4.10 Frames...................................................................................................................25 4.4.11 Internal Doors ........................................................................................................25 4.4.12 Internal Walls .........................................................................................................25 4.4.13 IT FF&E..................................................................................................................26 4.4.14 Kerbs, Footways and Paved Areas............................................................................26 4.4.15 Kitchens and Laundry..............................................................................................26 4.4.16 Miscellaneous .........................................................................................................26 4.4.17 Non-Integrated Garages..........................................................................................26 4.4.18 Piling and Embedded Retaining Walls .......................................................................26 4.4.19 Road Lighting Columns............................................................................................26 4.4.20 Road Pavements .....................................................................................................26 4.4.21 Road Restraint Systems...........................................................................................26 4.4.22 Roof.......................................................................................................................26 4.4.23 Services .................................................................................................................27 4.4.24 Special Structures ...................................................................................................27 4.4.25 Stairs .....................................................................................................................27 4.4.26 Structural Concrete .................................................................................................27 4.4.27 Sub-Structure .........................................................................................................27 4.4.28 Traffic Signs ...........................................................................................................27 4.4.29 Walls, Floors and Ceilings – Finishes ........................................................................28 4.4.30 Windows and External Doors ...................................................................................28
5.0 Packaging............................................................................................................................... 29
Guide to Reference Data Version 1.0
5.1 Sources of Available Information ..........................................................................................29 5.2 Limitations of Data and Options for Further Research ............................................................29 5.3 Results of Validation Exercise ...............................................................................................30 5.4 Packaging Dataset and Assumptions .....................................................................................30
6.0 Recovery Rates ...................................................................................................................... 31 6.1 Sources of Available Information ..........................................................................................31 6.2 Limitations of Data and Options for Further Research ............................................................31 6.3 Results of Validation Exercise ...............................................................................................31 6.4 Recovery Rate Dataset and Assumptions...............................................................................32
7.0 Bulking Factors ...................................................................................................................... 35 7.1 Sources of Available Information ..........................................................................................35 7.2 Limitations of Data and Options for Further Research ............................................................35 7.3 Bulking Factor Dataset and Assumptions...............................................................................35
8.0 Cost of Waste Disposal and Take-Back Schemes................................................................... 36 8.1 Sources of Available Information ..........................................................................................36 8.2 Cost of Waste Disposal Dataset: Assumptions and Validation .................................................37
8.2.1 Inert ......................................................................................................................37 8.2.2 Plasterboard ...........................................................................................................37 8.2.3 Timber ...................................................................................................................37 8.2.4 Metal .....................................................................................................................37 8.2.5 Packaging...............................................................................................................38 8.2.6 Mixed Waste...........................................................................................................38
8.3 Cost of Take-Back: Assumptions and Validation.....................................................................38 8.4 Limitations and Options for Further Research ........................................................................39
9.0 Carbon Factors ....................................................................................................................... 40 9.1 Sources of Available Information ..........................................................................................40 9.2 Limitations of Data and Options for Further Research ............................................................41 9.3 Data Validation and Benchmarking .......................................................................................41 9.4 Carbon Factor Dataset and Assumptions ...............................................................................43
10.0 Conclusion.............................................................................................................................. 46 Appendix 1 Densities Dataset ............................................................................................................ 47 Appendix 2 Data Validation Questionnaire for Contractors ............................................................... 51 Appendix 3 Responses to Data Validation Questionnaire .................................................................. 56 Appendix 4 Wastage Rates and MMC Wastage Rates Dataset .......................................................... 60

Guide to Reference Data Version 1.0
1.0 Introduction This report outlines the key sources of background data (reference dataset) assembled for use in the Net Waste Tool (NW Tool). This is a web-based tool that has been developed to help construction project teams (designers, project managers, waste managers etc) measure the amount of waste generated by their projects, improve the way in which that waste is managed and report on waste management performance. The NW Tool will help to identify opportunities for waste reduction and strategies for waste recovery, as well as quantifying the costs of waste and the scope to use recovered materials. The NW Tool supports five important applications:
Generating waste forecasts and prioritising waste reduction and recovery actions to input to the Site Waste
Management Plan – inputs which are required by the new SWMP Regulation in England from April 2008; Applying value engineering at the design stage to reduce the costs of wastage (value of wasted and unused
materials, cost of waste recovery and disposal); Optimising strategy for on-site segregation of wastes for minimum cost within a known space constraint; Targeting the top cost-competitive opportunities to adopt more reused materials and higher recycled content
in building products, e.g. in response to a client requirement; and Evaluating performance against corporate targets, such as a reduction in construction waste to landfill and
progress towards waste neutrality or zero Net Waste.
The NW Tool extends and replaces the WRAP ‘Evaluation Tool for Recycled Content in Construction Projects’ (RC Tool), which enabled the user to assess the level of recycled material used in construction projects. The NW Tool adds an additional element to this, which provides the user with information relating to the value and quantity of materials wasted. Together, both sets of information enable the calculation of ‘Net Waste’, where the value of construction materials wasted is compared to the value of additional reused and recycled content employed on a project. This helps to measure progress towards ‘Waste Neutrality’, which was proposed as a performance indicator in the Government’s Waste Strategy for England 2007. The reference dataset compiled for the NW Tool will enable the user to:
Target the quantity of waste to be generated by a project;
Provide a prioritised list of components where waste reduction opportunities exist;
Help users make an informed decision about their skip strategy and materials recovery rates;
Provide a way of capturing actual project data and comparing performance to targets; and
Report a range of metrics, including: value of materials wasted; reduction in wastage; waste diverted from landfill; carbon saving; saving in cost of waste disposal.
This purpose of this report is to describe the data collection method used and to comment upon the quality of the data gathered for use in the NW Tool, in terms of availability and limitations of the data, assumptions made in applying the information gathered and results of data validation exercises.
Guide to Reference Data Version 1.0
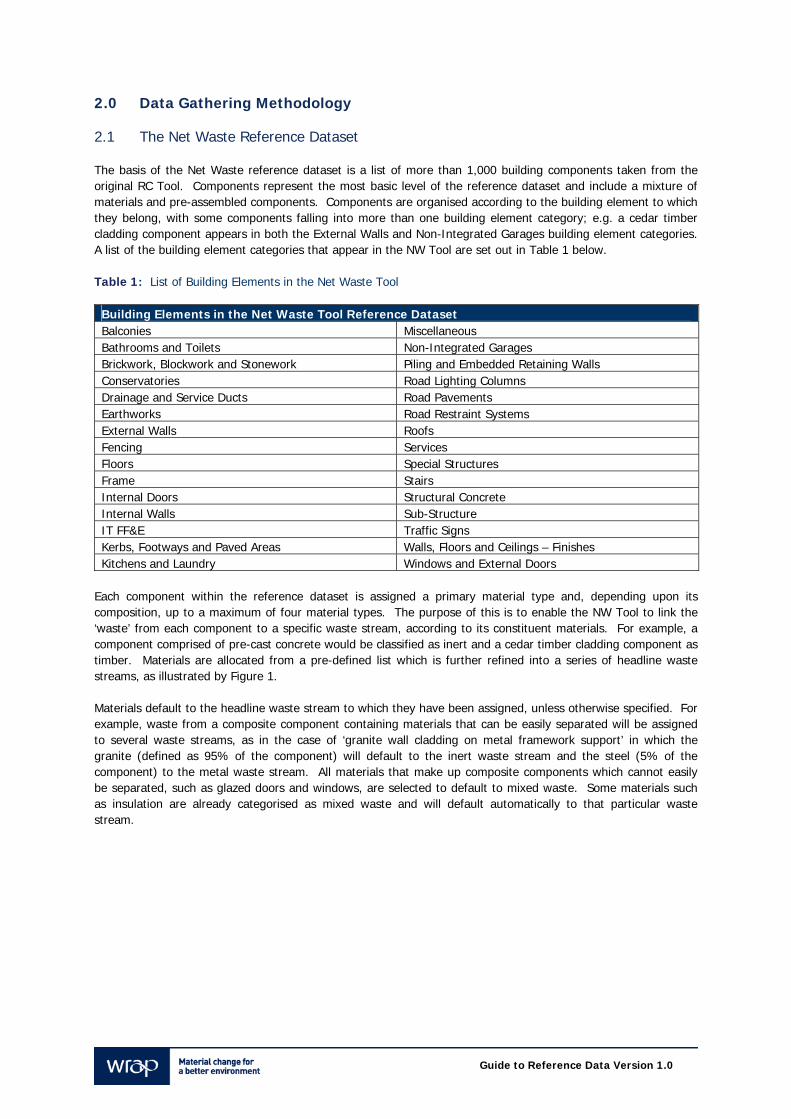
2.0 Data Gathering Methodology 2.1 The Net Waste Reference Dataset The basis of the Net Waste reference dataset is a list of more than 1,000 building components taken from the original RC Tool. Components represent the most basic level of the reference dataset and include a mixture of materials and pre-assembled components. Components are organised according to the building element to which they belong, with some components falling into more than one building element category; e.g. a cedar timber cladding component appears in both the External Walls and Non-Integrated Garages building element categories. A list of the building element categories that appear in the NW Tool are set out in Table 1 below. Table 1: List of Building Elements in the Net Waste Tool
Building Elements in the Net Waste Tool Reference Dataset Balconies Miscellaneous Bathrooms and Toilets Non-Integrated Garages Brickwork, Blockwork and Stonework Piling and Embedded Retaining Walls Conservatories Road Lighting Columns Drainage and Service Ducts Road Pavements Earthworks Road Restraint Systems External Walls Roofs Fencing Services Floors Special Structures Frame Stairs Internal Doors Structural Concrete Internal Walls Sub-Structure IT FF&E Traffic Signs Kerbs, Footways and Paved Areas Walls, Floors and Ceilings – Finishes Kitchens and Laundry Windows and External Doors
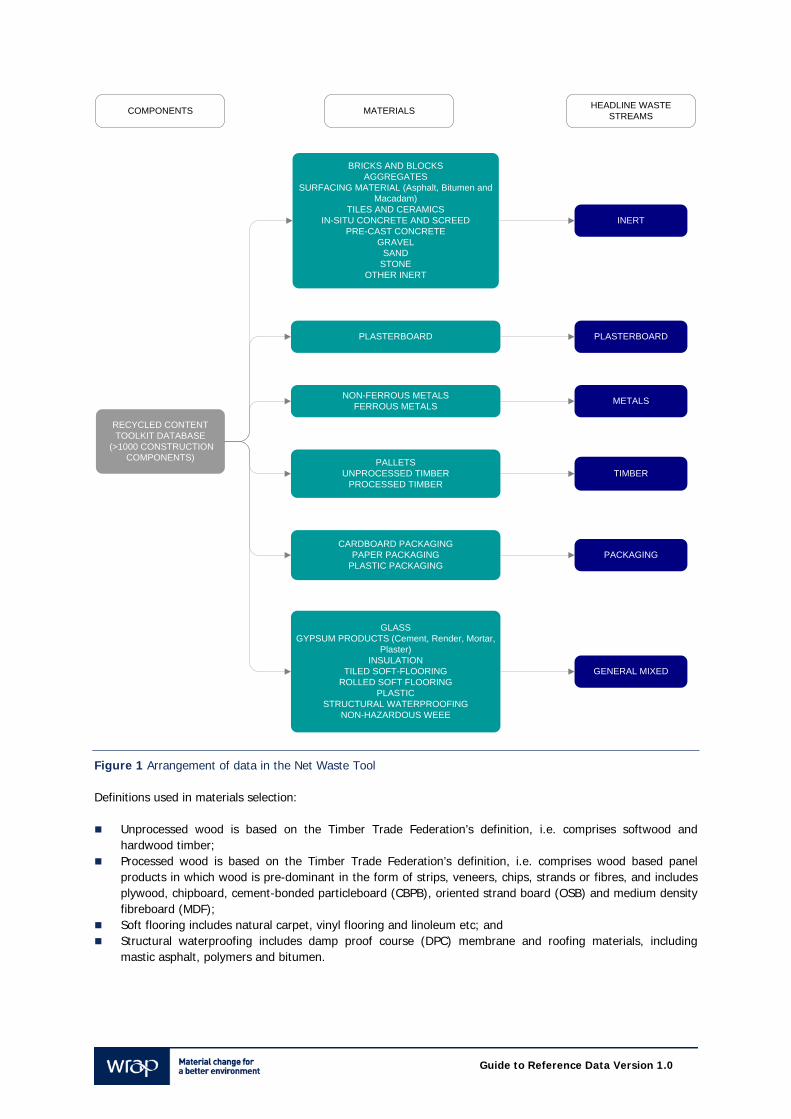
Each component within the reference dataset is assigned a primary material type and, depending upon its composition, up to a maximum of four material types. The purpose of this is to enable the NW Tool to link the ‘waste’ from each component to a specific waste stream, according to its constituent materials. For example, a component comprised of pre-cast concrete would be classified as inert and a cedar timber cladding component as timber. Materials are allocated from a pre-defined list which is further refined into a series of headline waste streams, as illustrated by Figure 1. Materials default to the headline waste stream to which they have been assigned, unless otherwise specified. For example, waste from a composite component containing materials that can be easily separated will be assigned to several waste streams, as in the case of ‘granite wall cladding on metal framework support’ in which the granite (defined as 95% of the component) will default to the inert waste stream and the steel (5% of the component) to the metal waste stream. All materials that make up composite components which cannot easily be separated, such as glazed doors and windows, are selected to default to mixed waste. Some materials such as insulation are already categorised as mixed waste and will default automatically to that particular waste stream.
Guide to Reference Data Version 1.0
RECYCLED CONTENT TOOLKIT DATABASE
(>1000 CONSTRUCTION COMPONENTS)
METALS
GENERAL MIXED
TIMBER
INERT
PACKAGING
PLASTERBOARD
PALLETSUNPROCESSED TIMBER
PROCESSED TIMBER
CARDBOARD PACKAGINGPAPER PACKAGING
PLASTIC PACKAGING
PLASTERBOARD
GLASSGYPSUM PRODUCTS (Cement, Render, Mortar,
Plaster)INSULATION
TILED SOFT-FLOORINGROLLED SOFT FLOORING
PLASTICSTRUCTURAL WATERPROOFING
NON-HAZARDOUS WEEE
NON-FERROUS METALSFERROUS METALS
BRICKS AND BLOCKSAGGREGATES
SURFACING MATERIAL (Asphalt, Bitumen and Macadam)
TILES AND CERAMICSIN-SITU CONCRETE AND SCREED
PRE-CAST CONCRETEGRAVEL
SANDSTONE
OTHER INERT
COMPONENTS MATERIALS HEADLINE WASTE STREAMS
Figure 1 Arrangement of data in the Net Waste Tool Definitions used in materials selection:
Unprocessed wood is based on the Timber Trade Federation’s definition, i.e. comprises softwood and hardwood timber;
Processed wood is based on the Timber Trade Federation’s definition, i.e. comprises wood based panel products in which wood is pre-dominant in the form of strips, veneers, chips, strands or fibres, and includes plywood, chipboard, cement-bonded particleboard (CBPB), oriented strand board (OSB) and medium density fibreboard (MDF);
Soft flooring includes natural carpet, vinyl flooring and linoleum etc; and Structural waterproofing includes damp proof course (DPC) membrane and roofing materials, including
mastic asphalt, polymers and bitumen.
Guide to Reference Data Version 1.0
2.2 Data Requirements The reference dataset contains eight categories of data, each of which applies at either the component, material, or headline waste stream level. The NW Tool uses the reference dataset to provide information relating to each component selected by the user. These data categories can be summarised as follows: At the Component Level
Dimensions and Densities; Wastage Rates; Wastage Rates associated with Modern Methods of Construction (MMC); and Mass of Packaging.
At the Material Level
Recovery Rates; Bulking Factors; and Embodied Carbon of Primary Materials and Carbon Savings from Reduction of Waste and Recycling.
At the Headline Waste Stream Level
Cost of Waste Disposal and Take-Back Schemes.
2.2.1 Dimensions and Densities Dimension and density data are required for each component in order to convert dimensional metrics (item, m, m2 or m3) to mass (kg). Some dimensions also require conversion factors from linear or square metres to volume (m3). 2.2.2 Wastage Rates Wastage rates account for the proportion of a component that ends up as waste during the installation and/or construction process. Wastage rates apply to all components in the reference dataset and exist in two forms, baseline and good practice. Allowance has been made to accommodate best practice wastage rates in future versions of the NW Tool. Wastage rates are expressed as a percentage by volume of construction materials ordered which becomes waste and are used to calculate the likely or actual proportion of each component wasted. This is a key dataset within the NW Tool as wastage rates inform a number of functions, including the site waste management plan screen, skip selector and waste management costs, and the final Net Waste metric calculation.1 Wastage rates are referred to as ‘default’ wastage rates when described in comparison to wastage rates associated with Modern Methods of Construction (MMC); see Section 2.2.3 for details. 2.2.3 Wastage Rates Associated with Modern Methods of Construction The rise of MMC mean that construction waste generated on-site can be reduced by as much as 90% for specific building components.2 A second set of wastage rates, known as MMC wastage rates are incorporated into the reference dataset and apply to all components at baseline and good practice. Allowance has been made to accommodate best practice wastage rates in future versions of the NW Tool. MMC wastage rates are relevant to those components which can be constructed or installed either directly on-site or as part of a MMC system, e.g. ceramic sanitary ware may be installed directly on-site or form part of a
1 WRAP (2008) The Net Waste Method: Testing a New Standard for Measuring Waste Neutrality, http://www.wrap.org.uk/downloads/Net_Waste_Brochure.9f8bec2e.pdf.
2 WRAP (2007) Current Practices and Future Potential in Modern Methods of Construction, http://www.wrap.org.uk/downloads/Modern_Methods_of_Construction_-_Summmary.8bd62970.pdf
Guide to Reference Data Version 1.0
bathroom pod manufactured off-site. In these cases, the MMC wastage rate for the individual component will be less than for the ‘default’ wastage rate (i.e. those described in Section 2.2.2). Where MMC is not applicable to a particular component, the default wastage rate will apply (in which case, the user does not see a checkbox for MMC in the NW Tool interface); this includes:
Composite components such as wall panels and aluminium-framed windows, which are often manufactured off-site to a given specification and typically generate little waste on-site. Any waste which is generated is usually through on-site damage and so the MMC and default wastage rates are deemed to be the same.
Other non-composite components to which MMC does not apply include those associated with earthworks, such as granular fill. In these cases, the MMC wastage rate will be the same as the default because there is no scope for reduced wastage with MMC.
In all cases, MMC wastage rates are expressed as a percentage by volume of construction materials ordered which becomes waste and are used to calculate the likely or actual proportion of each component wasted when the MMC check box is selected by the user in the NW Tool. 2.2.4 Packaging The reference dataset contains information relating to the amount of packaging associated with each component. This is expressed in terms of kilograms per component and is split across four types of packaging material: wooden pallets, timber, cardboard/paper and plastic. The purpose of this is to allow the total mass of packaging associated with these components to be calculated. Whilst a packaging waste stream has been identified, only cardboard, paper and plastic packaging default to this waste stream. Metal packaging is assigned to the metal waste stream and timber packaging and wooden pallets to the timber waste stream. 2.2.5 Recovery Rates Recovery rates are applied at the material level and represent the proportion of each material within a component that is likely to be recovered through a materials recycling or processing facility. This information is required to calculate the amount of waste associated with each component that will be diverted from landfill. There are two categories of recovery rates within the reference dataset:
Recovery rates of materials from segregated containers; and Recovery rates of materials from mixed waste containers.
Both sets of data include baseline and good recovery rates; allowance has been made to accommodate best practice recovery rates in future versions of the NW Tool. 2.2.6 Bulking Factors Container bulking factors refer to the amount of void space within a skip and are required to calculate the actual volume of space taken up by a particular material. There are two sets of bulking factors, one set for un-compacted waste and another for compacted, both of which apply at the material level. 2.2.7 Cost of Waste Disposal and Take-Back Schemes Cost data are used to demonstrate the cost of disposal and the savings that could be made by segregating waste and reducing waste to landfill. The reference dataset contains cost data for a variety of container sizes for each headline waste stream. Together with the value of waste, these savings provide the business case for waste minimisation and management. The reference dataset also contains information on the cost of applicable take-back schemes for certain materials, which the user is able to select where applicable. 2.2.8 Embodied Carbon Impact Factors The reference dataset contains two sets of carbon factors which allow the user to calculate the net carbon dioxide benefits of a) diverting waste from landfill by recycling (relative to landfill) and b) saving embodied energy of construction products through further waste reduction. The resulting units are a mass (kg) of carbon dioxide saved per kilogram of material that will be recycled and per kilogram of material that is not wasted.
Guide to Reference Data Version 1.0
2.3 Data Gathering Arup has collated information for all categories of data except dimensions and densities (undertaken by Cyril Sweett) and packaging, which has been provided directly by Responsible Solutions, a consultant to Envirowise. This report does not currently provide any further information on these two datasets except to comment on the quality of the packaging data provided; the densities dataset is contained in Appendix 1. The reference dataset has been compiled using a mix of primary and secondary sources of information. A desk-based study has been undertaken to identify pre-existing data in published sources of information, including previous WRAP research projects, articles from academic journals and online information from component manufacturers and industry associations. This has proved valuable in collating information for all data categories, but particularly for wastage rates, MMC wastage rates, recovery rates and carbon factors. Additional primary research has also been undertaken for bulking factors, container costs and take-back costs due to a lack, or absence of, available secondary information. Materials recycling facilities (MRFs) and construction companies have been approached to provide information as well as some industry organisations, such as British Gypsum, which has provided information on the cost of plasterboard take-back schemes in particular. Research has also been undertaken to help allocate material categories to composite components. This has involved consultation with Arup internal specialists and component manufacturers, including Kingspan, Bison, Kirk Natural Stone, Levolux, Alumasc Exterior Building Products, Tensys, Demountable Partitions Ltd, and Mitchellson, among others. Information contained within the reference dataset is based on new build projects where possible. The sources of available data for each data category are described further in section 3 of this report. 2.4 Data Benchmarking and Validation Benchmarking and validation of the reference dataset was undertaken at various stages during January to March 2008. It has been possible to provide some degree of validation for all categories of data, which is further described in section 3 of this report. A variety of key sources were identified to undertake this exercise as follows:
Building Research Establishment (BRE): has detailed information available on wastage rates and recovery rates of components and building materials. This is based on a range of sources and dates from 2005. This information is confidential and cannot be used specifically or described in this report, but has been used to test if research data are within a range to be expected.
WRAP Net Waste Trial (NW Trial): In 2007, the Net Waste Method was trialled on eight construction waste
projects across the UK, involving the collection of wastage rate data for a variety of NW Tool components based on the various construction contractors' experience.3 This data was checked against the existing BRE data (as described above) and has since been provided for use as part of the data validation exercise for the NW Tool.
Net Waste Tool Consultation Group (NW Consultation Group): set up as part of Phase One of the Net Waste
project to test functionality of the NW Tool. This comprised members of the construction industry who were familiar with the project and who were willing to participate in the scoping phase of the NW Tool. A workshop meeting was held on the 4th February 2008 and the opportunity used to present research data requiring further validation.
Net Waste Tool Contractor Questionnaires (NW Contractor Questionnaire): questionnaires were sent to
representatives of 10 construction companies already participating in the Net Waste Tool Consultation Group to request actual construction project data relevant to the NW Tool. Where possible, a short follow-up interview was conducted to review the data provided in further detail. A response rate of 30% was
3 http://www.wrap.org.uk/wrap_corporate/news/wrap_launches_pilot.html
Guide to Reference Data Version 1.0
achieved, which limited opportunities for follow-up interviews, but while most participants were unable to respond to the questionnaire directly, they have provided ad hoc information throughout the data gathering and benchmarking process which has been used to validate information in the reference dataset. A copy of the information requirements can be found in Appendix 2 and a summary of questionnaire responses received in Appendix 3.
2.5 Data Entry and Data Update Process The WRAP Data Controller is a software data management tool developed to facilitate the data gathering exercise and capture the information recorded. This incorporates the RC Tool component database, against which values for wastage rates, MMC wastage rates, packaging, and component dimensions and densities can be input. It also enables materials to be allocated to components and provides the mechanism by which components can be assigned to the mixed waste category, if this is not the default waste stream. The Data Controller will be used to update the reference dataset as future versions of the NW Tool are developed. This is particularly important for data categories such as wastage rates, which will be affected, for example, by developments in construction methods and price of secondary materials such as metals. This report also states a number of limitations in relation to each category within the initial reference dataset and a number of areas for further research have been identified. In relation to this process, users of the tool are invited to submit relevant data from their own projects, or otherwise, that could be used to help refine the reference dataset.
Guide to Reference Data Version 1.0
3.0 Wastage Rates and Materials Allocation 3.1 Sources of Available Information There is a relatively wide range of data available for both building materials and composite components. WRAP has recently published a number of reports on construction waste management and minimisation and many include wastage rate data that have formed the basis for much of the reference dataset; these include:
Construction Wastage Quick Win Solutions: Supply Chain Wastage of Materials;4 Current Practices and Future Potential in Modern Methods of Construction;5 A Partnership Approach to Plasterboard Waste Management and Recycling;6 Woodbridge Airfield and Coventry Hospital Site Reports;7 and Capture of Waste Plasterboard on Construction Sites.8
A range of information is also available from Waste Aware Construction, an online resource created by Waste Aware Scotland, which provides general information on the management of construction and demolition wastes.9 Wastage rate data has been published for a list of materials largely in line with that developed as part of the NW Tool. It has been confirmed that the data originates from other published sources but it has not been possible to validate those sources at this stage. The Building Research Establishment (BRE) is a third source of information on wastage rates for a wide range of materials and components. It was not possible to use this data directly to inform wastage rates for the NW Tool, but has instead been used for validation purposes. Other sources of information generally relate more to composite components. For example, ‘i-greenbuild’ is a US-based online resource for sustainable design and construction that has been used to inform the wastage rates applied to soft-flooring components.10 Use has also been made of online information provided by industry organisations (e.g. UK Aluminium Federation11 and Corus12) and building component manufacturers. In some cases, professional judgement has been applied, particularly to high-value and off-site manufactured items such as bathroom fixtures and fittings, and doors and windows, for which very little wastage would be expected. In these cases, an attempt has been made to provide data supporting these assumptions but has otherwise been checked during the validation exercise. A limited amount of information is also available from some academic research journals; for example, wastage rates for in-situ concrete were obtained from a research paper, ‘Review of Construction Industry Waste with
4 WRAP (2007) Construction Wastage Quick Win Solutions: Supply Chain Wastage of Materials, http://www.wrap.org.uk
5 WRAP (2007) Current Practices and Future Potential in Modern Methods of Construction, http://www.wrap.org.uk/downloads/Modern_Methods_of_Construction_Full.853d2543.pdf.
6 WRAP (Undated) A Partnership Approach to Plasterboard Waste Management and Recycling, http://www.wrap.org.uk/downloads/Case_Study_-_A_partnership_approach.bd3a28a2.pdf.
7 WRAP (2007) Woodbridge Airfield and Coventry Hospital Site Reports, http://www.wrap.org.uk
8 WRAP (2007) Capture of Waste Plasterboard on Construction Sites, http://www.wrap.org.uk/downloads/Cost_effective_solutions_report_-_final.49a2316b.pdf.
9 Waste Aware Construction (2005) Waste Aware Facts, http://www.wasteawareconstruction.org.uk/why.asp.
10 Author and Date Unknown, Efficient Installation Guide in Schools, http://www.igreenbuild.com. Please note that this article was accessed on 9 November 2007 but is no longer available from the ‘igreenbuild’ website.
11 http://www.alfed.org.uk/templates/alfed/content.asp?PageId=108
12 http://corusgroup.com/en/responsibility/sustainable_development/construction/
Guide to Reference Data Version 1.0
Particular Reference to the Wastage of Ready Mixed Concrete’, published online by the University of Aberystwyth.13 3.2 Limitations of Data and Options for Further Research The NW Tool requires wastage rate data at baseline and good practice. However, the sources of information consulted generally provide just one figure and it is often not stated as to whether this is considered to be baseline, good or best practice. Baseline and good practice wastage rates are, therefore, assumed based upon the range and type of information provided by the various sources. Some sources provide a range of values between which wastage rates are expected to fall and these have been interpreted as providing a ‘baseline’ and ‘good’ practice wastage rate. Despite the level of research undertaken with component manufacturers in relation to component-specific wastage rates, it has sometimes been necessary to apply a wastage rate based on the performance of the materials contained within a certain component. In other cases, where it was felt incorrect to do this, professional judgement has been applied, particularly for some off-site manufactured components for which little wastage is assumed but for which there is no actual reference data in support of the assumption made. As future versions of the NW Tool develop, it will be necessary to undertake further research on best practice wastage rates. Some of this information does already exist as secondary information from previous WRAP research, although to a more limited extent than for baseline and good practice wastage rates. One of the challenges will be to find best practice wastage rates for composite components, where most of the baseline and good practice wastage rates have been obtained from manufacturers or are based on professional judgement according to the nature of the materials used and application within the construction process. 3.3 Data Benchmarking and Validation Wastage rate data has been benchmarked against existing information from BRE, Waste Aware Construction, the WRAP NW Trial, NW Consultation Group and NW Contractor Questionnaires. It has been possible only to benchmark wastage rates for materials against Waste Aware Construction Data, which applies to fifteen main types of materials generated as waste during construction. In some cases, the data are too generic to be useful; for example a wastage rate of 6% is specified for ‘concrete’ but it is currently unknown as to whether this applies to in-situ or pre-cast concrete, although this figure would fall within the ranges specified for both types of concrete. Where the data can be used for comparison, the results are varied; wastage rates of 16% for drywall plasterboard and 10% for general inert support the good and baseline wastage rates identified respectively for these two material types. The wastage rate for timber (15%) is a third higher than the baseline wastage rate for both unprocessed and processed timber, whilst wastage rates for bricks (7.5%), glass (1%) and non-ferrous metal (1%) are much lower than the good wastage rates identified for these materials. Information provided by BRE is generally in line with the baseline wastage rates identified for the NW Tool. Only one respondent to the contractor questionnaire provided percentage waste rate data for an actual project and this was shown to be more in line with the good practice wastage rates identified. Where available from published information, use has also been made of best practice wastage rates which validate that baseline and good practice wastage rates are in the correct range. Some of the wastage rate data presented to the NW Consultation Group resulted in the following amendments:
Bricks and blocks: it was considered that the baseline practice wastage rate of 3-4% was too low, especially for bricks, and more representative of a best practice scenario. It was estimated that up to 16% wastage would typically occur on delivery to site, with perhaps a further 5% wastage occurring on site. For this reason, a 20% baseline wastage rate has been input for both bricks and blocks, with a 10% good
13 Deeble S (1998) A Review of Construction Industry Waste with Particular Reference to the Wastage of Ready Mixed Concrete. University of Aberystwyth, http://users.aber.ac.uk/zwk/distlearn/virtlib/projects/deeble/deeble.html.
Guide to Reference Data Version 1.0
wastage rate for bricks and a 5% wastage rate for blocks. The good practice wastage rate for blocks is less than for bricks based on information provided by the NW Trials, where four projects reported a wastage rate of 5% for blocks.
Plasterboard: there is a wide range of data available on plasterboard wastage rates, which was presented
to the NW Consultation Group. It was agreed by two members of the Group that baseline wastage was likely to be in the higher range of 15-20% and up to as much as 25%, based on the waste generated by a dry-lining project, which had been tracked throughout the project. Another member of the Group involved in tracking plasterboard waste suggested that a baseline wastage rate for residential new build would be 22%. Given the feedback obtained, a baseline wastage rate of 22.5% has been applied with a good practice wastage rate of 15%. The latter also reflects the aims of the Ashdown Agreement to reduce site plasterboard wastage to 15%.
It was further agreed that a best practice wastage rate of less than 10% would occur where plasterboard
waste could be designed out of the process. Plasterboard is one material where members of the Group are using bar-coding techniques to track waste and, as such, where it is possible to have a high degree of confidence in the wastage rates suggested.
Packaging: it was agreed that baseline wastage for construction packaging would be close to, if not
100%. This would apply to all materials since it was confirmed that the industry, generally, does not segregate packaging waste streams, although some are trialling reusable packaging on specific projects.
Soft-flooring tiles: it was agreed that Arup’s data showing a range of between 1.5% and 2.5% was
realistic at good to baseline wastage. A midway figure of 2% has been adopted as good practice with 5% at baseline which is based on other sources of data.
3.4 Wastage and MMC Wastage Rate Dataset and Assumptions Due to the large number of components in the reference dataset, a full set of wastage rate data and assumptions are included as Appendix 4. The dataset is presented in tabular format by building element (in alphabetical order) and component categories within each building element are listed. Some parts of the dataset have been refined so that component descriptions of the same type and materials allocation are grouped together for ease of use. The majority of components in the reference dataset are assigned either with a general material or component-specific wastage and these are detailed in Tables 2 and 3 respectively. Appendix 4 refers to the type of wastage rate specified for a particular component and also describes the allocation of materials, especially in relation to composite components, for which a number of assumptions have been made. Materials allocation is important because it is sometimes used to inform the wastage rate where it cannot be identified from other sources; i.e. the wastage rates of the constituent materials are used to produce an aggregate figure, e.g. as for pre-cast beam and block used in ground slabs and in-situ reinforced concrete, where the steel element is determined to be more than 3%. Materials allocation also determines the waste stream to which waste from the component will be assigned. All components which are comprised of more than one material are automatically selected to default to mixed waste. There are two exceptions to this:
Components which contain only materials from the same waste stream; e.g. ‘porous concrete pipe with type A bed and type A fill’, which contains pre-cast concrete and aggregate materials, both of which are categorised as inert materials. Also, waste from most door components, which are comprised of processed and unprocessed timber, will continue to be categorised within the timber waste stream rather than mixed waste.
Any component containing in-situ concrete in addition to one other material, i.e. usually reinforced concrete.
The in-situ nature of construction means that any concrete waste will be separate to steel waste and vice-versa.

Guide to Reference Data Version 1.0
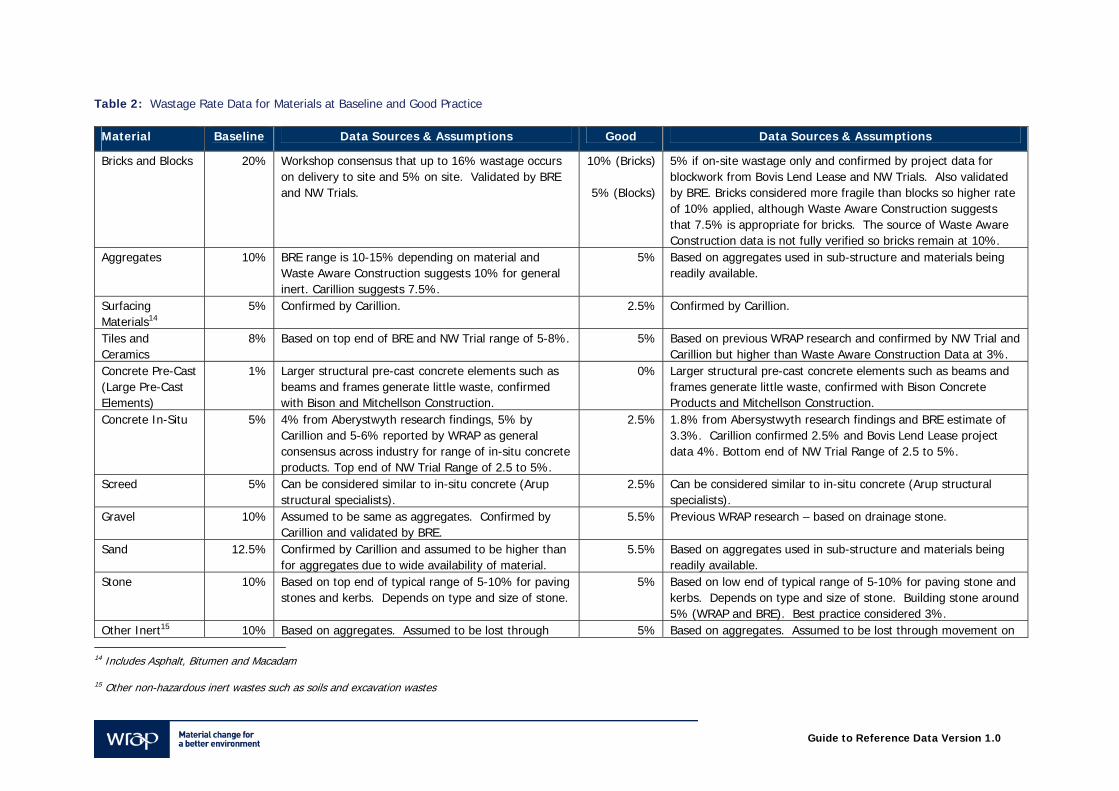
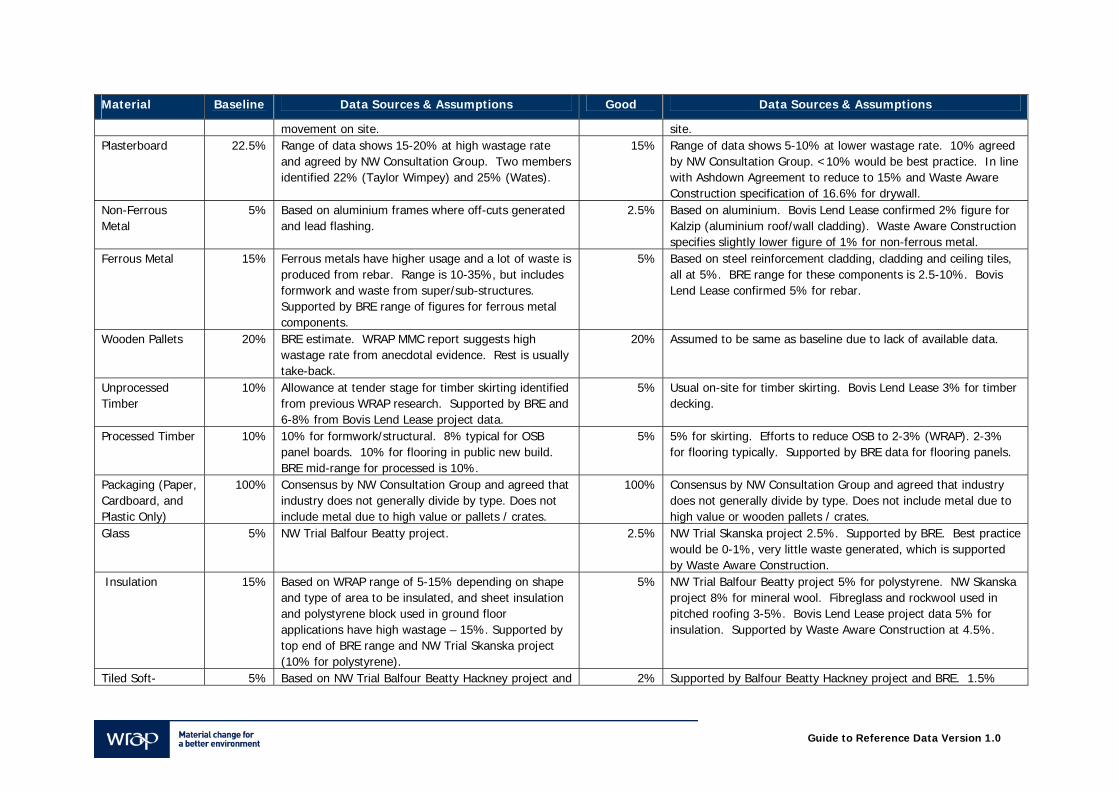
Table 2 shows the wastage rates (mainly based on primary materials) for which there is much published information available and which is well supported by other sources. Table 3 provides details of the more common NW Tool component-specific wastage rates which are based primarily on information from manufacturers and installation companies. These lists are not exhaustive but do provide an overview of the most common sets of wastage rates used and a comparison against validation sources.
Guide to Reference Data Version 1.0
Table 2: Wastage Rate Data for Materials at Baseline and Good Practice
Material Baseline Data Sources & Assumptions Good Data Sources & Assumptions
Bricks and Blocks 20% Workshop consensus that up to 16% wastage occurs on delivery to site and 5% on site. Validated by BRE and NW Trials.
10% (Bricks)
5% (Blocks)
5% if on-site wastage only and confirmed by project data for blockwork from Bovis Lend Lease and NW Trials. Also validated by BRE. Bricks considered more fragile than blocks so higher rate of 10% applied, although Waste Aware Construction suggests that 7.5% is appropriate for bricks. The source of Waste Aware Construction data is not fully verified so bricks remain at 10%.
Aggregates 10% BRE range is 10-15% depending on material and Waste Aware Construction suggests 10% for general inert. Carillion suggests 7.5%.
5% Based on aggregates used in sub-structure and materials being readily available.
Surfacing Materials14
5% Confirmed by Carillion. 2.5% Confirmed by Carillion.
Tiles and Ceramics
8% Based on top end of BRE and NW Trial range of 5-8%. 5% Based on previous WRAP research and confirmed by NW Trial and Carillion but higher than Waste Aware Construction Data at 3%.
Concrete Pre-Cast (Large Pre-Cast Elements)
1% Larger structural pre-cast concrete elements such as beams and frames generate little waste, confirmed with Bison and Mitchellson Construction.
0% Larger structural pre-cast concrete elements such as beams and frames generate little waste, confirmed with Bison Concrete Products and Mitchellson Construction.
Concrete In-Situ 5% 4% from Aberystwyth research findings, 5% by Carillion and 5-6% reported by WRAP as general consensus across industry for range of in-situ concrete products. Top end of NW Trial Range of 2.5 to 5%.
2.5% 1.8% from Abersystwyth research findings and BRE estimate of 3.3%. Carillion confirmed 2.5% and Bovis Lend Lease project data 4%. Bottom end of NW Trial Range of 2.5 to 5%.
Screed 5% Can be considered similar to in-situ concrete (Arup structural specialists).
2.5% Can be considered similar to in-situ concrete (Arup structural specialists).
Gravel 10% Assumed to be same as aggregates. Confirmed by Carillion and validated by BRE.
5.5% Previous WRAP research – based on drainage stone.
Sand 12.5% Confirmed by Carillion and assumed to be higher than for aggregates due to wide availability of material.
5.5% Based on aggregates used in sub-structure and materials being readily available.
Stone 10% Based on top end of typical range of 5-10% for paving stones and kerbs. Depends on type and size of stone.
5% Based on low end of typical range of 5-10% for paving stone and kerbs. Depends on type and size of stone. Building stone around 5% (WRAP and BRE). Best practice considered 3%.
Other Inert15 10% Based on aggregates. Assumed to be lost through 5% Based on aggregates. Assumed to be lost through movement on 14 Includes Asphalt, Bitumen and Macadam
15 Other non-hazardous inert wastes such as soils and excavation wastes
Guide to Reference Data Version 1.0
Material Baseline Data Sources & Assumptions Good Data Sources & Assumptions
movement on site. site. Plasterboard 22.5% Range of data shows 15-20% at high wastage rate
and agreed by NW Consultation Group. Two members identified 22% (Taylor Wimpey) and 25% (Wates).
15% Range of data shows 5-10% at lower wastage rate. 10% agreed by NW Consultation Group. <10% would be best practice. In line with Ashdown Agreement to reduce to 15% and Waste Aware Construction specification of 16.6% for drywall.
Non-Ferrous Metal
5% Based on aluminium frames where off-cuts generated and lead flashing.
2.5% Based on aluminium. Bovis Lend Lease confirmed 2% figure for Kalzip (aluminium roof/wall cladding). Waste Aware Construction specifies slightly lower figure of 1% for non-ferrous metal.
Ferrous Metal 15% Ferrous metals have higher usage and a lot of waste is produced from rebar. Range is 10-35%, but includes formwork and waste from super/sub-structures. Supported by BRE range of figures for ferrous metal components.
5% Based on steel reinforcement cladding, cladding and ceiling tiles, all at 5%. BRE range for these components is 2.5-10%. Bovis Lend Lease confirmed 5% for rebar.
Wooden Pallets 20% BRE estimate. WRAP MMC report suggests high wastage rate from anecdotal evidence. Rest is usually take-back.
20% Assumed to be same as baseline due to lack of available data.
Unprocessed Timber
10% Allowance at tender stage for timber skirting identified from previous WRAP research. Supported by BRE and 6-8% from Bovis Lend Lease project data.
5% Usual on-site for timber skirting. Bovis Lend Lease 3% for timber decking.
Processed Timber 10% 10% for formwork/structural. 8% typical for OSB panel boards. 10% for flooring in public new build. BRE mid-range for processed is 10%.
5% 5% for skirting. Efforts to reduce OSB to 2-3% (WRAP). 2-3% for flooring typically. Supported by BRE data for flooring panels.
Packaging (Paper, Cardboard, and Plastic Only)
100% Consensus by NW Consultation Group and agreed that industry does not generally divide by type. Does not include metal due to high value or pallets / crates.
100% Consensus by NW Consultation Group and agreed that industry does not generally divide by type. Does not include metal due to high value or wooden pallets / crates.
Glass 5% NW Trial Balfour Beatty project. 2.5% NW Trial Skanska project 2.5%. Supported by BRE. Best practice would be 0-1%, very little waste generated, which is supported by Waste Aware Construction.
Insulation 15% Based on WRAP range of 5-15% depending on shape and type of area to be insulated, and sheet insulation and polystyrene block used in ground floor applications have high wastage – 15%. Supported by top end of BRE range and NW Trial Skanska project (10% for polystyrene).
5% NW Trial Balfour Beatty project 5% for polystyrene. NW Skanska project 8% for mineral wool. Fibreglass and rockwool used in pitched roofing 3-5%. Bovis Lend Lease project data 5% for insulation. Supported by Waste Aware Construction at 4.5%.
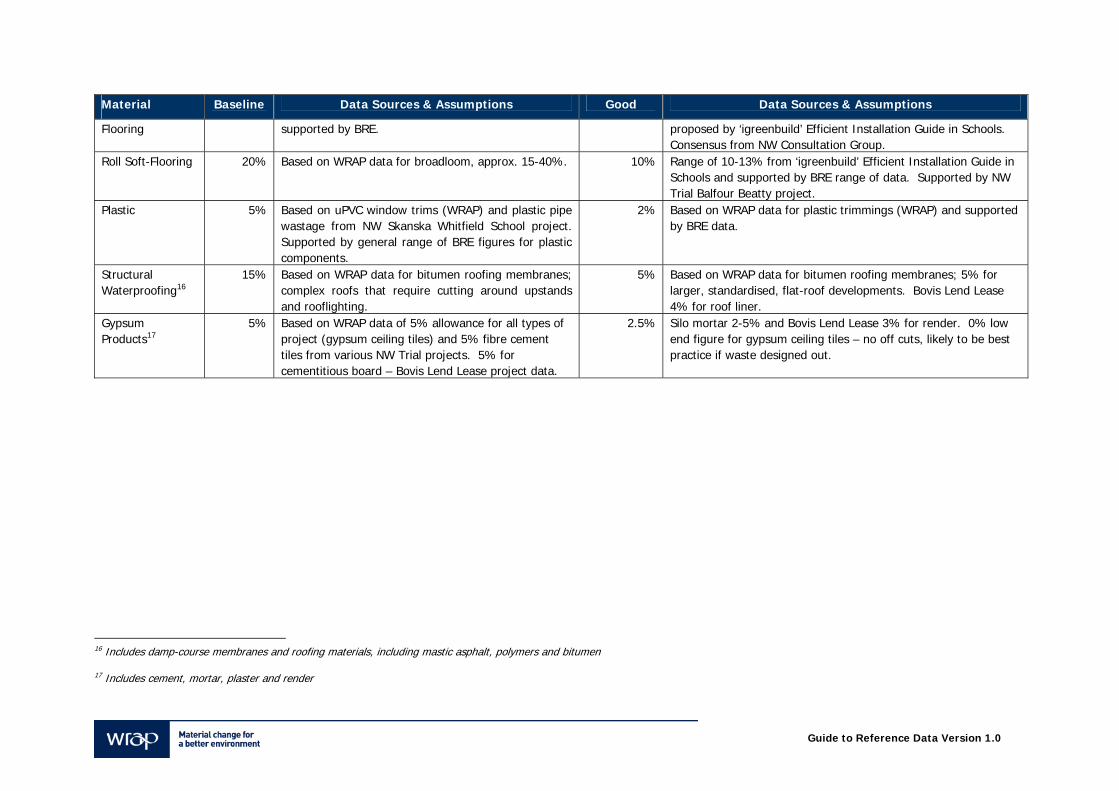
Tiled Soft- 5% Based on NW Trial Balfour Beatty Hackney project and 2% Supported by Balfour Beatty Hackney project and BRE. 1.5%
Guide to Reference Data Version 1.0
Material Baseline Data Sources & Assumptions Good Data Sources & Assumptions
Flooring supported by BRE. proposed by ‘igreenbuild’ Efficient Installation Guide in Schools. Consensus from NW Consultation Group.
Roll Soft-Flooring 20% Based on WRAP data for broadloom, approx. 15-40%. 10% Range of 10-13% from ‘igreenbuild’ Efficient Installation Guide in Schools and supported by BRE range of data. Supported by NW Trial Balfour Beatty project.
Plastic 5% Based on uPVC window trims (WRAP) and plastic pipe wastage from NW Skanska Whitfield School project. Supported by general range of BRE figures for plastic components.
2% Based on WRAP data for plastic trimmings (WRAP) and supported by BRE data.
Structural Waterproofing16
15% Based on WRAP data for bitumen roofing membranes; complex roofs that require cutting around upstands and rooflighting.
5% Based on WRAP data for bitumen roofing membranes; 5% for larger, standardised, flat-roof developments. Bovis Lend Lease 4% for roof liner.
Gypsum Products17
5% Based on WRAP data of 5% allowance for all types of project (gypsum ceiling tiles) and 5% fibre cement tiles from various NW Trial projects. 5% for cementitious board – Bovis Lend Lease project data.
2.5% Silo mortar 2-5% and Bovis Lend Lease 3% for render. 0% low end figure for gypsum ceiling tiles – no off cuts, likely to be best practice if waste designed out.
16 Includes damp-course membranes and roofing materials, including mastic asphalt, polymers and bitumen
17 Includes cement, mortar, plaster and render
Guide to Reference Data Version 1.0
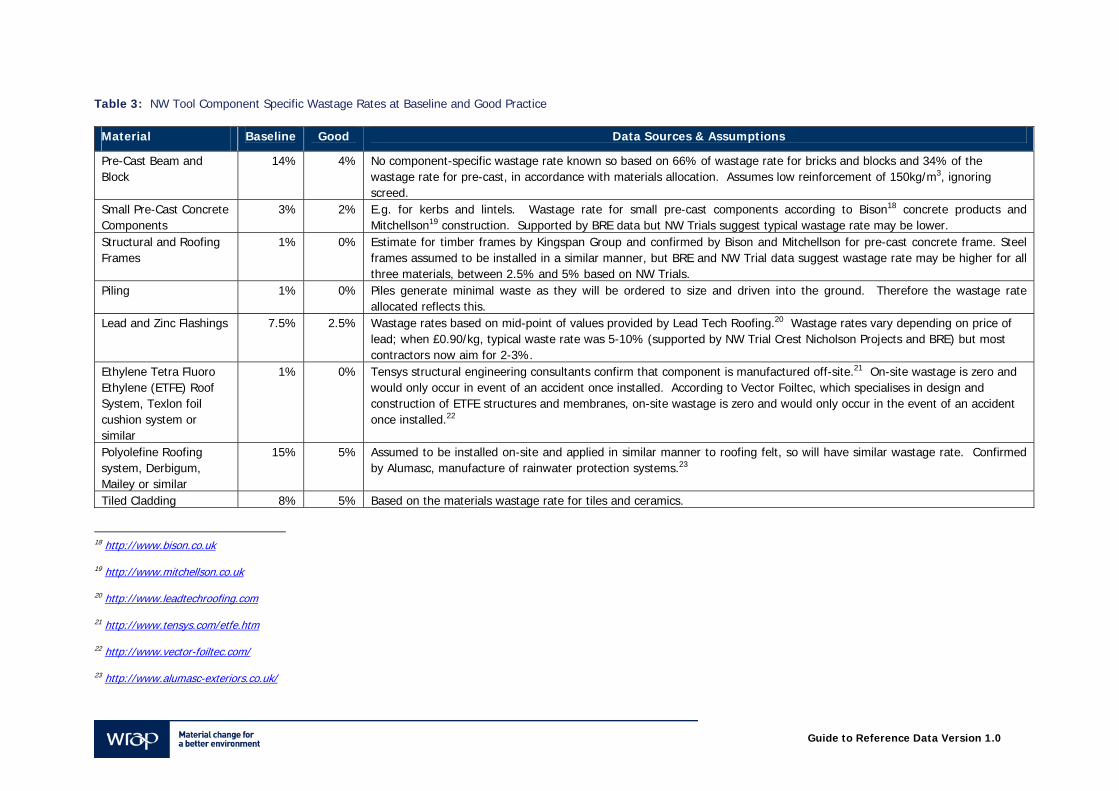
Table 3: NW Tool Component Specific Wastage Rates at Baseline and Good Practice
Material Baseline Good Data Sources & Assumptions
Pre-Cast Beam and Block
14% 4% No component-specific wastage rate known so based on 66% of wastage rate for bricks and blocks and 34% of the wastage rate for pre-cast, in accordance with materials allocation. Assumes low reinforcement of 150kg/m3, ignoring screed.
Small Pre-Cast Concrete Components
3% 2% E.g. for kerbs and lintels. Wastage rate for small pre-cast components according to Bison18 concrete products and Mitchellson19 construction. Supported by BRE data but NW Trials suggest typical wastage rate may be lower.
Structural and Roofing Frames
1% 0% Estimate for timber frames by Kingspan Group and confirmed by Bison and Mitchellson for pre-cast concrete frame. Steel frames assumed to be installed in a similar manner, but BRE and NW Trial data suggest wastage rate may be higher for all three materials, between 2.5% and 5% based on NW Trials.
Piling 1% 0% Piles generate minimal waste as they will be ordered to size and driven into the ground. Therefore the wastage rate allocated reflects this.
Lead and Zinc Flashings 7.5% 2.5% Wastage rates based on mid-point of values provided by Lead Tech Roofing.20 Wastage rates vary depending on price of lead; when £0.90/kg, typical waste rate was 5-10% (supported by NW Trial Crest Nicholson Projects and BRE) but most contractors now aim for 2-3%.
Ethylene Tetra Fluoro Ethylene (ETFE) Roof System, Texlon foil cushion system or similar
1% 0% Tensys structural engineering consultants confirm that component is manufactured off-site.21 On-site wastage is zero and would only occur in event of an accident once installed. According to Vector Foiltec, which specialises in design and construction of ETFE structures and membranes, on-site wastage is zero and would only occur in the event of an accident once installed.22
Polyolefine Roofing system, Derbigum, Mailey or similar
15% 5% Assumed to be installed on-site and applied in similar manner to roofing felt, so will have similar wastage rate. Confirmed by Alumasc, manufacture of rainwater protection systems.23
Tiled Cladding 8% 5% Based on the materials wastage rate for tiles and ceramics.
18 http://www.bison.co.uk
19 http://www.mitchellson.co.uk
20 http://www.leadtechroofing.com
21 http://www.tensys.com/etfe.htm
22 http://www.vector-foiltec.com/
23 http://www.alumasc-exteriors.co.uk/
Guide to Reference Data Version 1.0
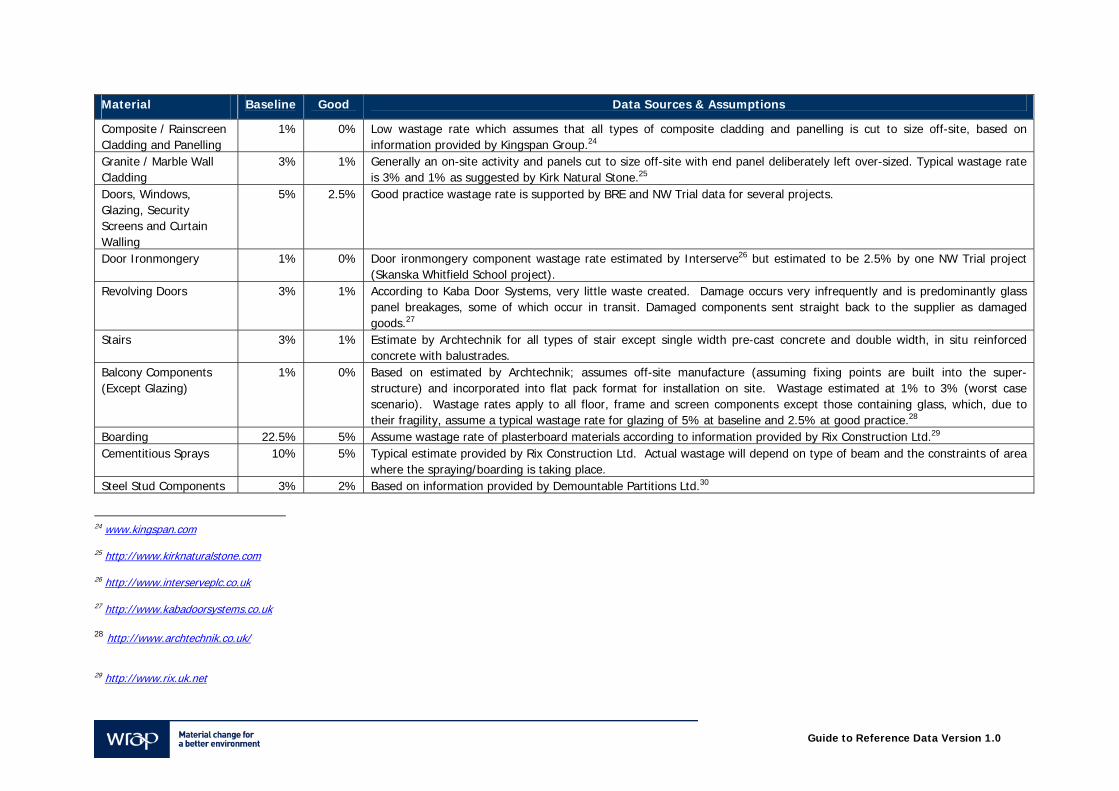
Material Baseline Good Data Sources & Assumptions
Composite / Rainscreen Cladding and Panelling
1% 0% Low wastage rate which assumes that all types of composite cladding and panelling is cut to size off-site, based on information provided by Kingspan Group.24
Granite / Marble Wall Cladding
3% 1% Generally an on-site activity and panels cut to size off-site with end panel deliberately left over-sized. Typical wastage rate is 3% and 1% as suggested by Kirk Natural Stone.25
Doors, Windows, Glazing, Security Screens and Curtain Walling
5% 2.5% Good practice wastage rate is supported by BRE and NW Trial data for several projects.
Door Ironmongery 1% 0% Door ironmongery component wastage rate estimated by Interserve26 but estimated to be 2.5% by one NW Trial project (Skanska Whitfield School project).
Revolving Doors 3% 1% According to Kaba Door Systems, very little waste created. Damage occurs very infrequently and is predominantly glass panel breakages, some of which occur in transit. Damaged components sent straight back to the supplier as damaged goods.27
Stairs 3% 1% Estimate by Archtechnik for all types of stair except single width pre-cast concrete and double width, in situ reinforced concrete with balustrades.
Balcony Components (Except Glazing)
1% 0% Based on estimated by Archtechnik; assumes off-site manufacture (assuming fixing points are built into the super-structure) and incorporated into flat pack format for installation on site. Wastage estimated at 1% to 3% (worst case scenario). Wastage rates apply to all floor, frame and screen components except those containing glass, which, due to their fragility, assume a typical wastage rate for glazing of 5% at baseline and 2.5% at good practice.28
Boarding 22.5% 5% Assume wastage rate of plasterboard materials according to information provided by Rix Construction Ltd.29 Cementitious Sprays 10% 5% Typical estimate provided by Rix Construction Ltd. Actual wastage will depend on type of beam and the constraints of area
where the spraying/boarding is taking place. Steel Stud Components 3% 2% Based on information provided by Demountable Partitions Ltd.30
24 www.kingspan.com
25 http://www.kirknaturalstone.com
26 http://www.interserveplc.co.uk
27 http://www.kabadoorsystems.co.uk
28 http://www.archtechnik.co.uk/
29 http://www.rix.uk.net
Guide to Reference Data Version 1.0
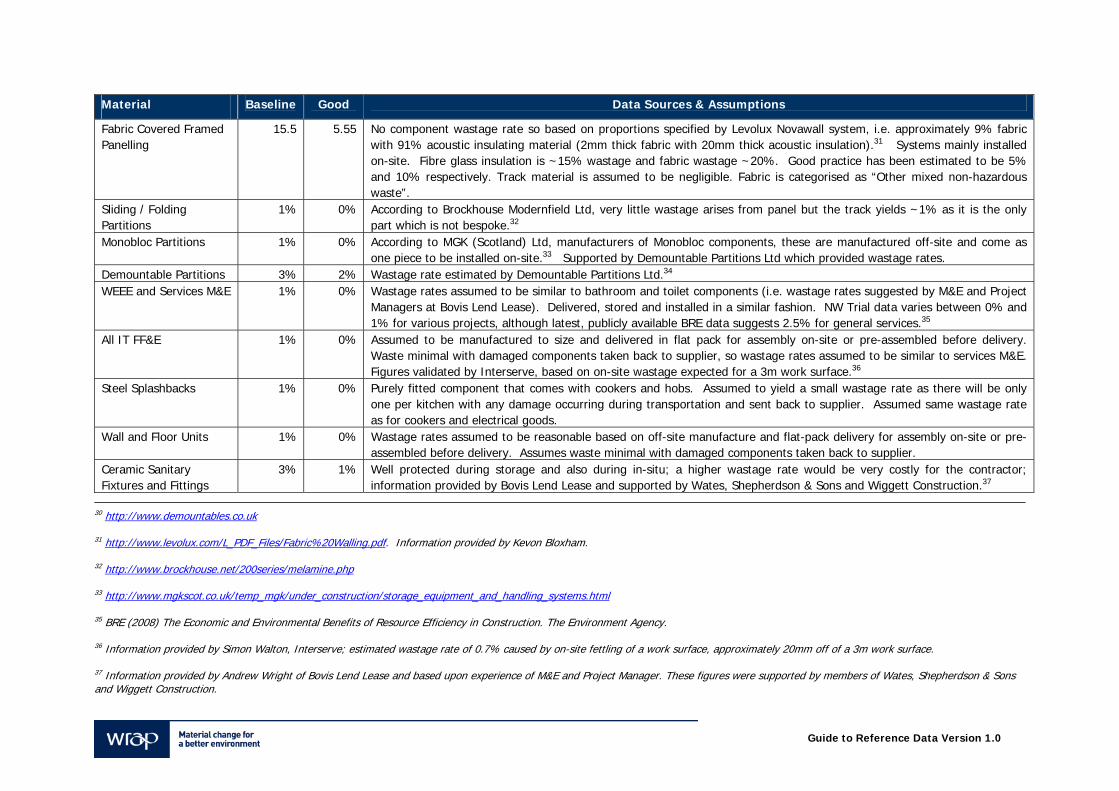
Material Baseline Good Data Sources & Assumptions
Fabric Covered Framed Panelling
15.5 5.55 No component wastage rate so based on proportions specified by Levolux Novawall system, i.e. approximately 9% fabric with 91% acoustic insulating material (2mm thick fabric with 20mm thick acoustic insulation).31 Systems mainly installed on-site. Fibre glass insulation is ~15% wastage and fabric wastage ~20%. Good practice has been estimated to be 5% and 10% respectively. Track material is assumed to be negligible. Fabric is categorised as “Other mixed non-hazardous waste”.
Sliding / Folding Partitions
1% 0% According to Brockhouse Modernfield Ltd, very little wastage arises from panel but the track yields ~1% as it is the only part which is not bespoke.32
Monobloc Partitions 1% 0% According to MGK (Scotland) Ltd, manufacturers of Monobloc components, these are manufactured off-site and come as one piece to be installed on-site.33 Supported by Demountable Partitions Ltd which provided wastage rates.
Demountable Partitions 3% 2% Wastage rate estimated by Demountable Partitions Ltd.34 WEEE and Services M&E 1% 0% Wastage rates assumed to be similar to bathroom and toilet components (i.e. wastage rates suggested by M&E and Project
Managers at Bovis Lend Lease). Delivered, stored and installed in a similar fashion. NW Trial data varies between 0% and 1% for various projects, although latest, publicly available BRE data suggests 2.5% for general services.35
All IT FF&E 1% 0% Assumed to be manufactured to size and delivered in flat pack for assembly on-site or pre-assembled before delivery. Waste minimal with damaged components taken back to supplier, so wastage rates assumed to be similar to services M&E. Figures validated by Interserve, based on on-site wastage expected for a 3m work surface.36
Steel Splashbacks 1% 0% Purely fitted component that comes with cookers and hobs. Assumed to yield a small wastage rate as there will be only one per kitchen with any damage occurring during transportation and sent back to supplier. Assumed same wastage rate as for cookers and electrical goods.
Wall and Floor Units 1% 0% Wastage rates assumed to be reasonable based on off-site manufacture and flat-pack delivery for assembly on-site or pre-assembled before delivery. Assumes waste minimal with damaged components taken back to supplier.
Ceramic Sanitary Fixtures and Fittings
3% 1% Well protected during storage and also during in-situ; a higher wastage rate would be very costly for the contractor; information provided by Bovis Lend Lease and supported by Wates, Shepherdson & Sons and Wiggett Construction.37
30 http://www.demountables.co.uk
31 http://www.levolux.com/L_PDF_Files/Fabric%20Walling.pdf. Information provided by Kevon Bloxham.
32 http://www.brockhouse.net/200series/melamine.php
33 http://www.mgkscot.co.uk/temp_mgk/under_construction/storage_equipment_and_handling_systems.html 35 BRE (2008) The Economic and Environmental Benefits of Resource Efficiency in Construction. The Environment Agency.
36 Information provided by Simon Walton, Interserve; estimated wastage rate of 0.7% caused by on-site fettling of a work surface, approximately 20mm off of a 3m work surface.
37 Information provided by Andrew Wright of Bovis Lend Lease and based upon experience of M&E and Project Manager. These figures were supported by members of Wates, Shepherdson & Sons and Wiggett Construction.
Guide to Reference Data Version 1.0
4.0 MMC Wastage Rates 4.1 Sources of Available Information There is relatively little information available on the effect of modern methods of construction (MMC) upon wastage rates. WRAP has recently made efforts to address this through publication of the report, Current Practices and Future Potential in Modern Methods of Construction, which is based on trade estimates and research undertaken by AMA Research.38 The report provides percentage waste reduction figures that can be achieved from a variety of modern methods of construction compared to the traditional equivalent construction methods. Some limited information is also available from the construction industry itself and component manufacturers but it has not always been possible to obtain the correct information required. Assumptions and figures given for MMC components are based on a mixture of manufacturer/installer estimates and best estimates based on Arup’s experience and knowledge of the off-site industry. 4.2 Limitations and Options for Further Research Due to the number of various MMC and off-site methods of manufacturing available, the reference dataset is only able to provide a typical wastage rate that could be achieved through the use of MMC. In reality, MMC wastage rates will be dependent on the actual type of system and may differ considerably, therefore, in comparison to those suggested. 4.3 Data Benchmarking and Validation Unfortunately, there is little information available in the public domain to validate these figures and as few members of the Net Waste Consultation Group are currently using MMC, there is also a lack of actual project data available for validation purposes. Respondents to the questionnaire have provided information as to the components that are installed as part of a MMC system but there is no data to suggest what effect these have in terms of wastage rates. Questionnaire respondents stated the following components are manufactured off-site or are part of a MMC system in their projects and an attempt has been made to obtain relevant MMC data against these component types from other sources:
Curtain Walling; Windows, Doors and Glazing; M&E Plant; Air-Con and Mechanical Air Ducts; Cladding; Steelwork and Structural Steel Frames; Blockwork; Pre-Cast Stairs; Plasterboard and Studwork; and Ceiling Tiles.
4.4 MMC Wastage Rates Dataset and Assumptions In relation to MMC wastage rates, a number of general assumptions are made and these are further detailed in the report in relation to each building element category. In Appendix 4, wastage rates are given in brackets next to the non-MMC wastage rate. The general assumptions made are:
All work below floor level and external to the building structure is assumed to not be affected by MMC and Off-Site Manufacturing (OSM); e.g. granular fill components in the Earthworks building element category;
38 WRAP (2007) Current Practices and Future Potential in Modern Methods of Construction, http://www.wrap.org.uk/downloads/Modern_Methods_of_Construction_Full.853d2543.pdf.
Guide to Reference Data Version 1.0
All in-situ concrete is not affected by the use of MMC; and
Pre-cast components are generally manufactured off-site as a matter of course and so the wastage rates will
remain the same if the user selects those components under MMC. This also applies to some composite components such as wall panels and aluminium-framed windows, which are often manufactured off-site to a given specification and typically generate little waste on-site. Any waste which is generated is usually through on-site damage and so the MMC and default wastage rates are generally deemed to be the same.
It should be noted that the potential for reduced wastage rates through the use of MMC is dependent upon the type of building element which is being constructed. MMC wastage rates may apply to a component in one building element category but not necessarily to the same component in a different building element category. For example, in most cases the wastage rate for render is assumed to be reduced through the use of MMC where it can be incorporated into a volumetric system off-site. When used in conservatories, however, the render is assumed always to be applied in-situ due to the nature of the building element and thus the wastage rate does not change. 4.4.1 Balconies Based upon information provided by Archtechnik, it is assumed that the majority of components are manufactured off-site (assuming fixing points are built into the super-structure) and incorporated into a flat pack format for installation on site.39 Little waste is produced as a result, estimated at between 1% and 3%, with the latter being the worst case scenario. A wastage rate of 1% at baseline and 0% at good practice is assumed for all components, except those containing glass, which, due to their fragility, assume a typical wastage rate for glazing of 5% at baseline and 2.5% at good practice. As such, MMC wastage rates are the same as for non-MMC. 4.4.2 Bathrooms and Toilets Tiles and Ceramics wastage rates are considered too high for ceramic fittings and fixtures, so a component wastage rate of 3% and 1% is applied to all components except floor finishes and wall finishes, which are based on the material wastage rates specified. Fixtures and fittings are assumed to be well protected during storage and also during in-situ; a higher wastage rate would be very costly, as stated by Bovis Lend Lease.40 It is assumed that all component types (i.e. toilets, urinals, showers, baths, sinks, bath panels, floor finishes and wall finishes) could be installed as part of a bathroom pod and that on-site wastage as a result would be almost zero, providing that the interior is protected. However, there does remain the potential for some damage to occur on-site following pod installation and MMC wastage rates are estimated to be around 1% at baseline and 0% at good practice. This is applied to all components within the Bathrooms and Toilets building element category. 4.4.3 Brickwork, Blockwork and Stonework It is assumed that all brickwork, blockwork and stonework is generally built in-situ, although limited secondary information and questionnaire responses suggest otherwise. WRAP’s Current Practices and Future Potential in Modern Methods of Construction report provides examples of brick and blockwork being omitted through the use of MMC, e.g. timber frame and pre-cast cladding is considered as substitute for brick and block work construction, and the use of OSB structural insulated panels do not require blockwork. Even if some brick and blockwork is omitted through the use of MMC, any use of these materials will still incur the same level of waste, so it is assumed that there is no further reduction in the wastage rate.
39 Archtechnik are architectural engineers involved in the design, manufacture and installation of bespoke architectural metalwork, including balconies, balustrades, canopies and staircases. http://www.archtechnik.co.uk/
40 Information provided by Andrew Wright of Bovis Lend Lease and based upon experience of M&E and Project Manager
Guide to Reference Data Version 1.0
4.4.4 Conservatories It is assumed that MMC processes do not apply to conservatories, with no further reduction in the wastage rate:
Fill and Floor Coverings: are on-site activities and no scope for reduced wastage with MMC. Foundations: not affected by MMC as the foundation components in the database are in-situ elements. Frame: already assumed to be pre-fabricated with a typical wastage rate of 1% or less. Amdega (designers
and manufacturers of conservatories and orangeries) confirm that the component wastage rate for frames is based upon the assumption that these are cut to size off-site, hence a low wastage rate of 1% at baseline and 0% at good practice.41 Waste is said only to occur if sizing issues on site but considered rare.
Glass: Amdega advise that glazing is always fitted on-site so no scope for reduced wastage with MMC. Ground Floor Slab: not affected by MMC as the foundation components are in-situ elements. Walls: assumed that brickwork, blockwork and render are on-site activities and no scope for reduced
wastage with MMC. 4.4.5 Drainage and Services All work is below floor level and / or external to building structure, so assumed to not be affected by MMC, hence no further reduction in wastage rates. 4.4.6 Earthworks All work is below floor level and / or external to building structure, so assumed to not be affected by MMC, hence no further reduction in wastage rates. 4.4.7 External Walls
Structural and Composite Cladding: components are assumed to be produced off-site as a matter of course, so assumed to not be affected by MMC with no further reduction in wastage rates. This has been confirmed by Kingspan Group.42
Outer Skin: cladding is generally manufactured to size off-site and is installed with very little waste, so no further reduction in wastage rates. Render systems will also not be affected as they are predominantly applied in-situ, so no further reduction in wastage rates.
External Wall Sundries: such as lintels in masonry or stonework lintels are assumed to be incorporated on-site only, so no further reduction in wastage rates using MMC.
Insulation: assumed to be incorporated on-site only, so no further reduction in wastage rates using MMC. Inner Skin: assumed that brickwork and blockwork is in-situ with no further reduction in wastage rates
through use of MMC. However, MMC wastage rates for plywood structural sheathing will be eliminated to almost zero as it is assumed that timber off-site systems can be pre-assembled off-site as well as on-site.
4.4.8 Fencing All work is external to building structure, so assumed to not be affected by MMC, hence no further reduction in wastage rates. 4.4.9 Floors MMC wastage rates for all concrete and structural steel elements remain unchanged. MMC wastage rates of 1% at baseline and 0% at good practice apply to all wooden floor and boarding components.
Concrete In-Situ: not affected by MMC as components are in-situ elements. Concrete Pre-Cast: all pre-cast elements are assumed to be manufactured off-site as a matter of course,
so no scope for further reduction in wastage rates. Steel Structures: assumed that steel frames and joists are manufactured to size off-site and with
negligible waste arisings. Wooden Floor: assumed that components can be incorporated into a MMC system with less joist and
floorboard waste produced as a result.
41 http://www.amdega.co.uk/home.htm
42 http://www.kingspan.com
Guide to Reference Data Version 1.0
Boarding (for floors): wastage rates depend on whether a flooring system is used and if it has waterproof sheeting attached. For MMC, it is assumed that use of a volumetric system would generate less waste than normal. For timber panel systems boarding would be laid in the traditional manner and this would lead to off-cuts.
4.4.10 Frames Existing wastage rates for all components are unaffected by MMC:
It is assumed that all steel beams and columns are assembled into generic frames prior to arrival on site as a matter of course, with correspondingly little waste produced as a result. As such, wastage rates will not differ under MMC.
By nature of their manufacture, pre-cast concrete and in-situ concrete elements will not be affected by the use of MMC not affected by MMC.
Kingspan Group confirm that timber frames and roofing are also manufactured to size and only generate waste when a mistake has been made in the measurement. Wastage rates at both default and MMC are the same as for steel frames, i.e. 1% at baseline and 0% at good practice.
Steel frame fire protection: both boarding and cementitious spraying are on-site practices and so wastage rates will not be affected by MMC.
4.4.11 Internal Doors
Doors and Shutters: MMC assumes the use of a volumetric or panelised system with doors and frames incorporated and therefore, reduced wastage rates will apply. Damage may still occur during transit so a 3% baseline wastage rate is assumed with good practice at 1%. The exception is fire resistant steel shutters (fire alarm activated), for which wastage rates remain unchanged at 5% and 2.5%; these are assumed to be fitted on site.
Ironmongery: can also be incorporated into an MMC system, but wastage rates are unaffected because the component is assumed to be manufactured off-site with resulting little waste produced.
Security Screens: assume the same MMC wastage rate as doors (i.e. 3% at baseline and 1% at good practice) as they are similar elements fitted on-site or in the factory.
Table 4: Summary of MMC Wastage Rates for Internal Door Components
Component Baseline Good MMC Baseline MMC Good
Doors 5% 2.5% 3% 1% Steel Shutters 5% 2.5% 5% 2.5% Ironmongery 1% 0% 1% 0% Security Screens 5% 2.5% 3% 1%
4.4.12 Internal Walls
Internal walls: with the exception of blockwork (generally built in-situ and not affected by MMC), fabric covered panelling (always installed on site) and fair-face concrete, it is assumed that the use of a volumetric or panellised system will enable all walls and screens to be manufactured off-site and installed as one piece. All internal studded walls would be pre-installed (in volumetric) or manufactured to size and installed on-site (e.g. timber frame panel and, structural insulated panels). All MMC wastage rates in this instance are 1% at baseline and 0% at good practice.
Party Wall: it is assumed that all party wall components can be incorporated into a volumetric or panellised system off-site with resulting little wastage. Baseline is 1% to account for damage during transit and 0% at good practice. The exception is for blockwork which is assumed to be generally built in-situ.
Partitions and Glazed Screens: are assumed to be incorporated into a volumetric or panellised system off-site with resulting little wastage. Baseline is 1% to account for damage during transit and 0% at good practice. Note that monobloc partitions and sliding/folding partitions already have a low wastage rate so it is assumed not to be reduced any further by the use of MMC.
Guide to Reference Data Version 1.0
4.4.13 IT FF&E Due to the nature and use of the components, it is assumed that all are manufactured to size off-site and arrive either as flat pack or pre-assembled. A low wastage rate is, therefore, to be expected in all cases with no scope for further reduction through MMC. 4.4.14 Kerbs, Footways and Paved Areas All work is external to building structure, so assumed to not be affected by MMC, hence no further reduction in wastage rates. 4.4.15 Kitchens and Laundry It is assumed that all components could potentially be incorporated into kitchen pods and that a low wastage rate would occur as a result, i.e. similar to that for bathrooms and toilets. However, there is potential for some damage to occur once on-site so a baseline wastage rate of 1% is assumed and 0% at good practice. Components that already have baseline wastage of 1% and 0% at good practice would not reduce their wastage rates further through the use of MMC. 4.4.16 Miscellaneous Miscellaneous components are assumed not to be affected by MMC so wastage rates remain unchanged. 4.4.17 Non-Integrated Garages It is assumed that MMC processes do not apply to non-integrated garages, so there is no further reduction in the wastage rate:
Cladding: typically manufactured off-site. It is assumed that wastage rates are not changed. Fill: not affected by MMC, so no difference in the wastage rate. Foundations: not affected by MMC as the foundation components in the database are in-situ elements. Ground Floor Slab: not affected by MMC as the foundation components in the database are in-situ
elements. Roof Covering: assumed to be predominantly an on-site process and, therefore, not affected by MMC,
particularly for traditional coverings such as slates and tiles. Roof Frame: it is assumed that roof trusses and pre-cast elements are pre-fabricated to size off-site, with
wastage typically around 1% at baseline and 0% at good practice (confirmed by Kingspan Group Plc). As such, there is no change in the wastage rate at MMC.
Walls: assumed that brickwork, blockwork and render are on-site activities and assume the same wastage rates as for default.
4.4.18 Piling and Embedded Retaining Walls All work is below floor level and / or external to building structure, so assumed to not be affected by MMC without further reduction in wastage rates. 4.4.19 Road Lighting Columns All work is below floor level and / or external to building structure, so assumed to not be affected by MMC without further reduction in wastage rates. 4.4.20 Road Pavements All work is below floor level and / or external to building structure, so assumed to not be affected by MMC without further reduction in wastage rates. 4.4.21 Road Restraint Systems All work is below floor level and / or external to building structure, so assumed to not be affected by MMC without further reduction in wastage rates. 4.4.22 Roof It is assumed that MMC processes do not apply to roof structures, so there is no further reduction in the wastage rate:
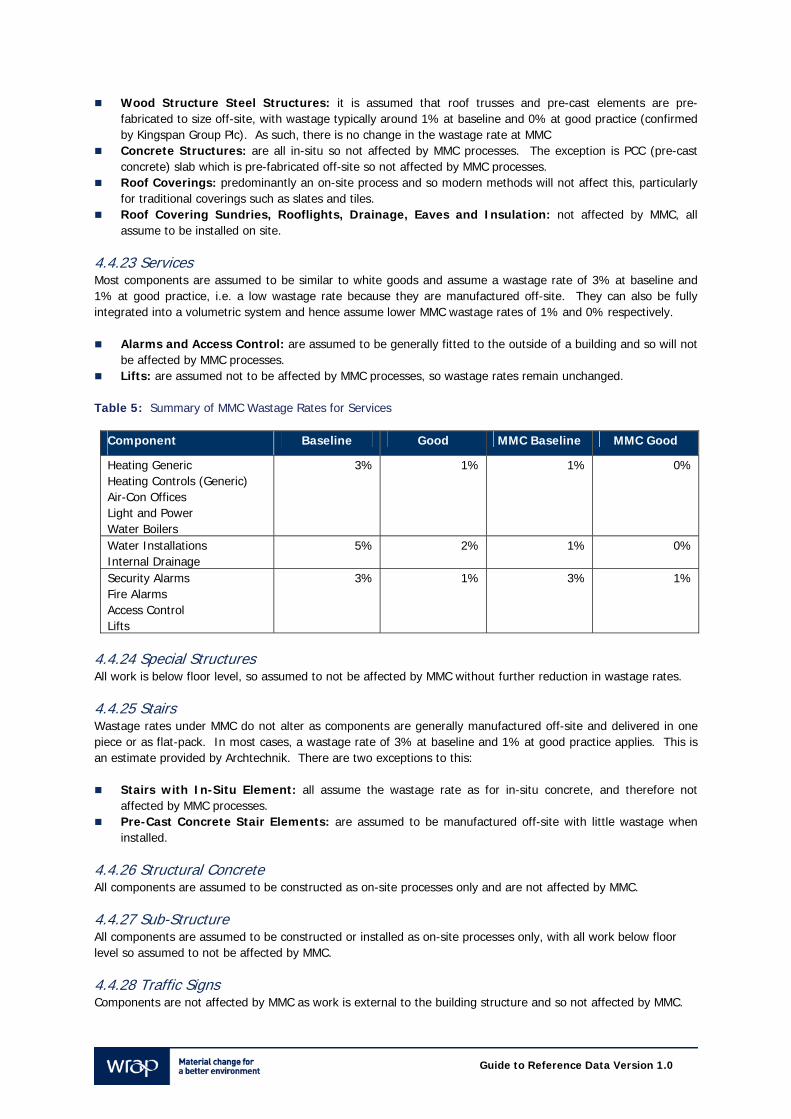
Guide to Reference Data Version 1.0
Wood Structure Steel Structures: it is assumed that roof trusses and pre-cast elements are pre-fabricated to size off-site, with wastage typically around 1% at baseline and 0% at good practice (confirmed by Kingspan Group Plc). As such, there is no change in the wastage rate at MMC
Concrete Structures: are all in-situ so not affected by MMC processes. The exception is PCC (pre-cast concrete) slab which is pre-fabricated off-site so not affected by MMC processes.
Roof Coverings: predominantly an on-site process and so modern methods will not affect this, particularly for traditional coverings such as slates and tiles.
Roof Covering Sundries, Rooflights, Drainage, Eaves and Insulation: not affected by MMC, all assume to be installed on site.
4.4.23 Services Most components are assumed to be similar to white goods and assume a wastage rate of 3% at baseline and 1% at good practice, i.e. a low wastage rate because they are manufactured off-site. They can also be fully integrated into a volumetric system and hence assume lower MMC wastage rates of 1% and 0% respectively.
Alarms and Access Control: are assumed to be generally fitted to the outside of a building and so will not be affected by MMC processes.
Lifts: are assumed not to be affected by MMC processes, so wastage rates remain unchanged. Table 5: Summary of MMC Wastage Rates for Services
Component Baseline Good MMC Baseline MMC Good
Heating Generic Heating Controls (Generic) Air-Con Offices Light and Power Water Boilers
3% 1% 1% 0%
Water Installations Internal Drainage
5% 2% 1% 0%
Security Alarms Fire Alarms Access Control Lifts
3% 1% 3% 1%
4.4.24 Special Structures All work is below floor level, so assumed to not be affected by MMC without further reduction in wastage rates. 4.4.25 Stairs Wastage rates under MMC do not alter as components are generally manufactured off-site and delivered in one piece or as flat-pack. In most cases, a wastage rate of 3% at baseline and 1% at good practice applies. This is an estimate provided by Archtechnik. There are two exceptions to this:
Stairs with In-Situ Element: all assume the wastage rate as for in-situ concrete, and therefore not affected by MMC processes.
Pre-Cast Concrete Stair Elements: are assumed to be manufactured off-site with little wastage when installed.
4.4.26 Structural Concrete All components are assumed to be constructed as on-site processes only and are not affected by MMC. 4.4.27 Sub-Structure All components are assumed to be constructed or installed as on-site processes only, with all work below floor level so assumed to not be affected by MMC. 4.4.28 Traffic Signs Components are not affected by MMC as work is external to the building structure and so not affected by MMC.
Guide to Reference Data Version 1.0
4.4.29 Walls, Floors and Ceilings – Finishes It is assumed that most components could be installed as part of a volumetric system, resulting in a low MMC wastage rate of 1% at baseline and 0% at good practice. There are a number of exceptions to this and the following components are assumed not to be affected by MMC processes:
Stone Wall Cladding Systems: installation is assumed to be an on site activity with end panels left deliberately over-sized (confirmed by Kirk Natural Stone) and with a typical wastage rate of around 3% at baseline to 1% at good practice.
It is assumed that certain flooring components would not form part of a volumetric system, including polished granite floors, stone ashlar, quarry tiles and terrazzo flooring, thus are not affected by MMC processes.
4.4.30 Windows and External Doors MMC assumes the use of a volumetric or panelised system with doors and frames incorporated and therefore, reduced wastage rates will apply. Damage may still occur during transit so a 3% baseline wastage rate is assumed with good practice at 1%. This is the same as for internal doors. The exception is for glazing sundry components (all metal shutters in the reference dataset) and garage doors; these are assumed to be fitted on site and so are not affected by MMC processes. Likewise for ironmongery which can be incorporated into an MMC system, but wastage rates are unaffected because the component is assumed to be manufactured off-site with resulting few losses on site.
Guide to Reference Data Version 1.0
5.0 Packaging 5.1 Sources of Available Information WRAP identified that the most reliable source of construction packaging waste data currently available is the Envirowise Construction Packaging Waste Estimator Version 1.0.43 This is an online tool designed to help identify packaging waste streams and provide information to help users improve management of waste generated in the construction sector; it is designed to accompany the Envirowise Good Practice Guide - Managing Packaging Waste on Your Construction Site (GG606).44 The Packaging Waste Estimator contains a reference dataset that enables the weight of packaging in kilograms per component to be specified. Estimates can be obtained on the levels of packaging waste produced throughout the duration of a project, currently categorised as building, fit out and external works. The current version of the Packaging Waste Estimator is based upon an initial set of data collected through onsite visits to builder’s merchants and construction site audits. As such, reference data within the tool is based on actual packaging quantities, but where this has not been possible it is based on visual observations of how packaging is generally managed on construction sites. A data mapping exercise has been undertaken to match the existing packaging waste factors to the component list in the NW Tool reference dataset. This process has identified packaging data for approximately 75% of the components within the reference dataset, including:
Components for which packaging data already exists; Components for which existing data could be used with further calculation; and Components for which no data currently exists.
5.2 Limitations of Data and Options for Further Research Envirowise recommend that outputs from the current version of the tool should be used as a guide to decision making only and specify a number of key limitations associated with its dataset. In terms of its use within the NW Tool, these limitations are as follows:
Packaging with a formal collection and return procedure is included; The Envirowise dataset is based upon packaging associated with a traditional building construction project
and common work activities. Packaging data may not be available for components that are required for more specialised construction; major amounts of curtain walling is given as an example;
There is no reference to components that generate very little, if any, packaging, e.g. concrete; It has not been possible to account for every method and amount of packaging that would be used by
suppliers to package their products. As such, packaging waste outputs should be used as an estimate in the absence of better information being available; and
Individual fitting items, such as sockets, are assumed to be packaged separately. The Packaging Waste Estimator is in the process of being updated, which will entail the collection of data based on detailed analyses of bill of quantities and information gathered during site audits. To date, this process has revealed that the method by which the building is constructed is more significant than the project type; assuming, therefore, that this data can be incorporated into future versions of the NW Tool, there will be a degree of confidence that the packaging data is relevant to all types of building, e.g. retail, office, and residential.
43 http://www.envirowise.gov.uk/gg606
44 http://www.envirowise.gov.uk/gg606
Guide to Reference Data Version 1.0
5.3 Results of Validation Exercise Since the Packaging Waste Estimator has been identified as the most reliable source of data available, opportunities for benchmarking and validation are currently limited. None of the respondents to the questionnaire were able to provide information on packaging waste at the time, with one respondent confirming specifically that actual project data is not currently available. 5.4 Packaging Dataset and Assumptions The packaging waste element of the reference dataset is not currently included in this report as it is based on a pre-existing dataset taken from the Envirowise Packaging Waste Estimator.
Guide to Reference Data Version 1.0
6.0 Recovery Rates 6.1 Sources of Available Information The availability of recovery rate data is somewhat more limited compared to that for wastage rates. Much of the secondary data is taken from three key documents previously published by WRAP. WRAP’s Construction Wastage Quick Win Solutions, Supply Chain Wastage of Materials contains recovery rate data from eleven case studies.45 A second report entitled Defining Good Practice for Waste Minimisation and Management in Hammerson’s Office and Retail Construction Fit-Out contains data relating to three sites, collected between October 2006 and February 2007.46 Where possible, information relating to new build case studies has been used rather than refurbishment and infrastructure. A third WRAP document, Current Practices and Future Potential in Modern Methods of Construction, has been used to provide recovery rate information for some specific materials.47 It has not been possible to obtain much primary data directly from MRF operators due to the time required by waste management companies to collate this information. 6.2 Limitations of Data and Options for Further Research The level of detail provided by previous WRAP reports makes it possible to distinguish between recovery rates for segregated containers and those for mixed waste containers. However, due to the range of data available from different case studies, it has been necessary to take an estimated average of what would be considered appropriate for baseline and good practice recovery rates. This has sometimes involved applying professional judgement, especially for materials such as metals, where recovery rates would be expected to be high due to the value of metals. Recovery rate data is more limited for some materials than others, e.g. as for screed, and are based on data for other, similar, materials. It has also not been possible to split packaging materials that would default to the packaging waste stream (i.e. cardboard, paper and plastic) due to lack of data from published sources and actual project data. This is potentially an area for further research, especially since some NW Consultation Group members are beginning to trial take-back schemes for construction waste packaging and wooden pallets. Packaging data that does exist in the public domain is generally not related specifically to construction waste packaging; e.g. much of existing research work is based on retail packaging. 6.3 Results of Validation Exercise Results of the data benchmarking process with the NW Consultation Group and BRE data are provided in section 6.4. Despite requests to materials recycling facilities for primary data, few responses were received in time to be included in the initial version of the NW Tool. Data that was received suggested recovery rates as high as 100% for all materials and is likely to be more reflective of best practice recovery, which is outside of the scope of this version of the NW Tool.
45 WRAP (2007) Construction Wastage Quick Win Solutions: Supply Chain Wastage of Materials. http://www.wrap.org.uk.
46 WRAP (2007) Defining Good Practice for Waste Minimisation and Management in Hammerson’s Office and Retail Construction Fit-Out, http://www.wrap.org.uk
47 WRAP (2007) Current Practices and Future Potential in Modern Methods of Construction, http://www.wrap.org.uk/downloads/Modern_Methods_of_Construction_Full.853d2543.pdf.
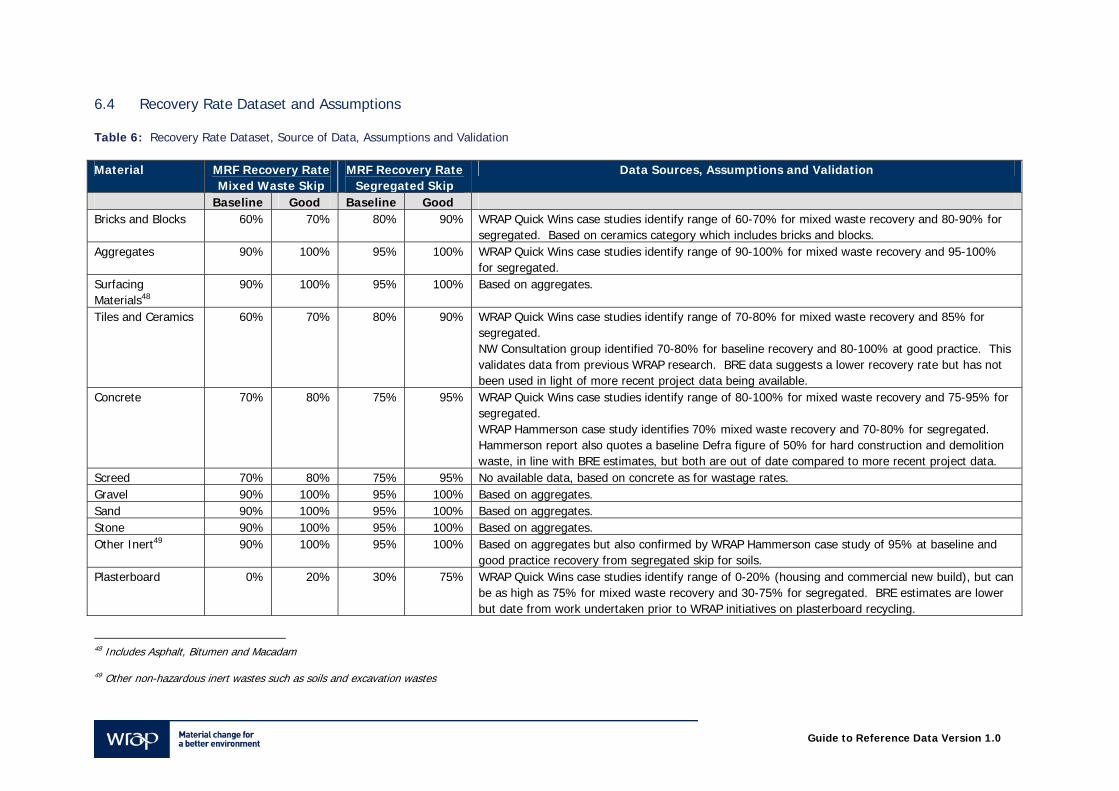
Guide to Reference Data Version 1.0
6.4 Recovery Rate Dataset and Assumptions Table 6: Recovery Rate Dataset, Source of Data, Assumptions and Validation Material MRF Recovery Rate
Mixed Waste Skip MRF Recovery Rate
Segregated Skip Data Sources, Assumptions and Validation
Baseline Good Baseline Good Bricks and Blocks 60% 70% 80% 90% WRAP Quick Wins case studies identify range of 60-70% for mixed waste recovery and 80-90% for
segregated. Based on ceramics category which includes bricks and blocks. Aggregates 90% 100% 95% 100% WRAP Quick Wins case studies identify range of 90-100% for mixed waste recovery and 95-100%
for segregated. Surfacing Materials48
90% 100% 95% 100% Based on aggregates.
Tiles and Ceramics 60% 70% 80% 90% WRAP Quick Wins case studies identify range of 70-80% for mixed waste recovery and 85% for segregated. NW Consultation group identified 70-80% for baseline recovery and 80-100% at good practice. This validates data from previous WRAP research. BRE data suggests a lower recovery rate but has not been used in light of more recent project data being available.
Concrete 70% 80% 75% 95% WRAP Quick Wins case studies identify range of 80-100% for mixed waste recovery and 75-95% for segregated. WRAP Hammerson case study identifies 70% mixed waste recovery and 70-80% for segregated. Hammerson report also quotes a baseline Defra figure of 50% for hard construction and demolition waste, in line with BRE estimates, but both are out of date compared to more recent project data.
Screed 70% 80% 75% 95% No available data, based on concrete as for wastage rates. Gravel 90% 100% 95% 100% Based on aggregates. Sand 90% 100% 95% 100% Based on aggregates. Stone 90% 100% 95% 100% Based on aggregates. Other Inert49 90% 100% 95% 100% Based on aggregates but also confirmed by WRAP Hammerson case study of 95% at baseline and
good practice recovery from segregated skip for soils. Plasterboard 0% 20% 30% 75% WRAP Quick Wins case studies identify range of 0-20% (housing and commercial new build), but can
be as high as 75% for mixed waste recovery and 30-75% for segregated. BRE estimates are lower but date from work undertaken prior to WRAP initiatives on plasterboard recycling.
48 Includes Asphalt, Bitumen and Macadam
49 Other non-hazardous inert wastes such as soils and excavation wastes
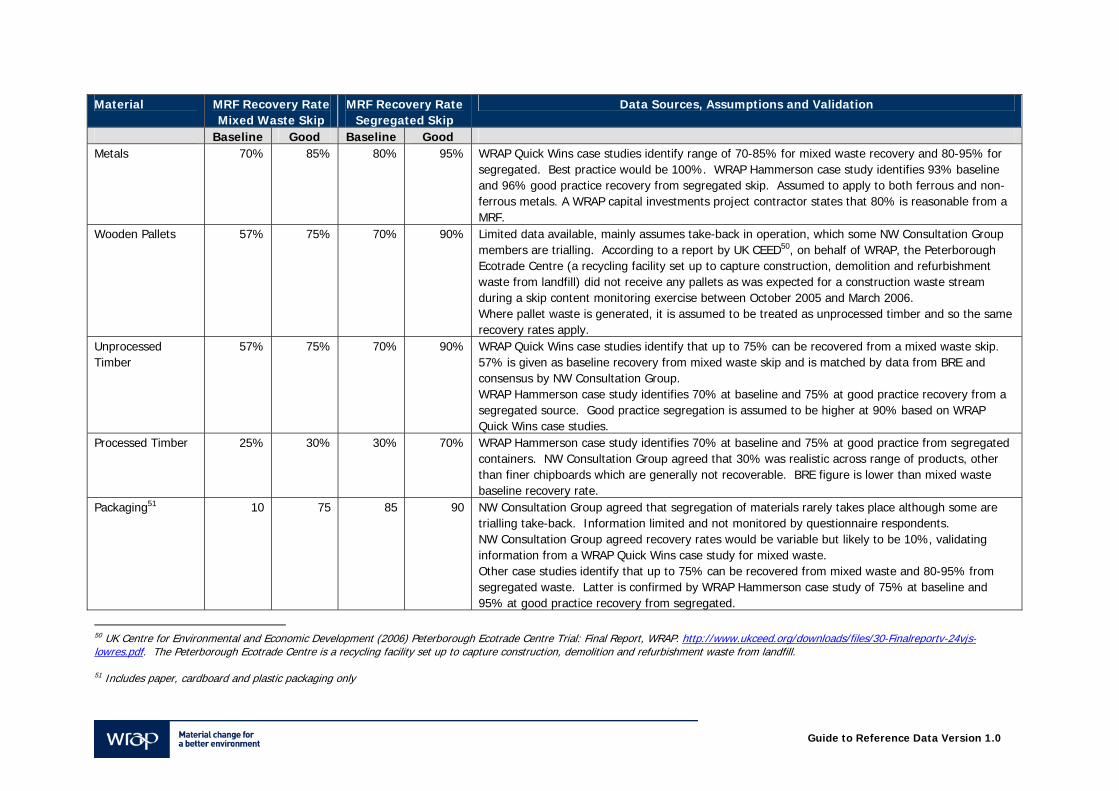
Guide to Reference Data Version 1.0
Material MRF Recovery Rate Mixed Waste Skip
MRF Recovery Rate Segregated Skip
Data Sources, Assumptions and Validation
Baseline Good Baseline Good Metals 70% 85% 80% 95% WRAP Quick Wins case studies identify range of 70-85% for mixed waste recovery and 80-95% for
segregated. Best practice would be 100%. WRAP Hammerson case study identifies 93% baseline and 96% good practice recovery from segregated skip. Assumed to apply to both ferrous and non-ferrous metals. A WRAP capital investments project contractor states that 80% is reasonable from a MRF.
Wooden Pallets 57% 75% 70% 90% Limited data available, mainly assumes take-back in operation, which some NW Consultation Group members are trialling. According to a report by UK CEED50, on behalf of WRAP, the Peterborough Ecotrade Centre (a recycling facility set up to capture construction, demolition and refurbishment waste from landfill) did not receive any pallets as was expected for a construction waste stream during a skip content monitoring exercise between October 2005 and March 2006. Where pallet waste is generated, it is assumed to be treated as unprocessed timber and so the same recovery rates apply.
Unprocessed Timber
57% 75% 70% 90% WRAP Quick Wins case studies identify that up to 75% can be recovered from a mixed waste skip. 57% is given as baseline recovery from mixed waste skip and is matched by data from BRE and consensus by NW Consultation Group. WRAP Hammerson case study identifies 70% at baseline and 75% at good practice recovery from a segregated source. Good practice segregation is assumed to be higher at 90% based on WRAP Quick Wins case studies.
Processed Timber 25% 30% 30% 70% WRAP Hammerson case study identifies 70% at baseline and 75% at good practice from segregated containers. NW Consultation Group agreed that 30% was realistic across range of products, other than finer chipboards which are generally not recoverable. BRE figure is lower than mixed waste baseline recovery rate.
Packaging51 10 75 85 90 NW Consultation Group agreed that segregation of materials rarely takes place although some are trialling take-back. Information limited and not monitored by questionnaire respondents. NW Consultation Group agreed recovery rates would be variable but likely to be 10%, validating information from a WRAP Quick Wins case study for mixed waste. Other case studies identify that up to 75% can be recovered from mixed waste and 80-95% from segregated waste. Latter is confirmed by WRAP Hammerson case study of 75% at baseline and 95% at good practice recovery from segregated.
50 UK Centre for Environmental and Economic Development (2006) Peterborough Ecotrade Centre Trial: Final Report, WRAP. http://www.ukceed.org/downloads/files/30-Finalreportv-24vjs-lowres.pdf. The Peterborough Ecotrade Centre is a recycling facility set up to capture construction, demolition and refurbishment waste from landfill.
51 Includes paper, cardboard and plastic packaging only
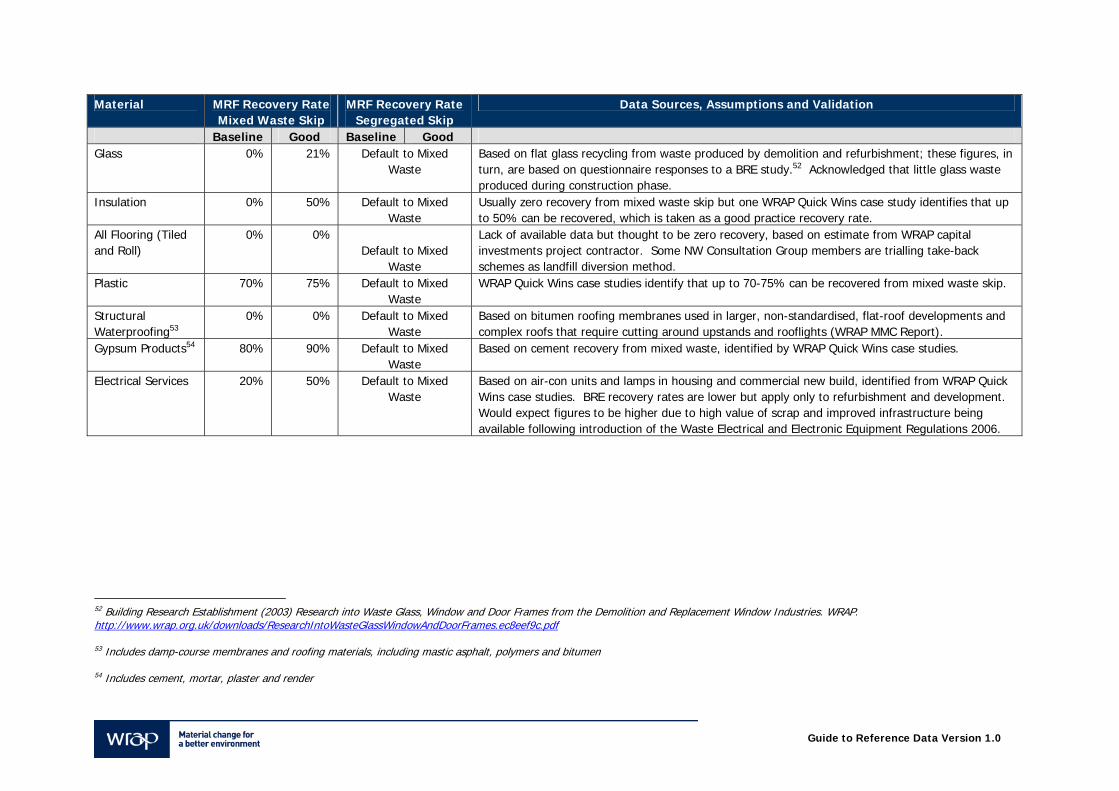
Guide to Reference Data Version 1.0
Material MRF Recovery Rate Mixed Waste Skip
MRF Recovery Rate Segregated Skip
Data Sources, Assumptions and Validation
Baseline Good Baseline Good Glass 0% 21% Default to Mixed
Waste Based on flat glass recycling from waste produced by demolition and refurbishment; these figures, in turn, are based on questionnaire responses to a BRE study.52 Acknowledged that little glass waste produced during construction phase.
Insulation 0% 50% Default to Mixed Waste
Usually zero recovery from mixed waste skip but one WRAP Quick Wins case study identifies that up to 50% can be recovered, which is taken as a good practice recovery rate.
All Flooring (Tiled and Roll)
0% 0% Default to Mixed
Waste
Lack of available data but thought to be zero recovery, based on estimate from WRAP capital investments project contractor. Some NW Consultation Group members are trialling take-back schemes as landfill diversion method.
Plastic 70% 75% Default to Mixed Waste
WRAP Quick Wins case studies identify that up to 70-75% can be recovered from mixed waste skip.
Structural Waterproofing53
0% 0% Default to Mixed Waste
Based on bitumen roofing membranes used in larger, non-standardised, flat-roof developments and complex roofs that require cutting around upstands and rooflights (WRAP MMC Report).
Gypsum Products54 80% 90% Default to Mixed Waste
Based on cement recovery from mixed waste, identified by WRAP Quick Wins case studies.
Electrical Services 20% 50% Default to Mixed Waste
Based on air-con units and lamps in housing and commercial new build, identified from WRAP Quick Wins case studies. BRE recovery rates are lower but apply only to refurbishment and development. Would expect figures to be higher due to high value of scrap and improved infrastructure being available following introduction of the Waste Electrical and Electronic Equipment Regulations 2006.
52 Building Research Establishment (2003) Research into Waste Glass, Window and Door Frames from the Demolition and Replacement Window Industries. WRAP. http://www.wrap.org.uk/downloads/ResearchIntoWasteGlassWindowAndDoorFrames.ec8eef9c.pdf
53 Includes damp-course membranes and roofing materials, including mastic asphalt, polymers and bitumen
54 Includes cement, mortar, plaster and render
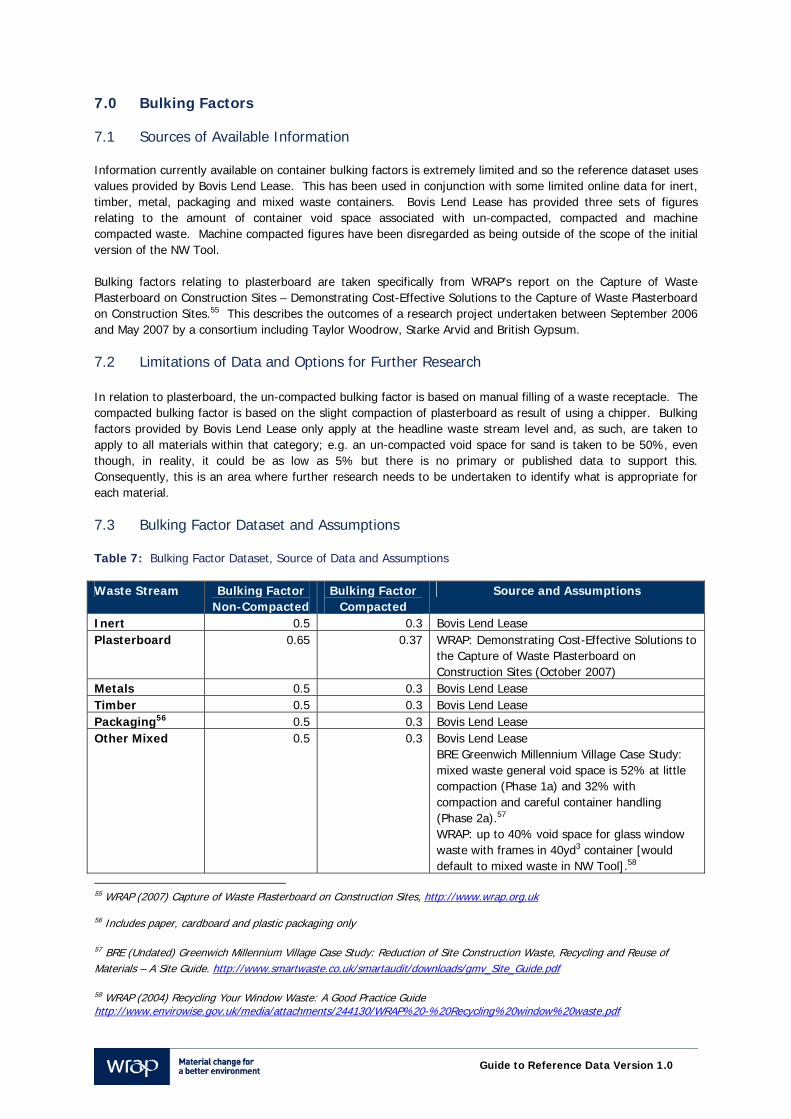
Guide to Reference Data Version 1.0
7.0 Bulking Factors 7.1 Sources of Available Information Information currently available on container bulking factors is extremely limited and so the reference dataset uses values provided by Bovis Lend Lease. This has been used in conjunction with some limited online data for inert, timber, metal, packaging and mixed waste containers. Bovis Lend Lease has provided three sets of figures relating to the amount of container void space associated with un-compacted, compacted and machine compacted waste. Machine compacted figures have been disregarded as being outside of the scope of the initial version of the NW Tool. Bulking factors relating to plasterboard are taken specifically from WRAP’s report on the Capture of Waste Plasterboard on Construction Sites – Demonstrating Cost-Effective Solutions to the Capture of Waste Plasterboard on Construction Sites.55 This describes the outcomes of a research project undertaken between September 2006 and May 2007 by a consortium including Taylor Woodrow, Starke Arvid and British Gypsum. 7.2 Limitations of Data and Options for Further Research In relation to plasterboard, the un-compacted bulking factor is based on manual filling of a waste receptacle. The compacted bulking factor is based on the slight compaction of plasterboard as result of using a chipper. Bulking factors provided by Bovis Lend Lease only apply at the headline waste stream level and, as such, are taken to apply to all materials within that category; e.g. an un-compacted void space for sand is taken to be 50%, even though, in reality, it could be as low as 5% but there is no primary or published data to support this. Consequently, this is an area where further research needs to be undertaken to identify what is appropriate for each material. 7.3 Bulking Factor Dataset and Assumptions Table 7: Bulking Factor Dataset, Source of Data and Assumptions Waste Stream Bulking Factor
Non-Compacted Bulking Factor
Compacted Source and Assumptions
Inert 0.5 0.3 Bovis Lend Lease Plasterboard 0.65 0.37 WRAP: Demonstrating Cost-Effective Solutions to
the Capture of Waste Plasterboard on Construction Sites (October 2007)
Metals 0.5 0.3 Bovis Lend Lease Timber 0.5 0.3 Bovis Lend Lease Packaging56 0.5 0.3 Bovis Lend Lease Other Mixed 0.5 0.3 Bovis Lend Lease
BRE Greenwich Millennium Village Case Study: mixed waste general void space is 52% at little compaction (Phase 1a) and 32% with compaction and careful container handling (Phase 2a).57 WRAP: up to 40% void space for glass window waste with frames in 40yd3 container [would default to mixed waste in NW Tool].58
55 WRAP (2007) Capture of Waste Plasterboard on Construction Sites, http://www.wrap.org.uk
56 Includes paper, cardboard and plastic packaging only
57 BRE (Undated) Greenwich Millennium Village Case Study: Reduction of Site Construction Waste, Recycling and Reuse of Materials – A Site Guide. http://www.smartwaste.co.uk/smartaudit/downloads/gmv_Site_Guide.pdf 58 WRAP (2004) Recycling Your Window Waste: A Good Practice Guide http://www.envirowise.gov.uk/media/attachments/244130/WRAP%20-%20Recycling%20window%20waste.pdf
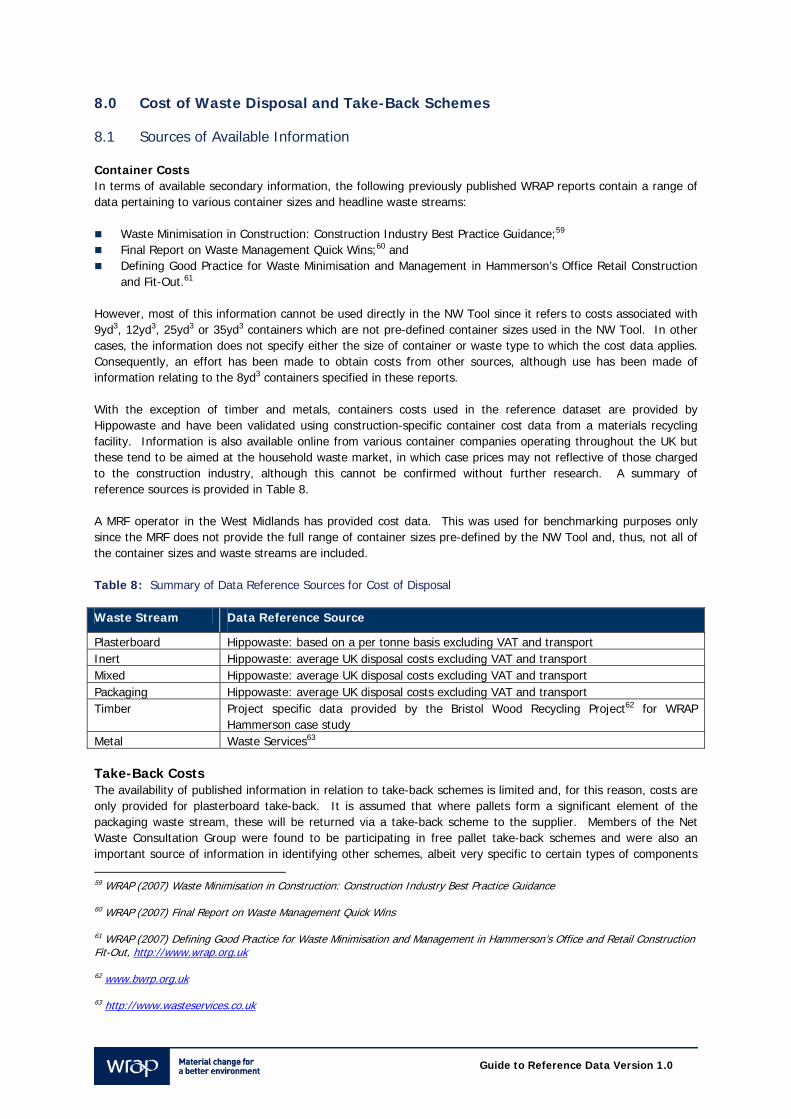
Guide to Reference Data Version 1.0
8.0 Cost of Waste Disposal and Take-Back Schemes 8.1 Sources of Available Information Container Costs In terms of available secondary information, the following previously published WRAP reports contain a range of data pertaining to various container sizes and headline waste streams:
Waste Minimisation in Construction: Construction Industry Best Practice Guidance;59 Final Report on Waste Management Quick Wins;60 and Defining Good Practice for Waste Minimisation and Management in Hammerson’s Office Retail Construction
and Fit-Out.61 However, most of this information cannot be used directly in the NW Tool since it refers to costs associated with 9yd3, 12yd3, 25yd3 or 35yd3 containers which are not pre-defined container sizes used in the NW Tool. In other cases, the information does not specify either the size of container or waste type to which the cost data applies. Consequently, an effort has been made to obtain costs from other sources, although use has been made of information relating to the 8yd3 containers specified in these reports. With the exception of timber and metals, containers costs used in the reference dataset are provided by Hippowaste and have been validated using construction-specific container cost data from a materials recycling facility. Information is also available online from various container companies operating throughout the UK but these tend to be aimed at the household waste market, in which case prices may not reflective of those charged to the construction industry, although this cannot be confirmed without further research. A summary of reference sources is provided in Table 8. A MRF operator in the West Midlands has provided cost data. This was used for benchmarking purposes only since the MRF does not provide the full range of container sizes pre-defined by the NW Tool and, thus, not all of the container sizes and waste streams are included. Table 8: Summary of Data Reference Sources for Cost of Disposal Waste Stream Data Reference Source
Plasterboard Hippowaste: based on a per tonne basis excluding VAT and transport Inert Hippowaste: average UK disposal costs excluding VAT and transport Mixed Hippowaste: average UK disposal costs excluding VAT and transport Packaging Hippowaste: average UK disposal costs excluding VAT and transport Timber Project specific data provided by the Bristol Wood Recycling Project62 for WRAP
Hammerson case study Metal Waste Services63 Take-Back Costs The availability of published information in relation to take-back schemes is limited and, for this reason, costs are only provided for plasterboard take-back. It is assumed that where pallets form a significant element of the packaging waste stream, these will be returned via a take-back scheme to the supplier. Members of the Net Waste Consultation Group were found to be participating in free pallet take-back schemes and were also an important source of information in identifying other schemes, albeit very specific to certain types of components 59 WRAP (2007) Waste Minimisation in Construction: Construction Industry Best Practice Guidance
60 WRAP (2007) Final Report on Waste Management Quick Wins
61 WRAP (2007) Defining Good Practice for Waste Minimisation and Management in Hammerson’s Office and Retail Construction Fit-Out, http://www.wrap.org.uk
62 www.bwrp.org.uk
63 http://www.wasteservices.co.uk
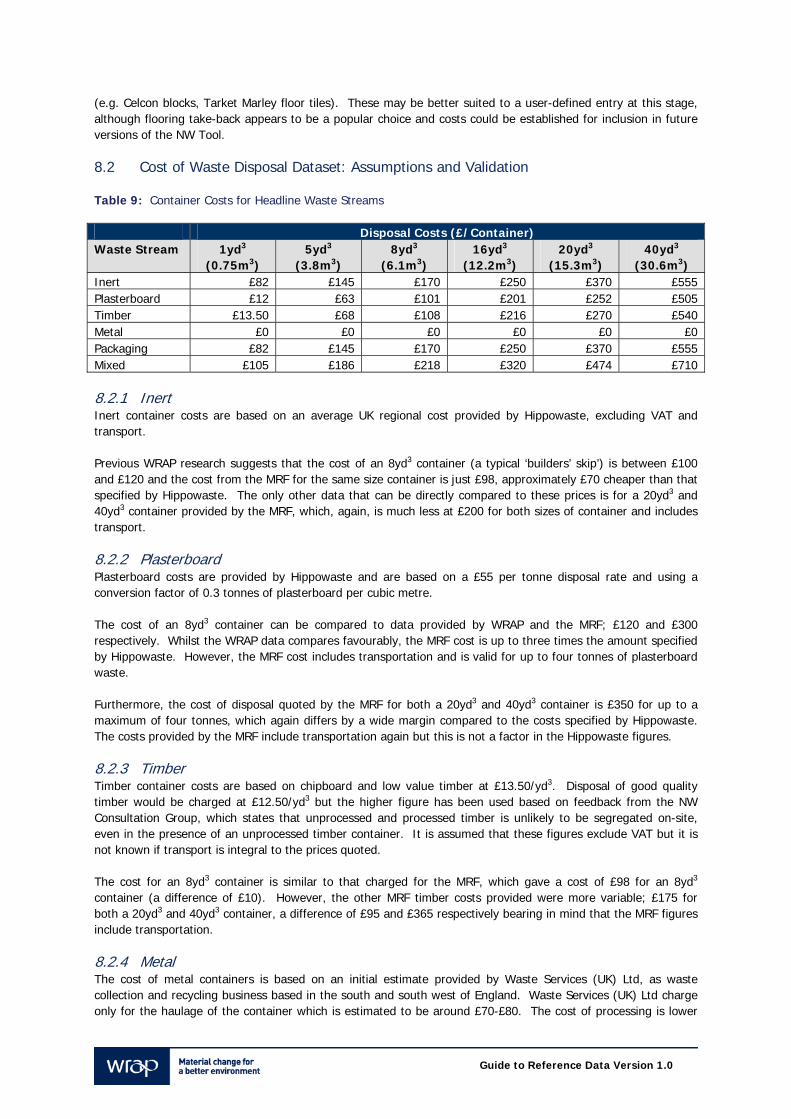
Guide to Reference Data Version 1.0
(e.g. Celcon blocks, Tarket Marley floor tiles). These may be better suited to a user-defined entry at this stage, although flooring take-back appears to be a popular choice and costs could be established for inclusion in future versions of the NW Tool. 8.2 Cost of Waste Disposal Dataset: Assumptions and Validation Table 9: Container Costs for Headline Waste Streams Disposal Costs (£/Container) Waste Stream 1yd3
(0.75m3) 5yd3
(3.8m3) 8yd3
(6.1m3) 16yd3
(12.2m3) 20yd3
(15.3m3) 40yd3
(30.6m3) Inert £82 £145 £170 £250 £370 £555 Plasterboard £12 £63 £101 £201 £252 £505 Timber £13.50 £68 £108 £216 £270 £540 Metal £0 £0 £0 £0 £0 £0 Packaging £82 £145 £170 £250 £370 £555 Mixed £105 £186 £218 £320 £474 £710 8.2.1 Inert Inert container costs are based on an average UK regional cost provided by Hippowaste, excluding VAT and transport. Previous WRAP research suggests that the cost of an 8yd3 container (a typical ‘builders’ skip’) is between £100 and £120 and the cost from the MRF for the same size container is just £98, approximately £70 cheaper than that specified by Hippowaste. The only other data that can be directly compared to these prices is for a 20yd3 and 40yd3 container provided by the MRF, which, again, is much less at £200 for both sizes of container and includes transport. 8.2.2 Plasterboard Plasterboard costs are provided by Hippowaste and are based on a £55 per tonne disposal rate and using a conversion factor of 0.3 tonnes of plasterboard per cubic metre. The cost of an 8yd3 container can be compared to data provided by WRAP and the MRF; £120 and £300 respectively. Whilst the WRAP data compares favourably, the MRF cost is up to three times the amount specified by Hippowaste. However, the MRF cost includes transportation and is valid for up to four tonnes of plasterboard waste. Furthermore, the cost of disposal quoted by the MRF for both a 20yd3 and 40yd3 container is £350 for up to a maximum of four tonnes, which again differs by a wide margin compared to the costs specified by Hippowaste. The costs provided by the MRF include transportation again but this is not a factor in the Hippowaste figures. 8.2.3 Timber Timber container costs are based on chipboard and low value timber at £13.50/yd3. Disposal of good quality timber would be charged at £12.50/yd3 but the higher figure has been used based on feedback from the NW Consultation Group, which states that unprocessed and processed timber is unlikely to be segregated on-site, even in the presence of an unprocessed timber container. It is assumed that these figures exclude VAT but it is not known if transport is integral to the prices quoted. The cost for an 8yd3 container is similar to that charged for the MRF, which gave a cost of £98 for an 8yd3 container (a difference of £10). However, the other MRF timber costs provided were more variable; £175 for both a 20yd3 and 40yd3 container, a difference of £95 and £365 respectively bearing in mind that the MRF figures include transportation. 8.2.4 Metal The cost of metal containers is based on an initial estimate provided by Waste Services (UK) Ltd, as waste collection and recycling business based in the south and south west of England. Waste Services (UK) Ltd charge only for the haulage of the container which is estimated to be around £70-£80. The cost of processing is lower
Guide to Reference Data Version 1.0
than the revenue that can be derived from its sale as a secondary raw material, so the container cost is neutral. This has been validated by the NW Consultation Group, one member of which verified this with three waste contractors based in London, Birmingham and Surrey, respectively. All confirmed that a container would be provided free of charge with only transportation costs being levied, in the region of £50-£100. The cost of an 8yd3 container provided by the MRF is £90; however, this includes transportation costs which are similar to those suggested by Waste Services (UK) Ltd and other contractors. It is assumed, therefore, that this would cover transportation only with the MRF deriving revenue from the onward sale of the metal. In order to ensure as fair a comparison as possible with other data sources, the cost of transportation is not included in the reference dataset, particularly as this will vary depending on the region of the UK and distances travelled. Accordingly, all metal container costs are assumed to be zero. 8.2.5 Packaging Packaging waste container costs are based on an average UK regional cost provided by Hippowaste, excluding VAT and transport. Previous WRAP research suggests that the cost of an 8yd3 container (a typical ‘builders’ skip’) is between £100 and £120 and the cost from the MRF is just £90, approximately £70-£80 cheaper than that specified by Hippowaste. The only other data that can be directly compared to these prices is for a 20yd3 and 40yd3 container provided by the MRF, which, again, is much less at £275 for both sizes of container and includes transport. 8.2.6 Mixed Waste Mixed waste container costs are based on the average UK regional costs provided by Hippowaste, excluding VAT and transport. However, these costs differ by container size rather than material and are assumed to be the same as for both inert and packaging waste. As waste minimisation and management practices develop, it is to be expected that the processing of mixed waste would incur a higher cost than for a segregated container due to the lower material recovery rates associated with mixed waste containers. This is supported by data provided by the MRF which shows a marked difference in price between mixed waste containers and for those for inert, timber and packaging materials (except for in the case of both a 20yd3 and 40yd3 container for packaging, which can assumed to be due to the fact that packaging has a generally lower recovery rate). As such, an adjustment has been made to the mixed waste costs provided by Hippowaste. The adjustment is based on a 28% difference between mixed waste and the average cost for packaging, inert and timber containers (based on 8yd3, 20yd3 and 40yd3 containers). 8.3 Cost of Take-Back: Assumptions and Validation The reference dataset currently only contains data for plasterboard take-back, which is one of the more common and widespread schemes used by the construction industry and for which suitable data is available. Take-back costs are provided directly by British Gypsum and appear in the reference dataset as a price per cubic metre of plasterboard waste:
British Gypsum charge £19.00 per 1m3 bag; One bag is equivalent to 0.25 tonnes (£76/tonne); and With the use of a chipper, one bag is equivalent to 0.33 tonnes per bag (£57/tonne).
This is validated by information provided in the WRAP Hammerson case study, which states that plasterboard recycling costs £75/tonne for the purchase and removal of 1m3 bags (i.e. not including any labour or other costs). This is based on a charge of £25 per bag at 0.33 tonnes of plasterboard per bag (three bags equivalent to one tonne).
Guide to Reference Data Version 1.0
8.4 Limitations and Options for Further Research Cost of Disposal Container costs have been checked against those available online, which appear to be generally lower than those in the reference dataset. However, these are marketed more at the household waste market than perhaps for major construction projects where prices could be higher, although it is impossible to determine this for certain without further research being undertaken to examine potential differences in price. What these online sources of information also show is that container prices are determined by the size of the container and not necessarily the content of the waste. Whilst this validates Hippowaste’s assumption that the price of a mixed waste container is the same as for most other waste streams, it is in contrast to the information provided by the MRF. Based on the cost information in the reference dataset, the NW Tool assumes that mixed waste is more expensive to treat than a segregated container. In summary, the sources of information used show that container costs are highly variable and are dependent on a number of factors, including:
Transportation costs; Labour costs; Market for materials (especially for metals); Region of the UK; and Effect of increasing Landfill Tax.
Variability in container costs makes it extremely difficult to suggest a one-size-fits-all approach and the costs used in the reference dataset should be used as a guide only. Cost of Take-Back Information relating to other take-back schemes identified is not included since they are specific to certain types of component or to the manufacturer of a component. However, this information could be used in future versions of the NW Tool as contractors begin to make more use of such schemes. Further research could be undertaken to assess the market for take-back, the factors that determine whether or not a take-back scheme is used and the types of take-back that are attractive for use by the construction industry.
Guide to Reference Data Version 1.0
9.0 Carbon Factors 9.1 Sources of Available Information The quoted emission factors come from a number of published sources which either undertake a life cycle inventory analysis, or report on the findings of other life cycle based studies that have undertaken a life cycle inventory analysis. Life cycle inventory analysis represents part of the process of life cycle assessment (LCA), which is enshrined in international standards (ISO 14040-44). Figures for the embodied carbon of the primary material are sourced from the University of Bath’s Inventory of Carbon and Energy (ICE), Version 1.5a beta, which provides values of embodied energy and carbon co-efficients collected from secondary resources assessed for reliability by the author.64 Many of the factors relating to carbon dioxide emissions arising from recycling include those from an initial set of data provided by WRAP, which have been gathered from WRAP’s own research work and various published sources, which include:
University of Bath’s Inventory of Carbon and Energy (as detailed above); DEFRA (2007) Waste Strategy for England 2007;65 WRAP (2007) Environmental Impact of Higher Recycled Content in Construction Projects;66 Enviros (2003) Lifecycle Analysis of Glass Recycling;67 and Bioregional (2007) Reclaimed Building Products Guide.68
Data are also available from a range of other sources, which have not been used at this stage either due to copyright permissions or because further study is required to establish their LCA boundaries; these sources include:
GaBi 4 life-cycle assessment tool;69 The Environment Agency’s Waste and Resources Assessment Tool for the Environment (WRATE);70 The Environment Agency’s online Carbon Footprint Calculator;71 CSERGE Working Paper: A Life Cycle Assessment and Evaluation of Construction and Demolition Waste; 72 Defra (2006) Impact of Energy from Waste and Recycling Policy on UK Greenhouse Gas Emissions;73 EcoInvent Centre (also known as the Swiss Centre for Life Cycle Inventories) Version 2.0 LCA tool;74 Edinburgh Centre for Carbon Management Carbon Self-Assessment Tool;75
64 Hammond G & Jones C (2006) Inventory of Carbon & Energy Version 1.5 Beta, University of Bath. 65 Defra (2007) Waste Strategy for England, http://www.defra.gov.uk/environment/waste/strategy/strategy07/pdf/waste07-strategy.pdf
66 WRAP (2007) Environmental Impact of Higher Recycled Content in Construction Projects, http://www.wrap.org.uk/downloads/Environmental_assessment_report_FINAL_011007.781580c2.pdf
67 Enviros (2003) Lifecycle Analysis of Glass Recycling, http://www.britglass.org.uk/Files/LocalAuthorities/BGEnviroReport.pdf
68 Bioregional 92007) Reclaimed Buildings Product Guide, http://www.bioregional.com
69 http://www.gabi-software.com
70 http://www.environment-agency.gov.uk/wtd/1396237
71 http://www.environment-agency.gov.uk/business/444304/502508/1506471/1506565/1508048/1883907/?lang=_e
72 Craighill A & Powell JC (1999) A Life Cycle Assessment and Evaluation of Construction and Demolition Waste. CSERGE Working Paper WM 99-03.
73 Defra (2006) Impact of Energy from Waste and Recycling Policy on UK Greenhouse Gas Emissions, http://www.defra.gov.uk/science/project_data/DocumentLibrary/WR0609/WR0609_5737_FRP.pdf
74 http://www.ecoinvent.org
75 http://www.eccm.uk.com/httpdocs/index.htm
Guide to Reference Data Version 1.0
9.2 Limitations of Data and Options for Further Research Each of the LCA studies used to assemble carbon factors in the reference dataset have different boundaries, assumptions and data, for example, in terms of age and of geographical and technical scope, some of which may be reported and some of which may not. As a result, there will be some variation in the actual values quoted in the NW Tool. It is advised, therefore, that values should be considered as a guide only rather than a definitive carbon saving. The data gathered applies specifically to materials rather than components, which means that carbon factors are applied to composite components based on the apportionment of materials, which may not necessarily reflect the carbon dioxide saving associated with recycling a particular component. There are also a large number of data gaps, including items such as electrical and electronic equipment and M&E plant, and for some materials themselves; values for bricks and blocks and tiles and ceramics are based on those for aggregates. As the reference data set is refined, further work will be required to obtain carbon factors for these components and materials. WRAP is currently completing an ongoing review of information that is publicly available for other materials and this should be available for use in updating the reference dataset at a later stage. 9.3 Data Validation and Benchmarking As demonstrated, there are a number of other sources of data available that provide alternative figures to those suggested, particularly for carbon savings from recycling. However, it has not been possible to use these in a benchmarking exercise due to the different LCA system boundaries. Further work would be required to determine these system boundaries and the LCA studies that would be appropriate to the NW Tool.

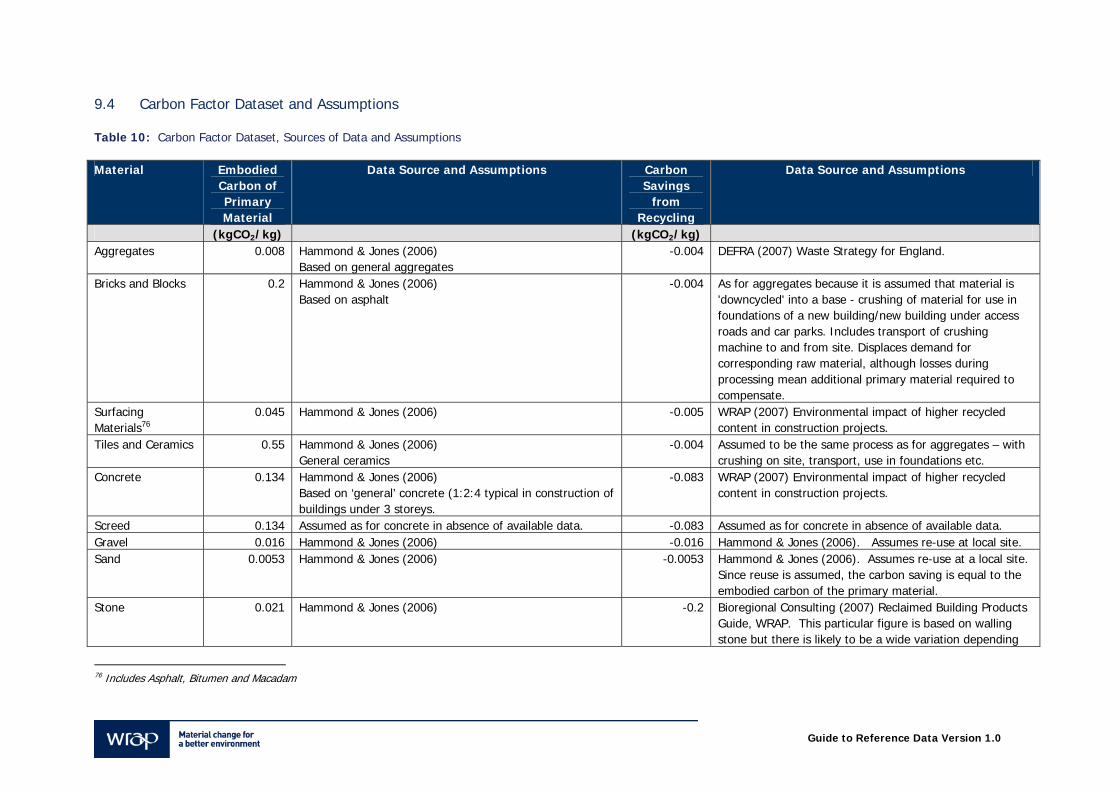
Guide to Reference Data Version 1.0
9.4 Carbon Factor Dataset and Assumptions Table 10: Carbon Factor Dataset, Sources of Data and Assumptions Material Embodied
Carbon of Primary Material
Data Source and Assumptions Carbon Savings
from Recycling
Data Source and Assumptions
(kgCO2/kg) (kgCO2/kg) Aggregates 0.008 Hammond & Jones (2006)
Based on general aggregates -0.004 DEFRA (2007) Waste Strategy for England.
Bricks and Blocks 0.2 Hammond & Jones (2006) Based on asphalt
-0.004 As for aggregates because it is assumed that material is 'downcycled' into a base - crushing of material for use in foundations of a new building/new building under access roads and car parks. Includes transport of crushing machine to and from site. Displaces demand for corresponding raw material, although losses during processing mean additional primary material required to compensate.
Surfacing Materials76
0.045 Hammond & Jones (2006) -0.005 WRAP (2007) Environmental impact of higher recycled content in construction projects.
Tiles and Ceramics 0.55 Hammond & Jones (2006) General ceramics
-0.004 Assumed to be the same process as for aggregates – with crushing on site, transport, use in foundations etc.
Concrete 0.134 Hammond & Jones (2006) Based on ‘general’ concrete (1:2:4 typical in construction of buildings under 3 storeys.
-0.083 WRAP (2007) Environmental impact of higher recycled content in construction projects.
Screed 0.134 Assumed as for concrete in absence of available data. -0.083 Assumed as for concrete in absence of available data. Gravel 0.016 Hammond & Jones (2006) -0.016 Hammond & Jones (2006). Assumes re-use at local site. Sand 0.0053 Hammond & Jones (2006)
-0.0053 Hammond & Jones (2006). Assumes re-use at a local site.
Since reuse is assumed, the carbon saving is equal to the embodied carbon of the primary material.
Stone 0.021 Hammond & Jones (2006)
-0.2 Bioregional Consulting (2007) Reclaimed Building Products Guide, WRAP. This particular figure is based on walling stone but there is likely to be a wide variation depending
76 Includes Asphalt, Bitumen and Macadam
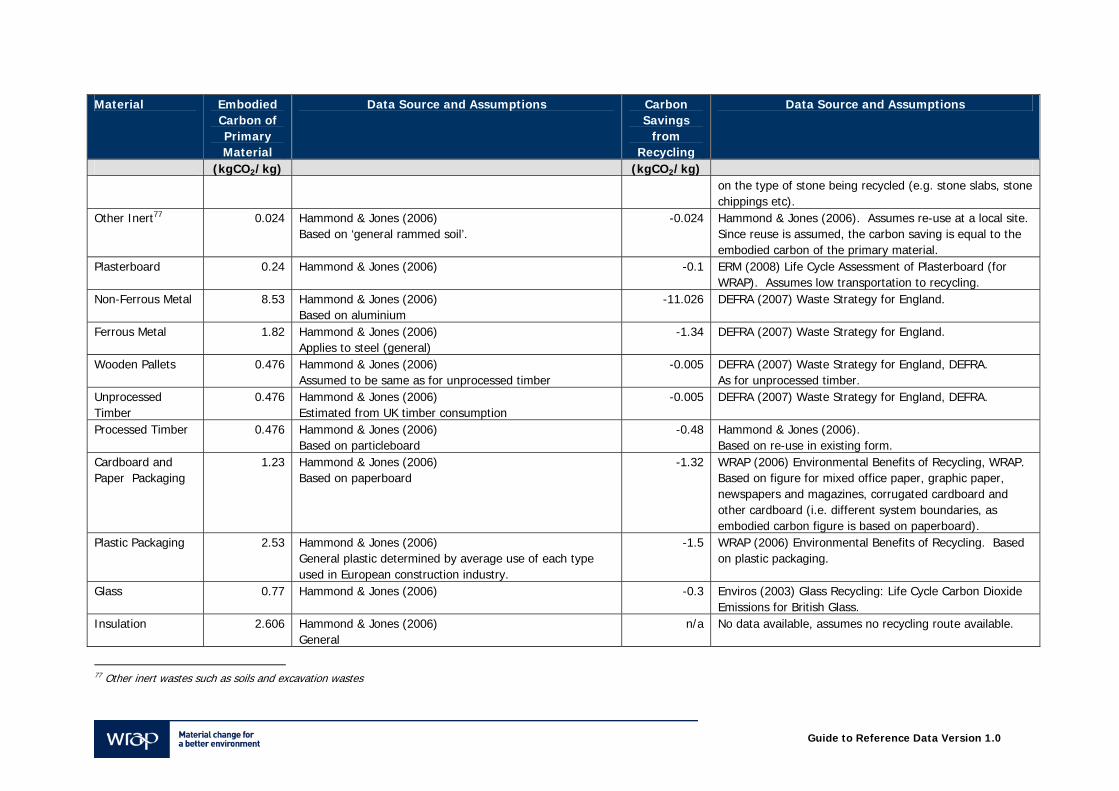
Guide to Reference Data Version 1.0
Material Embodied Carbon of Primary Material
Data Source and Assumptions Carbon Savings
from Recycling
Data Source and Assumptions
(kgCO2/kg) (kgCO2/kg) on the type of stone being recycled (e.g. stone slabs, stone chippings etc).
Other Inert77 0.024 Hammond & Jones (2006) Based on ‘general rammed soil’.
-0.024 Hammond & Jones (2006). Assumes re-use at a local site. Since reuse is assumed, the carbon saving is equal to the embodied carbon of the primary material.
Plasterboard 0.24 Hammond & Jones (2006)
-0.1 ERM (2008) Life Cycle Assessment of Plasterboard (for WRAP). Assumes low transportation to recycling.
Non-Ferrous Metal 8.53 Hammond & Jones (2006) Based on aluminium
-11.026 DEFRA (2007) Waste Strategy for England.
Ferrous Metal 1.82 Hammond & Jones (2006) Applies to steel (general)
-1.34 DEFRA (2007) Waste Strategy for England.
Wooden Pallets 0.476 Hammond & Jones (2006) Assumed to be same as for unprocessed timber
-0.005 DEFRA (2007) Waste Strategy for England, DEFRA. As for unprocessed timber.
Unprocessed Timber
0.476 Hammond & Jones (2006) Estimated from UK timber consumption
-0.005 DEFRA (2007) Waste Strategy for England, DEFRA.
Processed Timber 0.476 Hammond & Jones (2006) Based on particleboard
-0.48 Hammond & Jones (2006). Based on re-use in existing form.
Cardboard and Paper Packaging
1.23 Hammond & Jones (2006) Based on paperboard
-1.32
WRAP (2006) Environmental Benefits of Recycling, WRAP. Based on figure for mixed office paper, graphic paper, newspapers and magazines, corrugated cardboard and other cardboard (i.e. different system boundaries, as embodied carbon figure is based on paperboard).
Plastic Packaging 2.53 Hammond & Jones (2006) General plastic determined by average use of each type used in European construction industry.
-1.5 WRAP (2006) Environmental Benefits of Recycling. Based on plastic packaging.
Glass 0.77 Hammond & Jones (2006) -0.3 Enviros (2003) Glass Recycling: Life Cycle Carbon Dioxide Emissions for British Glass.
Insulation 2.606 Hammond & Jones (2006) General
n/a No data available, assumes no recycling route available.
77 Other inert wastes such as soils and excavation wastes
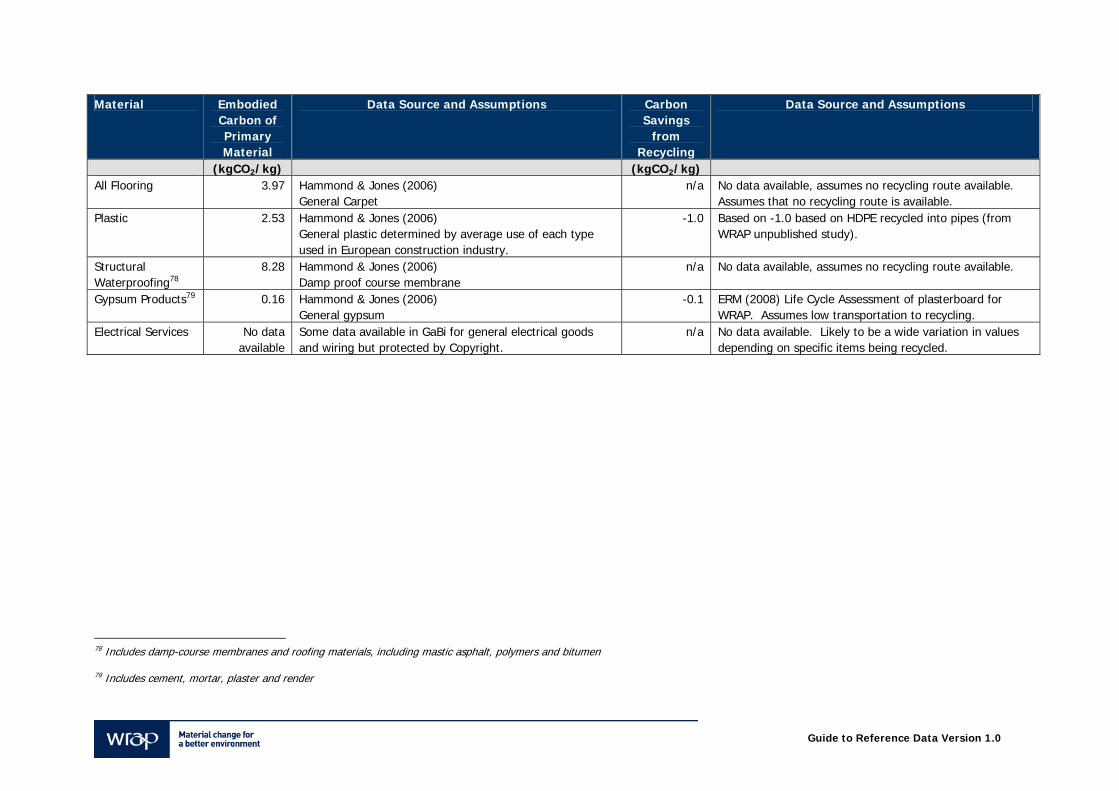
Guide to Reference Data Version 1.0
Material Embodied Carbon of Primary Material
Data Source and Assumptions Carbon Savings
from Recycling
Data Source and Assumptions
(kgCO2/kg) (kgCO2/kg) All Flooring 3.97 Hammond & Jones (2006)
General Carpet n/a No data available, assumes no recycling route available.
Assumes that no recycling route is available. Plastic 2.53 Hammond & Jones (2006)
General plastic determined by average use of each type used in European construction industry.
-1.0 Based on -1.0 based on HDPE recycled into pipes (from WRAP unpublished study).
Structural Waterproofing78
8.28 Hammond & Jones (2006) Damp proof course membrane
n/a No data available, assumes no recycling route available.
Gypsum Products79 0.16 Hammond & Jones (2006) General gypsum
-0.1 ERM (2008) Life Cycle Assessment of plasterboard for WRAP. Assumes low transportation to recycling.
Electrical Services No data available
Some data available in GaBi for general electrical goods and wiring but protected by Copyright.
n/a No data available. Likely to be a wide variation in values depending on specific items being recycled.
78 Includes damp-course membranes and roofing materials, including mastic asphalt, polymers and bitumen
79 Includes cement, mortar, plaster and render
Guide to Reference Data Version 1.0
10.0 Conclusion This report outlines the key sources of background data (reference dataset) assembled for use in the NW Tool. The data it contains is based on a variety of relevant sources and in some cases professional judgment has been applied in making assumptions associated with the components and materials in the database. As such, the reference dataset exists to guide the user as to the appropriate values that are assumed to be typical for the relevant data categories included. Despite the large amount of background data contained within the NW Tool, the user retains the ability to overwrite any part of the data used within a project as appropriate. This is an important function since projects will vary according to the waste management practices employed, and it is left to the discretion of the user to decide if the values suggested by the NW Tool are appropriate. The reference dataset will be refined by WRAP over time and a number of suggestions have been made for further research that would assist this process. It is also important that NW Tool users have an opportunity to influence this process; users are invited to submit actual project data or otherwise, e.g. comments on appropriateness of the existing data that could be used to help refine the reference dataset over time.
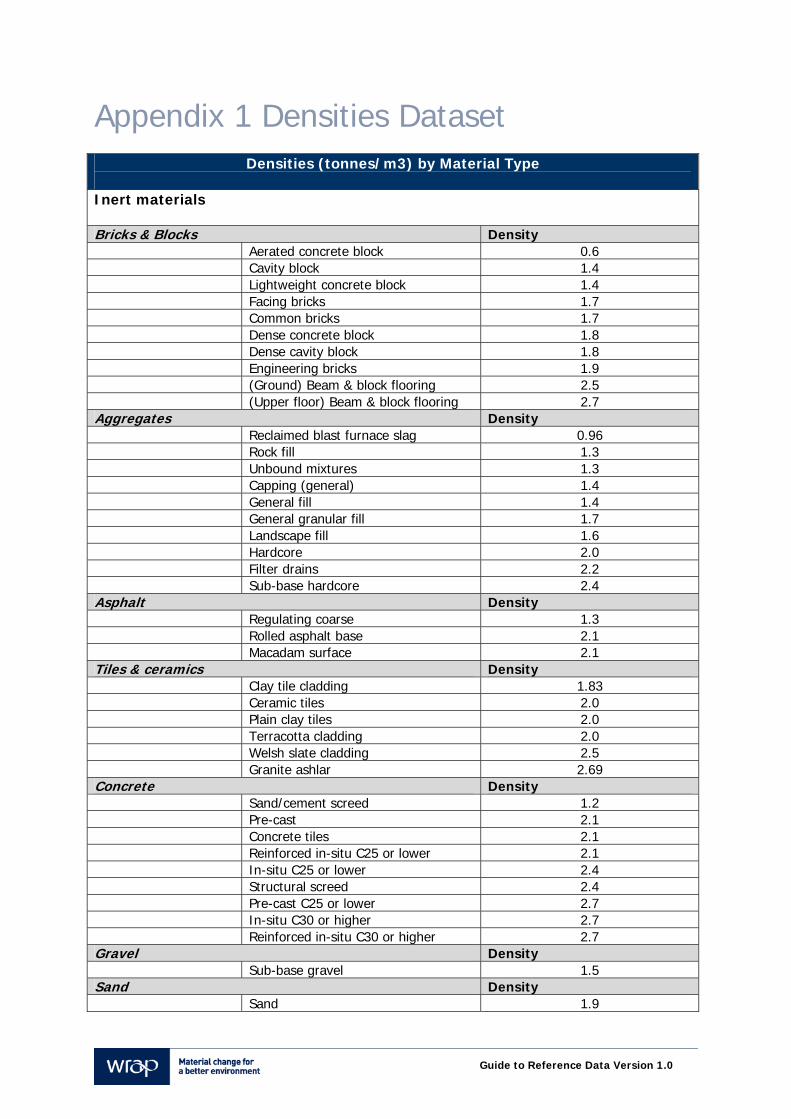
Guide to Reference Data Version 1.0
Appendix 1 Densities Dataset Densities (tonnes/m3) by Material Type
Inert materials Bricks & Blocks Density Aerated concrete block 0.6 Cavity block 1.4 Lightweight concrete block 1.4 Facing bricks 1.7 Common bricks 1.7 Dense concrete block 1.8 Dense cavity block 1.8 Engineering bricks 1.9 (Ground) Beam & block flooring 2.5 (Upper floor) Beam & block flooring 2.7 Aggregates Density Reclaimed blast furnace slag 0.96 Rock fill 1.3 Unbound mixtures 1.3 Capping (general) 1.4 General fill 1.4 General granular fill 1.7 Landscape fill 1.6 Hardcore 2.0 Filter drains 2.2 Sub-base hardcore 2.4 Asphalt Density Regulating coarse 1.3 Rolled asphalt base 2.1 Macadam surface 2.1 Tiles & ceramics Density Clay tile cladding 1.83 Ceramic tiles 2.0 Plain clay tiles 2.0 Terracotta cladding 2.0 Welsh slate cladding 2.5 Granite ashlar 2.69 Concrete Density Sand/cement screed 1.2 Pre-cast 2.1 Concrete tiles 2.1 Reinforced in-situ C25 or lower 2.1 In-situ C25 or lower 2.4 Structural screed 2.4 Pre-cast C25 or lower 2.7 In-situ C30 or higher 2.7 Reinforced in-situ C30 or higher 2.7 Gravel Density Sub-base gravel 1.5 Sand Density Sand 1.9
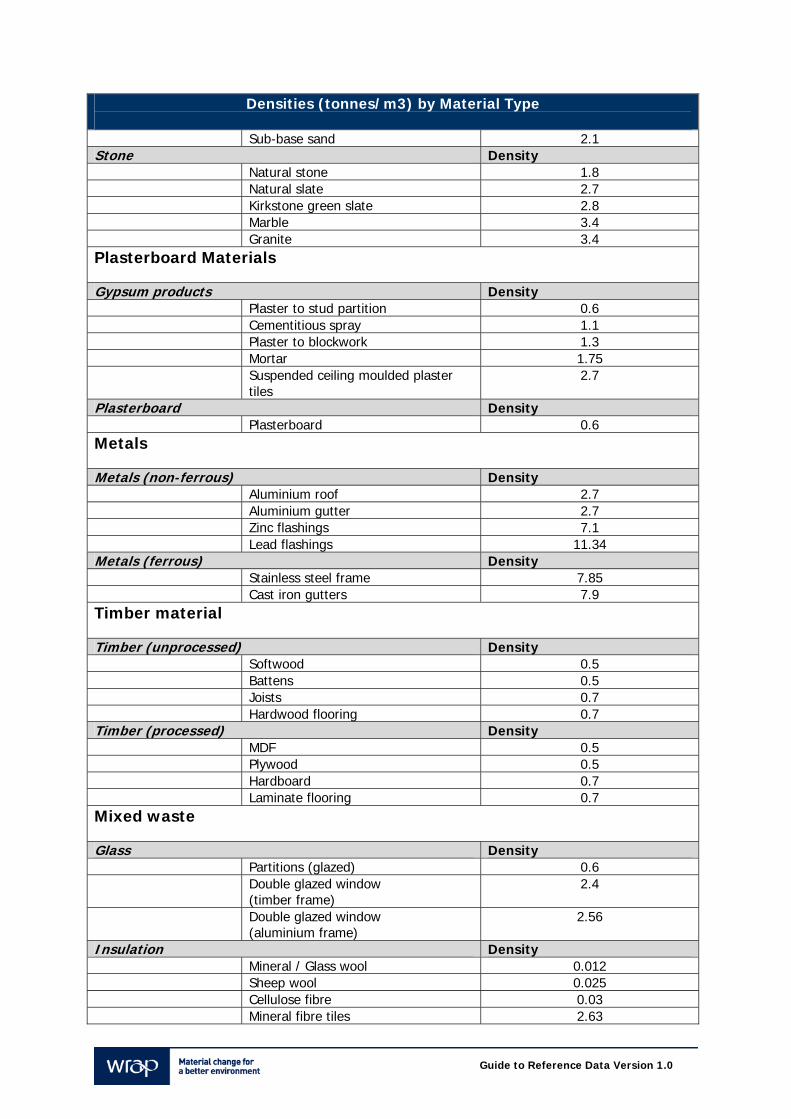
Guide to Reference Data Version 1.0
Densities (tonnes/m3) by Material Type Sub-base sand 2.1 Stone Density Natural stone 1.8 Natural slate 2.7 Kirkstone green slate 2.8 Marble 3.4 Granite 3.4 Plasterboard Materials Gypsum products Density Plaster to stud partition 0.6 Cementitious spray 1.1 Plaster to blockwork 1.3 Mortar 1.75 Suspended ceiling moulded plaster
tiles 2.7
Plasterboard Density Plasterboard 0.6 Metals Metals (non-ferrous) Density Aluminium roof 2.7 Aluminium gutter 2.7 Zinc flashings 7.1 Lead flashings 11.34 Metals (ferrous) Density Stainless steel frame 7.85 Cast iron gutters 7.9 Timber material Timber (unprocessed) Density Softwood 0.5 Battens 0.5 Joists 0.7 Hardwood flooring 0.7 Timber (processed) Density MDF 0.5 Plywood 0.5 Hardboard 0.7 Laminate flooring 0.7 Mixed waste Glass Density Partitions (glazed) 0.6 Double glazed window
(timber frame) 2.4
Double glazed window (aluminium frame)
2.56
Insulation Density Mineral / Glass wool 0.012 Sheep wool 0.025 Cellulose fibre 0.03 Mineral fibre tiles 2.63
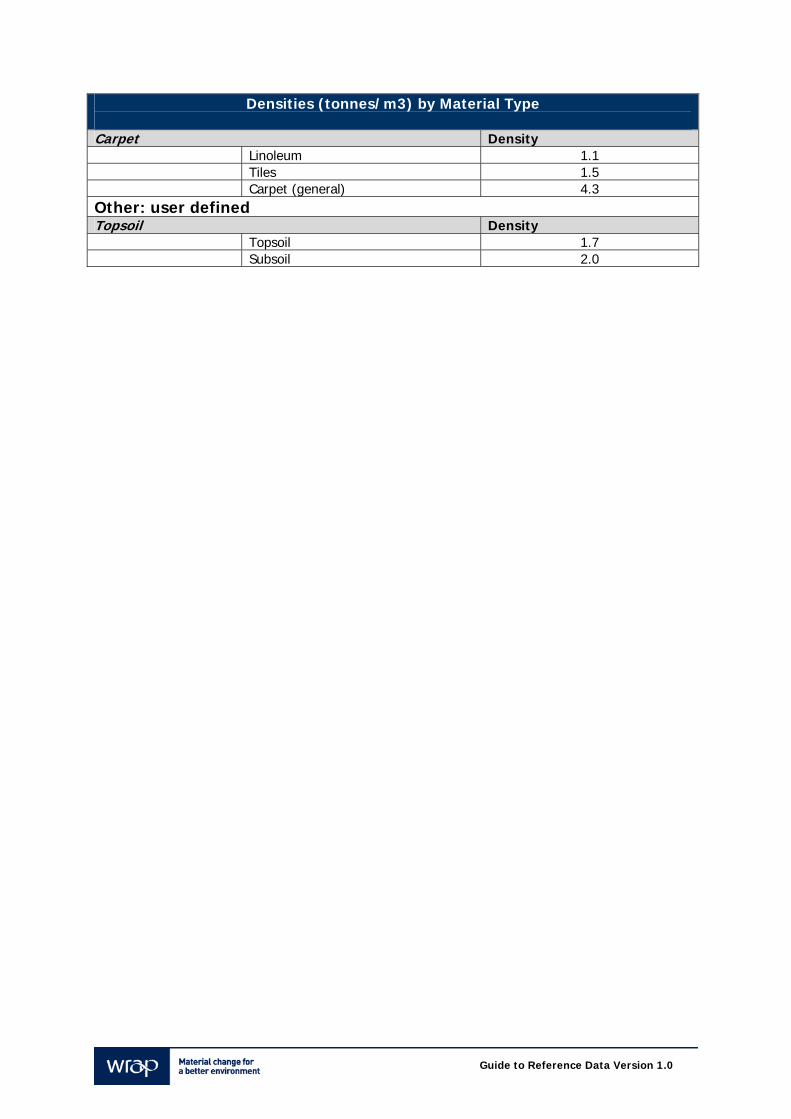
Guide to Reference Data Version 1.0
Densities (tonnes/m3) by Material Type Carpet Density Linoleum 1.1 Tiles 1.5 Carpet (general) 4.3 Other: user defined Topsoil Density Topsoil 1.7 Subsoil 2.0

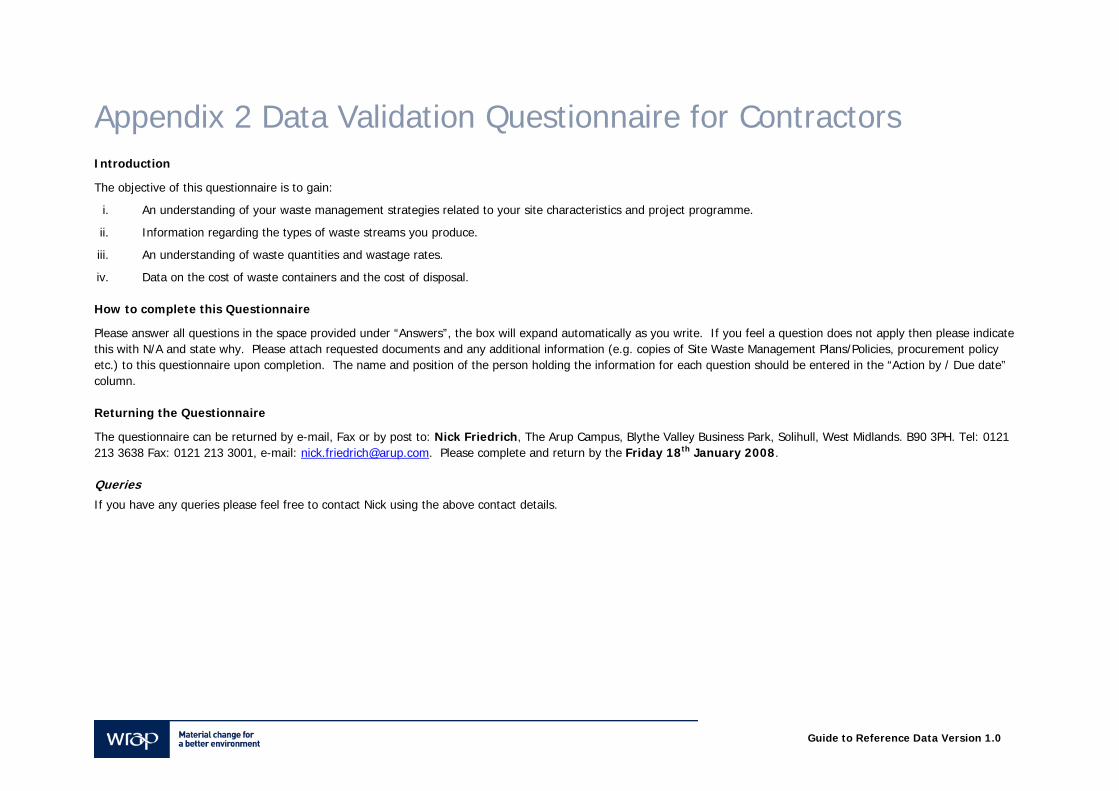
Guide to Reference Data Version 1.0
Appendix 2 Data Validation Questionnaire for Contractors Introduction
The objective of this questionnaire is to gain:
i. An understanding of your waste management strategies related to your site characteristics and project programme.
ii. Information regarding the types of waste streams you produce.
iii. An understanding of waste quantities and wastage rates.
iv. Data on the cost of waste containers and the cost of disposal.
How to complete this Questionnaire
Please answer all questions in the space provided under “Answers”, the box will expand automatically as you write. If you feel a question does not apply then please indicate this with N/A and state why. Please attach requested documents and any additional information (e.g. copies of Site Waste Management Plans/Policies, procurement policy etc.) to this questionnaire upon completion. The name and position of the person holding the information for each question should be entered in the “Action by / Due date” column.
Returning the Questionnaire
The questionnaire can be returned by e-mail, Fax or by post to: Nick Friedrich, The Arup Campus, Blythe Valley Business Park, Solihull, West Midlands. B90 3PH. Tel: 0121 213 3638 Fax: 0121 213 3001, e-mail: [email protected]. Please complete and return by the Friday 18th January 2008.
Queries If you have any queries please feel free to contact Nick using the above contact details.
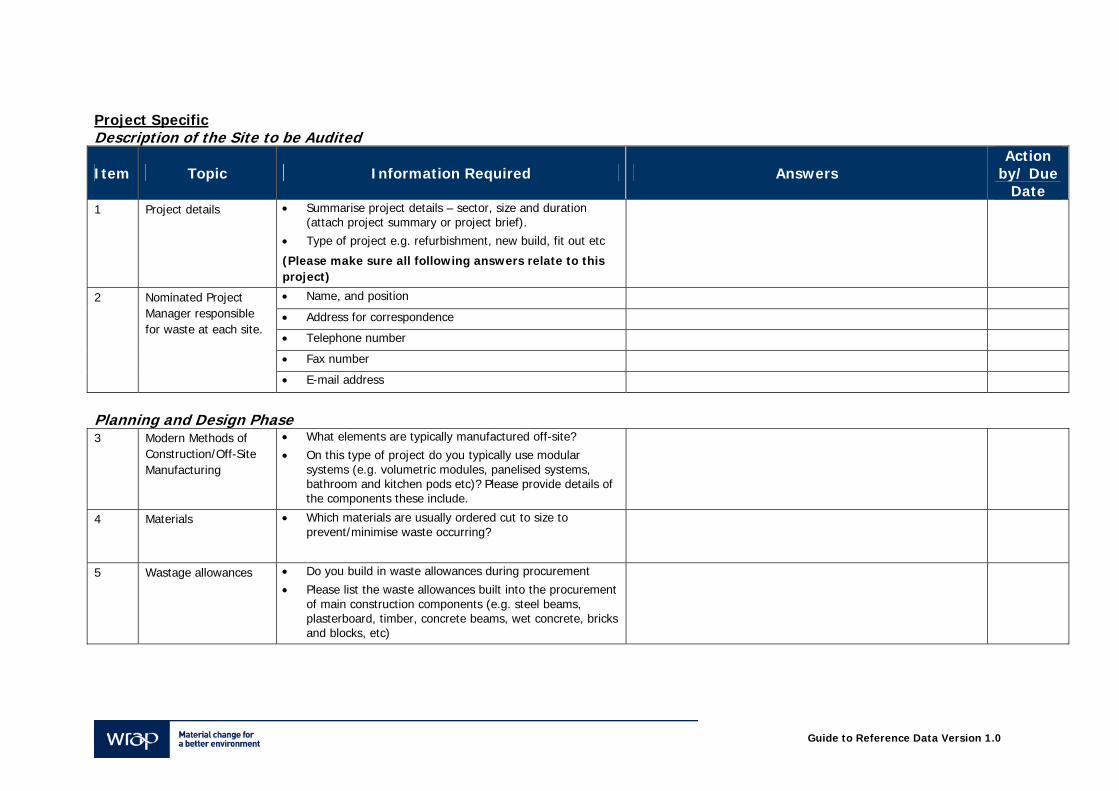
Guide to Reference Data Version 1.0
Project Specific Description of the Site to be Audited
Item Topic Information Required Answers Action
by/ Due Date
1 Project details • Summarise project details – sector, size and duration (attach project summary or project brief).
• Type of project e.g. refurbishment, new build, fit out etc
(Please make sure all following answers relate to this project)
• Name, and position
• Address for correspondence
• Telephone number
• Fax number
2 Nominated Project Manager responsible for waste at each site.
• E-mail address
Planning and Design Phase 3 Modern Methods of
Construction/Off-Site Manufacturing
• What elements are typically manufactured off-site? • On this type of project do you typically use modular
systems (e.g. volumetric modules, panelised systems, bathroom and kitchen pods etc)? Please provide details of the components these include.
4 Materials • Which materials are usually ordered cut to size to prevent/minimise waste occurring?
5 Wastage allowances • Do you build in waste allowances during procurement • Please list the waste allowances built into the procurement
of main construction components (e.g. steel beams, plasterboard, timber, concrete beams, wet concrete, bricks and blocks, etc)
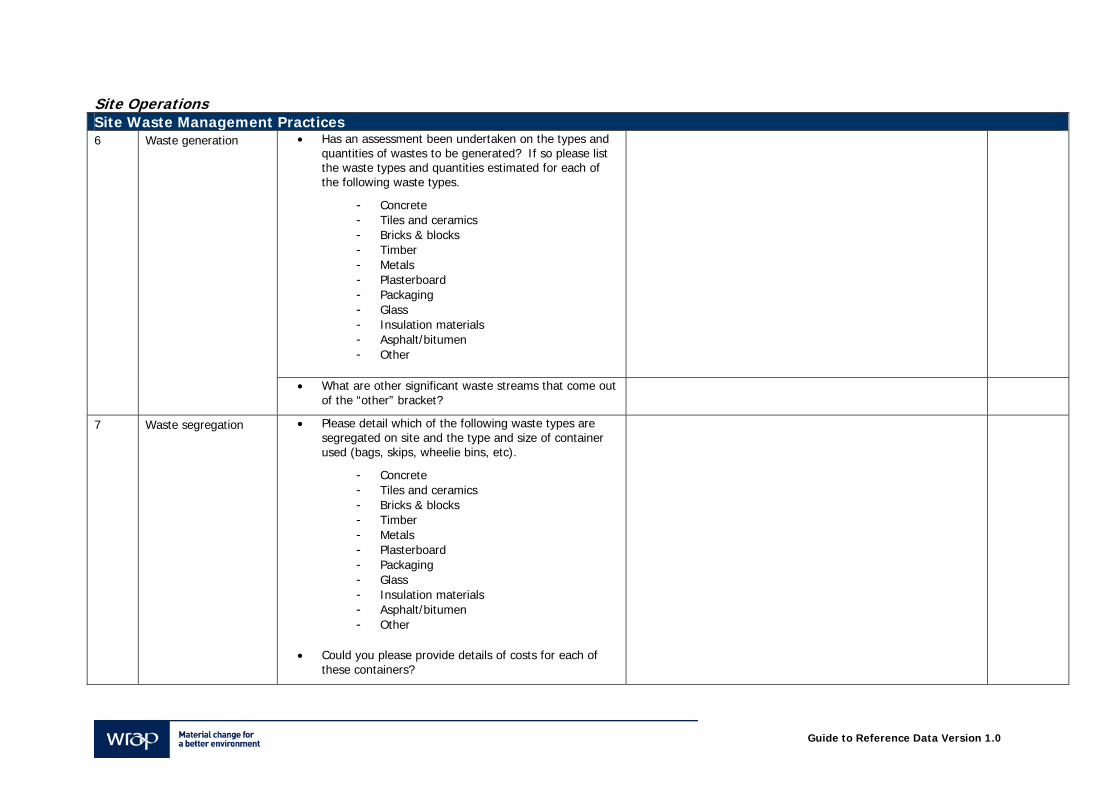
Guide to Reference Data Version 1.0
Site Operations Site Waste Management Practices
• Has an assessment been undertaken on the types and quantities of wastes to be generated? If so please list the waste types and quantities estimated for each of the following waste types.
- Concrete - Tiles and ceramics - Bricks & blocks - Timber - Metals - Plasterboard - Packaging - Glass - Insulation materials - Asphalt/bitumen - Other
6 Waste generation
• What are other significant waste streams that come out of the “other” bracket?
7 Waste segregation • Please detail which of the following waste types are segregated on site and the type and size of container used (bags, skips, wheelie bins, etc).
- Concrete - Tiles and ceramics - Bricks & blocks - Timber - Metals - Plasterboard - Packaging - Glass - Insulation materials - Asphalt/bitumen - Other
• Could you please provide details of costs for each of
these containers?
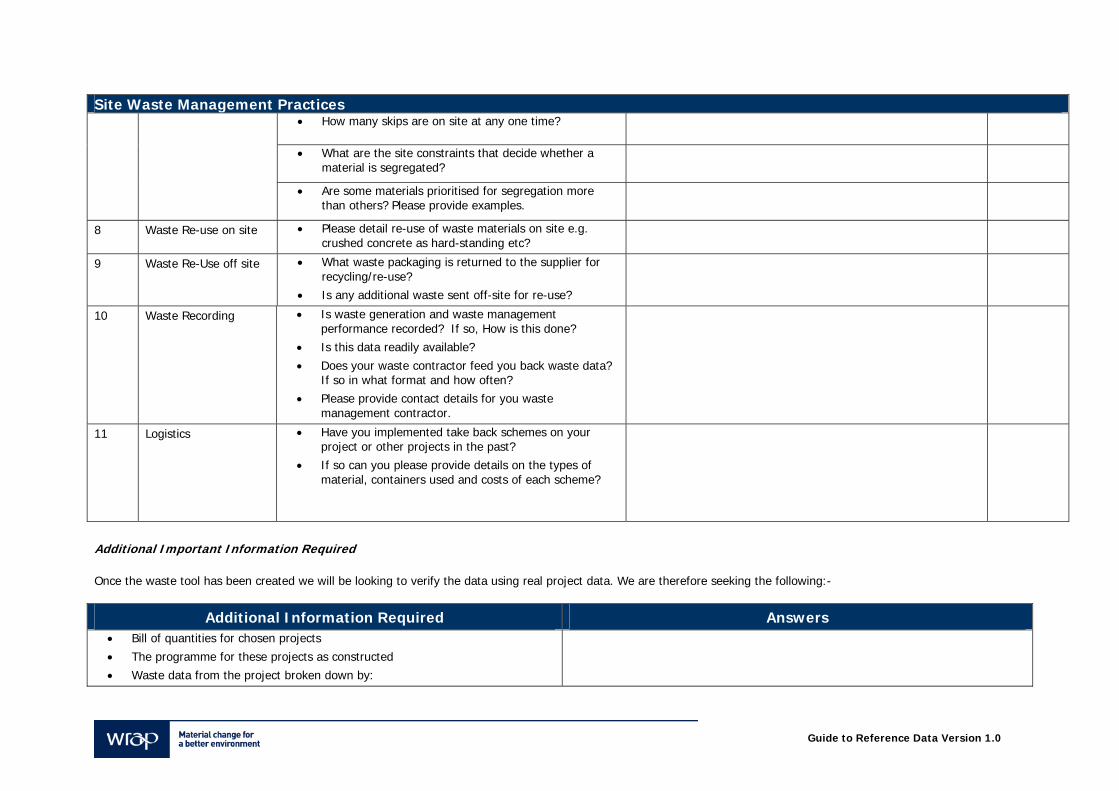
Guide to Reference Data Version 1.0
Site Waste Management Practices • How many skips are on site at any one time?
• What are the site constraints that decide whether a material is segregated?
• Are some materials prioritised for segregation more than others? Please provide examples.
8 Waste Re-use on site • Please detail re-use of waste materials on site e.g. crushed concrete as hard-standing etc?
9 Waste Re-Use off site • What waste packaging is returned to the supplier for recycling/re-use?
• Is any additional waste sent off-site for re-use?
10 Waste Recording • Is waste generation and waste management performance recorded? If so, How is this done?
• Is this data readily available? • Does your waste contractor feed you back waste data?
If so in what format and how often? • Please provide contact details for you waste
management contractor.
11 Logistics • Have you implemented take back schemes on your project or other projects in the past?
• If so can you please provide details on the types of material, containers used and costs of each scheme?
Additional Important Information Required Once the waste tool has been created we will be looking to verify the data using real project data. We are therefore seeking the following:-
Additional Information Required Answers • Bill of quantities for chosen projects • The programme for these projects as constructed • Waste data from the project broken down by:
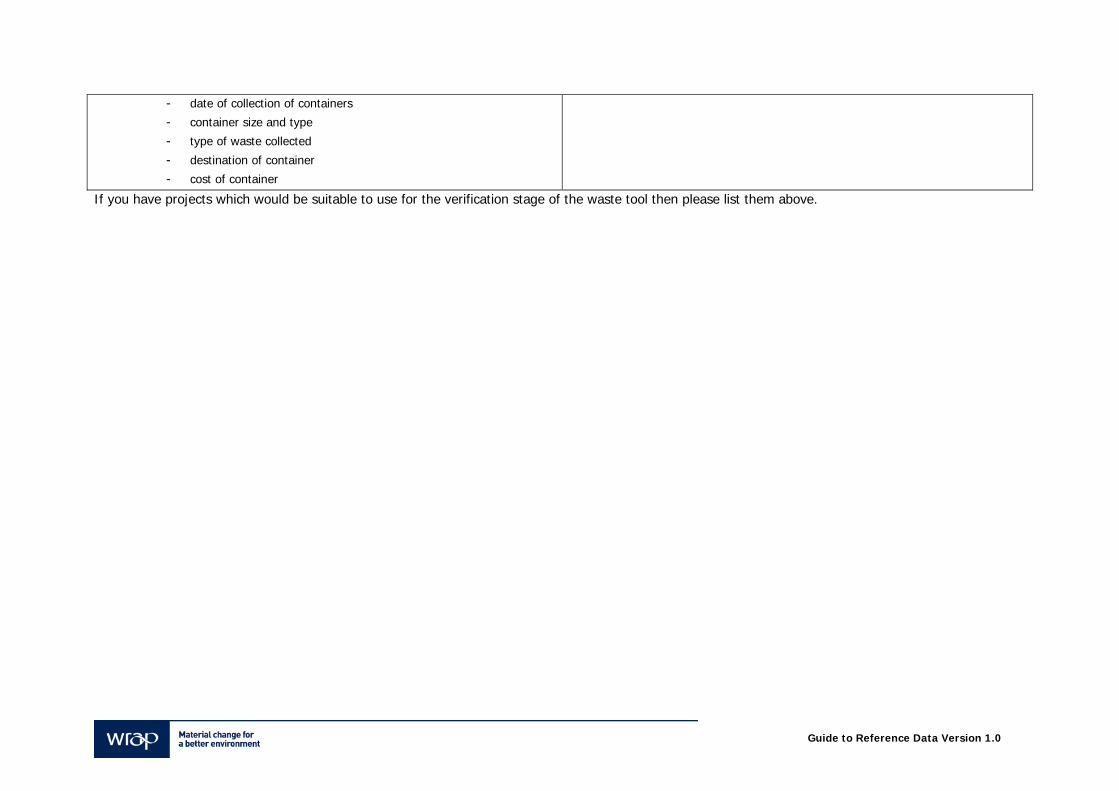
Guide to Reference Data Version 1.0
- date of collection of containers
- container size and type
- type of waste collected
- destination of container
- cost of container
If you have projects which would be suitable to use for the verification stage of the waste tool then please list them above.
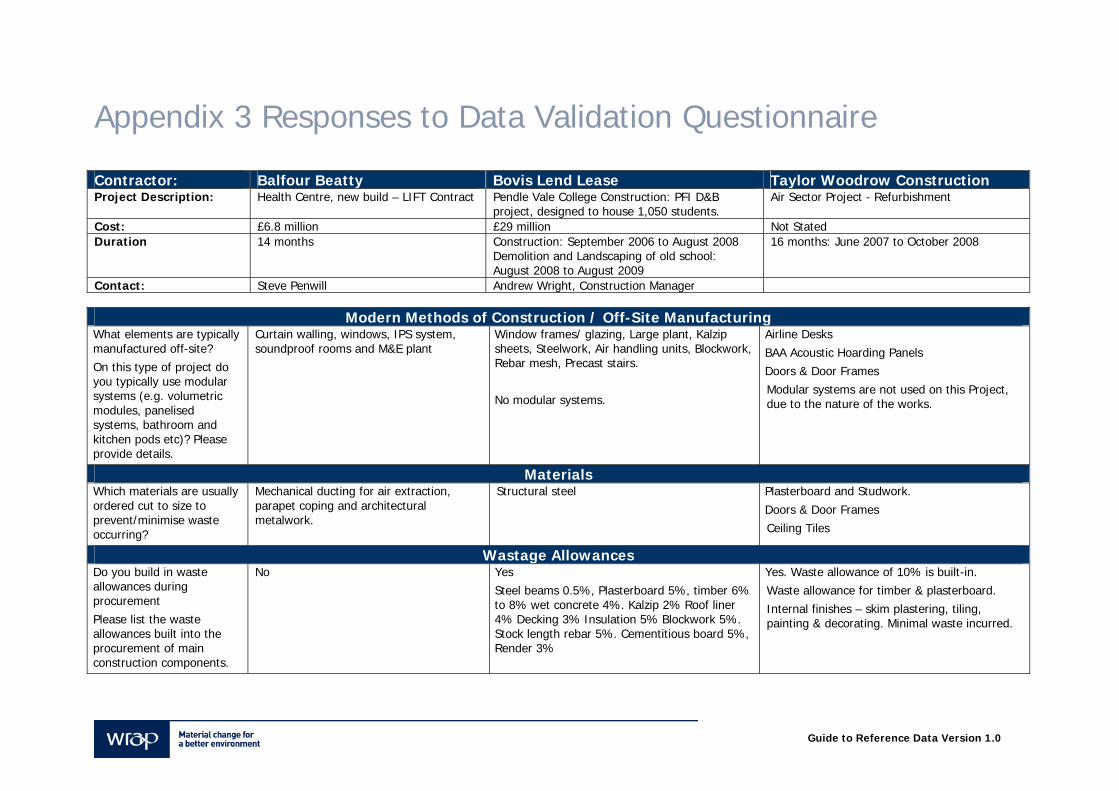
Guide to Reference Data Version 1.0
Appendix 3 Responses to Data Validation Questionnaire Contractor: Balfour Beatty Bovis Lend Lease Taylor Woodrow Construction Project Description: Health Centre, new build – LIFT Contract Pendle Vale College Construction: PFI D&B
project, designed to house 1,050 students. Air Sector Project - Refurbishment
Cost: £6.8 million £29 million Not Stated Duration 14 months Construction: September 2006 to August 2008
Demolition and Landscaping of old school: August 2008 to August 2009
16 months: June 2007 to October 2008
Contact: Steve Penwill Andrew Wright, Construction Manager
Modern Methods of Construction / Off-Site Manufacturing What elements are typically manufactured off-site? On this type of project do you typically use modular systems (e.g. volumetric modules, panelised systems, bathroom and kitchen pods etc)? Please provide details.
Curtain walling, windows, IPS system, soundproof rooms and M&E plant
Window frames/ glazing, Large plant, Kalzip sheets, Steelwork, Air handling units, Blockwork, Rebar mesh, Precast stairs. No modular systems.
Airline Desks BAA Acoustic Hoarding Panels Doors & Door Frames Modular systems are not used on this Project, due to the nature of the works.
Materials Which materials are usually ordered cut to size to prevent/minimise waste occurring?
Mechanical ducting for air extraction, parapet coping and architectural metalwork.
Structural steel Plasterboard and Studwork. Doors & Door Frames Ceiling Tiles
Wastage Allowances Do you build in waste allowances during procurement Please list the waste allowances built into the procurement of main construction components.
No Yes Steel beams 0.5%, Plasterboard 5%, timber 6% to 8% wet concrete 4%. Kalzip 2% Roof liner 4% Decking 3% Insulation 5% Blockwork 5%. Stock length rebar 5%. Cementitious board 5%, Render 3%
Yes. Waste allowance of 10% is built-in. Waste allowance for timber & plasterboard. Internal finishes – skim plastering, tiling, painting & decorating. Minimal waste incurred.
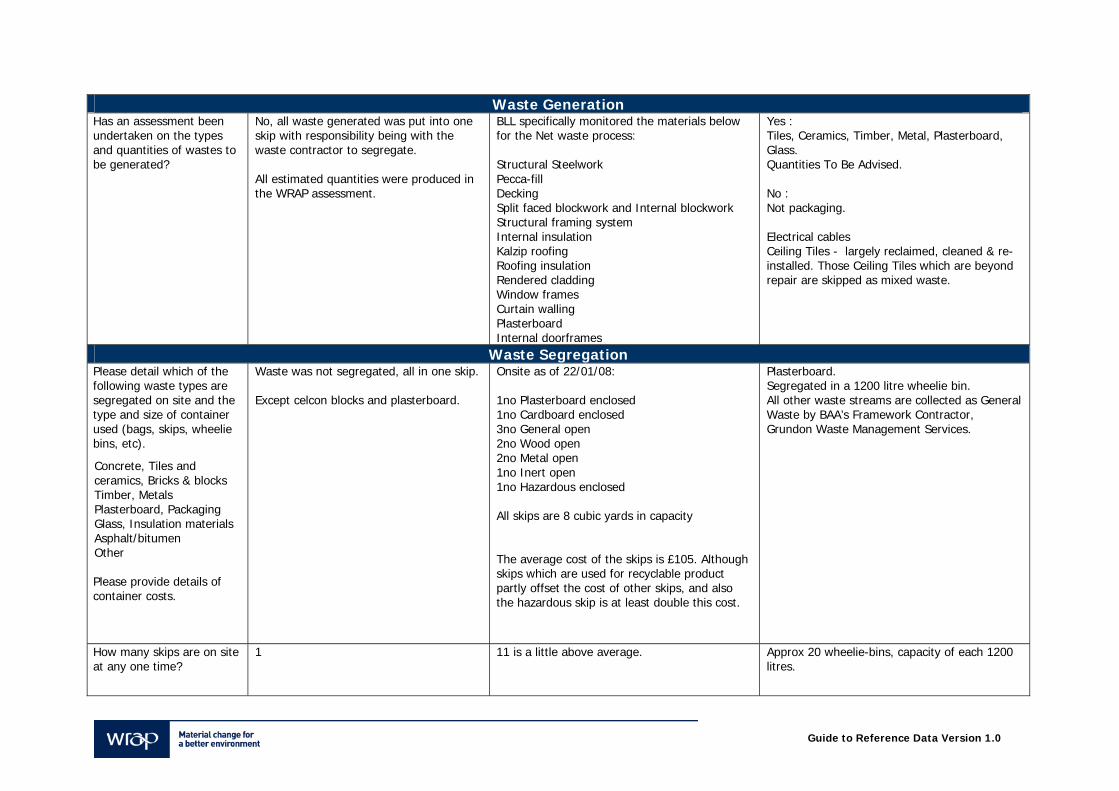
Guide to Reference Data Version 1.0
Waste Generation Has an assessment been undertaken on the types and quantities of wastes to be generated?
No, all waste generated was put into one skip with responsibility being with the waste contractor to segregate. All estimated quantities were produced in the WRAP assessment.
BLL specifically monitored the materials below for the Net waste process: Structural Steelwork Pecca-fill Decking Split faced blockwork and Internal blockwork Structural framing system Internal insulation Kalzip roofing Roofing insulation Rendered cladding Window frames Curtain walling Plasterboard Internal doorframes
Yes : Tiles, Ceramics, Timber, Metal, Plasterboard, Glass. Quantities To Be Advised. No : Not packaging. Electrical cables Ceiling Tiles - largely reclaimed, cleaned & re-installed. Those Ceiling Tiles which are beyond repair are skipped as mixed waste.
Waste Segregation Please detail which of the following waste types are segregated on site and the type and size of container used (bags, skips, wheelie bins, etc).
Concrete, Tiles and ceramics, Bricks & blocks Timber, Metals Plasterboard, Packaging Glass, Insulation materials Asphalt/bitumen Other Please provide details of container costs.
Waste was not segregated, all in one skip. Except celcon blocks and plasterboard.
Onsite as of 22/01/08: 1no Plasterboard enclosed 1no Cardboard enclosed 3no General open 2no Wood open 2no Metal open 1no Inert open 1no Hazardous enclosed All skips are 8 cubic yards in capacity The average cost of the skips is £105. Although skips which are used for recyclable product partly offset the cost of other skips, and also the hazardous skip is at least double this cost.
Plasterboard. Segregated in a 1200 litre wheelie bin. All other waste streams are collected as General Waste by BAA’s Framework Contractor, Grundon Waste Management Services.
How many skips are on site at any one time?
1 11 is a little above average. Approx 20 wheelie-bins, capacity of each 1200 litres.
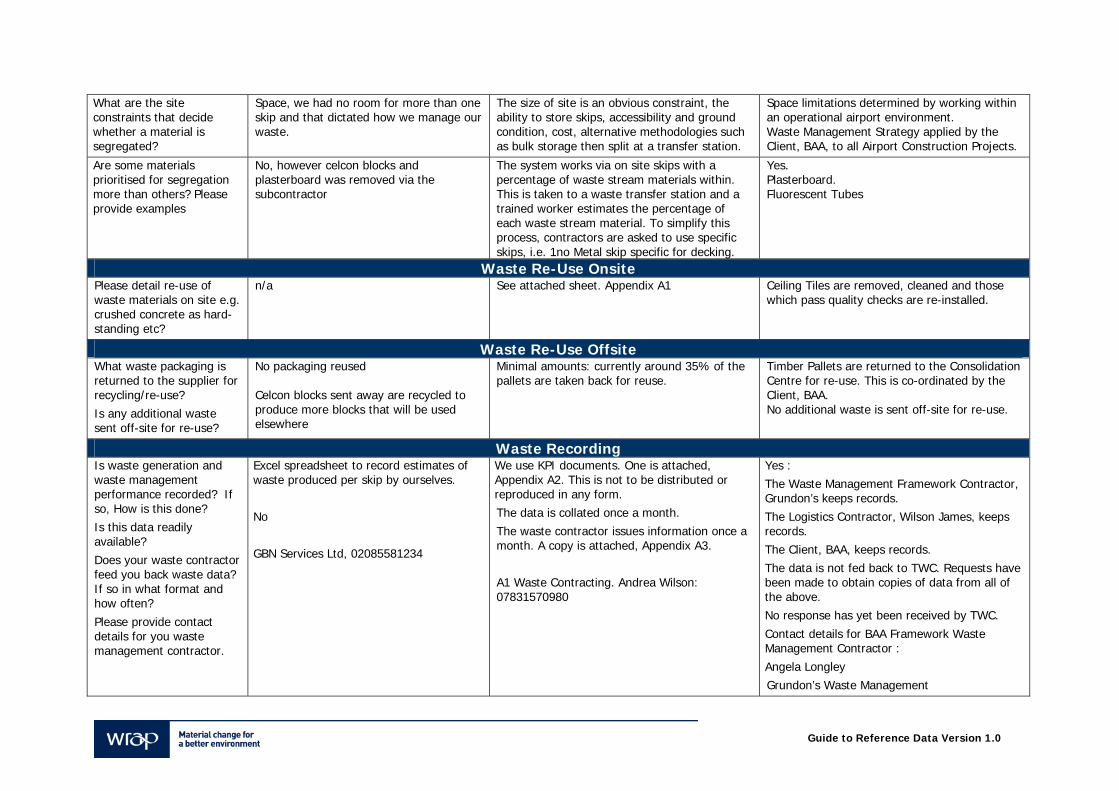
Guide to Reference Data Version 1.0
What are the site constraints that decide whether a material is segregated?
Space, we had no room for more than one skip and that dictated how we manage our waste.
The size of site is an obvious constraint, the ability to store skips, accessibility and ground condition, cost, alternative methodologies such as bulk storage then split at a transfer station.
Space limitations determined by working within an operational airport environment. Waste Management Strategy applied by the Client, BAA, to all Airport Construction Projects.
Are some materials prioritised for segregation more than others? Please provide examples
No, however celcon blocks and plasterboard was removed via the subcontractor
The system works via on site skips with a percentage of waste stream materials within. This is taken to a waste transfer station and a trained worker estimates the percentage of each waste stream material. To simplify this process, contractors are asked to use specific skips, i.e. 1no Metal skip specific for decking.
Yes. Plasterboard. Fluorescent Tubes
Waste Re-Use Onsite Please detail re-use of waste materials on site e.g. crushed concrete as hard-standing etc?
n/a See attached sheet. Appendix A1 Ceiling Tiles are removed, cleaned and those which pass quality checks are re-installed.
Waste Re-Use Offsite What waste packaging is returned to the supplier for recycling/re-use? Is any additional waste sent off-site for re-use?
No packaging reused Celcon blocks sent away are recycled to produce more blocks that will be used elsewhere
Minimal amounts: currently around 35% of the pallets are taken back for reuse.
Timber Pallets are returned to the Consolidation Centre for re-use. This is co-ordinated by the Client, BAA. No additional waste is sent off-site for re-use.
Waste Recording Is waste generation and waste management performance recorded? If so, How is this done? Is this data readily available? Does your waste contractor feed you back waste data? If so in what format and how often? Please provide contact details for you waste management contractor.
Excel spreadsheet to record estimates of waste produced per skip by ourselves. No GBN Services Ltd, 02085581234
We use KPI documents. One is attached, Appendix A2. This is not to be distributed or reproduced in any form. The data is collated once a month. The waste contractor issues information once a month. A copy is attached, Appendix A3. A1 Waste Contracting. Andrea Wilson: 07831570980
Yes : The Waste Management Framework Contractor, Grundon’s keeps records. The Logistics Contractor, Wilson James, keeps records. The Client, BAA, keeps records. The data is not fed back to TWC. Requests have been made to obtain copies of data from all of the above. No response has yet been received by TWC. Contact details for BAA Framework Waste Management Contractor : Angela Longley Grundon’s Waste Management
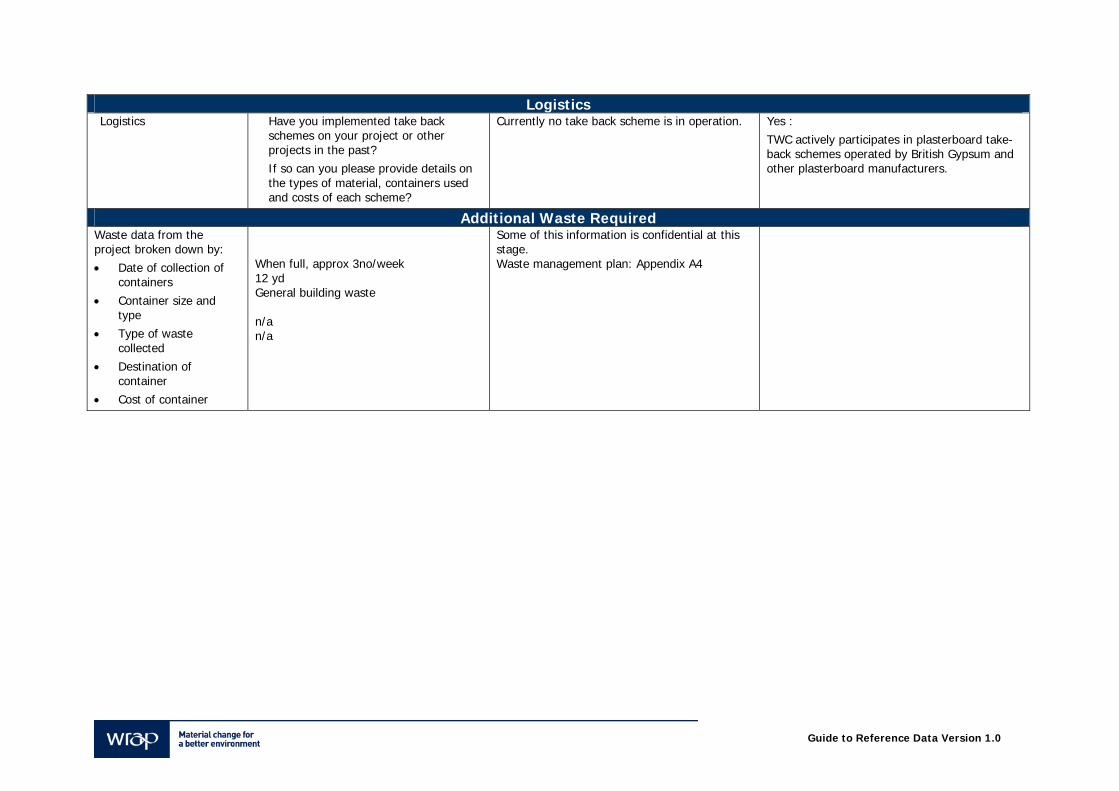
Guide to Reference Data Version 1.0
Logistics Logistics Have you implemented take back
schemes on your project or other projects in the past? If so can you please provide details on the types of material, containers used and costs of each scheme?
Currently no take back scheme is in operation. Yes : TWC actively participates in plasterboard take-back schemes operated by British Gypsum and other plasterboard manufacturers.
Additional Waste Required Waste data from the project broken down by: • Date of collection of
containers • Container size and
type • Type of waste
collected • Destination of
container • Cost of container
When full, approx 3no/week 12 yd General building waste n/a n/a
Some of this information is confidential at this stage. Waste management plan: Appendix A4
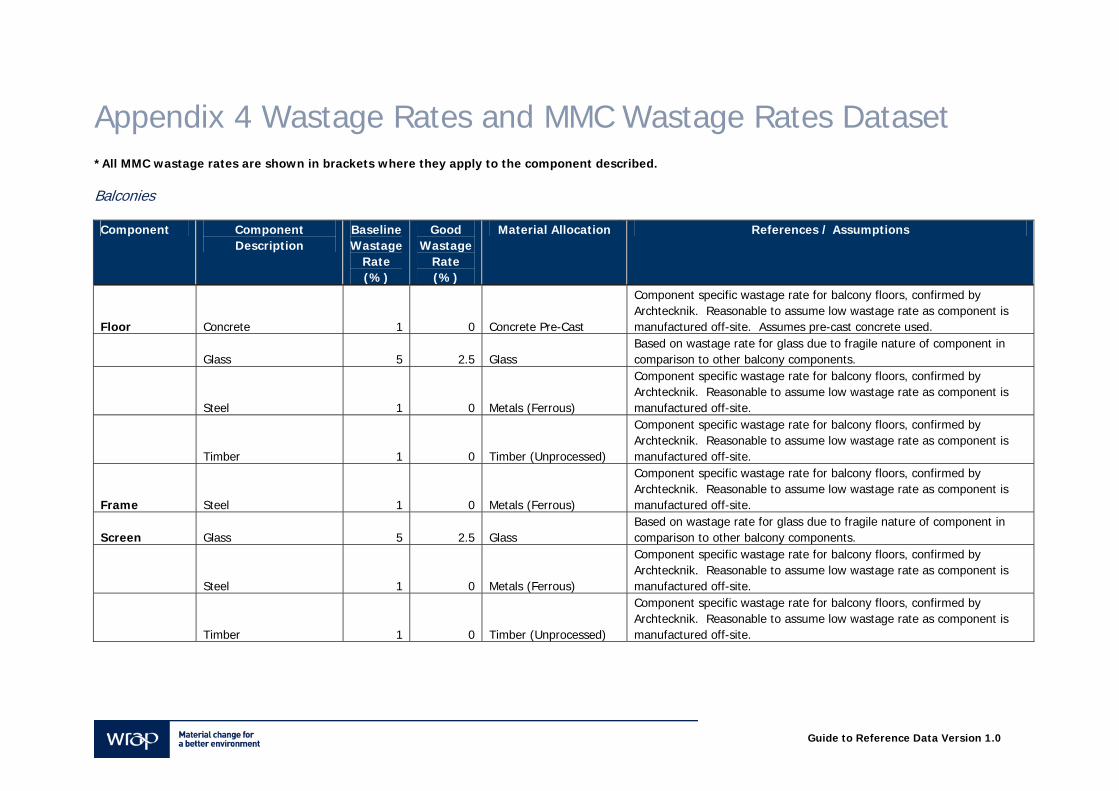
Guide to Reference Data Version 1.0
Appendix 4 Wastage Rates and MMC Wastage Rates Dataset *All MMC wastage rates are shown in brackets where they apply to the component described. Balconies Component Component
Description Baseline Wastage
Rate (%)
Good Wastage
Rate (%)
Material Allocation References / Assumptions
Floor Concrete 1 0 Concrete Pre-Cast
Component specific wastage rate for balcony floors, confirmed by Archtecknik. Reasonable to assume low wastage rate as component is manufactured off-site. Assumes pre-cast concrete used.
Glass 5 2.5 Glass Based on wastage rate for glass due to fragile nature of component in comparison to other balcony components.
Steel 1 0 Metals (Ferrous)
Component specific wastage rate for balcony floors, confirmed by Archtecknik. Reasonable to assume low wastage rate as component is manufactured off-site.
Timber 1 0 Timber (Unprocessed)
Component specific wastage rate for balcony floors, confirmed by Archtecknik. Reasonable to assume low wastage rate as component is manufactured off-site.
Frame Steel 1 0 Metals (Ferrous)
Component specific wastage rate for balcony floors, confirmed by Archtecknik. Reasonable to assume low wastage rate as component is manufactured off-site.
Screen Glass 5 2.5 Glass Based on wastage rate for glass due to fragile nature of component in comparison to other balcony components.
Steel 1 0 Metals (Ferrous)
Component specific wastage rate for balcony floors, confirmed by Archtecknik. Reasonable to assume low wastage rate as component is manufactured off-site.
Timber 1 0 Timber (Unprocessed)
Component specific wastage rate for balcony floors, confirmed by Archtecknik. Reasonable to assume low wastage rate as component is manufactured off-site.
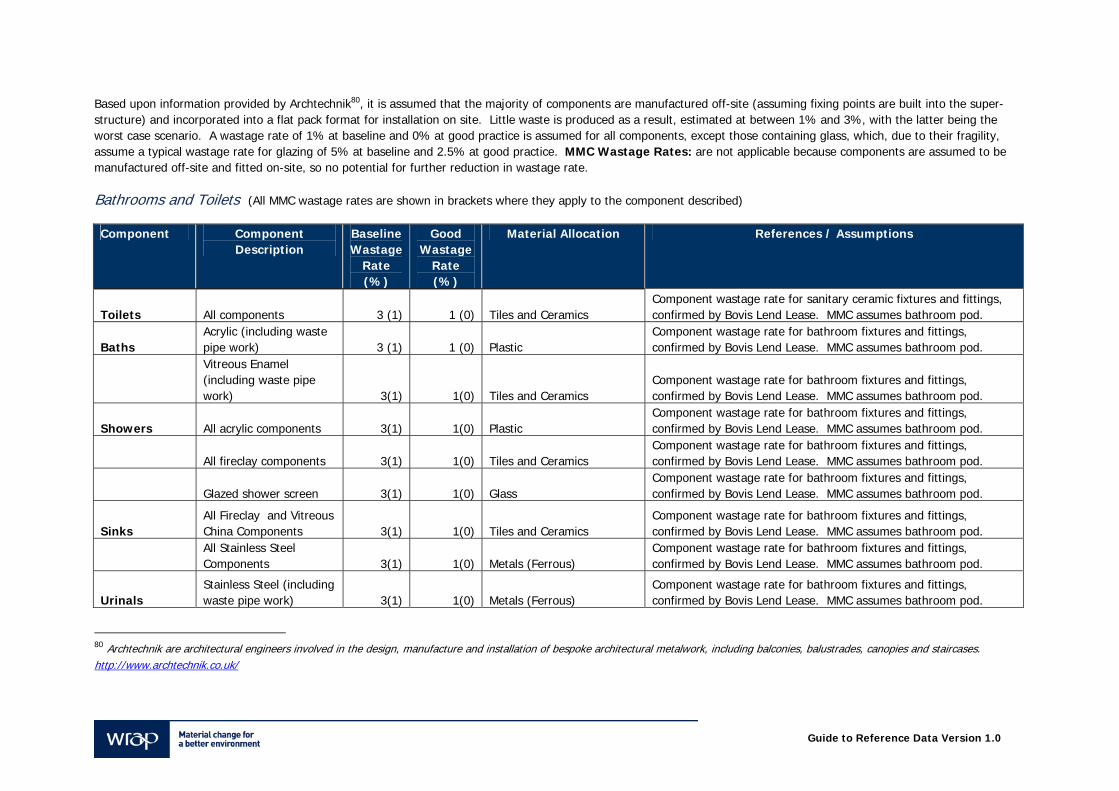
Guide to Reference Data Version 1.0
Based upon information provided by Archtechnik80, it is assumed that the majority of components are manufactured off-site (assuming fixing points are built into the super-structure) and incorporated into a flat pack format for installation on site. Little waste is produced as a result, estimated at between 1% and 3%, with the latter being the worst case scenario. A wastage rate of 1% at baseline and 0% at good practice is assumed for all components, except those containing glass, which, due to their fragility, assume a typical wastage rate for glazing of 5% at baseline and 2.5% at good practice. MMC Wastage Rates: are not applicable because components are assumed to be manufactured off-site and fitted on-site, so no potential for further reduction in wastage rate. Bathrooms and Toilets (All MMC wastage rates are shown in brackets where they apply to the component described) Component Component
Description Baseline Wastage
Rate (%)
Good Wastage
Rate (%)
Material Allocation References / Assumptions
Toilets All components 3 (1) 1 (0) Tiles and Ceramics Component wastage rate for sanitary ceramic fixtures and fittings, confirmed by Bovis Lend Lease. MMC assumes bathroom pod.
Baths Acrylic (including waste pipe work) 3 (1) 1 (0) Plastic
Component wastage rate for bathroom fixtures and fittings, confirmed by Bovis Lend Lease. MMC assumes bathroom pod.
Vitreous Enamel (including waste pipe work) 3(1) 1(0) Tiles and Ceramics
Component wastage rate for bathroom fixtures and fittings, confirmed by Bovis Lend Lease. MMC assumes bathroom pod.
Showers All acrylic components 3(1) 1(0) Plastic Component wastage rate for bathroom fixtures and fittings, confirmed by Bovis Lend Lease. MMC assumes bathroom pod.
All fireclay components 3(1) 1(0) Tiles and Ceramics Component wastage rate for bathroom fixtures and fittings, confirmed by Bovis Lend Lease. MMC assumes bathroom pod.
Glazed shower screen 3(1) 1(0) Glass Component wastage rate for bathroom fixtures and fittings, confirmed by Bovis Lend Lease. MMC assumes bathroom pod.
Sinks All Fireclay and Vitreous China Components 3(1) 1(0) Tiles and Ceramics
Component wastage rate for bathroom fixtures and fittings, confirmed by Bovis Lend Lease. MMC assumes bathroom pod.
All Stainless Steel Components 3(1) 1(0) Metals (Ferrous)
Component wastage rate for bathroom fixtures and fittings, confirmed by Bovis Lend Lease. MMC assumes bathroom pod.
Urinals Stainless Steel (including waste pipe work) 3(1) 1(0) Metals (Ferrous)
Component wastage rate for bathroom fixtures and fittings, confirmed by Bovis Lend Lease. MMC assumes bathroom pod.
80 Archtechnik are architectural engineers involved in the design, manufacture and installation of bespoke architectural metalwork, including balconies, balustrades, canopies and staircases. http://www.archtechnik.co.uk/
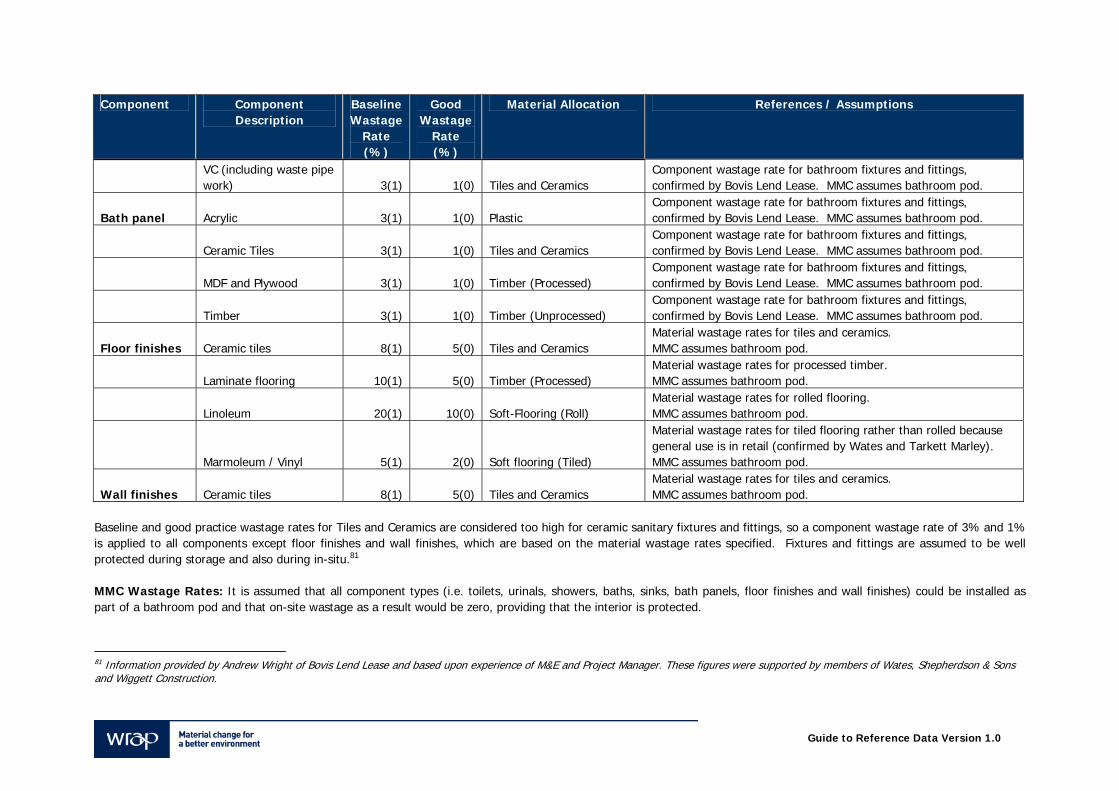
Guide to Reference Data Version 1.0
Component Component Description
Baseline Wastage
Rate (%)
Good Wastage
Rate (%)
Material Allocation References / Assumptions
VC (including waste pipe work) 3(1) 1(0) Tiles and Ceramics
Component wastage rate for bathroom fixtures and fittings, confirmed by Bovis Lend Lease. MMC assumes bathroom pod.
Bath panel Acrylic 3(1) 1(0) Plastic Component wastage rate for bathroom fixtures and fittings, confirmed by Bovis Lend Lease. MMC assumes bathroom pod.
Ceramic Tiles 3(1) 1(0) Tiles and Ceramics Component wastage rate for bathroom fixtures and fittings, confirmed by Bovis Lend Lease. MMC assumes bathroom pod.
MDF and Plywood 3(1) 1(0) Timber (Processed) Component wastage rate for bathroom fixtures and fittings, confirmed by Bovis Lend Lease. MMC assumes bathroom pod.
Timber 3(1) 1(0) Timber (Unprocessed) Component wastage rate for bathroom fixtures and fittings, confirmed by Bovis Lend Lease. MMC assumes bathroom pod.
Floor finishes Ceramic tiles 8(1) 5(0) Tiles and Ceramics Material wastage rates for tiles and ceramics. MMC assumes bathroom pod.
Laminate flooring 10(1) 5(0) Timber (Processed) Material wastage rates for processed timber. MMC assumes bathroom pod.
Linoleum 20(1) 10(0) Soft-Flooring (Roll) Material wastage rates for rolled flooring. MMC assumes bathroom pod.
Marmoleum / Vinyl 5(1) 2(0) Soft flooring (Tiled)
Material wastage rates for tiled flooring rather than rolled because general use is in retail (confirmed by Wates and Tarkett Marley). MMC assumes bathroom pod.
Wall finishes Ceramic tiles 8(1) 5(0) Tiles and Ceramics Material wastage rates for tiles and ceramics. MMC assumes bathroom pod.
Baseline and good practice wastage rates for Tiles and Ceramics are considered too high for ceramic sanitary fixtures and fittings, so a component wastage rate of 3% and 1% is applied to all components except floor finishes and wall finishes, which are based on the material wastage rates specified. Fixtures and fittings are assumed to be well protected during storage and also during in-situ.81 MMC Wastage Rates: It is assumed that all component types (i.e. toilets, urinals, showers, baths, sinks, bath panels, floor finishes and wall finishes) could be installed as part of a bathroom pod and that on-site wastage as a result would be zero, providing that the interior is protected.
81 Information provided by Andrew Wright of Bovis Lend Lease and based upon experience of M&E and Project Manager. These figures were supported by members of Wates, Shepherdson & Sons and Wiggett Construction.
Guide to Reference Data Version 1.0
However, there does remain potential for some damage to occur on site following pod installation and MMC wastage rates are estimated to be around 1% at baseline and 0% at good practice. This is applied to all components within the Bathrooms and Toilets building element category.
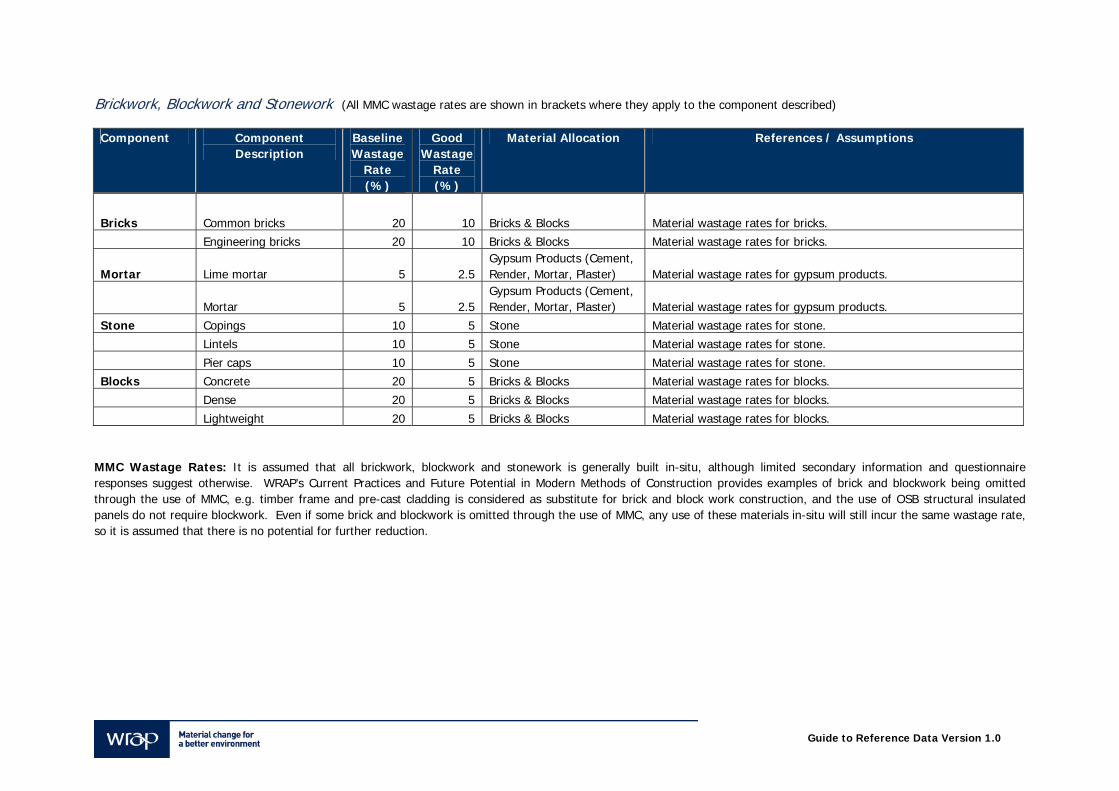
Guide to Reference Data Version 1.0
Brickwork, Blockwork and Stonework (All MMC wastage rates are shown in brackets where they apply to the component described) Component Component
Description Baseline Wastage
Rate (%)
Good Wastage
Rate (%)
Material Allocation References / Assumptions
Bricks Common bricks 20 10 Bricks & Blocks Material wastage rates for bricks.
Engineering bricks 20 10 Bricks & Blocks Material wastage rates for bricks.
Mortar Lime mortar 5 2.5 Gypsum Products (Cement, Render, Mortar, Plaster) Material wastage rates for gypsum products.
Mortar 5 2.5 Gypsum Products (Cement, Render, Mortar, Plaster) Material wastage rates for gypsum products.
Stone Copings 10 5 Stone Material wastage rates for stone.
Lintels 10 5 Stone Material wastage rates for stone.
Pier caps 10 5 Stone Material wastage rates for stone.
Blocks Concrete 20 5 Bricks & Blocks Material wastage rates for blocks.
Dense 20 5 Bricks & Blocks Material wastage rates for blocks.
Lightweight 20 5 Bricks & Blocks Material wastage rates for blocks. MMC Wastage Rates: It is assumed that all brickwork, blockwork and stonework is generally built in-situ, although limited secondary information and questionnaire responses suggest otherwise. WRAP’s Current Practices and Future Potential in Modern Methods of Construction provides examples of brick and blockwork being omitted through the use of MMC, e.g. timber frame and pre-cast cladding is considered as substitute for brick and block work construction, and the use of OSB structural insulated panels do not require blockwork. Even if some brick and blockwork is omitted through the use of MMC, any use of these materials in-situ will still incur the same wastage rate, so it is assumed that there is no potential for further reduction.
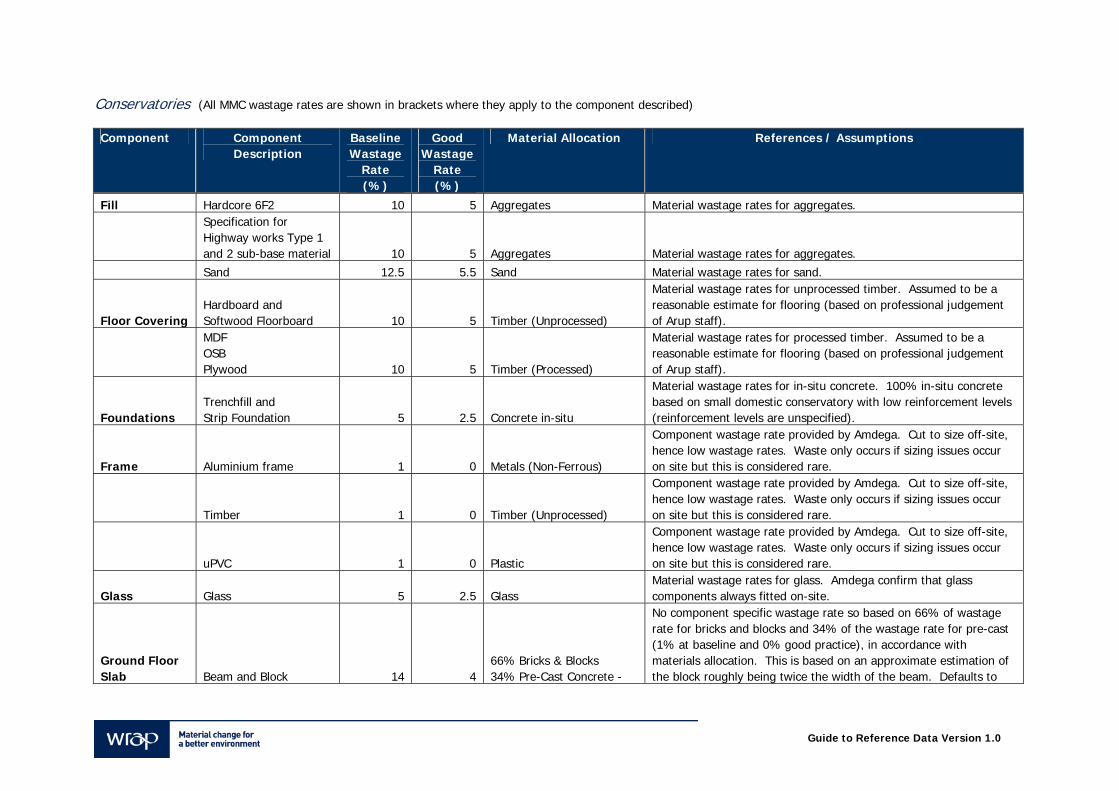
Guide to Reference Data Version 1.0
Conservatories (All MMC wastage rates are shown in brackets where they apply to the component described) Component Component
Description Baseline Wastage
Rate (%)
Good Wastage
Rate (%)
Material Allocation References / Assumptions
Fill Hardcore 6F2 10 5 Aggregates Material wastage rates for aggregates.
Specification for Highway works Type 1 and 2 sub-base material 10 5 Aggregates Material wastage rates for aggregates.
Sand 12.5 5.5 Sand Material wastage rates for sand.
Floor Covering Hardboard and Softwood Floorboard 10 5 Timber (Unprocessed)
Material wastage rates for unprocessed timber. Assumed to be a reasonable estimate for flooring (based on professional judgement of Arup staff).
MDF OSB Plywood 10 5 Timber (Processed)
Material wastage rates for processed timber. Assumed to be a reasonable estimate for flooring (based on professional judgement of Arup staff).
Foundations Trenchfill and Strip Foundation 5 2.5 Concrete in-situ
Material wastage rates for in-situ concrete. 100% in-situ concrete based on small domestic conservatory with low reinforcement levels (reinforcement levels are unspecified).
Frame Aluminium frame 1 0 Metals (Non-Ferrous)
Component wastage rate provided by Amdega. Cut to size off-site, hence low wastage rates. Waste only occurs if sizing issues occur on site but this is considered rare.
Timber 1 0 Timber (Unprocessed)
Component wastage rate provided by Amdega. Cut to size off-site, hence low wastage rates. Waste only occurs if sizing issues occur on site but this is considered rare.
uPVC 1 0 Plastic
Component wastage rate provided by Amdega. Cut to size off-site, hence low wastage rates. Waste only occurs if sizing issues occur on site but this is considered rare.
Glass Glass 5 2.5 Glass Material wastage rates for glass. Amdega confirm that glass components always fitted on-site.
Ground Floor Slab Beam and Block 14 4
66% Bricks & Blocks 34% Pre-Cast Concrete -
No component specific wastage rate so based on 66% of wastage rate for bricks and blocks and 34% of the wastage rate for pre-cast (1% at baseline and 0% good practice), in accordance with materials allocation. This is based on an approximate estimation of the block roughly being twice the width of the beam. Defaults to
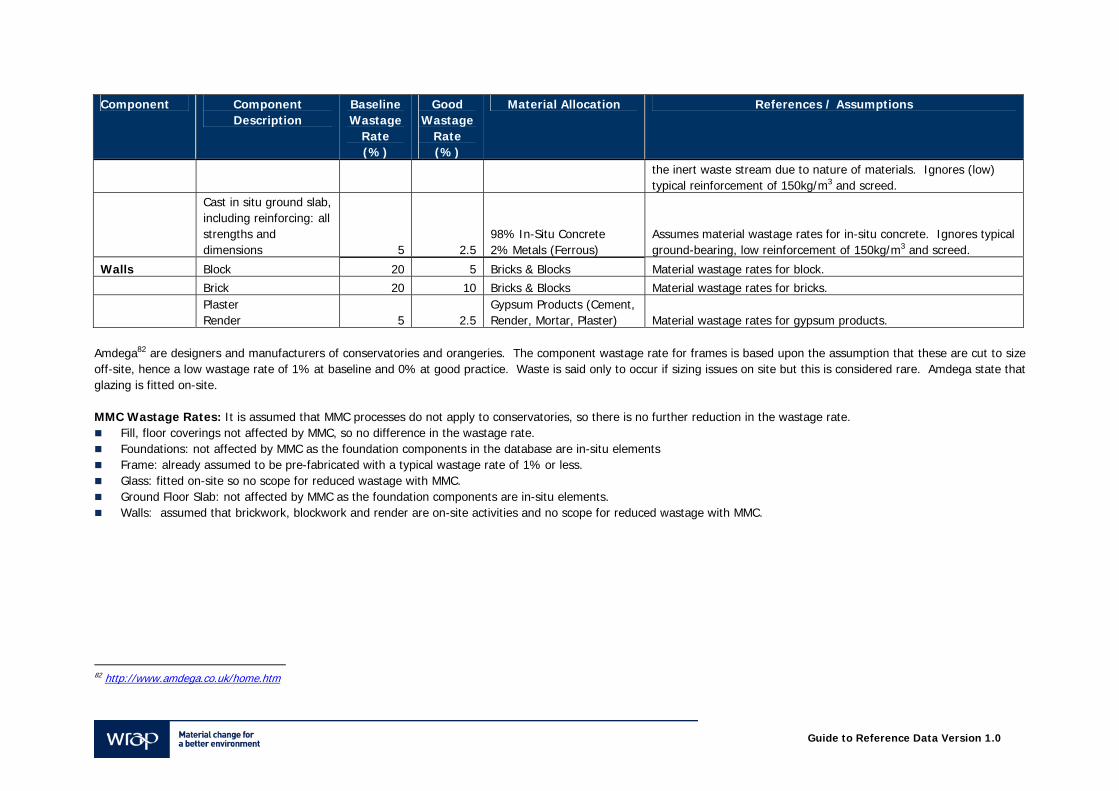
Guide to Reference Data Version 1.0
Component Component Description
Baseline Wastage
Rate (%)
Good Wastage
Rate (%)
Material Allocation References / Assumptions
the inert waste stream due to nature of materials. Ignores (low) typical reinforcement of 150kg/m3 and screed.
Cast in situ ground slab, including reinforcing: all strengths and dimensions 5 2.5
98% In-Situ Concrete 2% Metals (Ferrous)
Assumes material wastage rates for in-situ concrete. Ignores typical ground-bearing, low reinforcement of 150kg/m3 and screed.
Walls Block 20 5 Bricks & Blocks Material wastage rates for block.
Brick 20 10 Bricks & Blocks Material wastage rates for bricks.
Plaster Render 5 2.5
Gypsum Products (Cement, Render, Mortar, Plaster) Material wastage rates for gypsum products.
Amdega82 are designers and manufacturers of conservatories and orangeries. The component wastage rate for frames is based upon the assumption that these are cut to size off-site, hence a low wastage rate of 1% at baseline and 0% at good practice. Waste is said only to occur if sizing issues on site but this is considered rare. Amdega state that glazing is fitted on-site. MMC Wastage Rates: It is assumed that MMC processes do not apply to conservatories, so there is no further reduction in the wastage rate.
Fill, floor coverings not affected by MMC, so no difference in the wastage rate. Foundations: not affected by MMC as the foundation components in the database are in-situ elements Frame: already assumed to be pre-fabricated with a typical wastage rate of 1% or less. Glass: fitted on-site so no scope for reduced wastage with MMC. Ground Floor Slab: not affected by MMC as the foundation components are in-situ elements. Walls: assumed that brickwork, blockwork and render are on-site activities and no scope for reduced wastage with MMC.
82 http://www.amdega.co.uk/home.htm
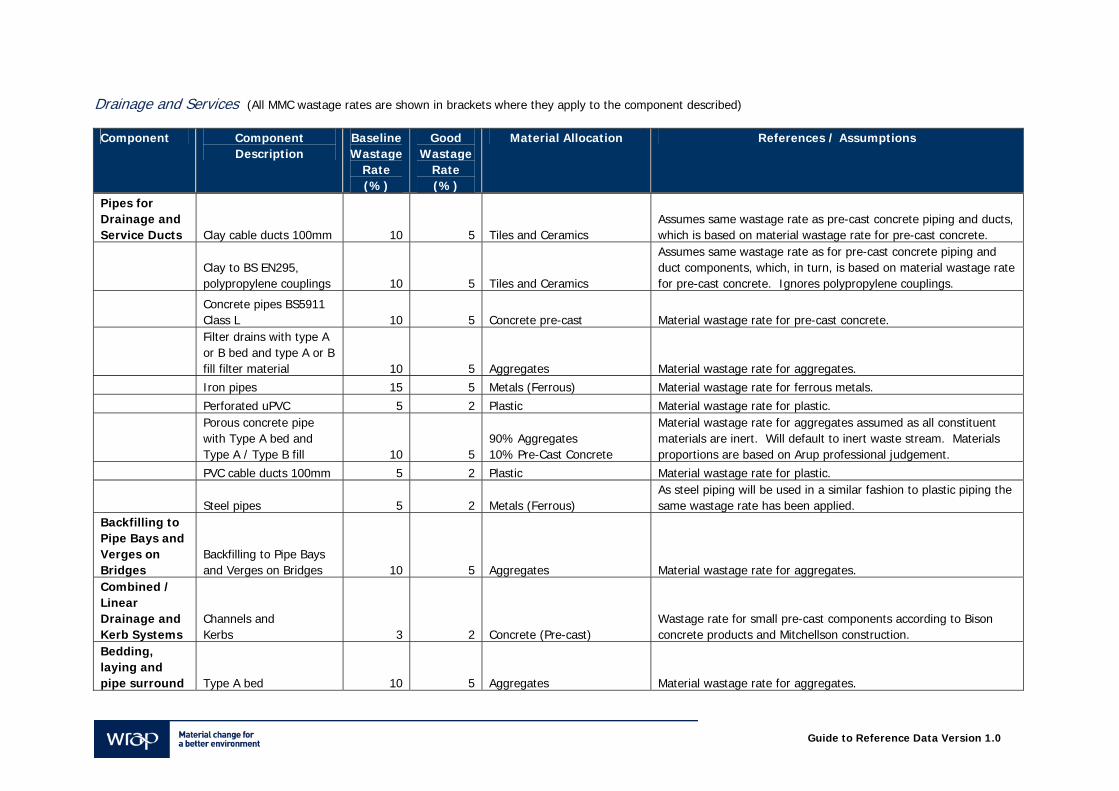
Guide to Reference Data Version 1.0
Drainage and Services (All MMC wastage rates are shown in brackets where they apply to the component described) Component Component
Description Baseline Wastage
Rate (%)
Good Wastage
Rate (%)
Material Allocation References / Assumptions
Pipes for Drainage and Service Ducts Clay cable ducts 100mm 10 5 Tiles and Ceramics
Assumes same wastage rate as pre-cast concrete piping and ducts, which is based on material wastage rate for pre-cast concrete.
Clay to BS EN295, polypropylene couplings 10 5 Tiles and Ceramics
Assumes same wastage rate as for pre-cast concrete piping and duct components, which, in turn, is based on material wastage rate for pre-cast concrete. Ignores polypropylene couplings.
Concrete pipes BS5911 Class L 10 5 Concrete pre-cast Material wastage rate for pre-cast concrete.
Filter drains with type A or B bed and type A or B fill filter material 10 5 Aggregates Material wastage rate for aggregates.
Iron pipes 15 5 Metals (Ferrous) Material wastage rate for ferrous metals.
Perforated uPVC 5 2 Plastic Material wastage rate for plastic.
Porous concrete pipe with Type A bed and Type A / Type B fill 10 5
90% Aggregates 10% Pre-Cast Concrete
Material wastage rate for aggregates assumed as all constituent materials are inert. Will default to inert waste stream. Materials proportions are based on Arup professional judgement.
PVC cable ducts 100mm 5 2 Plastic Material wastage rate for plastic.
Steel pipes 5 2 Metals (Ferrous) As steel piping will be used in a similar fashion to plastic piping the same wastage rate has been applied.
Backfilling to Pipe Bays and Verges on Bridges
Backfilling to Pipe Bays and Verges on Bridges 10 5 Aggregates Material wastage rate for aggregates.
Combined / Linear Drainage and Kerb Systems
Channels and Kerbs 3 2 Concrete (Pre-cast)
Wastage rate for small pre-cast components according to Bison concrete products and Mitchellson construction.
Bedding, laying and pipe surround Type A bed 10 5 Aggregates Material wastage rate for aggregates.
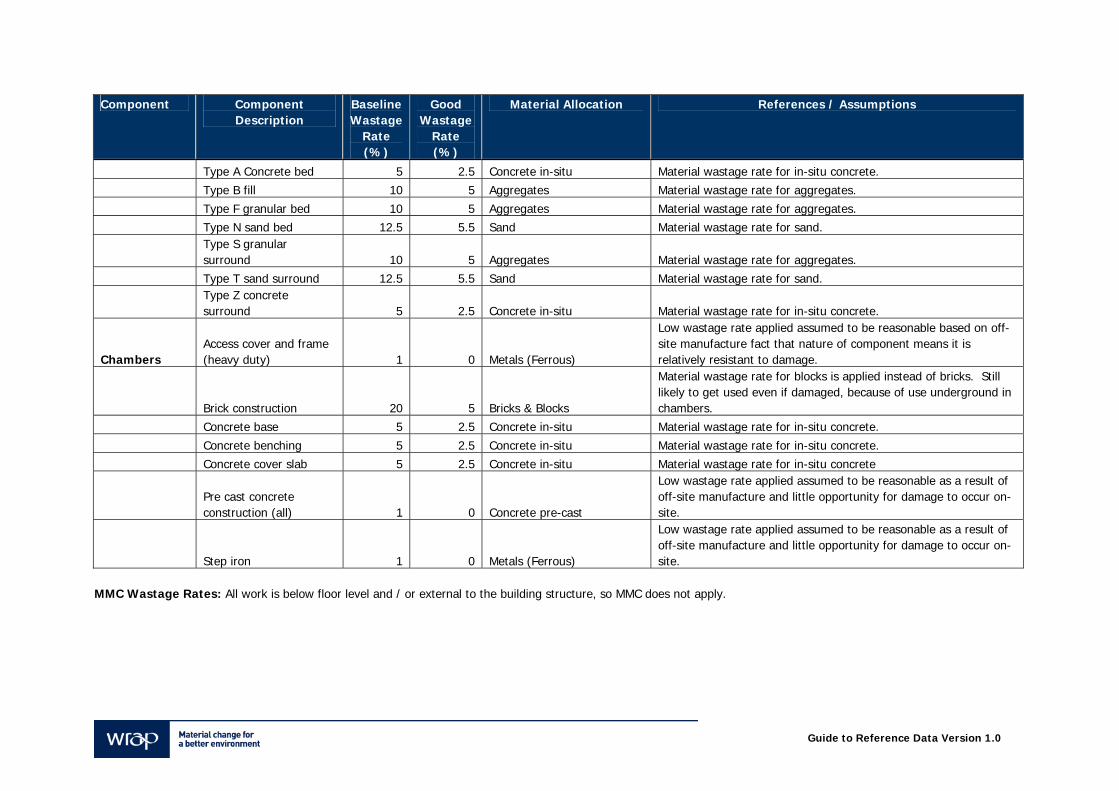
Guide to Reference Data Version 1.0
Component Component Description
Baseline Wastage
Rate (%)
Good Wastage
Rate (%)
Material Allocation References / Assumptions
Type A Concrete bed 5 2.5 Concrete in-situ Material wastage rate for in-situ concrete.
Type B fill 10 5 Aggregates Material wastage rate for aggregates.
Type F granular bed 10 5 Aggregates Material wastage rate for aggregates.
Type N sand bed 12.5 5.5 Sand Material wastage rate for sand.
Type S granular surround 10 5 Aggregates Material wastage rate for aggregates.
Type T sand surround 12.5 5.5 Sand Material wastage rate for sand.
Type Z concrete surround 5 2.5 Concrete in-situ Material wastage rate for in-situ concrete.
Chambers Access cover and frame (heavy duty) 1 0 Metals (Ferrous)
Low wastage rate applied assumed to be reasonable based on off-site manufacture fact that nature of component means it is relatively resistant to damage.
Brick construction 20 5 Bricks & Blocks
Material wastage rate for blocks is applied instead of bricks. Still likely to get used even if damaged, because of use underground in chambers.
Concrete base 5 2.5 Concrete in-situ Material wastage rate for in-situ concrete.
Concrete benching 5 2.5 Concrete in-situ Material wastage rate for in-situ concrete.
Concrete cover slab 5 2.5 Concrete in-situ Material wastage rate for in-situ concrete
Pre cast concrete construction (all) 1 0 Concrete pre-cast
Low wastage rate applied assumed to be reasonable as a result of off-site manufacture and little opportunity for damage to occur on-site.
Step iron 1 0 Metals (Ferrous)
Low wastage rate applied assumed to be reasonable as a result of off-site manufacture and little opportunity for damage to occur on-site.
MMC Wastage Rates: All work is below floor level and / or external to the building structure, so MMC does not apply.
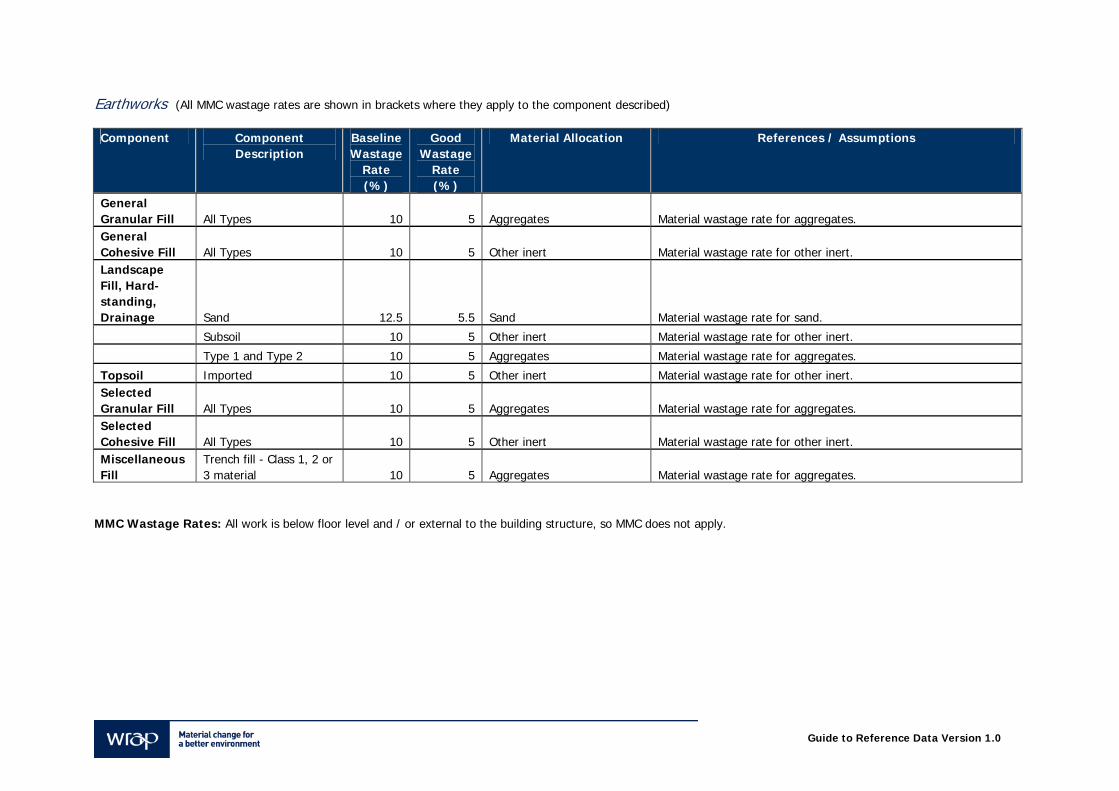
Guide to Reference Data Version 1.0
Earthworks (All MMC wastage rates are shown in brackets where they apply to the component described) Component Component
Description Baseline Wastage
Rate (%)
Good Wastage
Rate (%)
Material Allocation References / Assumptions
General Granular Fill All Types 10 5 Aggregates Material wastage rate for aggregates. General Cohesive Fill All Types 10 5 Other inert Material wastage rate for other inert. Landscape Fill, Hard-standing, Drainage Sand 12.5 5.5 Sand Material wastage rate for sand.
Subsoil 10 5 Other inert Material wastage rate for other inert.
Type 1 and Type 2 10 5 Aggregates Material wastage rate for aggregates.
Topsoil Imported 10 5 Other inert Material wastage rate for other inert. Selected Granular Fill All Types 10 5 Aggregates Material wastage rate for aggregates. Selected Cohesive Fill All Types 10 5 Other inert Material wastage rate for other inert. Miscellaneous Fill
Trench fill - Class 1, 2 or 3 material 10 5 Aggregates Material wastage rate for aggregates.
MMC Wastage Rates: All work is below floor level and / or external to the building structure, so MMC does not apply.
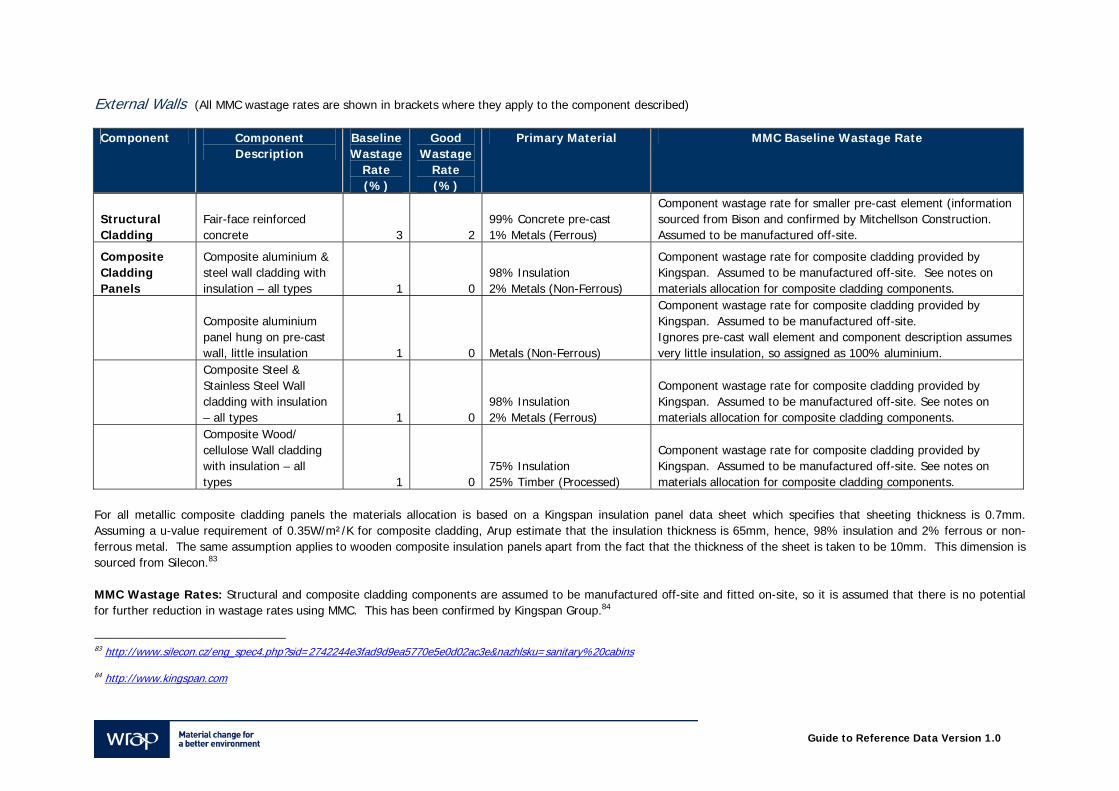
Guide to Reference Data Version 1.0
External Walls (All MMC wastage rates are shown in brackets where they apply to the component described) Component Component
Description Baseline Wastage
Rate (%)
Good Wastage
Rate (%)
Primary Material MMC Baseline Wastage Rate
Structural Cladding
Fair-face reinforced concrete 3 2
99% Concrete pre-cast 1% Metals (Ferrous)
Component wastage rate for smaller pre-cast element (information sourced from Bison and confirmed by Mitchellson Construction. Assumed to be manufactured off-site.
Composite Cladding Panels
Composite aluminium & steel wall cladding with insulation – all types 1 0
98% Insulation 2% Metals (Non-Ferrous)
Component wastage rate for composite cladding provided by Kingspan. Assumed to be manufactured off-site. See notes on materials allocation for composite cladding components.
Composite aluminium panel hung on pre-cast wall, little insulation 1 0 Metals (Non-Ferrous)
Component wastage rate for composite cladding provided by Kingspan. Assumed to be manufactured off-site. Ignores pre-cast wall element and component description assumes very little insulation, so assigned as 100% aluminium.
Composite Steel & Stainless Steel Wall cladding with insulation – all types 1 0
98% Insulation 2% Metals (Ferrous)
Component wastage rate for composite cladding provided by Kingspan. Assumed to be manufactured off-site. See notes on materials allocation for composite cladding components.
Composite Wood/ cellulose Wall cladding with insulation – all types 1 0
75% Insulation 25% Timber (Processed)
Component wastage rate for composite cladding provided by Kingspan. Assumed to be manufactured off-site. See notes on materials allocation for composite cladding components.
For all metallic composite cladding panels the materials allocation is based on a Kingspan insulation panel data sheet which specifies that sheeting thickness is 0.7mm. Assuming a u-value requirement of 0.35W/m²/K for composite cladding, Arup estimate that the insulation thickness is 65mm, hence, 98% insulation and 2% ferrous or non-ferrous metal. The same assumption applies to wooden composite insulation panels apart from the fact that the thickness of the sheet is taken to be 10mm. This dimension is sourced from Silecon.83 MMC Wastage Rates: Structural and composite cladding components are assumed to be manufactured off-site and fitted on-site, so it is assumed that there is no potential for further reduction in wastage rates using MMC. This has been confirmed by Kingspan Group.84
83 http://www.silecon.cz/eng_spec4.php?sid=2742244e3fad9d9ea5770e5e0d02ac3e&nazhlsku=sanitary%20cabins
84 http://www.kingspan.com
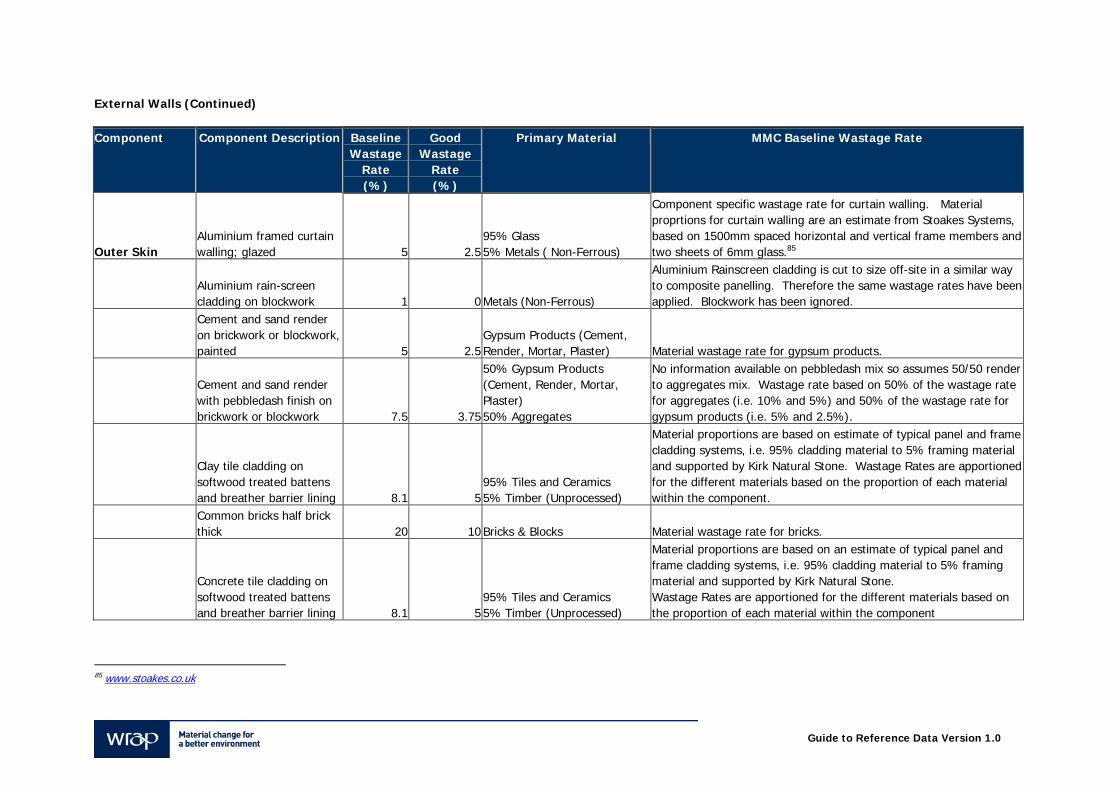
Guide to Reference Data Version 1.0
External Walls (Continued) Component Component Description Baseline
Wastage Rate (%)
Good Wastage
Rate (%)
Primary Material MMC Baseline Wastage Rate
Outer Skin Aluminium framed curtain walling; glazed 5 2.5
95% Glass 5% Metals ( Non-Ferrous)
Component specific wastage rate for curtain walling. Material proprtions for curtain walling are an estimate from Stoakes Systems, based on 1500mm spaced horizontal and vertical frame members and two sheets of 6mm glass.85
Aluminium rain-screen cladding on blockwork 1 0 Metals (Non-Ferrous)
Aluminium Rainscreen cladding is cut to size off-site in a similar way to composite panelling. Therefore the same wastage rates have been applied. Blockwork has been ignored.
Cement and sand render on brickwork or blockwork, painted 5 2.5
Gypsum Products (Cement, Render, Mortar, Plaster) Material wastage rate for gypsum products.
Cement and sand render with pebbledash finish on brickwork or blockwork 7.5 3.75
50% Gypsum Products (Cement, Render, Mortar, Plaster) 50% Aggregates
No information available on pebbledash mix so assumes 50/50 render to aggregates mix. Wastage rate based on 50% of the wastage rate for aggregates (i.e. 10% and 5%) and 50% of the wastage rate for gypsum products (i.e. 5% and 2.5%).
Clay tile cladding on softwood treated battens and breather barrier lining 8.1 5
95% Tiles and Ceramics 5% Timber (Unprocessed)
Material proportions are based on estimate of typical panel and frame cladding systems, i.e. 95% cladding material to 5% framing material and supported by Kirk Natural Stone. Wastage Rates are apportioned for the different materials based on the proportion of each material within the component.
Common bricks half brick thick 20 10 Bricks & Blocks Material wastage rate for bricks.
Concrete tile cladding on softwood treated battens and breather barrier lining 8.1 5
95% Tiles and Ceramics 5% Timber (Unprocessed)
Material proportions are based on an estimate of typical panel and frame cladding systems, i.e. 95% cladding material to 5% framing material and supported by Kirk Natural Stone. Wastage Rates are apportioned for the different materials based on the proportion of each material within the component
85 www.stoakes.co.uk
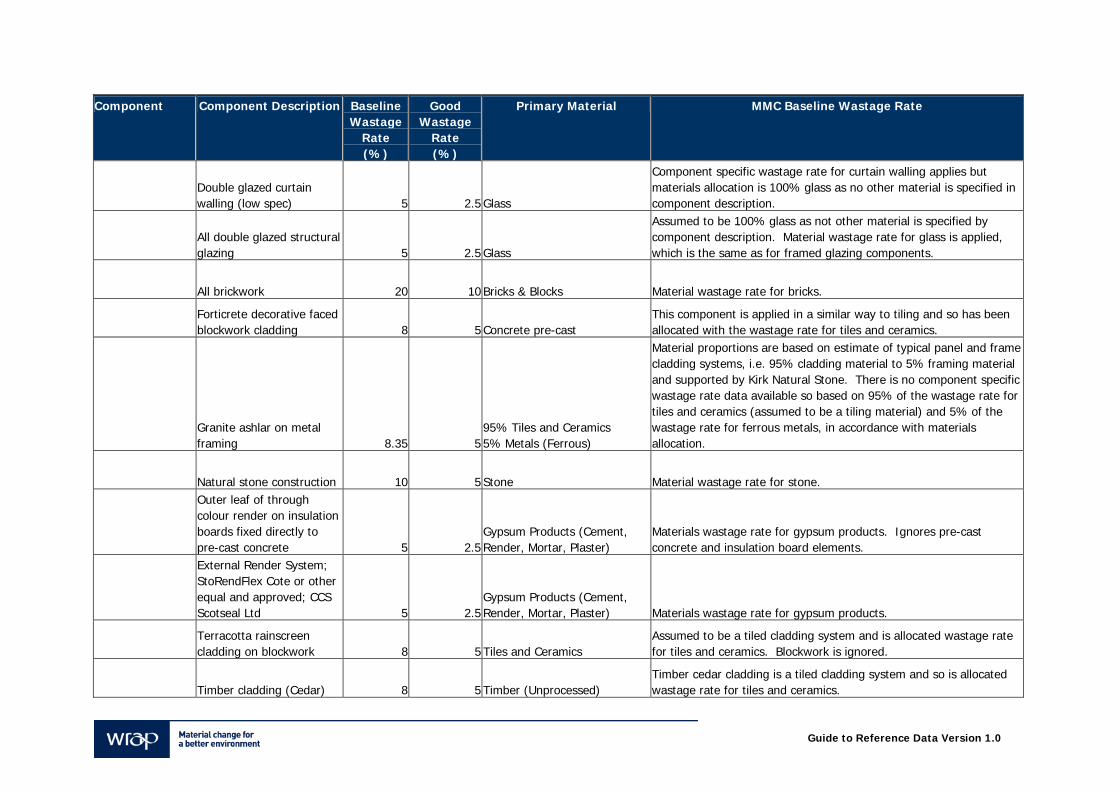
Guide to Reference Data Version 1.0
Component Component Description Baseline Wastage
Rate (%)
Good Wastage
Rate (%)
Primary Material MMC Baseline Wastage Rate
Double glazed curtain walling (low spec) 5 2.5 Glass
Component specific wastage rate for curtain walling applies but materials allocation is 100% glass as no other material is specified in component description.
All double glazed structural glazing 5 2.5 Glass
Assumed to be 100% glass as not other material is specified by component description. Material wastage rate for glass is applied, which is the same as for framed glazing components.
All brickwork 20 10 Bricks & Blocks Material wastage rate for bricks.
Forticrete decorative faced blockwork cladding 8 5 Concrete pre-cast
This component is applied in a similar way to tiling and so has been allocated with the wastage rate for tiles and ceramics.
Granite ashlar on metal framing 8.35 5
95% Tiles and Ceramics 5% Metals (Ferrous)
Material proportions are based on estimate of typical panel and frame cladding systems, i.e. 95% cladding material to 5% framing material and supported by Kirk Natural Stone. There is no component specific wastage rate data available so based on 95% of the wastage rate for tiles and ceramics (assumed to be a tiling material) and 5% of the wastage rate for ferrous metals, in accordance with materials allocation.
Natural stone construction 10 5 Stone Material wastage rate for stone.
Outer leaf of through colour render on insulation boards fixed directly to pre-cast concrete 5 2.5
Gypsum Products (Cement, Render, Mortar, Plaster)
Materials wastage rate for gypsum products. Ignores pre-cast concrete and insulation board elements.
External Render System; StoRendFlex Cote or other equal and approved; CCS Scotseal Ltd 5 2.5
Gypsum Products (Cement, Render, Mortar, Plaster) Materials wastage rate for gypsum products.
Terracotta rainscreen cladding on blockwork 8 5 Tiles and Ceramics
Assumed to be a tiled cladding system and is allocated wastage rate for tiles and ceramics. Blockwork is ignored.
Timber cladding (Cedar) 8 5 Timber (Unprocessed) Timber cedar cladding is a tiled cladding system and so is allocated wastage rate for tiles and ceramics.
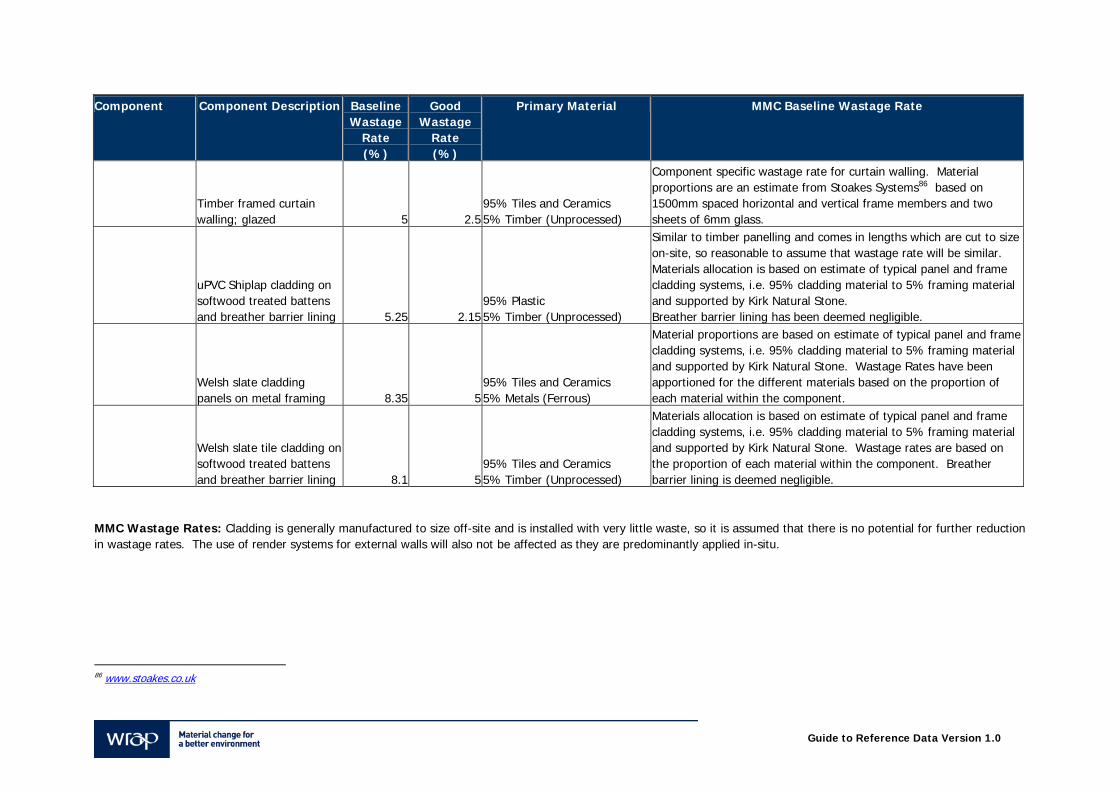
Guide to Reference Data Version 1.0
Component Component Description Baseline Wastage
Rate (%)
Good Wastage
Rate (%)
Primary Material MMC Baseline Wastage Rate
Timber framed curtain walling; glazed 5 2.5
95% Tiles and Ceramics 5% Timber (Unprocessed)
Component specific wastage rate for curtain walling. Material proportions are an estimate from Stoakes Systems86 based on 1500mm spaced horizontal and vertical frame members and two sheets of 6mm glass.
uPVC Shiplap cladding on softwood treated battens and breather barrier lining 5.25 2.15
95% Plastic 5% Timber (Unprocessed)
Similar to timber panelling and comes in lengths which are cut to size on-site, so reasonable to assume that wastage rate will be similar. Materials allocation is based on estimate of typical panel and frame cladding systems, i.e. 95% cladding material to 5% framing material and supported by Kirk Natural Stone. Breather barrier lining has been deemed negligible.
Welsh slate cladding panels on metal framing 8.35 5
95% Tiles and Ceramics 5% Metals (Ferrous)
Material proportions are based on estimate of typical panel and frame cladding systems, i.e. 95% cladding material to 5% framing material and supported by Kirk Natural Stone. Wastage Rates have been apportioned for the different materials based on the proportion of each material within the component.
Welsh slate tile cladding on softwood treated battens and breather barrier lining 8.1 5
95% Tiles and Ceramics 5% Timber (Unprocessed)
Materials allocation is based on estimate of typical panel and frame cladding systems, i.e. 95% cladding material to 5% framing material and supported by Kirk Natural Stone. Wastage rates are based on the proportion of each material within the component. Breather barrier lining is deemed negligible.
MMC Wastage Rates: Cladding is generally manufactured to size off-site and is installed with very little waste, so it is assumed that there is no potential for further reduction in wastage rates. The use of render systems for external walls will also not be affected as they are predominantly applied in-situ.
86 www.stoakes.co.uk
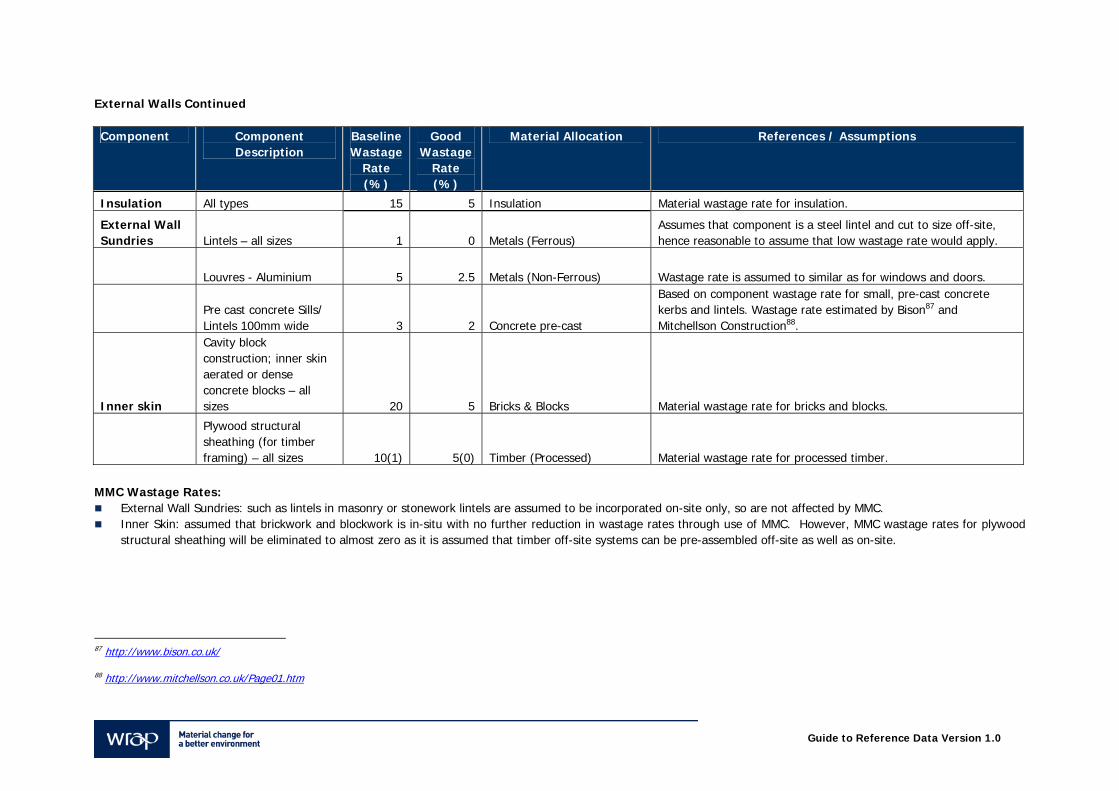
Guide to Reference Data Version 1.0
External Walls Continued Component Component
Description Baseline Wastage
Rate (%)
Good Wastage
Rate (%)
Material Allocation References / Assumptions
Insulation All types 15 5 Insulation Material wastage rate for insulation.
External Wall Sundries Lintels – all sizes 1 0 Metals (Ferrous)
Assumes that component is a steel lintel and cut to size off-site, hence reasonable to assume that low wastage rate would apply.
Louvres - Aluminium 5 2.5 Metals (Non-Ferrous) Wastage rate is assumed to similar as for windows and doors.
Pre cast concrete Sills/ Lintels 100mm wide 3 2 Concrete pre-cast
Based on component wastage rate for small, pre-cast concrete kerbs and lintels. Wastage rate estimated by Bison87 and Mitchellson Construction88.
Inner skin
Cavity block construction; inner skin aerated or dense concrete blocks – all sizes 20 5 Bricks & Blocks Material wastage rate for bricks and blocks.
Plywood structural sheathing (for timber framing) – all sizes 10(1) 5(0) Timber (Processed) Material wastage rate for processed timber.
MMC Wastage Rates:
External Wall Sundries: such as lintels in masonry or stonework lintels are assumed to be incorporated on-site only, so are not affected by MMC. Inner Skin: assumed that brickwork and blockwork is in-situ with no further reduction in wastage rates through use of MMC. However, MMC wastage rates for plywood
structural sheathing will be eliminated to almost zero as it is assumed that timber off-site systems can be pre-assembled off-site as well as on-site.
87 http://www.bison.co.uk/
88 http://www.mitchellson.co.uk/Page01.htm
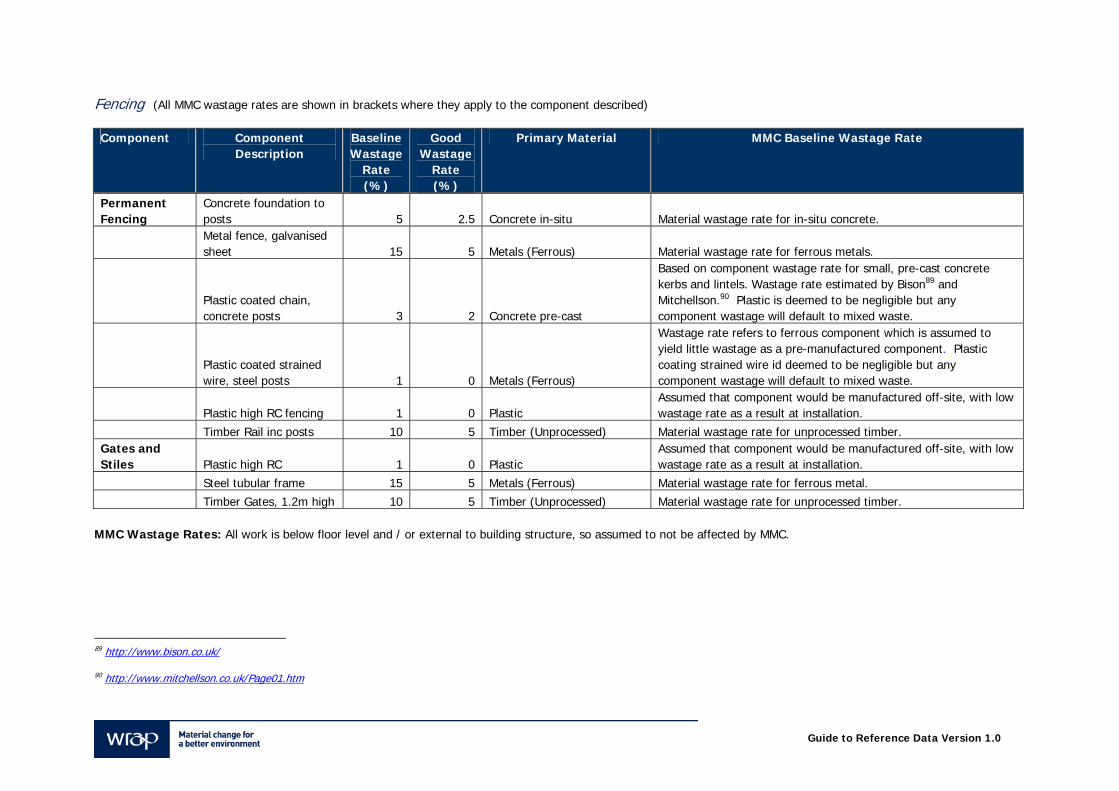
Guide to Reference Data Version 1.0
Fencing (All MMC wastage rates are shown in brackets where they apply to the component described) Component Component
Description Baseline Wastage
Rate (%)
Good Wastage
Rate (%)
Primary Material MMC Baseline Wastage Rate
Permanent Fencing
Concrete foundation to posts 5 2.5 Concrete in-situ Material wastage rate for in-situ concrete.
Metal fence, galvanised sheet 15 5 Metals (Ferrous) Material wastage rate for ferrous metals.
Plastic coated chain, concrete posts 3 2 Concrete pre-cast
Based on component wastage rate for small, pre-cast concrete kerbs and lintels. Wastage rate estimated by Bison89 and Mitchellson.90 Plastic is deemed to be negligible but any component wastage will default to mixed waste.
Plastic coated strained wire, steel posts 1 0 Metals (Ferrous)
Wastage rate refers to ferrous component which is assumed to yield little wastage as a pre-manufactured component. Plastic coating strained wire id deemed to be negligible but any component wastage will default to mixed waste.
Plastic high RC fencing 1 0 Plastic Assumed that component would be manufactured off-site, with low wastage rate as a result at installation.
Timber Rail inc posts 10 5 Timber (Unprocessed) Material wastage rate for unprocessed timber. Gates and Stiles Plastic high RC 1 0 Plastic
Assumed that component would be manufactured off-site, with low wastage rate as a result at installation.
Steel tubular frame 15 5 Metals (Ferrous) Material wastage rate for ferrous metal.
Timber Gates, 1.2m high 10 5 Timber (Unprocessed) Material wastage rate for unprocessed timber. MMC Wastage Rates: All work is below floor level and / or external to building structure, so assumed to not be affected by MMC.
89 http://www.bison.co.uk/
90 http://www.mitchellson.co.uk/Page01.htm
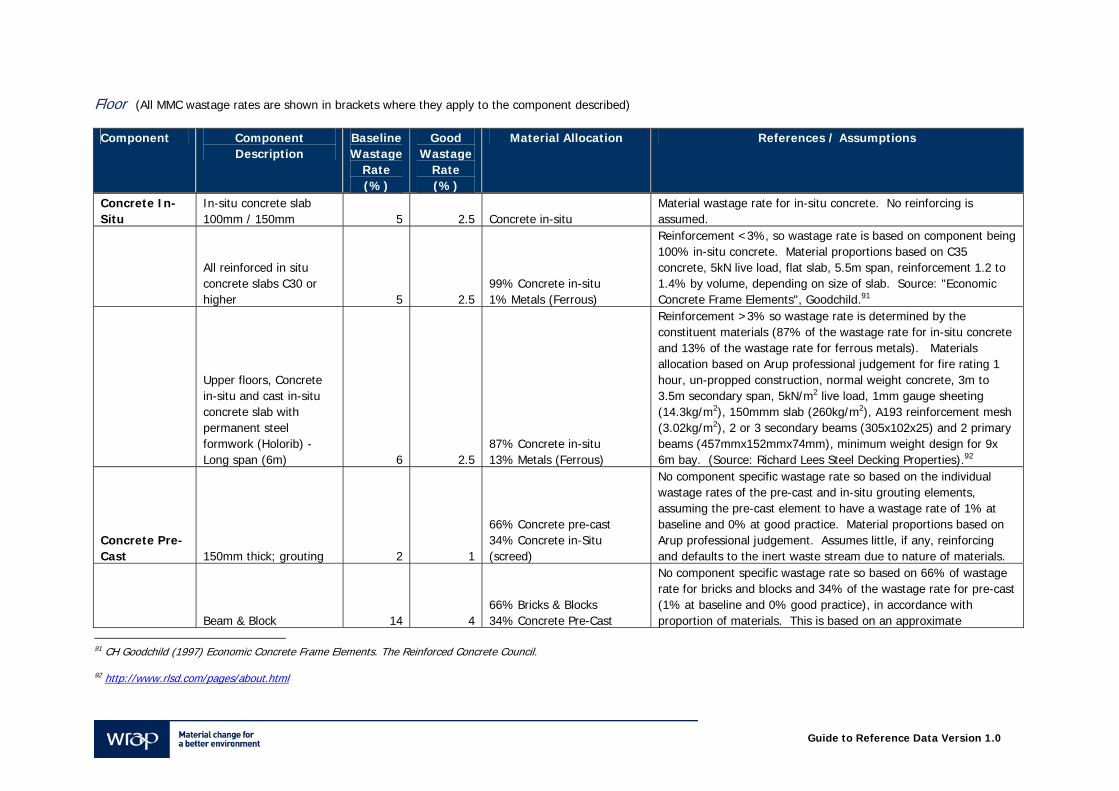
Guide to Reference Data Version 1.0
Floor (All MMC wastage rates are shown in brackets where they apply to the component described) Component Component
Description Baseline Wastage
Rate (%)
Good Wastage
Rate (%)
Material Allocation References / Assumptions
Concrete In-Situ
In-situ concrete slab 100mm / 150mm 5 2.5 Concrete in-situ
Material wastage rate for in-situ concrete. No reinforcing is assumed.
All reinforced in situ concrete slabs C30 or higher 5 2.5
99% Concrete in-situ 1% Metals (Ferrous)
Reinforcement <3%, so wastage rate is based on component being 100% in-situ concrete. Material proportions based on C35 concrete, 5kN live load, flat slab, 5.5m span, reinforcement 1.2 to 1.4% by volume, depending on size of slab. Source: "Economic Concrete Frame Elements", Goodchild.91
Upper floors, Concrete in-situ and cast in-situ concrete slab with permanent steel formwork (Holorib) - Long span (6m) 6 2.5
87% Concrete in-situ 13% Metals (Ferrous)
Reinforcement >3% so wastage rate is determined by the constituent materials (87% of the wastage rate for in-situ concrete and 13% of the wastage rate for ferrous metals). Materials allocation based on Arup professional judgement for fire rating 1 hour, un-propped construction, normal weight concrete, 3m to 3.5m secondary span, 5kN/m2 live load, 1mm gauge sheeting (14.3kg/m2), 150mmm slab (260kg/m2), A193 reinforcement mesh (3.02kg/m2), 2 or 3 secondary beams (305x102x25) and 2 primary beams (457mmx152mmx74mm), minimum weight design for 9x 6m bay. (Source: Richard Lees Steel Decking Properties).92
Concrete Pre-Cast 150mm thick; grouting 2 1
66% Concrete pre-cast 34% Concrete in-Situ (screed)
No component specific wastage rate so based on the individual wastage rates of the pre-cast and in-situ grouting elements, assuming the pre-cast element to have a wastage rate of 1% at baseline and 0% at good practice. Material proportions based on Arup professional judgement. Assumes little, if any, reinforcing and defaults to the inert waste stream due to nature of materials.
Beam & Block 14 4 66% Bricks & Blocks 34% Concrete Pre-Cast
No component specific wastage rate so based on 66% of wastage rate for bricks and blocks and 34% of the wastage rate for pre-cast (1% at baseline and 0% good practice), in accordance with proportion of materials. This is based on an approximate
91 CH Goodchild (1997) Economic Concrete Frame Elements. The Reinforced Concrete Council.
92 http://www.rlsd.com/pages/about.html
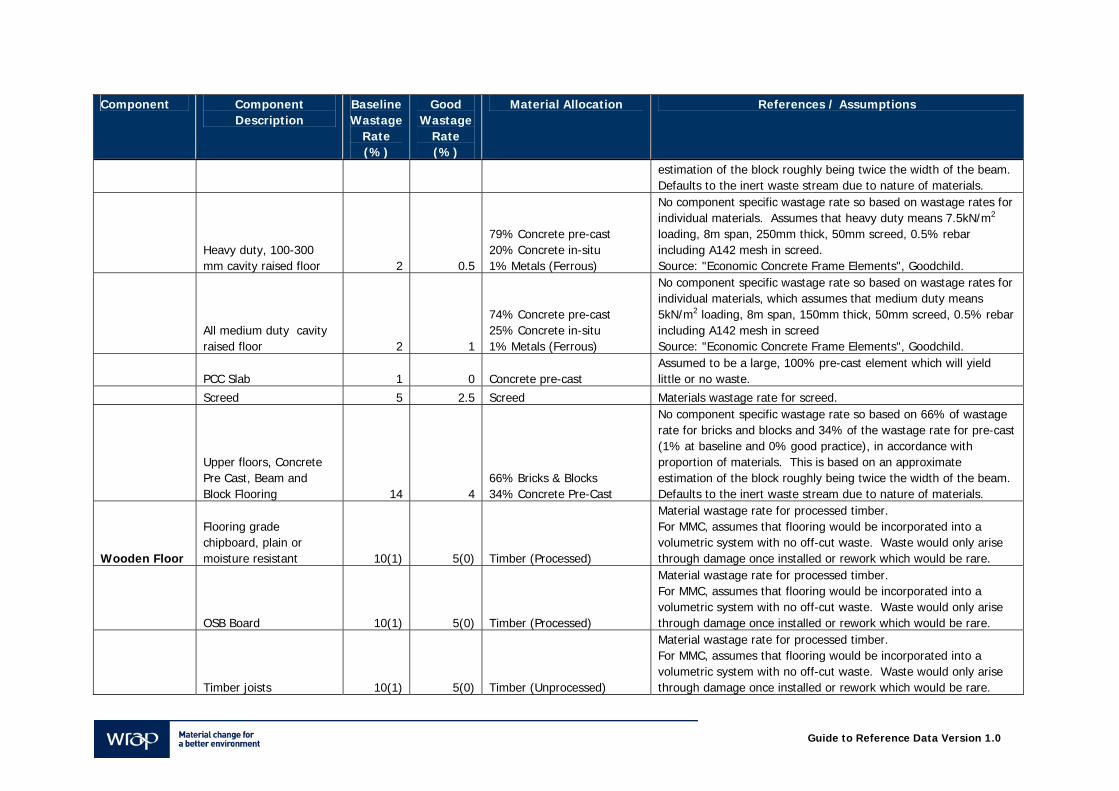
Guide to Reference Data Version 1.0
Component Component Description
Baseline Wastage
Rate (%)
Good Wastage
Rate (%)
Material Allocation References / Assumptions
estimation of the block roughly being twice the width of the beam. Defaults to the inert waste stream due to nature of materials.
Heavy duty, 100-300 mm cavity raised floor 2 0.5
79% Concrete pre-cast 20% Concrete in-situ 1% Metals (Ferrous)
No component specific wastage rate so based on wastage rates for individual materials. Assumes that heavy duty means 7.5kN/m2 loading, 8m span, 250mm thick, 50mm screed, 0.5% rebar including A142 mesh in screed. Source: "Economic Concrete Frame Elements", Goodchild.
All medium duty cavity raised floor 2 1
74% Concrete pre-cast 25% Concrete in-situ 1% Metals (Ferrous)
No component specific wastage rate so based on wastage rates for individual materials, which assumes that medium duty means 5kN/m2 loading, 8m span, 150mm thick, 50mm screed, 0.5% rebar including A142 mesh in screed Source: "Economic Concrete Frame Elements", Goodchild.
PCC Slab 1 0 Concrete pre-cast Assumed to be a large, 100% pre-cast element which will yield little or no waste.
Screed 5 2.5 Screed Materials wastage rate for screed.
Upper floors, Concrete Pre Cast, Beam and Block Flooring 14 4
66% Bricks & Blocks 34% Concrete Pre-Cast
No component specific wastage rate so based on 66% of wastage rate for bricks and blocks and 34% of the wastage rate for pre-cast (1% at baseline and 0% good practice), in accordance with proportion of materials. This is based on an approximate estimation of the block roughly being twice the width of the beam. Defaults to the inert waste stream due to nature of materials.
Wooden Floor
Flooring grade chipboard, plain or moisture resistant 10(1) 5(0) Timber (Processed)
Material wastage rate for processed timber. For MMC, assumes that flooring would be incorporated into a volumetric system with no off-cut waste. Waste would only arise through damage once installed or rework which would be rare.
OSB Board 10(1) 5(0) Timber (Processed)
Material wastage rate for processed timber. For MMC, assumes that flooring would be incorporated into a volumetric system with no off-cut waste. Waste would only arise through damage once installed or rework which would be rare.
Timber joists 10(1) 5(0) Timber (Unprocessed)
Material wastage rate for processed timber. For MMC, assumes that flooring would be incorporated into a volumetric system with no off-cut waste. Waste would only arise through damage once installed or rework which would be rare.
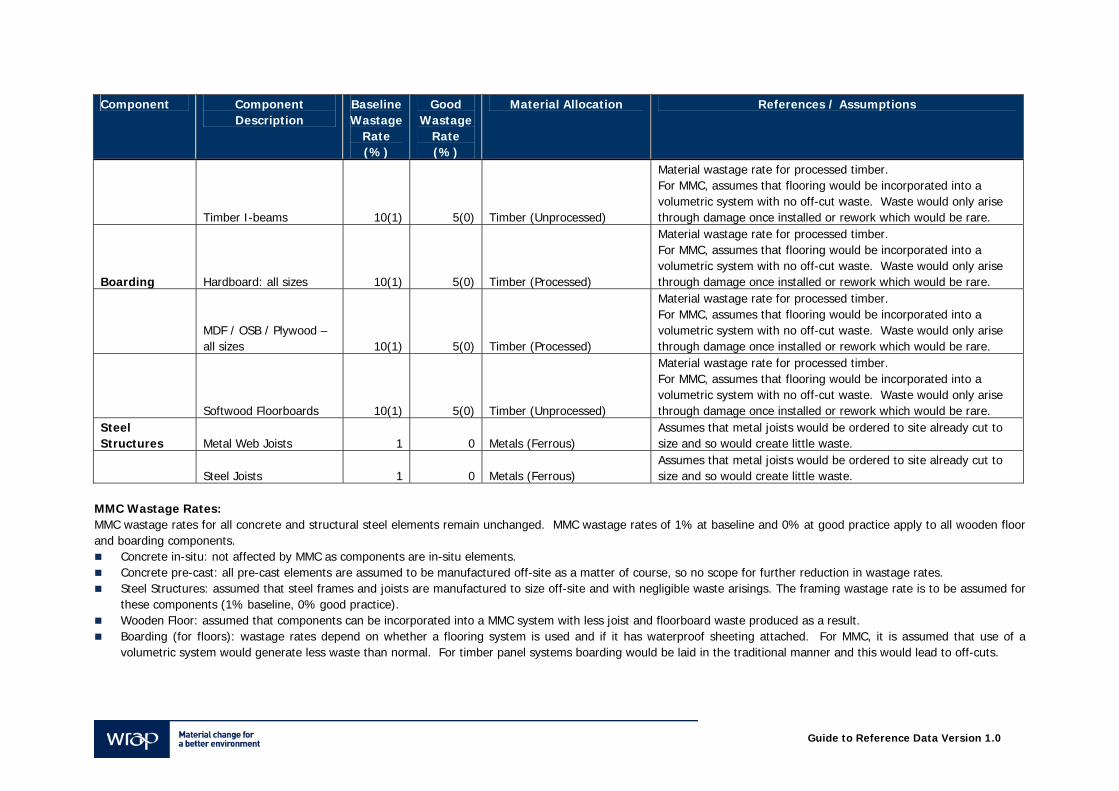
Guide to Reference Data Version 1.0
Component Component Description
Baseline Wastage
Rate (%)
Good Wastage
Rate (%)
Material Allocation References / Assumptions
Timber I-beams 10(1) 5(0) Timber (Unprocessed)
Material wastage rate for processed timber. For MMC, assumes that flooring would be incorporated into a volumetric system with no off-cut waste. Waste would only arise through damage once installed or rework which would be rare.
Boarding Hardboard: all sizes 10(1) 5(0) Timber (Processed)
Material wastage rate for processed timber. For MMC, assumes that flooring would be incorporated into a volumetric system with no off-cut waste. Waste would only arise through damage once installed or rework which would be rare.
MDF / OSB / Plywood – all sizes 10(1) 5(0) Timber (Processed)
Material wastage rate for processed timber. For MMC, assumes that flooring would be incorporated into a volumetric system with no off-cut waste. Waste would only arise through damage once installed or rework which would be rare.
Softwood Floorboards 10(1) 5(0) Timber (Unprocessed)
Material wastage rate for processed timber. For MMC, assumes that flooring would be incorporated into a volumetric system with no off-cut waste. Waste would only arise through damage once installed or rework which would be rare.
Steel Structures Metal Web Joists 1 0 Metals (Ferrous)
Assumes that metal joists would be ordered to site already cut to size and so would create little waste.
Steel Joists 1 0 Metals (Ferrous) Assumes that metal joists would be ordered to site already cut to size and so would create little waste.
MMC Wastage Rates: MMC wastage rates for all concrete and structural steel elements remain unchanged. MMC wastage rates of 1% at baseline and 0% at good practice apply to all wooden floor and boarding components.
Concrete in-situ: not affected by MMC as components are in-situ elements. Concrete pre-cast: all pre-cast elements are assumed to be manufactured off-site as a matter of course, so no scope for further reduction in wastage rates. Steel Structures: assumed that steel frames and joists are manufactured to size off-site and with negligible waste arisings. The framing wastage rate is to be assumed for
these components (1% baseline, 0% good practice). Wooden Floor: assumed that components can be incorporated into a MMC system with less joist and floorboard waste produced as a result. Boarding (for floors): wastage rates depend on whether a flooring system is used and if it has waterproof sheeting attached. For MMC, it is assumed that use of a
volumetric system would generate less waste than normal. For timber panel systems boarding would be laid in the traditional manner and this would lead to off-cuts.
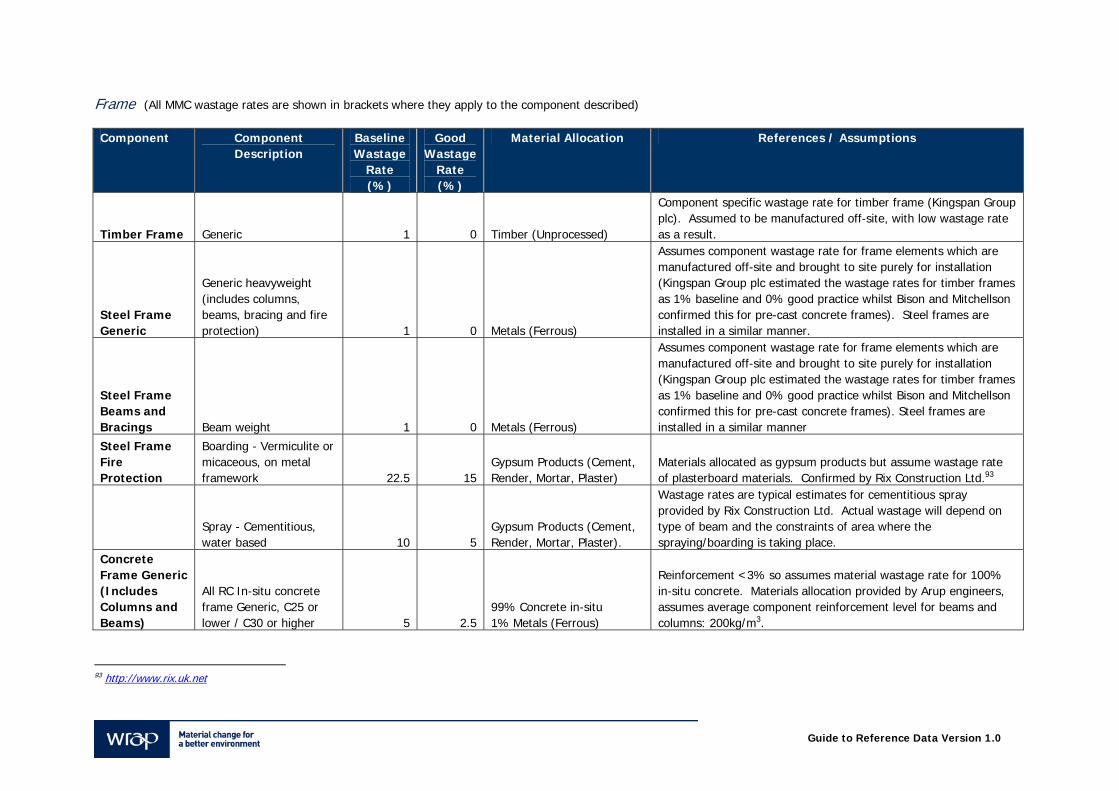
Guide to Reference Data Version 1.0
Frame (All MMC wastage rates are shown in brackets where they apply to the component described) Component Component
Description Baseline Wastage
Rate (%)
Good Wastage
Rate (%)
Material Allocation References / Assumptions
Timber Frame Generic 1 0 Timber (Unprocessed)
Component specific wastage rate for timber frame (Kingspan Group plc). Assumed to be manufactured off-site, with low wastage rate as a result.
Steel Frame Generic
Generic heavyweight (includes columns, beams, bracing and fire protection) 1 0 Metals (Ferrous)
Assumes component wastage rate for frame elements which are manufactured off-site and brought to site purely for installation (Kingspan Group plc estimated the wastage rates for timber frames as 1% baseline and 0% good practice whilst Bison and Mitchellson confirmed this for pre-cast concrete frames). Steel frames are installed in a similar manner.
Steel Frame Beams and Bracings Beam weight 1 0 Metals (Ferrous)
Assumes component wastage rate for frame elements which are manufactured off-site and brought to site purely for installation (Kingspan Group plc estimated the wastage rates for timber frames as 1% baseline and 0% good practice whilst Bison and Mitchellson confirmed this for pre-cast concrete frames). Steel frames are installed in a similar manner
Steel Frame Fire Protection
Boarding - Vermiculite or micaceous, on metal framework 22.5 15
Gypsum Products (Cement, Render, Mortar, Plaster)
Materials allocated as gypsum products but assume wastage rate of plasterboard materials. Confirmed by Rix Construction Ltd.93
Spray - Cementitious, water based 10 5
Gypsum Products (Cement, Render, Mortar, Plaster).
Wastage rates are typical estimates for cementitious spray provided by Rix Construction Ltd. Actual wastage will depend on type of beam and the constraints of area where the spraying/boarding is taking place.
Concrete Frame Generic (Includes Columns and Beams)
All RC In-situ concrete frame Generic, C25 or lower / C30 or higher 5 2.5
99% Concrete in-situ 1% Metals (Ferrous)
Reinforcement <3% so assumes material wastage rate for 100% in-situ concrete. Materials allocation provided by Arup engineers, assumes average component reinforcement level for beams and columns: 200kg/m3.
93 http://www.rix.uk.net
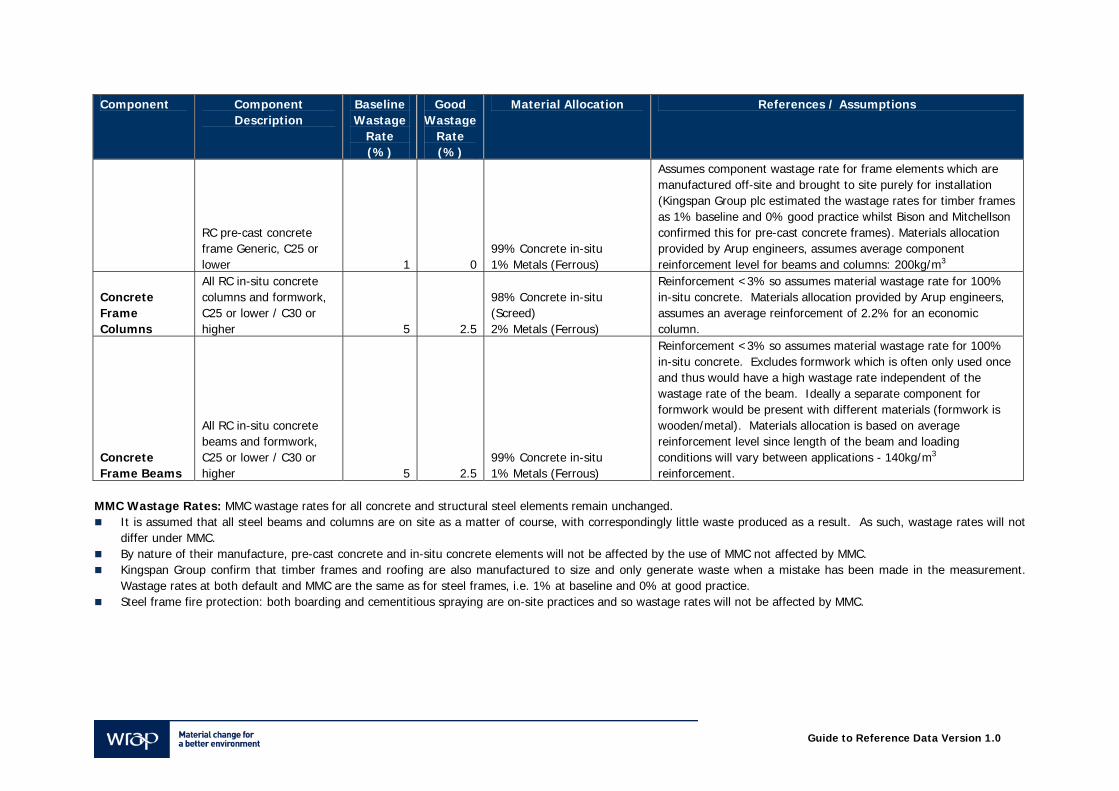
Guide to Reference Data Version 1.0
Component Component Description
Baseline Wastage
Rate (%)
Good Wastage
Rate (%)
Material Allocation References / Assumptions
RC pre-cast concrete frame Generic, C25 or lower 1 0
99% Concrete in-situ 1% Metals (Ferrous)
Assumes component wastage rate for frame elements which are manufactured off-site and brought to site purely for installation (Kingspan Group plc estimated the wastage rates for timber frames as 1% baseline and 0% good practice whilst Bison and Mitchellson confirmed this for pre-cast concrete frames). Materials allocation provided by Arup engineers, assumes average component reinforcement level for beams and columns: 200kg/m3
Concrete Frame Columns
All RC in-situ concrete columns and formwork, C25 or lower / C30 or higher 5 2.5
98% Concrete in-situ (Screed) 2% Metals (Ferrous)
Reinforcement <3% so assumes material wastage rate for 100% in-situ concrete. Materials allocation provided by Arup engineers, assumes an average reinforcement of 2.2% for an economic column.
Concrete Frame Beams
All RC in-situ concrete beams and formwork, C25 or lower / C30 or higher 5 2.5
99% Concrete in-situ 1% Metals (Ferrous)
Reinforcement <3% so assumes material wastage rate for 100% in-situ concrete. Excludes formwork which is often only used once and thus would have a high wastage rate independent of the wastage rate of the beam. Ideally a separate component for formwork would be present with different materials (formwork is wooden/metal). Materials allocation is based on average reinforcement level since length of the beam and loading conditions will vary between applications - 140kg/m3 reinforcement.
MMC Wastage Rates: MMC wastage rates for all concrete and structural steel elements remain unchanged.
It is assumed that all steel beams and columns are on site as a matter of course, with correspondingly little waste produced as a result. As such, wastage rates will not differ under MMC.
By nature of their manufacture, pre-cast concrete and in-situ concrete elements will not be affected by the use of MMC not affected by MMC. Kingspan Group confirm that timber frames and roofing are also manufactured to size and only generate waste when a mistake has been made in the measurement.
Wastage rates at both default and MMC are the same as for steel frames, i.e. 1% at baseline and 0% at good practice. Steel frame fire protection: both boarding and cementitious spraying are on-site practices and so wastage rates will not be affected by MMC.
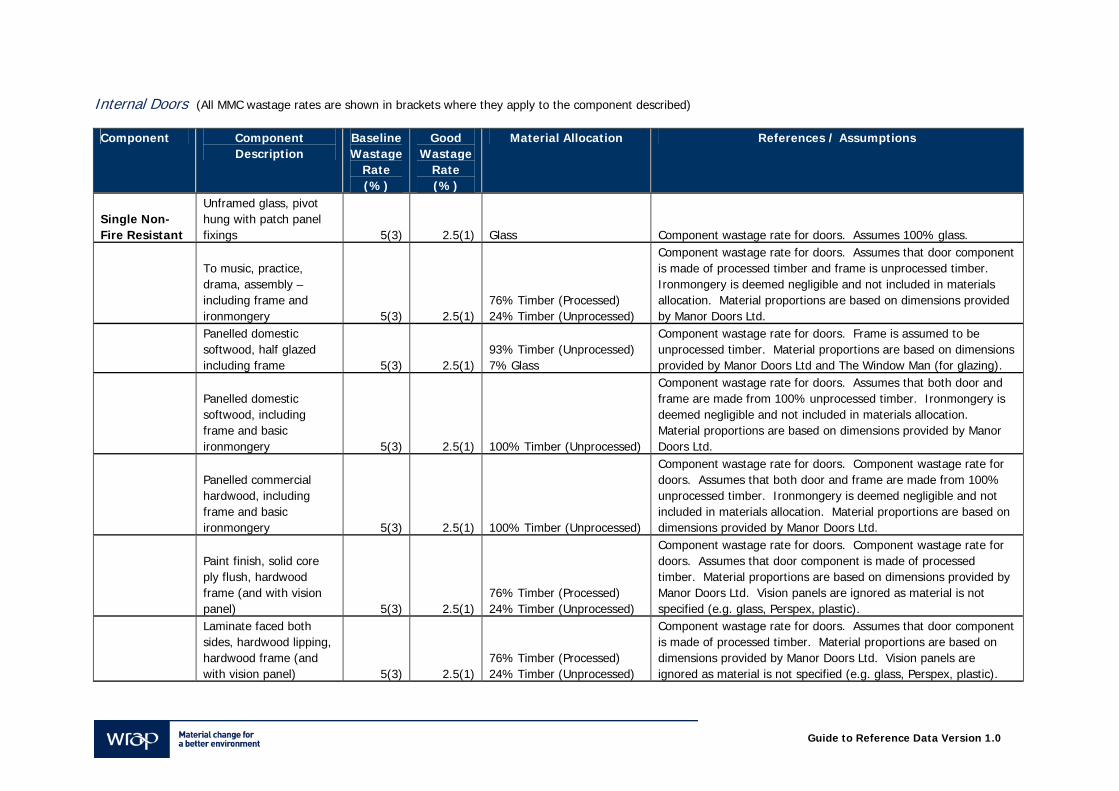
Guide to Reference Data Version 1.0
Internal Doors (All MMC wastage rates are shown in brackets where they apply to the component described) Component Component
Description Baseline Wastage
Rate (%)
Good Wastage
Rate (%)
Material Allocation References / Assumptions
Single Non-Fire Resistant
Unframed glass, pivot hung with patch panel fixings 5(3) 2.5(1) Glass Component wastage rate for doors. Assumes 100% glass.
To music, practice, drama, assembly – including frame and ironmongery 5(3) 2.5(1)
76% Timber (Processed) 24% Timber (Unprocessed)
Component wastage rate for doors. Assumes that door component is made of processed timber and frame is unprocessed timber. Ironmongery is deemed negligible and not included in materials allocation. Material proportions are based on dimensions provided by Manor Doors Ltd.
Panelled domestic softwood, half glazed including frame 5(3) 2.5(1)
93% Timber (Unprocessed) 7% Glass
Component wastage rate for doors. Frame is assumed to be unprocessed timber. Material proportions are based on dimensions provided by Manor Doors Ltd and The Window Man (for glazing).
Panelled domestic softwood, including frame and basic ironmongery 5(3) 2.5(1) 100% Timber (Unprocessed)
Component wastage rate for doors. Assumes that both door and frame are made from 100% unprocessed timber. Ironmongery is deemed negligible and not included in materials allocation. Material proportions are based on dimensions provided by Manor Doors Ltd.
Panelled commercial hardwood, including frame and basic ironmongery 5(3) 2.5(1) 100% Timber (Unprocessed)
Component wastage rate for doors. Component wastage rate for doors. Assumes that both door and frame are made from 100% unprocessed timber. Ironmongery is deemed negligible and not included in materials allocation. Material proportions are based on dimensions provided by Manor Doors Ltd.
Paint finish, solid core ply flush, hardwood frame (and with vision panel) 5(3) 2.5(1)
76% Timber (Processed) 24% Timber (Unprocessed)
Component wastage rate for doors. Component wastage rate for doors. Assumes that door component is made of processed timber. Material proportions are based on dimensions provided by Manor Doors Ltd. Vision panels are ignored as material is not specified (e.g. glass, Perspex, plastic).
Laminate faced both sides, hardwood lipping, hardwood frame (and with vision panel) 5(3) 2.5(1)
76% Timber (Processed) 24% Timber (Unprocessed)
Component wastage rate for doors. Assumes that door component is made of processed timber. Material proportions are based on dimensions provided by Manor Doors Ltd. Vision panels are ignored as material is not specified (e.g. glass, Perspex, plastic).
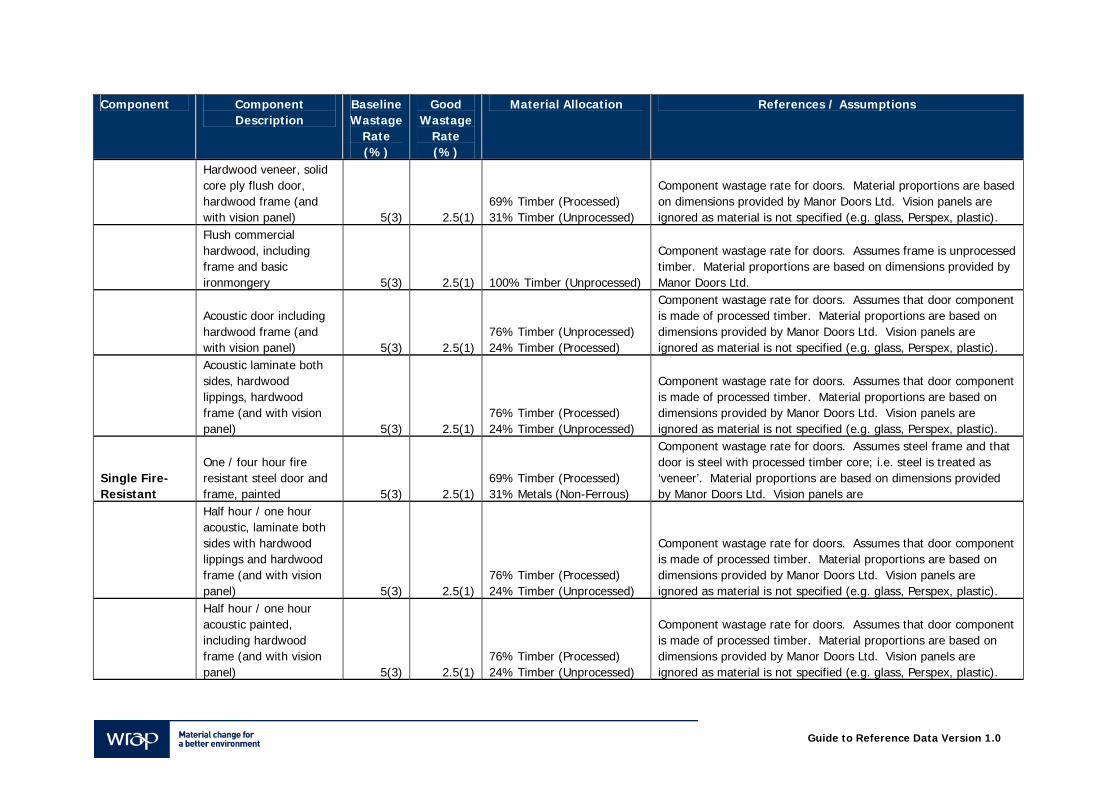
Guide to Reference Data Version 1.0
Component Component Description
Baseline Wastage
Rate (%)
Good Wastage
Rate (%)
Material Allocation References / Assumptions
Hardwood veneer, solid core ply flush door, hardwood frame (and with vision panel) 5(3) 2.5(1)
69% Timber (Processed) 31% Timber (Unprocessed)
Component wastage rate for doors. Material proportions are based on dimensions provided by Manor Doors Ltd. Vision panels are ignored as material is not specified (e.g. glass, Perspex, plastic).
Flush commercial hardwood, including frame and basic ironmongery 5(3) 2.5(1) 100% Timber (Unprocessed)
Component wastage rate for doors. Assumes frame is unprocessed timber. Material proportions are based on dimensions provided by Manor Doors Ltd.
Acoustic door including hardwood frame (and with vision panel) 5(3) 2.5(1)
76% Timber (Unprocessed) 24% Timber (Processed)
Component wastage rate for doors. Assumes that door component is made of processed timber. Material proportions are based on dimensions provided by Manor Doors Ltd. Vision panels are ignored as material is not specified (e.g. glass, Perspex, plastic).
Acoustic laminate both sides, hardwood lippings, hardwood frame (and with vision panel) 5(3) 2.5(1)
76% Timber (Processed) 24% Timber (Unprocessed)
Component wastage rate for doors. Assumes that door component is made of processed timber. Material proportions are based on dimensions provided by Manor Doors Ltd. Vision panels are ignored as material is not specified (e.g. glass, Perspex, plastic).
Single Fire-Resistant
One / four hour fire resistant steel door and frame, painted 5(3) 2.5(1)
69% Timber (Processed) 31% Metals (Non-Ferrous)
Component wastage rate for doors. Assumes steel frame and that door is steel with processed timber core; i.e. steel is treated as ‘veneer’. Material proportions are based on dimensions provided by Manor Doors Ltd. Vision panels are
Half hour / one hour acoustic, laminate both sides with hardwood lippings and hardwood frame (and with vision panel) 5(3) 2.5(1)
76% Timber (Processed) 24% Timber (Unprocessed)
Component wastage rate for doors. Assumes that door component is made of processed timber. Material proportions are based on dimensions provided by Manor Doors Ltd. Vision panels are ignored as material is not specified (e.g. glass, Perspex, plastic).
Half hour / one hour acoustic painted, including hardwood frame (and with vision panel) 5(3) 2.5(1)
76% Timber (Processed) 24% Timber (Unprocessed)
Component wastage rate for doors. Assumes that door component is made of processed timber. Material proportions are based on dimensions provided by Manor Doors Ltd. Vision panels are ignored as material is not specified (e.g. glass, Perspex, plastic).
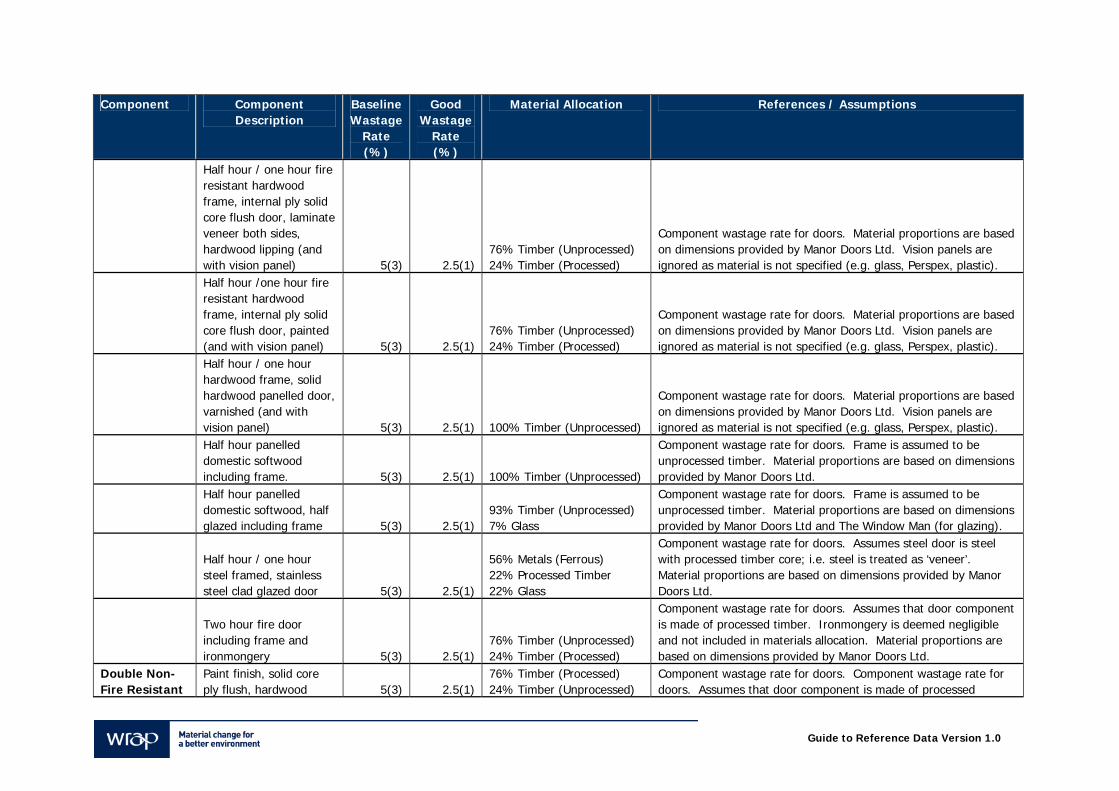
Guide to Reference Data Version 1.0
Component Component Description
Baseline Wastage
Rate (%)
Good Wastage
Rate (%)
Material Allocation References / Assumptions
Half hour / one hour fire resistant hardwood frame, internal ply solid core flush door, laminate veneer both sides, hardwood lipping (and with vision panel) 5(3) 2.5(1)
76% Timber (Unprocessed) 24% Timber (Processed)
Component wastage rate for doors. Material proportions are based on dimensions provided by Manor Doors Ltd. Vision panels are ignored as material is not specified (e.g. glass, Perspex, plastic).
Half hour /one hour fire resistant hardwood frame, internal ply solid core flush door, painted (and with vision panel) 5(3) 2.5(1)
76% Timber (Unprocessed) 24% Timber (Processed)
Component wastage rate for doors. Material proportions are based on dimensions provided by Manor Doors Ltd. Vision panels are ignored as material is not specified (e.g. glass, Perspex, plastic).
Half hour / one hour hardwood frame, solid hardwood panelled door, varnished (and with vision panel) 5(3) 2.5(1) 100% Timber (Unprocessed)
Component wastage rate for doors. Material proportions are based on dimensions provided by Manor Doors Ltd. Vision panels are ignored as material is not specified (e.g. glass, Perspex, plastic).
Half hour panelled domestic softwood including frame. 5(3) 2.5(1) 100% Timber (Unprocessed)
Component wastage rate for doors. Frame is assumed to be unprocessed timber. Material proportions are based on dimensions provided by Manor Doors Ltd.
Half hour panelled domestic softwood, half glazed including frame 5(3) 2.5(1)
93% Timber (Unprocessed) 7% Glass
Component wastage rate for doors. Frame is assumed to be unprocessed timber. Material proportions are based on dimensions provided by Manor Doors Ltd and The Window Man (for glazing).
Half hour / one hour steel framed, stainless steel clad glazed door 5(3) 2.5(1)
56% Metals (Ferrous) 22% Processed Timber 22% Glass
Component wastage rate for doors. Assumes steel door is steel with processed timber core; i.e. steel is treated as ‘veneer’. Material proportions are based on dimensions provided by Manor Doors Ltd.
Two hour fire door including frame and ironmongery 5(3) 2.5(1)
76% Timber (Unprocessed) 24% Timber (Processed)
Component wastage rate for doors. Assumes that door component is made of processed timber. Ironmongery is deemed negligible and not included in materials allocation. Material proportions are based on dimensions provided by Manor Doors Ltd.
Double Non-Fire Resistant
Paint finish, solid core ply flush, hardwood 5(3) 2.5(1)
76% Timber (Processed) 24% Timber (Unprocessed)
Component wastage rate for doors. Component wastage rate for doors. Assumes that door component is made of processed
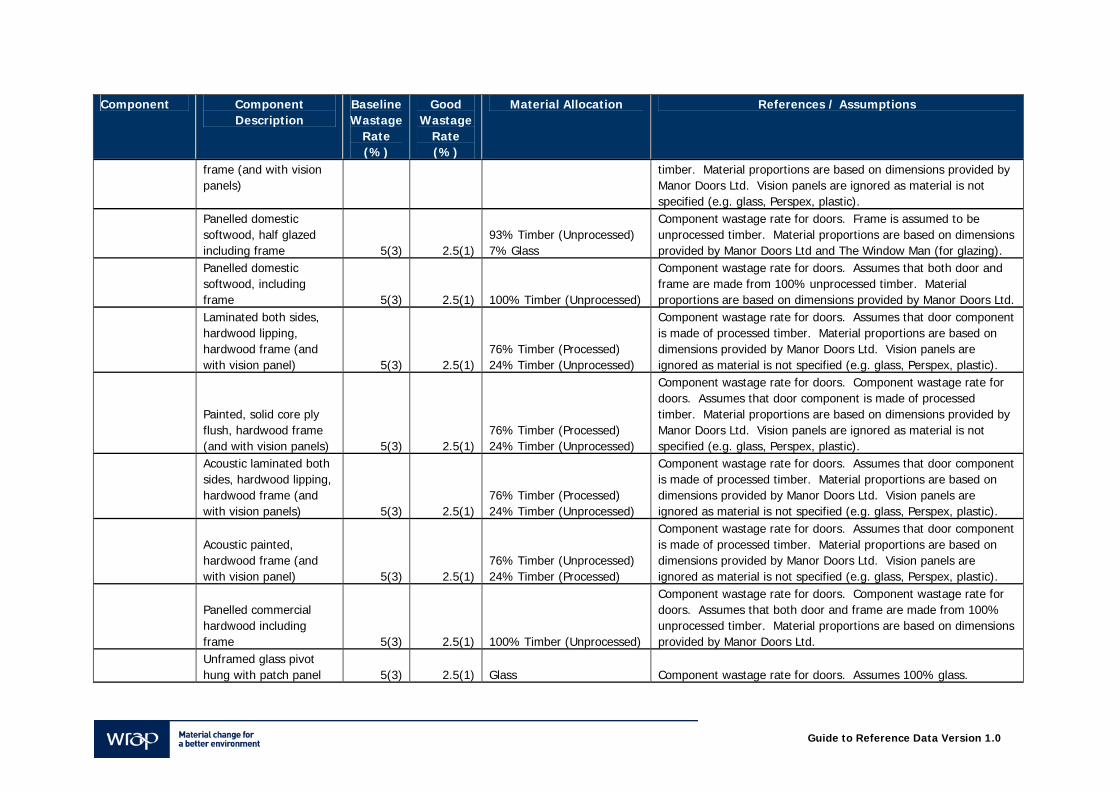
Guide to Reference Data Version 1.0
Component Component Description
Baseline Wastage
Rate (%)
Good Wastage
Rate (%)
Material Allocation References / Assumptions
frame (and with vision panels)
timber. Material proportions are based on dimensions provided by Manor Doors Ltd. Vision panels are ignored as material is not specified (e.g. glass, Perspex, plastic).
Panelled domestic softwood, half glazed including frame 5(3) 2.5(1)
93% Timber (Unprocessed) 7% Glass
Component wastage rate for doors. Frame is assumed to be unprocessed timber. Material proportions are based on dimensions provided by Manor Doors Ltd and The Window Man (for glazing).
Panelled domestic softwood, including frame 5(3) 2.5(1) 100% Timber (Unprocessed)
Component wastage rate for doors. Assumes that both door and frame are made from 100% unprocessed timber. Material proportions are based on dimensions provided by Manor Doors Ltd.
Laminated both sides, hardwood lipping, hardwood frame (and with vision panel) 5(3) 2.5(1)
76% Timber (Processed) 24% Timber (Unprocessed)
Component wastage rate for doors. Assumes that door component is made of processed timber. Material proportions are based on dimensions provided by Manor Doors Ltd. Vision panels are ignored as material is not specified (e.g. glass, Perspex, plastic).
Painted, solid core ply flush, hardwood frame (and with vision panels) 5(3) 2.5(1)
76% Timber (Processed) 24% Timber (Unprocessed)
Component wastage rate for doors. Component wastage rate for doors. Assumes that door component is made of processed timber. Material proportions are based on dimensions provided by Manor Doors Ltd. Vision panels are ignored as material is not specified (e.g. glass, Perspex, plastic).
Acoustic laminated both sides, hardwood lipping, hardwood frame (and with vision panels) 5(3) 2.5(1)
76% Timber (Processed) 24% Timber (Unprocessed)
Component wastage rate for doors. Assumes that door component is made of processed timber. Material proportions are based on dimensions provided by Manor Doors Ltd. Vision panels are ignored as material is not specified (e.g. glass, Perspex, plastic).
Acoustic painted, hardwood frame (and with vision panel) 5(3) 2.5(1)
76% Timber (Unprocessed) 24% Timber (Processed)
Component wastage rate for doors. Assumes that door component is made of processed timber. Material proportions are based on dimensions provided by Manor Doors Ltd. Vision panels are ignored as material is not specified (e.g. glass, Perspex, plastic).
Panelled commercial hardwood including frame 5(3) 2.5(1) 100% Timber (Unprocessed)
Component wastage rate for doors. Component wastage rate for doors. Assumes that both door and frame are made from 100% unprocessed timber. Material proportions are based on dimensions provided by Manor Doors Ltd.
Unframed glass pivot hung with patch panel 5(3) 2.5(1) Glass Component wastage rate for doors. Assumes 100% glass.
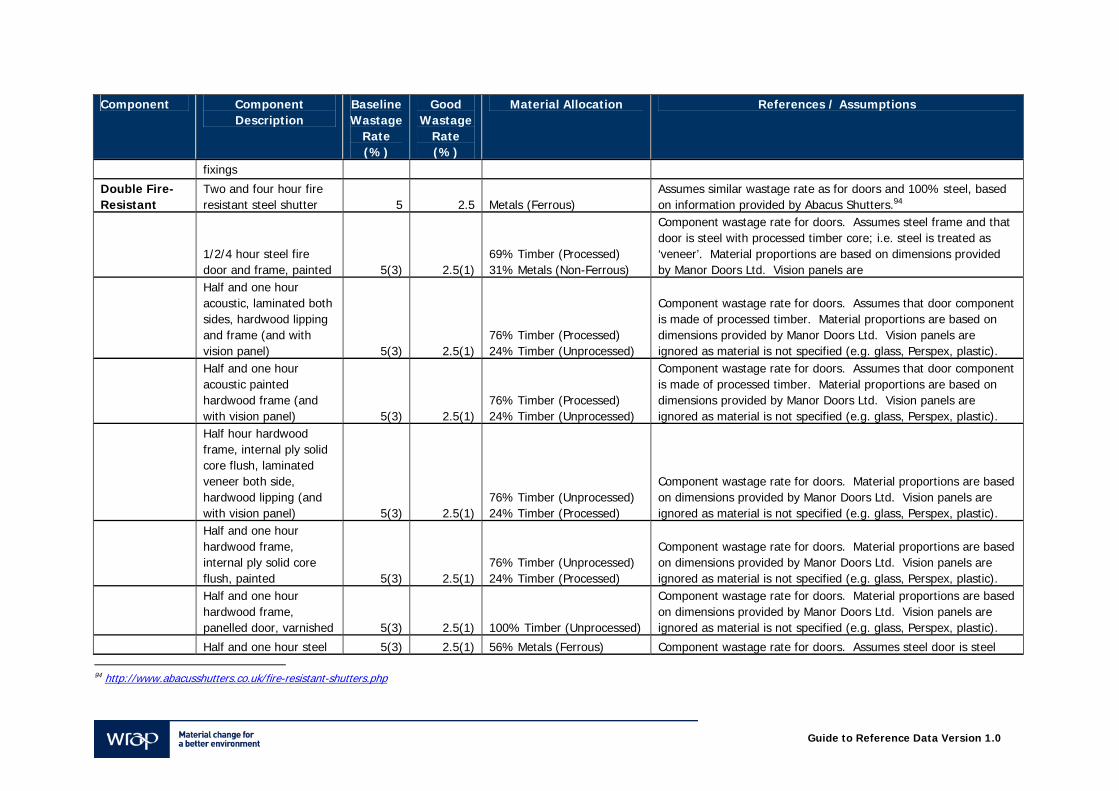
Guide to Reference Data Version 1.0
Component Component Description
Baseline Wastage
Rate (%)
Good Wastage
Rate (%)
Material Allocation References / Assumptions
fixings
Double Fire-Resistant
Two and four hour fire resistant steel shutter 5 2.5 Metals (Ferrous)
Assumes similar wastage rate as for doors and 100% steel, based on information provided by Abacus Shutters.94
1/2/4 hour steel fire door and frame, painted 5(3) 2.5(1)
69% Timber (Processed) 31% Metals (Non-Ferrous)
Component wastage rate for doors. Assumes steel frame and that door is steel with processed timber core; i.e. steel is treated as ‘veneer’. Material proportions are based on dimensions provided by Manor Doors Ltd. Vision panels are
Half and one hour acoustic, laminated both sides, hardwood lipping and frame (and with vision panel) 5(3) 2.5(1)
76% Timber (Processed) 24% Timber (Unprocessed)
Component wastage rate for doors. Assumes that door component is made of processed timber. Material proportions are based on dimensions provided by Manor Doors Ltd. Vision panels are ignored as material is not specified (e.g. glass, Perspex, plastic).
Half and one hour acoustic painted hardwood frame (and with vision panel) 5(3) 2.5(1)
76% Timber (Processed) 24% Timber (Unprocessed)
Component wastage rate for doors. Assumes that door component is made of processed timber. Material proportions are based on dimensions provided by Manor Doors Ltd. Vision panels are ignored as material is not specified (e.g. glass, Perspex, plastic).
Half hour hardwood frame, internal ply solid core flush, laminated veneer both side, hardwood lipping (and with vision panel) 5(3) 2.5(1)
76% Timber (Unprocessed) 24% Timber (Processed)
Component wastage rate for doors. Material proportions are based on dimensions provided by Manor Doors Ltd. Vision panels are ignored as material is not specified (e.g. glass, Perspex, plastic).
Half and one hour hardwood frame, internal ply solid core flush, painted 5(3) 2.5(1)
76% Timber (Unprocessed) 24% Timber (Processed)
Component wastage rate for doors. Material proportions are based on dimensions provided by Manor Doors Ltd. Vision panels are ignored as material is not specified (e.g. glass, Perspex, plastic).
Half and one hour hardwood frame, panelled door, varnished 5(3) 2.5(1) 100% Timber (Unprocessed)
Component wastage rate for doors. Material proportions are based on dimensions provided by Manor Doors Ltd. Vision panels are ignored as material is not specified (e.g. glass, Perspex, plastic).
Half and one hour steel 5(3) 2.5(1) 56% Metals (Ferrous) Component wastage rate for doors. Assumes steel door is steel 94 http://www.abacusshutters.co.uk/fire-resistant-shutters.php
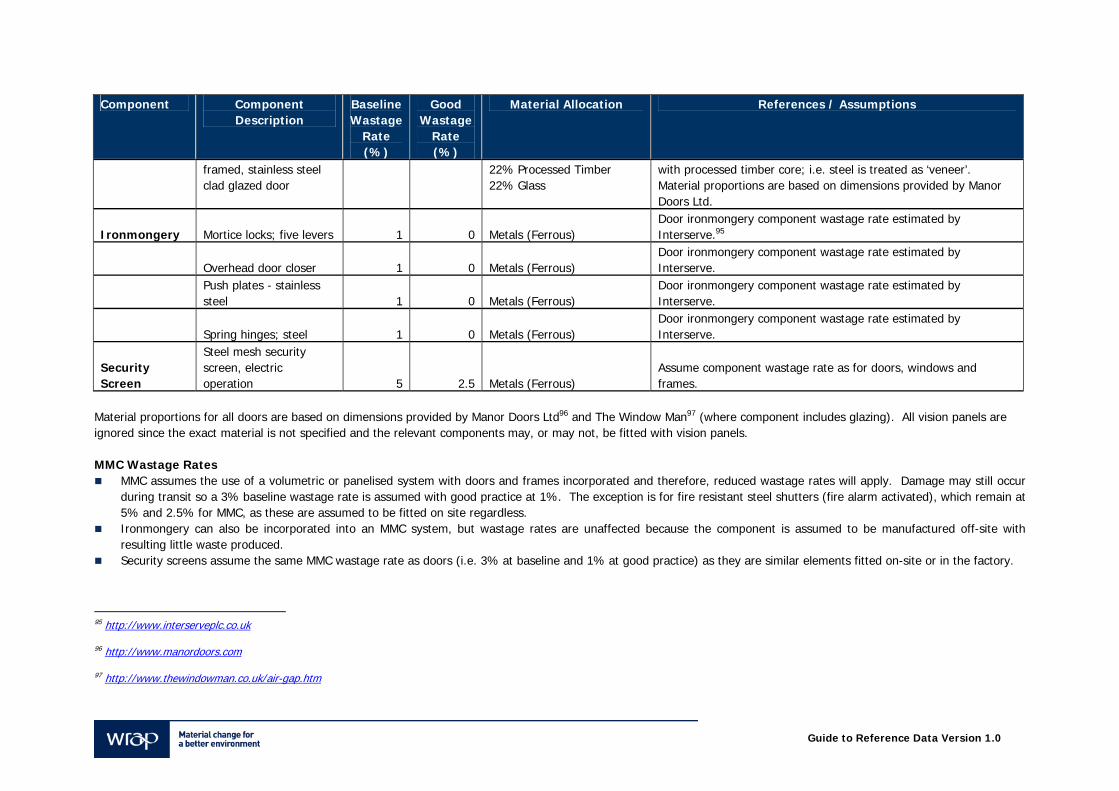
Guide to Reference Data Version 1.0
Component Component Description
Baseline Wastage
Rate (%)
Good Wastage
Rate (%)
Material Allocation References / Assumptions
framed, stainless steel clad glazed door
22% Processed Timber 22% Glass
with processed timber core; i.e. steel is treated as ‘veneer’. Material proportions are based on dimensions provided by Manor Doors Ltd.
Ironmongery Mortice locks; five levers 1 0 Metals (Ferrous) Door ironmongery component wastage rate estimated by Interserve.95
Overhead door closer 1 0 Metals (Ferrous) Door ironmongery component wastage rate estimated by Interserve.
Push plates - stainless steel 1 0 Metals (Ferrous)
Door ironmongery component wastage rate estimated by Interserve.
Spring hinges; steel 1 0 Metals (Ferrous) Door ironmongery component wastage rate estimated by Interserve.
Security Screen
Steel mesh security screen, electric operation 5 2.5 Metals (Ferrous)
Assume component wastage rate as for doors, windows and frames.
Material proportions for all doors are based on dimensions provided by Manor Doors Ltd96 and The Window Man97 (where component includes glazing). All vision panels are ignored since the exact material is not specified and the relevant components may, or may not, be fitted with vision panels. MMC Wastage Rates
MMC assumes the use of a volumetric or panelised system with doors and frames incorporated and therefore, reduced wastage rates will apply. Damage may still occur during transit so a 3% baseline wastage rate is assumed with good practice at 1%. The exception is for fire resistant steel shutters (fire alarm activated), which remain at 5% and 2.5% for MMC, as these are assumed to be fitted on site regardless.
Ironmongery can also be incorporated into an MMC system, but wastage rates are unaffected because the component is assumed to be manufactured off-site with resulting little waste produced.
Security screens assume the same MMC wastage rate as doors (i.e. 3% at baseline and 1% at good practice) as they are similar elements fitted on-site or in the factory.
95 http://www.interserveplc.co.uk
96 http://www.manordoors.com
97 http://www.thewindowman.co.uk/air-gap.htm
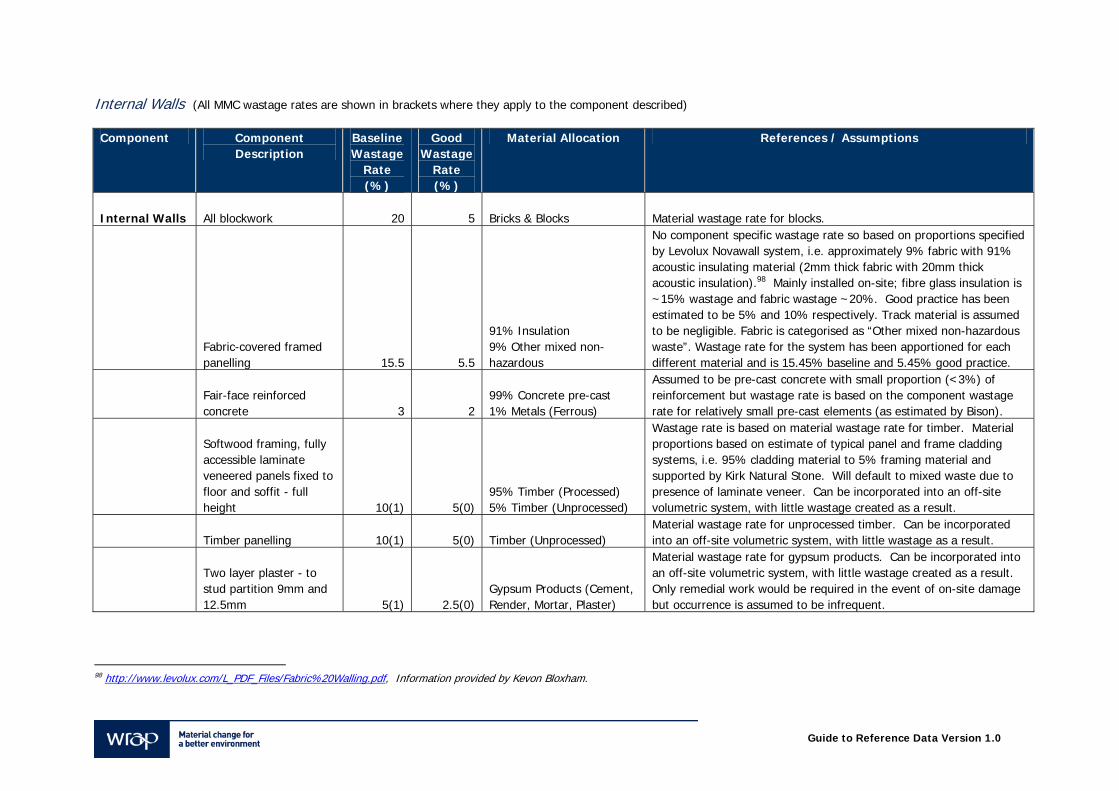
Guide to Reference Data Version 1.0
Internal Walls (All MMC wastage rates are shown in brackets where they apply to the component described) Component Component
Description Baseline Wastage
Rate (%)
Good Wastage
Rate (%)
Material Allocation References / Assumptions
Internal Walls All blockwork 20 5 Bricks & Blocks Material wastage rate for blocks.
Fabric-covered framed panelling 15.5 5.5
91% Insulation 9% Other mixed non-hazardous
No component specific wastage rate so based on proportions specified by Levolux Novawall system, i.e. approximately 9% fabric with 91% acoustic insulating material (2mm thick fabric with 20mm thick acoustic insulation).98 Mainly installed on-site; fibre glass insulation is ~15% wastage and fabric wastage ~20%. Good practice has been estimated to be 5% and 10% respectively. Track material is assumed to be negligible. Fabric is categorised as “Other mixed non-hazardous waste”. Wastage rate for the system has been apportioned for each different material and is 15.45% baseline and 5.45% good practice.
Fair-face reinforced concrete 3 2
99% Concrete pre-cast 1% Metals (Ferrous)
Assumed to be pre-cast concrete with small proportion (<3%) of reinforcement but wastage rate is based on the component wastage rate for relatively small pre-cast elements (as estimated by Bison).
Softwood framing, fully accessible laminate veneered panels fixed to floor and soffit - full height 10(1) 5(0)
95% Timber (Processed) 5% Timber (Unprocessed)
Wastage rate is based on material wastage rate for timber. Material proportions based on estimate of typical panel and frame cladding systems, i.e. 95% cladding material to 5% framing material and supported by Kirk Natural Stone. Will default to mixed waste due to presence of laminate veneer. Can be incorporated into an off-site volumetric system, with little wastage created as a result.
Timber panelling 10(1) 5(0) Timber (Unprocessed) Material wastage rate for unprocessed timber. Can be incorporated into an off-site volumetric system, with little wastage as a result.
Two layer plaster - to stud partition 9mm and 12.5mm 5(1) 2.5(0)
Gypsum Products (Cement, Render, Mortar, Plaster)
Material wastage rate for gypsum products. Can be incorporated into an off-site volumetric system, with little wastage created as a result. Only remedial work would be required in the event of on-site damage but occurrence is assumed to be infrequent.
98 http://www.levolux.com/L_PDF_Files/Fabric%20Walling.pdf, Information provided by Kevon Bloxham.
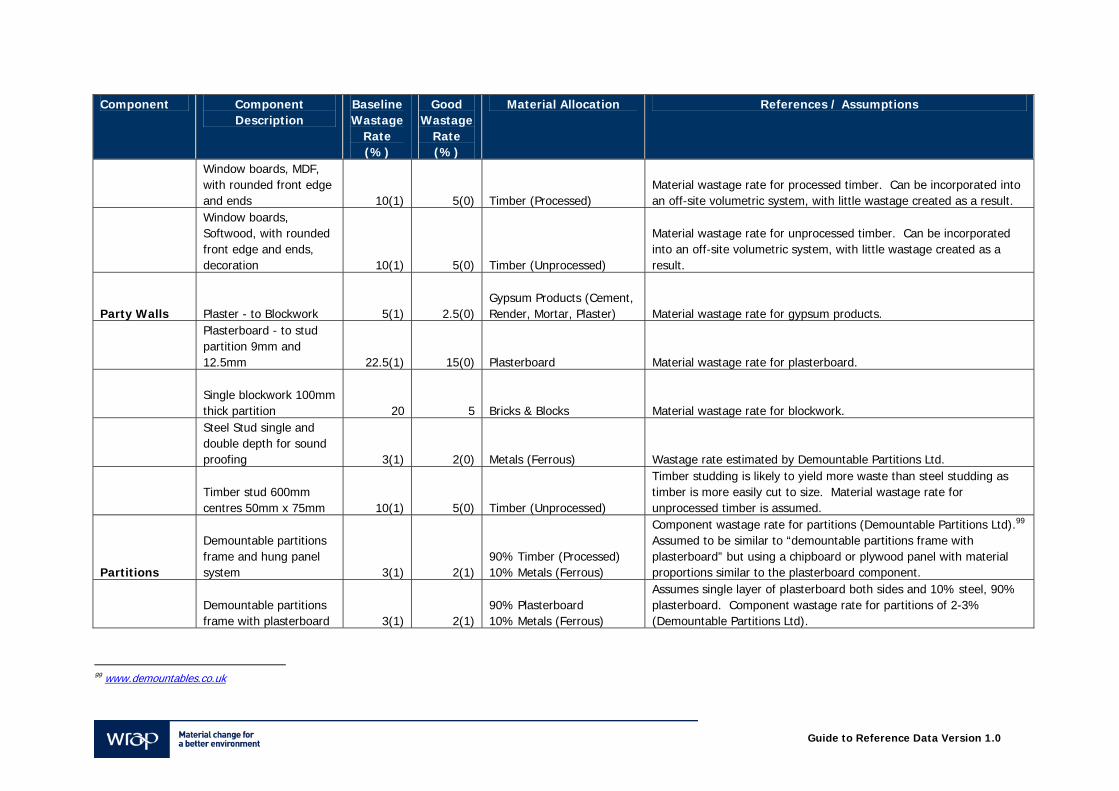
Guide to Reference Data Version 1.0
Component Component Description
Baseline Wastage
Rate (%)
Good Wastage
Rate (%)
Material Allocation References / Assumptions
Window boards, MDF, with rounded front edge and ends 10(1) 5(0) Timber (Processed)
Material wastage rate for processed timber. Can be incorporated into an off-site volumetric system, with little wastage created as a result.
Window boards, Softwood, with rounded front edge and ends, decoration 10(1) 5(0) Timber (Unprocessed)
Material wastage rate for unprocessed timber. Can be incorporated into an off-site volumetric system, with little wastage created as a result.
Party Walls Plaster - to Blockwork 5(1) 2.5(0) Gypsum Products (Cement, Render, Mortar, Plaster) Material wastage rate for gypsum products.
Plasterboard - to stud partition 9mm and 12.5mm 22.5(1) 15(0) Plasterboard Material wastage rate for plasterboard.
Single blockwork 100mm thick partition 20 5 Bricks & Blocks Material wastage rate for blockwork.
Steel Stud single and double depth for sound proofing 3(1) 2(0) Metals (Ferrous) Wastage rate estimated by Demountable Partitions Ltd.
Timber stud 600mm centres 50mm x 75mm 10(1) 5(0) Timber (Unprocessed)
Timber studding is likely to yield more waste than steel studding as timber is more easily cut to size. Material wastage rate for unprocessed timber is assumed.
Partitions
Demountable partitions frame and hung panel system 3(1) 2(1)
90% Timber (Processed) 10% Metals (Ferrous)
Component wastage rate for partitions (Demountable Partitions Ltd).99 Assumed to be similar to “demountable partitions frame with plasterboard” but using a chipboard or plywood panel with material proportions similar to the plasterboard component.
Demountable partitions frame with plasterboard 3(1) 2(1)
90% Plasterboard 10% Metals (Ferrous)
Assumes single layer of plasterboard both sides and 10% steel, 90% plasterboard. Component wastage rate for partitions of 2-3% (Demountable Partitions Ltd).
99 www.demountables.co.uk
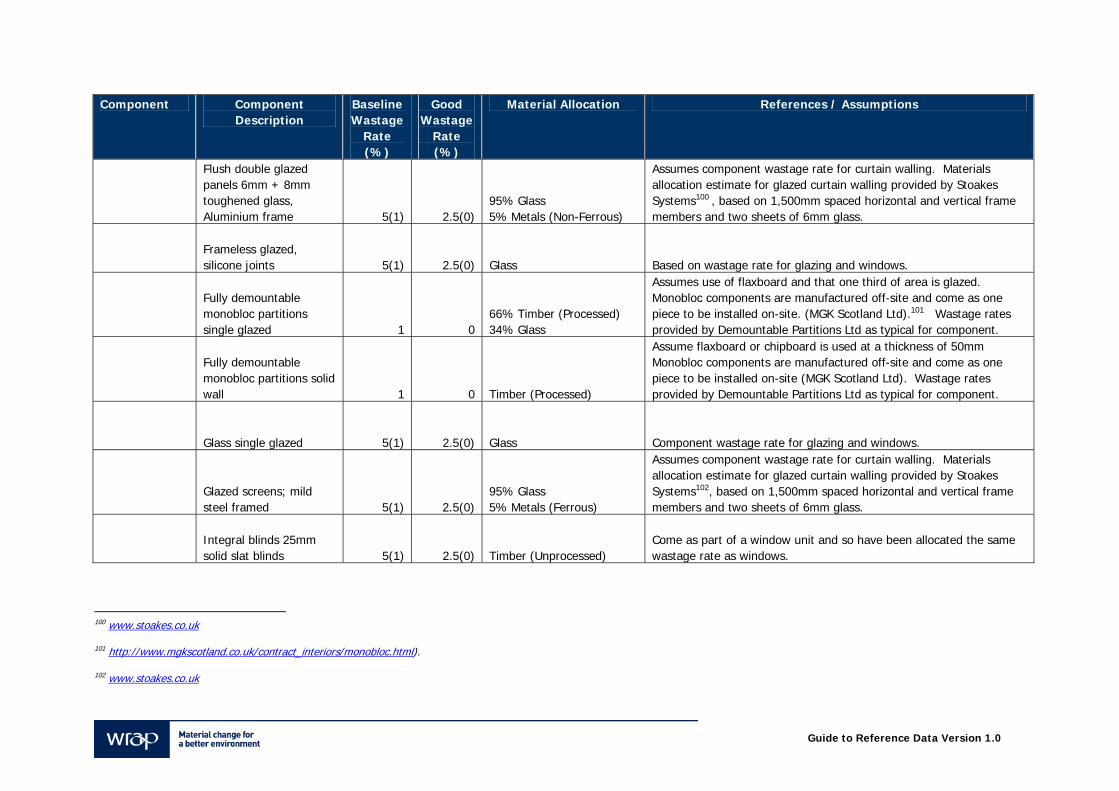
Guide to Reference Data Version 1.0
Component Component Description
Baseline Wastage
Rate (%)
Good Wastage
Rate (%)
Material Allocation References / Assumptions
Flush double glazed panels 6mm + 8mm toughened glass, Aluminium frame 5(1) 2.5(0)
95% Glass 5% Metals (Non-Ferrous)
Assumes component wastage rate for curtain walling. Materials allocation estimate for glazed curtain walling provided by Stoakes Systems100 , based on 1,500mm spaced horizontal and vertical frame members and two sheets of 6mm glass.
Frameless glazed, silicone joints 5(1) 2.5(0) Glass Based on wastage rate for glazing and windows.
Fully demountable monobloc partitions single glazed 1 0
66% Timber (Processed) 34% Glass
Assumes use of flaxboard and that one third of area is glazed. Monobloc components are manufactured off-site and come as one piece to be installed on-site. (MGK Scotland Ltd).101 Wastage rates provided by Demountable Partitions Ltd as typical for component.
Fully demountable monobloc partitions solid wall 1 0 Timber (Processed)
Assume flaxboard or chipboard is used at a thickness of 50mm Monobloc components are manufactured off-site and come as one piece to be installed on-site (MGK Scotland Ltd). Wastage rates provided by Demountable Partitions Ltd as typical for component.
Glass single glazed 5(1) 2.5(0) Glass Component wastage rate for glazing and windows.
Glazed screens; mild steel framed 5(1) 2.5(0)
95% Glass 5% Metals (Ferrous)
Assumes component wastage rate for curtain walling. Materials allocation estimate for glazed curtain walling provided by Stoakes Systems102, based on 1,500mm spaced horizontal and vertical frame members and two sheets of 6mm glass.
Integral blinds 25mm solid slat blinds 5(1) 2.5(0) Timber (Unprocessed)
Come as part of a window unit and so have been allocated the same wastage rate as windows.
100 www.stoakes.co.uk
101 http://www.mgkscotland.co.uk/contract_interiors/monobloc.html).
102 www.stoakes.co.uk
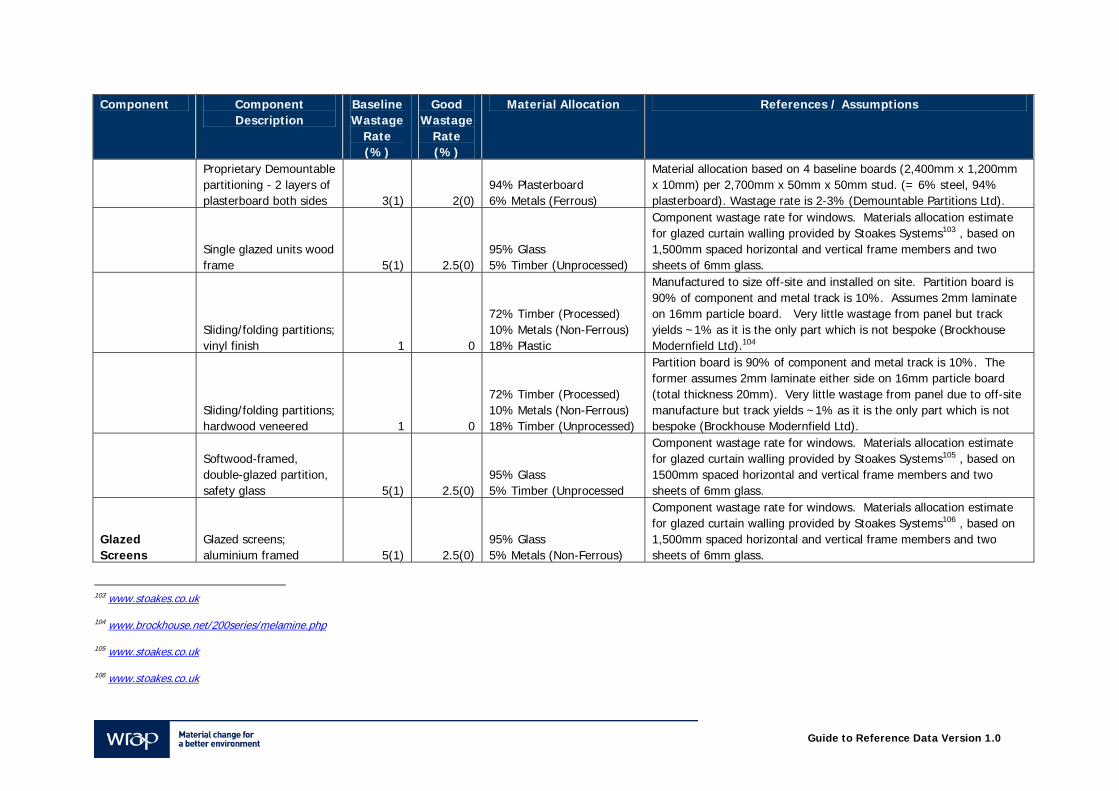
Guide to Reference Data Version 1.0
Component Component Description
Baseline Wastage
Rate (%)
Good Wastage
Rate (%)
Material Allocation References / Assumptions
Proprietary Demountable partitioning - 2 layers of plasterboard both sides 3(1) 2(0)
94% Plasterboard 6% Metals (Ferrous)
Material allocation based on 4 baseline boards (2,400mm x 1,200mm x 10mm) per 2,700mm x 50mm x 50mm stud. (= 6% steel, 94% plasterboard). Wastage rate is 2-3% (Demountable Partitions Ltd).
Single glazed units wood frame 5(1) 2.5(0)
95% Glass 5% Timber (Unprocessed)
Component wastage rate for windows. Materials allocation estimate for glazed curtain walling provided by Stoakes Systems103 , based on 1,500mm spaced horizontal and vertical frame members and two sheets of 6mm glass.
Sliding/folding partitions; vinyl finish 1 0
72% Timber (Processed) 10% Metals (Non-Ferrous) 18% Plastic
Manufactured to size off-site and installed on site. Partition board is 90% of component and metal track is 10%. Assumes 2mm laminate on 16mm particle board. Very little wastage from panel but track yields ~1% as it is the only part which is not bespoke (Brockhouse Modernfield Ltd).104
Sliding/folding partitions; hardwood veneered 1 0
72% Timber (Processed) 10% Metals (Non-Ferrous) 18% Timber (Unprocessed)
Partition board is 90% of component and metal track is 10%. The former assumes 2mm laminate either side on 16mm particle board (total thickness 20mm). Very little wastage from panel due to off-site manufacture but track yields ~1% as it is the only part which is not bespoke (Brockhouse Modernfield Ltd).
Softwood-framed, double-glazed partition, safety glass 5(1) 2.5(0)
95% Glass 5% Timber (Unprocessed
Component wastage rate for windows. Materials allocation estimate for glazed curtain walling provided by Stoakes Systems105 , based on 1500mm spaced horizontal and vertical frame members and two sheets of 6mm glass.
Glazed Screens
Glazed screens; aluminium framed 5(1) 2.5(0)
95% Glass 5% Metals (Non-Ferrous)
Component wastage rate for windows. Materials allocation estimate for glazed curtain walling provided by Stoakes Systems106 , based on 1,500mm spaced horizontal and vertical frame members and two sheets of 6mm glass.
103 www.stoakes.co.uk
104 www.brockhouse.net/200series/melamine.php
105 www.stoakes.co.uk
106 www.stoakes.co.uk
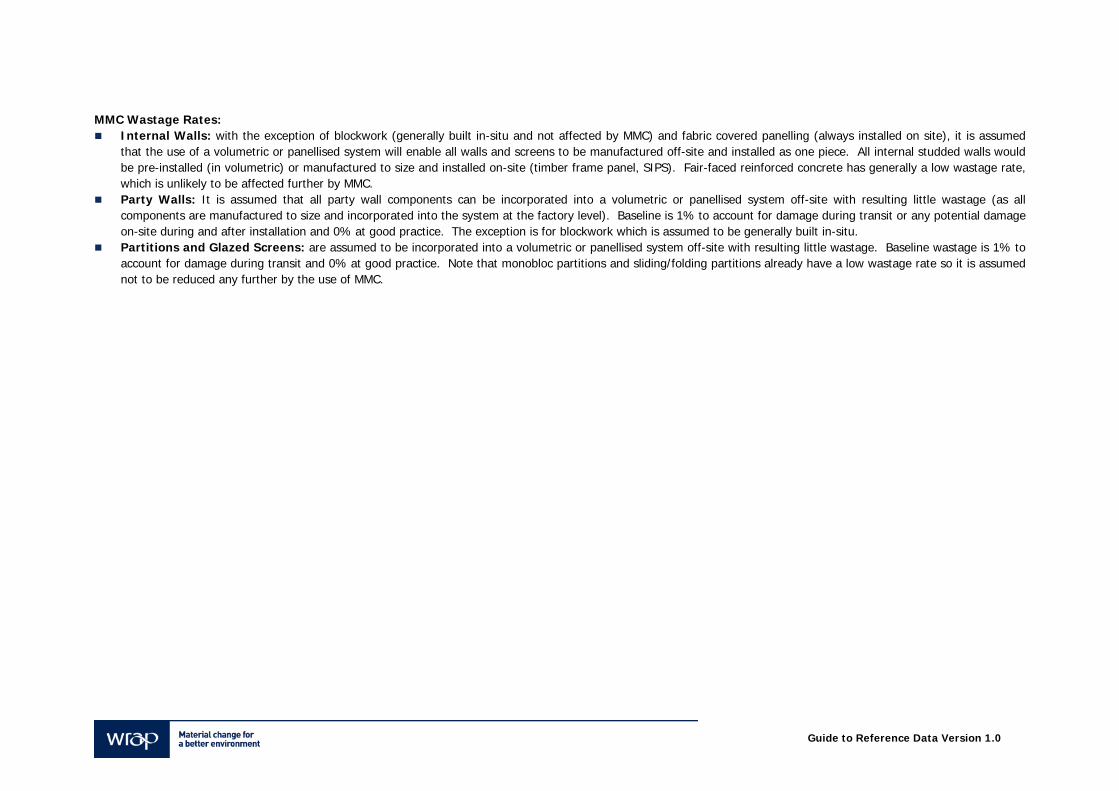
Guide to Reference Data Version 1.0
MMC Wastage Rates:
Internal Walls: with the exception of blockwork (generally built in-situ and not affected by MMC) and fabric covered panelling (always installed on site), it is assumed that the use of a volumetric or panellised system will enable all walls and screens to be manufactured off-site and installed as one piece. All internal studded walls would be pre-installed (in volumetric) or manufactured to size and installed on-site (timber frame panel, SIPS). Fair-faced reinforced concrete has generally a low wastage rate, which is unlikely to be affected further by MMC.
Party Walls: It is assumed that all party wall components can be incorporated into a volumetric or panellised system off-site with resulting little wastage (as all components are manufactured to size and incorporated into the system at the factory level). Baseline is 1% to account for damage during transit or any potential damage on-site during and after installation and 0% at good practice. The exception is for blockwork which is assumed to be generally built in-situ.
Partitions and Glazed Screens: are assumed to be incorporated into a volumetric or panellised system off-site with resulting little wastage. Baseline wastage is 1% to account for damage during transit and 0% at good practice. Note that monobloc partitions and sliding/folding partitions already have a low wastage rate so it is assumed not to be reduced any further by the use of MMC.
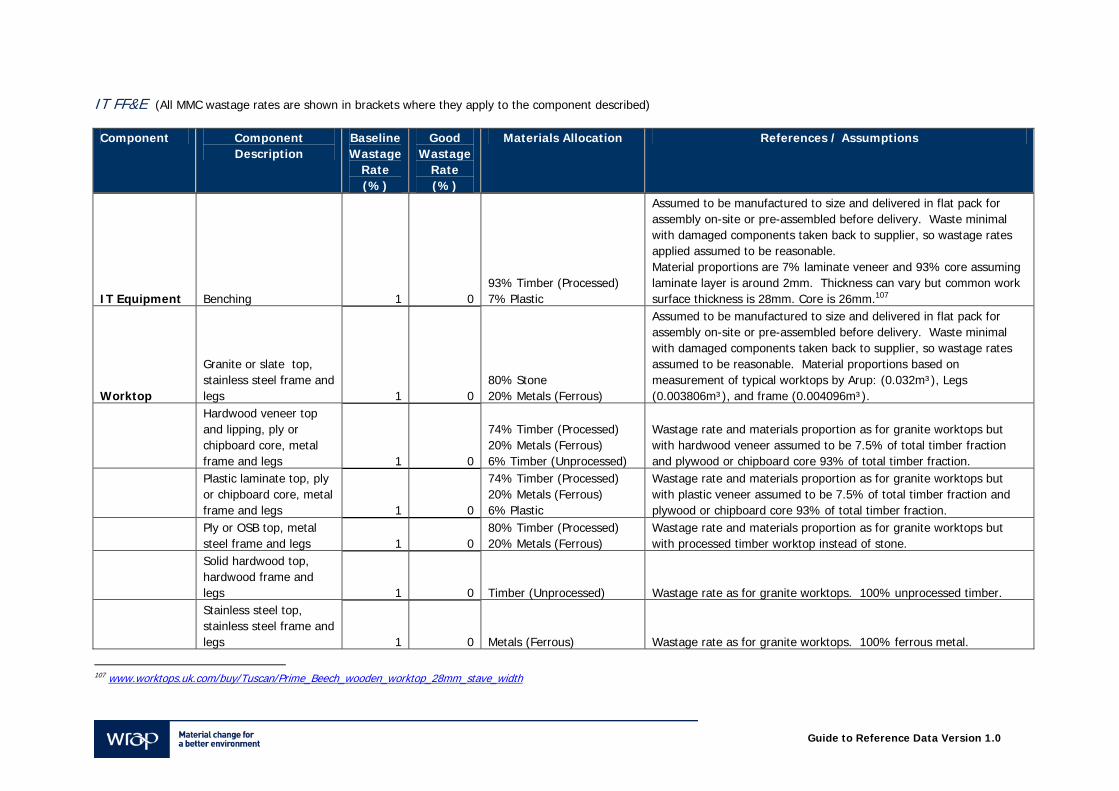
Guide to Reference Data Version 1.0
IT FF&E (All MMC wastage rates are shown in brackets where they apply to the component described) Component Component
Description Baseline Wastage
Rate (%)
Good Wastage
Rate (%)
Materials Allocation References / Assumptions
IT Equipment Benching 1 0 93% Timber (Processed) 7% Plastic
Assumed to be manufactured to size and delivered in flat pack for assembly on-site or pre-assembled before delivery. Waste minimal with damaged components taken back to supplier, so wastage rates applied assumed to be reasonable. Material proportions are 7% laminate veneer and 93% core assuming laminate layer is around 2mm. Thickness can vary but common work surface thickness is 28mm. Core is 26mm.107
Worktop
Granite or slate top, stainless steel frame and legs 1 0
80% Stone 20% Metals (Ferrous)
Assumed to be manufactured to size and delivered in flat pack for assembly on-site or pre-assembled before delivery. Waste minimal with damaged components taken back to supplier, so wastage rates assumed to be reasonable. Material proportions based on measurement of typical worktops by Arup: (0.032m³), Legs (0.003806m³), and frame (0.004096m³).
Hardwood veneer top and lipping, ply or chipboard core, metal frame and legs 1 0
74% Timber (Processed) 20% Metals (Ferrous) 6% Timber (Unprocessed)
Wastage rate and materials proportion as for granite worktops but with hardwood veneer assumed to be 7.5% of total timber fraction and plywood or chipboard core 93% of total timber fraction.
Plastic laminate top, ply or chipboard core, metal frame and legs 1 0
74% Timber (Processed) 20% Metals (Ferrous) 6% Plastic
Wastage rate and materials proportion as for granite worktops but with plastic veneer assumed to be 7.5% of total timber fraction and plywood or chipboard core 93% of total timber fraction.
Ply or OSB top, metal steel frame and legs 1 0
80% Timber (Processed) 20% Metals (Ferrous)
Wastage rate and materials proportion as for granite worktops but with processed timber worktop instead of stone.
Solid hardwood top, hardwood frame and legs 1 0 Timber (Unprocessed) Wastage rate as for granite worktops. 100% unprocessed timber.
Stainless steel top, stainless steel frame and legs 1 0 Metals (Ferrous) Wastage rate as for granite worktops. 100% ferrous metal.
107 www.worktops.uk.com/buy/Tuscan/Prime_Beech_wooden_worktop_28mm_stave_width
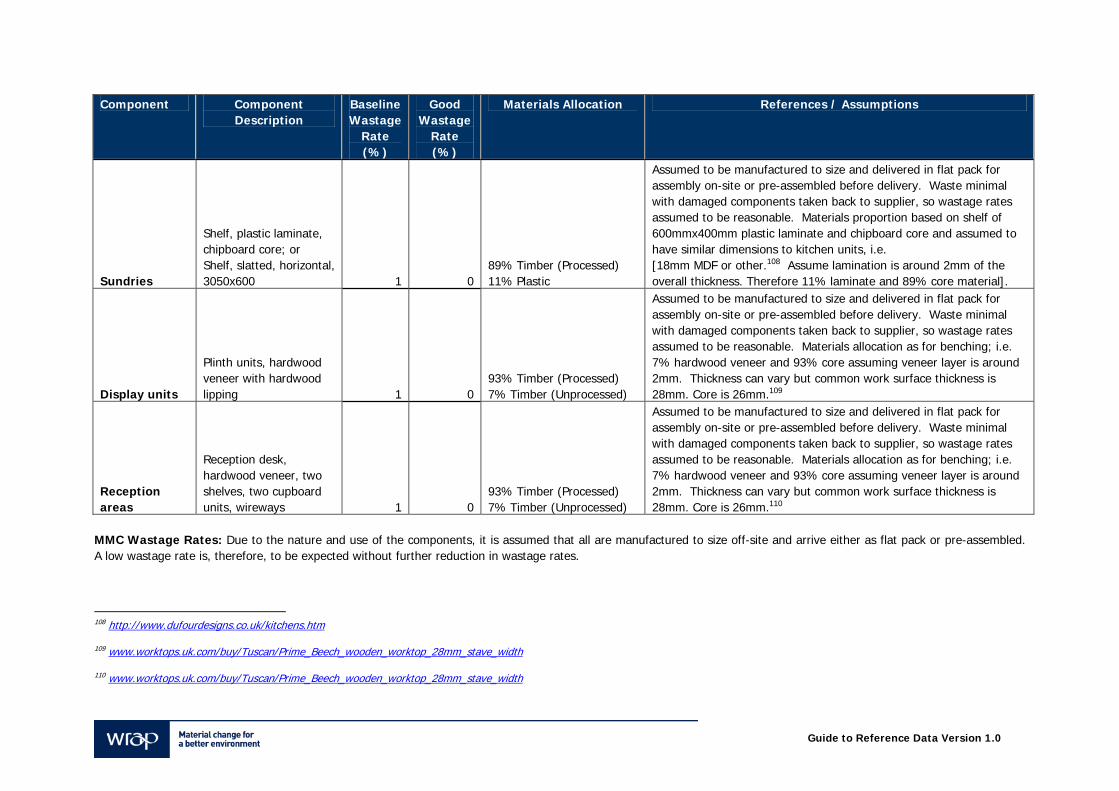
Guide to Reference Data Version 1.0
Component Component Description
Baseline Wastage
Rate (%)
Good Wastage
Rate (%)
Materials Allocation References / Assumptions
Sundries
Shelf, plastic laminate, chipboard core; or Shelf, slatted, horizontal, 3050x600 1 0
89% Timber (Processed) 11% Plastic
Assumed to be manufactured to size and delivered in flat pack for assembly on-site or pre-assembled before delivery. Waste minimal with damaged components taken back to supplier, so wastage rates assumed to be reasonable. Materials proportion based on shelf of 600mmx400mm plastic laminate and chipboard core and assumed to have similar dimensions to kitchen units, i.e. [18mm MDF or other.108 Assume lamination is around 2mm of the overall thickness. Therefore 11% laminate and 89% core material].
Display units
Plinth units, hardwood veneer with hardwood lipping 1 0
93% Timber (Processed) 7% Timber (Unprocessed)
Assumed to be manufactured to size and delivered in flat pack for assembly on-site or pre-assembled before delivery. Waste minimal with damaged components taken back to supplier, so wastage rates assumed to be reasonable. Materials allocation as for benching; i.e. 7% hardwood veneer and 93% core assuming veneer layer is around 2mm. Thickness can vary but common work surface thickness is 28mm. Core is 26mm.109
Reception areas
Reception desk, hardwood veneer, two shelves, two cupboard units, wireways 1 0
93% Timber (Processed) 7% Timber (Unprocessed)
Assumed to be manufactured to size and delivered in flat pack for assembly on-site or pre-assembled before delivery. Waste minimal with damaged components taken back to supplier, so wastage rates assumed to be reasonable. Materials allocation as for benching; i.e. 7% hardwood veneer and 93% core assuming veneer layer is around 2mm. Thickness can vary but common work surface thickness is 28mm. Core is 26mm.110
MMC Wastage Rates: Due to the nature and use of the components, it is assumed that all are manufactured to size off-site and arrive either as flat pack or pre-assembled. A low wastage rate is, therefore, to be expected without further reduction in wastage rates.
108 http://www.dufourdesigns.co.uk/kitchens.htm
109 www.worktops.uk.com/buy/Tuscan/Prime_Beech_wooden_worktop_28mm_stave_width
110 www.worktops.uk.com/buy/Tuscan/Prime_Beech_wooden_worktop_28mm_stave_width
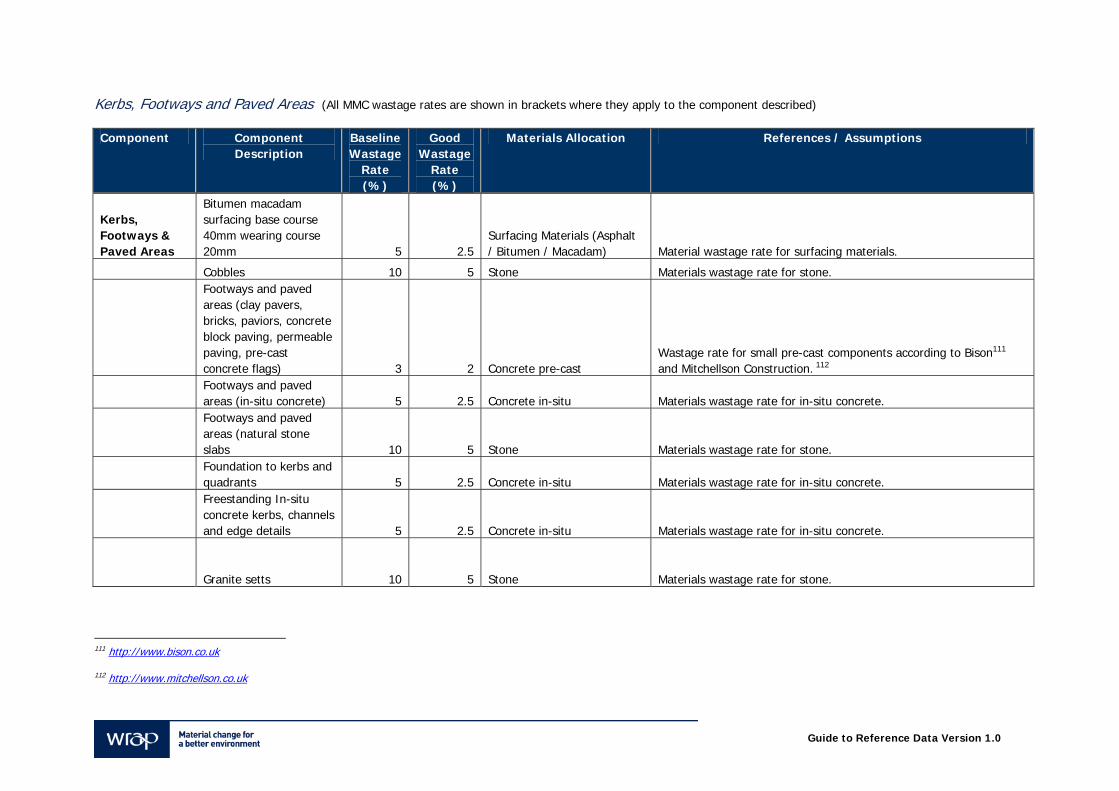
Guide to Reference Data Version 1.0
Kerbs, Footways and Paved Areas (All MMC wastage rates are shown in brackets where they apply to the component described) Component Component
Description Baseline Wastage
Rate (%)
Good Wastage
Rate (%)
Materials Allocation References / Assumptions
Kerbs, Footways & Paved Areas
Bitumen macadam surfacing base course 40mm wearing course 20mm 5 2.5
Surfacing Materials (Asphalt / Bitumen / Macadam) Material wastage rate for surfacing materials.
Cobbles 10 5 Stone Materials wastage rate for stone.
Footways and paved areas (clay pavers, bricks, paviors, concrete block paving, permeable paving, pre-cast concrete flags) 3 2 Concrete pre-cast
Wastage rate for small pre-cast components according to Bison111 and Mitchellson Construction. 112
Footways and paved areas (in-situ concrete) 5 2.5 Concrete in-situ Materials wastage rate for in-situ concrete.
Footways and paved areas (natural stone slabs 10 5 Stone Materials wastage rate for stone.
Foundation to kerbs and quadrants 5 2.5 Concrete in-situ Materials wastage rate for in-situ concrete.
Freestanding In-situ concrete kerbs, channels and edge details 5 2.5 Concrete in-situ Materials wastage rate for in-situ concrete.
Granite setts 10 5 Stone Materials wastage rate for stone.
111 http://www.bison.co.uk
112 http://www.mitchellson.co.uk
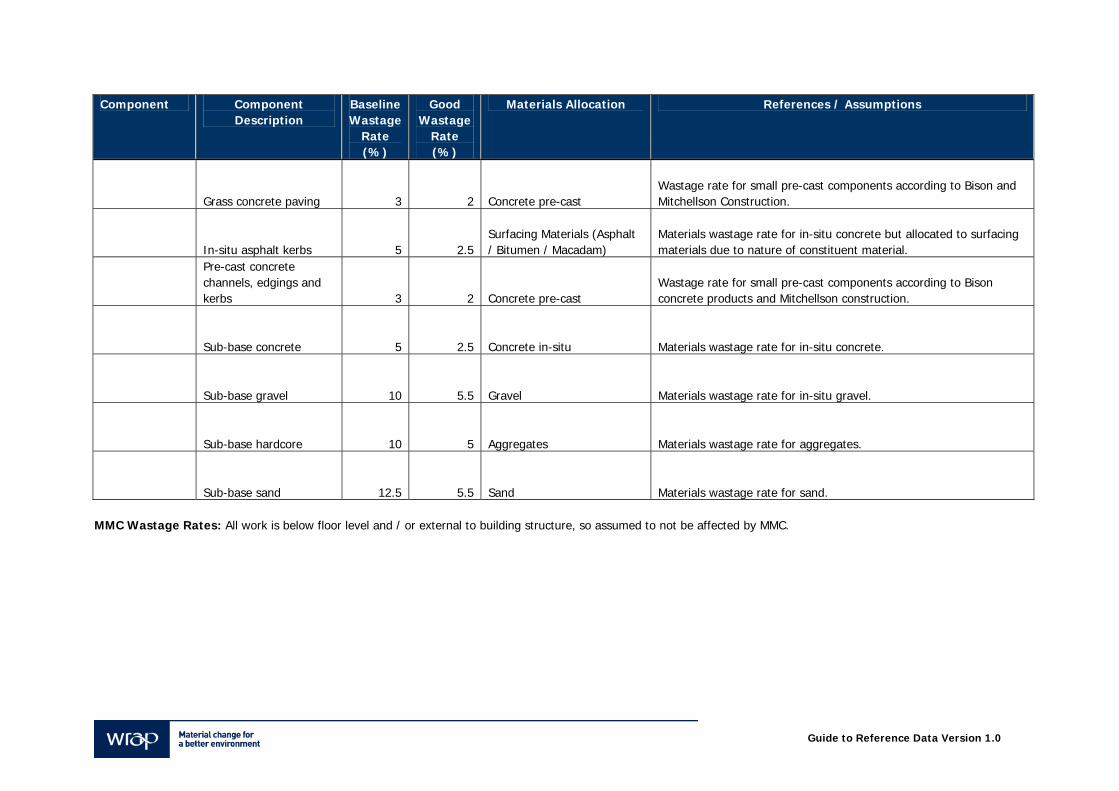
Guide to Reference Data Version 1.0
Component Component Description
Baseline Wastage
Rate (%)
Good Wastage
Rate (%)
Materials Allocation References / Assumptions
Grass concrete paving 3 2 Concrete pre-cast Wastage rate for small pre-cast components according to Bison and Mitchellson Construction.
In-situ asphalt kerbs 5 2.5 Surfacing Materials (Asphalt / Bitumen / Macadam)
Materials wastage rate for in-situ concrete but allocated to surfacing materials due to nature of constituent material.
Pre-cast concrete channels, edgings and kerbs 3 2 Concrete pre-cast
Wastage rate for small pre-cast components according to Bison concrete products and Mitchellson construction.
Sub-base concrete 5 2.5 Concrete in-situ Materials wastage rate for in-situ concrete.
Sub-base gravel 10 5.5 Gravel Materials wastage rate for in-situ gravel.
Sub-base hardcore 10 5 Aggregates Materials wastage rate for aggregates.
Sub-base sand 12.5 5.5 Sand Materials wastage rate for sand. MMC Wastage Rates: All work is below floor level and / or external to building structure, so assumed to not be affected by MMC.
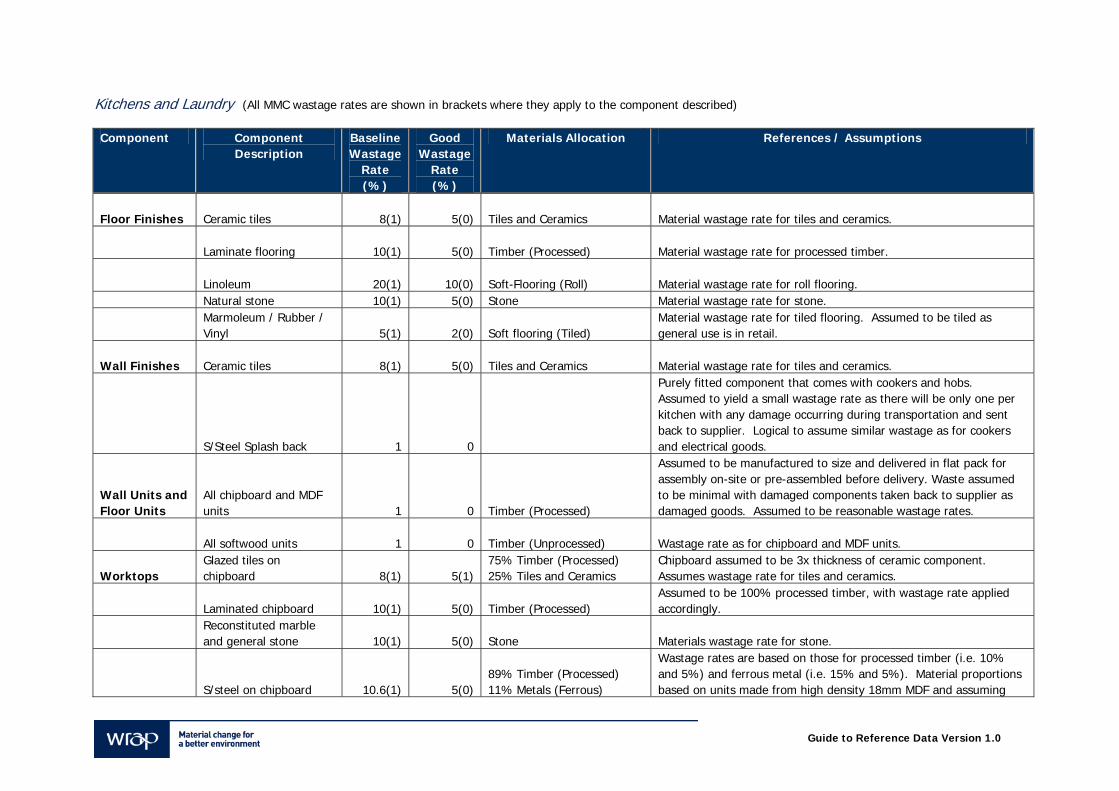
Guide to Reference Data Version 1.0
Kitchens and Laundry (All MMC wastage rates are shown in brackets where they apply to the component described) Component Component
Description Baseline Wastage
Rate (%)
Good Wastage
Rate (%)
Materials Allocation References / Assumptions
Floor Finishes Ceramic tiles 8(1) 5(0) Tiles and Ceramics Material wastage rate for tiles and ceramics.
Laminate flooring 10(1) 5(0) Timber (Processed) Material wastage rate for processed timber.
Linoleum 20(1) 10(0) Soft-Flooring (Roll) Material wastage rate for roll flooring. Natural stone 10(1) 5(0) Stone Material wastage rate for stone.
Marmoleum / Rubber / Vinyl 5(1) 2(0) Soft flooring (Tiled)
Material wastage rate for tiled flooring. Assumed to be tiled as general use is in retail.
Wall Finishes Ceramic tiles 8(1) 5(0) Tiles and Ceramics Material wastage rate for tiles and ceramics.
S/Steel Splash back 1 0
Purely fitted component that comes with cookers and hobs. Assumed to yield a small wastage rate as there will be only one per kitchen with any damage occurring during transportation and sent back to supplier. Logical to assume similar wastage as for cookers and electrical goods.
Wall Units and Floor Units
All chipboard and MDF units 1 0 Timber (Processed)
Assumed to be manufactured to size and delivered in flat pack for assembly on-site or pre-assembled before delivery. Waste assumed to be minimal with damaged components taken back to supplier as damaged goods. Assumed to be reasonable wastage rates.
All softwood units 1 0 Timber (Unprocessed) Wastage rate as for chipboard and MDF units.
Worktops Glazed tiles on chipboard 8(1) 5(1)
75% Timber (Processed) 25% Tiles and Ceramics
Chipboard assumed to be 3x thickness of ceramic component. Assumes wastage rate for tiles and ceramics.
Laminated chipboard 10(1) 5(0) Timber (Processed) Assumed to be 100% processed timber, with wastage rate applied accordingly.
Reconstituted marble and general stone 10(1) 5(0) Stone Materials wastage rate for stone.
S/steel on chipboard 10.6(1) 5(0) 89% Timber (Processed) 11% Metals (Ferrous)
Wastage rates are based on those for processed timber (i.e. 10% and 5%) and ferrous metal (i.e. 15% and 5%). Material proportions based on units made from high density 18mm MDF and assuming
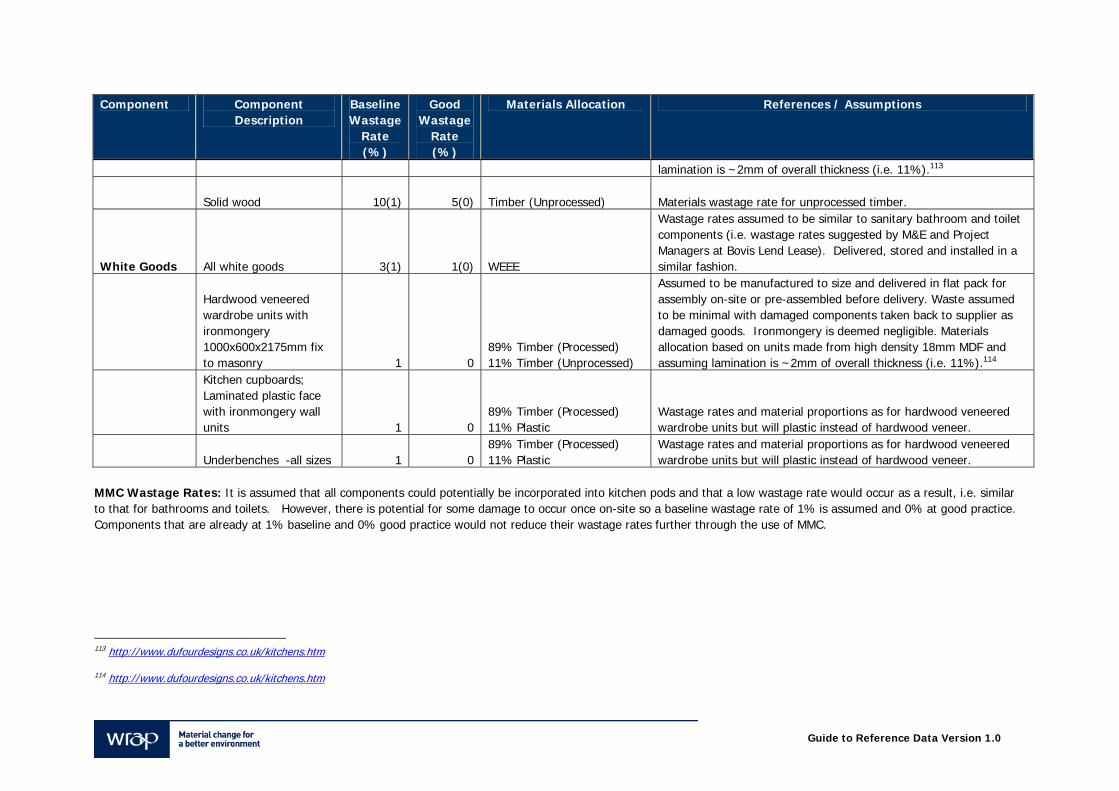
Guide to Reference Data Version 1.0
Component Component Description
Baseline Wastage
Rate (%)
Good Wastage
Rate (%)
Materials Allocation References / Assumptions
lamination is ~2mm of overall thickness (i.e. 11%).113
Solid wood 10(1) 5(0) Timber (Unprocessed) Materials wastage rate for unprocessed timber.
White Goods All white goods 3(1) 1(0) WEEE
Wastage rates assumed to be similar to sanitary bathroom and toilet components (i.e. wastage rates suggested by M&E and Project Managers at Bovis Lend Lease). Delivered, stored and installed in a similar fashion.
Hardwood veneered wardrobe units with ironmongery 1000x600x2175mm fix to masonry 1 0
89% Timber (Processed) 11% Timber (Unprocessed)
Assumed to be manufactured to size and delivered in flat pack for assembly on-site or pre-assembled before delivery. Waste assumed to be minimal with damaged components taken back to supplier as damaged goods. Ironmongery is deemed negligible. Materials allocation based on units made from high density 18mm MDF and assuming lamination is ~2mm of overall thickness (i.e. 11%).114
Kitchen cupboards; Laminated plastic face with ironmongery wall units 1 0
89% Timber (Processed) 11% Plastic
Wastage rates and material proportions as for hardwood veneered wardrobe units but will plastic instead of hardwood veneer.
Underbenches -all sizes 1 0 89% Timber (Processed) 11% Plastic
Wastage rates and material proportions as for hardwood veneered wardrobe units but will plastic instead of hardwood veneer.
MMC Wastage Rates: It is assumed that all components could potentially be incorporated into kitchen pods and that a low wastage rate would occur as a result, i.e. similar to that for bathrooms and toilets. However, there is potential for some damage to occur once on-site so a baseline wastage rate of 1% is assumed and 0% at good practice. Components that are already at 1% baseline and 0% good practice would not reduce their wastage rates further through the use of MMC.
113 http://www.dufourdesigns.co.uk/kitchens.htm
114 http://www.dufourdesigns.co.uk/kitchens.htm
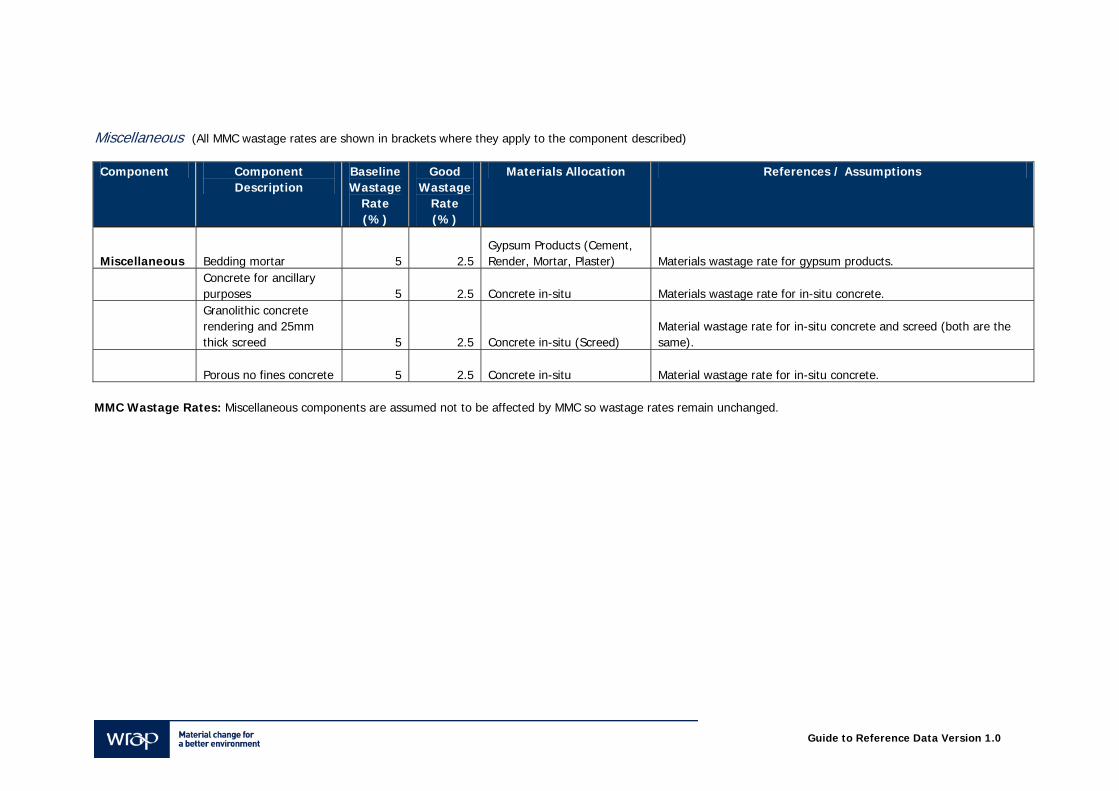
Guide to Reference Data Version 1.0
Miscellaneous (All MMC wastage rates are shown in brackets where they apply to the component described) Component Component
Description Baseline Wastage
Rate (%)
Good Wastage
Rate (%)
Materials Allocation References / Assumptions
Miscellaneous Bedding mortar 5 2.5 Gypsum Products (Cement, Render, Mortar, Plaster) Materials wastage rate for gypsum products.
Concrete for ancillary purposes 5 2.5 Concrete in-situ Materials wastage rate for in-situ concrete.
Granolithic concrete rendering and 25mm thick screed 5 2.5 Concrete in-situ (Screed)
Material wastage rate for in-situ concrete and screed (both are the same).
Porous no fines concrete 5 2.5 Concrete in-situ Material wastage rate for in-situ concrete. MMC Wastage Rates: Miscellaneous components are assumed not to be affected by MMC so wastage rates remain unchanged.
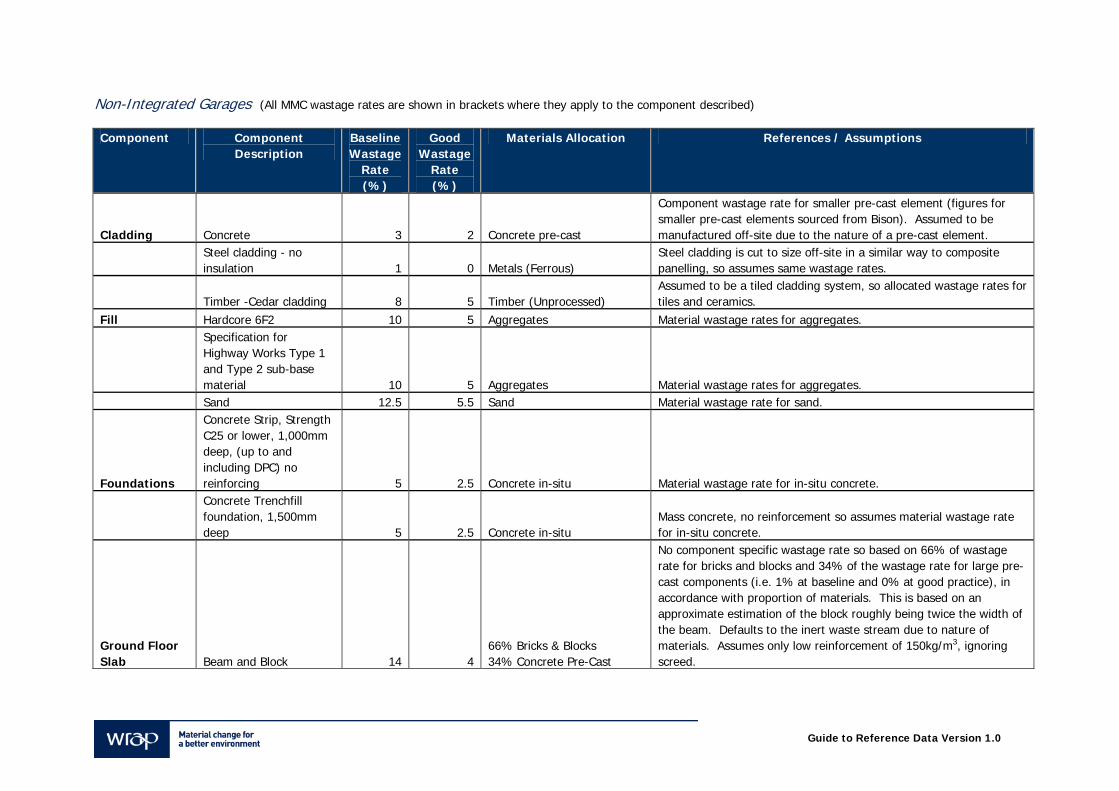
Guide to Reference Data Version 1.0
Non-Integrated Garages (All MMC wastage rates are shown in brackets where they apply to the component described) Component Component
Description Baseline Wastage
Rate (%)
Good Wastage
Rate (%)
Materials Allocation References / Assumptions
Cladding Concrete 3 2 Concrete pre-cast
Component wastage rate for smaller pre-cast element (figures for smaller pre-cast elements sourced from Bison). Assumed to be manufactured off-site due to the nature of a pre-cast element.
Steel cladding - no insulation 1 0 Metals (Ferrous)
Steel cladding is cut to size off-site in a similar way to composite panelling, so assumes same wastage rates.
Timber -Cedar cladding 8 5 Timber (Unprocessed) Assumed to be a tiled cladding system, so allocated wastage rates for tiles and ceramics.
Fill Hardcore 6F2 10 5 Aggregates Material wastage rates for aggregates.
Specification for Highway Works Type 1 and Type 2 sub-base material 10 5 Aggregates Material wastage rates for aggregates.
Sand 12.5 5.5 Sand Material wastage rate for sand.
Foundations
Concrete Strip, Strength C25 or lower, 1,000mm deep, (up to and including DPC) no reinforcing 5 2.5 Concrete in-situ Material wastage rate for in-situ concrete.
Concrete Trenchfill foundation, 1,500mm deep 5 2.5 Concrete in-situ
Mass concrete, no reinforcement so assumes material wastage rate for in-situ concrete.
Ground Floor Slab Beam and Block 14 4
66% Bricks & Blocks 34% Concrete Pre-Cast
No component specific wastage rate so based on 66% of wastage rate for bricks and blocks and 34% of the wastage rate for large pre-cast components (i.e. 1% at baseline and 0% at good practice), in accordance with proportion of materials. This is based on an approximate estimation of the block roughly being twice the width of the beam. Defaults to the inert waste stream due to nature of materials. Assumes only low reinforcement of 150kg/m3, ignoring screed.
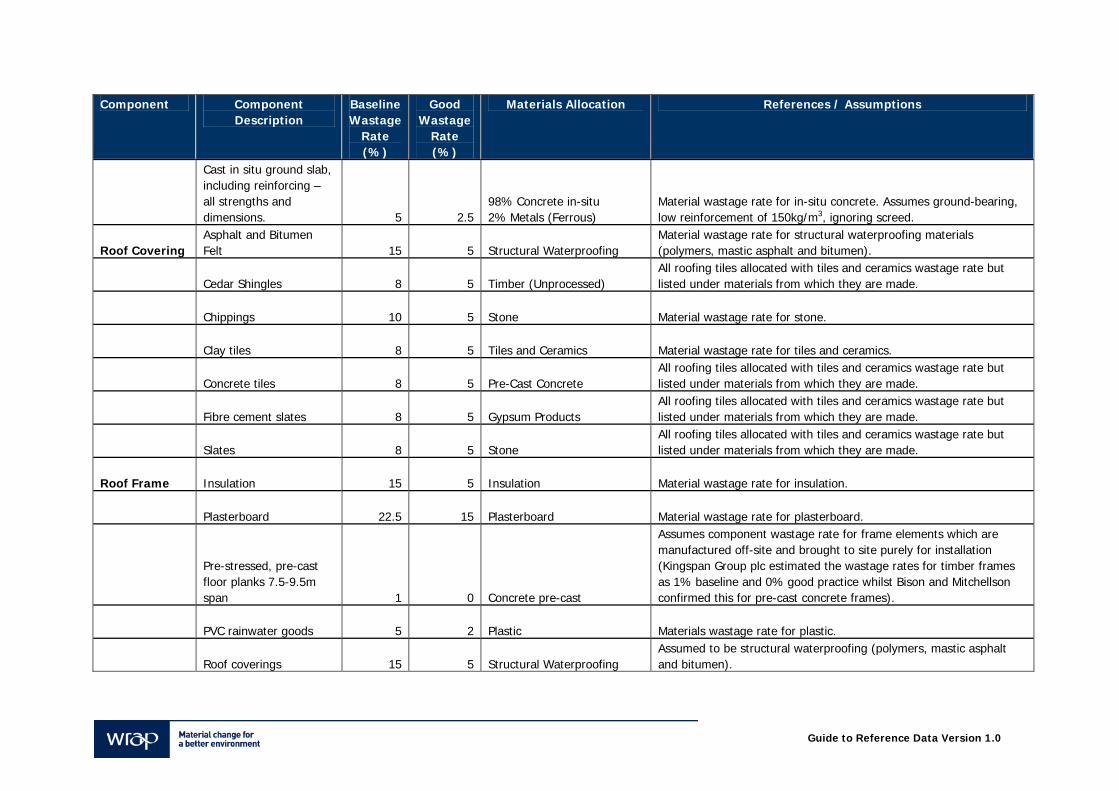
Guide to Reference Data Version 1.0
Component Component Description
Baseline Wastage
Rate (%)
Good Wastage
Rate (%)
Materials Allocation References / Assumptions
Cast in situ ground slab, including reinforcing – all strengths and dimensions. 5 2.5
98% Concrete in-situ 2% Metals (Ferrous)
Material wastage rate for in-situ concrete. Assumes ground-bearing, low reinforcement of 150kg/m3, ignoring screed.
Roof Covering Asphalt and Bitumen Felt 15 5 Structural Waterproofing
Material wastage rate for structural waterproofing materials (polymers, mastic asphalt and bitumen).
Cedar Shingles 8 5 Timber (Unprocessed) All roofing tiles allocated with tiles and ceramics wastage rate but listed under materials from which they are made.
Chippings 10 5 Stone Material wastage rate for stone.
Clay tiles 8 5 Tiles and Ceramics Material wastage rate for tiles and ceramics.
Concrete tiles 8 5 Pre-Cast Concrete All roofing tiles allocated with tiles and ceramics wastage rate but listed under materials from which they are made.
Fibre cement slates 8 5 Gypsum Products All roofing tiles allocated with tiles and ceramics wastage rate but listed under materials from which they are made.
Slates 8 5 Stone All roofing tiles allocated with tiles and ceramics wastage rate but listed under materials from which they are made.
Roof Frame Insulation 15 5 Insulation Material wastage rate for insulation.
Plasterboard 22.5 15 Plasterboard Material wastage rate for plasterboard.
Pre-stressed, pre-cast floor planks 7.5-9.5m span 1 0 Concrete pre-cast
Assumes component wastage rate for frame elements which are manufactured off-site and brought to site purely for installation (Kingspan Group plc estimated the wastage rates for timber frames as 1% baseline and 0% good practice whilst Bison and Mitchellson confirmed this for pre-cast concrete frames).
PVC rainwater goods 5 2 Plastic Materials wastage rate for plastic.
Roof coverings 15 5 Structural Waterproofing Assumed to be structural waterproofing (polymers, mastic asphalt and bitumen).
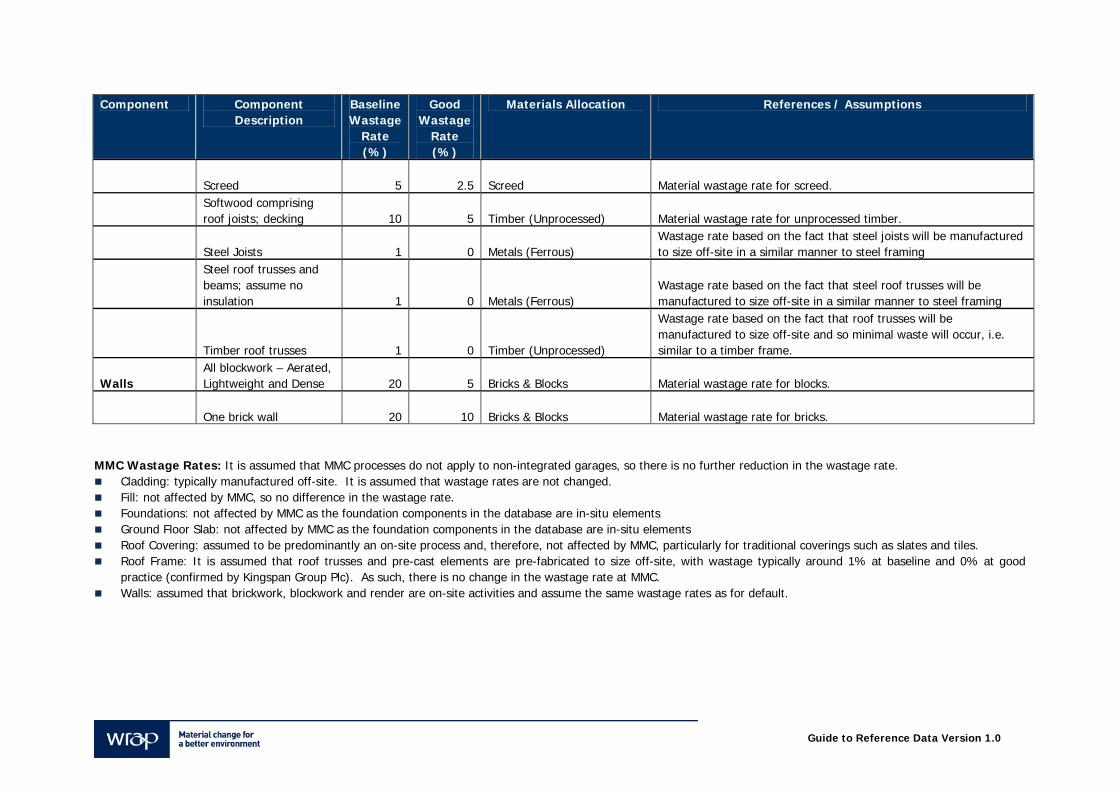
Guide to Reference Data Version 1.0
Component Component Description
Baseline Wastage
Rate (%)
Good Wastage
Rate (%)
Materials Allocation References / Assumptions
Screed 5 2.5 Screed Material wastage rate for screed.
Softwood comprising roof joists; decking 10 5 Timber (Unprocessed) Material wastage rate for unprocessed timber.
Steel Joists 1 0 Metals (Ferrous) Wastage rate based on the fact that steel joists will be manufactured to size off-site in a similar manner to steel framing
Steel roof trusses and beams; assume no insulation 1 0 Metals (Ferrous)
Wastage rate based on the fact that steel roof trusses will be manufactured to size off-site in a similar manner to steel framing
Timber roof trusses 1 0 Timber (Unprocessed)
Wastage rate based on the fact that roof trusses will be manufactured to size off-site and so minimal waste will occur, i.e. similar to a timber frame.
Walls All blockwork – Aerated, Lightweight and Dense 20 5 Bricks & Blocks Material wastage rate for blocks.
One brick wall 20 10 Bricks & Blocks Material wastage rate for bricks. MMC Wastage Rates: It is assumed that MMC processes do not apply to non-integrated garages, so there is no further reduction in the wastage rate.
Cladding: typically manufactured off-site. It is assumed that wastage rates are not changed. Fill: not affected by MMC, so no difference in the wastage rate. Foundations: not affected by MMC as the foundation components in the database are in-situ elements Ground Floor Slab: not affected by MMC as the foundation components in the database are in-situ elements Roof Covering: assumed to be predominantly an on-site process and, therefore, not affected by MMC, particularly for traditional coverings such as slates and tiles. Roof Frame: It is assumed that roof trusses and pre-cast elements are pre-fabricated to size off-site, with wastage typically around 1% at baseline and 0% at good
practice (confirmed by Kingspan Group Plc). As such, there is no change in the wastage rate at MMC. Walls: assumed that brickwork, blockwork and render are on-site activities and assume the same wastage rates as for default.
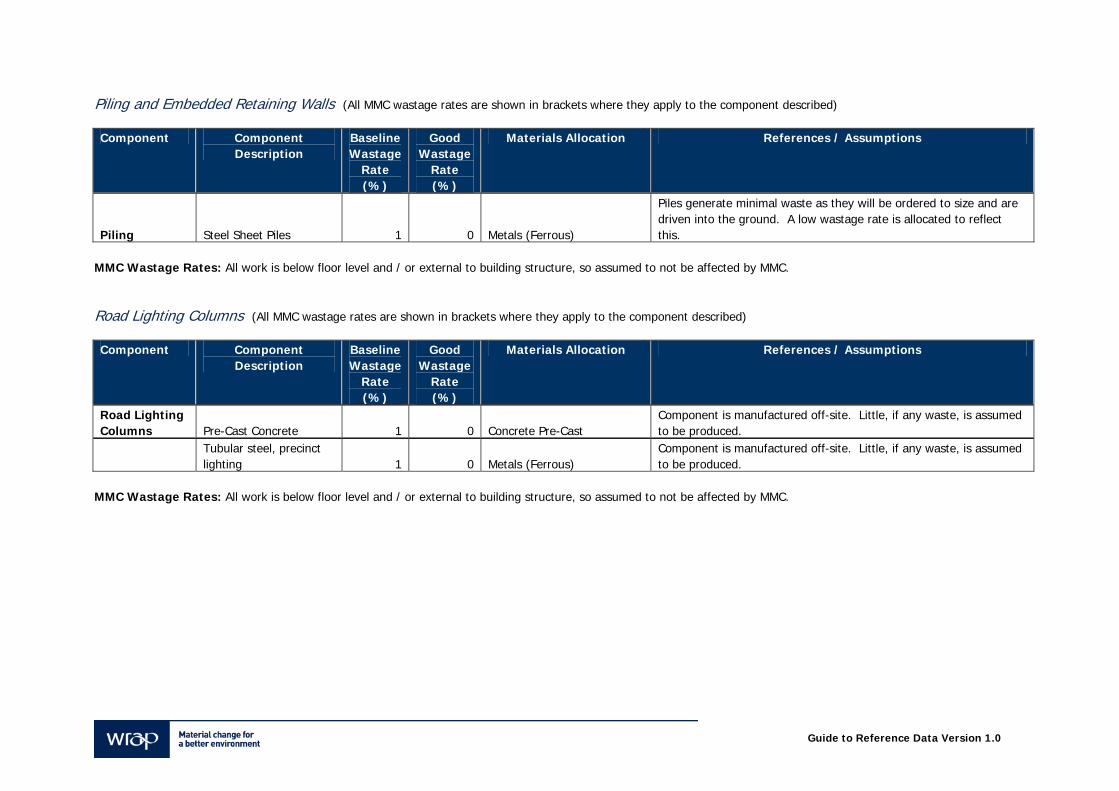
Guide to Reference Data Version 1.0
Piling and Embedded Retaining Walls (All MMC wastage rates are shown in brackets where they apply to the component described) Component Component
Description Baseline Wastage
Rate (%)
Good Wastage
Rate (%)
Materials Allocation References / Assumptions
Piling Steel Sheet Piles 1 0 Metals (Ferrous)
Piles generate minimal waste as they will be ordered to size and are driven into the ground. A low wastage rate is allocated to reflect this.
MMC Wastage Rates: All work is below floor level and / or external to building structure, so assumed to not be affected by MMC. Road Lighting Columns (All MMC wastage rates are shown in brackets where they apply to the component described) Component Component
Description Baseline Wastage
Rate (%)
Good Wastage
Rate (%)
Materials Allocation References / Assumptions
Road Lighting Columns Pre-Cast Concrete 1 0 Concrete Pre-Cast
Component is manufactured off-site. Little, if any waste, is assumed to be produced.
Tubular steel, precinct lighting 1 0 Metals (Ferrous)
Component is manufactured off-site. Little, if any waste, is assumed to be produced.
MMC Wastage Rates: All work is below floor level and / or external to building structure, so assumed to not be affected by MMC.
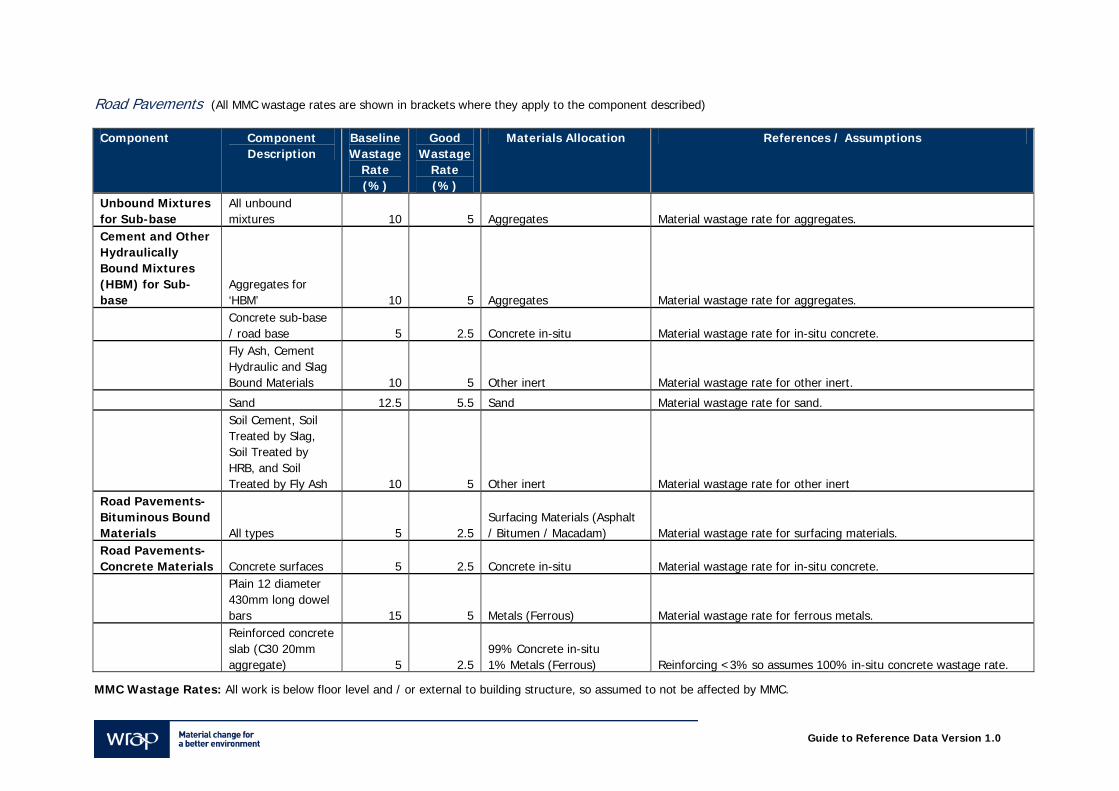
Guide to Reference Data Version 1.0
Road Pavements (All MMC wastage rates are shown in brackets where they apply to the component described) Component Component
Description Baseline Wastage
Rate (%)
Good Wastage
Rate (%)
Materials Allocation References / Assumptions
Unbound Mixtures for Sub-base
All unbound mixtures 10 5 Aggregates Material wastage rate for aggregates.
Cement and Other Hydraulically Bound Mixtures (HBM) for Sub-base
Aggregates for ‘HBM’ 10 5 Aggregates Material wastage rate for aggregates.
Concrete sub-base / road base 5 2.5 Concrete in-situ Material wastage rate for in-situ concrete.
Fly Ash, Cement Hydraulic and Slag Bound Materials 10 5 Other inert Material wastage rate for other inert.
Sand 12.5 5.5 Sand Material wastage rate for sand.
Soil Cement, Soil Treated by Slag, Soil Treated by HRB, and Soil Treated by Fly Ash 10 5 Other inert Material wastage rate for other inert
Road Pavements-Bituminous Bound Materials All types 5 2.5
Surfacing Materials (Asphalt / Bitumen / Macadam) Material wastage rate for surfacing materials.
Road Pavements-Concrete Materials Concrete surfaces 5 2.5 Concrete in-situ Material wastage rate for in-situ concrete.
Plain 12 diameter 430mm long dowel bars 15 5 Metals (Ferrous) Material wastage rate for ferrous metals.
Reinforced concrete slab (C30 20mm aggregate) 5 2.5
99% Concrete in-situ 1% Metals (Ferrous) Reinforcing <3% so assumes 100% in-situ concrete wastage rate.
MMC Wastage Rates: All work is below floor level and / or external to building structure, so assumed to not be affected by MMC.
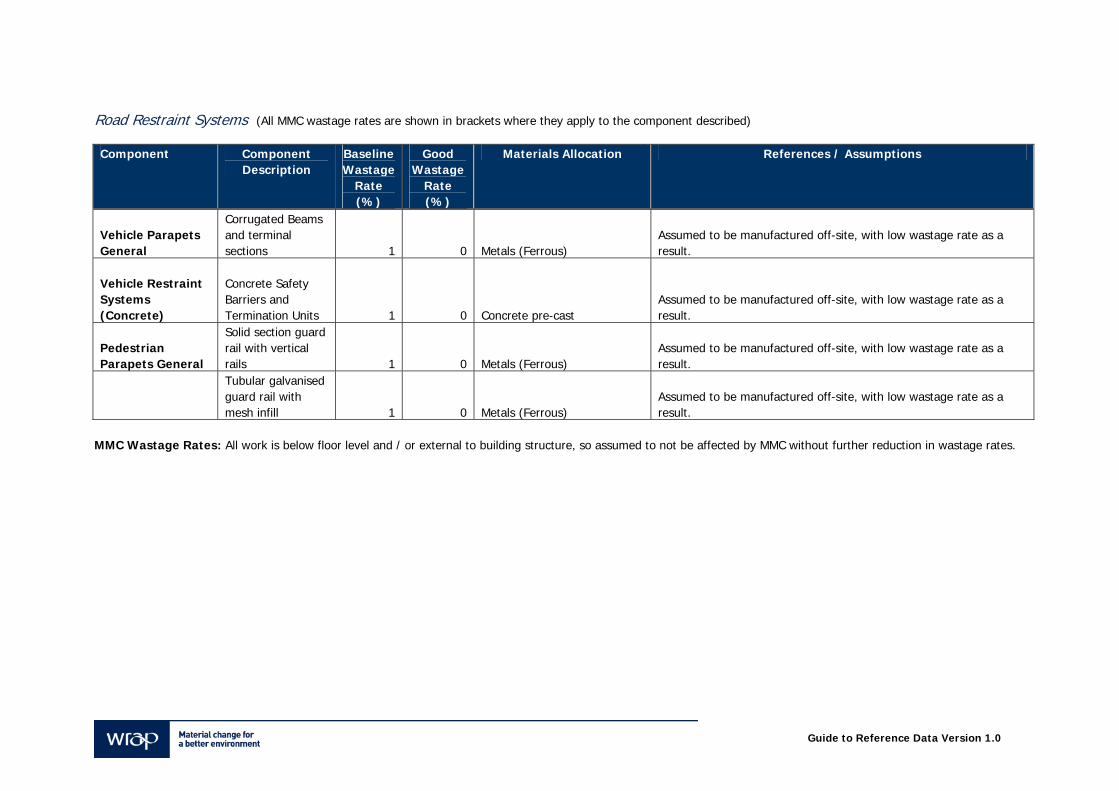
Guide to Reference Data Version 1.0
Road Restraint Systems (All MMC wastage rates are shown in brackets where they apply to the component described) Component Component
Description Baseline Wastage
Rate (%)
Good Wastage
Rate (%)
Materials Allocation References / Assumptions
Vehicle Parapets General
Corrugated Beams and terminal sections 1 0 Metals (Ferrous)
Assumed to be manufactured off-site, with low wastage rate as a result.
Vehicle Restraint Systems (Concrete)
Concrete Safety Barriers and Termination Units 1 0 Concrete pre-cast
Assumed to be manufactured off-site, with low wastage rate as a result.
Pedestrian Parapets General
Solid section guard rail with vertical rails 1 0 Metals (Ferrous)
Assumed to be manufactured off-site, with low wastage rate as a result.
Tubular galvanised guard rail with mesh infill 1 0 Metals (Ferrous)
Assumed to be manufactured off-site, with low wastage rate as a result.
MMC Wastage Rates: All work is below floor level and / or external to building structure, so assumed to not be affected by MMC without further reduction in wastage rates.
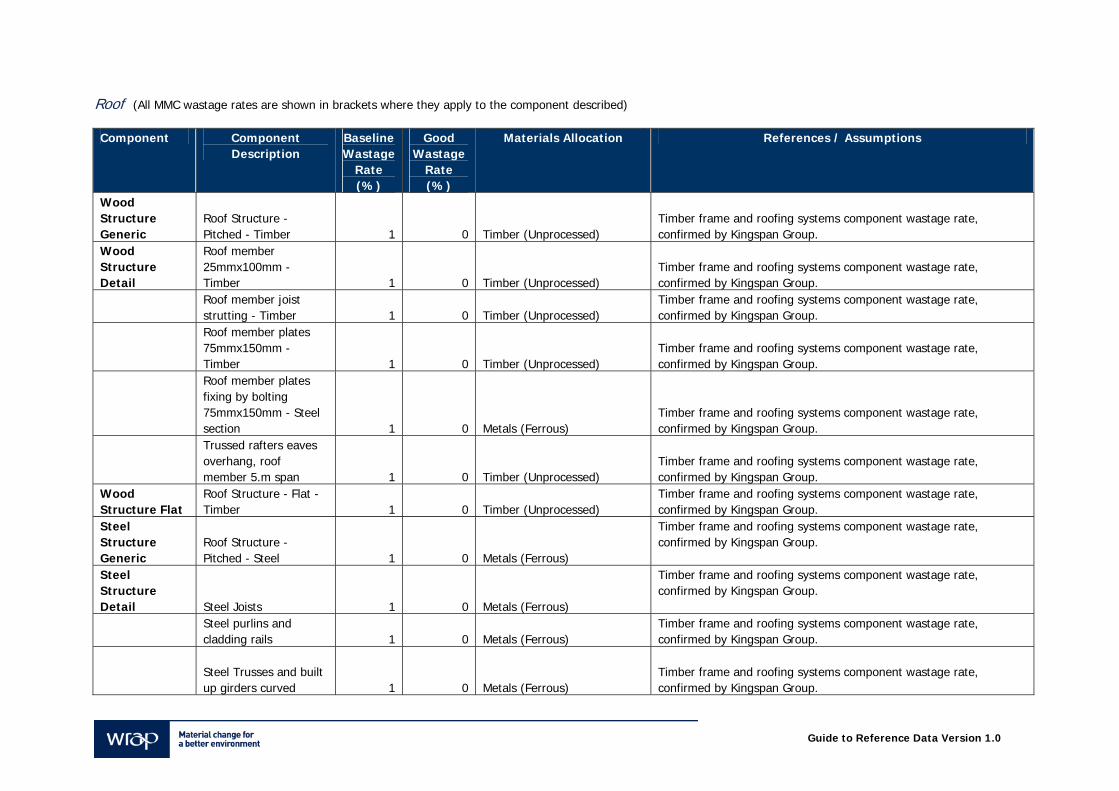
Guide to Reference Data Version 1.0
Roof (All MMC wastage rates are shown in brackets where they apply to the component described) Component Component
Description Baseline Wastage
Rate (%)
Good Wastage
Rate (%)
Materials Allocation References / Assumptions
Wood Structure Generic
Roof Structure - Pitched - Timber 1 0 Timber (Unprocessed)
Timber frame and roofing systems component wastage rate, confirmed by Kingspan Group.
Wood Structure Detail
Roof member 25mmx100mm - Timber 1 0 Timber (Unprocessed)
Timber frame and roofing systems component wastage rate, confirmed by Kingspan Group.
Roof member joist strutting - Timber 1 0 Timber (Unprocessed)
Timber frame and roofing systems component wastage rate, confirmed by Kingspan Group.
Roof member plates 75mmx150mm - Timber 1 0 Timber (Unprocessed)
Timber frame and roofing systems component wastage rate, confirmed by Kingspan Group.
Roof member plates fixing by bolting 75mmx150mm - Steel section 1 0 Metals (Ferrous)
Timber frame and roofing systems component wastage rate, confirmed by Kingspan Group.
Trussed rafters eaves overhang, roof member 5.m span 1 0 Timber (Unprocessed)
Timber frame and roofing systems component wastage rate, confirmed by Kingspan Group.
Wood Structure Flat
Roof Structure - Flat - Timber 1 0 Timber (Unprocessed)
Timber frame and roofing systems component wastage rate, confirmed by Kingspan Group.
Steel Structure Generic
Roof Structure - Pitched - Steel 1 0 Metals (Ferrous)
Timber frame and roofing systems component wastage rate, confirmed by Kingspan Group.
Steel Structure Detail Steel Joists 1 0 Metals (Ferrous)
Timber frame and roofing systems component wastage rate, confirmed by Kingspan Group.
Steel purlins and cladding rails 1 0 Metals (Ferrous)
Timber frame and roofing systems component wastage rate, confirmed by Kingspan Group.
Steel Trusses and built up girders curved 1 0 Metals (Ferrous)
Timber frame and roofing systems component wastage rate, confirmed by Kingspan Group.
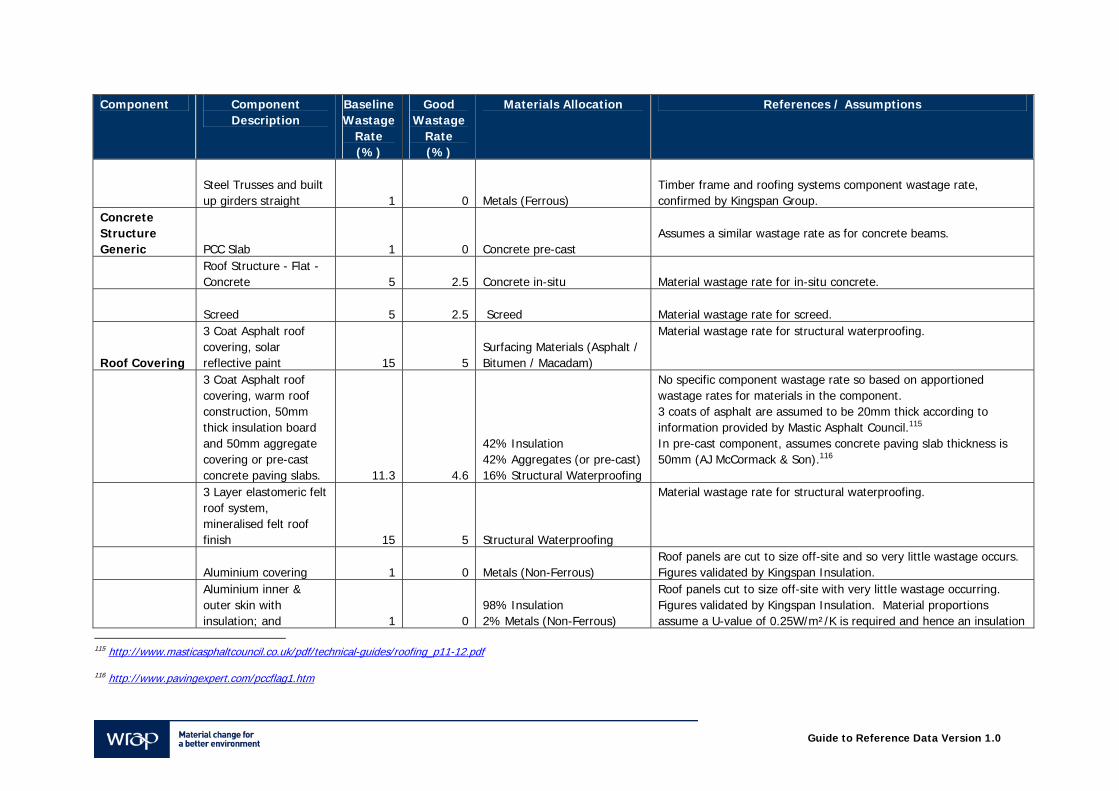
Guide to Reference Data Version 1.0
Component Component Description
Baseline Wastage
Rate (%)
Good Wastage
Rate (%)
Materials Allocation References / Assumptions
Steel Trusses and built up girders straight 1 0 Metals (Ferrous)
Timber frame and roofing systems component wastage rate, confirmed by Kingspan Group.
Concrete Structure Generic PCC Slab 1 0 Concrete pre-cast
Assumes a similar wastage rate as for concrete beams.
Roof Structure - Flat - Concrete 5 2.5 Concrete in-situ
Material wastage rate for in-situ concrete.
Screed 5 2.5 Screed Material wastage rate for screed.
Roof Covering
3 Coat Asphalt roof covering, solar reflective paint 15 5
Surfacing Materials (Asphalt / Bitumen / Macadam)
Material wastage rate for structural waterproofing.
3 Coat Asphalt roof covering, warm roof construction, 50mm thick insulation board and 50mm aggregate covering or pre-cast concrete paving slabs. 11.3 4.6
42% Insulation 42% Aggregates (or pre-cast) 16% Structural Waterproofing
No specific component wastage rate so based on apportioned wastage rates for materials in the component. 3 coats of asphalt are assumed to be 20mm thick according to information provided by Mastic Asphalt Council.115 In pre-cast component, assumes concrete paving slab thickness is 50mm (AJ McCormack & Son).116
3 Layer elastomeric felt roof system, mineralised felt roof finish 15 5 Structural Waterproofing
Material wastage rate for structural waterproofing.
Aluminium covering 1 0 Metals (Non-Ferrous) Roof panels are cut to size off-site and so very little wastage occurs. Figures validated by Kingspan Insulation.
Aluminium inner & outer skin with insulation; and 1 0
98% Insulation 2% Metals (Non-Ferrous)
Roof panels cut to size off-site with very little wastage occurring. Figures validated by Kingspan Insulation. Material proportions assume a U-value of 0.25W/m²/K is required and hence an insulation
115 http://www.masticasphaltcouncil.co.uk/pdf/technical-guides/roofing_p11-12.pdf
116 http://www.pavingexpert.com/pccflag1.htm
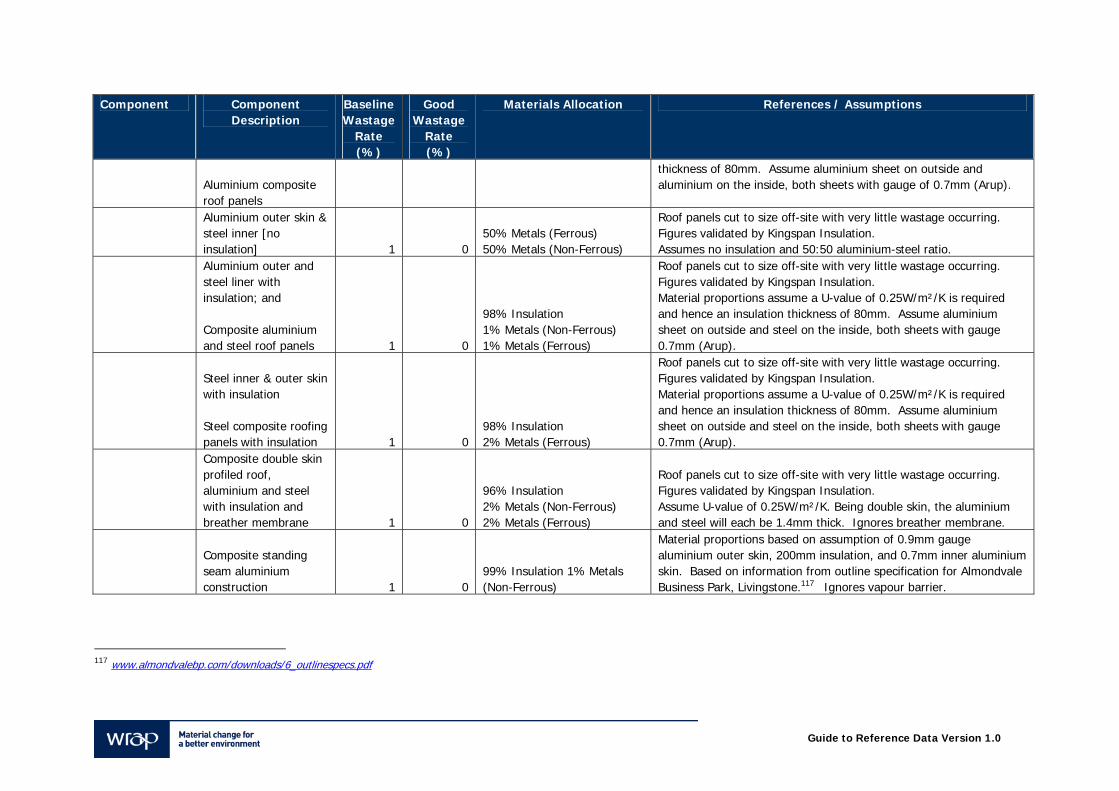
Guide to Reference Data Version 1.0
Component Component Description
Baseline Wastage
Rate (%)
Good Wastage
Rate (%)
Materials Allocation References / Assumptions
Aluminium composite roof panels
thickness of 80mm. Assume aluminium sheet on outside and aluminium on the inside, both sheets with gauge of 0.7mm (Arup).
Aluminium outer skin & steel inner [no insulation] 1 0
50% Metals (Ferrous) 50% Metals (Non-Ferrous)
Roof panels cut to size off-site with very little wastage occurring. Figures validated by Kingspan Insulation. Assumes no insulation and 50:50 aluminium-steel ratio.
Aluminium outer and steel liner with insulation; and Composite aluminium and steel roof panels 1 0
98% Insulation 1% Metals (Non-Ferrous) 1% Metals (Ferrous)
Roof panels cut to size off-site with very little wastage occurring. Figures validated by Kingspan Insulation. Material proportions assume a U-value of 0.25W/m²/K is required and hence an insulation thickness of 80mm. Assume aluminium sheet on outside and steel on the inside, both sheets with gauge 0.7mm (Arup).
Steel inner & outer skin with insulation Steel composite roofing panels with insulation 1 0
98% Insulation 2% Metals (Ferrous)
Roof panels cut to size off-site with very little wastage occurring. Figures validated by Kingspan Insulation. Material proportions assume a U-value of 0.25W/m²/K is required and hence an insulation thickness of 80mm. Assume aluminium sheet on outside and steel on the inside, both sheets with gauge 0.7mm (Arup).
Composite double skin profiled roof, aluminium and steel with insulation and breather membrane 1 0
96% Insulation 2% Metals (Non-Ferrous) 2% Metals (Ferrous)
Roof panels cut to size off-site with very little wastage occurring. Figures validated by Kingspan Insulation. Assume U-value of 0.25W/m²/K. Being double skin, the aluminium and steel will each be 1.4mm thick. Ignores breather membrane.
Composite standing seam aluminium construction 1 0
99% Insulation 1% Metals (Non-Ferrous)
Material proportions based on assumption of 0.9mm gauge aluminium outer skin, 200mm insulation, and 0.7mm inner aluminium skin. Based on information from outline specification for Almondvale Business Park, Livingstone.117 Ignores vapour barrier.
117 www.almondvalebp.com/downloads/6_outlinespecs.pdf
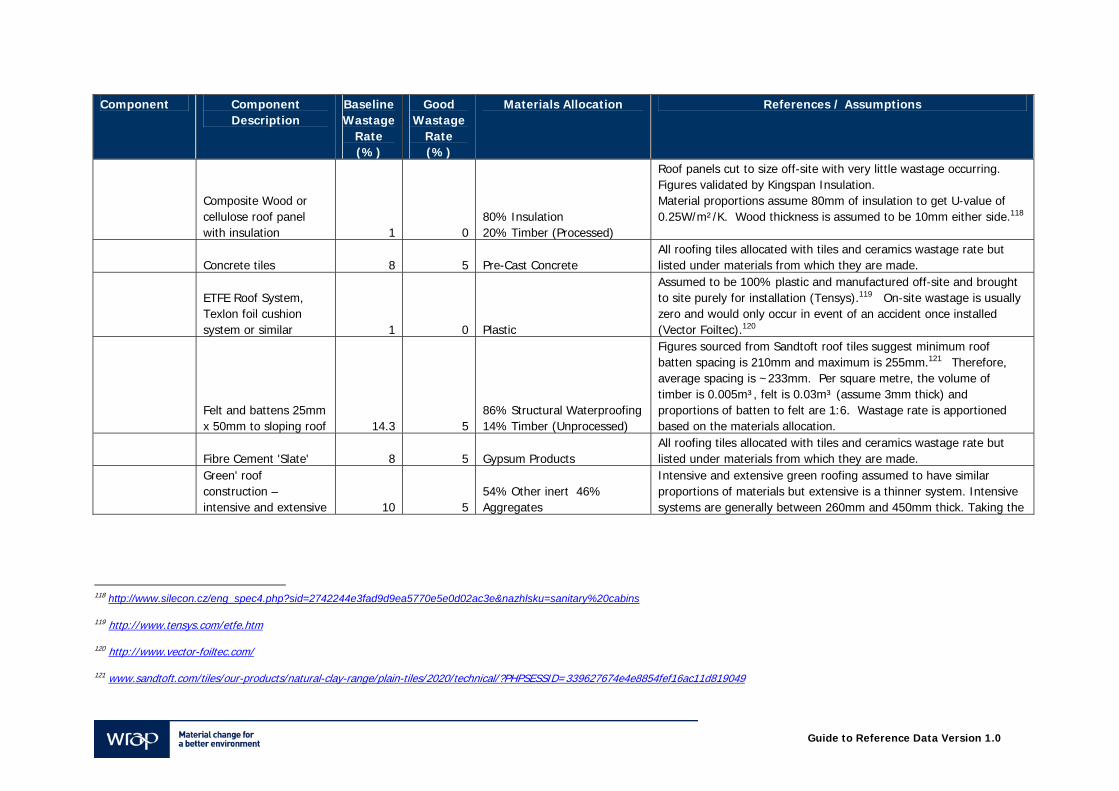
Guide to Reference Data Version 1.0
Component Component Description
Baseline Wastage
Rate (%)
Good Wastage
Rate (%)
Materials Allocation References / Assumptions
Composite Wood or cellulose roof panel with insulation 1 0
80% Insulation 20% Timber (Processed)
Roof panels cut to size off-site with very little wastage occurring. Figures validated by Kingspan Insulation. Material proportions assume 80mm of insulation to get U-value of 0.25W/m²/K. Wood thickness is assumed to be 10mm either side.118
Concrete tiles 8 5 Pre-Cast Concrete All roofing tiles allocated with tiles and ceramics wastage rate but listed under materials from which they are made.
ETFE Roof System, Texlon foil cushion system or similar 1 0 Plastic
Assumed to be 100% plastic and manufactured off-site and brought to site purely for installation (Tensys).119 On-site wastage is usually zero and would only occur in event of an accident once installed (Vector Foiltec).120
Felt and battens 25mm x 50mm to sloping roof 14.3 5
86% Structural Waterproofing 14% Timber (Unprocessed)
Figures sourced from Sandtoft roof tiles suggest minimum roof batten spacing is 210mm and maximum is 255mm.121 Therefore, average spacing is ~233mm. Per square metre, the volume of timber is 0.005m³, felt is 0.03m³ (assume 3mm thick) and proportions of batten to felt are 1:6. Wastage rate is apportioned based on the materials allocation.
Fibre Cement 'Slate' 8 5 Gypsum Products All roofing tiles allocated with tiles and ceramics wastage rate but listed under materials from which they are made.
Green' roof construction – intensive and extensive 10 5
54% Other inert 46% Aggregates
Intensive and extensive green roofing assumed to have similar proportions of materials but extensive is a thinner system. Intensive systems are generally between 260mm and 450mm thick. Taking the
118 http://www.silecon.cz/eng_spec4.php?sid=2742244e3fad9d9ea5770e5e0d02ac3e&nazhlsku=sanitary%20cabins
119 http://www.tensys.com/etfe.htm
120 http://www.vector-foiltec.com/
121 www.sandtoft.com/tiles/our-products/natural-clay-range/plain-tiles/2020/technical/?PHPSESSID=339627674e4e8854fef16ac11d819049
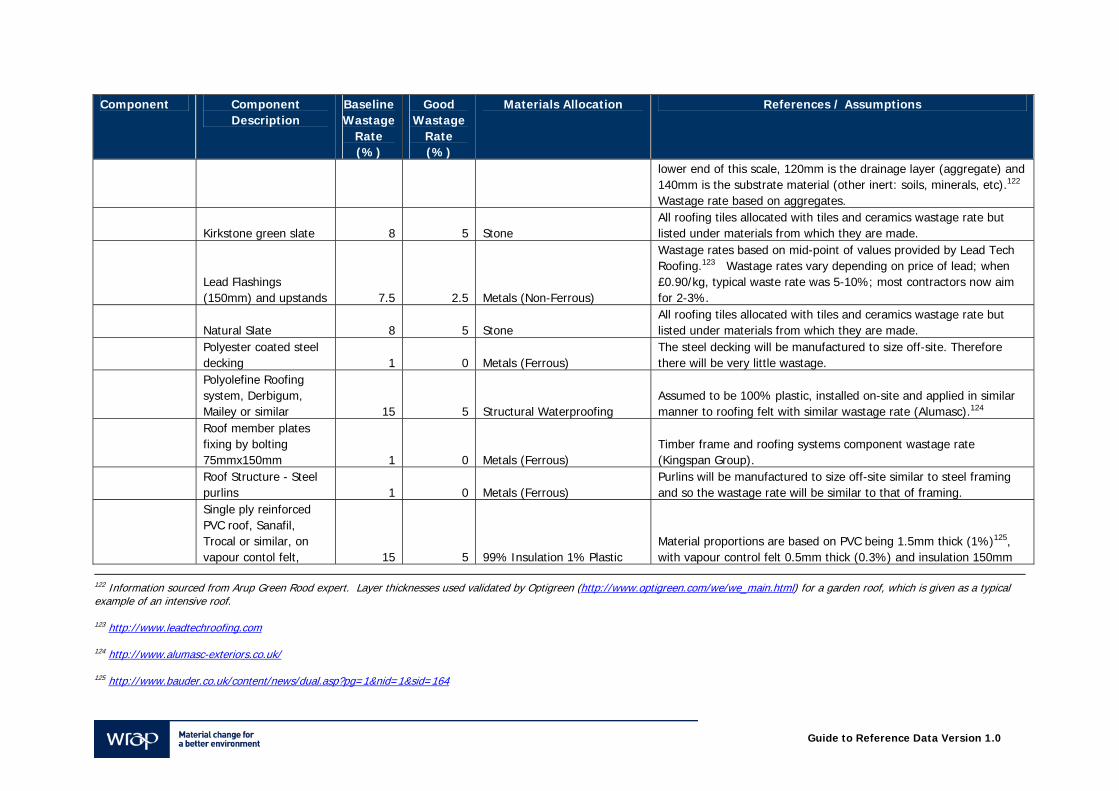
Guide to Reference Data Version 1.0
Component Component Description
Baseline Wastage
Rate (%)
Good Wastage
Rate (%)
Materials Allocation References / Assumptions
lower end of this scale, 120mm is the drainage layer (aggregate) and 140mm is the substrate material (other inert: soils, minerals, etc).122 Wastage rate based on aggregates.
Kirkstone green slate 8 5 Stone All roofing tiles allocated with tiles and ceramics wastage rate but listed under materials from which they are made.
Lead Flashings (150mm) and upstands 7.5 2.5 Metals (Non-Ferrous)
Wastage rates based on mid-point of values provided by Lead Tech Roofing.123 Wastage rates vary depending on price of lead; when £0.90/kg, typical waste rate was 5-10%; most contractors now aim for 2-3%.
Natural Slate 8 5 Stone All roofing tiles allocated with tiles and ceramics wastage rate but listed under materials from which they are made.
Polyester coated steel decking 1 0 Metals (Ferrous)
The steel decking will be manufactured to size off-site. Therefore there will be very little wastage.
Polyolefine Roofing system, Derbigum, Mailey or similar 15 5 Structural Waterproofing
Assumed to be 100% plastic, installed on-site and applied in similar manner to roofing felt with similar wastage rate (Alumasc).124
Roof member plates fixing by bolting 75mmx150mm 1 0 Metals (Ferrous)
Timber frame and roofing systems component wastage rate (Kingspan Group).
Roof Structure - Steel purlins 1 0 Metals (Ferrous)
Purlins will be manufactured to size off-site similar to steel framing and so the wastage rate will be similar to that of framing.
Single ply reinforced PVC roof, Sanafil, Trocal or similar, on vapour contol felt, 15 5 99% Insulation 1% Plastic
Material proportions are based on PVC being 1.5mm thick (1%)125, with vapour control felt 0.5mm thick (0.3%) and insulation 150mm
122 Information sourced from Arup Green Rood expert. Layer thicknesses used validated by Optigreen (http://www.optigreen.com/we/we_main.html) for a garden roof, which is given as a typical example of an intensive roof.
123 http://www.leadtechroofing.com
124 http://www.alumasc-exteriors.co.uk/
125 http://www.bauder.co.uk/content/news/dual.asp?pg=1&nid=1&sid=164
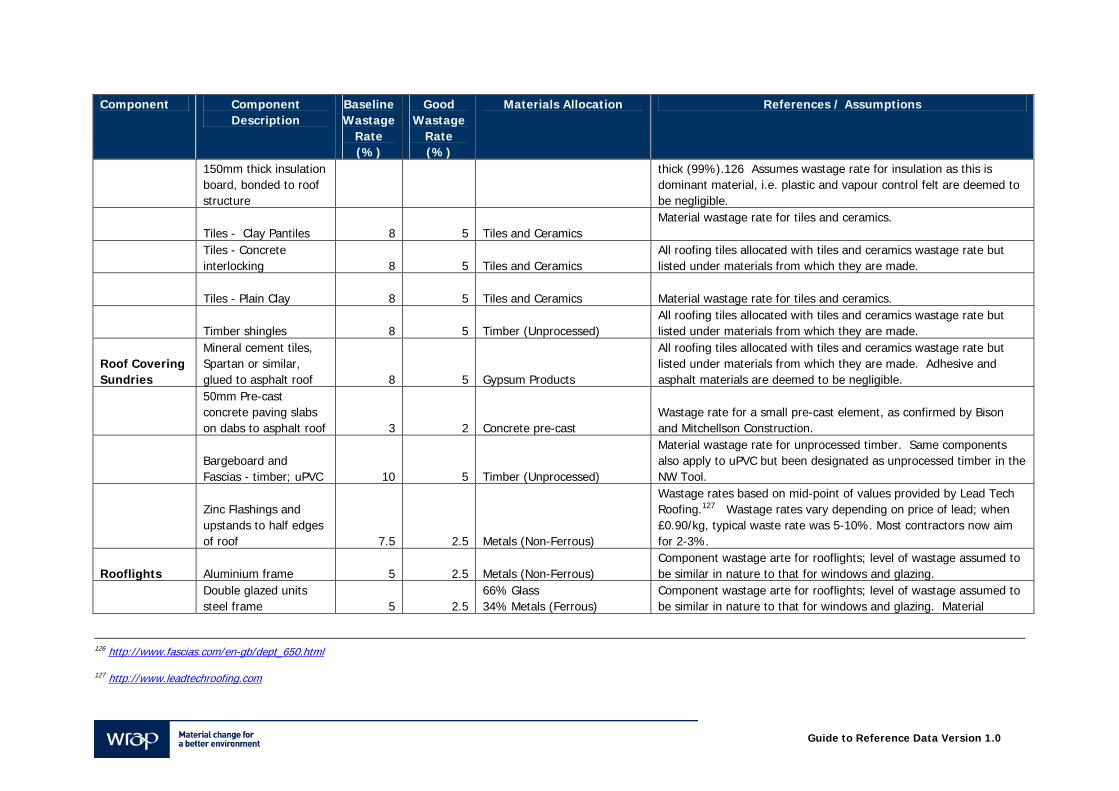
Guide to Reference Data Version 1.0
Component Component Description
Baseline Wastage
Rate (%)
Good Wastage
Rate (%)
Materials Allocation References / Assumptions
150mm thick insulation board, bonded to roof structure
thick (99%).126 Assumes wastage rate for insulation as this is dominant material, i.e. plastic and vapour control felt are deemed to be negligible.
Tiles - Clay Pantiles 8 5 Tiles and Ceramics Material wastage rate for tiles and ceramics.
Tiles - Concrete interlocking 8 5 Tiles and Ceramics
All roofing tiles allocated with tiles and ceramics wastage rate but listed under materials from which they are made.
Tiles - Plain Clay 8 5 Tiles and Ceramics Material wastage rate for tiles and ceramics.
Timber shingles 8 5 Timber (Unprocessed) All roofing tiles allocated with tiles and ceramics wastage rate but listed under materials from which they are made.
Roof Covering Sundries
Mineral cement tiles, Spartan or similar, glued to asphalt roof 8 5 Gypsum Products
All roofing tiles allocated with tiles and ceramics wastage rate but listed under materials from which they are made. Adhesive and asphalt materials are deemed to be negligible.
50mm Pre-cast concrete paving slabs on dabs to asphalt roof 3 2 Concrete pre-cast
Wastage rate for a small pre-cast element, as confirmed by Bison and Mitchellson Construction.
Bargeboard and Fascias - timber; uPVC 10 5 Timber (Unprocessed)
Material wastage rate for unprocessed timber. Same components also apply to uPVC but been designated as unprocessed timber in the NW Tool.
Zinc Flashings and upstands to half edges of roof 7.5 2.5 Metals (Non-Ferrous)
Wastage rates based on mid-point of values provided by Lead Tech Roofing.127 Wastage rates vary depending on price of lead; when £0.90/kg, typical waste rate was 5-10%. Most contractors now aim for 2-3%.
Rooflights Aluminium frame 5 2.5 Metals (Non-Ferrous) Component wastage arte for rooflights; level of wastage assumed to be similar in nature to that for windows and glazing.
Double glazed units steel frame 5 2.5
66% Glass 34% Metals (Ferrous)
Component wastage arte for rooflights; level of wastage assumed to be similar in nature to that for windows and glazing. Material
126 http://www.fascias.com/en-gb/dept_650.html
127 http://www.leadtechroofing.com
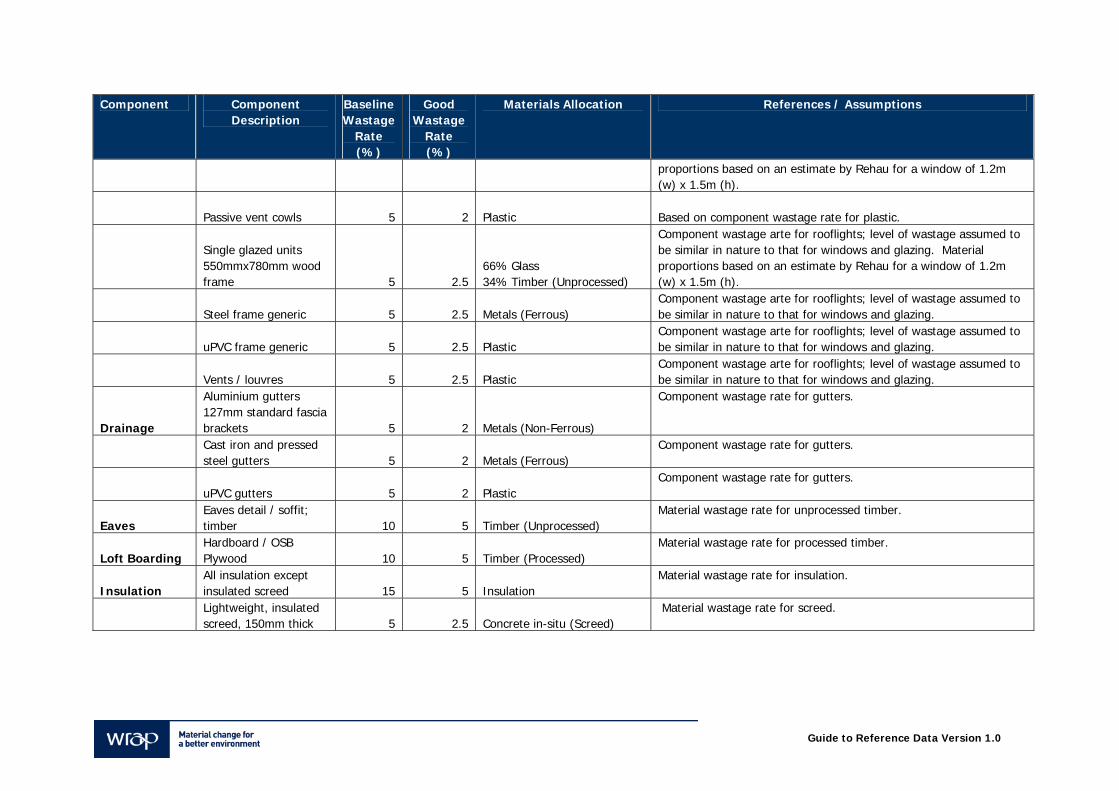
Guide to Reference Data Version 1.0
Component Component Description
Baseline Wastage
Rate (%)
Good Wastage
Rate (%)
Materials Allocation References / Assumptions
proportions based on an estimate by Rehau for a window of 1.2m (w) x 1.5m (h).
Passive vent cowls 5 2 Plastic Based on component wastage rate for plastic.
Single glazed units 550mmx780mm wood frame 5 2.5
66% Glass 34% Timber (Unprocessed)
Component wastage arte for rooflights; level of wastage assumed to be similar in nature to that for windows and glazing. Material proportions based on an estimate by Rehau for a window of 1.2m (w) x 1.5m (h).
Steel frame generic 5 2.5 Metals (Ferrous) Component wastage arte for rooflights; level of wastage assumed to be similar in nature to that for windows and glazing.
uPVC frame generic 5 2.5 Plastic Component wastage arte for rooflights; level of wastage assumed to be similar in nature to that for windows and glazing.
Vents / louvres 5 2.5 Plastic Component wastage arte for rooflights; level of wastage assumed to be similar in nature to that for windows and glazing.
Drainage
Aluminium gutters 127mm standard fascia brackets 5 2 Metals (Non-Ferrous)
Component wastage rate for gutters.
Cast iron and pressed steel gutters 5 2 Metals (Ferrous)
Component wastage rate for gutters.
uPVC gutters 5 2 Plastic Component wastage rate for gutters.
Eaves Eaves detail / soffit; timber 10 5 Timber (Unprocessed)
Material wastage rate for unprocessed timber.
Loft Boarding Hardboard / OSB Plywood 10 5 Timber (Processed)
Material wastage rate for processed timber.
Insulation All insulation except insulated screed 15 5 Insulation
Material wastage rate for insulation.
Lightweight, insulated screed, 150mm thick 5 2.5 Concrete in-situ (Screed)
Material wastage rate for screed.
Guide to Reference Data Version 1.0
MMC Wastage Rates: It is assumed that MMC processes do not apply to roof structures, so there is no further reduction in the wastage rate. Installation of roofs is predominantly an on-site process and so MMC will not affect this.
Wood Structure Steel Structures: it is assumed that roof trusses and pre-cast elements are pre-fabricated to size off-site, with wastage typically around 1% at baseline and 0% at good practice (estimate validated by Kingspan Group Plc). As such, there is no change in the wastage rate at MMC.
Concrete Structures: are all in-situ so not affected by MMC processes. The exception is PCC (pre-cast concrete) slab which is pre-fabricated off-site so not affected by MMC processes.
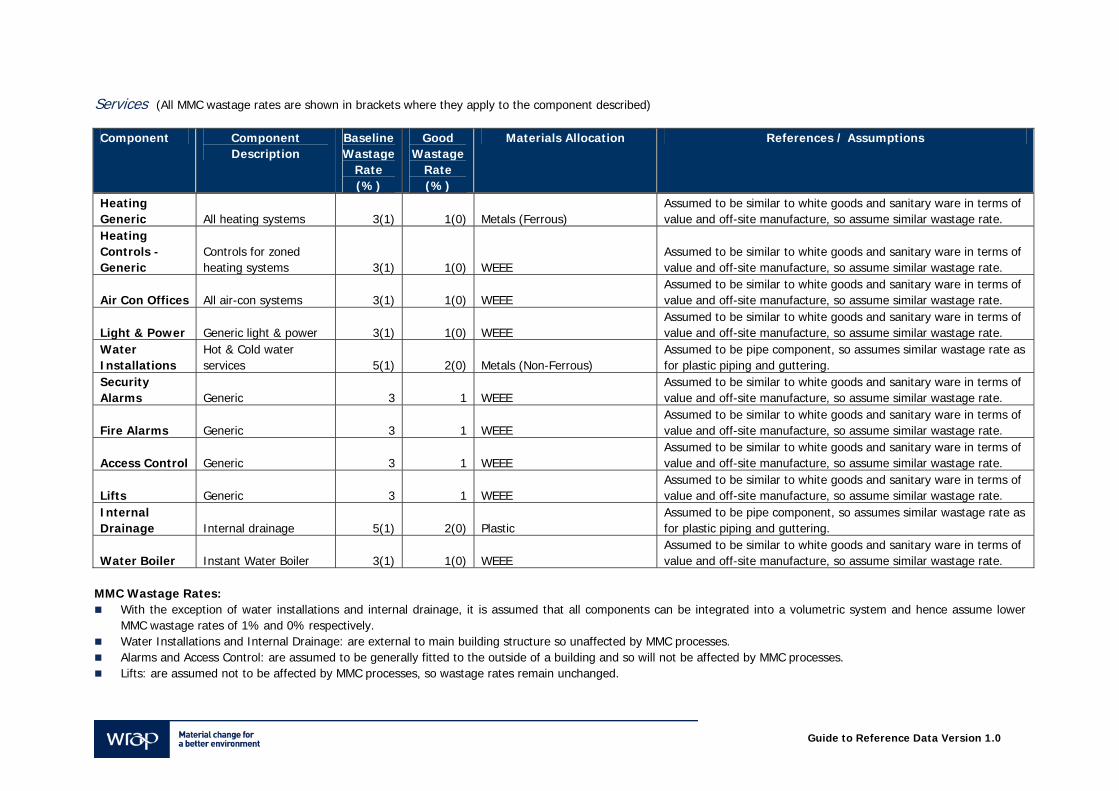
Guide to Reference Data Version 1.0
Services (All MMC wastage rates are shown in brackets where they apply to the component described) Component Component
Description Baseline Wastage
Rate (%)
Good Wastage
Rate (%)
Materials Allocation References / Assumptions
Heating Generic All heating systems 3(1) 1(0) Metals (Ferrous)
Assumed to be similar to white goods and sanitary ware in terms of value and off-site manufacture, so assume similar wastage rate.
Heating Controls - Generic
Controls for zoned heating systems 3(1) 1(0) WEEE
Assumed to be similar to white goods and sanitary ware in terms of value and off-site manufacture, so assume similar wastage rate.
Air Con Offices All air-con systems 3(1) 1(0) WEEE Assumed to be similar to white goods and sanitary ware in terms of value and off-site manufacture, so assume similar wastage rate.
Light & Power Generic light & power 3(1) 1(0) WEEE Assumed to be similar to white goods and sanitary ware in terms of value and off-site manufacture, so assume similar wastage rate.
Water Installations
Hot & Cold water services 5(1) 2(0) Metals (Non-Ferrous)
Assumed to be pipe component, so assumes similar wastage rate as for plastic piping and guttering.
Security Alarms Generic 3 1 WEEE
Assumed to be similar to white goods and sanitary ware in terms of value and off-site manufacture, so assume similar wastage rate.
Fire Alarms Generic 3 1 WEEE Assumed to be similar to white goods and sanitary ware in terms of value and off-site manufacture, so assume similar wastage rate.
Access Control Generic 3 1 WEEE Assumed to be similar to white goods and sanitary ware in terms of value and off-site manufacture, so assume similar wastage rate.
Lifts Generic 3 1 WEEE Assumed to be similar to white goods and sanitary ware in terms of value and off-site manufacture, so assume similar wastage rate.
Internal Drainage Internal drainage 5(1) 2(0) Plastic
Assumed to be pipe component, so assumes similar wastage rate as for plastic piping and guttering.
Water Boiler Instant Water Boiler 3(1) 1(0) WEEE Assumed to be similar to white goods and sanitary ware in terms of value and off-site manufacture, so assume similar wastage rate.
MMC Wastage Rates:
With the exception of water installations and internal drainage, it is assumed that all components can be integrated into a volumetric system and hence assume lower MMC wastage rates of 1% and 0% respectively.
Water Installations and Internal Drainage: are external to main building structure so unaffected by MMC processes. Alarms and Access Control: are assumed to be generally fitted to the outside of a building and so will not be affected by MMC processes. Lifts: are assumed not to be affected by MMC processes, so wastage rates remain unchanged.
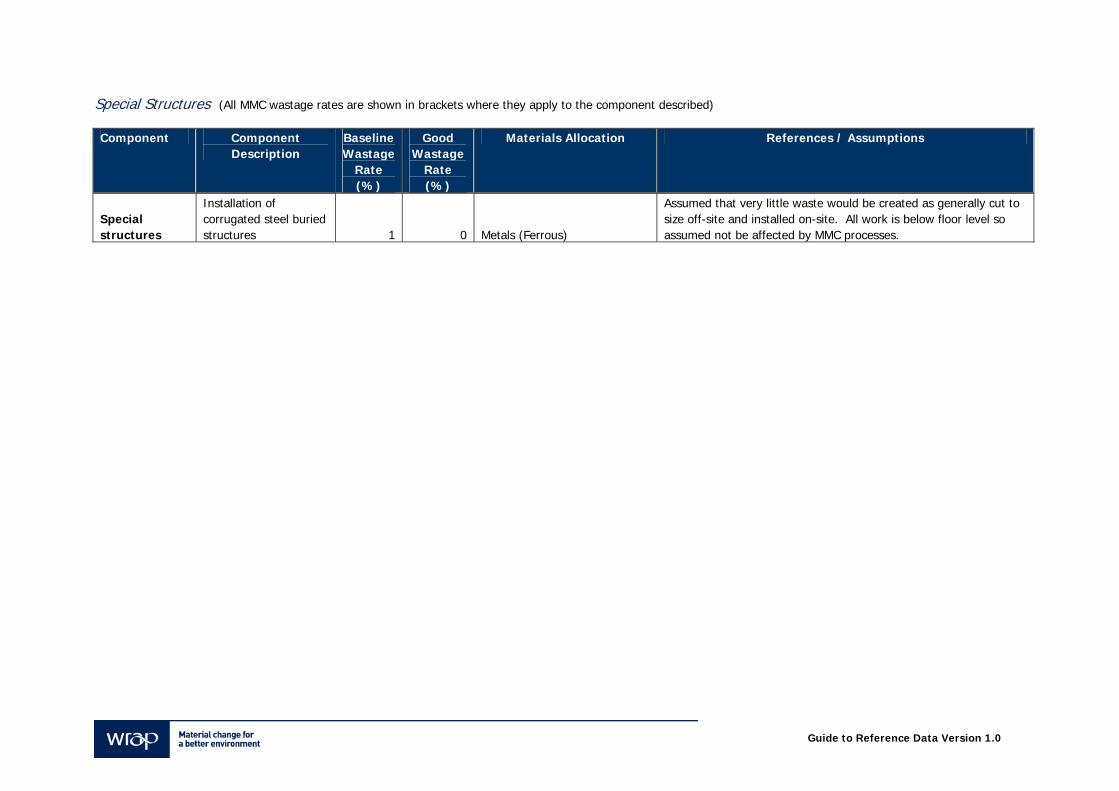
Guide to Reference Data Version 1.0
Special Structures (All MMC wastage rates are shown in brackets where they apply to the component described) Component Component
Description Baseline Wastage
Rate (%)
Good Wastage
Rate (%)
Materials Allocation References / Assumptions
Special structures
Installation of corrugated steel buried structures 1 0 Metals (Ferrous)
Assumed that very little waste would be created as generally cut to size off-site and installed on-site. All work is below floor level so assumed not be affected by MMC processes.
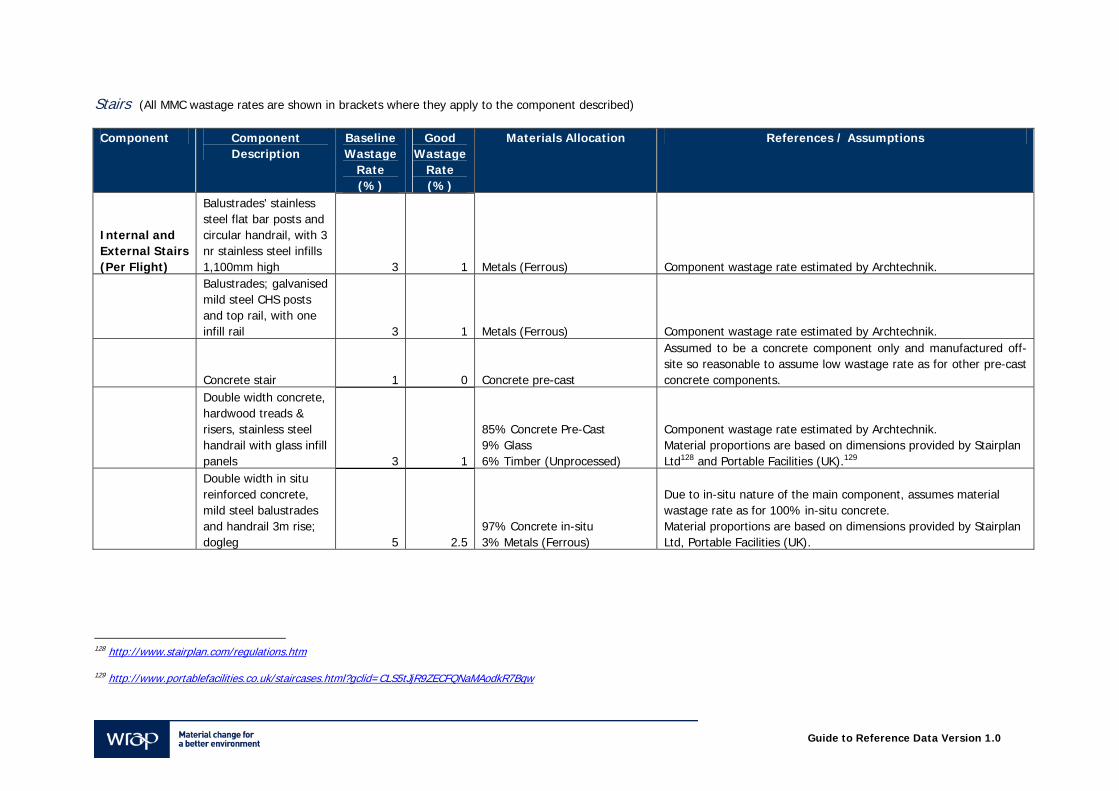
Guide to Reference Data Version 1.0
Stairs (All MMC wastage rates are shown in brackets where they apply to the component described) Component Component
Description Baseline Wastage
Rate (%)
Good Wastage
Rate (%)
Materials Allocation References / Assumptions
Internal and External Stairs (Per Flight)
Balustrades' stainless steel flat bar posts and circular handrail, with 3 nr stainless steel infills 1,100mm high 3 1 Metals (Ferrous) Component wastage rate estimated by Archtechnik.
Balustrades; galvanised mild steel CHS posts and top rail, with one infill rail 3 1 Metals (Ferrous) Component wastage rate estimated by Archtechnik.
Concrete stair 1 0 Concrete pre-cast
Assumed to be a concrete component only and manufactured off-site so reasonable to assume low wastage rate as for other pre-cast concrete components.
Double width concrete, hardwood treads & risers, stainless steel handrail with glass infill panels 3 1
85% Concrete Pre-Cast 9% Glass 6% Timber (Unprocessed)
Component wastage rate estimated by Archtechnik. Material proportions are based on dimensions provided by Stairplan Ltd128 and Portable Facilities (UK).129
Double width in situ reinforced concrete, mild steel balustrades and handrail 3m rise; dogleg 5 2.5
97% Concrete in-situ 3% Metals (Ferrous)
Due to in-situ nature of the main component, assumes material wastage rate as for 100% in-situ concrete. Material proportions are based on dimensions provided by Stairplan Ltd, Portable Facilities (UK).
128 http://www.stairplan.com/regulations.htm
129 http://www.portablefacilities.co.uk/staircases.html?gclid=CLS5tJjR9ZECFQNaMAodkR7Bqw
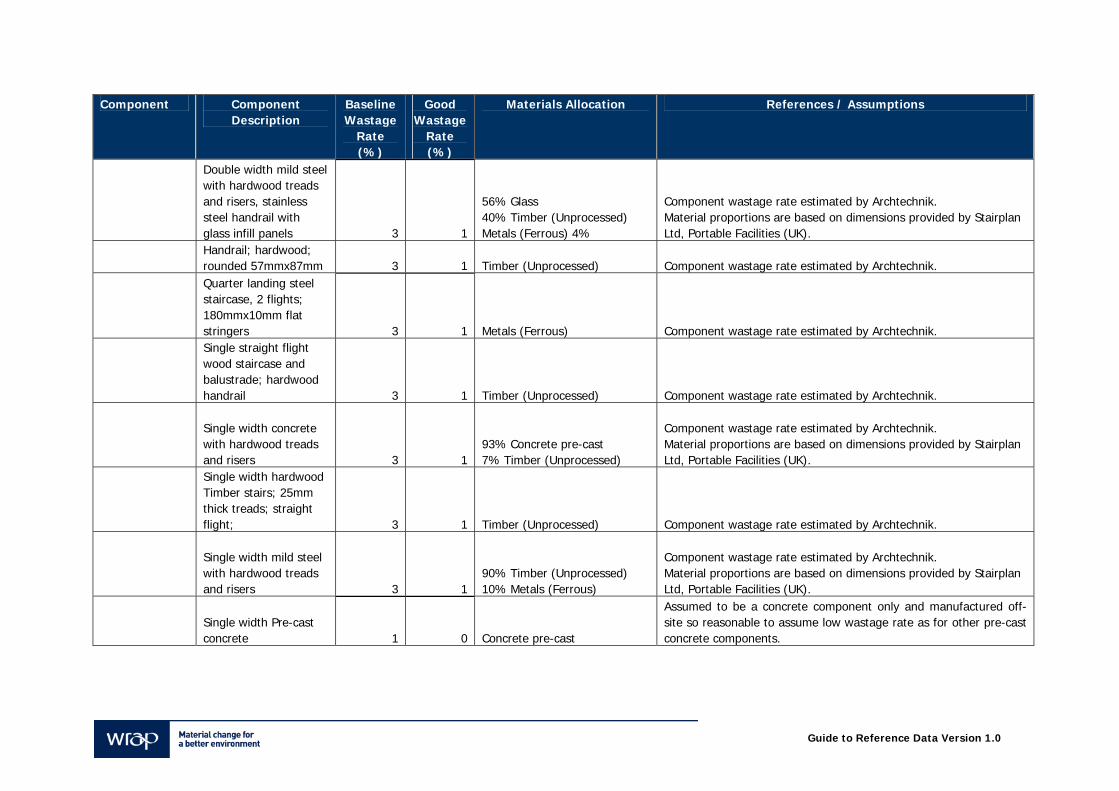
Guide to Reference Data Version 1.0
Component Component Description
Baseline Wastage
Rate (%)
Good Wastage
Rate (%)
Materials Allocation References / Assumptions
Double width mild steel with hardwood treads and risers, stainless steel handrail with glass infill panels 3 1
56% Glass 40% Timber (Unprocessed) Metals (Ferrous) 4%
Component wastage rate estimated by Archtechnik. Material proportions are based on dimensions provided by Stairplan Ltd, Portable Facilities (UK).
Handrail; hardwood; rounded 57mmx87mm 3 1 Timber (Unprocessed) Component wastage rate estimated by Archtechnik.
Quarter landing steel staircase, 2 flights; 180mmx10mm flat stringers 3 1 Metals (Ferrous) Component wastage rate estimated by Archtechnik.
Single straight flight wood staircase and balustrade; hardwood handrail 3 1 Timber (Unprocessed) Component wastage rate estimated by Archtechnik.
Single width concrete with hardwood treads and risers 3 1
93% Concrete pre-cast 7% Timber (Unprocessed)
Component wastage rate estimated by Archtechnik. Material proportions are based on dimensions provided by Stairplan Ltd, Portable Facilities (UK).
Single width hardwood Timber stairs; 25mm thick treads; straight flight; 3 1 Timber (Unprocessed) Component wastage rate estimated by Archtechnik.
Single width mild steel with hardwood treads and risers 3 1
90% Timber (Unprocessed) 10% Metals (Ferrous)
Component wastage rate estimated by Archtechnik. Material proportions are based on dimensions provided by Stairplan Ltd, Portable Facilities (UK).
Single width Pre-cast concrete 1 0 Concrete pre-cast
Assumed to be a concrete component only and manufactured off-site so reasonable to assume low wastage rate as for other pre-cast concrete components.
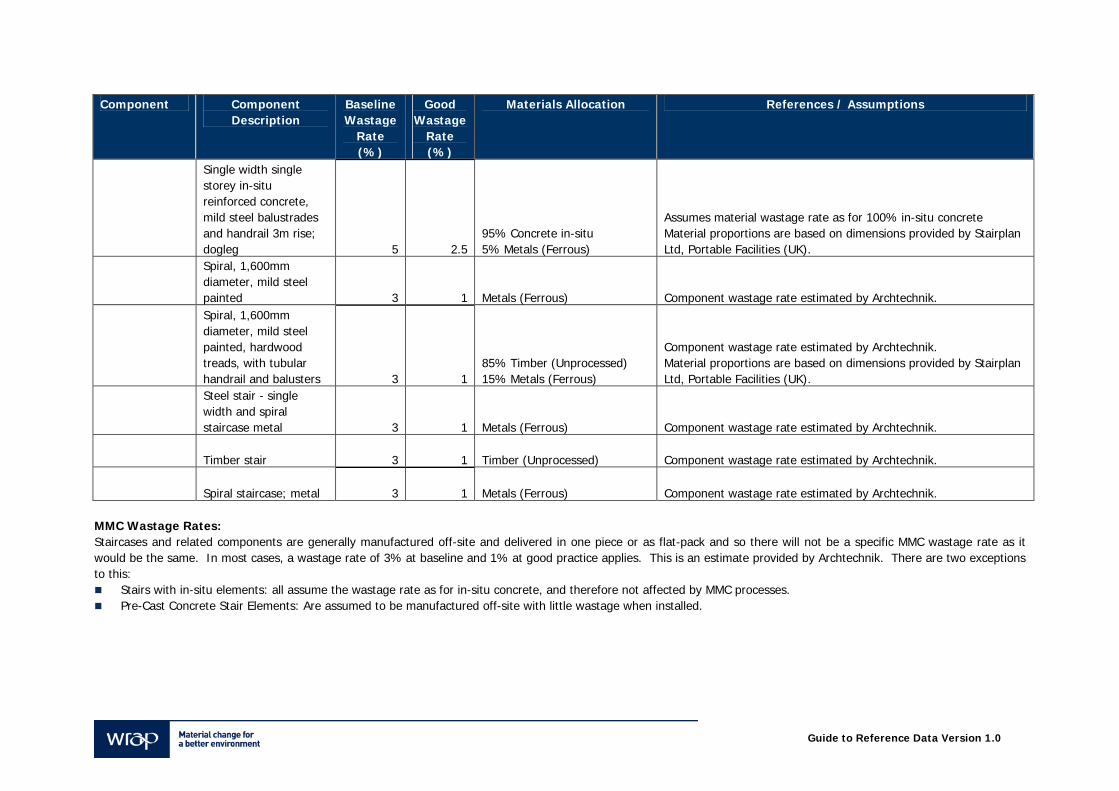
Guide to Reference Data Version 1.0
Component Component Description
Baseline Wastage
Rate (%)
Good Wastage
Rate (%)
Materials Allocation References / Assumptions
Single width single storey in-situ reinforced concrete, mild steel balustrades and handrail 3m rise; dogleg 5 2.5
95% Concrete in-situ 5% Metals (Ferrous)
Assumes material wastage rate as for 100% in-situ concrete Material proportions are based on dimensions provided by Stairplan Ltd, Portable Facilities (UK).
Spiral, 1,600mm diameter, mild steel painted 3 1 Metals (Ferrous) Component wastage rate estimated by Archtechnik.
Spiral, 1,600mm diameter, mild steel painted, hardwood treads, with tubular handrail and balusters 3 1
85% Timber (Unprocessed) 15% Metals (Ferrous)
Component wastage rate estimated by Archtechnik. Material proportions are based on dimensions provided by Stairplan Ltd, Portable Facilities (UK).
Steel stair - single width and spiral staircase metal 3 1 Metals (Ferrous) Component wastage rate estimated by Archtechnik.
Timber stair 3 1 Timber (Unprocessed) Component wastage rate estimated by Archtechnik.
Spiral staircase; metal 3 1 Metals (Ferrous) Component wastage rate estimated by Archtechnik. MMC Wastage Rates: Staircases and related components are generally manufactured off-site and delivered in one piece or as flat-pack and so there will not be a specific MMC wastage rate as it would be the same. In most cases, a wastage rate of 3% at baseline and 1% at good practice applies. This is an estimate provided by Archtechnik. There are two exceptions to this:
Stairs with in-situ elements: all assume the wastage rate as for in-situ concrete, and therefore not affected by MMC processes. Pre-Cast Concrete Stair Elements: Are assumed to be manufactured off-site with little wastage when installed.
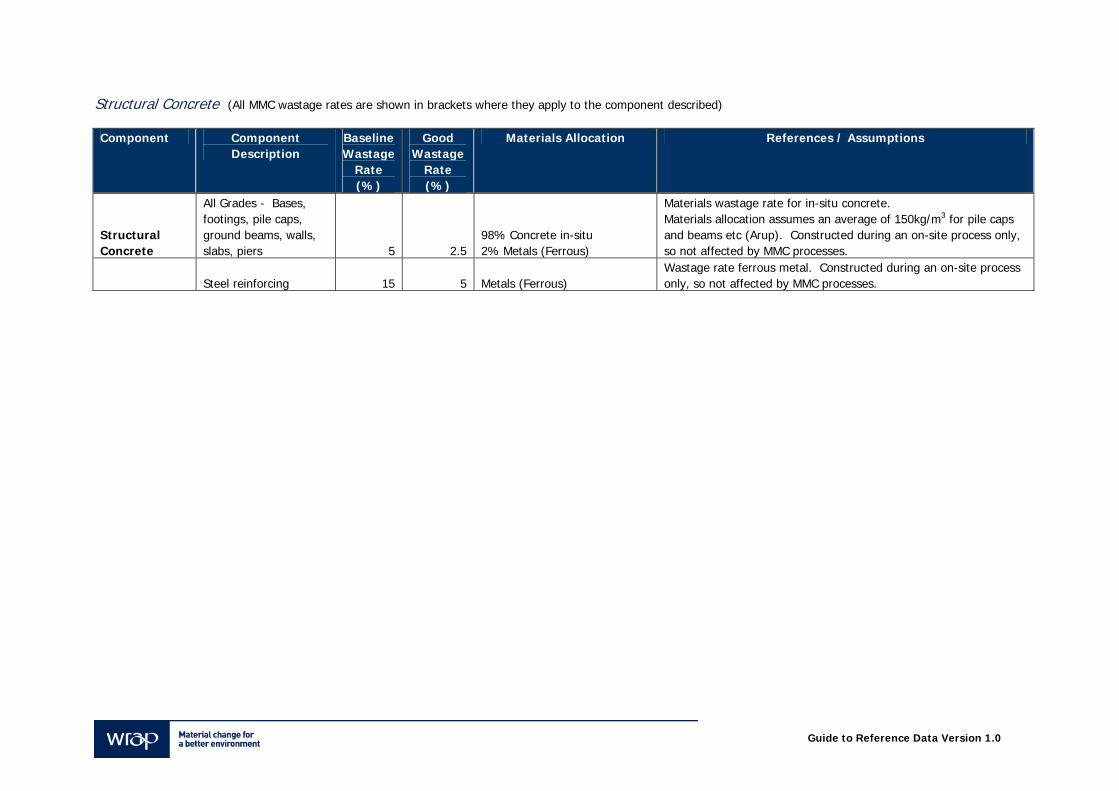
Guide to Reference Data Version 1.0
Structural Concrete (All MMC wastage rates are shown in brackets where they apply to the component described) Component Component
Description Baseline Wastage
Rate (%)
Good Wastage
Rate (%)
Materials Allocation References / Assumptions
Structural Concrete
All Grades - Bases, footings, pile caps, ground beams, walls, slabs, piers 5 2.5
98% Concrete in-situ 2% Metals (Ferrous)
Materials wastage rate for in-situ concrete. Materials allocation assumes an average of 150kg/m3 for pile caps and beams etc (Arup). Constructed during an on-site process only, so not affected by MMC processes.
Steel reinforcing 15 5 Metals (Ferrous) Wastage rate ferrous metal. Constructed during an on-site process only, so not affected by MMC processes.
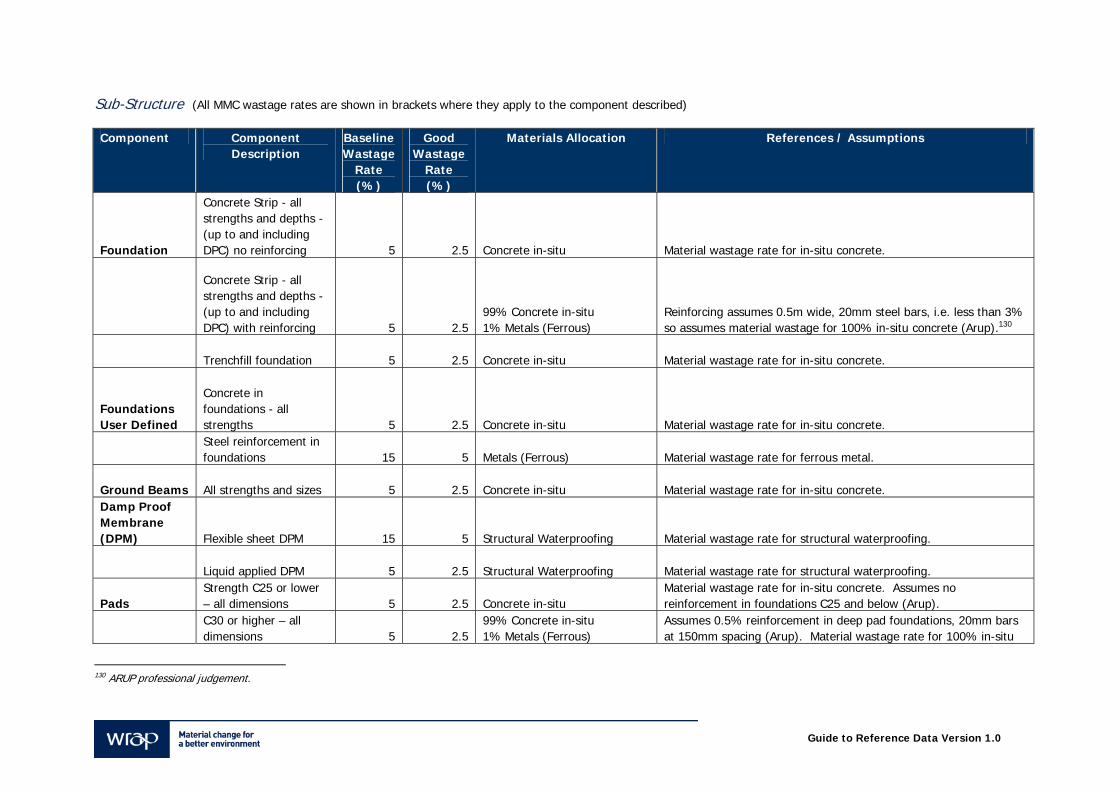
Guide to Reference Data Version 1.0
Sub-Structure (All MMC wastage rates are shown in brackets where they apply to the component described) Component Component
Description Baseline Wastage
Rate (%)
Good Wastage
Rate (%)
Materials Allocation References / Assumptions
Foundation
Concrete Strip - all strengths and depths - (up to and including DPC) no reinforcing 5 2.5 Concrete in-situ Material wastage rate for in-situ concrete.
Concrete Strip - all strengths and depths - (up to and including DPC) with reinforcing 5 2.5
99% Concrete in-situ 1% Metals (Ferrous)
Reinforcing assumes 0.5m wide, 20mm steel bars, i.e. less than 3% so assumes material wastage for 100% in-situ concrete (Arup).130
Trenchfill foundation 5 2.5 Concrete in-situ Material wastage rate for in-situ concrete.
Foundations User Defined
Concrete in foundations - all strengths 5 2.5 Concrete in-situ Material wastage rate for in-situ concrete.
Steel reinforcement in foundations 15 5 Metals (Ferrous) Material wastage rate for ferrous metal.
Ground Beams All strengths and sizes 5 2.5 Concrete in-situ Material wastage rate for in-situ concrete. Damp Proof Membrane (DPM) Flexible sheet DPM 15 5 Structural Waterproofing Material wastage rate for structural waterproofing.
Liquid applied DPM 5 2.5 Structural Waterproofing Material wastage rate for structural waterproofing.
Pads Strength C25 or lower – all dimensions 5 2.5 Concrete in-situ
Material wastage rate for in-situ concrete. Assumes no reinforcement in foundations C25 and below (Arup).
C30 or higher – all dimensions 5 2.5
99% Concrete in-situ 1% Metals (Ferrous)
Assumes 0.5% reinforcement in deep pad foundations, 20mm bars at 150mm spacing (Arup). Material wastage rate for 100% in-situ
130 ARUP professional judgement.
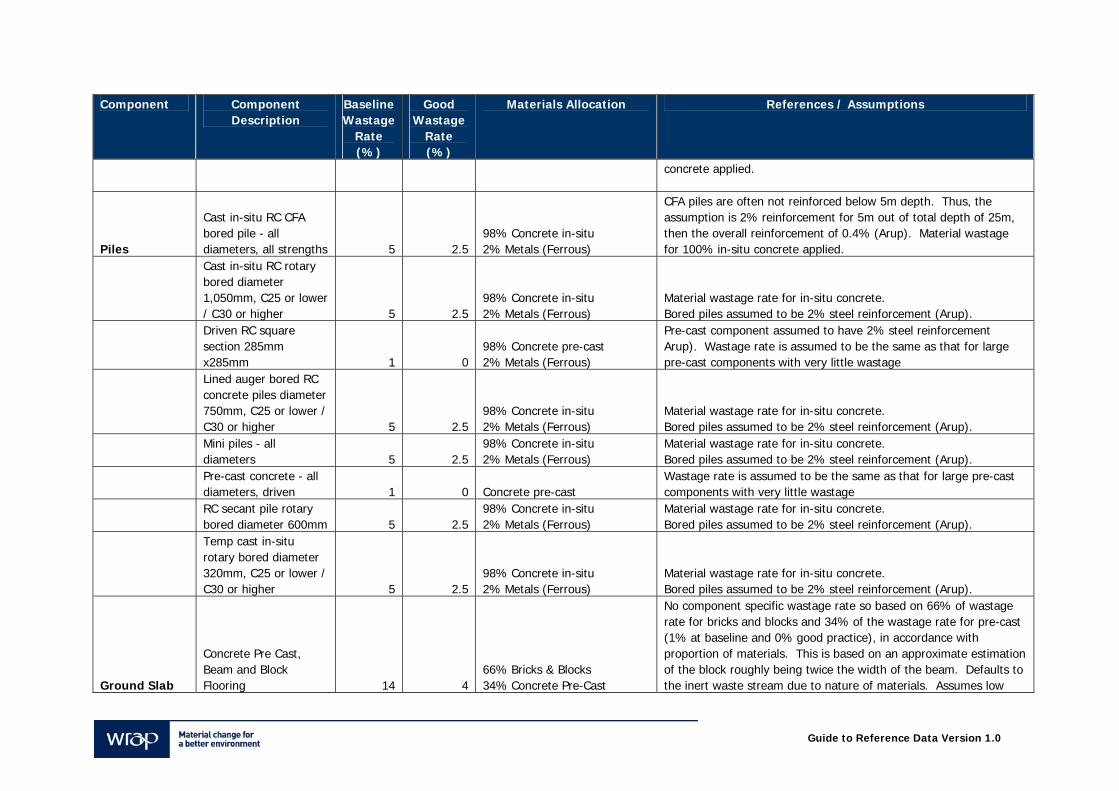
Guide to Reference Data Version 1.0
Component Component Description
Baseline Wastage
Rate (%)
Good Wastage
Rate (%)
Materials Allocation References / Assumptions
concrete applied.
Piles
Cast in-situ RC CFA bored pile - all diameters, all strengths 5 2.5
98% Concrete in-situ 2% Metals (Ferrous)
CFA piles are often not reinforced below 5m depth. Thus, the assumption is 2% reinforcement for 5m out of total depth of 25m, then the overall reinforcement of 0.4% (Arup). Material wastage for 100% in-situ concrete applied.
Cast in-situ RC rotary bored diameter 1,050mm, C25 or lower / C30 or higher 5 2.5
98% Concrete in-situ 2% Metals (Ferrous)
Material wastage rate for in-situ concrete. Bored piles assumed to be 2% steel reinforcement (Arup).
Driven RC square section 285mm x285mm 1 0
98% Concrete pre-cast 2% Metals (Ferrous)
Pre-cast component assumed to have 2% steel reinforcement Arup). Wastage rate is assumed to be the same as that for large pre-cast components with very little wastage
Lined auger bored RC concrete piles diameter 750mm, C25 or lower / C30 or higher 5 2.5
98% Concrete in-situ 2% Metals (Ferrous)
Material wastage rate for in-situ concrete. Bored piles assumed to be 2% steel reinforcement (Arup).
Mini piles - all diameters 5 2.5
98% Concrete in-situ 2% Metals (Ferrous)
Material wastage rate for in-situ concrete. Bored piles assumed to be 2% steel reinforcement (Arup).
Pre-cast concrete - all diameters, driven 1 0 Concrete pre-cast
Wastage rate is assumed to be the same as that for large pre-cast components with very little wastage
RC secant pile rotary bored diameter 600mm 5 2.5
98% Concrete in-situ 2% Metals (Ferrous)
Material wastage rate for in-situ concrete. Bored piles assumed to be 2% steel reinforcement (Arup).
Temp cast in-situ rotary bored diameter 320mm, C25 or lower / C30 or higher 5 2.5
98% Concrete in-situ 2% Metals (Ferrous)
Material wastage rate for in-situ concrete. Bored piles assumed to be 2% steel reinforcement (Arup).
Ground Slab
Concrete Pre Cast, Beam and Block Flooring 14 4
66% Bricks & Blocks 34% Concrete Pre-Cast
No component specific wastage rate so based on 66% of wastage rate for bricks and blocks and 34% of the wastage rate for pre-cast (1% at baseline and 0% good practice), in accordance with proportion of materials. This is based on an approximate estimation of the block roughly being twice the width of the beam. Defaults to the inert waste stream due to nature of materials. Assumes low
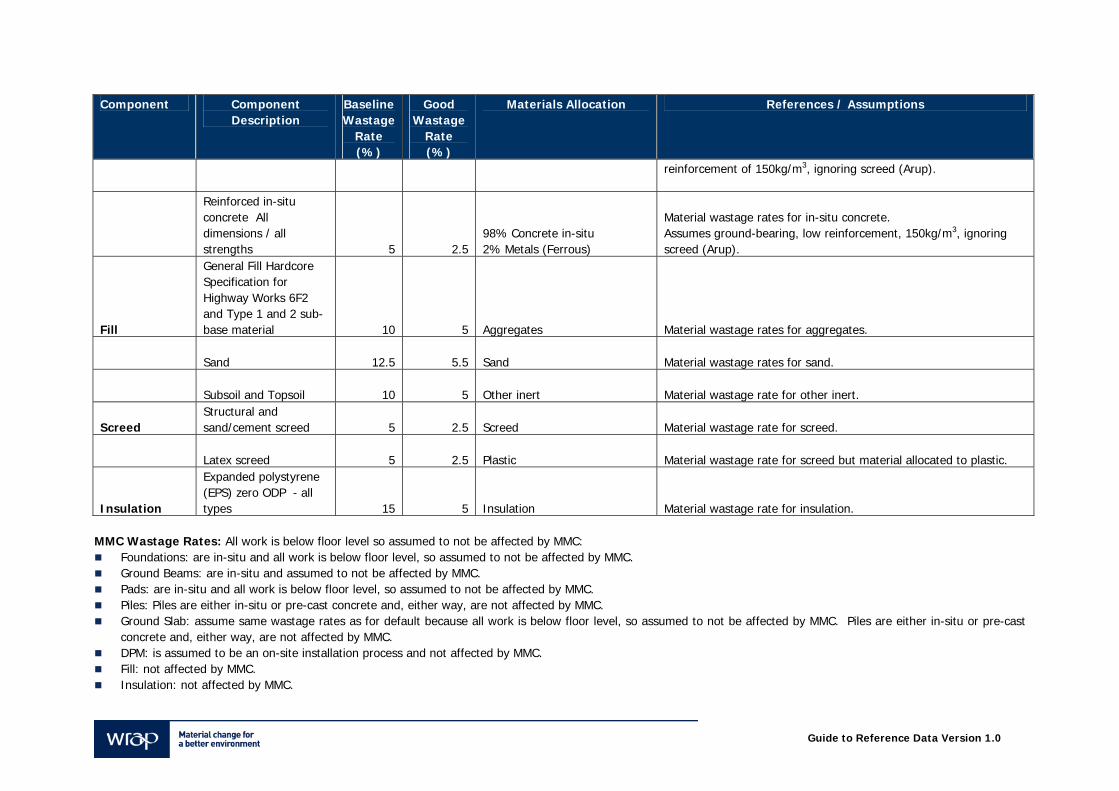
Guide to Reference Data Version 1.0
Component Component Description
Baseline Wastage
Rate (%)
Good Wastage
Rate (%)
Materials Allocation References / Assumptions
reinforcement of 150kg/m3, ignoring screed (Arup).
Reinforced in-situ concrete All dimensions / all strengths 5 2.5
98% Concrete in-situ 2% Metals (Ferrous)
Material wastage rates for in-situ concrete. Assumes ground-bearing, low reinforcement, 150kg/m3, ignoring screed (Arup).
Fill
General Fill Hardcore Specification for Highway Works 6F2 and Type 1 and 2 sub-base material 10 5 Aggregates Material wastage rates for aggregates.
Sand 12.5 5.5 Sand Material wastage rates for sand.
Subsoil and Topsoil 10 5 Other inert Material wastage rate for other inert.
Screed Structural and sand/cement screed 5 2.5 Screed Material wastage rate for screed.
Latex screed 5 2.5 Plastic Material wastage rate for screed but material allocated to plastic.
Insulation
Expanded polystyrene (EPS) zero ODP - all types 15 5 Insulation Material wastage rate for insulation.
MMC Wastage Rates: All work is below floor level so assumed to not be affected by MMC:
Foundations: are in-situ and all work is below floor level, so assumed to not be affected by MMC. Ground Beams: are in-situ and assumed to not be affected by MMC. Pads: are in-situ and all work is below floor level, so assumed to not be affected by MMC. Piles: Piles are either in-situ or pre-cast concrete and, either way, are not affected by MMC. Ground Slab: assume same wastage rates as for default because all work is below floor level, so assumed to not be affected by MMC. Piles are either in-situ or pre-cast
concrete and, either way, are not affected by MMC. DPM: is assumed to be an on-site installation process and not affected by MMC. Fill: not affected by MMC. Insulation: not affected by MMC.
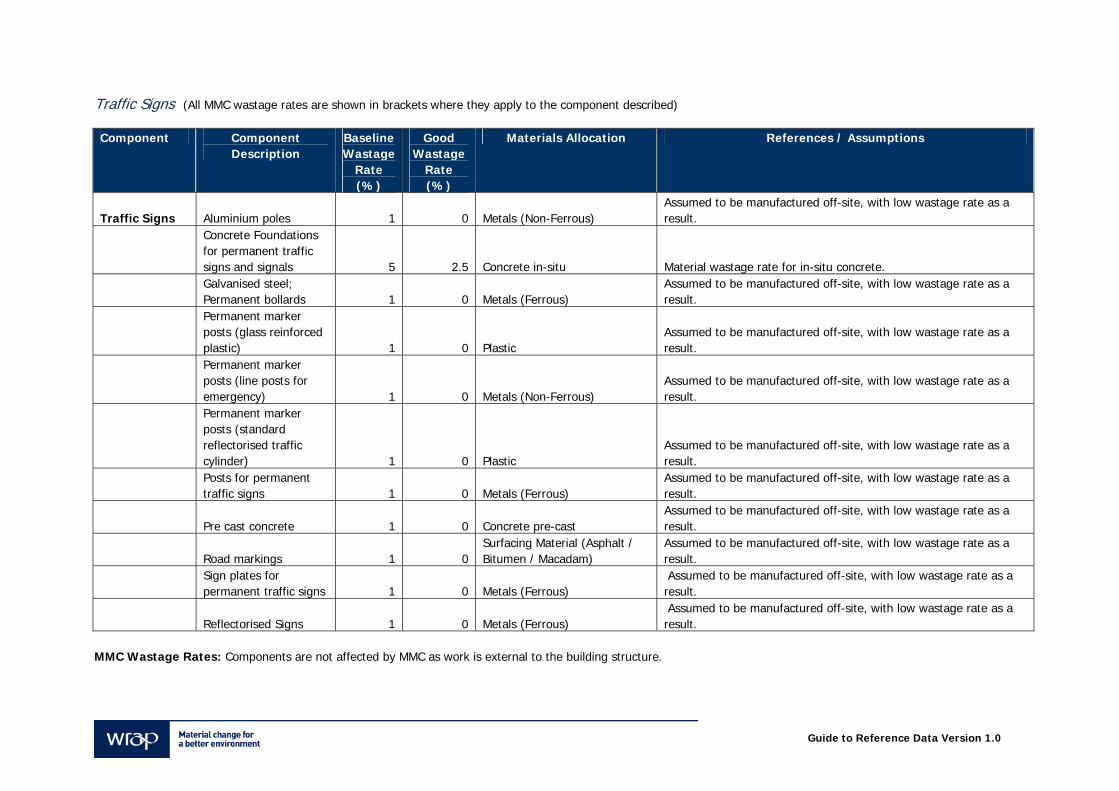
Guide to Reference Data Version 1.0
Traffic Signs (All MMC wastage rates are shown in brackets where they apply to the component described) Component Component
Description Baseline Wastage
Rate (%)
Good Wastage
Rate (%)
Materials Allocation References / Assumptions
Traffic Signs Aluminium poles 1 0 Metals (Non-Ferrous) Assumed to be manufactured off-site, with low wastage rate as a result.
Concrete Foundations for permanent traffic signs and signals 5 2.5 Concrete in-situ Material wastage rate for in-situ concrete.
Galvanised steel; Permanent bollards 1 0 Metals (Ferrous)
Assumed to be manufactured off-site, with low wastage rate as a result.
Permanent marker posts (glass reinforced plastic) 1 0 Plastic
Assumed to be manufactured off-site, with low wastage rate as a result.
Permanent marker posts (line posts for emergency) 1 0 Metals (Non-Ferrous)
Assumed to be manufactured off-site, with low wastage rate as a result.
Permanent marker posts (standard reflectorised traffic cylinder) 1 0 Plastic
Assumed to be manufactured off-site, with low wastage rate as a result.
Posts for permanent traffic signs 1 0 Metals (Ferrous)
Assumed to be manufactured off-site, with low wastage rate as a result.
Pre cast concrete 1 0 Concrete pre-cast Assumed to be manufactured off-site, with low wastage rate as a result.
Road markings 1 0 Surfacing Material (Asphalt / Bitumen / Macadam)
Assumed to be manufactured off-site, with low wastage rate as a result.
Sign plates for permanent traffic signs 1 0 Metals (Ferrous)
Assumed to be manufactured off-site, with low wastage rate as a result.
Reflectorised Signs 1 0 Metals (Ferrous) Assumed to be manufactured off-site, with low wastage rate as a result.
MMC Wastage Rates: Components are not affected by MMC as work is external to the building structure.
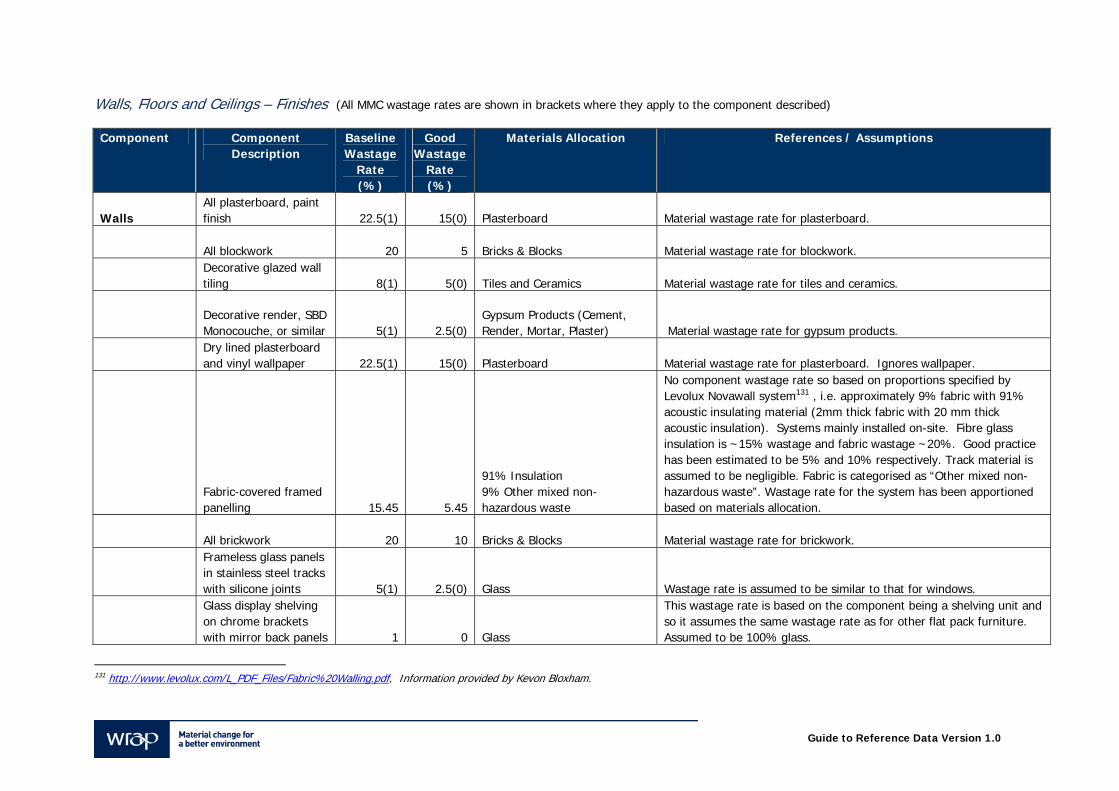
Guide to Reference Data Version 1.0
Walls, Floors and Ceilings – Finishes (All MMC wastage rates are shown in brackets where they apply to the component described) Component Component
Description Baseline Wastage
Rate (%)
Good Wastage
Rate (%)
Materials Allocation References / Assumptions
Walls All plasterboard, paint finish 22.5(1) 15(0) Plasterboard Material wastage rate for plasterboard.
All blockwork 20 5 Bricks & Blocks Material wastage rate for blockwork.
Decorative glazed wall tiling 8(1) 5(0) Tiles and Ceramics Material wastage rate for tiles and ceramics.
Decorative render, SBD Monocouche, or similar 5(1) 2.5(0)
Gypsum Products (Cement, Render, Mortar, Plaster) Material wastage rate for gypsum products.
Dry lined plasterboard and vinyl wallpaper 22.5(1) 15(0) Plasterboard Material wastage rate for plasterboard. Ignores wallpaper.
Fabric-covered framed panelling 15.45 5.45
91% Insulation 9% Other mixed non-hazardous waste
No component wastage rate so based on proportions specified by Levolux Novawall system131 , i.e. approximately 9% fabric with 91% acoustic insulating material (2mm thick fabric with 20 mm thick acoustic insulation). Systems mainly installed on-site. Fibre glass insulation is ~15% wastage and fabric wastage ~20%. Good practice has been estimated to be 5% and 10% respectively. Track material is assumed to be negligible. Fabric is categorised as “Other mixed non-hazardous waste”. Wastage rate for the system has been apportioned based on materials allocation.
All brickwork 20 10 Bricks & Blocks Material wastage rate for brickwork.
Frameless glass panels in stainless steel tracks with silicone joints 5(1) 2.5(0) Glass Wastage rate is assumed to be similar to that for windows.
Glass display shelving on chrome brackets with mirror back panels 1 0 Glass
This wastage rate is based on the component being a shelving unit and so it assumes the same wastage rate as for other flat pack furniture. Assumed to be 100% glass.
131 http://www.levolux.com/L_PDF_Files/Fabric%20Walling.pdf, Information provided by Kevon Bloxham.
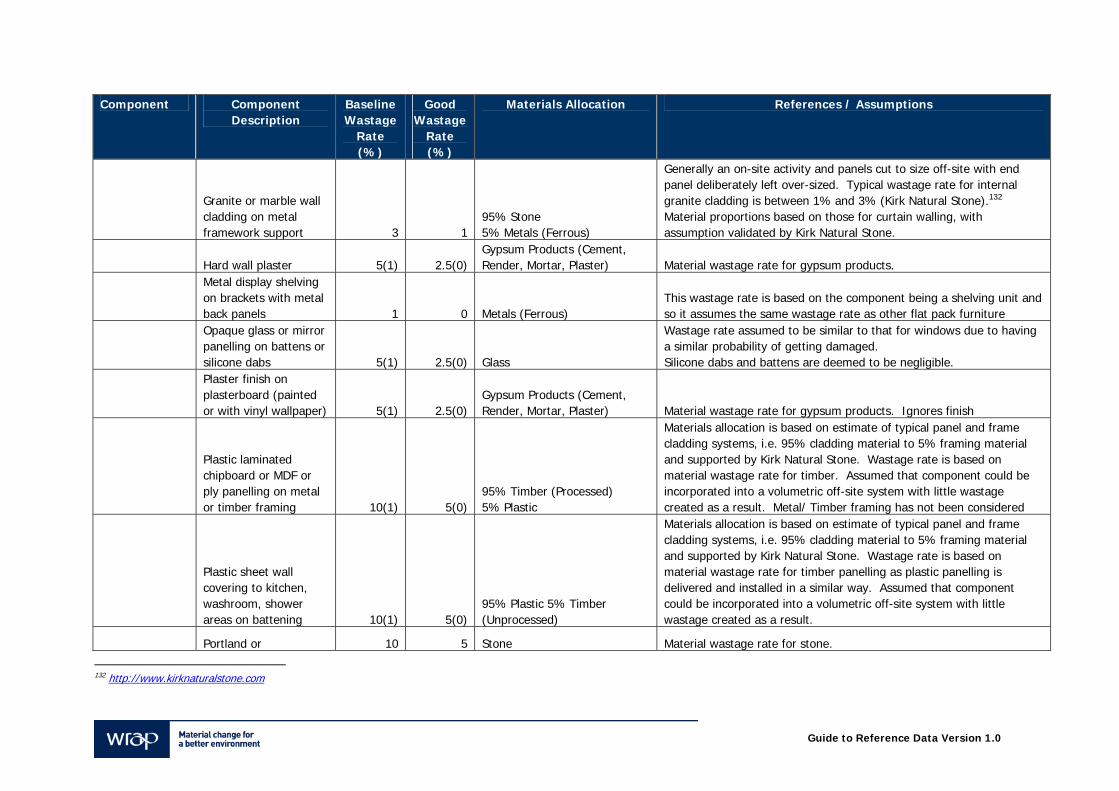
Guide to Reference Data Version 1.0
Component Component Description
Baseline Wastage
Rate (%)
Good Wastage
Rate (%)
Materials Allocation References / Assumptions
Granite or marble wall cladding on metal framework support 3 1
95% Stone 5% Metals (Ferrous)
Generally an on-site activity and panels cut to size off-site with end panel deliberately left over-sized. Typical wastage rate for internal granite cladding is between 1% and 3% (Kirk Natural Stone).132 Material proportions based on those for curtain walling, with assumption validated by Kirk Natural Stone.
Hard wall plaster 5(1) 2.5(0) Gypsum Products (Cement, Render, Mortar, Plaster) Material wastage rate for gypsum products.
Metal display shelving on brackets with metal back panels 1 0 Metals (Ferrous)
This wastage rate is based on the component being a shelving unit and so it assumes the same wastage rate as other flat pack furniture
Opaque glass or mirror panelling on battens or silicone dabs 5(1) 2.5(0) Glass
Wastage rate assumed to be similar to that for windows due to having a similar probability of getting damaged. Silicone dabs and battens are deemed to be negligible.
Plaster finish on plasterboard (painted or with vinyl wallpaper) 5(1) 2.5(0)
Gypsum Products (Cement, Render, Mortar, Plaster) Material wastage rate for gypsum products. Ignores finish
Plastic laminated chipboard or MDF or ply panelling on metal or timber framing 10(1) 5(0)
95% Timber (Processed) 5% Plastic
Materials allocation is based on estimate of typical panel and frame cladding systems, i.e. 95% cladding material to 5% framing material and supported by Kirk Natural Stone. Wastage rate is based on material wastage rate for timber. Assumed that component could be incorporated into a volumetric off-site system with little wastage created as a result. Metal/ Timber framing has not been considered
Plastic sheet wall covering to kitchen, washroom, shower areas on battening 10(1) 5(0)
95% Plastic 5% Timber (Unprocessed)
Materials allocation is based on estimate of typical panel and frame cladding systems, i.e. 95% cladding material to 5% framing material and supported by Kirk Natural Stone. Wastage rate is based on material wastage rate for timber panelling as plastic panelling is delivered and installed in a similar way. Assumed that component could be incorporated into a volumetric off-site system with little wastage created as a result.
Portland or 10 5 Stone Material wastage rate for stone.
132 http://www.kirknaturalstone.com
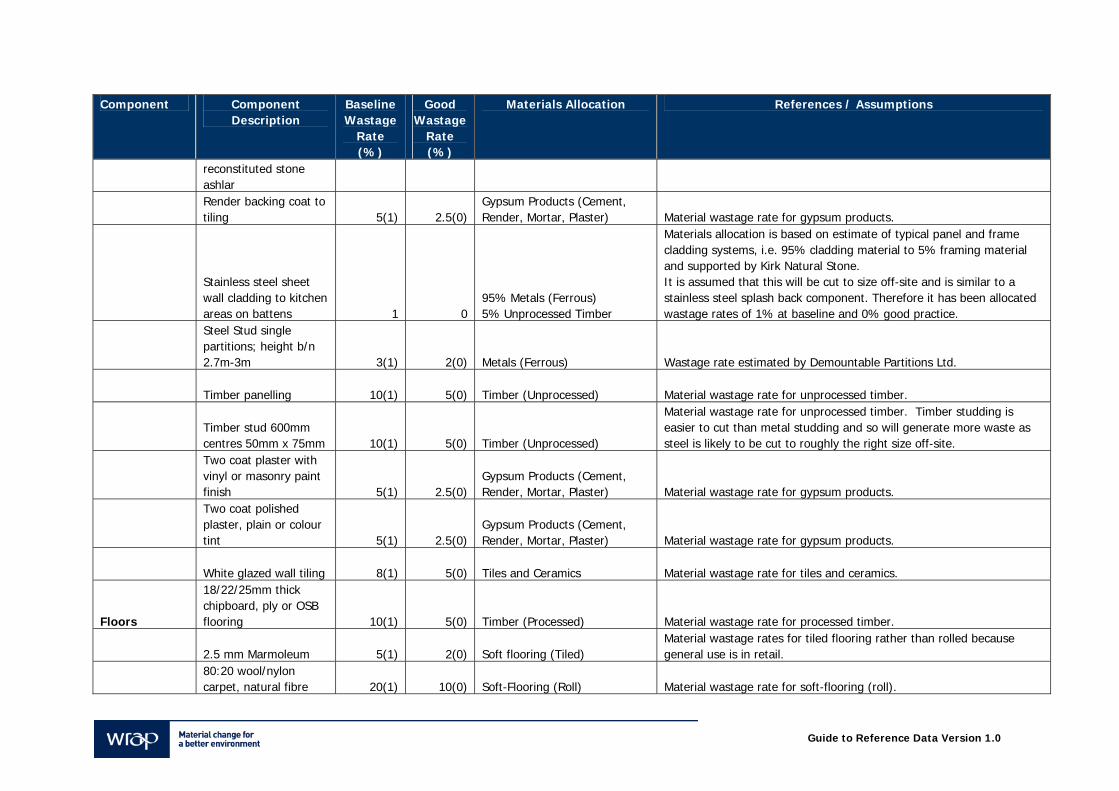
Guide to Reference Data Version 1.0
Component Component Description
Baseline Wastage
Rate (%)
Good Wastage
Rate (%)
Materials Allocation References / Assumptions
reconstituted stone ashlar
Render backing coat to tiling 5(1) 2.5(0)
Gypsum Products (Cement, Render, Mortar, Plaster) Material wastage rate for gypsum products.
Stainless steel sheet wall cladding to kitchen areas on battens 1 0
95% Metals (Ferrous) 5% Unprocessed Timber
Materials allocation is based on estimate of typical panel and frame cladding systems, i.e. 95% cladding material to 5% framing material and supported by Kirk Natural Stone. It is assumed that this will be cut to size off-site and is similar to a stainless steel splash back component. Therefore it has been allocated wastage rates of 1% at baseline and 0% good practice.
Steel Stud single partitions; height b/n 2.7m-3m 3(1) 2(0) Metals (Ferrous) Wastage rate estimated by Demountable Partitions Ltd.
Timber panelling 10(1) 5(0) Timber (Unprocessed) Material wastage rate for unprocessed timber.
Timber stud 600mm centres 50mm x 75mm 10(1) 5(0) Timber (Unprocessed)
Material wastage rate for unprocessed timber. Timber studding is easier to cut than metal studding and so will generate more waste as steel is likely to be cut to roughly the right size off-site.
Two coat plaster with vinyl or masonry paint finish 5(1) 2.5(0)
Gypsum Products (Cement, Render, Mortar, Plaster) Material wastage rate for gypsum products.
Two coat polished plaster, plain or colour tint 5(1) 2.5(0)
Gypsum Products (Cement, Render, Mortar, Plaster) Material wastage rate for gypsum products.
White glazed wall tiling 8(1) 5(0) Tiles and Ceramics Material wastage rate for tiles and ceramics.
Floors
18/22/25mm thick chipboard, ply or OSB flooring 10(1) 5(0) Timber (Processed) Material wastage rate for processed timber.
2.5 mm Marmoleum 5(1) 2(0) Soft flooring (Tiled) Material wastage rates for tiled flooring rather than rolled because general use is in retail.
80:20 wool/nylon carpet, natural fibre 20(1) 10(0) Soft-Flooring (Roll) Material wastage rate for soft-flooring (roll).
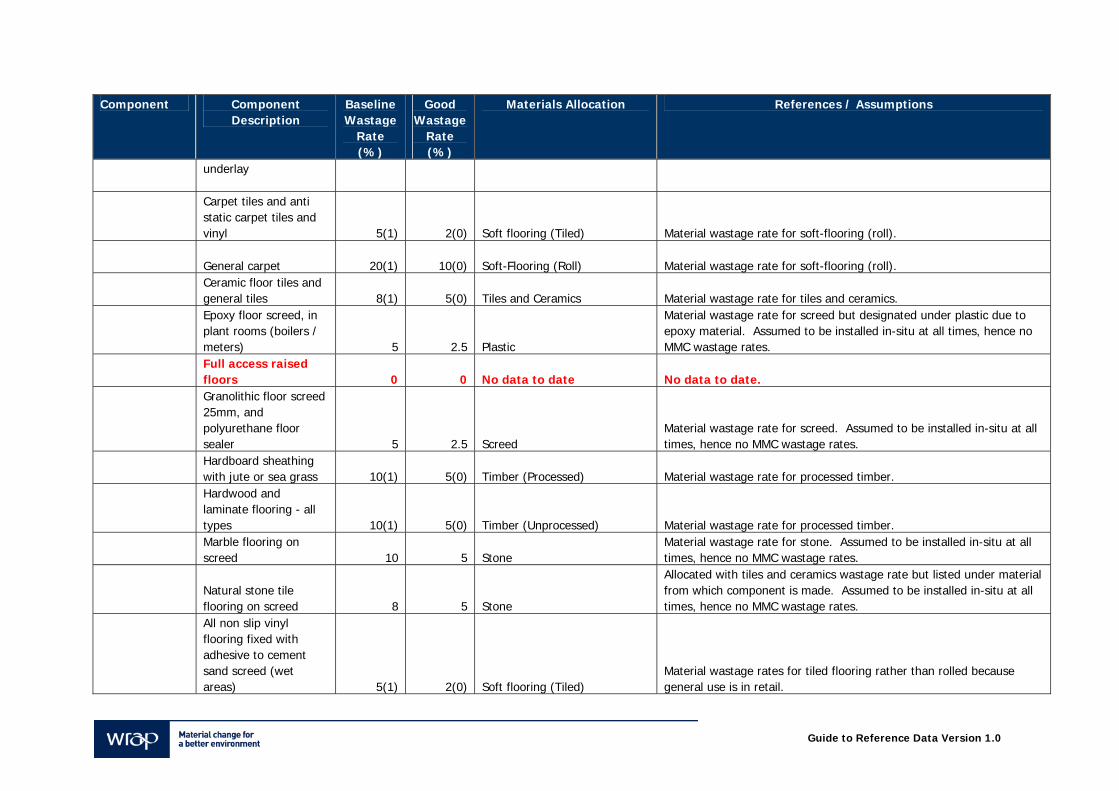
Guide to Reference Data Version 1.0
Component Component Description
Baseline Wastage
Rate (%)
Good Wastage
Rate (%)
Materials Allocation References / Assumptions
underlay
Carpet tiles and anti static carpet tiles and vinyl 5(1) 2(0) Soft flooring (Tiled) Material wastage rate for soft-flooring (roll).
General carpet 20(1) 10(0) Soft-Flooring (Roll) Material wastage rate for soft-flooring (roll).
Ceramic floor tiles and general tiles 8(1) 5(0) Tiles and Ceramics Material wastage rate for tiles and ceramics.
Epoxy floor screed, in plant rooms (boilers / meters) 5 2.5 Plastic
Material wastage rate for screed but designated under plastic due to epoxy material. Assumed to be installed in-situ at all times, hence no MMC wastage rates.
Full access raised floors 0 0 No data to date No data to date.
Granolithic floor screed 25mm, and polyurethane floor sealer 5 2.5 Screed
Material wastage rate for screed. Assumed to be installed in-situ at all times, hence no MMC wastage rates.
Hardboard sheathing with jute or sea grass 10(1) 5(0) Timber (Processed) Material wastage rate for processed timber.
Hardwood and laminate flooring - all types 10(1) 5(0) Timber (Unprocessed) Material wastage rate for processed timber.
Marble flooring on screed 10 5 Stone
Material wastage rate for stone. Assumed to be installed in-situ at all times, hence no MMC wastage rates.
Natural stone tile flooring on screed 8 5 Stone
Allocated with tiles and ceramics wastage rate but listed under material from which component is made. Assumed to be installed in-situ at all times, hence no MMC wastage rates.
All non slip vinyl flooring fixed with adhesive to cement sand screed (wet areas) 5(1) 2(0) Soft flooring (Tiled)
Material wastage rates for tiled flooring rather than rolled because general use is in retail.
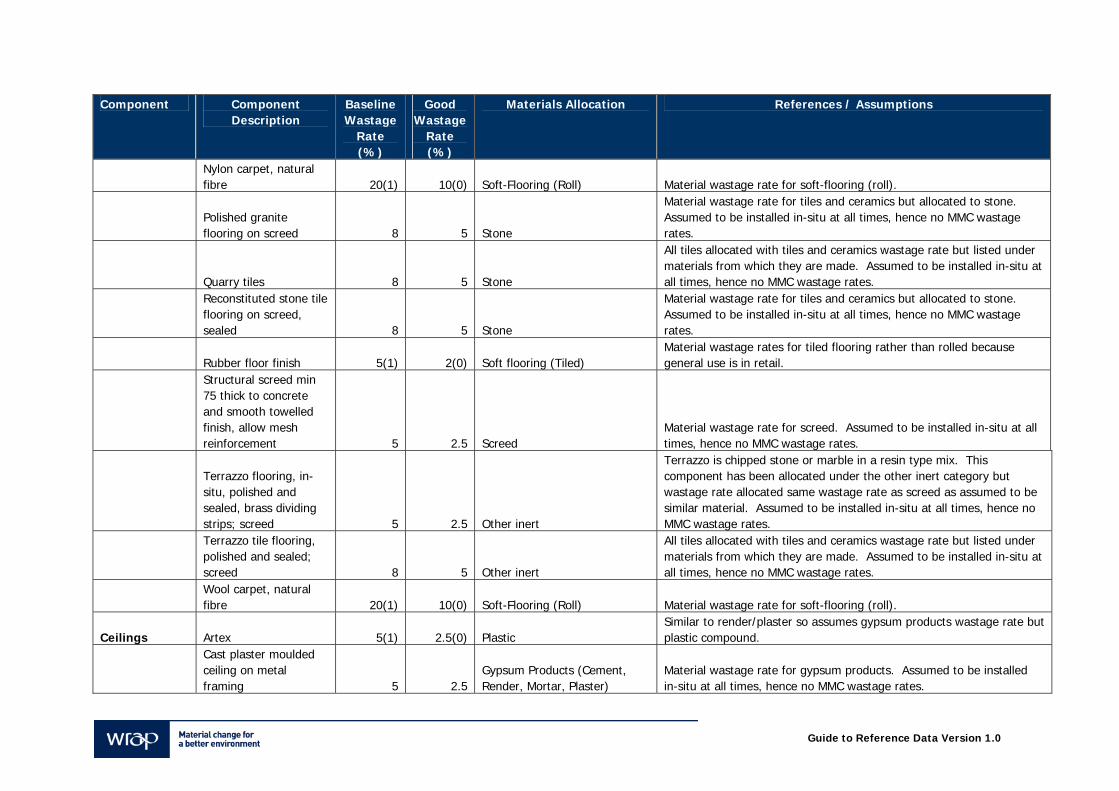
Guide to Reference Data Version 1.0
Component Component Description
Baseline Wastage
Rate (%)
Good Wastage
Rate (%)
Materials Allocation References / Assumptions
Nylon carpet, natural fibre 20(1) 10(0) Soft-Flooring (Roll) Material wastage rate for soft-flooring (roll).
Polished granite flooring on screed 8 5 Stone
Material wastage rate for tiles and ceramics but allocated to stone. Assumed to be installed in-situ at all times, hence no MMC wastage rates.
Quarry tiles 8 5 Stone
All tiles allocated with tiles and ceramics wastage rate but listed under materials from which they are made. Assumed to be installed in-situ at all times, hence no MMC wastage rates.
Reconstituted stone tile flooring on screed, sealed 8 5 Stone
Material wastage rate for tiles and ceramics but allocated to stone. Assumed to be installed in-situ at all times, hence no MMC wastage rates.
Rubber floor finish 5(1) 2(0) Soft flooring (Tiled) Material wastage rates for tiled flooring rather than rolled because general use is in retail.
Structural screed min 75 thick to concrete and smooth towelled finish, allow mesh reinforcement 5 2.5 Screed
Material wastage rate for screed. Assumed to be installed in-situ at all times, hence no MMC wastage rates.
Terrazzo flooring, in-situ, polished and sealed, brass dividing strips; screed 5 2.5 Other inert
Terrazzo is chipped stone or marble in a resin type mix. This component has been allocated under the other inert category but wastage rate allocated same wastage rate as screed as assumed to be similar material. Assumed to be installed in-situ at all times, hence no MMC wastage rates.
Terrazzo tile flooring, polished and sealed; screed 8 5 Other inert
All tiles allocated with tiles and ceramics wastage rate but listed under materials from which they are made. Assumed to be installed in-situ at all times, hence no MMC wastage rates.
Wool carpet, natural fibre 20(1) 10(0) Soft-Flooring (Roll) Material wastage rate for soft-flooring (roll).
Ceilings Artex 5(1) 2.5(0) Plastic Similar to render/plaster so assumes gypsum products wastage rate but plastic compound.
Cast plaster moulded ceiling on metal framing 5 2.5
Gypsum Products (Cement, Render, Mortar, Plaster)
Material wastage rate for gypsum products. Assumed to be installed in-situ at all times, hence no MMC wastage rates.
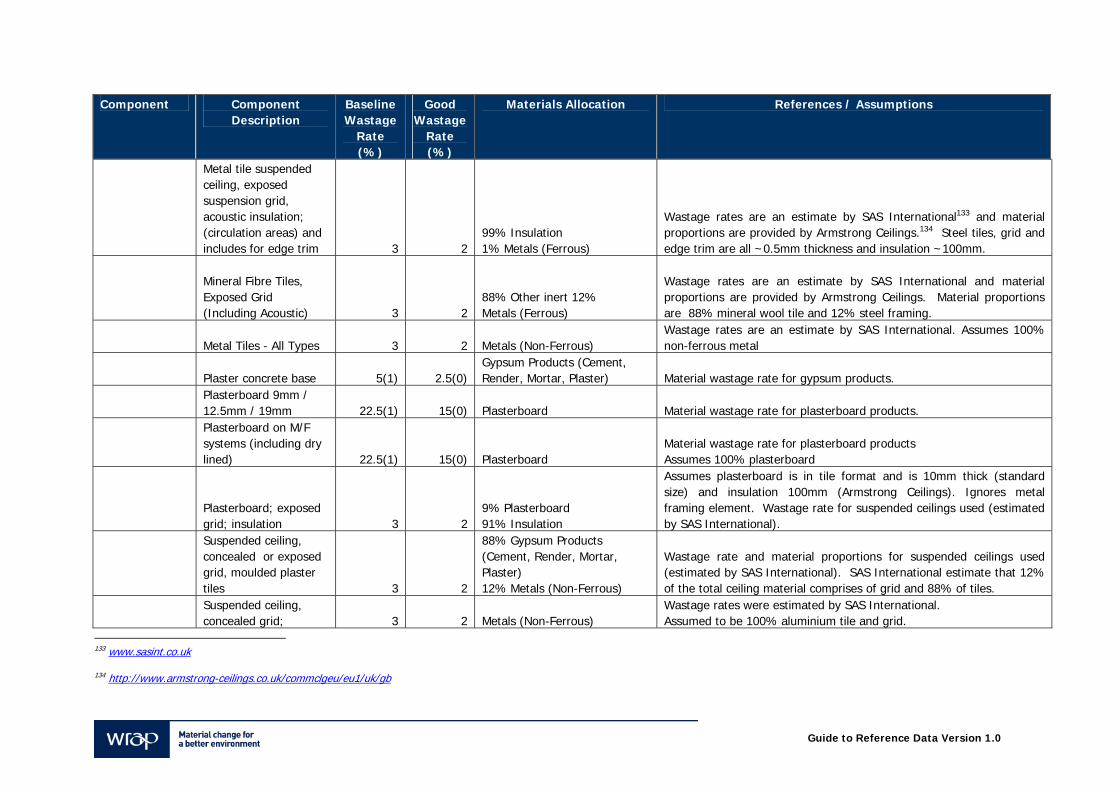
Guide to Reference Data Version 1.0
Component Component Description
Baseline Wastage
Rate (%)
Good Wastage
Rate (%)
Materials Allocation References / Assumptions
Metal tile suspended ceiling, exposed suspension grid, acoustic insulation; (circulation areas) and includes for edge trim 3 2
99% Insulation 1% Metals (Ferrous)
Wastage rates are an estimate by SAS International133 and material proportions are provided by Armstrong Ceilings.134 Steel tiles, grid and edge trim are all ~0.5mm thickness and insulation ~100mm.
Mineral Fibre Tiles, Exposed Grid (Including Acoustic) 3 2
88% Other inert 12% Metals (Ferrous)
Wastage rates are an estimate by SAS International and material proportions are provided by Armstrong Ceilings. Material proportions are 88% mineral wool tile and 12% steel framing.
Metal Tiles - All Types 3 2 Metals (Non-Ferrous) Wastage rates are an estimate by SAS International. Assumes 100% non-ferrous metal
Plaster concrete base 5(1) 2.5(0) Gypsum Products (Cement, Render, Mortar, Plaster) Material wastage rate for gypsum products.
Plasterboard 9mm / 12.5mm / 19mm 22.5(1) 15(0) Plasterboard Material wastage rate for plasterboard products.
Plasterboard on M/F systems (including dry lined) 22.5(1) 15(0) Plasterboard
Material wastage rate for plasterboard products Assumes 100% plasterboard
Plasterboard; exposed grid; insulation 3 2
9% Plasterboard 91% Insulation
Assumes plasterboard is in tile format and is 10mm thick (standard size) and insulation 100mm (Armstrong Ceilings). Ignores metal framing element. Wastage rate for suspended ceilings used (estimated by SAS International).
Suspended ceiling, concealed or exposed grid, moulded plaster tiles 3 2
88% Gypsum Products (Cement, Render, Mortar, Plaster) 12% Metals (Non-Ferrous)
Wastage rate and material proportions for suspended ceilings used (estimated by SAS International). SAS International estimate that 12% of the total ceiling material comprises of grid and 88% of tiles.
Suspended ceiling, concealed grid; 3 2 Metals (Non-Ferrous)
Wastage rates were estimated by SAS International. Assumed to be 100% aluminium tile and grid.
133 www.sasint.co.uk
134 http://www.armstrong-ceilings.co.uk/commclgeu/eu1/uk/gb
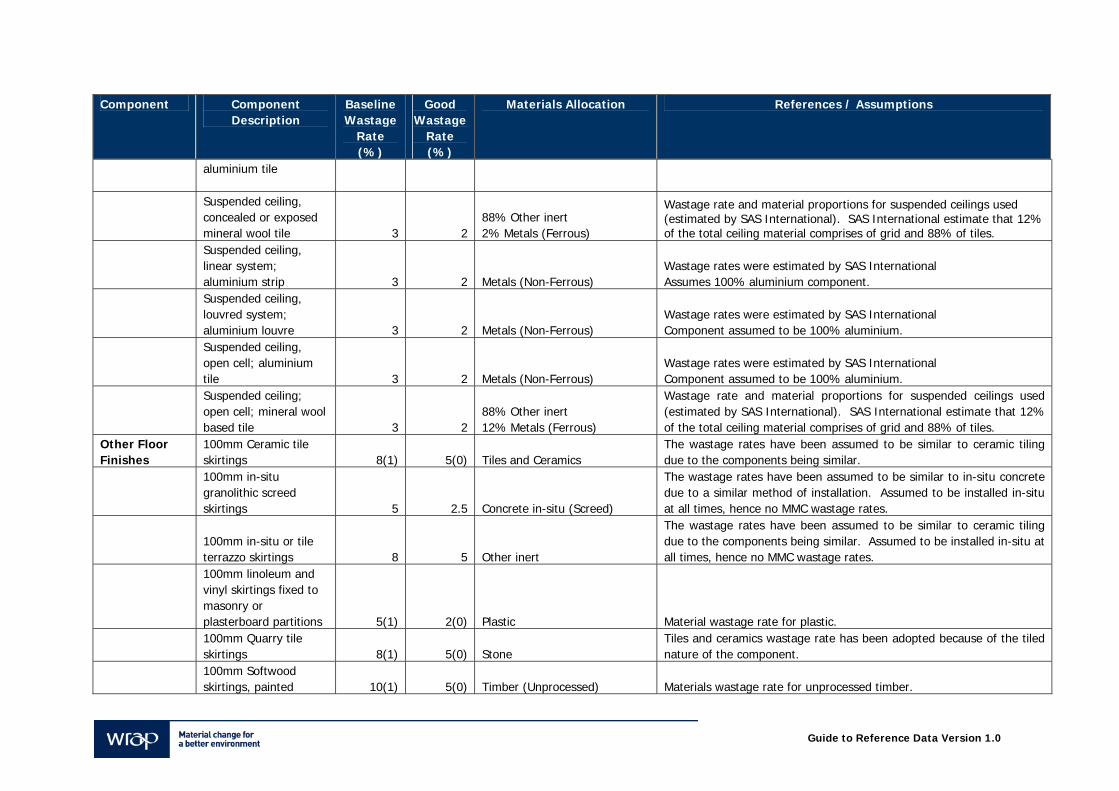
Guide to Reference Data Version 1.0
Component Component Description
Baseline Wastage
Rate (%)
Good Wastage
Rate (%)
Materials Allocation References / Assumptions
aluminium tile
Suspended ceiling, concealed or exposed mineral wool tile 3 2
88% Other inert 2% Metals (Ferrous)
Wastage rate and material proportions for suspended ceilings used (estimated by SAS International). SAS International estimate that 12% of the total ceiling material comprises of grid and 88% of tiles.
Suspended ceiling, linear system; aluminium strip 3 2 Metals (Non-Ferrous)
Wastage rates were estimated by SAS International Assumes 100% aluminium component.
Suspended ceiling, louvred system; aluminium louvre 3 2 Metals (Non-Ferrous)
Wastage rates were estimated by SAS International Component assumed to be 100% aluminium.
Suspended ceiling, open cell; aluminium tile 3 2 Metals (Non-Ferrous)
Wastage rates were estimated by SAS International Component assumed to be 100% aluminium.
Suspended ceiling; open cell; mineral wool based tile 3 2
88% Other inert 12% Metals (Ferrous)
Wastage rate and material proportions for suspended ceilings used (estimated by SAS International). SAS International estimate that 12% of the total ceiling material comprises of grid and 88% of tiles.
Other Floor Finishes
100mm Ceramic tile skirtings 8(1) 5(0) Tiles and Ceramics
The wastage rates have been assumed to be similar to ceramic tiling due to the components being similar.
100mm in-situ granolithic screed skirtings 5 2.5 Concrete in-situ (Screed)
The wastage rates have been assumed to be similar to in-situ concrete due to a similar method of installation. Assumed to be installed in-situ at all times, hence no MMC wastage rates.
100mm in-situ or tile terrazzo skirtings 8 5 Other inert
The wastage rates have been assumed to be similar to ceramic tiling due to the components being similar. Assumed to be installed in-situ at all times, hence no MMC wastage rates.
100mm linoleum and vinyl skirtings fixed to masonry or plasterboard partitions 5(1) 2(0) Plastic Material wastage rate for plastic.
100mm Quarry tile skirtings 8(1) 5(0) Stone
Tiles and ceramics wastage rate has been adopted because of the tiled nature of the component.
100mm Softwood skirtings, painted 10(1) 5(0) Timber (Unprocessed) Materials wastage rate for unprocessed timber.
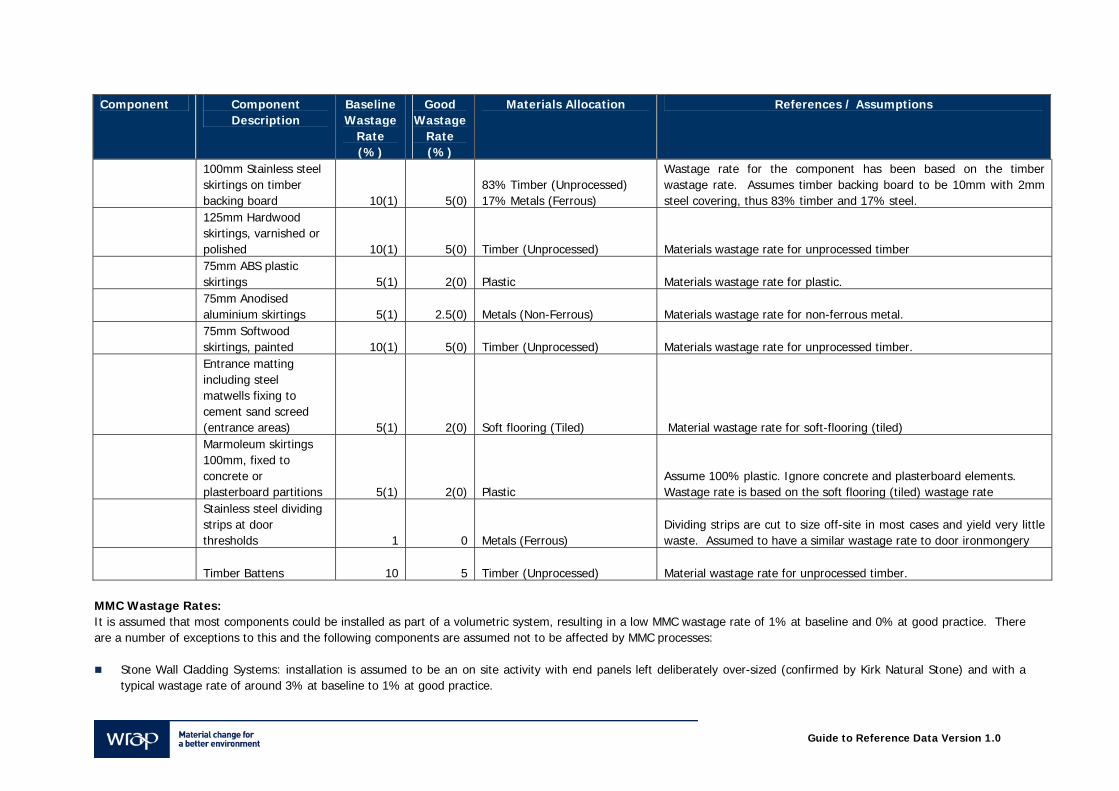
Guide to Reference Data Version 1.0
Component Component Description
Baseline Wastage
Rate (%)
Good Wastage
Rate (%)
Materials Allocation References / Assumptions
100mm Stainless steel skirtings on timber backing board 10(1) 5(0)
83% Timber (Unprocessed) 17% Metals (Ferrous)
Wastage rate for the component has been based on the timber wastage rate. Assumes timber backing board to be 10mm with 2mm steel covering, thus 83% timber and 17% steel.
125mm Hardwood skirtings, varnished or polished 10(1) 5(0) Timber (Unprocessed) Materials wastage rate for unprocessed timber
75mm ABS plastic skirtings 5(1) 2(0) Plastic Materials wastage rate for plastic.
75mm Anodised aluminium skirtings 5(1) 2.5(0) Metals (Non-Ferrous) Materials wastage rate for non-ferrous metal.
75mm Softwood skirtings, painted 10(1) 5(0) Timber (Unprocessed) Materials wastage rate for unprocessed timber.
Entrance matting including steel matwells fixing to cement sand screed (entrance areas) 5(1) 2(0) Soft flooring (Tiled) Material wastage rate for soft-flooring (tiled)
Marmoleum skirtings 100mm, fixed to concrete or plasterboard partitions 5(1) 2(0) Plastic
Assume 100% plastic. Ignore concrete and plasterboard elements. Wastage rate is based on the soft flooring (tiled) wastage rate
Stainless steel dividing strips at door thresholds 1 0 Metals (Ferrous)
Dividing strips are cut to size off-site in most cases and yield very little waste. Assumed to have a similar wastage rate to door ironmongery
Timber Battens 10 5 Timber (Unprocessed) Material wastage rate for unprocessed timber. MMC Wastage Rates: It is assumed that most components could be installed as part of a volumetric system, resulting in a low MMC wastage rate of 1% at baseline and 0% at good practice. There are a number of exceptions to this and the following components are assumed not to be affected by MMC processes:
Stone Wall Cladding Systems: installation is assumed to be an on site activity with end panels left deliberately over-sized (confirmed by Kirk Natural Stone) and with a typical wastage rate of around 3% at baseline to 1% at good practice.
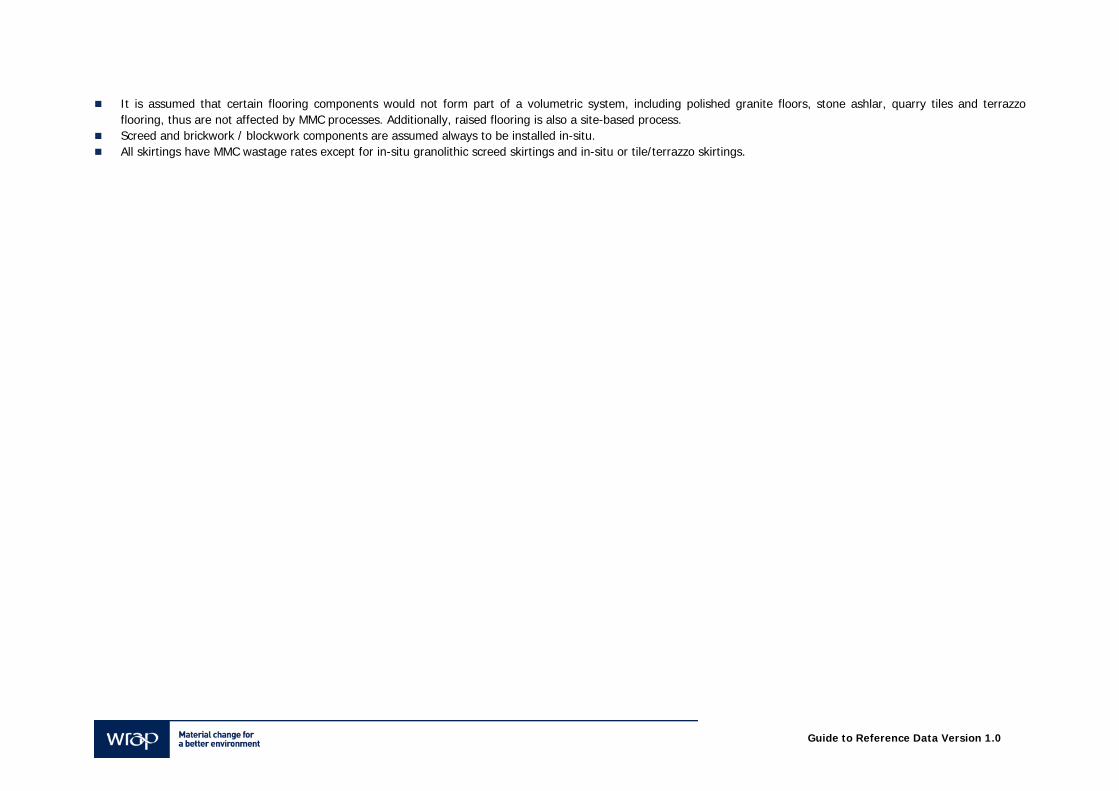
Guide to Reference Data Version 1.0
It is assumed that certain flooring components would not form part of a volumetric system, including polished granite floors, stone ashlar, quarry tiles and terrazzo flooring, thus are not affected by MMC processes. Additionally, raised flooring is also a site-based process.
Screed and brickwork / blockwork components are assumed always to be installed in-situ. All skirtings have MMC wastage rates except for in-situ granolithic screed skirtings and in-situ or tile/terrazzo skirtings.
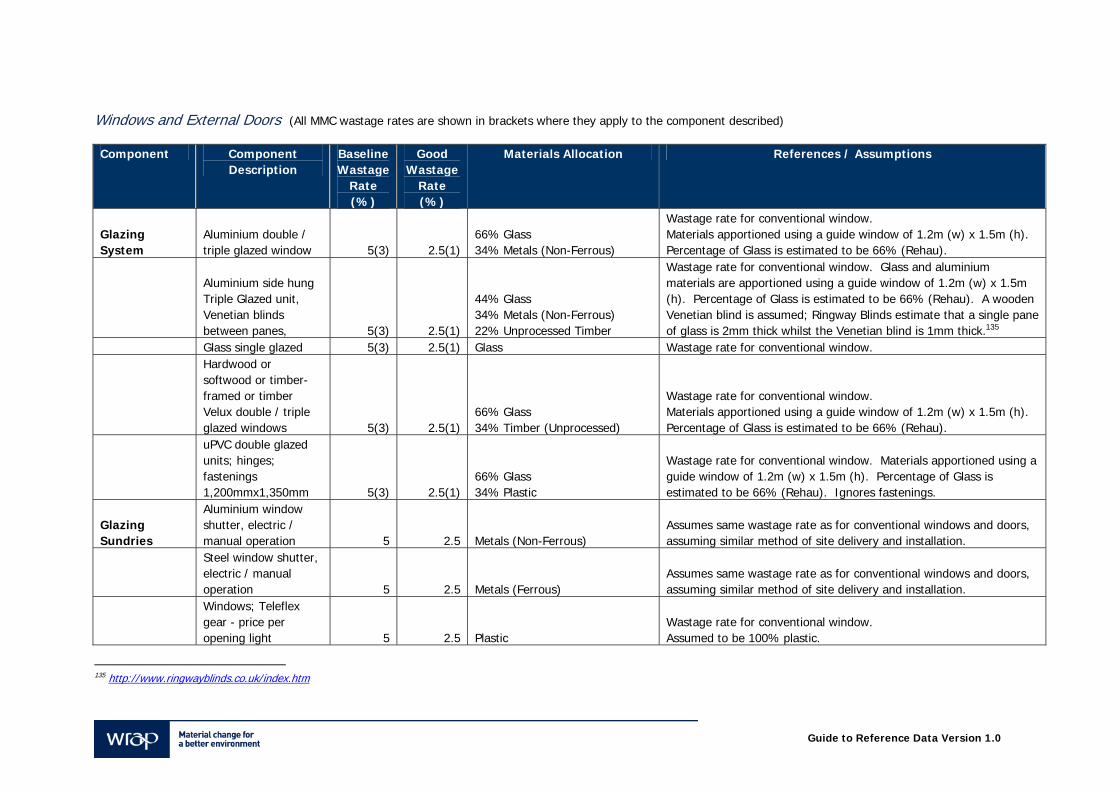
Guide to Reference Data Version 1.0
Windows and External Doors (All MMC wastage rates are shown in brackets where they apply to the component described) Component Component
Description Baseline Wastage
Rate (%)
Good Wastage
Rate (%)
Materials Allocation References / Assumptions
Glazing System
Aluminium double / triple glazed window 5(3) 2.5(1)
66% Glass 34% Metals (Non-Ferrous)
Wastage rate for conventional window. Materials apportioned using a guide window of 1.2m (w) x 1.5m (h). Percentage of Glass is estimated to be 66% (Rehau).
Aluminium side hung Triple Glazed unit, Venetian blinds between panes, 5(3) 2.5(1)
44% Glass 34% Metals (Non-Ferrous) 22% Unprocessed Timber
Wastage rate for conventional window. Glass and aluminium materials are apportioned using a guide window of 1.2m (w) x 1.5m (h). Percentage of Glass is estimated to be 66% (Rehau). A wooden Venetian blind is assumed; Ringway Blinds estimate that a single pane of glass is 2mm thick whilst the Venetian blind is 1mm thick.135
Glass single glazed 5(3) 2.5(1) Glass Wastage rate for conventional window.
Hardwood or softwood or timber-framed or timber Velux double / triple glazed windows 5(3) 2.5(1)
66% Glass 34% Timber (Unprocessed)
Wastage rate for conventional window. Materials apportioned using a guide window of 1.2m (w) x 1.5m (h). Percentage of Glass is estimated to be 66% (Rehau).
uPVC double glazed units; hinges; fastenings 1,200mmx1,350mm 5(3) 2.5(1)
66% Glass 34% Plastic
Wastage rate for conventional window. Materials apportioned using a guide window of 1.2m (w) x 1.5m (h). Percentage of Glass is estimated to be 66% (Rehau). Ignores fastenings.
Glazing Sundries
Aluminium window shutter, electric / manual operation 5 2.5 Metals (Non-Ferrous)
Assumes same wastage rate as for conventional windows and doors, assuming similar method of site delivery and installation.
Steel window shutter, electric / manual operation 5 2.5 Metals (Ferrous)
Assumes same wastage rate as for conventional windows and doors, assuming similar method of site delivery and installation.
Windows; Teleflex gear - price per opening light 5 2.5 Plastic
Wastage rate for conventional window. Assumed to be 100% plastic.
135 http://www.ringwayblinds.co.uk/index.htm
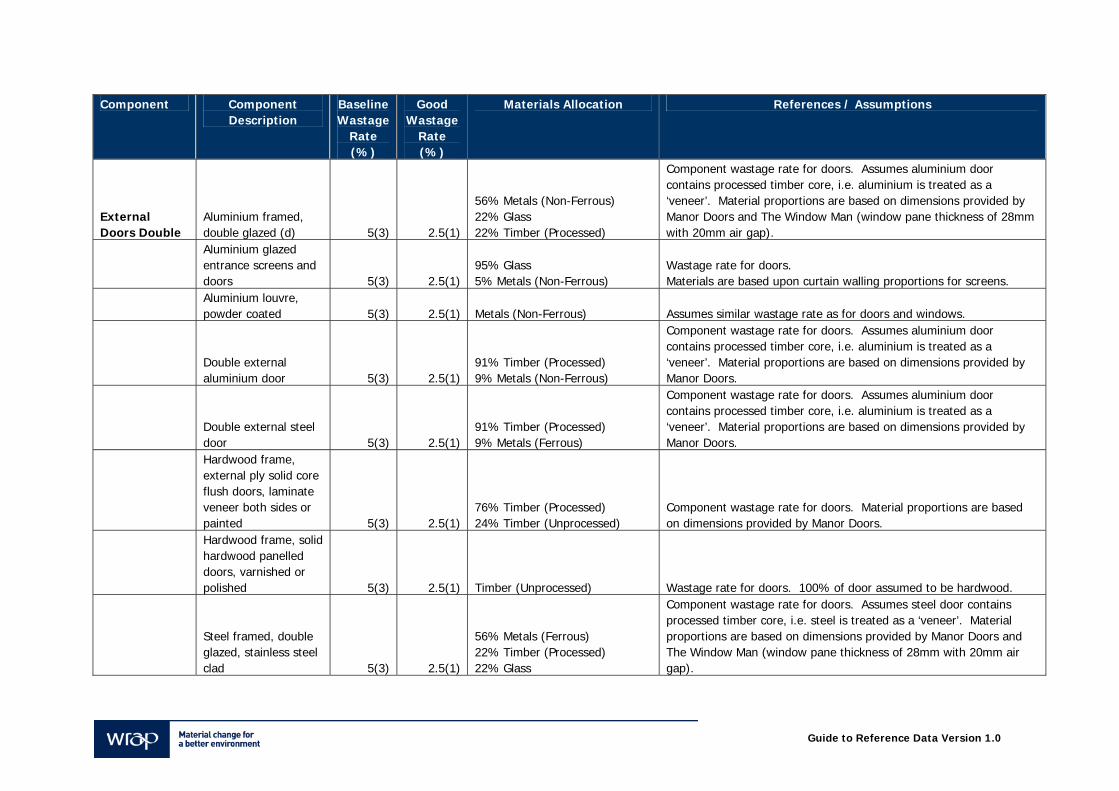
Guide to Reference Data Version 1.0
Component Component Description
Baseline Wastage
Rate (%)
Good Wastage
Rate (%)
Materials Allocation References / Assumptions
External Doors Double
Aluminium framed, double glazed (d) 5(3) 2.5(1)
56% Metals (Non-Ferrous) 22% Glass 22% Timber (Processed)
Component wastage rate for doors. Assumes aluminium door contains processed timber core, i.e. aluminium is treated as a ‘veneer’. Material proportions are based on dimensions provided by Manor Doors and The Window Man (window pane thickness of 28mm with 20mm air gap).
Aluminium glazed entrance screens and doors 5(3) 2.5(1)
95% Glass 5% Metals (Non-Ferrous)
Wastage rate for doors. Materials are based upon curtain walling proportions for screens.
Aluminium louvre, powder coated 5(3) 2.5(1) Metals (Non-Ferrous) Assumes similar wastage rate as for doors and windows.
Double external aluminium door 5(3) 2.5(1)
91% Timber (Processed) 9% Metals (Non-Ferrous)
Component wastage rate for doors. Assumes aluminium door contains processed timber core, i.e. aluminium is treated as a ‘veneer’. Material proportions are based on dimensions provided by Manor Doors.
Double external steel door 5(3) 2.5(1)
91% Timber (Processed) 9% Metals (Ferrous)
Component wastage rate for doors. Assumes aluminium door contains processed timber core, i.e. aluminium is treated as a ‘veneer’. Material proportions are based on dimensions provided by Manor Doors.
Hardwood frame, external ply solid core flush doors, laminate veneer both sides or painted 5(3) 2.5(1)
76% Timber (Processed) 24% Timber (Unprocessed)
Component wastage rate for doors. Material proportions are based on dimensions provided by Manor Doors.
Hardwood frame, solid hardwood panelled doors, varnished or polished 5(3) 2.5(1) Timber (Unprocessed) Wastage rate for doors. 100% of door assumed to be hardwood.
Steel framed, double glazed, stainless steel clad 5(3) 2.5(1)
56% Metals (Ferrous) 22% Timber (Processed) 22% Glass
Component wastage rate for doors. Assumes steel door contains processed timber core, i.e. steel is treated as a ‘veneer’. Material proportions are based on dimensions provided by Manor Doors and The Window Man (window pane thickness of 28mm with 20mm air gap).
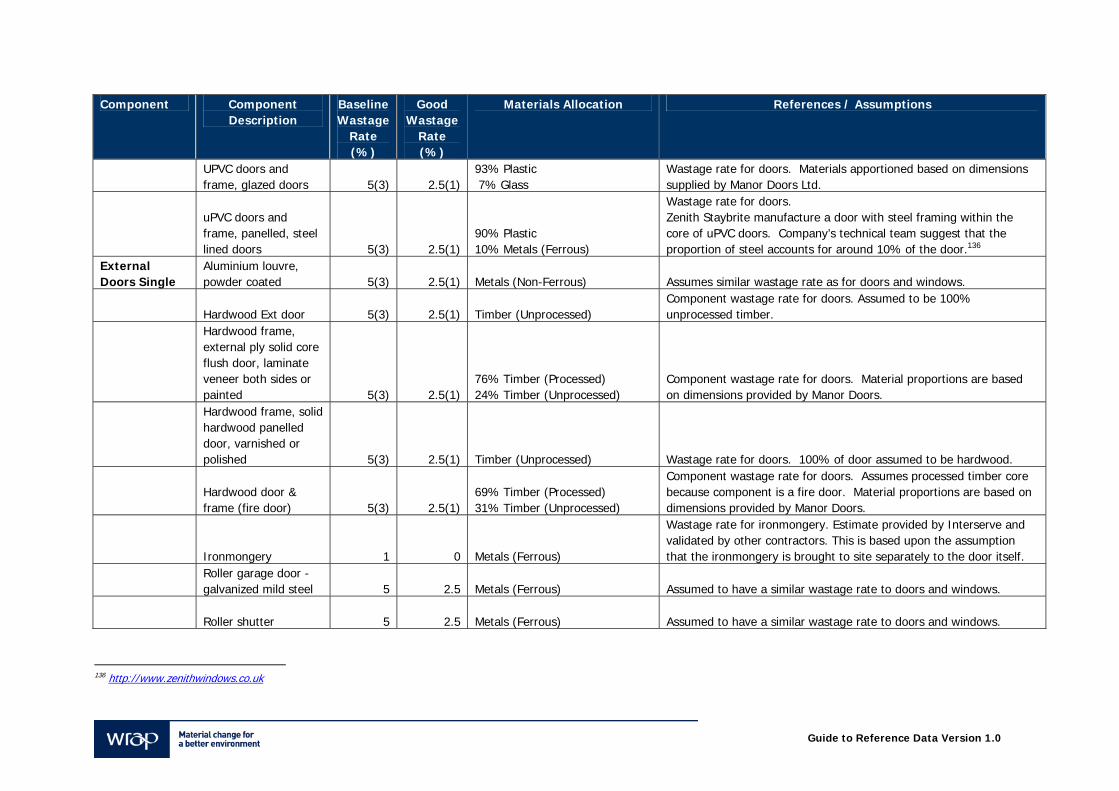
Guide to Reference Data Version 1.0
Component Component Description
Baseline Wastage
Rate (%)
Good Wastage
Rate (%)
Materials Allocation References / Assumptions
UPVC doors and frame, glazed doors 5(3) 2.5(1)
93% Plastic 7% Glass
Wastage rate for doors. Materials apportioned based on dimensions supplied by Manor Doors Ltd.
uPVC doors and frame, panelled, steel lined doors 5(3) 2.5(1)
90% Plastic 10% Metals (Ferrous)
Wastage rate for doors. Zenith Staybrite manufacture a door with steel framing within the core of uPVC doors. Company’s technical team suggest that the proportion of steel accounts for around 10% of the door.136
External Doors Single
Aluminium louvre, powder coated 5(3) 2.5(1) Metals (Non-Ferrous) Assumes similar wastage rate as for doors and windows.
Hardwood Ext door 5(3) 2.5(1) Timber (Unprocessed) Component wastage rate for doors. Assumed to be 100% unprocessed timber.
Hardwood frame, external ply solid core flush door, laminate veneer both sides or painted 5(3) 2.5(1)
76% Timber (Processed) 24% Timber (Unprocessed)
Component wastage rate for doors. Material proportions are based on dimensions provided by Manor Doors.
Hardwood frame, solid hardwood panelled door, varnished or polished 5(3) 2.5(1) Timber (Unprocessed) Wastage rate for doors. 100% of door assumed to be hardwood.
Hardwood door & frame (fire door) 5(3) 2.5(1)
69% Timber (Processed) 31% Timber (Unprocessed)
Component wastage rate for doors. Assumes processed timber core because component is a fire door. Material proportions are based on dimensions provided by Manor Doors.
Ironmongery 1 0 Metals (Ferrous)
Wastage rate for ironmongery. Estimate provided by Interserve and validated by other contractors. This is based upon the assumption that the ironmongery is brought to site separately to the door itself.
Roller garage door - galvanized mild steel 5 2.5 Metals (Ferrous) Assumed to have a similar wastage rate to doors and windows.
Roller shutter 5 2.5 Metals (Ferrous) Assumed to have a similar wastage rate to doors and windows.
136 http://www.zenithwindows.co.uk
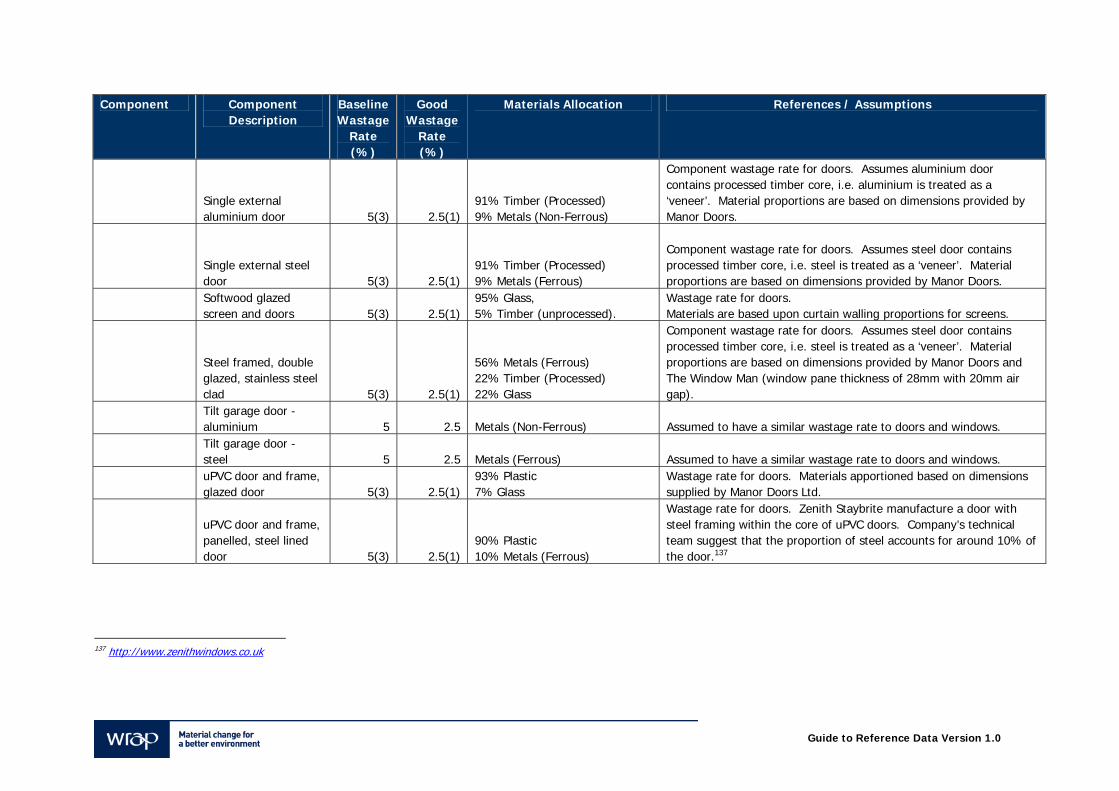
Guide to Reference Data Version 1.0
Component Component Description
Baseline Wastage
Rate (%)
Good Wastage
Rate (%)
Materials Allocation References / Assumptions
Single external aluminium door 5(3) 2.5(1)
91% Timber (Processed) 9% Metals (Non-Ferrous)
Component wastage rate for doors. Assumes aluminium door contains processed timber core, i.e. aluminium is treated as a ‘veneer’. Material proportions are based on dimensions provided by Manor Doors.
Single external steel door 5(3) 2.5(1)
91% Timber (Processed) 9% Metals (Ferrous)
Component wastage rate for doors. Assumes steel door contains processed timber core, i.e. steel is treated as a ‘veneer’. Material proportions are based on dimensions provided by Manor Doors.
Softwood glazed screen and doors 5(3) 2.5(1)
95% Glass, 5% Timber (unprocessed).
Wastage rate for doors. Materials are based upon curtain walling proportions for screens.
Steel framed, double glazed, stainless steel clad 5(3) 2.5(1)
56% Metals (Ferrous) 22% Timber (Processed) 22% Glass
Component wastage rate for doors. Assumes steel door contains processed timber core, i.e. steel is treated as a ‘veneer’. Material proportions are based on dimensions provided by Manor Doors and The Window Man (window pane thickness of 28mm with 20mm air gap).
Tilt garage door - aluminium 5 2.5 Metals (Non-Ferrous) Assumed to have a similar wastage rate to doors and windows.
Tilt garage door - steel 5 2.5 Metals (Ferrous) Assumed to have a similar wastage rate to doors and windows.
uPVC door and frame, glazed door 5(3) 2.5(1)
93% Plastic 7% Glass
Wastage rate for doors. Materials apportioned based on dimensions supplied by Manor Doors Ltd.
uPVC door and frame, panelled, steel lined door 5(3) 2.5(1)
90% Plastic 10% Metals (Ferrous)
Wastage rate for doors. Zenith Staybrite manufacture a door with steel framing within the core of uPVC doors. Company’s technical team suggest that the proportion of steel accounts for around 10% of the door.137
137 http://www.zenithwindows.co.uk
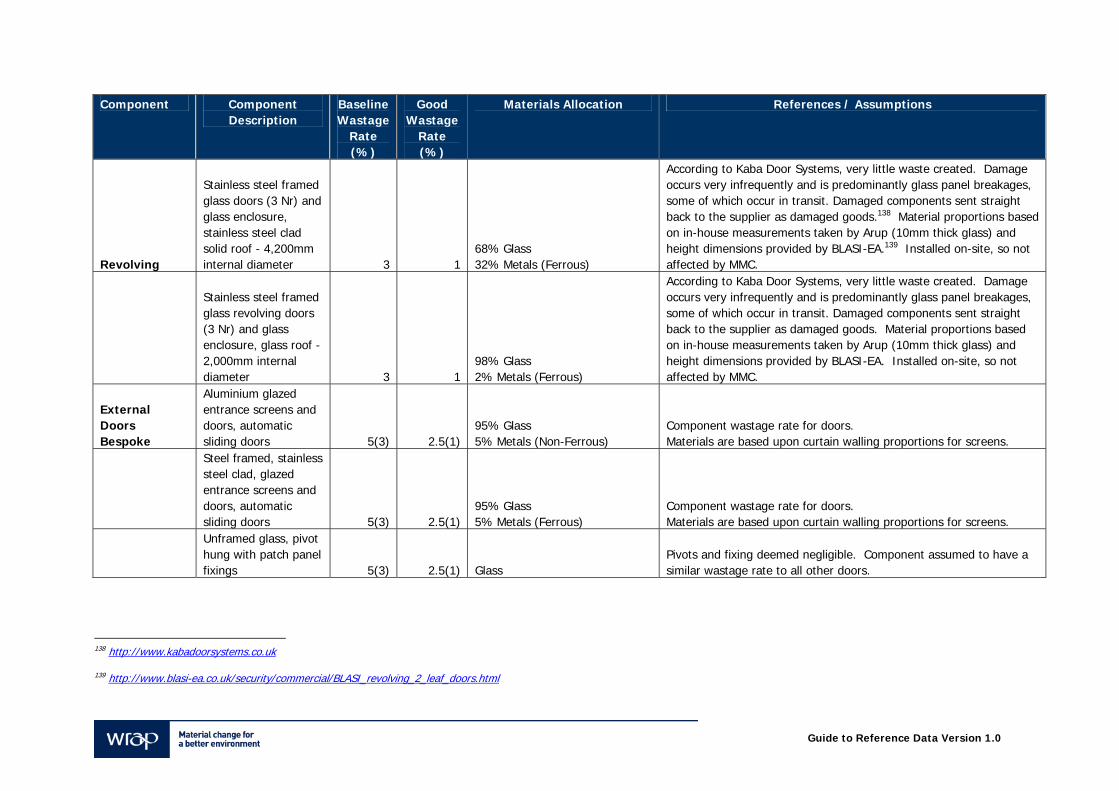
Guide to Reference Data Version 1.0
Component Component Description
Baseline Wastage
Rate (%)
Good Wastage
Rate (%)
Materials Allocation References / Assumptions
Revolving
Stainless steel framed glass doors (3 Nr) and glass enclosure, stainless steel clad solid roof - 4,200mm internal diameter 3 1
68% Glass 32% Metals (Ferrous)
According to Kaba Door Systems, very little waste created. Damage occurs very infrequently and is predominantly glass panel breakages, some of which occur in transit. Damaged components sent straight back to the supplier as damaged goods.138 Material proportions based on in-house measurements taken by Arup (10mm thick glass) and height dimensions provided by BLASI-EA.139 Installed on-site, so not affected by MMC.
Stainless steel framed glass revolving doors (3 Nr) and glass enclosure, glass roof - 2,000mm internal diameter 3 1
98% Glass 2% Metals (Ferrous)
According to Kaba Door Systems, very little waste created. Damage occurs very infrequently and is predominantly glass panel breakages, some of which occur in transit. Damaged components sent straight back to the supplier as damaged goods. Material proportions based on in-house measurements taken by Arup (10mm thick glass) and height dimensions provided by BLASI-EA. Installed on-site, so not affected by MMC.
External Doors Bespoke
Aluminium glazed entrance screens and doors, automatic sliding doors 5(3) 2.5(1)
95% Glass 5% Metals (Non-Ferrous)
Component wastage rate for doors. Materials are based upon curtain walling proportions for screens.
Steel framed, stainless steel clad, glazed entrance screens and doors, automatic sliding doors 5(3) 2.5(1)
95% Glass 5% Metals (Ferrous)
Component wastage rate for doors. Materials are based upon curtain walling proportions for screens.
Unframed glass, pivot hung with patch panel fixings 5(3) 2.5(1) Glass
Pivots and fixing deemed negligible. Component assumed to have a similar wastage rate to all other doors.
138 http://www.kabadoorsystems.co.uk
139 http://www.blasi-ea.co.uk/security/commercial/BLASI_revolving_2_leaf_doors.html
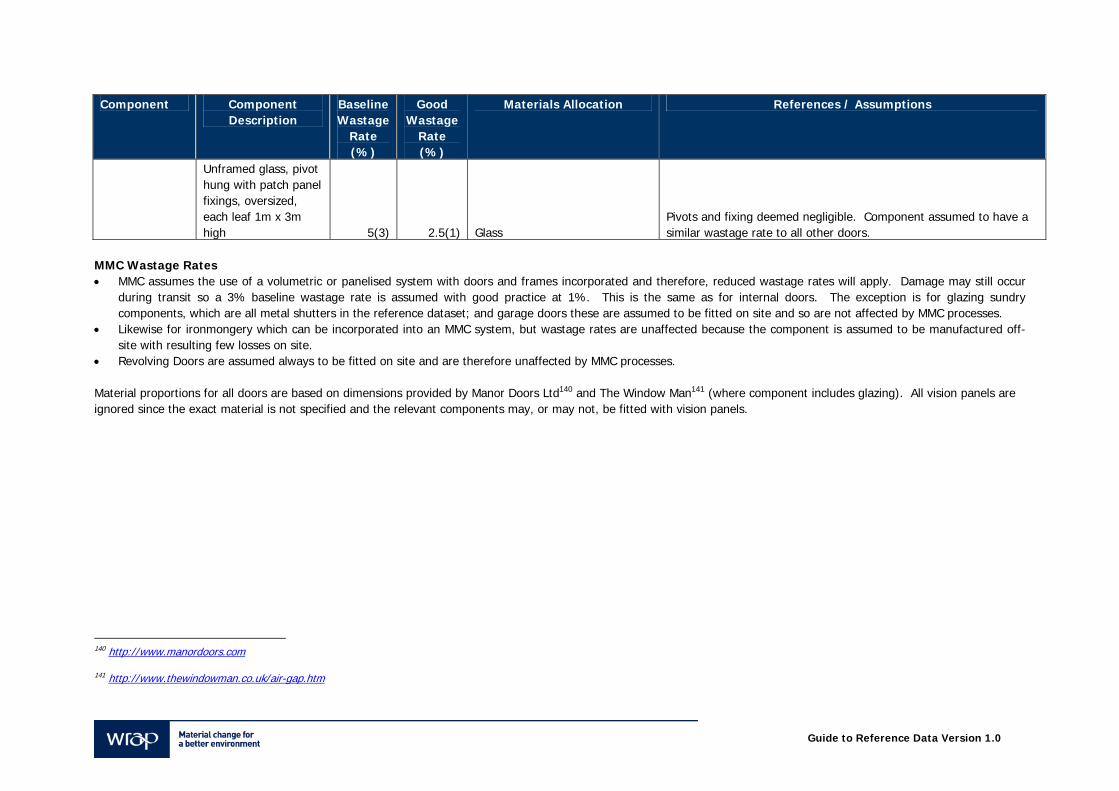
Guide to Reference Data Version 1.0
Component Component Description
Baseline Wastage
Rate (%)
Good Wastage
Rate (%)
Materials Allocation References / Assumptions
Unframed glass, pivot hung with patch panel fixings, oversized, each leaf 1m x 3m high 5(3) 2.5(1) Glass
Pivots and fixing deemed negligible. Component assumed to have a similar wastage rate to all other doors.
MMC Wastage Rates • MMC assumes the use of a volumetric or panelised system with doors and frames incorporated and therefore, reduced wastage rates will apply. Damage may still occur
during transit so a 3% baseline wastage rate is assumed with good practice at 1%. This is the same as for internal doors. The exception is for glazing sundry components, which are all metal shutters in the reference dataset; and garage doors these are assumed to be fitted on site and so are not affected by MMC processes.
• Likewise for ironmongery which can be incorporated into an MMC system, but wastage rates are unaffected because the component is assumed to be manufactured off-site with resulting few losses on site.
• Revolving Doors are assumed always to be fitted on site and are therefore unaffected by MMC processes. Material proportions for all doors are based on dimensions provided by Manor Doors Ltd140 and The Window Man141 (where component includes glazing). All vision panels are ignored since the exact material is not specified and the relevant components may, or may not, be fitted with vision panels.
140 http://www.manordoors.com
141 http://www.thewindowman.co.uk/air-gap.htm


Printed on xx% recycled content paper