Embed Size (px)
Citation preview
REFERENCEGUIDE FORBUILDINGDESIGN ANDCONSTRUCTION

v4
REFERENCEGUIDE FORBUILDINGDESIGN ANDCONSTRUCTION
i
COPYRIGHTCopyright © 2013 by the U.S. Green Building Council. All rights reserved.
The U.S. Green Building Council, Inc. (USGBC) devoted significant time and resources to create this LEED Reference Guide for Building Design and Construction, 2013 Edition. USGBC authorizes individual use of the Reference Guide. In exchange for this authorization, the user agrees:
1. to retain all copyright and other proprietary notices contained in the Reference Guide,
2. not to sell or modify the Reference Guide, and
3. not to reproduce, display, or distribute the Reference Guide in any way for any public or commercial purpose, including display on a website or in a networked environment.
Unauthorized use of the Reference Guide violates copyright, trademark, and other laws and is prohibited.
The text of the federal and state codes, regulations, voluntary standards, etc., reproduced in the Reference Guide is used under license to USGBC or, in some instances, in the public domain. All other text, graphics, layout, and other elements of content in the Reference Guide are owned by USGBC and are protected by copyright under both United States and foreign laws.
NOTE: for downloads of the Reference Guide:Redistributing the Reference Guide on the internet or otherwise is STRICTLY prohibited even if offered free of charge. DOWNLOADS OF THE REFERENCE GUIDE MAY NOT BE COPIED OR DISTRIBUTED. THE USER OF THE REFERENCE GUIDE MAY NOT ALTER, REDISTRIBUTE, UPLOAD OR PUBLISH THIS REFERENCE GUIDE IN WHOLE OR IN PART, AND HAS NO RIGHT TO LEND OR SELL THE DOWNLOAD OR COPIES OF THE DOWNLOAD TO OTHER PERSONS.
DISCLAIMERNone of the parties involved in the funding or creation of the Reference Guide, including the USGBC, its members, its contractors, or the United States government, assume any liability or responsibility to the user or any third parties for the accuracy, completeness, or use of or reliance on any information contained in the Reference Guide, or for any injuries, losses, or damages (including, without limitation, equitable relief ) arising from such use or reliance. Although the information contained in the Reference Guide is believed to be reliable and accurate, all materials set forth within are provided without warranties of any kind, either express or implied, including but not limited to warranties of the accuracy or completeness of information contained in the training or the suitability of the information for any particular purpose.
As a condition of use, the user covenants not to sue and agrees to waive and release the U.S. Green Building Council, its members, its contractors, and the United States government from any and all claims, demands, and causes of action for any injuries, losses, or damages (including, without limitation, equitable relief ) that the user may now or hereafter have a right to assert against such parties as a result of the use of, or reliance on, the Reference Guide.
U.S. Green Building Council2101 L Street, NWSuite 500Washington, DC 20037
TRADEMARKLEED® is a registered trademark of the U.S. Green Building Council.LEED Reference Guide for Building Design and Construction2013 EditionISBN #978-1-932444-19

ii
ACKNOWLEDGMENTSTheLEED Reference Guide for Building Design and Construction, 2013 Edition, has been made possible only through the efforts of many dedicated volunteers, staff members, and others in the USGBC community. The Reference Guide drafting was managed and implemented by USGBC staff and consultants and included review and suggestions by many Technical Advisory Group (TAG) members. We extend our deepest gratitude to all of our LEED committee members who participated in the development of this guide, for their tireless volunteer efforts and constant support of USGBC’s mission:
LEED Steering CommitteeJoel Todd, Chair Joel Ann ToddBryna Dunn, Vice-Chair Moseley ArchitectsFelipe Faria Green Building Council BrasilElaine Hsieh KEMA ServicesSusan Kaplan BuildingWrxMalcolm Lewis Cadmus GroupMuscoe Martin M2 ArchitectureLisa Matthiessen Integral GroupBrenda Morawa Integrated Environmental SolutionsTim Murray Morris ArchitectsSara O'Mara Choate Construction CompanyBruce Poe Modus Architecture CollaborativeAlfonso Ponce Deloitte FinanceDavid Sheridan Aqua CuraLynn Simon Thornton TomasettiDoug Gatlin (Non-voting) U.S. Green Building CouncilScot Horst (Non-voting) U.S. Green Building CouncilBrendan Owens (Non-voting) U.S. Green Building CouncilPeter Templeton (Non-voting) U.S. Green Building Council
LEED Technical CommitteeSusan Kaplan, Chair BuildingWrxMaureen McGeary Mahle, Vice-Chair Steven Winter AssociatesJennifer Atlee BuildingGreenSteve Baer Five Winds InternationalTed Bardacke Global Green USASteve Benz OLINNeal Billetdeaux SmithGroupJJRDavid Bracciano Alliance for Water EfficiencyDaniel Bruck BRC Acoustics & Audiovisual DesignDavid Carlson Columbia UniversityJenny Carney YR&GMark Frankel New Buildings InstituteNathan Gauthier EA BuildingsGeorge Brad Guy Catholic University of AmericaMichelle Halle Stern The Green FacilitatorMalcolm Lewis Cadmus GroupJohn McFarland Working Buildings LLCJessica Millman The Agora GroupNeil Rosen North Shore LIJ Health SystemThomas Scarola Tishman Speyer Chris Schaffner The Green EngineerMarcus Sheffer 7groupSheila Sheridan Sheridan AssociatesBob Thompson U.S. Environmental Protection AgencyAlfred Vick University of Georgia
iii
LEED Market Advisory CommitteeLisa Matthiessen, Chair Integral GroupHolley Henderson, Vice-Chair H2Ecodesign Liana Berberidou-Kallivoka City of AustinJeffrey Cole KonstruktWalter Cuculic Pulte HomesRand Ekman Cannon DesignRichard Kleinman LaSalle Investment ManagementCraig Kneeland NYSERDAMuscoe Martin M2 ArchitectureCindy Quan Goldman Sachs & Co.Matt Raimi Raimi + AssociatesJon Ratner Forest City EnterprisesMarcus Sheffer 7groupRebecca Stafford University of California, Office of PresidentGary Thomas CB Richard EllisKeith Winn Catalyst Partners
Implementation Advisory CommitteeBrenda Morawa, Chair Integrated Environmental SolutionsAdam Fransen, Vice-Chair CB Richard EllisMichelle Malanca Michelle Malanca Sustainability ConsultingBrad Pease Paladino and Co.Ken Potts McGoughRichard Schneider U.S. Army Engineer Research and Development CenterGreg Shank Altura AssociatesDavid Sheridan Aqua CuraNatalie Terrill Viridian Energy & EnvironmentalBill Worthen Urban Fabrick DesignMax Zahniser Praxis | Building Solutions
Location and Planning TAGJessica Millman, Chair The Agora GroupJohn Dalzell, Vice-Chair Boston Redevelopment Authority/ City of BostonEliot Allen Criterion PlannersLaurence Aurbach Office of Laurence AurbachTed Bardacke Global Green USAErin Christensen MithunAndy Clarke League of American Bicyclists Fred Dock City of PasadenaBruce Donnelly AuricityVictor Dover Dover, Kohl, and Partners Reid Ewing University of UtahDoug Farr Farr & AssociatesLois Fisher Fisher Town Design Tim Frank Sierra ClubRandy Hansell Earth Advantage InstituteJustin Horner Natural Resources Defense CouncilRon Kilcoyne Lane Transit District Todd Litman Victoria Transport Policy InstituteDana Little Treasure Coast Regional Planning CouncilArt Lomenick Parsons BrinckerhoffSteve Mouzon New Urban Guild

iv
Lynn Richards U.S. Environmental Protection AgencyHarrison Rue ICF InternationalShawn Seamen PN HoffmanAnthony Sease CivitechLaurie Volk Zimmerman/ Volk AssociatesPatricia White Defenders of Wildlife
Sustainable Sites TAGJenny Carney, Chair YR&GNeal Billetdeaux, Vice-Chair SmithGroupJJRMichele Adams Meliora Environmental DesignJoby Carlson University of ArkansasLaura Case Southface Energy InstituteStephen Cook VIKARichard Heinisch Acuity Brands LightingHeather Holdridge Lake | Flato ArchitectsJason King Greenworks, PCKatrina Rosa The EcoLogic StudioKyle Thomas Natural Systems EngineeringAlfred Vick University of GeorgiaTeresa Watkins St. John's Water Management DistrictSteve Benz OLIN
Water Efficiency TAGNeil Rosen, Chair North Shore LIJ Health SystemDoug Bennett, Vice-Chair Las Vegas Valley Water District / Southern Nevada Water AuthorityDamann Anderson Hazen & SawyerGunnar Baldwin TOTO USARobert Benazzi Jaros Baum & BollesSteve Benz OLIN Neal Billetdeaux SmithGroupJJRDavid Bracciano Alliance for Water EfficiencyDavid Carlson Columbia UniversityRon Hand E/FECT. Sustainable Design SolutionsBill Hoffman H.W. Hoffman and AssociatesWinston Huff SSR EngineersJoanna Kind Eastern Research GroupHeather Kinkade Forgotten RainGary Klein Affiliated International ManagementJohn Koeller Koeller and Company Shawn Martin International Code CouncilDon Mills Clivus MultrumGeoff Nara Civil & Environmental ConsultantsKaren Poff Austin EnergyShabbir Rawalpindiwala KohlerRobert Rubin NCSUStephanie Tanner US Environmental Protection AgencyDavid Viola International Association of Plumbing and Mechanical Officials Bill Wall Clivus New EnglandDaniel Yeh University of South FloridaRob Zimmerman Kohler

v
Energy and Atmosphere TAGNathan Gauthier, Chair EA BuildingsJeremy Poling, Vice-Chair GobyJohn Adams General Services Administration Amanda Bogner The Energy StudioKevin Bright Harvard UniversityLane Burt Natural Resources Defense Council Allan Daly Taylor EngineeringCharles Dorgan University of Wisconsin-MadisonJay Enck Commissioning & Green Building SolutionsEllen Franconi Rocky Mountain Institute Scott Frank Jaros Baum & BollesGail Hampsmire Low Energy Low CostTia Heneghan ZIA for BuildingsRusty Hodapp Dallas/Fort Worth International Airport BoardBrad Jones Sebesta BlombergDan Katzenberger Engineering, Energy, and the EnvironmentDoug King King SustainabilityChris Ladner ViridianRichard Lord Carrier CorporationBob Maddox Sterling PlanetRob Moody Organic ThinkBrenda Morawa BVM EngineeringPaul Raymer Heyoka SolutionsErik Ring LPADavid Roberts National Renewable Energy Laboratory Michael Rosenberg Pacific Northwest National LaboratoryGreg San Martin PG&EChris Schaffner The Green EngineerMarcus Sheffer 7groupGordon Shymko G.F. Shymko & AssociatesJason Steinbock The Weidt GroupJorge Torres Coto MBOTate Walker Energy Center of Wisconsin
Materials and Resources TAGSteve Baer, Chair PE INTERNATIONAL/ Five Winds Strategic ConsultingBrad Guy, Vice-Chair Material ReusePaul Bertram Kingspan Insulated Panels, North AmericaPaul Bierman-Lytle Pangeon/ iMCC Management ConsultingSteve Brauneis Rocky Mountain Institute Amy Costello Armstrong World IndustriesChris Geiger San Francisco Department of the EnvironmentBarry Giles BuildingWiseAvi Golen Construction Waste Management Lee Gros Lee Gros Architect and ArtisanRick Levin Kahler SlaterJoep Meijer The Right EnvironmentXhavin Sinha CH2M HILLRaymond Smith U.S. Environmental Protection AgencyWes Sullens StopWaste.Org of Alameda CountyDenise Van Valkenburg Eurofins
vi
Indoor Environmental Quality TAGDaniel Bruck, Chair BRC Acoustics & Audiovisual DesignMichelle Halle Stern, Vice-Chair The Green FacilitatorSahar Abbaszadeh The Cadmus GroupTerry Brennan Camroden AssociatesAida Carbo UL EnvironmentRandal Carter SteelcaseWenhao Chen California Department of Public HealthNancy Clanton Clanton & AssociatesDan Dempsey CarrierLarry Dykhuis Herman MillerDwayne Fuhlhage PROSOCOStowe Hartridge Beam Scientific Certification SystemsDan Int-Hout KruegerAlexis Kurtz The Sextant GroupMatt Latchford Lam PartnersDavid Lubman David Lubman & AssociatesRichard Master USG CorporationJohn McFarland WorkingBuildingsBud Offermann Indoor Environmental EngineeringReinhard Oppl Eurofins Product Testing A/SOzgem Ornektekin New York UniversityCharles Salter Salter AssociatesChris Schaffner The Green EngineerDana Schneider Jones Lang LaSalleDennis Stanke Trane Commercial SystemsDon Stevens Panasonic Home and Environment CompanyBob Thompson U.S. Environmental Protection AgencyEllen Tohn Tohn Environmental StrategiesPrasad Vaidya The Weidt Group
Pilot Credit Library Working GroupMarc Cohen (Chair) The Cadmus GroupLindsay Baker Mary Davidge AssociatesCheryl Baldwin GreenSealJames Bogdan PPG IndustriesCarlie Bullock-Jones Ecoworks StudioPaul Firth UL EnvironmentMick Schwedler TraneSteve Taylor Taylor EngineeringRichard Young Fisher-Nickel
Integrative Process Task GroupLindsay Baker Mary Davidge Associates John Boecker 7groupPenny Bonda Ecoimpact ConsultingJenny Carney YR&GJoel Todd Joel Ann ToddBill Reed Integrative Design CollaborativeHeather Rosenberg The Cadmus GroupLinda Sorrento National Academy of Environmental Design Keith Winn Catalyst PartnersBill Worthen Urban FabrikMax Zahniser Praxis | Building Solutions

vii
A special thanks to USGBC and GBCI staff for their invaluable efforts in developing this reference guide, especially to the following for their technical expertise: Emily Alvarez, Eric Anderson, Theresa Backhus, Lonny Blumenthal, Amy Boyce, Steve Brauneis, Sarah Buffaloe, Sara Cederberg, Christopher Davis, Robyn Eason, Corey Enck, Sean Fish, Asa Foss, Deon Glaser, Scott Haag, Gail Hampsmire, Jason Hercules, Jackie Hofmaenner, Theresa Hogerheide, Mika Kania, Heather Langford, Christopher Law, Rebecca Lloyd, Emily Loquidis, Chrissy Macken, Chris Marshall, Batya Metalitz, Larissa Oaks, Lauren Riggs, Jarrod Siegel, Micah Silvey, Ken Simpson, Megan Sparks, Rebecca Stahlnecker, and Tim Williamson.
A special thanks to Jessica Centella, Selina Holmes, and Dave Marcus for their graphics support and eye for design.
A thank you also goes to Scot Horst, Doug Gatlin, and Brendan Owens for their vision and support, and Meghan Bogaerts for her hard work, attention to detail and flair for writing. A very special thanks to Dara Zycherman, staff lead on the development of the LEED v4 Reference Guide suite, for her unwavering commitment to quality and her dedication to the production of the guides.
A special thanks to the consultant team which included Arup, CBRE, C.C. Johnson & Malhotra, Criterion Planners, Goby, Paladino & Co., Post Typography, West Main, and YR&G, and the unique artwork created for this publication by RTKL Associates.

LE
ED
RE
FE
RE
NC
E G
UID
E F
OR
bU
ILD
ING
DE
sIG
N A
ND
CO
Ns
tR
UC
tIO
N
LE
ED
RE
fE
RE
nc
E G
uiD
E f
oR
Bu
iLD
inG
DE
siG
n a
nD
co
ns
tR
uc
tio
n
4
PR
EFA
CE
Green buildings are an integral part of the solution to the environmental challenges facing the planet.
Today we use the equivalent of 1.5 Earths to meet the resource needs of everyday life and absorb the resulting wastes. This measure of our planet’s carrying capacity means that it takes Earth 18 months to regenerate what is used in only 12 months. If current trends continue, estimates suggest, by the year 2030 we will need the equivalent of two planets.1 Turning resources into waste faster than they can be regenerated puts the planet into ecological overshoot, a clearly unsustainable condition that we all must address.
The forces driving this situation are numerous. Human population has increased exponentially in the past 60 years, from about 2.5 billion in 1950 to more than 7 billion today. Our linear use of resources, treating outputs as waste, is responsible for the toxins that are accumulating in the atmosphere, in water, and on the ground. This pattern of extraction, use, and disposal has hastened depletion of finite supplies of nonrenewable energy, water, and materials and is accelerating the pace of our greatest problem—climate change. Buildings account for a significant portion of greenhouse gas emissions; in the U.S., buildings are associated with 38% of all emissions of carbon dioxide2; globally, the figure is nearly one-third.3 The problem is anticipated to worsen as developing countries attain higher standards of living. These forces are bringing us to a tipping point, a threshold beyond which Earth cannot rebalance itself without major disruption to the systems that humans and other species rely on for survival.
The Case for Green buildinG
The impetus behind development of the Leadership in Energy and Environmental Design (LEED) rating systems was recognition of those problems, coupled with awareness that the design and construction industry already had the expertise, tools, and technology to transform buildings and make significant advances toward a sustainable planet. LEED projects throughout the world have demonstrated the benefits of taking a green design approach that reduces the environmental harms of buildings and restores the balance of natural systems.
Buildings have a major role to play in sustainability through their construction, the lifetime of their operation, and patterns of development. As Earth’s population continues to increase, construction and renovation of buildings expand even more rapidly. For example, estimates for the U.S. indicate that two-thirds of the structures that will exist in 2050 will have been built between now and then.4 What we build today and where we build it are profoundly important.
The green building portion of the construction market is rapidly expanding. It represented 2% of nonresidential construction starts in 2005, 12% in 2008, and 28% to 35% in 2010.5 The concept of green buildings provides a vision for resource equity between developing and developed nations. As green building practices guide developed nations toward a more responsible use of resources, they enable developing nations to attain essential improvements in quality of life without overtaxing local resources.
1. GlobalFootprintNetwork,http://footprintnetwork.org/en/index.php/gfn/page/world_footprint/,accessed9/11/20122. EnergyInformationAdministration(2008).AssumptionstotheAnnualEnergyOutlook3. unep.org/sbci/pdfs/SBCI-BCCSummary.pdf.4. Ewing,R.,K.Bartholomew,S.Winkleman,J.Walters,andD.Chen,GrowingCooler:TheEvidenceonUrbanDevelopmentandClimateChange(Washington,
DC:UrbanLandInstitute,2008),p.8,smartgrowthamerica.org/documents/growingcoolerCH1.pdf.5. GreenOutlook2011:GreenTrendsDrivingGrowth(McGraw-HillConstruction,2010).
5
PR
EFA
CE
th
e c
as
e f
or
gr
ee
n b
uil
din
g
abouT leed
Developed by the U.S. Green Building Council, LEED is a framework for identifying, implementing, and measuring green building and neighborhood design, construction, operations, and maintenance. LEED is a voluntary, market-driven, consensus-based tool that serves as a guideline and assessment mechanism. LEED rating systems address commercial, institutional, and residential buildings and neighborhood developments.
LEED seeks to optimize the use of natural resources, promote regenerative and restorative strategies, maximize the positive and minimize the negative environmental and human health consequences of the construction industry, and provide high-quality indoor environments for building occupants. LEED emphasizes integrative design, integration of existing technology, and state-of-the-art strategies to advance expertise in green building and transform professional practice. The technical basis for LEED strikes a balance between requiring today’s best practices and encouraging leadership strategies. LEED sets a challenging yet achievable set of benchmarks that define green building for interior spaces, entire structures, and whole neighborhoods.
LEED for New Construction and Major Renovations was developed in 1998 for the commercial building industry and has since been updated several times. Over the years, other rating systems have been developed to meet the needs of different market sectors.
Since its launch, LEED has evolved to address new markets and building types, advances in practice and technology, and greater understanding of the environmental and human health effects of the built environment. These ongoing improvements, developed by USGBC member-based volunteer committees, subcommittees, and working groups in conjunction with USGBC staff, have been reviewed by the LEED Steering Committee and the USGBC Board of Directors before being submitted to USGBC members for a vote. The process is based on principles of transparency, openness, and inclusiveness.
leed's Goals
The LEED rating systems aim to promote a transformation of the construction industry through strategies designed to achieve seven goals:
· To reverse contribution to global climate change
· To enhance individual human health and well-being
· To protect and restore water resources
· To protect, enhance, and restore biodiversity and ecosystem services
· To promote sustainable and regenerative material resources cycles
· To build a greener economy
· To enhance social equity, environmental justice, community health, and quality of life
These goals are the basis for LEED’s prerequisites and credits. In the BD+C rating system, the major prerequisites and credits are categorized as Location and Transportation (LT), Sustainable Sites (SS), Water Efficiency (WE), Energy and Atmosphere (EA), Materials and Resources (MR), and Indoor Environmental Quality (EQ).
The goals also drive the weighting of points toward certification. Each credit in the rating system is allocated points based on the relative importance of its contribution to the goals. The result is a weighted average: credits that most directly address the most important goals are given the greatest weight. Project teams that meet the prerequisites and earn enough credits to achieve certification have demonstrated performance that spans the goals in an integrated way. Certification is awarded at four levels (Certified, Silver, Gold, Platinum) to incentivize higher achievement and, in turn, faster progress toward the goals.
benefiTs of usinG leed
LEED is designed to address environmental challenges while responding to the needs of a competitive market. Certification demonstrates leadership, innovation, environmental stewardship, and social responsibility. LEED
LE
ED
RE
fE
RE
nc
E G
uiD
E f
oR
Bu
iLD
inG
DE
siG
n a
nD
co
ns
tR
uc
tio
n
6
PR
EFA
CE
gives building owners and operators the tools they need to immediately improve both building performance and the bottom line while providing healthful indoor spaces for a building’s occupants.
LEED-certified buildings are designed to deliver the following benefits:
· Lower operating costs and increased asset value
· Reduced waste sent to landfills
· Energy and water conservation
· More healthful and productive environments for occupants
· Reductions in greenhouse gas emissions
· Qualification for tax rebates, zoning allowances, and other incentives in many cities
By participating in LEED, owners, operators, designers, and builders make a meaningful contribution to the green building industry. By documenting and tracking buildings’ resource use, they contribute to a growing body of knowledge that will advance research in this rapidly evolving field. This will allow future projects to build on the successes of today’s designs and bring innovations to the market.
leed CerTifiCaTion ProCess
The process begins when the owner selects the rating system and registers the project (see RatingSystemSelection). The project is then designed to meet the requirements for all prerequisites and for the credits the team has chosen to pursue. After documentation has been submitted for certification, a project goes through preliminary and final reviews. The preliminary review provides technical advice on credits that require additional work for achievement, and the final review contains the project’s final score and certification level. The decision can be appealed if a team believes additional consideration is warranted.
LEED has four levels of certification, depending on the point thresholds achieved:
· Certified, 40–49 points
· Silver, 50–59 points
· Gold, 60–79 points
· Platinum, 80 points and above
referenCe Guide overvieW
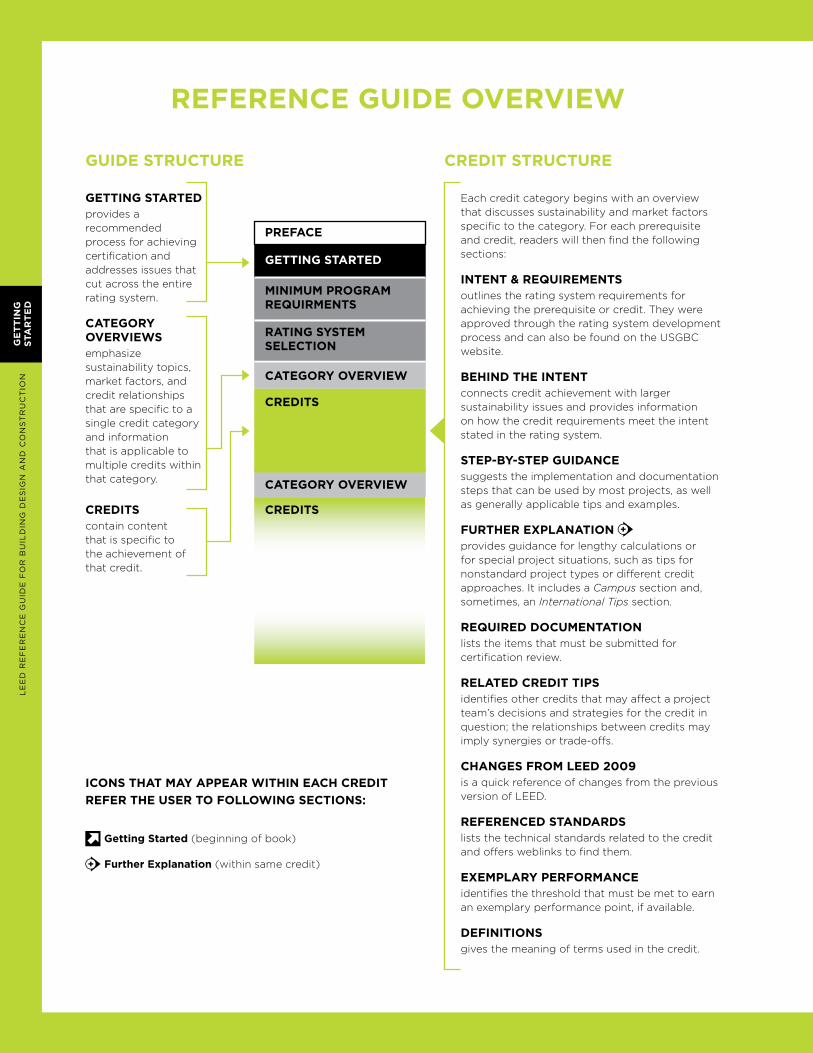
GeTTinG sTarTed provides a recommended process for achieving certification and addresses issues that cut across the entire rating system.
CaTeGory overvieWsemphasize sustainability topics, market factors, and credit relationships that are specific to a single credit category and information that is applicable to multiple credits within that category.
CrediTscontain content that is specific to the achievement of that credit.
Each credit category begins with an overview that discusses sustainability and market factors specific to the category. For each prerequisite and credit, readers will then find the following sections:
inTenT & requireMenTs outlines the rating system requirements for achieving the prerequisite or credit. They were approved through the rating system development process and can also be found on the USGBC website.
behind The inTenT connects credit achievement with larger sustainability issues and provides information on how the credit requirements meet the intent stated in the rating system.
sTeP-by-sTeP GuidanCesuggests the implementation and documentation steps that can be used by most projects, as well as generally applicable tips and examples.
furTher exPlanaTion provides guidance for lengthy calculations or for special project situations, such as tips for nonstandard project types or different credit approaches. It includes a Campus section and, sometimes, an International Tips section.
required doCuMenTaTionlists the items that must be submitted for certification review.
relaTed CrediT TiPs identifies other credits that may affect a project team’s decisions and strategies for the credit in question; the relationships between credits may imply synergies or trade-offs.
ChanGes froM leed 2009 is a quick reference of changes from the previous version of LEED.
referenCed sTandards lists the technical standards related to the credit and offers weblinks to find them.
exeMPlary PerforManCeidentifies the threshold that must be met to earn an exemplary performance point, if available.
definiTionsgives the meaning of terms used in the credit.
Guide sTruCTure
iCons ThaT May aPPear WiThin eaCh CrediT refer The user To folloWinG seCTions:
Getting started (beginning of book)
further explanation (within same credit)
GeTTinG sTarTed
MiniMuM ProGraM requirMenTs
PrefaCe
category overview
CrediTs
credits
CaTeGory overvieW
raTinG sysTeM seleCTion
CrediT sTruCTure
Ge
TT
inG
sTa
rT
ed
LE
ED
RE
fE
RE
nc
E G
uiD
E f
oR
Bu
iLD
inG
DE
siG
n a
nD
co
ns
tR
uc
tio
n

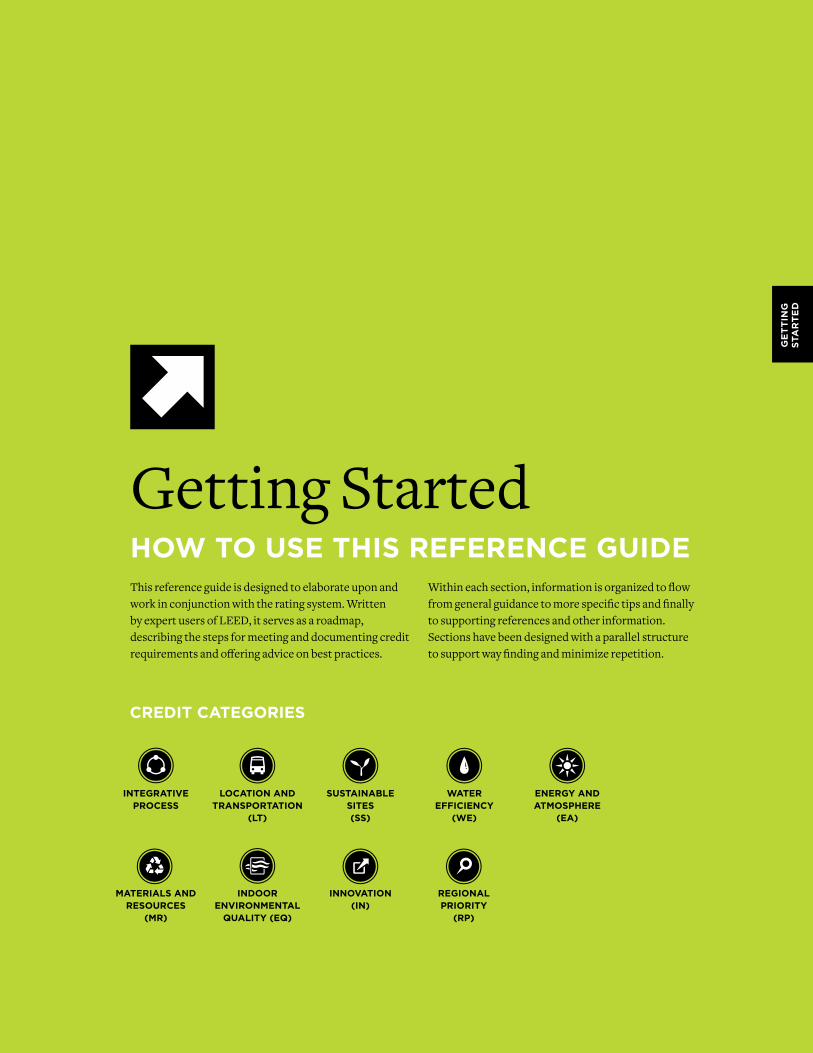
Getting StartedhoW To use This referenCe GuideThis reference guide is designed to elaborate upon and work in conjunction with the rating system. Written by expert users of LEED, it serves as a roadmap, describing the steps for meeting and documenting credit requirements and offering advice on best practices.
Within each section, information is organized to flow from general guidance to more specific tips and finally to supporting references and other information. Sections have been designed with a parallel structure to support way finding and minimize repetition.
CrediT CaTeGories
enerGy andaTMosPhere
(ea)
loCaTion and TransPorTaTion
(lT)
indoorenvironMenTal
qualiTy (eq)
WaTereffiCienCy
(We)
inTeGraTiveProCess
MaTerials andresourCes
(Mr)
susTainablesiTes(ss)
innovaTion (in)
reGional PrioriTy
(rP)
Ge
TT
inG
sTa
rT
ed
10
Ge
TT
inG
sTa
rT
ed
More abouT The furTher exPlanaTion seCTion
FurtherExplanation contains varied subsections depending on the credit; two of the common subsections are elaborated upon here.
CaMPus ProjeCTs
Campus refers to the Campus Program for Projects on a Shared Site, which certifies multiple buildings located on one site and under the control of a single entity. Examples include buildings on a corporate or educational campus and structures in a commercial development. Only project teams using the Campus Program need to follow the guidance in the Campus section; the guidance is not applicable to projects that are in a campus setting or are part of a multitenant complex but not pursuing certification using the Campus Program.
There are two approaches to certifying multiple buildings under the Campus Program:
· Group Approach allows buildings that are substantially similar and are in a single location to certify as one project that shares a single certification.
· Campus Approach allows buildings that share a single location and site attributes to achieve separate LEED certification for each project, building space, or group on the master site.
For each approach, the reference guide gives any credit-specific information and notes two possible scenarios:
· Group Approach
° “All buildings in the group may be documented as one.” The buildings may meet the credit requirements as a single group by, for example, pooling resources or purchasing, and then submitting a single set of documentation.
° “Submit separate documentation for each building.” Each building in the group project must meet the credit requirements individually for the project to earn the credit.
· Campus Approach
° “Eligible.” This credit may be documented once at the level of the master site, and then individual projects within the master site boundary earn the credit without submitting additional documentation.
° “Ineligible. Each LEED project may pursue the credit individually.” Each project within the campus boundary may earn the credit but each project must document compliance separately.
ProjeCTs ouTside The us
TheInternationalTips section offers advice on determining equivalency to U.S. standards or using non-U.S. standards referenced in the rating system. It is meant to complement, not replace, the other sections of the credit. Helpful advice for projects outside the U.S. may also appear in the Step-by-StepGuidance section of each credit. When no tips are needed or available, theInternationalTipsheading does not appear.
Units of measurement are given in both Inch-Pound (IP) and International System of Units (SI). IP refers to the system of measurements based on the inch, pound, and gallon, historically derived from the English system and commonly used in the U.S. SI is the modern metric system used in most other parts of the world and defined by the General Conference on Weights and Measures.
Where “local equivalent” is specified, it means an alternative to a LEED referenced standard that is specific to a project’s locality. This standard must be widely used and accepted by industry experts and when applied, must meet the credit’s intent leading to similar or better outcomes.
Where “USGBC-approved local equivalent” is specified, it means a local standard deemed equivalent to the listed standard by the U.S. Green Building Council through its process for establishing non-U.S. equivalencies in LEED.
° For Path 2 or 3, use a virtual upstream DES plant for the proposed case and compare it with code-compliant
LE
ED
RE
fE
RE
nc
E G
uiD
E f
oR
Bu
iLD
inG
DE
siG
n a
nD
co
ns
tR
uc
tio
n
11
Ge
TT
inG
sTa
rT
ed
TakinG an inTeGraTive aPProaCh To desiGn and ConsTruCTion
The realization of benefits associated with LEED starts with a transformation of the design process itself. Success in LEED and green building design is best accomplished through an integrative design process that prioritizes cost-effectiveness over both the short and long terms and engages all project team members in discovering beneficial interrelationships and synergies between systems and components. By integrating technical and living systems, the team can achieve high levels of building performance, human performance, and environmental benefits.
Conventionally, the design and construction disciplines work separately, and their solutions to design and construction challenges are fragmented. These “solutions” often create unintended consequences—some positive, but mostly negative. The corollary is that when areas of practice are integrated, it becomes possible to significantly improve building performance and achieve synergies that yield economic, environmental, and human health benefits.1
In the conventional design process, each discipline’s practitioner is expected to design the subassemblies and system components under his or her control for the most benefit and the least cost. In an integrative process, an entire team—client, designers, builders, and operators—identifies overlapping relationships, services, and redundancies among systems so that interdependencies and benefits (which otherwise would have gone unnoticed) can be exploited, thereby increasing performance and reducing costs.
To work this way requires that project teams, whose members represent various disciplines, come together so that the knowledge, analyses, and ideas from each discipline can inform and link with the systems and components of all other disciplines. In this way, LEED credits become aspects of a whole rather than separate components, and the entire design and construction team can identify the interrelationships and linked benefits across multiple LEED credits.
The coordination of building and site systems should be addressed early, preferably before schematic design. The Integrative Process credit formally introduces this way of working into LEED so that the team members’ expertise in building and site systems can inform the performance, efficiency, and effectiveness of every system.
The strategies in the Integrative Process credit are recommended for all LEED projects because they encourage integration during early design stages, when it will be the most effective. The credit introduces an integrative process by focusing on engaging energy- and water-related research and analysis to inform early design decisions through high levels of collaboration among all project team members.
Approaching certification using an integrative process gives the project team the greatest chance of success. The process includes three phases:
· Discovery. The most important phase of the integrative process, discovery can be thought of as an extensive expansion of what is conventionally called predesign. A project is unlikely to meets its environmental goals cost-effectively without this discrete phase. Discovery work should take place before schematic design begins.
· Design and construction (implementation). This phase begins with what is conventionally called schematic design. It resembles conventional practice but integrates all the work and collective understanding of system interactions reached during the discovery phase.
· Occupancy, operations, and performance feedback. This third stage focuses on preparing to measure performance and creating feedback mechanisms. Assessing performance against targets is critical for informing building operations and identifying the need for any corrective action.
Achieving economic and environmental performance requires that every issue and all team members (clients, designers, engineers, constructors, operators) be brought into the project at the earliest point, before anything is yet designed. The structure to manage this flow of people, information, and analysis is as follows:
· All project team members, representing all design and construction disciplines, gather information and data relevant to the project.
· Team members analyze their information.
· Team members participate in workshops to compare notes and identify opportunities for synergy.
This process of research, analysis, and workshops is done in an iterative cycle that refines the design solutions. In the best scenario, the research and workshops continue until the project systems are optimized, all reasonable synergies are identified, and the related strategies associated with all LEED credits are documented and implemented.
1. IntegrativeProcess(IP)ANSIConsensusNationalStandardGuide©2.0forDesignandConstructionofSustainableBuildingsandCommunities(February2,2012),p.4,webstore.ansi.org/RecordDetail.aspx?sku=MTS+2012%3a1.
ho
w t
o u
sE
th
is R
Ef
ER
En
cE
Gu
iDE
12
devisinG a leed Work Plan
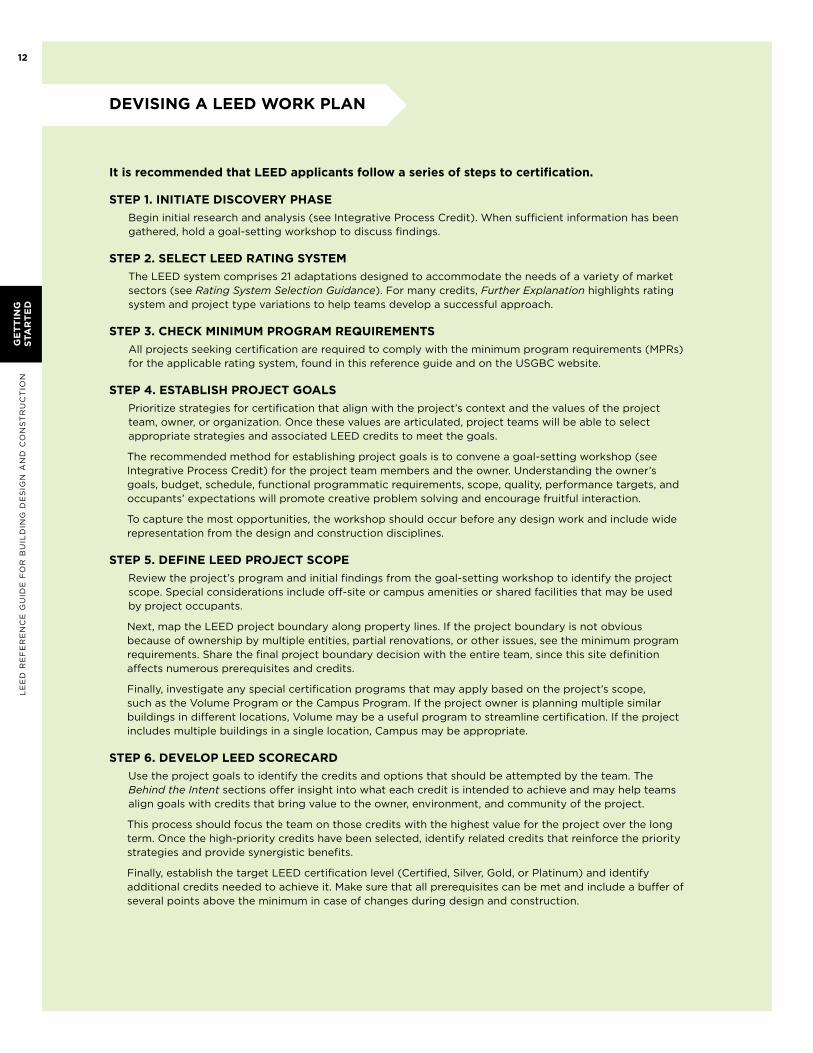
it is recommended that leed applicants follow a series of steps to certification.
sTeP 1. iniTiaTe disCovery PhaseBegin initial research and analysis (see integrative Process credit). when sufficient information has been gathered, hold a goal-setting workshop to discuss findings.
sTeP 2. seleCT leed raTinG sysTeM the LEED system comprises 21 adaptations designed to accommodate the needs of a variety of market sectors (see Rating System Selection Guidance). for many credits, Further Explanation highlights rating system and project type variations to help teams develop a successful approach.
sTeP 3. CheCk MiniMuM ProGraM requireMenTsall projects seeking certification are required to comply with the minimum program requirements (MPRs) for the applicable rating system, found in this reference guide and on the usGBc website.
sTeP 4. esTablish ProjeCT Goals Prioritize strategies for certification that align with the project’s context and the values of the project team, owner, or organization. once these values are articulated, project teams will be able to select appropriate strategies and associated LEED credits to meet the goals.
the recommended method for establishing project goals is to convene a goal-setting workshop (see integrative Process credit) for the project team members and the owner. understanding the owner’s goals, budget, schedule, functional programmatic requirements, scope, quality, performance targets, and occupants’ expectations will promote creative problem solving and encourage fruitful interaction.
to capture the most opportunities, the workshop should occur before any design work and include wide representation from the design and construction disciplines.
sTeP 5. define leed ProjeCT sCoPe Review the project’s program and initial findings from the goal-setting workshop to identify the project scope. special considerations include off-site or campus amenities or shared facilities that may be used by project occupants.
next, map the LEED project boundary along property lines. if the project boundary is not obvious because of ownership by multiple entities, partial renovations, or other issues, see the minimum program requirements. share the final project boundary decision with the entire team, since this site definition affects numerous prerequisites and credits.
finally, investigate any special certification programs that may apply based on the project’s scope, such as the Volume Program or the campus Program. if the project owner is planning multiple similar buildings in different locations, Volume may be a useful program to streamline certification. if the project includes multiple buildings in a single location, campus may be appropriate.
sTeP 6. develoP leed sCoreCard use the project goals to identify the credits and options that should be attempted by the team. the Behind the Intent sections offer insight into what each credit is intended to achieve and may help teams align goals with credits that bring value to the owner, environment, and community of the project.
this process should focus the team on those credits with the highest value for the project over the long term. once the high-priority credits have been selected, identify related credits that reinforce the priority strategies and provide synergistic benefits.
finally, establish the target LEED certification level (certified, silver, Gold, or Platinum) and identify additional credits needed to achieve it. Make sure that all prerequisites can be met and include a buffer of several points above the minimum in case of changes during design and construction.
Ge
TT
inG
sTa
rT
ed
LE
ED
RE
fE
RE
nc
E G
uiD
E f
oR
Bu
iLD
inG
DE
siG
n a
nD
co
ns
tR
uc
tio
n
13
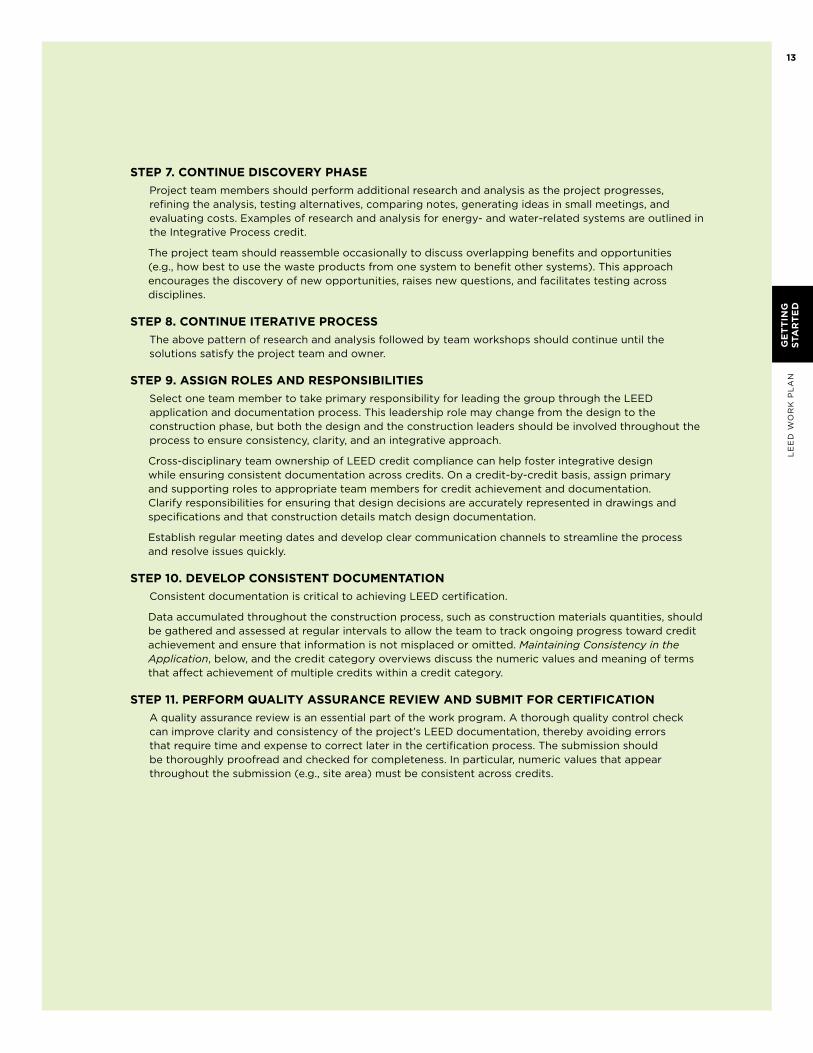
sTeP 7. ConTinue disCovery PhaseProject team members should perform additional research and analysis as the project progresses, refining the analysis, testing alternatives, comparing notes, generating ideas in small meetings, and evaluating costs. Examples of research and analysis for energy- and water-related systems are outlined in the integrative Process credit.
the project team should reassemble occasionally to discuss overlapping benefits and opportunities (e.g., how best to use the waste products from one system to benefit other systems). this approach encourages the discovery of new opportunities, raises new questions, and facilitates testing across disciplines.
sTeP 8. ConTinue iTeraTive ProCessthe above pattern of research and analysis followed by team workshops should continue until the solutions satisfy the project team and owner.
sTeP 9. assiGn roles and resPonsibiliTies select one team member to take primary responsibility for leading the group through the LEED application and documentation process. this leadership role may change from the design to the construction phase, but both the design and the construction leaders should be involved throughout the process to ensure consistency, clarity, and an integrative approach.
cross-disciplinary team ownership of LEED credit compliance can help foster integrative design while ensuring consistent documentation across credits. on a credit-by-credit basis, assign primary and supporting roles to appropriate team members for credit achievement and documentation. clarify responsibilities for ensuring that design decisions are accurately represented in drawings and specifications and that construction details match design documentation.
Establish regular meeting dates and develop clear communication channels to streamline the process and resolve issues quickly.
sTeP 10. develoP ConsisTenT doCuMenTaTion consistent documentation is critical to achieving LEED certification.
Data accumulated throughout the construction process, such as construction materials quantities, should be gathered and assessed at regular intervals to allow the team to track ongoing progress toward credit achievement and ensure that information is not misplaced or omitted. Maintaining Consistency in the Application, below, and the credit category overviews discuss the numeric values and meaning of terms that affect achievement of multiple credits within a credit category.
sTeP 11. PerforM qualiTy assuranCe revieW and subMiT for CerTifiCaTiona quality assurance review is an essential part of the work program. a thorough quality control check can improve clarity and consistency of the project’s LEED documentation, thereby avoiding errors that require time and expense to correct later in the certification process. the submission should be thoroughly proofread and checked for completeness. in particular, numeric values that appear throughout the submission (e.g., site area) must be consistent across credits.
Ge
TT
inG
sTa
rT
ed
LE
ED
wo
Rk
PL
an
14
MainTaininG ConsisTenCy in The aPPliCaTion
Certain issues recur across multiple credits and credit categories and must be treated consistently throughout the submission.
sPeCial ProjeCT siTuaTions
Projects with a combination of space types or unusual space types should pay particular attention to how these characteristics influence credit achievement. Common project programs that require additional consideration include the following:
Mixed UseProjects with a mix of uses may find it helpful to consult the ProjectTypeVariations and RatingSystemVariations sections in the reference guide for advice. For example, if an office building certifying under BD+C: New Construction includes a small data center, the team should follow the data center guidelines for certain credits; these guidelines are not limited to BD+C: Data Centers projects. Another common scenario is a hotel project certifying under BD+C: Hospitality; in designing the retail spaces on the hotel’s ground floor, the team could benefit from guidance for BD+C: Retail projects.
Multitenant ComplexSome projects may be part of a large complex of buildings or a master planned development. Any project can follow the multitenant complex approach if it is part of a master plan development, regardless of whether the project is using the LEED Campus approach.
Incomplete SpacesBuildings and spaces that earn LEED certification should be completed by the time they have submitted their final application for LEED certification. Complete means that no further work is needed and the project is ready for occupancy. No more than 40% of the certifying gross floor area of a LEED project may consist of incomplete space unless the project is using the LEED BD+C: Core and Shell rating system. Additionally, projects that include incomplete spaces must use Appendix 2 Default Occupancy Counts to establish occupant counts for incomplete spaces.
For incomplete spaces in projects using a rating system other than LEED BD+C: Core and Shell, the project team must provide supplemental documentation.
· Submit a letter of commitment, signed by the owner, indicating that the remaining incomplete spaces will satisfy the requirements of each prerequisite and credit achieved by this project if and when completed by the owner. This letter may cover the commitment in general terms and need not address each prerequisite or credit individually.
· For incomplete spaces intended to be finished by tenants (i.e., parties other than the owner), submit a set of nonbinding tenant design and construction guidelines, with a brief explanation of the project circumstances.
For prerequisites with established baselines (e.g., WE Prerequisite Indoor Water Use, EA Prerequisite Minimum Energy Performance) and the credits dependent on the calculations in the prerequisites, the proposed design must be equivalent to the baseline for the incomplete spaces. Project teams that wish to claim environmental performance or benefit beyond the baseline for incomplete spaces should refer to the Tenant Lease and Sales Agreement section.
Projects with Several Physically Distinct StructuresPrimary and secondary school projects, hospitals (general medical and surgical), hotels, resorts, and resort properties, as defined for ENERGY STAR building rating purposes, are eligible to include more than one physically distinct structure in a single LEED project certification application without having to use the Campus Program, subject to the following conditions.
· The buildings to be certified must be a part of the same identity. For example, the buildings are all part of the same elementary school, not a mix of elementary school and high school buildings.
Ge
TT
inG
sTa
rT
ed
LE
ED
RE
fE
RE
nc
E G
uiD
E f
oR
Bu
iLD
inG
DE
siG
n a
nD
co
ns
tR
uc
tio
n
15
· The project must be analyzed as a whole (i.e., in aggregate) for all minimum program requirements (MPRs), prerequisites, and credits in the LEED rating system.
· All the land area and all building floor areas within the LEED project boundary must be included in every prerequisite and credit submitted for certification.
· There is no specific limit on the number of structures, but the aggregate gross floor area included in a single project must not exceed 1 million square feet (92 905 square meters).
Any single structure that is larger than 25,000 square feet (2 320 square meters) must be registered as a separate project or treated as a separate building in a group certification approach.
renovaTions and addiTions
Refer to the minimum program requirements for information on how boundaries should be drawn for renovation and addition projects. Additionally, use the following guidance for treating energy systems in any project with mechanical systems.
· Separate systems. Mechanical systems are completely separate from those in the existing building (emergency generators excepted) and can be modeled separately.
· Shared central systems located outside the project building or space. Each prerequisite and credit section related to energy modeling offers specific guidance on how to handle this situation; in particular, see the guidance for EA Prerequisite Minimum Energy Performance.
TenanT sales and lease aGreeMenT
LEED BD+C: Core and Shell is designed to address the speculatively driven development market where project teams routinely do not control all aspects of the building’s construction. The scope of Core and Shell is limited to those elements of the project under the direct control of the owner/developer. At a minimum, the scope includes the core and the shell of the base building but can vary significantly from project to project.
Given that Core and Shell is limited in its ability to control the design and construction of tenant interior fit-outs, project teams should pursue credits that address parts of the building within the LEED project scope. Only portions of the building within the LEED project scope should be used in credit calculations. If a project team wishes to pursue additional credits or thresholds beyond the construction scope of the LEED project, a binding tenant sales and lease agreement must be provided as documentation. This must be signed by the future tenant and include terms related to how the technical credit requirements will be carried out by the tenant. An unsigned or sample lease agreement is not acceptable. Please note that lease agreements are not required in order to pursue Core and Shell. They are only used if a project is aiming to earn additional points considered outside of the project design and construction scope that will be fit-out by a future tenant.
Previous develoPMenT
Several credits require the assessment of a piece of land to determine whether it has been previously developed, defined as follows:
previously developed altered by paving, construction, and/or land use that would typically have required regulatory permitting to have been initiated (alterations may exist now or in the past). Land that is not previously developed and landscapes altered by current or historical clearing or filling, agricultural or forestry use, or preserved natural area use are considered undeveloped land. The date of previous development permit issuance constitutes the date of previous development, but permit issuance in itself does not constitute previous development.
Tricky lands to assess include those with few buildings present. If the land previously had buildings, then it is considered previously developed even if those buildings have since been torn down. Another frequently confusing situation is parkland. Pay careful attention to the type of parkland. Improved parks with graded land and constructed features like playgrounds (e.g., a city park) are considered previously developed. Land maintained in a natural state (e.g., a forest preserve) is not considered previously developed, even if minor features like walking paths are present.
Ge
TT
inG
sTa
rT
ed
Ma
int
ain
inG
co
ns
ist
En
cy
in
th
E a
PP
Lic
at
ion
16
develoPMenT fooTPrinT
A project’s development footprint is all of its impervious surfaces. development footprint the total land area of a project site covered by buildings, streets, parking areas, and other typically impermeable surfaces constructed as part of the project
Surfaces paved with permeable pavement (at least 50% permeable) are excluded from the development footprint.
densiTy
Density can be calculated separately for residential and nonresidential elements or as a single value. The following definitions apply:
density a ratio of building coverage on a given parcel of land to the size of that parcel. Density can be measured using floor area ratio (FAR); dwelling units per acre (DU/acre) or dwelling units per hectare (DU/hectare); square feet of building area per acre of buildable land; or square meters of building area per hectare of buildable land. It does not include structured parking.
buildable land the portion of the site where construction can occur, including land voluntarily set aside and not constructed on. When used in density calculations, buildable land excludes public rights-of-way and land excluded from development by codified law.
Land voluntarily set aside and not built on, such as open space, is considered buildable because it was available for construction but set aside voluntarily. For example, 5 acres (2 hectares) of park space required by local government code would be considered nonbuildable, but if a developer voluntarily sets aside an additional 3 acres (1.2 hectares) for more park space, those 3 acres (1.2 hectares) must be categorized as buildable land.
After determining buildable land, calculate residential or nonresidential density or a combined density. To calculate residential density, divide the number of dwelling units by the amount of residential land. To calculate nonresidential density, use floor area ratio (FAR):
floor-area ratio (FAR) the density of nonresidential land use, exclusive of structured parking, measured as the total nonresidential building floor area divided by the total buildable land area available for nonresidential buildings.
For example, on a site with 10,000 square feet (930 square meters) of buildable nonresidential land area, a building of 10,000 square feet (930 square meters) of floor area would have a FAR of 1.0. On the same site, a building of 5,000 square feet (465 square meters) would have a FAR of 0.5; a building of 15,000 square feet (1 395 square meters) would have a FAR of 1.5; and a building of 20,000 square feet (1 860 square meters) would have a FAR of 2.0.
To calculate the combined density for residential and nonresidential areas, use FAR.
oCCuPanCy
Many kinds of people use a typical LEED building, and the mix varies by project type. Occupants are sometimes referred to in a general sense; for example, “Provide places of respite that are accessible to patients and visitors.” In other instances, occupants must be counted for calculations. Definitions of occupant types are general guidelines that may be modified or superseded in a particular credit when appropriate (such changes are noted in each credit’s reference guide section). Most credits group users into two categories, regular building occupants and visitors.
Ge
TT
inG
sTa
rT
ed
LE
ED
RE
fE
RE
nc
E G
uiD
E f
oR
Bu
iLD
inG
DE
siG
n a
nD
co
ns
tR
uc
tio
n
17
Regular Building OccupantsRegular building occupants are habitual users of a building. All of the following are considered regular building occupants.
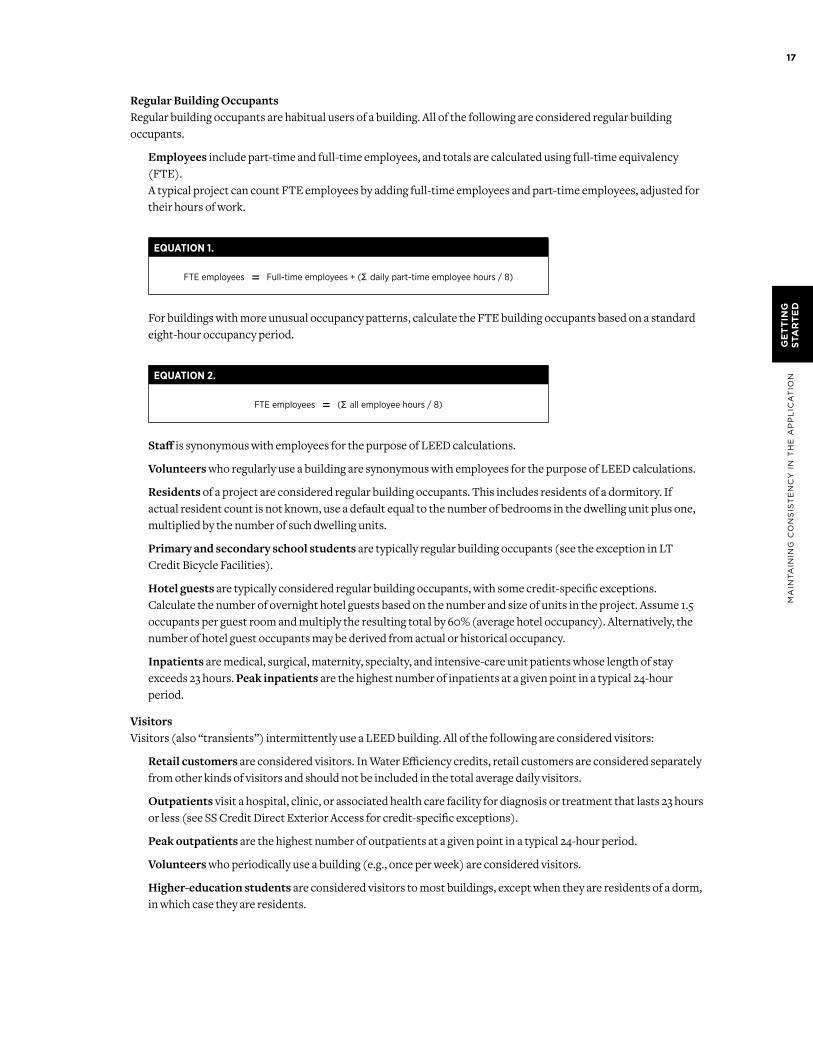
Employees include part-time and full-time employees, and totals are calculated using full-time equivalency (FTE). A typical project can count FTE employees by adding full-time employees and part-time employees, adjusted for their hours of work.
Equation 1.
FTE employees = Full-time employees + (Σ daily part-time employee hours / 8)
For buildings with more unusual occupancy patterns, calculate the FTE building occupants based on a standard eight-hour occupancy period.
Equation 2.
FTE employees = (Σ all employee hours / 8)
Staff is synonymous with employees for the purpose of LEED calculations.
Volunteers who regularly use a building are synonymous with employees for the purpose of LEED calculations.
Residents of a project are considered regular building occupants. This includes residents of a dormitory. If actual resident count is not known, use a default equal to the number of bedrooms in the dwelling unit plus one, multiplied by the number of such dwelling units.
Primary and secondary school students are typically regular building occupants (see the exception in LT Credit Bicycle Facilities).
Hotel guests are typically considered regular building occupants, with some credit-specific exceptions. Calculate the number of overnight hotel guests based on the number and size of units in the project. Assume 1.5 occupants per guest room and multiply the resulting total by 60% (average hotel occupancy). Alternatively, the number of hotel guest occupants may be derived from actual or historical occupancy.
Inpatients are medical, surgical, maternity, specialty, and intensive-care unit patients whose length of stay exceeds 23 hours. Peak inpatients are the highest number of inpatients at a given point in a typical 24-hour period.
VisitorsVisitors (also “transients”) intermittently use a LEED building. All of the following are considered visitors:
Retail customers are considered visitors. In Water Efficiency credits, retail customers are considered separately from other kinds of visitors and should not be included in the total average daily visitors.
Outpatients visit a hospital, clinic, or associated health care facility for diagnosis or treatment that lasts 23 hours or less (see SS Credit Direct Exterior Access for credit-specific exceptions).
Peak outpatients are the highest number of outpatients at a given point in a typical 24-hour period.
Volunteers who periodically use a building (e.g., once per week) are considered visitors.
Higher-education students are considered visitors to most buildings, except when they are residents of a dorm, in which case they are residents.
Ge
TT
inG
sTa
rT
ed
Ma
int
ain
inG
co
ns
ist
En
cy
in
th
E a
PP
Lic
at
ion
18
In calculations, occupant types are typically counted in two ways:
Daily averages take into account all the occupants of a given type for a typical 24-hour day of operation.
Peak totals are measured at the moment in a typical 24-hour period when the highest number of a given occupant type is present.
Whenever possible, use actual or predicted occupancies. If occupancy cannot be accurately predicted, one of the following resources to estimate occupancy:
a. Default occupant density from ASHRAE 62.1-2010, Table 6-1
b. Default occupant density from CEN Standard EN 15251, Table B.2
c. Appendix 2 Default Occupancy Counts
d. Results from applicable studies.
If numbers vary seasonally, use occupancy numbers that are a representative daily average over the entire operating season of the building.
If occupancy patterns are atypical (shift overlap, significant seasonal variation), explain such patterns when submitting documentation for certification.
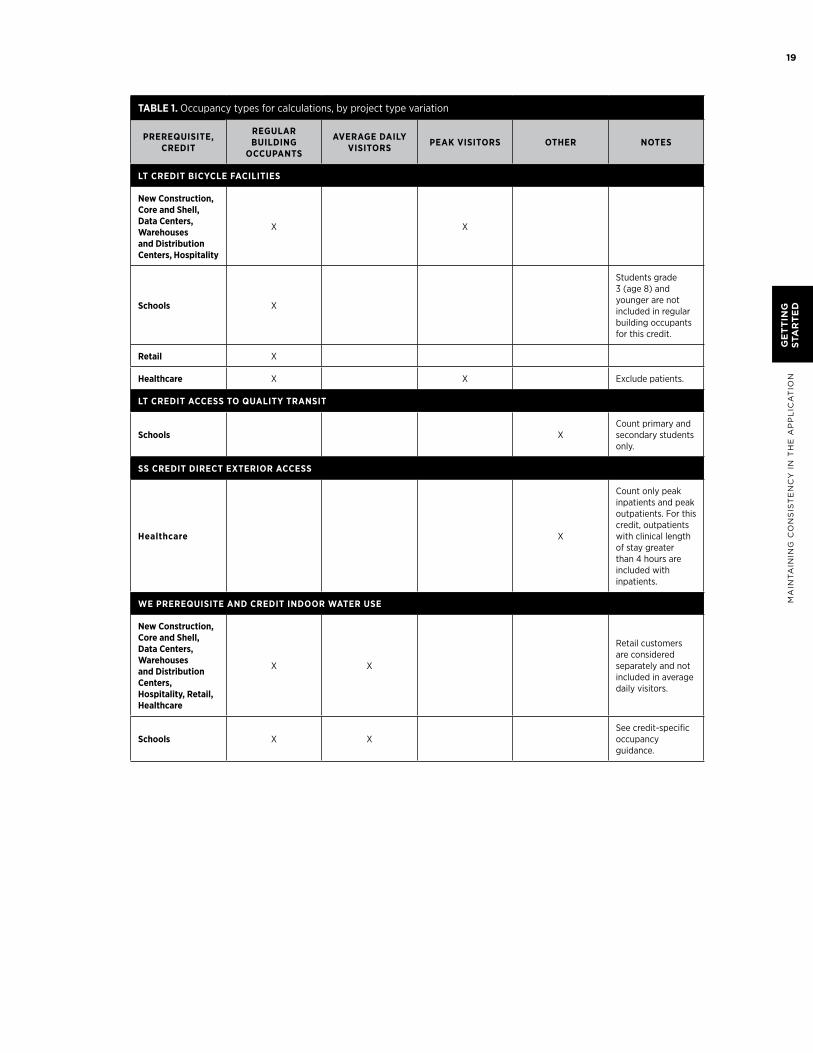
Table 1 lists prerequisites and credits that require specific occupancy counts for calculations.
Ge
TT
inG
sTa
rT
ed
LE
ED
RE
fE
RE
nc
E G
uiD
E f
oR
Bu
iLD
inG
DE
siG
n a
nD
co
ns
tR
uc
tio
n
19
tablE 1. Occupancy types for calculations, by project type variation
PrErEquisitE, crEdit
rEgular building
occuPants
avEragE daily visitors PEak visitors othEr notEs
lt crEdit bicyclE FacilitiEs
new construction, core and shell, data centers, Warehouses and distribution centers, hospitality
X X
schools X
Students grade 3 (age 8) and younger are not included in regular building occupants for this credit.
retail X
healthcare X X Exclude patients.
lt crEdit accEss to quality transit
schools XCount primary and secondary students only.
ss crEdit dirEct ExtErior accEss
healthcare X
Count only peak inpatients and peak outpatients. For this credit, outpatients with clinical length of stay greater than 4 hours are included with inpatients.
WE PrErEquisitE and crEdit indoor WatEr usE
new construction, core and shell, data centers, Warehouses and distribution centers, hospitality, retail, healthcare
X X
Retail customers are considered separately and not included in average daily visitors.
schools X XSee credit-specific occupancy guidance.
Ge
TT
inG
sTa
rT
ed
Ma
int
ain
inG
co
ns
ist
En
cy
in
th
E a
PP
Lic
at
ion
20
Ge
TT
inG
sTa
rT
ed
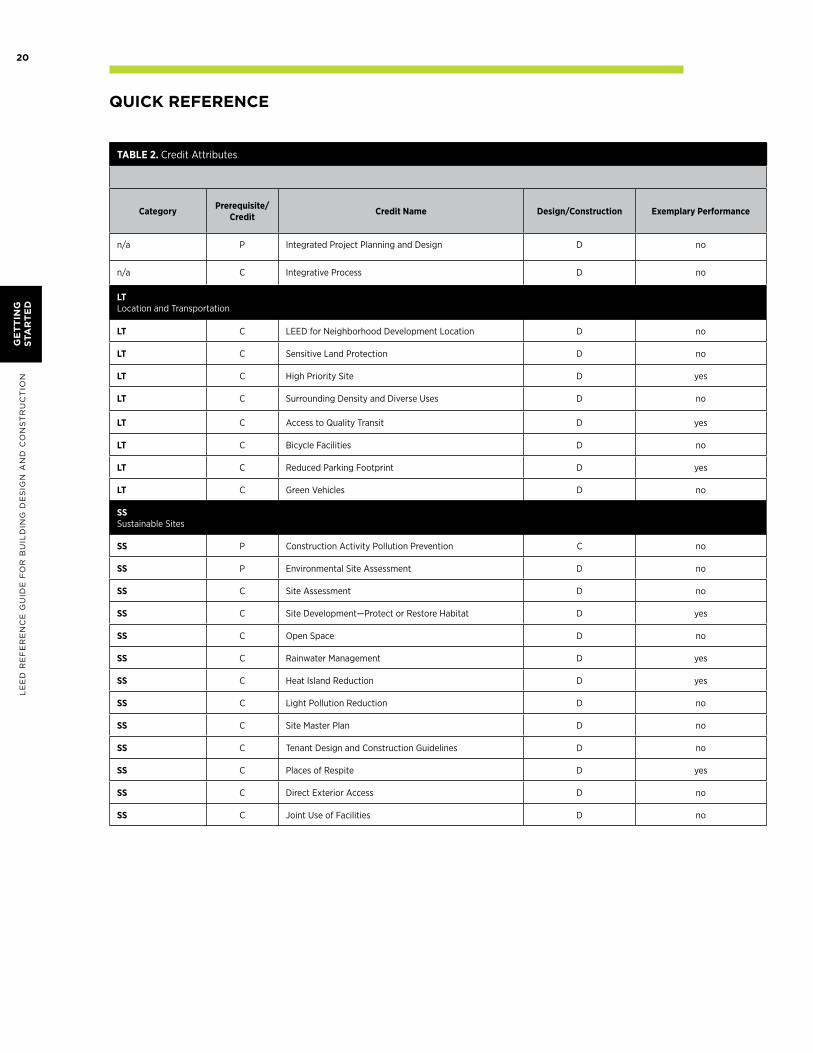
tablE 2. Credit Attributes
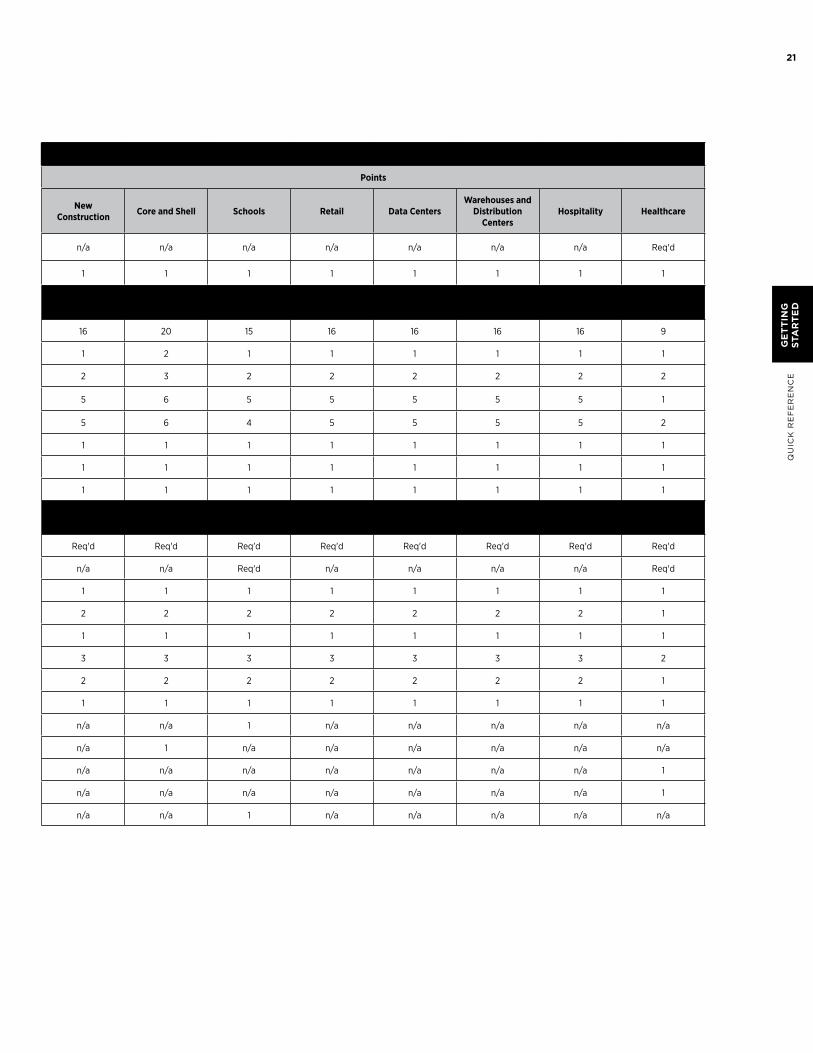
Points
category Prerequisite/credit credit name design/construction Exemplary Performance new
construction core and shell schools retail data centersWarehouses and
distribution centers
hospitality healthcare
n/a P Integrated Project Planning and Design D no n/a n/a n/a n/a n/a n/a n/a Req'd
n/a C Integrative Process D no 1 1 1 1 1 1 1 1
ltLocation and Transportation
lt C LEED for Neighborhood Development Location D no 16 20 15 16 16 16 16 9
lt C Sensitive Land Protection D no 1 2 1 1 1 1 1 1
lt C High Priority Site D yes 2 3 2 2 2 2 2 2
lt C Surrounding Density and Diverse Uses D no 5 6 5 5 5 5 5 1
lt C Access to Quality Transit D yes 5 6 4 5 5 5 5 2
lt C Bicycle Facilities D no 1 1 1 1 1 1 1 1
lt C Reduced Parking Footprint D yes 1 1 1 1 1 1 1 1
lt C Green Vehicles D no 1 1 1 1 1 1 1 1
ssSustainable Sites
ss P Construction Activity Pollution Prevention C no Req'd Req'd Req'd Req'd Req'd Req'd Req'd Req'd
ss P Environmental Site Assessment D no n/a n/a Req'd n/a n/a n/a n/a Req'd
ss C Site Assessment D no 1 1 1 1 1 1 1 1
ss C Site Development—Protect or Restore Habitat D yes 2 2 2 2 2 2 2 1
ss C Open Space D no 1 1 1 1 1 1 1 1
ss C Rainwater Management D yes 3 3 3 3 3 3 3 2
ss C Heat Island Reduction D yes 2 2 2 2 2 2 2 1
ss C Light Pollution Reduction D no 1 1 1 1 1 1 1 1
ss C Site Master Plan D no n/a n/a 1 n/a n/a n/a n/a n/a
ss C Tenant Design and Construction Guidelines D no n/a 1 n/a n/a n/a n/a n/a n/a
ss C Places of Respite D yes n/a n/a n/a n/a n/a n/a n/a 1
ss C Direct Exterior Access D no n/a n/a n/a n/a n/a n/a n/a 1
ss C Joint Use of Facilities D no n/a n/a 1 n/a n/a n/a n/a n/a
quiCk referenCe
LE
ED
RE
fE
RE
nc
E G
uiD
E f
oR
Bu
iLD
inG
DE
siG
n a
nD
co
ns
tR
uc
tio
n
21
Ge
TT
inG
sTa
rT
ed
tablE 2. Credit Attributes
Points
category Prerequisite/credit credit name design/construction Exemplary Performance new
construction core and shell schools retail data centersWarehouses and
distribution centers
hospitality healthcare
n/a P Integrated Project Planning and Design D no n/a n/a n/a n/a n/a n/a n/a Req'd
n/a C Integrative Process D no 1 1 1 1 1 1 1 1
ltLocation and Transportation
lt C LEED for Neighborhood Development Location D no 16 20 15 16 16 16 16 9
lt C Sensitive Land Protection D no 1 2 1 1 1 1 1 1
lt C High Priority Site D yes 2 3 2 2 2 2 2 2
lt C Surrounding Density and Diverse Uses D no 5 6 5 5 5 5 5 1
lt C Access to Quality Transit D yes 5 6 4 5 5 5 5 2
lt C Bicycle Facilities D no 1 1 1 1 1 1 1 1
lt C Reduced Parking Footprint D yes 1 1 1 1 1 1 1 1
lt C Green Vehicles D no 1 1 1 1 1 1 1 1
ssSustainable Sites
ss P Construction Activity Pollution Prevention C no Req'd Req'd Req'd Req'd Req'd Req'd Req'd Req'd
ss P Environmental Site Assessment D no n/a n/a Req'd n/a n/a n/a n/a Req'd
ss C Site Assessment D no 1 1 1 1 1 1 1 1
ss C Site Development—Protect or Restore Habitat D yes 2 2 2 2 2 2 2 1
ss C Open Space D no 1 1 1 1 1 1 1 1
ss C Rainwater Management D yes 3 3 3 3 3 3 3 2
ss C Heat Island Reduction D yes 2 2 2 2 2 2 2 1
ss C Light Pollution Reduction D no 1 1 1 1 1 1 1 1
ss C Site Master Plan D no n/a n/a 1 n/a n/a n/a n/a n/a
ss C Tenant Design and Construction Guidelines D no n/a 1 n/a n/a n/a n/a n/a n/a
ss C Places of Respite D yes n/a n/a n/a n/a n/a n/a n/a 1
ss C Direct Exterior Access D no n/a n/a n/a n/a n/a n/a n/a 1
ss C Joint Use of Facilities D no n/a n/a 1 n/a n/a n/a n/a n/a
Qu
ick
RE
fE
RE
nc
E
22
Ge
TT
inG
sTa
rT
ed
LE
ED
RE
fE
RE
nc
E G
uiD
E f
oR
Bu
iLD
inG
DE
siG
n a
nD
co
ns
tR
uc
tio
n
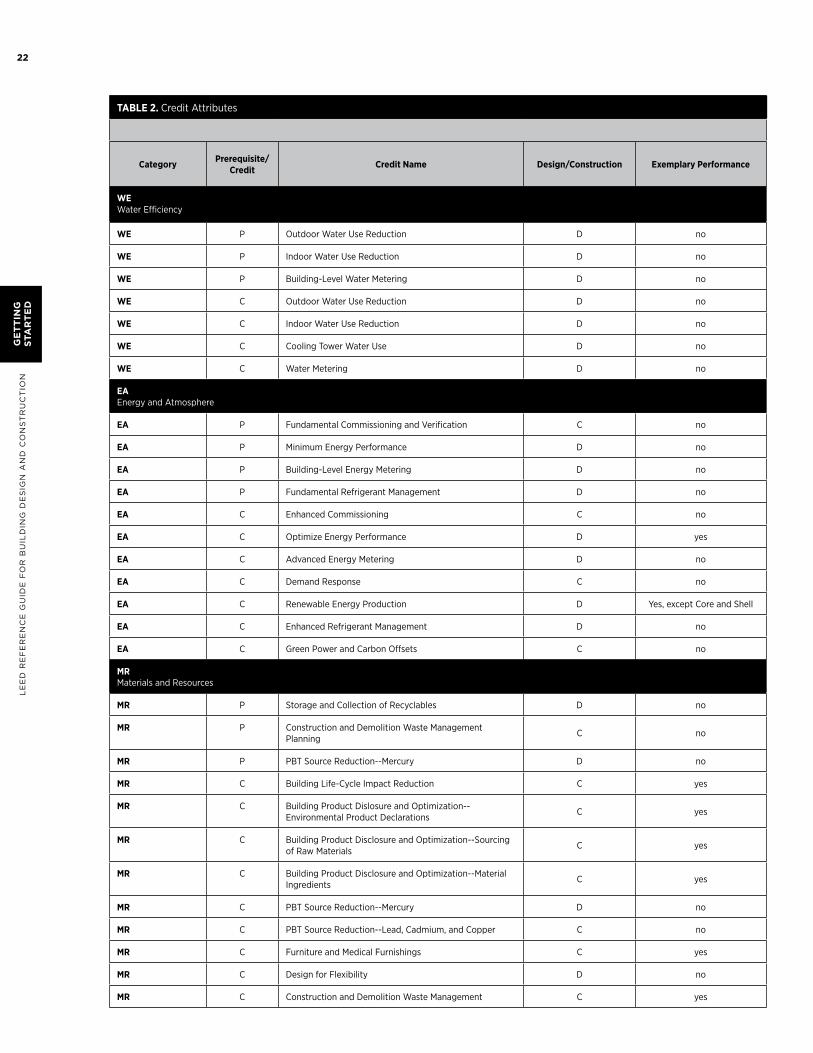
tablE 2. Credit Attributes
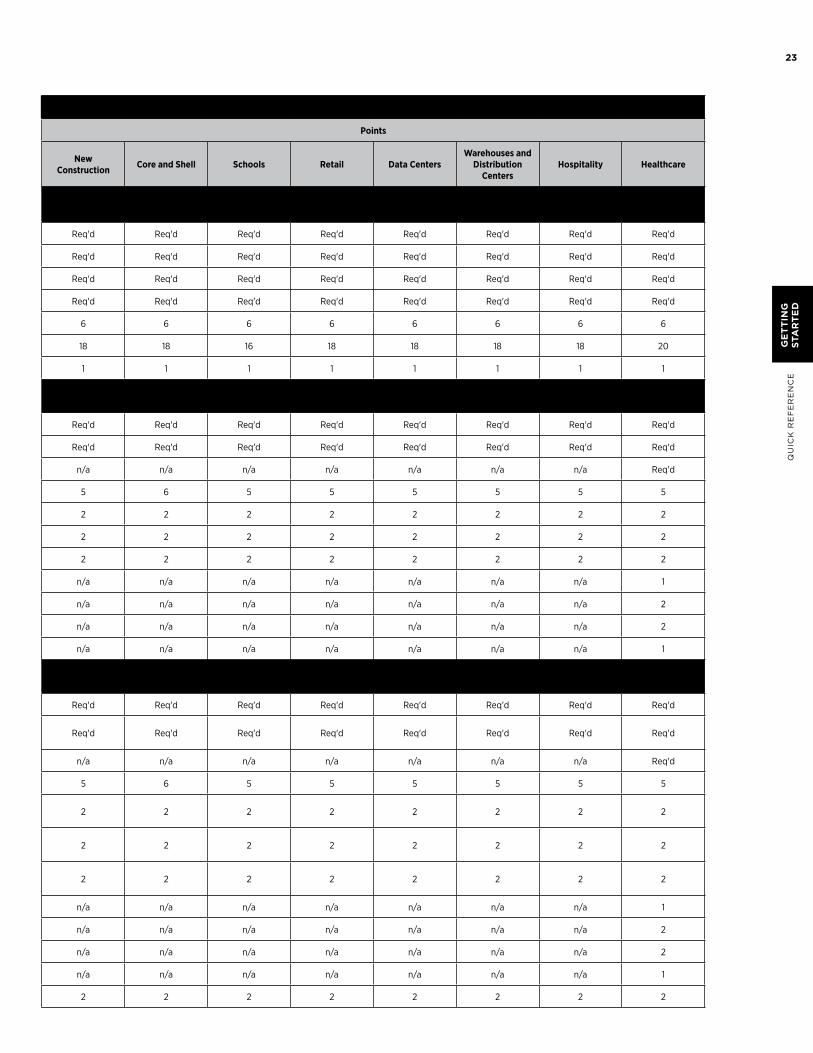
Points
category Prerequisite/credit credit name design/construction Exemplary Performance new
construction core and shell schools retail data centersWarehouses and
distribution centers
hospitality healthcare
WEWater Efficiency
WE P Outdoor Water Use Reduction D no Req'd Req'd Req'd Req'd Req'd Req'd Req'd Req'd
WE P Indoor Water Use Reduction D no Req'd Req'd Req'd Req'd Req'd Req'd Req'd Req'd
WE P Building-Level Water Metering D no Req'd Req'd Req'd Req'd Req'd Req'd Req'd Req'd
WE C Outdoor Water Use Reduction D no Req'd Req'd Req'd Req'd Req'd Req'd Req'd Req'd
WE C Indoor Water Use Reduction D no 6 6 6 6 6 6 6 6
WE C Cooling Tower Water Use D no 18 18 16 18 18 18 18 20
WE C Water Metering D no 1 1 1 1 1 1 1 1
EaEnergy and Atmosphere
3 3 3 3 3 3 3 3
Ea P Fundamental Commissioning and Verification C no Req'd Req'd Req'd Req'd Req'd Req'd Req'd Req'd
Ea P Minimum Energy Performance D no Req'd Req'd Req'd Req'd Req'd Req'd Req'd Req'd
Ea P Building-Level Energy Metering D no n/a n/a n/a n/a n/a n/a n/a Req'd
Ea P Fundamental Refrigerant Management D no 5 6 5 5 5 5 5 5
Ea C Enhanced Commissioning C no 2 2 2 2 2 2 2 2
Ea C Optimize Energy Performance D yes 2 2 2 2 2 2 2 2
Ea C Advanced Energy Metering D no 2 2 2 2 2 2 2 2
Ea C Demand Response C no n/a n/a n/a n/a n/a n/a n/a 1
Ea C Renewable Energy Production D Yes, except Core and Shell n/a n/a n/a n/a n/a n/a n/a 2
Ea C Enhanced Refrigerant Management D no n/a n/a n/a n/a n/a n/a n/a 2
Ea C Green Power and Carbon Offsets C no n/a n/a n/a n/a n/a n/a n/a 1
MrMaterials and Resources
3 3 3 3 3 3 3 3
Mr P Storage and Collection of Recyclables D no Req'd Req'd Req'd Req'd Req'd Req'd Req'd Req'd
Mr P Construction and Demolition Waste Management Planning
C no Req'd Req'd Req'd Req'd Req'd Req'd Req'd Req'd
Mr P PBT Source Reduction--Mercury D no n/a n/a n/a n/a n/a n/a n/a Req'd
Mr C Building Life-Cycle Impact Reduction C yes 5 6 5 5 5 5 5 5
Mr C Building Product Dislosure and Optimization--Environmental Product Declarations
C yes 2 2 2 2 2 2 2 2
Mr C Building Product Disclosure and Optimization--Sourcing of Raw Materials
C yes 2 2 2 2 2 2 2 2
Mr C Building Product Disclosure and Optimization--Material Ingredients
C yes 2 2 2 2 2 2 2 2
Mr C PBT Source Reduction--Mercury D no n/a n/a n/a n/a n/a n/a n/a 1
Mr C PBT Source Reduction--Lead, Cadmium, and Copper C no n/a n/a n/a n/a n/a n/a n/a 2
Mr C Furniture and Medical Furnishings C yes n/a n/a n/a n/a n/a n/a n/a 2
Mr C Design for Flexibility D no n/a n/a n/a n/a n/a n/a n/a 1
Mr C Construction and Demolition Waste Management C yes 2 2 2 2 2 2 2 2
23
Ge
TT
inG
sTa
rT
ed
tablE 2. Credit Attributes
Points
category Prerequisite/credit credit name design/construction Exemplary Performance new
construction core and shell schools retail data centersWarehouses and
distribution centers
hospitality healthcare
WEWater Efficiency
WE P Outdoor Water Use Reduction D no Req'd Req'd Req'd Req'd Req'd Req'd Req'd Req'd
WE P Indoor Water Use Reduction D no Req'd Req'd Req'd Req'd Req'd Req'd Req'd Req'd
WE P Building-Level Water Metering D no Req'd Req'd Req'd Req'd Req'd Req'd Req'd Req'd
WE C Outdoor Water Use Reduction D no Req'd Req'd Req'd Req'd Req'd Req'd Req'd Req'd
WE C Indoor Water Use Reduction D no 6 6 6 6 6 6 6 6
WE C Cooling Tower Water Use D no 18 18 16 18 18 18 18 20
WE C Water Metering D no 1 1 1 1 1 1 1 1
EaEnergy and Atmosphere
3 3 3 3 3 3 3 3
Ea P Fundamental Commissioning and Verification C no Req'd Req'd Req'd Req'd Req'd Req'd Req'd Req'd
Ea P Minimum Energy Performance D no Req'd Req'd Req'd Req'd Req'd Req'd Req'd Req'd
Ea P Building-Level Energy Metering D no n/a n/a n/a n/a n/a n/a n/a Req'd
Ea P Fundamental Refrigerant Management D no 5 6 5 5 5 5 5 5
Ea C Enhanced Commissioning C no 2 2 2 2 2 2 2 2
Ea C Optimize Energy Performance D yes 2 2 2 2 2 2 2 2
Ea C Advanced Energy Metering D no 2 2 2 2 2 2 2 2
Ea C Demand Response C no n/a n/a n/a n/a n/a n/a n/a 1
Ea C Renewable Energy Production D Yes, except Core and Shell n/a n/a n/a n/a n/a n/a n/a 2
Ea C Enhanced Refrigerant Management D no n/a n/a n/a n/a n/a n/a n/a 2
Ea C Green Power and Carbon Offsets C no n/a n/a n/a n/a n/a n/a n/a 1
MrMaterials and Resources
3 3 3 3 3 3 3 3
Mr P Storage and Collection of Recyclables D no Req'd Req'd Req'd Req'd Req'd Req'd Req'd Req'd
Mr P Construction and Demolition Waste Management Planning
C no Req'd Req'd Req'd Req'd Req'd Req'd Req'd Req'd
Mr P PBT Source Reduction--Mercury D no n/a n/a n/a n/a n/a n/a n/a Req'd
Mr C Building Life-Cycle Impact Reduction C yes 5 6 5 5 5 5 5 5
Mr C Building Product Dislosure and Optimization--Environmental Product Declarations
C yes 2 2 2 2 2 2 2 2
Mr C Building Product Disclosure and Optimization--Sourcing of Raw Materials
C yes 2 2 2 2 2 2 2 2
Mr C Building Product Disclosure and Optimization--Material Ingredients
C yes 2 2 2 2 2 2 2 2
Mr C PBT Source Reduction--Mercury D no n/a n/a n/a n/a n/a n/a n/a 1
Mr C PBT Source Reduction--Lead, Cadmium, and Copper C no n/a n/a n/a n/a n/a n/a n/a 2
Mr C Furniture and Medical Furnishings C yes n/a n/a n/a n/a n/a n/a n/a 2
Mr C Design for Flexibility D no n/a n/a n/a n/a n/a n/a n/a 1
Mr C Construction and Demolition Waste Management C yes 2 2 2 2 2 2 2 2
Qu
ick
RE
fE
RE
nc
E
24
LE
ED
RE
fE
RE
nc
E G
uiD
E f
oR
Bu
iLD
inG
DE
siG
n a
nD
co
ns
tR
uc
tio
n
tablE 2. Credit Attributes
Points
category Prerequisite/credit credit name design/construction Exemplary Performance new
construction core and shell schools retail data centersWarehouses and
distribution centers
hospitality healthcare
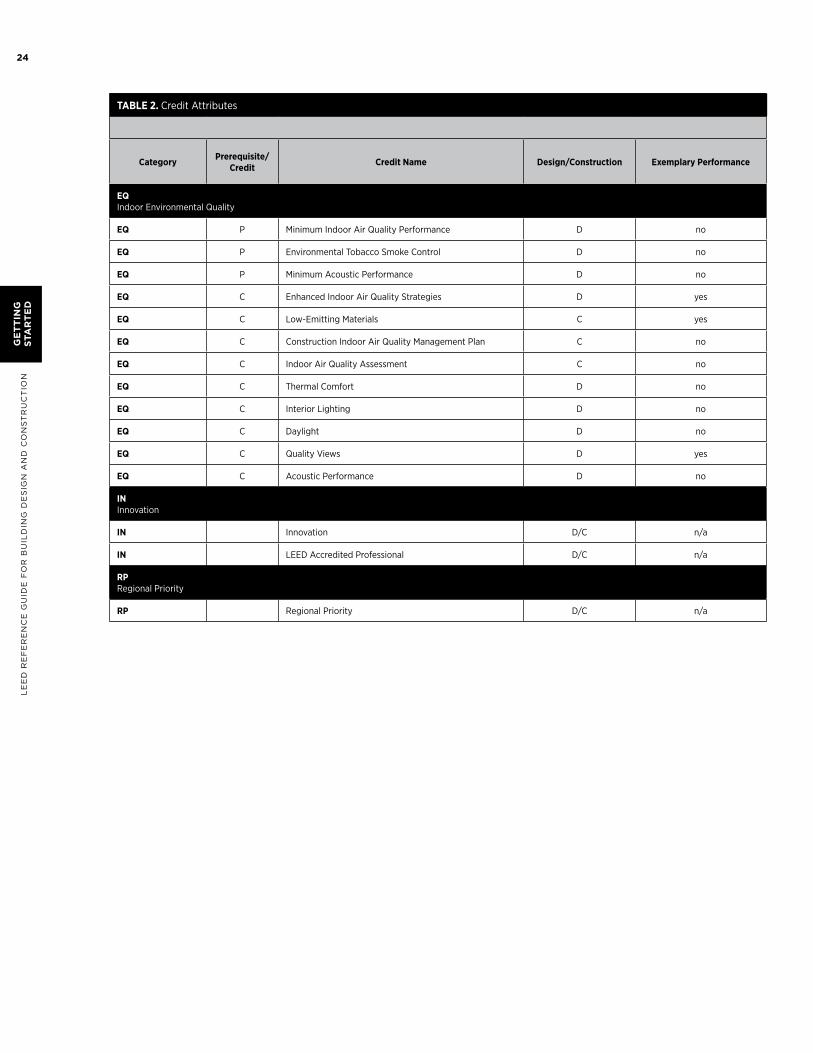
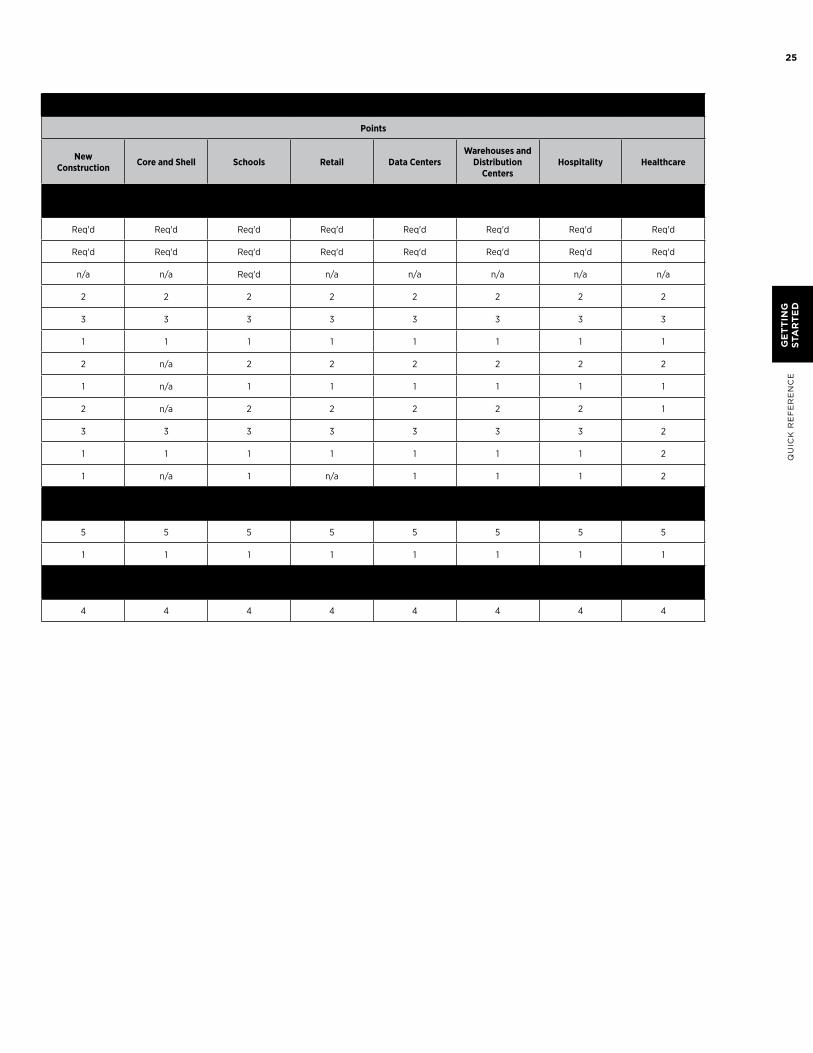
EqIndoor Environmental Quality
3 3 3 3 3 3 3 3
Eq P Minimum Indoor Air Quality Performance D no Req'd Req'd Req'd Req'd Req'd Req'd Req'd Req'd
Eq P Environmental Tobacco Smoke Control D no Req'd Req'd Req'd Req'd Req'd Req'd Req'd Req'd
Eq P Minimum Acoustic Performance D no n/a n/a Req'd n/a n/a n/a n/a n/a
Eq C Enhanced Indoor Air Quality Strategies D yes 2 2 2 2 2 2 2 2
Eq C Low-Emitting Materials C yes 3 3 3 3 3 3 3 3
Eq C Construction Indoor Air Quality Management Plan C no 1 1 1 1 1 1 1 1
Eq C Indoor Air Quality Assessment C no 2 n/a 2 2 2 2 2 2
Eq C Thermal Comfort D no 1 n/a 1 1 1 1 1 1
Eq C Interior Lighting D no 2 n/a 2 2 2 2 2 1
Eq C Daylight D no 3 3 3 3 3 3 3 2
Eq C Quality Views D yes 1 1 1 1 1 1 1 2
Eq C Acoustic Performance D no 1 n/a 1 n/a 1 1 1 2
inInnovation
3 3 3 3 3 3 3 3
in Innovation D/C n/a 5 5 5 5 5 5 5 5
in LEED Accredited Professional D/C n/a 1 1 1 1 1 1 1 1
rPRegional Priority
3 3 3 3 3 3 3 3
rP Regional Priority D/C n/a 4 4 4 4 4 4 4 4
Ge
TT
inG
sTa
rT
ed
25
Qu
ick
RE
fE
RE
nc
E
tablE 2. Credit Attributes
Points
category Prerequisite/credit credit name design/construction Exemplary Performance new
construction core and shell schools retail data centersWarehouses and
distribution centers
hospitality healthcare
EqIndoor Environmental Quality
3 3 3 3 3 3 3 3
Eq P Minimum Indoor Air Quality Performance D no Req'd Req'd Req'd Req'd Req'd Req'd Req'd Req'd
Eq P Environmental Tobacco Smoke Control D no Req'd Req'd Req'd Req'd Req'd Req'd Req'd Req'd
Eq P Minimum Acoustic Performance D no n/a n/a Req'd n/a n/a n/a n/a n/a
Eq C Enhanced Indoor Air Quality Strategies D yes 2 2 2 2 2 2 2 2
Eq C Low-Emitting Materials C yes 3 3 3 3 3 3 3 3
Eq C Construction Indoor Air Quality Management Plan C no 1 1 1 1 1 1 1 1
Eq C Indoor Air Quality Assessment C no 2 n/a 2 2 2 2 2 2
Eq C Thermal Comfort D no 1 n/a 1 1 1 1 1 1
Eq C Interior Lighting D no 2 n/a 2 2 2 2 2 1
Eq C Daylight D no 3 3 3 3 3 3 3 2
Eq C Quality Views D yes 1 1 1 1 1 1 1 2
Eq C Acoustic Performance D no 1 n/a 1 n/a 1 1 1 2
inInnovation
3 3 3 3 3 3 3 3
in Innovation D/C n/a 5 5 5 5 5 5 5 5
in LEED Accredited Professional D/C n/a 1 1 1 1 1 1 1 1
rPRegional Priority
3 3 3 3 3 3 3 3
rP Regional Priority D/C n/a 4 4 4 4 4 4 4 4
Ge
TT
inG
sTa
rT
ed

27
min
imu
m p
ro
gr
am
re
qu
ire
mn
ts
MP
r
Minimum Program RequirementsinTroduCTionThe Minimum Program Requirements (MPRs) are the minimum characteristics or conditions that make a project appropriate to pursue LEED certification. These requirements are foundational to all LEED projects and define the types of buildings, spaces, and neighborhoods that the LEED rating system is designed to evaluate.
28
LE
ED
RE
fE
RE
nc
E G
uiD
E f
oR
Bu
iLD
inG
DE
siG
n a
nD
co
ns
tR
uc
tio
nM
Pr
1. MusT be in a PerManenT loCaTion on exisTinG land
inTenT
The LEED rating system is designed to evaluate buildings, spaces, and neighborhoods in the context of their surroundings. A significant portion of LEED requirements are dependent on the project’s location, therefore it is important that LEED projects are evaluated as permanent structures. Locating projects on existing land is important to avoid artificial land masses that have the potential to displace and disrupt ecosystems.
requireMenTs
All LEED projects must be constructed and operated on a permanent location on existing land. No project that is designed to move at any point in its lifetime may pursue LEED certification. This requirement applies to all land within the LEED project.
addiTional GuidanCe
Permanent location
· Movable buildings are not eligible for LEED. This includes boats and mobile homes.
· Prefabricated or modular structures and building elements may be certified once permanently installed as part of the LEED project.
Existing land
· Buildings located on previously constructed docks, piers, jetties, infill, and other manufactured structures in or above water are permissible, provided that the artificial land is previously developed, such that the land once supported another building or hardscape constructed for a purpose other than the LEED project.
2. MusT use reasonable leed boundaries
inTenT
The LEED rating system is designed to evaluate buildings, spaces, or neighborhoods, and all environmental impacts associated with those projects. Defining a reasonable LEED boundary ensures that project is accurately evaluated.
requireMenTs
The LEED project boundary must include all contiguous land that is associated with the project and supports its typical operations. This includes land altered as a result of construction and features used primarily by the project’s occupants, such as hardscape (parking and sidewalks), septic or stormwater treatment equipment, and landscaping. The LEED boundary may not unreasonably exclude portions of the building, space, or site to give the project an advantage in complying with credit requirements. The LEED project must accurately communicate the scope of the certifying project in all promotional and descriptive materials and distinguish it from any non-certifying space.
addiTional GuidanCe
Site
· Non-contiguous parcels of land may be included within the LEED project boundary if the parcels directly support or are associated with normal building operations of the LEED project and are accessible to the LEED project’s occupants.
· Facilities (such as parking lots, bicycle storage, shower/changing facilities, and/or on-site renewable energy) that are outside of the LEED project boundary may be included in certain prerequisites and credits if they directly serve the LEED project and are not double-counted for other LEED projects. The project team must also have permission to use these facilities.
29
Min
iMu
M P
Ro
GR
aM
RE
Qu
iRE
Mn
ts
MP
r
· The LEED project boundary may include other buildings.
° If another building or structure within the LEED project boundary is ineligible for LEED certification, it may be included in the certification of the LEED project. It may also be excluded.
° If another building within the LEED project boundary is eligible for LEED certification, it may be included in the certification if USGBC’s multiple building guidance is followed. It may also be excluded.
· Projects that are phased sites with a master plan for multiple buildings must designate a LEED project boundary for each building or follow USGBC’s master site guidance.
· The gross floor area of the LEED project should be no less than 2% of the gross land area within the LEED project boundary.
Building
· The LEED project should include the complete scope of work of the building or interior space.
· The LEED project can be delineated by ownership, management, lease, or party wall separation.
· Buildings or structures primarily dedicated to parking are not eligible for LEED certification. Parking that serves an eligible LEED project should be included in the certification.
· If the project consists of multiple structures physically connected only by circulation, parking or mechanical/storage rooms, it may be considered a single building for LEED purposes if the structures have programmatic dependency (spaces, not personnel, within the building cannot function independently without the other building) or architectural cohesiveness (the building was designed to appear as one building).
· An addition to an existing building may certify independently, excluding the existing building in its entirety. Alternatively, the addition and the entire existing building may certify as one project.
Interiors
· If a single entity owns, manages, or occupies an entire building and wishes to certify a renovated portion of the building that is not separated by ownership, management, lease, or party wall separation, they may do so if the project boundary includes 100% of the construction scope and is drawn at a clear, physical barrier.
Neighborhood
· The LEED neighborhood includes the land, water, and construction within the LEED project boundary.
· The LEED boundary is usually defined by the platted property line of the project, including all land and water within it.
° Projects located on publicly owned campuses that do not have internal property lines must delineate a sphere-of-influence line to be used instead.
° Projects may have enclaves of non-project properties that are not subject to the rating system, but cannot exceed 2% of the total project area and cannot be described as certified.
° Projects must not contain non-contiguous parcels, but parcels can be separated by public rights-of-way.
· The project developer, which can include several property owners, should control a majority of the buildable land within the boundary, but does not have to control the entire area.
3. MusT CoMPly WiTh ProjeCT siZe requireMenTs
inTenT
The LEED rating system is designed to evaluate buildings, spaces, or neighborhoods of a certain size. The LEED requirements do not accurately assess the performance of projects outside of these size requirements.
requireMenTs
All LEED projects must meet the size requirements listed below.
LEED BD+C and LEED O+M Rating SystemsThe LEED project must include a minimum of 1,000 square feet (93 square meters) of gross floor area.

30
LEED ID+C Rating SystemsThe LEED project must include a minimum of 250 square feet (22 square meters) of gross floor area.
LEED for Neighborhood Development Rating SystemsThe LEED project should contain at least two habitable buildings and be no larger than 1500 acres.
LEED for Homes Rating SystemsThe LEED project must be defined as a “dwelling unit” by all applicable codes. This requirement includes, but is not limited to, the International Residential Code stipulation that a dwelling unit must include “permanent provisions for living, sleeping, eating, cooking, and sanitation.”
LE
ED
RE
fE
RE
nc
E G
uiD
E f
oR
Bu
iLD
inG
DE
siG
n a
nD
co
ns
tR
uc
tio
nM
Pr

31
min
imu
m p
ro
gr
am
re
qu
ire
mn
ts
MP
r

33
RA
TIN
G S
YS
TE
M S
EL
EC
TIO
N G
UID
AN
CE
Rating System Selection GuidanceinTroduCTionThis document provides guidance to help project teams select a LEED rating system. Projects are required to use the rating system that is most appropriate. However, when the decision is not clear, it is the responsibility of the project team to make a reasonable decision in selecting a rating system before registering their project. The project teams should first identify an appropriate rating system, and then determine the best adaptation. Occasionally, USGBC recognizes that an entirely inappropriate rating system has been chosen. In this case, the project team will be asked to change the designated rating system for their registered project. Please review this guidance carefully and contact USGBC if it is not clear which rating system to use.
sysT
eM
se
leC
Tio
n
34
LE
ED
RE
fE
RE
nc
E G
uiD
E f
oR
Bu
iLD
inG
DE
siG
n a
nD
co
ns
tR
uc
tio
n
raTinG sysTeM desCriPTions
leed for buildinG desiGn and ConsTruCTion
Buildings that are new construction or major renovation. In addition, at least 60% of the project’s grossfloorarea must be complete by the time of certification (except for LEED BD+C: Core and Shell).
· LEED BD+C: New Construction and Major Renovation. New construction or major renovation of buildings that do not primarily serve K-12 educational, retail, data centers, warehouses and distribution centers, hospitality, or healthcare uses. New construction also includes high-rise residential buildings 9 stories or more.
· LEED BD+C: Core and Shell Development. Buildings that are new construction or major renovation for the exterior shell and core mechanical, electrical, and plumbing units, but not a complete interior fit-out. LEED BD+C: Core and Shell is the appropriate rating system to use if more than 40% of the gross floor area is incomplete at the time of certification.
· LEED BD+C: Schools. Buildings made up of core and ancillary learning spaces on K-12 school grounds. LEED BD+C: Schools may optionally be used for higher education and non-academic buildings on school campuses.
· LEED BD+C: Retail. Buildings used to conduct the retail sale of consumer product goods. Includes both direct customer service areas (showroom) and preparation or storage areas that support customer service.
· LEED BD+C: Data Centers. Buildings specifically designed and equipped to meet the needs of high density computing equipment such as server racks, used for data storage and processing. LEED BD+C: Data Centers only addresses whole building data centers (greater than 60%).
· LEED BD+C: Warehouses and Distribution Centers. Buildings used to store goods, manufactured products, merchandise, raw materials, or personal belongings, such as self-storage.
· LEED BD+C: Hospitality. Buildings dedicated to hotels, motels, inns, or other businesses within the service industry that provide transitional or short-term lodging with or without food.
· LEED BD+C: Healthcare. Hospitals that operate twenty-four hours a day, seven days a week and provide inpatient medical treatment, including acute and long-term care.
· LEED BD+C: Homes and Multifamily Lowrise. Single-family homes and multi-family residential buildings of 1 to 3 stories. Projects 3 to 5 stories may choose the Homes rating system that corresponds to the ENERGY STAR program in which they are participating.
· LEED BD+C: Multifamily Midrise. Multi-family residential buildings of 4 to 8 occupiable stories above grade. The building must have 50% or more residential space. Buildings near 8 stories can inquire with USGBC about using Midrise or New Construction, if appropriate.
leed for inTerior desiGn and ConsTruCTion.
Interior spaces that are a complete interior fit-out. In addition, at least 60% of the project’s gross floor area must be complete by the time of certification.
· LEED ID+C: Commercial Interiors. Interior spaces dedicated to functions other than retail or hospitality.
· LEED ID+C: Retail. Interior spaces used to conduct the retail sale of consumer product goods. Includes both direct customer service areas (showroom) and preparation or storage areas that support customer service.
· LEED ID+C: Hospitality. Interior spaces dedicated to hotels, motels, inns, or other businesses within the service industry that provide transitional or short-term lodging with or without food.
leed for buildinG oPeraTions and MainTenanCe.
Existing buildings that are undergoing improvement work or little to no construction.
· LEED O+M: Existing Buildings. Existing buildings that do not primarily serve K-12 educational, retail, data centers, warehouses and distribution centers, or hospitality uses.
· LEED O+M: Retail. Existing buildings used to conduct the retail sale of consumer product goods. Includes both direct customer service areas (showroom) and preparation or storage areas that support customer service.
· LEED O+M: Schools. Existing buildings made up of core and ancillary learning spaces on K-12 school grounds.
sysT
eM
se
leC
Tio
n
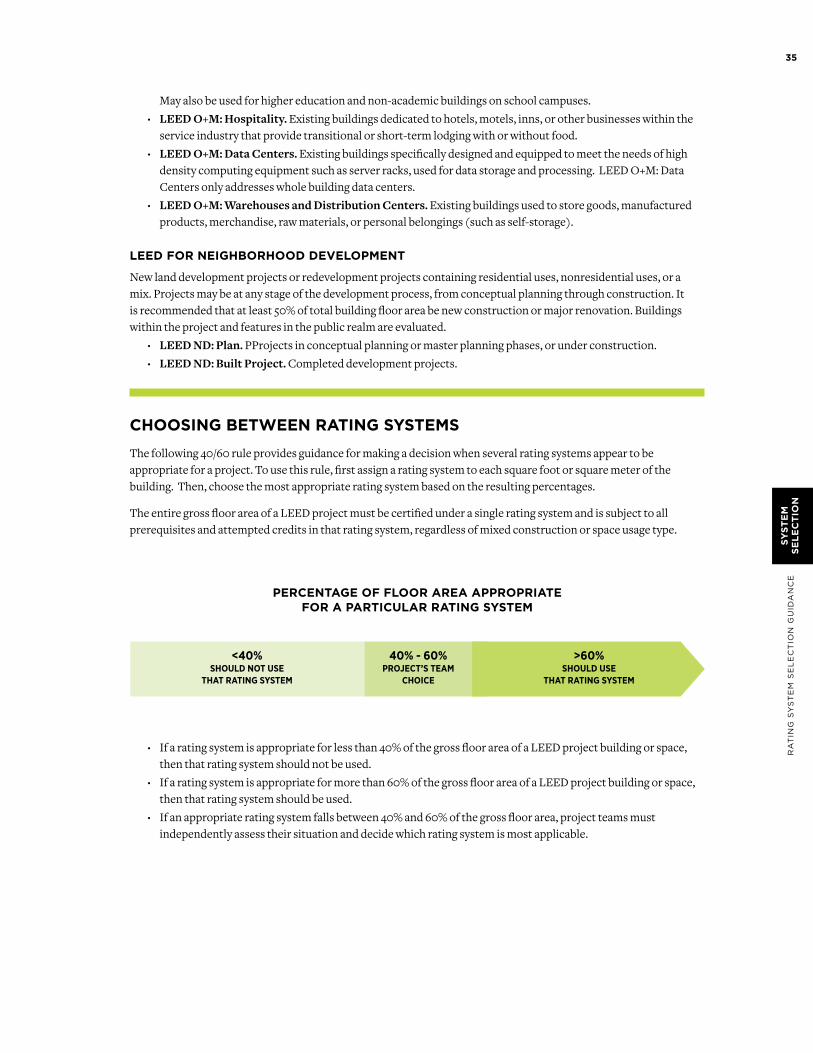
35
RA
TIN
G S
YS
TE
M S
EL
EC
TIO
N G
UID
AN
CE
May also be used for higher education and non-academic buildings on school campuses.
· LEED O+M: Hospitality. Existing buildings dedicated to hotels, motels, inns, or other businesses within the service industry that provide transitional or short-term lodging with or without food.
· LEED O+M: Data Centers. Existing buildings specifically designed and equipped to meet the needs of high density computing equipment such as server racks, used for data storage and processing. LEED O+M: Data Centers only addresses whole building data centers.
· LEED O+M: Warehouses and Distribution Centers. Existing buildings used to store goods, manufactured products, merchandise, raw materials, or personal belongings (such as self-storage).
leed for neiGhborhood develoPMenT
New land development projects or redevelopment projects containing residential uses, nonresidential uses, or a mix. Projects may be at any stage of the development process, from conceptual planning through construction. It is recommended that at least 50% of total building floor area be new construction or major renovation. Buildings within the project and features in the public realm are evaluated.
· LEED ND: Plan. PProjects in conceptual planning or master planning phases, or under construction.
· LEED ND: Built Project. Completed development projects.
ChoosinG beTWeen raTinG sysTeMs
The following 40/60 rule provides guidance for making a decision when several rating systems appear to be appropriate for a project. To use this rule, first assign a rating system to each square foot or square meter of the building. Then, choose the most appropriate rating system based on the resulting percentages.
The entire gross floor area of a LEED project must be certified under a single rating system and is subject to all prerequisites and attempted credits in that rating system, regardless of mixed construction or space usage type.
PerCenTaGe of floor area aPProPriaTe for a ParTiCular raTinG sysTeM
40% - 60%ProJEct’s tEaM
choicE
<40%should not usE
that rating systEM
>60%should usE
that rating systEM
· If a rating system is appropriate for less than 40% of the gross floor area of a LEED project building or space, then that rating system should not be used.
· If a rating system is appropriate for more than 60% of the gross floor area of a LEED project building or space, then that rating system should be used.
· If an appropriate rating system falls between 40% and 60% of the gross floor area, project teams must independently assess their situation and decide which rating system is most applicable.
sysT
eM
se
leC
Tio
n

55
lTL
oc
at
ion
an
D t
Ra
ns
Po
Rt
at
ion
Location and Transportation (lt)overvieWThe Location and Transportation (LT) category rewards thoughtful decisions about building location, with credits that encourage compact development, alternative transportation, and connection with amenities, such as restaurants and parks. The LT category is an outgrowth of the Sustainable Sites category, which formerly covered location-related topics. Whereas the SS category now specifically addresses on-site ecosystem services, the LT category considers the existing features of the surrounding community and how this infrastructure affects occupants’ behavior and environmental performance.
Well-located buildings take advantage of existing infrastructure—public transit, street networks, pedestrian paths, bicycle networks, services and amenities, and existing utilities, such as electricity, water, gas, and sewage. By recognizing existing patterns of development and land density, project teams can reduce strain on the environment from the material and ecological costs that accompany the creation of new infrastructure and hardscape. In addition, the compact communities promoted by the LT credits encourage robust and realistic alternatives to private automobile use, such as walking, biking, vehicle shares, and public transit. These incremental steps can have significant benefits: a 2009 Urban Land Institute study concluded that improvements in land-use patterns and investments in public transportation infrastructure alone could reduce greenhouse gas emissions from transportation in the U.S. by 9% to 15% by 20501; globally, the transportation sector is responsible for about one-quarter of energy-related greenhouse gas emissions.2
If integrated into the surrounding community, a building can offer distinct advantages to owners and building users. For owners, proximity to existing utility lines and street networks avoids the cost of bringing this infrastructure to the project site. For occupants, walkable and bikeable locations can enhance health by encouraging daily physical activity, and proximity to services and amenities can increase happiness and productivity. Locating in a vibrant, livable community makes the building a destination for residents, employees, customers, and visitors, and the building’s occupants will contribute to the area’s economic activity, creating a good model for future development. Reusing previously developed land, cleaning up brownfield sites, and investing in disadvantaged areas conserve undeveloped land and ensure efficient delivery of services and infrastructure.
1. U.S.EnvironmentalProtectionAgency,SmartGrowthandClimateChange,epa.gov/dced/climatechange.htm(accessedSeptember11,2012).2. InternationalCouncilonCleanTransportation,PassengerVehicles,(accessedMarch22,2013).
56
LE
ED
RE
fE
RE
nc
E G
uiD
E f
oR
Bu
iLD
inG
DE
siG
n A
nD
co
ns
tR
uc
tio
nLT
Design strategies that complement the building’s location are also rewarded in the LT section. For example, by limiting parking, a project can encourage building users to take alternative transportation. By providing bicycle storage, alternative-fuel facilities, and preferred parking for green vehicles, a project can support users seeking transportation options.
ConsisTenT doCuMenTaTion
WalkinG and biCyClinG disTanCe
Walking and bicycling distances are measurements of how far a pedestrian and bicyclist would travel from a point of origin to a destination, such as the nearest bus stop. This distance, also known as shortest path analysis, replaces the simple straight-line radius used in LEED 2009 and better reflects pedestrians’ and bicyclists’ access to amenities, taking into account safety, convenience, and obstructions to movement. This in turn better predicts the use of these amenities.
Walking distances must be measured along infrastructure that is safe and comfortable for pedestrian: sidewalks, all-weather-surface footpaths, crosswalks, or equivalent pedestrian facilities.
Bicycling distances must be measured along infrastructure that is safe and comfortable for bicyclists: on-street bicycle lanes, off-street bicycle paths or trails, and streets with low target vehicle speed. Project teams may use bicycling distance instead of walking distance to measure the proximity of bicycle storage to a bicycle network in LT Credit Bicycle Facilities.
When calculating the walking or bicycling distance, sum the continuous segments of the walking or bicycling route to determine the distance from origin to destination. A straight-line radius from the origin that does not follow pedestrian and bicyclist infrastructure will not be accepted.
Refer to specific credits to select the appropriate origin and destination points. In all cases, the origin must be accessible to all building users, and the walking or bicycling distance must not exceed the distance specified in the credit requirements.
ToTal vehiCle ParkinG CaPaCiTy
When determining total parking capacity, include all the off-street spaces available to the project building’s users. This may include spaces both inside and outside the project boundary.
If parking spaces are shared among two or more buildings (“pooled” parking), determine the share of this parking allocated to the project. Include this number of spaces in the total parking capacity and provide rationale for the parking distribution, if necessary.
If no off-street parking is allocated to the project building’s users, the team is eligible to pursue LT Credit Reduced Parking Footprint but is not eligible for LT Credit Green Vehicles.
The following parking spaces must be included in total parking capacity:
· New and existing surface parking spaces
· New and existing garage or multilevel parking spaces
· Any off-street parking spaces outside the project boundary that are available to the building’s users
The following parking spaces should not be included in total parking capacity:
· On-street (parallel or pull-in) parking spaces on public rights of way
· Parking spaces for fleet and inventory vehicles, unless these vehicles are regularly used by employees for commuting as well as business purposes
· Motorbike or bicycle spaces
57
LTL
oc
at
ion
an
D t
Ra
ns
Po
Rt
at
ion
Preferred ParkinG
Preferred parking spaces have the shortest walking distance to the main entrance of the project, exclusive of spaces designated for people with disabilities.
If parking is provided on multiple levels of a facility, locate preferred spaces on the level closest to the main entrance to the building.
If the parking area is subdivided for different kinds of building users (e.g., customers and employees, staff and students, ranking military officials), a project may distribute the required preferred parking spaces proportionally across each parking area. This also applies to the provision of fueling stations in LT Credit Green Vehicles.
Alternatively, a project that subdivides its parking area may provide one general preferred parking area with enough spaces for all user types (based on total parking capacity). In this case, parking areas outside the preferred parking zone would still be separated by user type. This also applies to the provision of fueling stations in LT Credit Green Vehicles.
The reservation of preferred parking spaces is required both for carpool and vanpool vehicles in LT Credit Reduced Parking Footprint and for green vehicles in LT Credit Green Vehicles. Projects pursuing both credits will need to reserve a higher proportion of preferred parking spaces.
Carpool and vanpool spaces and green vehicle spaces may be placed at the discretion of the project team (i.e., green vehicle spaces can be closer to the main entrance than carpool and vanpool spaces, or vice versa), provided the number of spaces reserved for each type meets credit requirements.
Although not encouraged, preferred parking areas and signage for carpool and vanpool vehicles and green vehicles may be combined if 10% of total parking capacity is reserved with this signage and both Reduced Parking Footprint and Green Vehicles credits are achieved.

137
SS
SU
ST
AIN
AB
LE
SIT
ES
Sustainable Sites (ss)overvieWThe Sustainable Sites (SS) category rewards decisions about the environment surrounding the building, with credits that emphasize the vital relationships among buildings, ecosystems, and ecosystem services. It focuses on restoring project site elements, integrating the site with local and regional ecosystems, and preserving the biodiversity that natural systems rely on.
Earth’s systems depend on biologically diverse forests, wetlands, coral reefs, and other ecosystems, which are often referred to as “natural capital” because they provide regenerative services. A United Nations study indicates that of the ecosystem services that have been assessed worldwide, about 60% are currently degraded or used unsustainably.1 The results are deforestation, soil erosion, a drop in water table levels, extinction of species, and rivers that no longer run to the sea. Recent trends like exurban development and sprawl encroach on the remaining natural landscapes and farmlands, fragmenting and replacing them with dispersed hardscapes surrounded by nonnative vegetation. Between 1982 and 2001 in the U.S. alone, about 34 million acres (13 759 hectares) of open space (an area the size of Illinois) was lost to development—approximately 4 acres per minute, or 6,000 acres a day.2 The rainwater runoff from these hardscape areas frequently overloads the capacity of natural infiltration systems, increasing both the quantity and pollution of site runoff. Rainwater runoff carries such pollutants as oil, sediment, chemicals, and lawn fertilizers directly to streams and rivers, where they contribute to eutrophication and harm aquatic ecosystems and species. A Washington State Department of Ecology study noted that rainwater runoff from roads, parking lots, and other hardscapes carries some 200,000 barrels of petroleum into the Puget Sound every year—more than half of what was spilled in the 1989 ExxonValdez accident in Alaska.3
Project teams that comply with the prerequisites and credits in the SS category protect sensitive ecosystems by completing an early site assessment and planning the locations of buildings and hardscape areas to avoid harming habitat, open space, and water bodies. They use low-impact development methods that minimize construction pollution, reduce heat island effects and light pollution, and mimic natural water flow patterns to manage rainwater runoff. They also remediate areas on the project site that are already in decline.
1. UNEnvironmentProgramme,StateandTrendsoftheEnvironment1987–2001,SectionB,Chapter5,unep.org/geo/geo4/report/05_Biodiversity.pdf.2. U.S.ForestService,QuickFacts,fs.fed.us/projects/four-threats/facts/open-space.shtml(accessedSeptember11,2012).3. Cornwall,W.,Stormwater’sDamagetoPugetSoundHuge,SeattleTimes(December1,2007),seattletimes.com/html/localnews/2004045940_ecology01m.html (accessedSeptember14,2012).

138
LE
ED
RE
FE
RE
NC
E G
UID
E F
OR
bU
ILD
ING
DE
sIG
N A
ND
CO
Ns
tR
UC
tIO
N
SS
In LEED v4, the SS category combines traditional approaches with several new strategies, including the backlight-uplight-glare (BUG) method (Light Pollution Reduction credit), working with conservation organizations to target financial support for off-site habitat protection (Site Development—Protect or Restore Habitat credit), replicating natural site hydrology (Rainwater Management credit), and using three-year aged SRI values for roofs and SR values for nonroof hardscape (Heat Island Reduction credit).
257
WE
WA
TE
R E
FF
ICIE
NC
YWater Efficiency (WE)overvieW
The Water Efficiency (WE) section addresses water holistically, looking at indoor use, outdoor use, specialized uses, and metering. The section is based on an “efficiency first” approach to water conservation. As a result, each prerequisite looks at water efficiency and reductions in potable water use alone. Then, the WE credits additionally recognize the use of nonpotable and alternative sources of water.
The conservation and creative reuse of water are important because only 3% of Earth’s water is fresh water, and of that, slightly over two-thirds is trapped in glaciers.1 Typically, most of a building’s water cycles through the building and then flows off-site as wastewater. In developed nations, potable water often comes from a public water supply system far from the building site, and wastewater leaving the site must be piped to a processing plant, after which it is discharged into a distant water body. This pass-through system reduces streamflow in rivers and depletes freshwater aquifers, causing water tables to drop and wells to go dry. In 60% of European cities with more than 100,000 people, groundwater is being used faster than it can be replenished.2
In addition, the energy required to treat water for drinking, transport it to and from a building, and treat it for disposal represents a significant amount of energy use not captured by a building’s utility meter. Research in California shows that roughly 19% of all energy used in this U.S. state is consumed by water treatment and pumping.3
In the U.S., buildings account for 13.6% of potable water use,4 the third-largest category, behind thermoelectric power and irrigation. Designers and builders can construct green buildings that use significantly less water than conventional construction by incorporating native landscapes that eliminate the need for irrigation, installing water-efficient fixtures, and reusing wastewater for nonpotable water needs. The Green Building Market Impact Report 2009 found that LEED projects were responsible for saving an aggregate 1.2 trillion gallons (4.54 trillion liters) of water.5 LEED’s WE credits encourage project teams to take advantage of every opportunity to significantly reduce total water use.
1. U.S.EnvironmentalProtectionAgency,WaterTriviaFacts,water.epa.gov/learn/kids/drinkingwater/water_trivia_facts.cfm(accessedSeptember12,2012).2. Statistics:Graphs&Maps,UNWater,http://www.unwater.org/statistics_use.html(accessedMarch8,2013).3. energy.ca.gov/2005publications/CEC-700-2005-011/CEC-700-2005-011-SF.PDF4. USGBC,GreenBuildingFacts,http://www.usgbc.org/articles/green-building-facts.5. GreenOutlook2011,GreenTrendsDrivingGrowth(McGraw-HillConstruction,2010),aiacc.org/wp-content/uploads/2011/06/greenoutlook2011.pdf (accessedonSeptember12,2012).
258
LE
ED
RE
fE
RE
nc
E G
uiD
E f
oR
Bu
iLD
inG
DE
siG
n A
nD
co
ns
tR
uc
tio
nW
E
Cross-CuTTinG issuesThe WE category comprises three major components: indoor water (used by fixtures, appliances, and processes, such as cooling), irrigation water, and water metering. Several kinds of documentation span these components, depending on the project’s specific water-saving strategies.
Site plans: Plans are used to document the location and size of vegetated areas and the locations of meters and submeters. Within the building, floorplans show the location of fixtures, appliances, and process water equipment (e.g., cooling towers, evaporative condensers), as well as indoor submeters. The same documentation can be used in credits in the Sustainable Sites category.
Fixture cutsheets: Projects must document their fixtures (and appliances as applicable) using fixture cutsheets or manufacturers’ literature. This documentation is used in the Indoor Water Use Reduction prerequisite and credit.
Alternative water sources: A project that includes graywater reuse, rainwater harvesting, municipally supplied wastewater (purple pipe water), or other reused sources is eligible to earn credit in WE Credit Outdoor Water Use Reduction, WE Credit Indoor Water Use Reduction, WE Credit Cooling Tower Water Use, and WE Credit Water Metering. But the team cannot apply the same water to multiple credits unless the water source has sufficient volume to cover the demand of all the uses (e.g., irrigation plus toilet-flushing demand).
Occupancy calculations: The Indoor Water Use Reduction prerequisite and credit require projections based on occupants’ usage. The Location and Transportation and Sustainable Sites categories also use project occupancy calculations. Review the occupancy section in GettingStarted to understand how occupants are classified and counted. Also see WE Prerequisite Indoor Water Use Reduction for additional guidance specific to the WE section.
319
EA
En
Er
gy
an
d a
tm
os
ph
Er
E
The Energy and Atmosphere (EA) category approaches energy from a holistic perspective, addressing energy use reduction, energy-efficient design strategies, and renewable energy sources.
The current worldwide mix of energy resources is weighted heavily toward oil, coal, and natural gas.1 In addition to emitting greenhouse gases, these resources are nonrenewable: their quantities are limited or they cannot be replaced as fast as they are consumed.2 Though estimates regarding the remaining quantity of these resources vary, it is clear that the current reliance on nonrenewable energy sources is not sustainable and involves increasingly destructive extraction processes, uncertain supplies, escalating market prices, and national security vulnerability. Accounting for approximately 40% of the total energy used today,3 buildings are significant contributors to these problems.
Energy efficiency in a green building starts with a focus on design that reduces overall energy needs, such as building orientation and glazing selection, and the choice of climate-appropriate building materials. Strategies such as passive heating and cooling, natural ventilation, and high-efficiency HVAC systems partnered with smart controls further reduce a building’s energy use. The generation of renewable energy on the project site or the purchase of green power allows portions of the remaining energy consumption to be met with non–fossil fuel energy, lowering the demand for traditional sources.
The commissioning process is critical to ensuring high-performing buildings. Early involvement of a commissioning authority helps prevent long-term maintenance issues and wasted energy by verifying that the design meets the owner’s project requirements and functions as intended. In an operationally effective and efficient building, the staff understands what systems are installed and how they function. Staff must have training and be receptive to learning new methods for optimizing system performance so that efficient design is carried through to efficient performance.
The EA category recognizes that the reduction of fossil fuel use extends far beyond the walls of the building. Projects can contribute to increasing the electricity grid’s efficiency by enrolling in a demand response program.
Energy and Atmosphere (ea)overvieW
1. iea.org/publications/freepublications/publication/kwes.pdf2. cnx.org/content/m16730/latest/3. unep.org/sbci/pdfs/SBCI-BCCSummary.pdf
320
LE
ED
RE
fE
RE
nc
E G
uiD
E f
oR
Bu
iLD
inG
DE
siG
n A
nD
co
ns
tR
uc
tio
nE
A
Demand response allows utilities to call on buildings to decrease their electricity use during peak times, reducing the strain on the grid and the need to operate more power plants, thus potentially avoiding the costs of constructing new plants. Similarly, on-site renewable energy not only moves the market away from dependence on fossil fuels but may also be a dependable local electricity source that avoids transmission losses and strain on the grid.
The American Physical Society has found that if current and emerging cost-effective energy efficiency measures are employed in new buildings and in existing buildings as their heating, cooling, lighting, and other equipment is replaced, the growth in energy demand from the building sector could fall from a projected 30% increase to zero between now and 2030.4 The EA section supports the goal of reduced energy demand through credits related to reducing usage, designing for efficiency, and supplementing the energy supply with renewables.
4. EnergyFuture:ThinkEfficiency(AmericanPhysicalSociety,September2008),aps.org/energyefficiencyreport/report/energy-bldgs.pdf(accessedSeptember13,2012).

467
MR
MA
TE
RIA
LS
An
d R
ES
OU
RC
ES
Materials and Resources (mr)overvieWThe Materials and Resources (MR) credit category focuses on minimizing the embodied energy and other impacts associated with the extraction, processing, transport, maintenance, and disposal of building materials. The requirements are designed to support a life-cycle approach that improves performance and promotes resource efficiency. Each requirement identifies a specific action that fits into the larger context of a life-cycle approach to embodied impact reduction.
The WasTe hierarChy
Construction and demolition waste constitutes about 40 percent of the total solid waste stream in the United States1 and about 25% of the total waste stream in the European Union.2 In its solid waste management hierarchy, the U.S. Environmental Protection Agency (EPA) ranks source reduction, reuse, recycling, and waste to energy as the four preferred strategies for reducing waste. The MR section directly addresses each of these recommended strategies.
Source reduction appears at the top of the hierarchy because it avoids environmental harms throughout a material’s life cycle, from supply chain and use to recycling and waste disposal. Source reduction encourages the use of innovative construction strategies, such as prefabrication and designing to dimensional construction materials, thereby minimizing material cutoffs and inefficiencies.
Building and material reuse is the next most effective strategy because reusing existing materials avoids the environmental burden of the manufacturing process. Replacing existing materials with new ones would entail production and transportation of new materials, and it would take many years to offset the associated greenhouse gases through increased efficiency of the building. LEED has consistently rewarded the reuse of materials. LEED v4 now offers more flexibility and rewards all material reuse achieved by a project—both in situ, as part of a building reuse strategy, and from off site, as part of a salvaging strategy.
Recycling is the most common way to divert waste from landfills. In conventional practice, most waste is landfilled—an increasingly unsustainable solution. In urban areas landfill space is reaching capacity, requiring
1. U.S.EnvironmentalProtectionAgency,epa.gov/osw/conserve/rrr/imr/cdm/pubs/cd-meas.pdf.2. EuropeanCommissionServiceContractonManagementofConstructionandDemolitionWaste,FinalReport,http://www.eu-smr.eu/cdw/docs/BIO_
Construction%20and%20Demolition%20Waste_Final%20report_09022011.pdf(accessedApril9,2013).
468
LE
ED
RE
fE
RE
nc
E G
uiD
E f
oR
bu
iLD
inG
DE
siG
n a
nD
co
ns
tR
uc
tio
nM
R
the conversion of more land elsewhere and raising the transportation costs of waste. Innovations in recycling technology improve sorting and processing to supply raw material to secondary markets, keeping those materials in the production stream longer.
Because secondary markets do not exist for every material, however, the next most beneficial use of waste materials is conversion to energy. Many countries are lessening the burden on landfills through a waste-to-energy solution. In countries such as Sweden and Saudi Arabia, waste-to-energy facilities are far more common than landfills. When strict air quality control measures are enforced, waste-to-energy can be a viable alternative to extracting fossil fuels to produce energy.
In aggregate, LEED projects are responsible for diverting more than 80 million tons (72.6 million tonnes) of waste from landfills, and this volume is expected to grow to 540 million tons (489.9 million tonnes) by 2030.3 From 2000 to 2011, LEED projects in Seattle diverted an average of 90 percent of their construction waste from the landfill, resulting in 175,000 tons (158,757.3 tonnes) of waste diverted.4 If all newly constructed buildings achieved the 90 percent diversion rate demonstrated by Seattle’s 102 LEED projects, the result would be staggering. Construction debris is no longer waste, it is a resource.
life-CyCle assessMenT in leed
Through credits in the MR category, LEED has instigated market transformation of building products by creating a cycle of consumer demand and industry delivery of environmentally preferable products. LEED project teams have created demand for increasingly sustainable products, and suppliers, designers, and manufacturers are responding. From responsibly harvested wood to increased recycled content to bio-based materials, the increased supply of sustainable materials has been measurable over the history of LEED. Several MR credits reward use of products that perform well on specific criteria. It is difficult, however, to compare two products that have different sustainable attributes—for example, cabinets made of wheat husks sourced from all over the country and bound together in resin versus solid wood cabinets made from local timber. Life-cycle assessment (LCA) provides a more comprehensive picture of materials and products, enabling project teams to make more informed decisions that will have greater overall benefit for the environmental, human health, and communities, while encouraging manufacturers to improve their products through innovation.
LCA is a “compilation and evaluation of the inputs and outputs and the potential environmental impacts of a product system throughout its life cycle.”5 The entire life cycle of a product (or building) is examined, the processes and constituents identified, and their environmental effects assessed—both upstream, from the point of manufacture or raw materials extraction, and downstream, including transportation, use, maintenance, and end of life. This approach is sometimes called “cradle to grave.” Going even further, “cradle to cradle” emphasizes recycling and reuse at the end of life rather than disposal.
Life-cycle approaches to materials assessment began in the 1960s with carbon accounting models. Since then, LCA standards and practices have been developed and refined. In Europe and a few other parts of the world, manufacturers, regulators, specifiers, and consumers in many fields have been using life-cycle information to improve their product selections and product environmental profiles. Until relatively recently, however, the data and tools that support LCA were lacking in the U.S. Now a growing number of manufacturers are ready to document and publicly disclose the environmental profiles of their products, and programs that assist this effort and help users understand the results are available.
LEED aims to accelerate the use of LCA tools and LCA-based decision making, thereby spurring market transformation and improving the quality of databases. Recognizing the limitations of the life-cycle approach for addressing human health and the ecosystem consequences of raw material extraction, LEED uses alternative, complementary approaches to LCA in the credits that address those topics.
Cross-CuTTinG issues
Required Products and MaterialsThe scope of the MR credit category includes the building or portions of the building that are being constructed or renovated. Portions of an existing building that are not part of the construction contract are excluded from MR
3. USGBC,GreenBuildingFacts,usgbc.org/ShowFile.aspx?DocumentID=18693(accessedSeptember13,2012).4. CityofSeattle,LEEDProjectsAnalysis,seattle.gov/dpd/greenbuilding/docs/dpdp022009.pdf(accessedMarch26,2013).5. ISO14040InternationalStandard,Environmentalmanagement,Lifecycleassessment,principlesandframework(Geneva,Switzerland:International
OrganizationforStandardization,2006).
469
MR
MA
TE
RIA
LS
An
d R
ES
OU
RC
ES
documentation unless otherwise noted. For guidance on the treatment of additions, see the minimum program requirements.
Qualifying Products and ExclusionsThe MR section addresses “permanently installed building products,” which as defined by LEED refers to products and materials that create the building or are attached to it. Examples include structure and enclosure elements, installed finishes, framing, interior walls, cabinets and casework, doors, and roofs. Most of these materials fall into Construction Specifications Institute (CSI) 2012 MasterFormat Divisions 3-10, 31, and 32. Some products addressed by MR credits fall outside these divisions.
Furniture is not required to be included in credit calculations. However, if furniture is included in MR credit calculations, all furniture must be included consistently in all cost-based credits.
In past versions of LEED, all mechanical, plumbing, and electrical equipment (MEP), categorized as CSI MasterFormat divisions 11, 21-28, and other specialty divisions, was excluded from MR credits. In this version of LEED some specific products that are part of these systems but are “passive” (meaning not part of the active portions of the system) may be included in credit calculations. This allows flexibility for the optional assessment of piping, pipe insulation, ducts, duct insulation, conduit, plumbing fixtures, faucets, showerheads, and lamp housings. If they are included in credit calculations, they must be included consistently across relevant MR credits. However, unlike furniture, if some of these products are included in credit calculations, not all products of that type must be included. For example, if the cost of ducts is included in the MR calculations for recycled content, the cost of ducts that do not meet the credit requirement does not need to be included in the numerator or denominator of the credit calculation. However, the denominator for cost-based credits (all Building Product Disclosure and Optimization credits) calculations must be the same.
Special equipment, such as elevators, escalators, process equipment, and fire suppression, systems, is excluded from the credit calculations. Also excluded are products purchased for temporary use on the project, like formwork for concrete.
For Healthcare projects, the scope of MR Credit Medical Furniture and Furnishings includes all freestanding furniture and medical furnishings. Freestanding furniture items included in this credit cannot be counted in any Building Product Disclosure and Optimization credits, to avoid double-counting. Permanently installed items such as casework and built-in millwork should be included in the Building Product Disclosure and Optimization credits, not MR Credit Medical Furniture and Furnishings.
Defining a ProductSeveral credits in this category calculate achievement on the basis of number of products instead of product cost. For these credits, a “product” or a “permanently installed building product” is defined by its function in the project. A product includes the physical components and services needed to serve the intended function. If there are similar products within a specification, each contributes as a separate product. Here are a few scenarios.
Products that arrive at the project site ready for installation:
· Metal studs, wallboard, and concrete masonry units are all separate products.
· For wallboard, the gypsum, binder, and backing are all required for the product to function, so each ingredient does not count as a separate product.
Products that arrive as an ingredient or component used in a site-assembled product:
· Concrete admixtures are considered separate products because each component (admixture, aggregate, and cement) serves a different function; each component is therefore a separate product.
Similar products from the same manufacturer with distinct formulations versus similar products from the same manufacturer with aesthetic variations or reconfigurations:
· Paints of different gloss levels are separate products because each paint type is specified to serve a different function, such as water resistance. Different colors of the same paint are not separate products because they serve the same function.
· Carpets of different pile heights are separate products because they are used for different kinds of foot traffic. The same carpet in a different color is not a separate product.
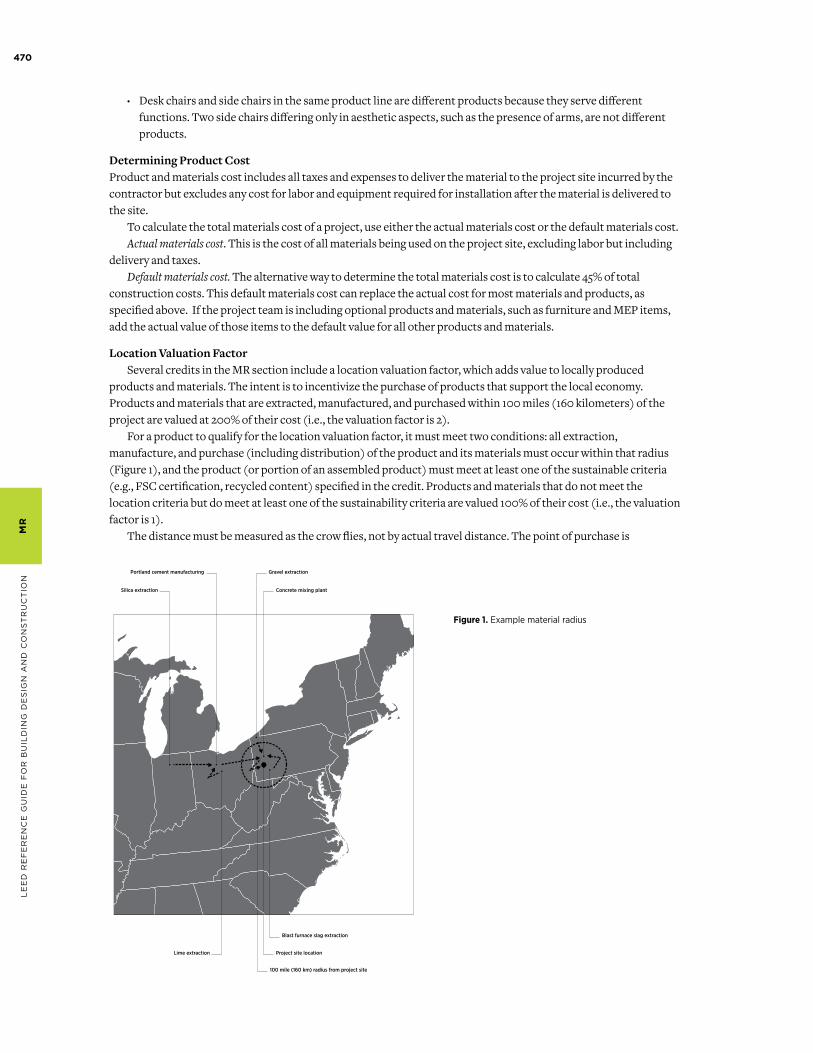
470
LE
ED
RE
fE
RE
nc
E G
uiD
E f
oR
bu
iLD
inG
DE
siG
n a
nD
co
ns
tR
uc
tio
nM
R
· Desk chairs and side chairs in the same product line are different products because they serve different functions. Two side chairs differing only in aesthetic aspects, such as the presence of arms, are not different products.
Determining Product CostProduct and materials cost includes all taxes and expenses to deliver the material to the project site incurred by the contractor but excludes any cost for labor and equipment required for installation after the material is delivered to the site.
To calculate the total materials cost of a project, use either the actual materials cost or the default materials cost. Actualmaterialscost. This is the cost of all materials being used on the project site, excluding labor but including
delivery and taxes.Defaultmaterialscost.The alternative way to determine the total materials cost is to calculate 45% of total
construction costs. This default materials cost can replace the actual cost for most materials and products, as specified above. If the project team is including optional products and materials, such as furniture and MEP items, add the actual value of those items to the default value for all other products and materials.
Location Valuation FactorSeveral credits in the MR section include a location valuation factor, which adds value to locally produced
products and materials. The intent is to incentivize the purchase of products that support the local economy. Products and materials that are extracted, manufactured, and purchased within 100 miles (160 kilometers) of the project are valued at 200% of their cost (i.e., the valuation factor is 2).
For a product to qualify for the location valuation factor, it must meet two conditions: all extraction, manufacture, and purchase (including distribution) of the product and its materials must occur within that radius (Figure 1), and the product (or portion of an assembled product) must meet at least one of the sustainable criteria (e.g., FSC certification, recycled content) specified in the credit. Products and materials that do not meet the location criteria but do meet at least one of the sustainability criteria are valued 100% of their cost (i.e., the valuation factor is 1).
The distance must be measured as the crow flies, not by actual travel distance. The point of purchase is
MR5MRc Responsible Sourcing of Raw Material
USGBC LEED Guide Illustrations
©2012 RTKL Associates Inc. All Rights Reserved. NOT FOR CONSTRUCTION
Project site location
Blast furnace slag extraction
100 mile (160 km) radius from project site
Lime extraction
Silica extraction
Portland cement manufacturing
Concrete mixing plant
Gravel extraction
Figure 1. Example material radius
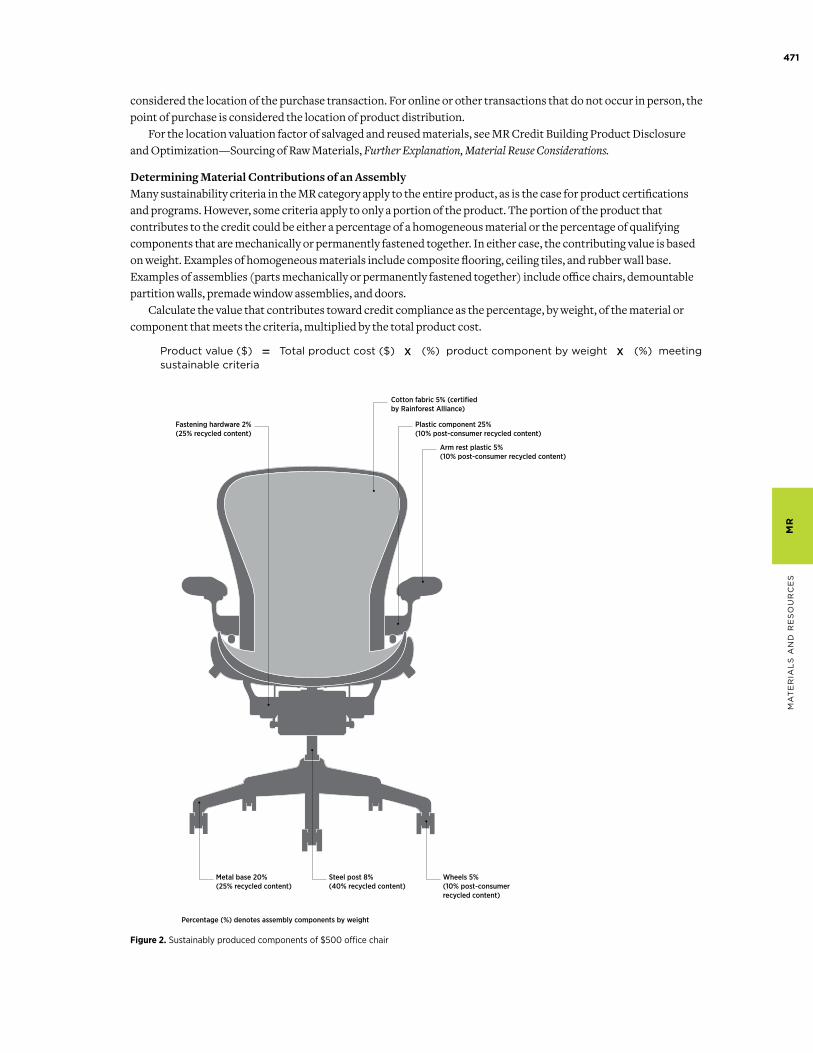
471
MR
MA
TE
RIA
LS
An
d R
ES
OU
RC
ES
considered the location of the purchase transaction. For online or other transactions that do not occur in person, the point of purchase is considered the location of product distribution.
For the location valuation factor of salvaged and reused materials, see MR Credit Building Product Disclosure and Optimization—Sourcing of Raw Materials, FurtherExplanation,MaterialReuseConsiderations.
Determining Material Contributions of an AssemblyMany sustainability criteria in the MR category apply to the entire product, as is the case for product certifications and programs. However, some criteria apply to only a portion of the product. The portion of the product that contributes to the credit could be either a percentage of a homogeneous material or the percentage of qualifying components that are mechanically or permanently fastened together. In either case, the contributing value is based on weight. Examples of homogeneous materials include composite flooring, ceiling tiles, and rubber wall base. Examples of assemblies (parts mechanically or permanently fastened together) include office chairs, demountable partition walls, premade window assemblies, and doors.
Calculate the value that contributes toward credit compliance as the percentage, by weight, of the material or component that meets the criteria, multiplied by the total product cost.
Product value ($) = total product cost ($) x (%) product component by weight x (%) meeting sustainable criteria
MR7MRc Responsible Sourcing of Raw Materials
USGBC LEED Guide Illustrations
©2012 RTKL Associates Inc. All Rights Reserved. NOT FOR CONSTRUCTION
Cotton fabric 5% (certifiedby Rainforest Alliance)
Plastic component 25%(10% post-consumer recycled content)
Arm rest plastic 5%(10% post-consumer recycled content)
Fastening hardware 2%(25% recycled content)
Steel post 8%(40% recycled content)
Wheels 5%(10% post-consumerrecycled content)
Percentage (%) denotes assembly components by weight
Metal base 20%(25% recycled content)
Figure 2. Sustainably produced components of $500 office chair
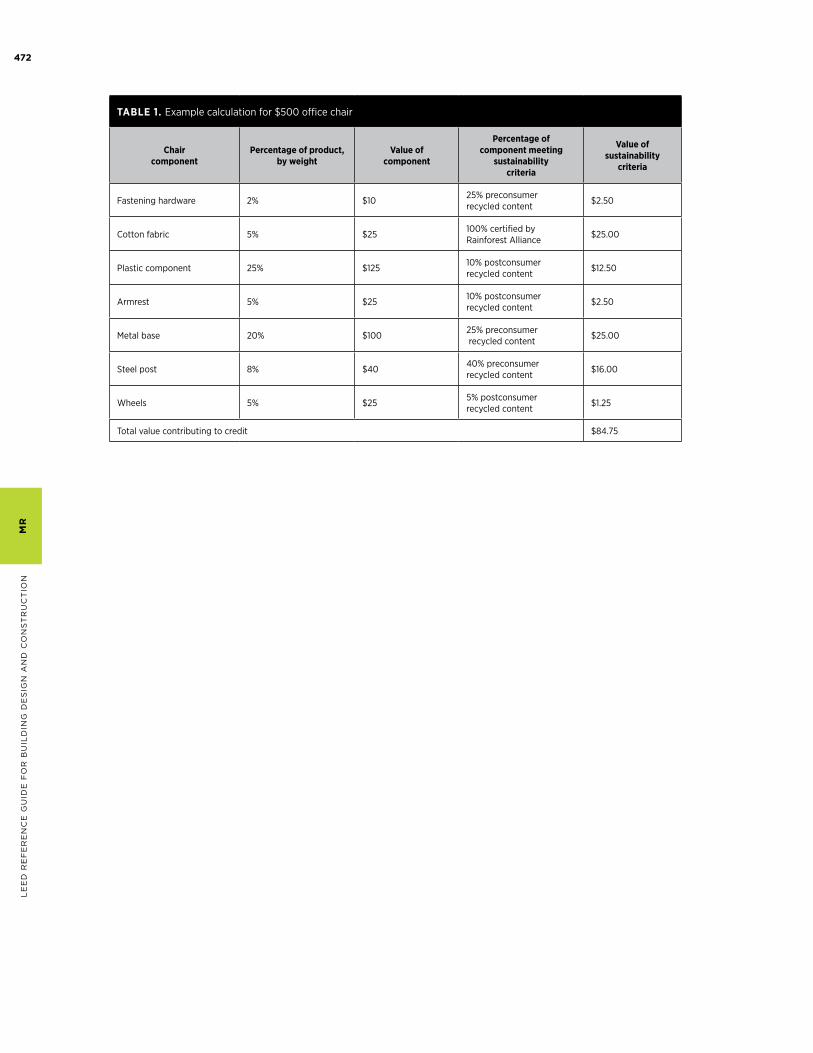
472
LE
ED
RE
fE
RE
nc
E G
uiD
E f
oR
bu
iLD
inG
DE
siG
n a
nD
co
ns
tR
uc
tio
nM
R
tablE 1. Example calculation for $500 office chair
chair component
Percentage of product, by weight
value of component
Percentage of component meeting
sustainability criteria
value of sustainability
criteria
Fastening hardware 2% $1025% preconsumer recycled content
$2.50
Cotton fabric 5% $25100% certified by Rainforest Alliance
$25.00
Plastic component 25% $12510% postconsumer recycled content
$12.50
Armrest 5% $2510% postconsumer recycled content
$2.50
Metal base 20% $10025% preconsumer recycled content
$25.00
Steel post 8% $4040% preconsumer recycled content
$16.00
Wheels 5% $255% postconsumer recycled content
$1.25
Total value contributing to credit $84.75
597
eq
inD
oo
R E
nV
iRo
nM
En
ta
L Q
ua
Lit
y
The Indoor Environmental Quality (EQ) category rewards decisions made by project teams about indoor air quality and thermal, visual, and acoustic comfort. Green buildings with good indoor environmental quality protect the health and comfort of building occupants. High-quality indoor environments also enhance productivity, decrease absenteeism, improve the building’s value, and reduce liability for building designers and owners.1 This category addresses the myriad design strategies and environmental factors—air quality, lighting quality, acoustic design, control over one’s surroundings—that influence the way people learn, work, and live.
The relationship between the indoor environment and the health and comfort of building occupants is complex and still not fully understood. Local customs and expectations, occupants’ activities, and the building’s site, design, and construction are just a few of the variables that make it difficult to quantify and measure the direct effect of a building on its occupants.2 Therefore, the EQ section balances the need for prescriptive measures with more performance-oriented credit requirements. For example, source control is addressed first, in a prerequisite, and a later credit then specifies an indoor air quality assessment to measure the actual outcome of those strategies.
The EQ category combines traditional approaches, such as ventilation and thermal control, with emerging design strategies, including a holistic, emissions-based approach (Low-Emitting Materials credit), source control and monitoring for user-determined contaminants (Enhanced Indoor Air Quality Strategies credit), requirements for lighting quality (Interior Lighting credit), and advanced lighting metrics (Daylight credit). A new credit covering acoustics is now available for all projects using a BD+C rating system.
Indoor Environmental Quality (eq)overvieW
1. U.S.EnvironmentalProtectionAgency,HealthBuildingsHealthyPeople:AVisionforthe21stCentury,epa.gov/iaq/pubs/hbhp.html(October2001)(accessedJuly25,2013).
2. Mitchell,CliffordS.,JunfengZhang,TorbenSigsgaard,MattiJantunen,PaluJ.Lioy,RobertSamson,andMerylH.Karol,CurrentStateoftheScience:HealthEffectsandIndoorEnvironmentalQuality,EnvironmentalHealthPerspectives115(6)(June2007).
598
LE
ED
RE
fE
RE
nc
E G
uiD
E f
oR
Bu
iLD
inG
DE
siG
n a
nD
co
ns
tR
uc
tio
nE
Q
Cross-CuTTinG issues
floor area CalCulaTions and floor Plans
For many of the credits in the EQ category, compliance is based on the percentage of floor area that meets the credit requirements. In general, floor areas and space categorization should be consistent across EQ credits. Any excluded spaces or discrepancies in floor area values should be explained and highlighted in the documentation. See SpaceCategorization, below, for additional information on which floor area should be included in which credits.
sPaCe CaTeGoriZaTion
The EQ category focuses on the interaction between the occupants of the building and the indoor spaces in which they spend their time. For this reason, it is important to identify which spaces are used by the occupants, including any visitors (transients), and what activities they perform in each space. Depending on the space categorization, the credit requirements may or may not apply (Table 1).
occupied versus unoccupied spaceAll spaces in a building must be categorized as either occupied or unoccupied. Occupied spaces are enclosed areas intended for human activities. Unoccupied spaces are places intended primarily for other purposes; they are occupied only occasionally and for short periods of time—in other words, they are inactive areas.
Examples of spaces that are typically unoccupied include the following:
· Mechanical and electrical rooms
· Egress stairway or dedicated emergency exit corridor
· Closets in a residence (but a walk-in closet is occupied)
· Data center floor area, including a raised floor area
· Inactive storage area in a warehouse or distribution centerFor areas with equipment retrieval, the space is unoccupied only if the retrieval is occasional.
regularly versus nonregularly occupied spacesOccupied spaces are further classified as regularly occupied or nonregularly occupied, based on the duration of the occupancy. Regularly occupied spaces are enclosed areas where people normally spend time, defined as more than one hour of continuous occupancy per person per day, on average; the occupants may be seated or standing as they work, study, or perform other activities. For spaces that are not used daily, the classification should be based on the time a typical occupant spends in the space when it is in use. For example, a computer workstation may be largely vacant throughout the month, but when it is occupied, a worker spends one to five hours there. It would then be considered regularly occupied because that length of time is sufficient to affect the person’s well-being, and he or she would have an expectation of thermal comfort and control over the environment.
Occupied spaces that do not meet the definition of regularly occupied are nonregularly occupied; these are areas that people pass through or areas used an average of less than one hour per person per day.
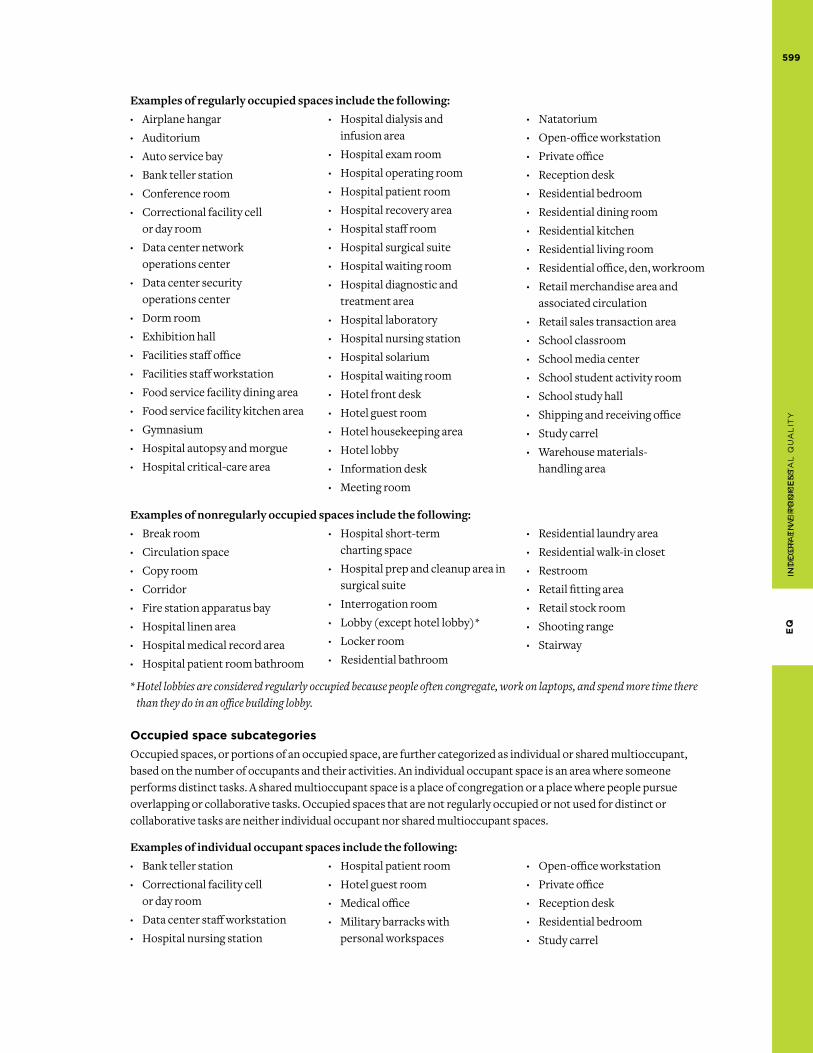
599
EQ
Int
eg
ra
tIv
e p
ro
ce
ss
Examples of regularly occupied spaces include the following:
· Airplane hangar
· Auditorium
· Auto service bay
· Bank teller station
· Conference room
· Correctional facility cell or day room
· Data center network operations center
· Data center security operations center
· Dorm room
· Exhibition hall
· Facilities staff office
· Facilities staff workstation
· Food service facility dining area
· Food service facility kitchen area
· Gymnasium
· Hospital autopsy and morgue
· Hospital critical-care area
· Hospital dialysis and infusion area
· Hospital exam room
· Hospital operating room
· Hospital patient room
· Hospital recovery area
· Hospital staff room
· Hospital surgical suite
· Hospital waiting room
· Hospital diagnostic and treatment area
· Hospital laboratory
· Hospital nursing station
· Hospital solarium
· Hospital waiting room
· Hotel front desk
· Hotel guest room
· Hotel housekeeping area
· Hotel lobby
· Information desk
· Meeting room
· Natatorium
· Open-office workstation
· Private office
· Reception desk
· Residential bedroom
· Residential dining room
· Residential kitchen
· Residential living room
· Residential office, den, workroom
· Retail merchandise area and associated circulation
· Retail sales transaction area
· School classroom
· School media center
· School student activity room
· School study hall
· Shipping and receiving office
· Study carrel
· Warehouse materials- handling area
Examples of nonregularly occupied spaces include the following:
· Break room
· Circulation space
· Copy room
· Corridor
· Fire station apparatus bay
· Hospital linen area
· Hospital medical record area
· Hospital patient room bathroom
· Hospital short-term charting space
· Hospital prep and cleanup area in surgical suite
· Interrogation room
· Lobby (except hotel lobby)*
· Locker room
· Residential bathroom
· Residential laundry area
· Residential walk-in closet
· Restroom
· Retail fitting area
· Retail stock room
· Shooting range
· Stairway
*Hotellobbiesareconsideredregularlyoccupiedbecausepeopleoftencongregate,workonlaptops,andspendmoretimetherethantheydoinanofficebuildinglobby.
occupied space subcategoriesOccupied spaces, or portions of an occupied space, are further categorized as individual or shared multioccupant, based on the number of occupants and their activities. An individual occupant space is an area where someone performs distinct tasks. A shared multioccupant space is a place of congregation or a place where people pursue overlapping or collaborative tasks. Occupied spaces that are not regularly occupied or not used for distinct or collaborative tasks are neither individual occupant nor shared multioccupant spaces.
Examples of individual occupant spaces include the following:
· Bank teller station
· Correctional facility cell or day room
· Data center staff workstation
· Hospital nursing station
· Hospital patient room
· Hotel guest room
· Medical office
· Military barracks with personal workspaces
· Open-office workstation
· Private office
· Reception desk
· Residential bedroom
· Study carrel
inD
oo
R E
nV
iRo
nM
En
ta
L Q
ua
Lit
y
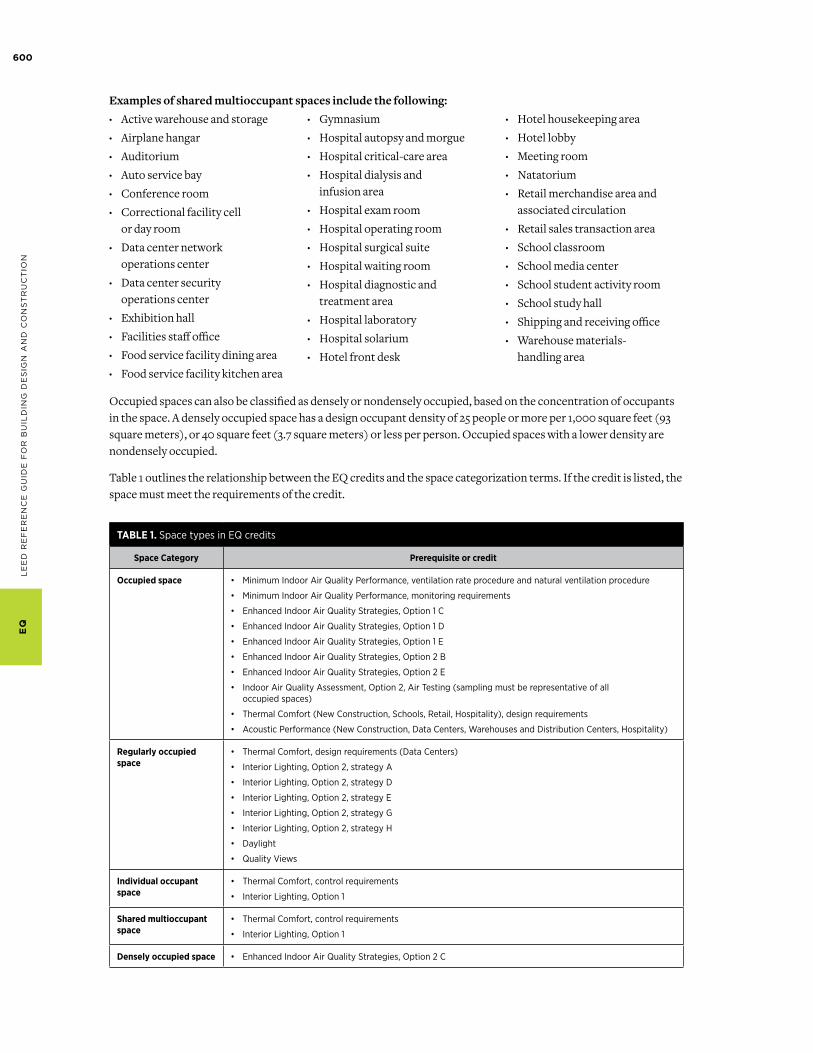
600
LE
ED
RE
fE
RE
nc
E G
uiD
E f
oR
Bu
iLD
inG
DE
siG
n a
nD
co
ns
tR
uc
tio
nE
Q
Examples of shared multioccupant spaces include the following:
· Active warehouse and storage
· Airplane hangar
· Auditorium
· Auto service bay
· Conference room
· Correctional facility cell or day room
· Data center network operations center
· Data center security operations center
· Exhibition hall
· Facilities staff office
· Food service facility dining area
· Food service facility kitchen area
· Gymnasium
· Hospital autopsy and morgue
· Hospital critical-care area
· Hospital dialysis and infusion area
· Hospital exam room
· Hospital operating room
· Hospital surgical suite
· Hospital waiting room
· Hospital diagnostic and treatment area
· Hospital laboratory
· Hospital solarium
· Hotel front desk
· Hotel housekeeping area
· Hotel lobby
· Meeting room
· Natatorium
· Retail merchandise area and associated circulation
· Retail sales transaction area
· School classroom
· School media center
· School student activity room
· School study hall
· Shipping and receiving office
· Warehouse materials- handling area
Occupied spaces can also be classified as densely or nondensely occupied, based on the concentration of occupants in the space. A densely occupied space has a design occupant density of 25 people or more per 1,000 square feet (93 square meters), or 40 square feet (3.7 square meters) or less per person. Occupied spaces with a lower density are nondensely occupied.
Table 1 outlines the relationship between the EQ credits and the space categorization terms. If the credit is listed, the space must meet the requirements of the credit.
tablE 1. Space types in EQ credits
space category Prerequisite or credit
occupied space • Minimum Indoor Air Quality Performance, ventilation rate procedure and natural ventilation procedure
• Minimum Indoor Air Quality Performance, monitoring requirements
• Enhanced Indoor Air Quality Strategies, Option 1 C
• Enhanced Indoor Air Quality Strategies, Option 1 D
• Enhanced Indoor Air Quality Strategies, Option 1 E
• Enhanced Indoor Air Quality Strategies, Option 2 B
• Enhanced Indoor Air Quality Strategies, Option 2 E
• Indoor Air Quality Assessment, Option 2, Air Testing (sampling must be representative of all occupied spaces)
• Thermal Comfort (New Construction, Schools, Retail, Hospitality), design requirements
• Acoustic Performance (New Construction, Data Centers, Warehouses and Distribution Centers, Hospitality)
regularly occupied space
• Thermal Comfort, design requirements (Data Centers)
• Interior Lighting, Option 2, strategy A
• Interior Lighting, Option 2, strategy D
• Interior Lighting, Option 2, strategy E
• Interior Lighting, Option 2, strategy G
• Interior Lighting, Option 2, strategy H
• Daylight
• Quality Views
individual occupant space
• Thermal Comfort, control requirements
• Interior Lighting, Option 1
shared multioccupant space
• Thermal Comfort, control requirements
• Interior Lighting, Option 1
densely occupied space • Enhanced Indoor Air Quality Strategies, Option 2 C
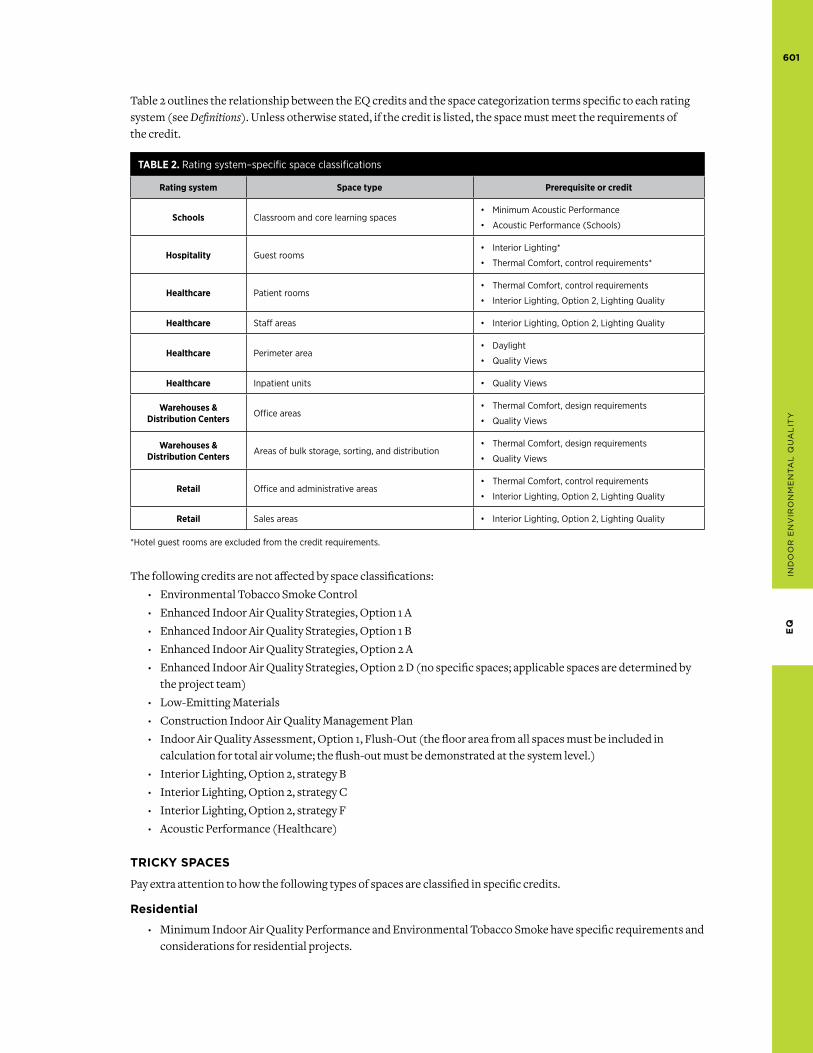
601
EQ
Table 2 outlines the relationship between the EQ credits and the space categorization terms specific to each rating system (see Definitions). Unless otherwise stated, if the credit is listed, the space must meet the requirements of the credit.
tablE 2. Rating system–specific space classifications
rating system space type Prerequisite or credit
schools Classroom and core learning spaces• Minimum Acoustic Performance
• Acoustic Performance (Schools)
hospitality Guest rooms• Interior Lighting*
• Thermal Comfort, control requirements*
healthcare Patient rooms• Thermal Comfort, control requirements
• Interior Lighting, Option 2, Lighting Quality
healthcare Staff areas • Interior Lighting, Option 2, Lighting Quality
healthcare Perimeter area• Daylight
• Quality Views
healthcare Inpatient units • Quality Views
Warehouses & distribution centers Office areas
• Thermal Comfort, design requirements
• Quality Views
Warehouses & distribution centers Areas of bulk storage, sorting, and distribution
• Thermal Comfort, design requirements
• Quality Views
retail Office and administrative areas• Thermal Comfort, control requirements
• Interior Lighting, Option 2, Lighting Quality
retail Sales areas • Interior Lighting, Option 2, Lighting Quality
*Hotel guest rooms are excluded from the credit requirements.
The following credits are not affected by space classifications:
· Environmental Tobacco Smoke Control
· Enhanced Indoor Air Quality Strategies, Option 1 A
· Enhanced Indoor Air Quality Strategies, Option 1 B
· Enhanced Indoor Air Quality Strategies, Option 2 A
· Enhanced Indoor Air Quality Strategies, Option 2 D (no specific spaces; applicable spaces are determined by the project team)
· Low-Emitting Materials
· Construction Indoor Air Quality Management Plan
· Indoor Air Quality Assessment, Option 1, Flush-Out (the floor area from all spaces must be included in calculation for total air volume; the flush-out must be demonstrated at the system level.)
· Interior Lighting, Option 2, strategy B
· Interior Lighting, Option 2, strategy C
· Interior Lighting, Option 2, strategy F
· Acoustic Performance (Healthcare)
TriCky sPaCes
Pay extra attention to how the following types of spaces are classified in specific credits.
residential
· Minimum Indoor Air Quality Performance and Environmental Tobacco Smoke have specific requirements and considerations for residential projects.
inD
oo
R E
nV
iRo
nM
En
ta
L Q
ua
Lit
y
602
LE
ED
RE
fE
RE
nc
E G
uiD
E f
oR
Bu
iLD
inG
DE
siG
n a
nD
co
ns
tR
uc
tio
nE
Q
· See the FurtherExplanation,ProjectTypeVariations sections in Thermal Comfort and Interior Lighting for guidance on providing appropriate controllability in residential buildings.
auditoriums
· Exceptions to Daylight and Quality Views are permitted. See the FurtherExplanation,ProjectTypeVariations sections in Daylight and Quality Views.
Gymnasiums
· See the FurtherExplanation,ProjectTypeVariations section in Thermal Comfort for guidance on dealing with high levels of physical activity.
· Exceptions to Quality Views are permitted. See the FurtherExplanation,ProjectTypeVariations section in Quality Views.
Transportation Terminals
· For Thermal Comfort and Interior Lighting, Option 1, Lighting Control, most of the areas in a transportation terminal can be considered shared multioccupant. Most areas in transportation terminals are also regularly occupied.
dormitories and Military barracks
· These spaces fall in-between a work space and residence.
· Dorm rooms or military barracks with personal workspaces are considered individual occupant spaces. Military barracks without personal workspaces are considered shared multioccupant.
industrial facilities
· For Thermal Comfort and Interior Lighting, Option 1, Lighting Control, most of the active warehouse and storage areas are considered multioccupant.
· Most areas in industrial facilities are also regularly occupied.

777
INIn
no
va
tIo
n
Innovation (in)overvieWSustainable design strategies and measures are constantly evolving and improving. New technologies are continually introduced to the marketplace, and up-to-date scientific research influences building design strategies. The purpose of this LEED category is to recognize projects for innovative building features and sustainable building practices and strategies.
Occasionally, a strategy results in building performance that greatly exceeds what is required in an existing LEED credit. Other strategies may not be addressed by any LEED prerequisite or credit but warrant consideration for their sustainability benefits. In addition, LEED is most effectively implemented as part of a cohesive team, and this category addresses the role of a LEED Accredited Professional in facilitating that process.

789
RP
RE
GIO
NA
L P
RIO
RIT
Y
Regional Priority (rp)overvieWBecause some environmental issues are particular to a locale, volunteers from USGBC chapters and the LEED International Roundtable have identified distinct environmental priorities within their areas and the credits that address those issues. These Regional Priority credits encourage project teams to focus on their local environmental priorities.
USGBC established a process that identified six RP credits for every location and every rating system within chapter or country boundaries. Participants were asked to determine which environmental issues were most salient in their chapter area or country. The issues could be naturally occurring (e.g., water shortages) or man-made (e.g., polluted watersheds) and could reflect environmental concerns (e.g., water shortages) or environmental assets (e.g., abundant sunlight). The areas, or zones, were defined by a combination of priority issues—for example, an urban area with an impaired watershed versus an urban area with an intact watershed.
The participants then prioritized credits to address the important issues of given locations. Because each LEED project type (e.g., a data center) may be associated with different environmental impacts, each rating system has its own RP credits.
The ultimate goal of RP credits is to enhance the ability of LEED project teams to address critical environmental issues across the country and around the world.

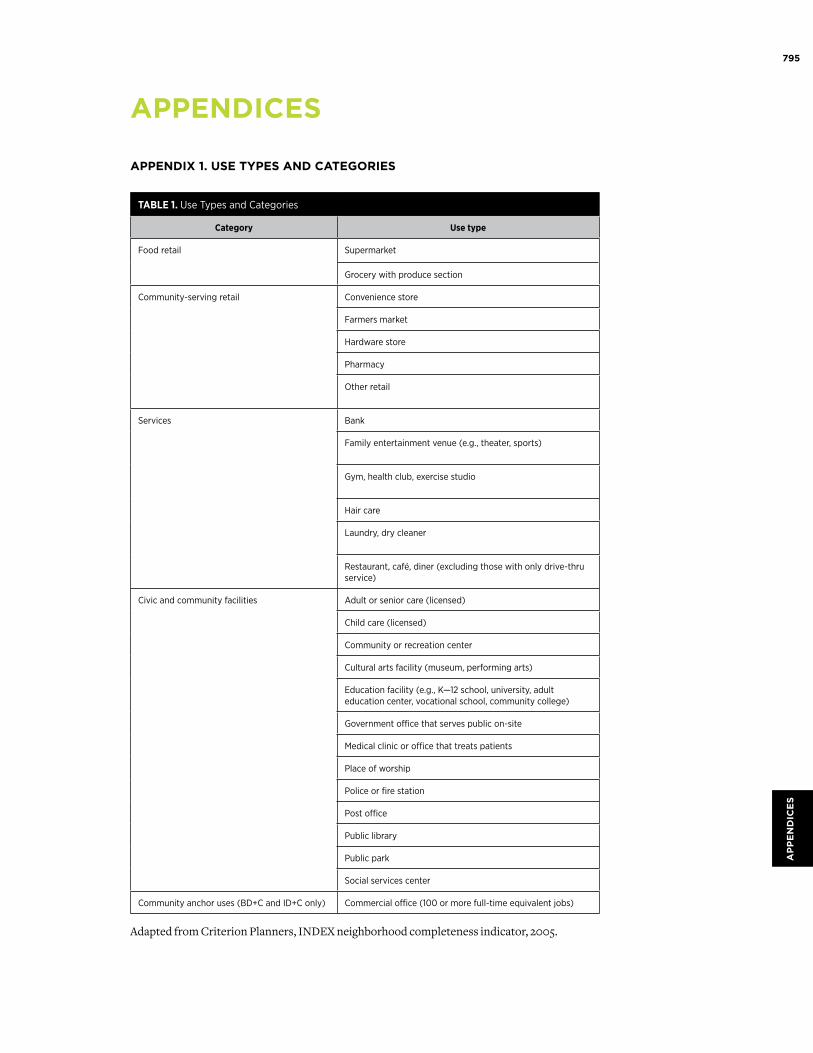
795
ap
pe
nd
ice
s
aPPendiCes
aPPendix 1. use TyPes and CaTeGories
tablE 1. Use Types and Categories
category use type
Food retail Supermarket
Grocery with produce section
Community-serving retail Convenience store
Farmers market
Hardware store
Pharmacy
Other retail
Services Bank
Family entertainment venue (e.g., theater, sports)
Gym, health club, exercise studio
Hair care
Laundry, dry cleaner
Restaurant, café, diner (excluding those with only drive-thru service)
Civic and community facilities Adult or senior care (licensed)
Child care (licensed)
Community or recreation center
Cultural arts facility (museum, performing arts)
Education facility (e.g., K—12 school, university, adult education center, vocational school, community college)
Government office that serves public on-site
Medical clinic or office that treats patients
Place of worship
Police or fire station
Post office
Public library
Public park
Social services center
Community anchor uses (BD+C and ID+C only) Commercial office (100 or more full-time equivalent jobs)
Adapted from Criterion Planners, INDEX neighborhood completeness indicator, 2005.
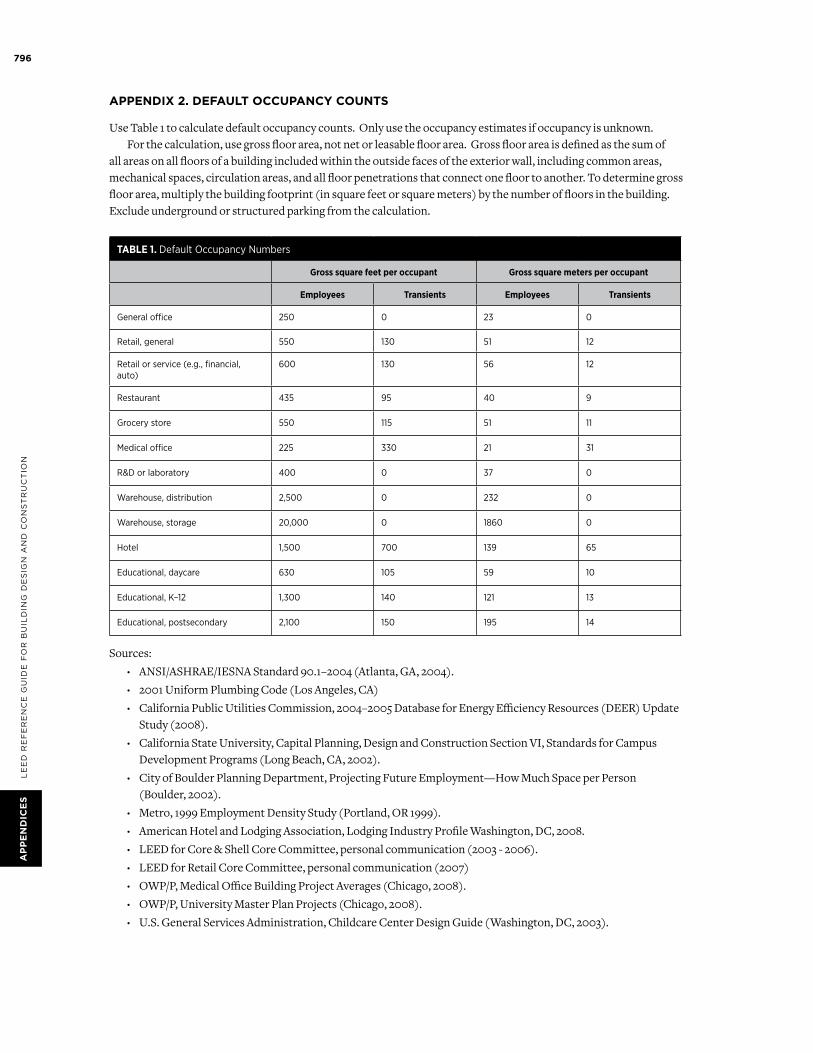
796
LE
ED
RE
fE
RE
nc
E G
uiD
E f
oR
Bu
iLD
inG
DE
siG
n a
nD
co
ns
tR
uc
tio
na
PP
en
diC
es
aPPendix 2. defaulT oCCuPanCy CounTs
Use Table 1 to calculate default occupancy counts. Only use the occupancy estimates if occupancy is unknown.For the calculation, use gross floor area, not net or leasable floor area. Gross floor area is defined as the sum of
all areas on all floors of a building included within the outside faces of the exterior wall, including common areas, mechanical spaces, circulation areas, and all floor penetrations that connect one floor to another. To determine gross floor area, multiply the building footprint (in square feet or square meters) by the number of floors in the building. Exclude underground or structured parking from the calculation.
tablE 1. Default Occupancy Numbers
gross square feet per occupant gross square meters per occupant
Employees transients Employees transients
General office 250 0 23 0
Retail, general 550 130 51 12
Retail or service (e.g., financial, auto)
600 130 56 12
Restaurant 435 95 40 9
Grocery store 550 115 51 11
Medical office 225 330 21 31
R&D or laboratory 400 0 37 0
Warehouse, distribution 2,500 0 232 0
Warehouse, storage 20,000 0 1860 0
Hotel 1,500 700 139 65
Educational, daycare 630 105 59 10
Educational, K–12 1,300 140 121 13
Educational, postsecondary 2,100 150 195 14
Sources:
· ANSI/ASHRAE/IESNA Standard 90.1–2004 (Atlanta, GA, 2004).
· 2001 Uniform Plumbing Code (Los Angeles, CA)
· California Public Utilities Commission, 2004–2005 Database for Energy Efficiency Resources (DEER) Update Study (2008).
· California State University, Capital Planning, Design and Construction Section VI, Standards for Campus Development Programs (Long Beach, CA, 2002).
· City of Boulder Planning Department, Projecting Future Employment—How Much Space per Person (Boulder, 2002).
· Metro, 1999 Employment Density Study (Portland, OR 1999).
· American Hotel and Lodging Association, Lodging Industry Profile Washington, DC, 2008.
· LEED for Core & Shell Core Committee, personal communication (2003 - 2006).
· LEED for Retail Core Committee, personal communication (2007)
· OWP/P, Medical Office Building Project Averages (Chicago, 2008).
· OWP/P, University Master Plan Projects (Chicago, 2008).
· U.S. General Services Administration, Childcare Center Design Guide (Washington, DC, 2003).
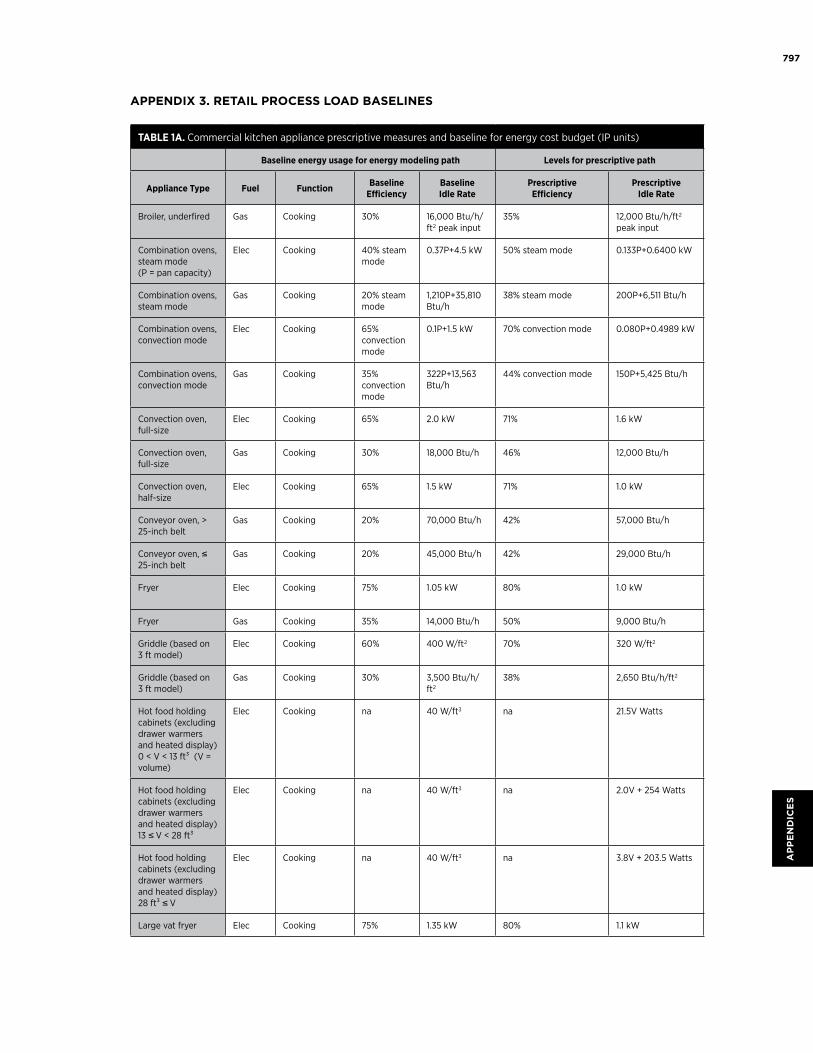
797
ap
pe
nd
ice
s
aPPendix 3. reTail ProCess load baselines
tablE 1a. Commercial kitchen appliance prescriptive measures and baseline for energy cost budget (IP units)
baseline energy usage for energy modeling path levels for prescriptive path
appliance type Fuel Function baseline Efficiency
baselineidle rate
Prescriptive Efficiency
Prescriptive idle rate
Broiler, underfired Gas Cooking 30% 16,000 Btu/h/ft2 peak input
35% 12,000 Btu/h/ft2
peak input
Combination ovens, steam mode (P = pan capacity)
Elec Cooking 40% steam mode
0.37P+4.5 kW 50% steam mode 0.133P+0.6400 kW
Combination ovens, steam mode
Gas Cooking 20% steam mode
1,210P+35,810 Btu/h
38% steam mode 200P+6,511 Btu/h
Combination ovens, convection mode
Elec Cooking 65% convection mode
0.1P+1.5 kW 70% convection mode 0.080P+0.4989 kW
Combination ovens, convection mode
Gas Cooking 35% convection mode
322P+13,563 Btu/h
44% convection mode 150P+5,425 Btu/h
Convection oven, full-size
Elec Cooking 65% 2.0 kW 71% 1.6 kW
Convection oven, full-size
Gas Cooking 30% 18,000 Btu/h 46% 12,000 Btu/h
Convection oven, half-size
Elec Cooking 65% 1.5 kW 71% 1.0 kW
Conveyor oven, > 25-inch belt
Gas Cooking 20% 70,000 Btu/h 42% 57,000 Btu/h
Conveyor oven, ≤ 25-inch belt
Gas Cooking 20% 45,000 Btu/h 42% 29,000 Btu/h
Fryer Elec Cooking 75% 1.05 kW 80% 1.0 kW
Fryer Gas Cooking 35% 14,000 Btu/h 50% 9,000 Btu/h
Griddle (based on 3 ft model)
Elec Cooking 60% 400 W/ft2 70% 320 W/ft2
Griddle (based on 3 ft model)
Gas Cooking 30% 3,500 Btu/h/ft2
38% 2,650 Btu/h/ft2
Hot food holding cabinets (excluding drawer warmers and heated display) 0 < V < 13 ft³ (V = volume)
Elec Cooking na 40 W/ft3 na 21.5V Watts
Hot food holding cabinets (excluding drawer warmers and heated display) 13 ≤ V < 28 ft³
Elec Cooking na 40 W/ft3 na 2.0V + 254 Watts
Hot food holding cabinets (excluding drawer warmers and heated display) 28 ft³ ≤ V
Elec Cooking na 40 W/ft3 na 3.8V + 203.5 Watts
Large vat fryer Elec Cooking 75% 1.35 kW 80% 1.1 kW
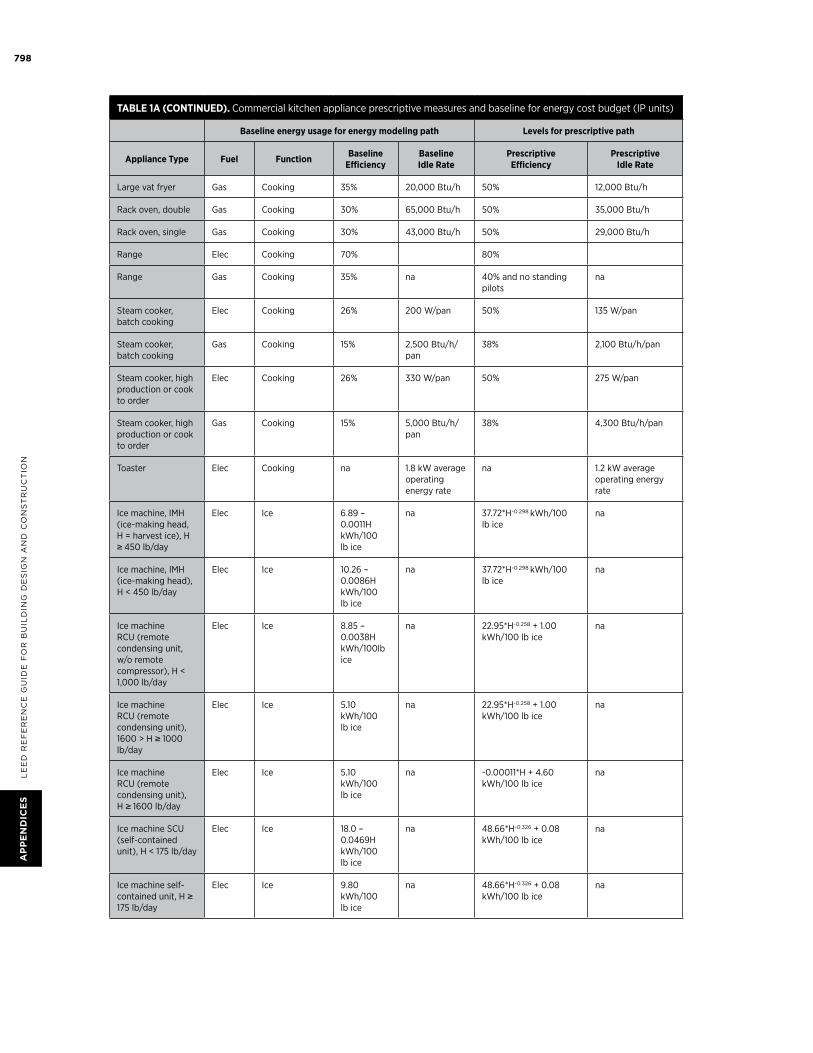
798
LE
ED
RE
fE
RE
nc
E G
uiD
E f
oR
Bu
iLD
inG
DE
siG
n a
nD
co
ns
tR
uc
tio
na
PP
en
diC
es
tablE 1a (continuEd). Commercial kitchen appliance prescriptive measures and baseline for energy cost budget (IP units)
baseline energy usage for energy modeling path levels for prescriptive path
appliance type Fuel Function baseline Efficiency
baselineidle rate
Prescriptive Efficiency
Prescriptive idle rate
Large vat fryer Gas Cooking 35% 20,000 Btu/h 50% 12,000 Btu/h
Rack oven, double Gas Cooking 30% 65,000 Btu/h 50% 35,000 Btu/h
Rack oven, single Gas Cooking 30% 43,000 Btu/h 50% 29,000 Btu/h
Range Elec Cooking 70% 80%
Range Gas Cooking 35% na 40% and no standing pilots
na
Steam cooker, batch cooking
Elec Cooking 26% 200 W/pan 50% 135 W/pan
Steam cooker, batch cooking
Gas Cooking 15% 2,500 Btu/h/pan
38% 2,100 Btu/h/pan
Steam cooker, high production or cook to order
Elec Cooking 26% 330 W/pan 50% 275 W/pan
Steam cooker, high production or cook to order
Gas Cooking 15% 5,000 Btu/h/pan
38% 4,300 Btu/h/pan
Toaster Elec Cooking na 1.8 kW average operating energy rate
na 1.2 kW average operating energy rate
Ice machine, IMH (ice-making head, H = harvest ice), H ≥ 450 lb/day
Elec Ice 6.89 – 0.0011H kWh/100 lb ice
na 37.72*H-0.298 kWh/100 lb ice
na
Ice machine, IMH (ice-making head), H < 450 lb/day
Elec Ice 10.26 – 0.0086H kWh/100 lb ice
na 37.72*H-0.298 kWh/100 lb ice
na
Ice machine RCU (remote condensing unit, w/o remote compressor), H < 1,000 lb/day
Elec Ice 8.85 – 0.0038H kWh/100lb ice
na 22.95*H-0.258 + 1.00 kWh/100 lb ice
na
Ice machine RCU (remote condensing unit), 1600 > H ≥ 1000 lb/day
Elec Ice 5.10 kWh/100 lb ice
na 22.95*H-0.258 + 1.00 kWh/100 lb ice
na
Ice machine RCU (remote condensing unit), H ≥ 1600 lb/day
Elec Ice 5.10 kWh/100 lb ice
na -0.00011*H + 4.60 kWh/100 lb ice
na
Ice machine SCU (self-contained unit), H < 175 lb/day
Elec Ice 18.0 – 0.0469H kWh/100 lb ice
na 48.66*H-0.326 + 0.08 kWh/100 lb ice
na
Ice machine self-contained unit, H ≥ 175 lb/day
Elec Ice 9.80 kWh/100 lb ice
na 48.66*H-0.326 + 0.08 kWh/100 lb ice
na
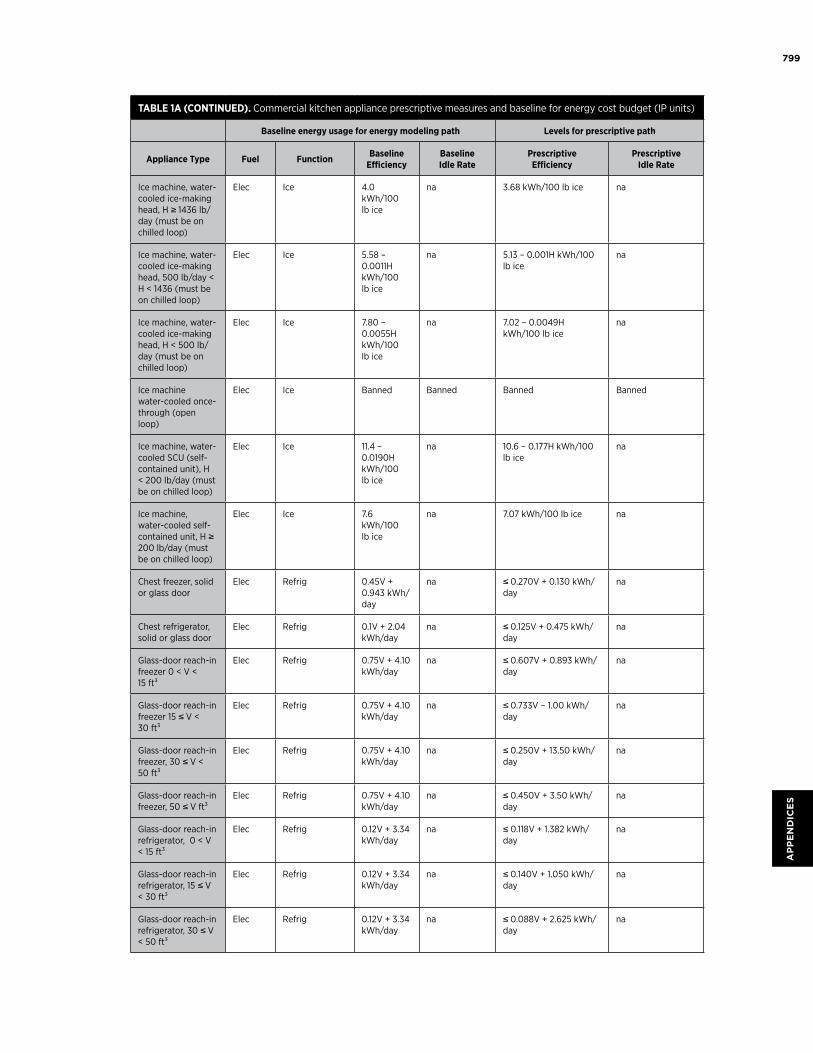
799
ap
pe
nd
ice
s
tablE 1a (continuEd). Commercial kitchen appliance prescriptive measures and baseline for energy cost budget (IP units)
baseline energy usage for energy modeling path levels for prescriptive path
appliance type Fuel Function baseline Efficiency
baselineidle rate
Prescriptive Efficiency
Prescriptive idle rate
Ice machine, water-cooled ice-making head, H ≥ 1436 lb/day (must be on chilled loop)
Elec Ice 4.0 kWh/100 lb ice
na 3.68 kWh/100 lb ice na
Ice machine, water-cooled ice-making head, 500 lb/day < H < 1436 (must be on chilled loop)
Elec Ice 5.58 – 0.0011H kWh/100 lb ice
na 5.13 – 0.001H kWh/100 lb ice
na
Ice machine, water-cooled ice-making head, H < 500 lb/day (must be on chilled loop)
Elec Ice 7.80 – 0.0055H kWh/100 lb ice
na 7.02 – 0.0049H kWh/100 lb ice
na
Ice machine water-cooled once-through (open loop)
Elec Ice Banned Banned Banned Banned
Ice machine, water-cooled SCU (self-contained unit), H < 200 lb/day (must be on chilled loop)
Elec Ice 11.4 – 0.0190H kWh/100 lb ice
na 10.6 – 0.177H kWh/100 lb ice
na
Ice machine, water-cooled self-contained unit, H ≥ 200 lb/day (must be on chilled loop)
Elec Ice 7.6 kWh/100 lb ice
na 7.07 kWh/100 lb ice na
Chest freezer, solid or glass door
Elec Refrig 0.45V + 0.943 kWh/day
na ≤ 0.270V + 0.130 kWh/day
na
Chest refrigerator, solid or glass door
Elec Refrig 0.1V + 2.04 kWh/day
na ≤ 0.125V + 0.475 kWh/day
na
Glass-door reach-in freezer 0 < V < 15 ft³
Elec Refrig 0.75V + 4.10 kWh/day
na ≤ 0.607V + 0.893 kWh/day
na
Glass-door reach-in freezer 15 ≤ V < 30 ft³
Elec Refrig 0.75V + 4.10 kWh/day
na ≤ 0.733V – 1.00 kWh/day
na
Glass-door reach-in freezer, 30 ≤ V < 50 ft³
Elec Refrig 0.75V + 4.10 kWh/day
na ≤ 0.250V + 13.50 kWh/day
na
Glass-door reach-in freezer, 50 ≤ V ft³
Elec Refrig 0.75V + 4.10 kWh/day
na ≤ 0.450V + 3.50 kWh/day
na
Glass-door reach-in refrigerator, 0 < V < 15 ft³
Elec Refrig 0.12V + 3.34 kWh/day
na ≤ 0.118V + 1.382 kWh/day
na
Glass-door reach-in refrigerator, 15 ≤ V < 30 ft³
Elec Refrig 0.12V + 3.34 kWh/day
na ≤ 0.140V + 1.050 kWh/day
na
Glass-door reach-in refrigerator, 30 ≤ V < 50 ft³
Elec Refrig 0.12V + 3.34 kWh/day
na ≤ 0.088V + 2.625 kWh/day
na
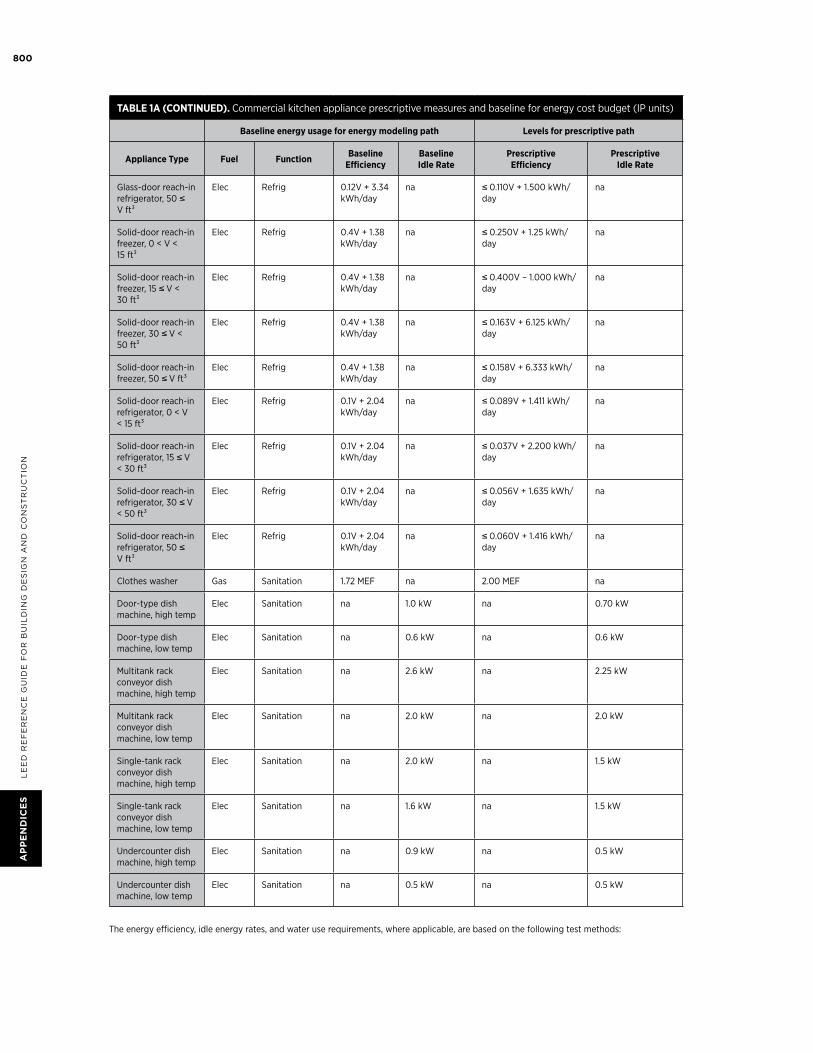
800
LE
ED
RE
fE
RE
nc
E G
uiD
E f
oR
Bu
iLD
inG
DE
siG
n a
nD
co
ns
tR
uc
tio
na
PP
en
diC
es
tablE 1a (continuEd). Commercial kitchen appliance prescriptive measures and baseline for energy cost budget (IP units)
baseline energy usage for energy modeling path levels for prescriptive path
appliance type Fuel Function baseline Efficiency
baselineidle rate
Prescriptive Efficiency
Prescriptive idle rate
Glass-door reach-in refrigerator, 50 ≤ V ft³
Elec Refrig 0.12V + 3.34 kWh/day
na ≤ 0.110V + 1.500 kWh/day
na
Solid-door reach-in freezer, 0 < V < 15 ft³
Elec Refrig 0.4V + 1.38 kWh/day
na ≤ 0.250V + 1.25 kWh/day
na
Solid-door reach-in freezer, 15 ≤ V < 30 ft³
Elec Refrig 0.4V + 1.38 kWh/day
na ≤ 0.400V – 1.000 kWh/day
na
Solid-door reach-in freezer, 30 ≤ V < 50 ft³
Elec Refrig 0.4V + 1.38 kWh/day
na ≤ 0.163V + 6.125 kWh/day
na
Solid-door reach-in freezer, 50 ≤ V ft³
Elec Refrig 0.4V + 1.38 kWh/day
na ≤ 0.158V + 6.333 kWh/day
na
Solid-door reach-in refrigerator, 0 < V < 15 ft³
Elec Refrig 0.1V + 2.04 kWh/day
na ≤ 0.089V + 1.411 kWh/day
na
Solid-door reach-in refrigerator, 15 ≤ V < 30 ft³
Elec Refrig 0.1V + 2.04 kWh/day
na ≤ 0.037V + 2.200 kWh/day
na
Solid-door reach-in refrigerator, 30 ≤ V < 50 ft³
Elec Refrig 0.1V + 2.04 kWh/day
na ≤ 0.056V + 1.635 kWh/day
na
Solid-door reach-in refrigerator, 50 ≤ V ft³
Elec Refrig 0.1V + 2.04 kWh/day
na ≤ 0.060V + 1.416 kWh/day
na
Clothes washer Gas Sanitation 1.72 MEF na 2.00 MEF na
Door-type dish machine, high temp
Elec Sanitation na 1.0 kW na 0.70 kW
Door-type dish machine, low temp
Elec Sanitation na 0.6 kW na 0.6 kW
Multitank rack conveyor dish machine, high temp
Elec Sanitation na 2.6 kW na 2.25 kW
Multitank rack conveyor dish machine, low temp
Elec Sanitation na 2.0 kW na 2.0 kW
Single-tank rack conveyor dish machine, high temp
Elec Sanitation na 2.0 kW na 1.5 kW
Single-tank rack conveyor dish machine, low temp
Elec Sanitation na 1.6 kW na 1.5 kW
Undercounter dish machine, high temp
Elec Sanitation na 0.9 kW na 0.5 kW
Undercounter dish machine, low temp
Elec Sanitation na 0.5 kW na 0.5 kW
The energy efficiency, idle energy rates, and water use requirements, where applicable, are based on the following test methods:
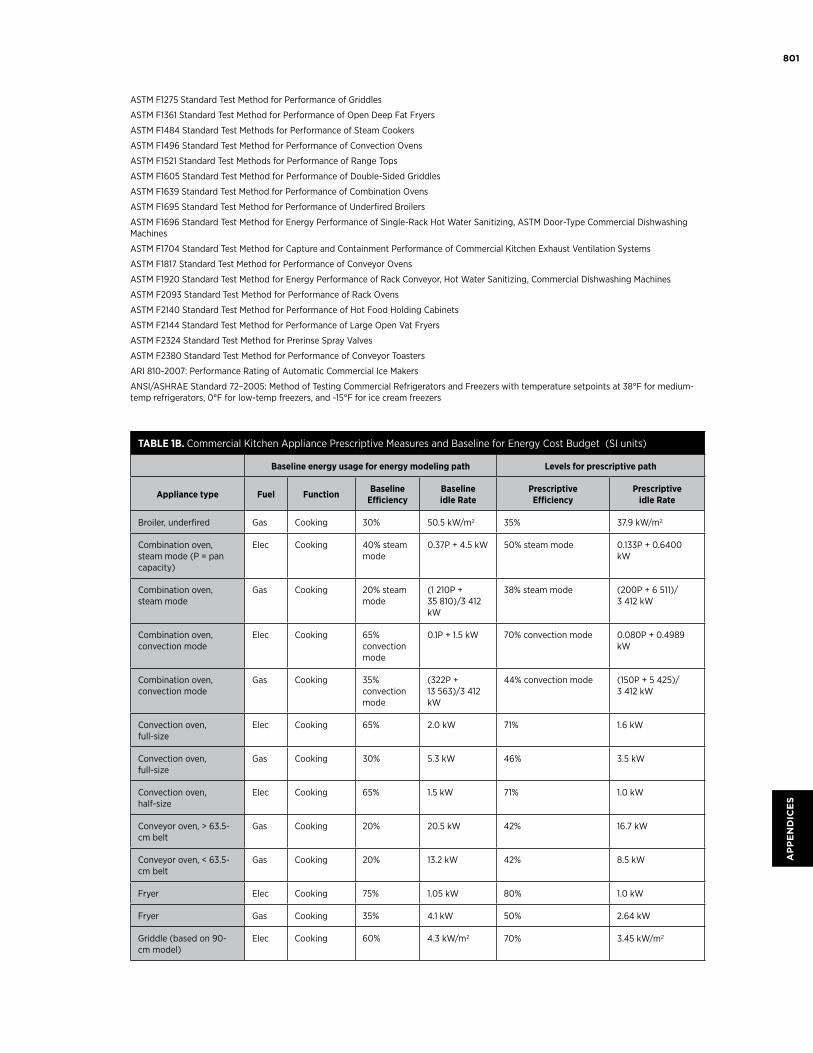
801
ap
pe
nd
ice
s
ASTM F1275 Standard Test Method for Performance of Griddles
ASTM F1361 Standard Test Method for Performance of Open Deep Fat Fryers
ASTM F1484 Standard Test Methods for Performance of Steam Cookers
ASTM F1496 Standard Test Method for Performance of Convection Ovens
ASTM F1521 Standard Test Methods for Performance of Range Tops
ASTM F1605 Standard Test Method for Performance of Double-Sided Griddles
ASTM F1639 Standard Test Method for Performance of Combination Ovens
ASTM F1695 Standard Test Method for Performance of Underfired Broilers
ASTM F1696 Standard Test Method for Energy Performance of Single-Rack Hot Water Sanitizing, ASTM Door-Type Commercial Dishwashing Machines
ASTM F1704 Standard Test Method for Capture and Containment Performance of Commercial Kitchen Exhaust Ventilation Systems
ASTM F1817 Standard Test Method for Performance of Conveyor Ovens
ASTM F1920 Standard Test Method for Energy Performance of Rack Conveyor, Hot Water Sanitizing, Commercial Dishwashing Machines
ASTM F2093 Standard Test Method for Performance of Rack Ovens
ASTM F2140 Standard Test Method for Performance of Hot Food Holding Cabinets
ASTM F2144 Standard Test Method for Performance of Large Open Vat Fryers
ASTM F2324 Standard Test Method for Prerinse Spray Valves
ASTM F2380 Standard Test Method for Performance of Conveyor Toasters
ARI 810-2007: Performance Rating of Automatic Commercial Ice Makers
ANSI/ASHRAE Standard 72–2005: Method of Testing Commercial Refrigerators and Freezers with temperature setpoints at 38°F for medium-temp refrigerators, 0°F for low-temp freezers, and -15°F for ice cream freezers
tablE 1b. Commercial Kitchen Appliance Prescriptive Measures and Baseline for Energy Cost Budget (SI units)
baseline energy usage for energy modeling path levels for prescriptive path
appliance type Fuel Function baseline Efficiency
baseline idle rate
Prescriptive Efficiency
Prescriptive idle rate
Broiler, underfired Gas Cooking 30% 50.5 kW/m2 35% 37.9 kW/m2
Combination oven, steam mode (P = pan capacity)
Elec Cooking 40% steam mode
0.37P + 4.5 kW 50% steam mode 0.133P + 0.6400 kW
Combination oven, steam mode
Gas Cooking 20% steam mode
(1 210P + 35 810)/3 412 kW
38% steam mode (200P + 6 511)/3 412 kW
Combination oven, convection mode
Elec Cooking 65% convection mode
0.1P + 1.5 kW 70% convection mode 0.080P + 0.4989 kW
Combination oven, convection mode
Gas Cooking 35% convection mode
(322P + 13 563)/3 412 kW
44% convection mode (150P + 5 425)/3 412 kW
Convection oven, full-size
Elec Cooking 65% 2.0 kW 71% 1.6 kW
Convection oven, full-size
Gas Cooking 30% 5.3 kW 46% 3.5 kW
Convection oven, half-size
Elec Cooking 65% 1.5 kW 71% 1.0 kW
Conveyor oven, > 63.5-cm belt
Gas Cooking 20% 20.5 kW 42% 16.7 kW
Conveyor oven, < 63.5-cm belt
Gas Cooking 20% 13.2 kW 42% 8.5 kW
Fryer Elec Cooking 75% 1.05 kW 80% 1.0 kW
Fryer Gas Cooking 35% 4.1 kW 50% 2.64 kW
Griddle (based on 90-cm model)
Elec Cooking 60% 4.3 kW/m2 70% 3.45 kW/m2
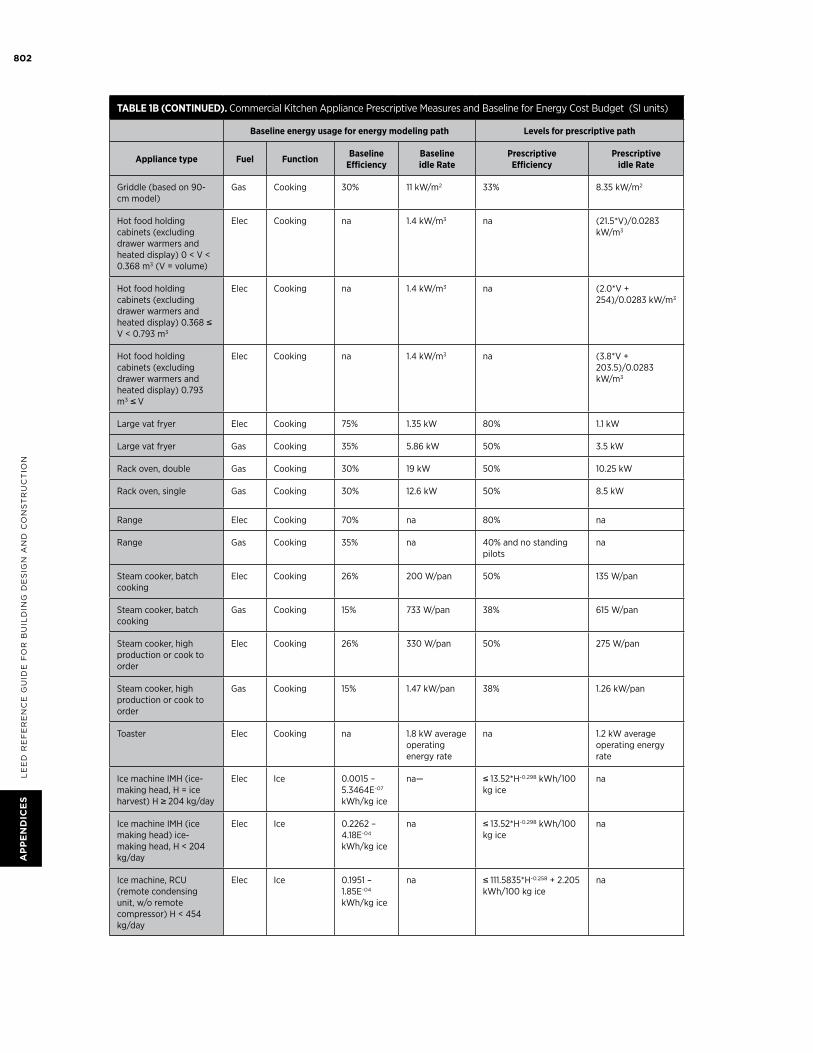
802
LE
ED
RE
fE
RE
nc
E G
uiD
E f
oR
Bu
iLD
inG
DE
siG
n a
nD
co
ns
tR
uc
tio
na
PP
en
diC
es
tablE 1b (continuEd). Commercial Kitchen Appliance Prescriptive Measures and Baseline for Energy Cost Budget (SI units)
baseline energy usage for energy modeling path levels for prescriptive path
appliance type Fuel Function baseline Efficiency
baseline idle rate
Prescriptive Efficiency
Prescriptive idle rate
Griddle (based on 90-cm model)
Gas Cooking 30% 11 kW/m2 33% 8.35 kW/m2
Hot food holding cabinets (excluding drawer warmers and heated display) 0 < V < 0.368 m3 (V = volume)
Elec Cooking na 1.4 kW/m3 na (21.5*V)/0.0283 kW/m3
Hot food holding cabinets (excluding drawer warmers and heated display) 0.368 ≤ V < 0.793 m3
Elec Cooking na 1.4 kW/m3 na (2.0*V + 254)/0.0283 kW/m3
Hot food holding cabinets (excluding drawer warmers and heated display) 0.793 m3 ≤ V
Elec Cooking na 1.4 kW/m3 na (3.8*V + 203.5)/0.0283 kW/m3
Large vat fryer Elec Cooking 75% 1.35 kW 80% 1.1 kW
Large vat fryer Gas Cooking 35% 5.86 kW 50% 3.5 kW
Rack oven, double Gas Cooking 30% 19 kW 50% 10.25 kW
Rack oven, single Gas Cooking 30% 12.6 kW 50% 8.5 kW
Range Elec Cooking 70% na 80% na
Range Gas Cooking 35% na 40% and no standing pilots
na
Steam cooker, batch cooking
Elec Cooking 26% 200 W/pan 50% 135 W/pan
Steam cooker, batch cooking
Gas Cooking 15% 733 W/pan 38% 615 W/pan
Steam cooker, high production or cook to order
Elec Cooking 26% 330 W/pan 50% 275 W/pan
Steam cooker, high production or cook to order
Gas Cooking 15% 1.47 kW/pan 38% 1.26 kW/pan
Toaster Elec Cooking na 1.8 kW average operating energy rate
na 1.2 kW average operating energy rate
Ice machine IMH (ice-making head, H = ice harvest) H ≥ 204 kg/day
Elec Ice 0.0015 – 5.3464E-07 kWh/kg ice
na— ≤ 13.52*H-0.298 kWh/100 kg ice
na
Ice machine IMH (ice making head) ice-making head, H < 204 kg/day
Elec Ice 0.2262 – 4.18E-04 kWh/kg ice
na ≤ 13.52*H-0.298 kWh/100 kg ice
na
Ice machine, RCU (remote condensing unit, w/o remote compressor) H < 454 kg/day
Elec Ice 0.1951 – 1.85E-04 kWh/kg ice
na ≤ 111.5835*H-0.258 + 2.205 kWh/100 kg ice
na
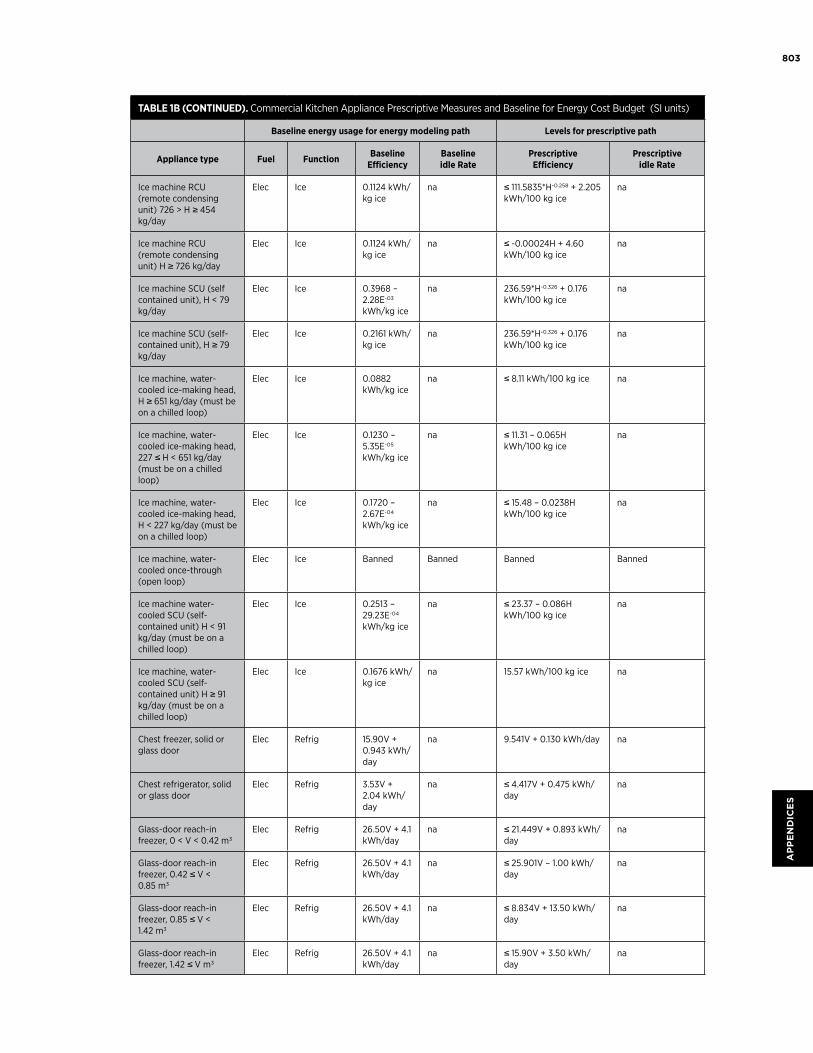
803
ap
pe
nd
ice
s
tablE 1b (continuEd). Commercial Kitchen Appliance Prescriptive Measures and Baseline for Energy Cost Budget (SI units)
baseline energy usage for energy modeling path levels for prescriptive path
appliance type Fuel Function baseline Efficiency
baseline idle rate
Prescriptive Efficiency
Prescriptive idle rate
Ice machine RCU (remote condensing unit) 726 > H ≥ 454 kg/day
Elec Ice 0.1124 kWh/kg ice
na ≤ 111.5835*H-0.258 + 2.205 kWh/100 kg ice
na
Ice machine RCU (remote condensing unit) H ≥ 726 kg/day
Elec Ice 0.1124 kWh/kg ice
na ≤ -0.00024H + 4.60 kWh/100 kg ice
na
Ice machine SCU (self contained unit), H < 79 kg/day
Elec Ice 0.3968 – 2.28E-03 kWh/kg ice
na 236.59*H-0.326 + 0.176 kWh/100 kg ice
na
Ice machine SCU (self-contained unit), H ≥ 79 kg/day
Elec Ice 0.2161 kWh/kg ice
na 236.59*H-0.326 + 0.176 kWh/100 kg ice
na
Ice machine, water-cooled ice-making head, H ≥ 651 kg/day (must be on a chilled loop)
Elec Ice 0.0882 kWh/kg ice
na ≤ 8.11 kWh/100 kg ice na
Ice machine, water-cooled ice-making head, 227 ≤ H < 651 kg/day (must be on a chilled loop)
Elec Ice 0.1230 – 5.35E-05 kWh/kg ice
na ≤ 11.31 – 0.065H kWh/100 kg ice
na
Ice machine, water-cooled ice-making head, H < 227 kg/day (must be on a chilled loop)
Elec Ice 0.1720 – 2.67E-04 kWh/kg ice
na ≤ 15.48 – 0.0238H kWh/100 kg ice
na
Ice machine, water-cooled once-through (open loop)
Elec Ice Banned Banned Banned Banned
Ice machine water-cooled SCU (self-contained unit) H < 91 kg/day (must be on a chilled loop)
Elec Ice 0.2513 – 29.23E-04 kWh/kg ice
na ≤ 23.37 – 0.086H kWh/100 kg ice
na
Ice machine, water-cooled SCU (self-contained unit) H ≥ 91 kg/day (must be on a chilled loop)
Elec Ice 0.1676 kWh/kg ice
na 15.57 kWh/100 kg ice na
Chest freezer, solid or glass door
Elec Refrig 15.90V + 0.943 kWh/day
na 9.541V + 0.130 kWh/day na
Chest refrigerator, solid or glass door
Elec Refrig 3.53V + 2.04 kWh/day
na ≤ 4.417V + 0.475 kWh/day
na
Glass-door reach-in freezer, 0 < V < 0.42 m3
Elec Refrig 26.50V + 4.1 kWh/day
na ≤ 21.449V + 0.893 kWh/day
na
Glass-door reach-in freezer, 0.42 ≤ V < 0.85 m3
Elec Refrig 26.50V + 4.1 kWh/day
na ≤ 25.901V – 1.00 kWh/day
na
Glass-door reach-in freezer, 0.85 ≤ V < 1.42 m3
Elec Refrig 26.50V + 4.1 kWh/day
na ≤ 8.834V + 13.50 kWh/day
na
Glass-door reach-in freezer, 1.42 ≤ V m3
Elec Refrig 26.50V + 4.1 kWh/day
na ≤ 15.90V + 3.50 kWh/day
na
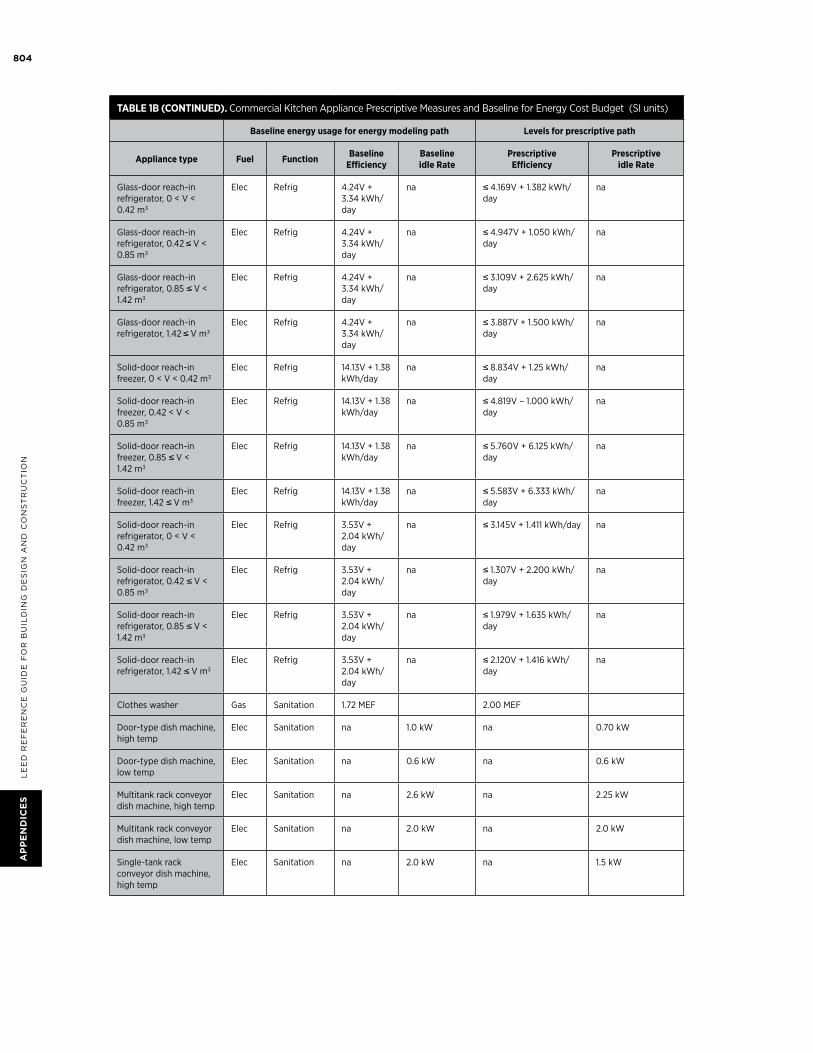
804
LE
ED
RE
fE
RE
nc
E G
uiD
E f
oR
Bu
iLD
inG
DE
siG
n a
nD
co
ns
tR
uc
tio
na
PP
en
diC
es
tablE 1b (continuEd). Commercial Kitchen Appliance Prescriptive Measures and Baseline for Energy Cost Budget (SI units)
baseline energy usage for energy modeling path levels for prescriptive path
appliance type Fuel Function baseline Efficiency
baseline idle rate
Prescriptive Efficiency
Prescriptive idle rate
Glass-door reach-in refrigerator, 0 < V < 0.42 m3
Elec Refrig 4.24V + 3.34 kWh/day
na ≤ 4.169V + 1.382 kWh/day
na
Glass-door reach-in refrigerator, 0.42 ≤ V < 0.85 m3
Elec Refrig 4.24V + 3.34 kWh/day
na ≤ 4.947V + 1.050 kWh/day
na
Glass-door reach-in refrigerator, 0.85 ≤ V < 1.42 m3
Elec Refrig 4.24V + 3.34 kWh/day
na ≤ 3.109V + 2.625 kWh/day
na
Glass-door reach-in refrigerator, 1.42 ≤ V m3
Elec Refrig 4.24V + 3.34 kWh/day
na ≤ 3.887V + 1.500 kWh/day
na
Solid-door reach-in freezer, 0 < V < 0.42 m3
Elec Refrig 14.13V + 1.38 kWh/day
na ≤ 8.834V + 1.25 kWh/day
na
Solid-door reach-in freezer, 0.42 < V < 0.85 m3
Elec Refrig 14.13V + 1.38 kWh/day
na ≤ 4.819V – 1.000 kWh/day
na
Solid-door reach-in freezer, 0.85 ≤ V < 1.42 m3
Elec Refrig 14.13V + 1.38 kWh/day
na ≤ 5.760V + 6.125 kWh/day
na
Solid-door reach-in freezer, 1.42 ≤ V m3
Elec Refrig 14.13V + 1.38 kWh/day
na ≤ 5.583V + 6.333 kWh/day
na
Solid-door reach-in refrigerator, 0 < V < 0.42 m3
Elec Refrig 3.53V + 2.04 kWh/day
na ≤ 3.145V + 1.411 kWh/day na
Solid-door reach-in refrigerator, 0.42 ≤ V < 0.85 m3
Elec Refrig 3.53V + 2.04 kWh/day
na ≤ 1.307V + 2.200 kWh/day
na
Solid-door reach-in refrigerator, 0.85 ≤ V < 1.42 m3
Elec Refrig 3.53V + 2.04 kWh/day
na ≤ 1.979V + 1.635 kWh/day
na
Solid-door reach-in refrigerator, 1.42 ≤ V m3
Elec Refrig 3.53V + 2.04 kWh/day
na ≤ 2.120V + 1.416 kWh/day
na
Clothes washer Gas Sanitation 1.72 MEF 2.00 MEF
Door-type dish machine, high temp
Elec Sanitation na 1.0 kW na 0.70 kW
Door-type dish machine, low temp
Elec Sanitation na 0.6 kW na 0.6 kW
Multitank rack conveyor dish machine, high temp
Elec Sanitation na 2.6 kW na 2.25 kW
Multitank rack conveyor dish machine, low temp
Elec Sanitation na 2.0 kW na 2.0 kW
Single-tank rack conveyor dish machine, high temp
Elec Sanitation na 2.0 kW na 1.5 kW
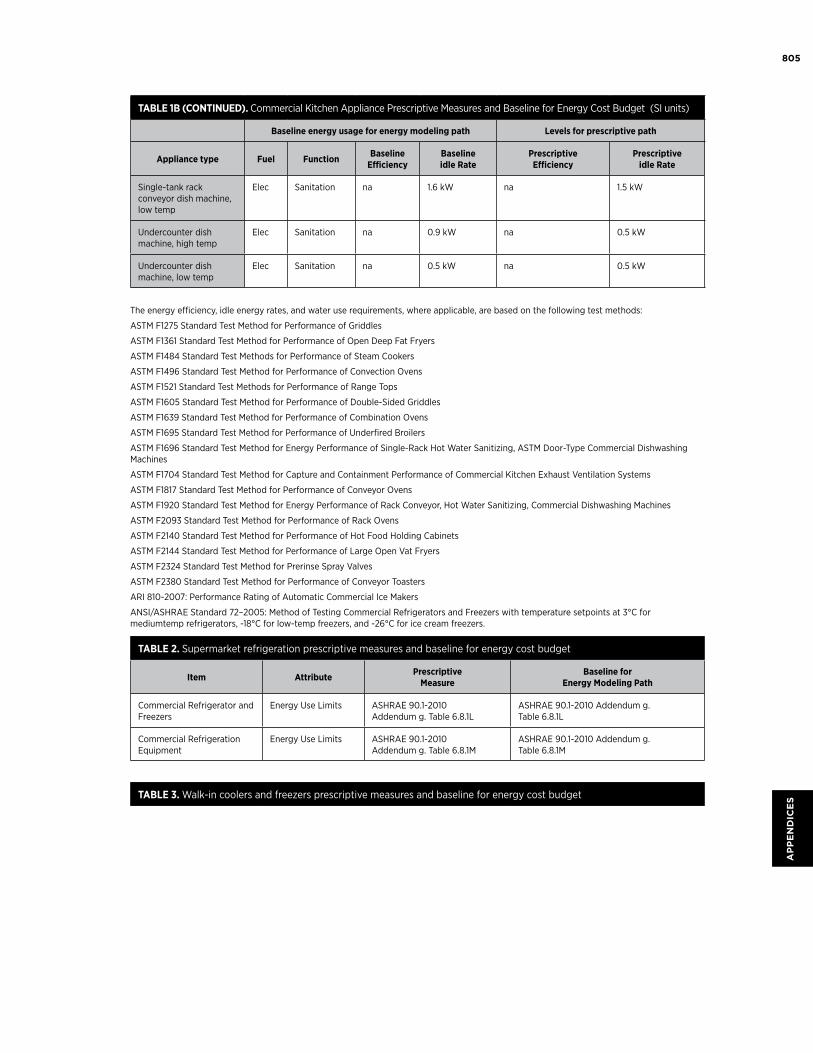
805
ap
pe
nd
ice
s
tablE 1b (continuEd). Commercial Kitchen Appliance Prescriptive Measures and Baseline for Energy Cost Budget (SI units)
baseline energy usage for energy modeling path levels for prescriptive path
appliance type Fuel Function baseline Efficiency
baseline idle rate
Prescriptive Efficiency
Prescriptive idle rate
Single-tank rack conveyor dish machine, low temp
Elec Sanitation na 1.6 kW na 1.5 kW
Undercounter dish machine, high temp
Elec Sanitation na 0.9 kW na 0.5 kW
Undercounter dish machine, low temp
Elec Sanitation na 0.5 kW na 0.5 kW
The energy efficiency, idle energy rates, and water use requirements, where applicable, are based on the following test methods:
ASTM F1275 Standard Test Method for Performance of Griddles
ASTM F1361 Standard Test Method for Performance of Open Deep Fat Fryers
ASTM F1484 Standard Test Methods for Performance of Steam Cookers
ASTM F1496 Standard Test Method for Performance of Convection Ovens
ASTM F1521 Standard Test Methods for Performance of Range Tops
ASTM F1605 Standard Test Method for Performance of Double-Sided Griddles
ASTM F1639 Standard Test Method for Performance of Combination Ovens
ASTM F1695 Standard Test Method for Performance of Underfired Broilers
ASTM F1696 Standard Test Method for Energy Performance of Single-Rack Hot Water Sanitizing, ASTM Door-Type Commercial Dishwashing Machines
ASTM F1704 Standard Test Method for Capture and Containment Performance of Commercial Kitchen Exhaust Ventilation Systems
ASTM F1817 Standard Test Method for Performance of Conveyor Ovens
ASTM F1920 Standard Test Method for Energy Performance of Rack Conveyor, Hot Water Sanitizing, Commercial Dishwashing Machines
ASTM F2093 Standard Test Method for Performance of Rack Ovens
ASTM F2140 Standard Test Method for Performance of Hot Food Holding Cabinets
ASTM F2144 Standard Test Method for Performance of Large Open Vat Fryers
ASTM F2324 Standard Test Method for Prerinse Spray Valves
ASTM F2380 Standard Test Method for Performance of Conveyor Toasters
ARI 810-2007: Performance Rating of Automatic Commercial Ice Makers
ANSI/ASHRAE Standard 72–2005: Method of Testing Commercial Refrigerators and Freezers with temperature setpoints at 3°C for mediumtemp refrigerators, -18°C for low-temp freezers, and -26°C for ice cream freezers.
tablE 2. Supermarket refrigeration prescriptive measures and baseline for energy cost budget
item attribute Prescriptive Measure
baseline for Energy Modeling Path
Commercial Refrigerator and Freezers
Energy Use Limits ASHRAE 90.1-2010 Addendum g. Table 6.8.1L
ASHRAE 90.1-2010 Addendum g. Table 6.8.1L
Commercial Refrigeration Equipment
Energy Use Limits ASHRAE 90.1-2010 Addendum g. Table 6.8.1M
ASHRAE 90.1-2010 Addendum g. Table 6.8.1M
tablE 3. Walk-in coolers and freezers prescriptive measures and baseline for energy cost budget
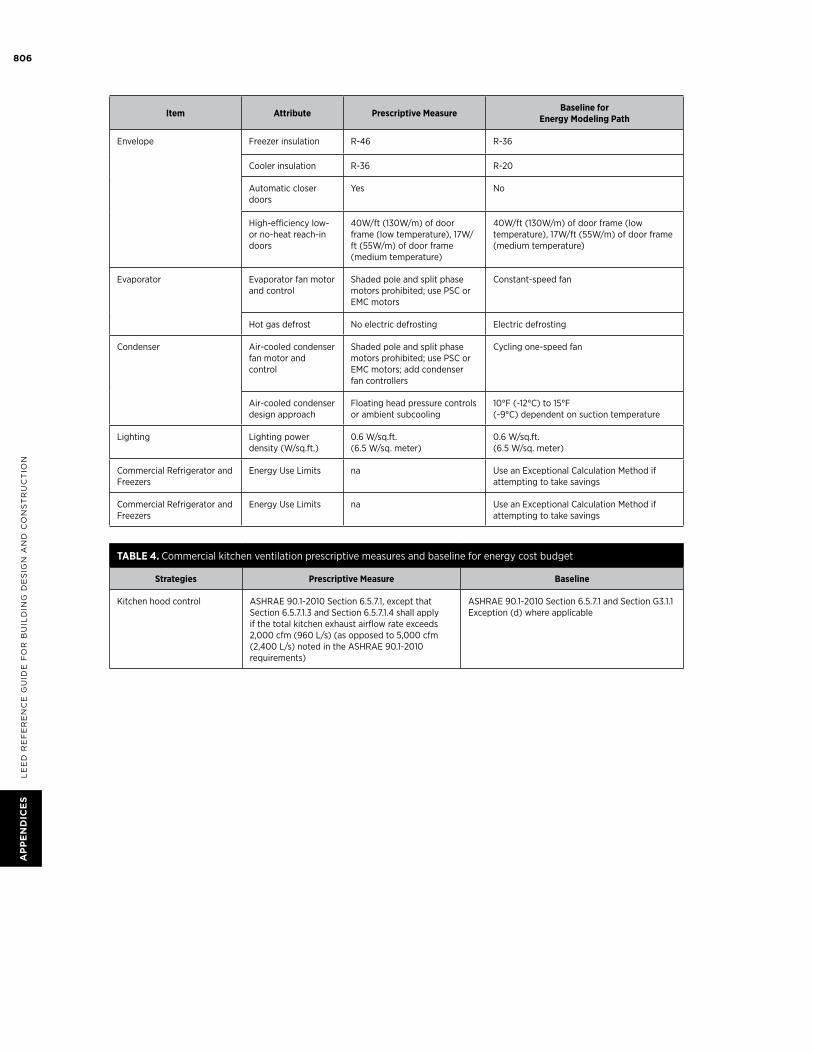
806
LE
ED
RE
fE
RE
nc
E G
uiD
E f
oR
Bu
iLD
inG
DE
siG
n a
nD
co
ns
tR
uc
tio
na
PP
en
diC
es
item attribute Prescriptive Measure baseline for Energy Modeling Path
Envelope Freezer insulation R-46 R-36
Cooler insulation R-36 R-20
Automatic closer doors
Yes No
High-efficiency low- or no-heat reach-in doors
40W/ft (130W/m) of door frame (low temperature), 17W/ft (55W/m) of door frame (medium temperature)
40W/ft (130W/m) of door frame (low temperature), 17W/ft (55W/m) of door frame (medium temperature)
Evaporator Evaporator fan motor and control
Shaded pole and split phase motors prohibited; use PSC or EMC motors
Constant-speed fan
Hot gas defrost No electric defrosting Electric defrosting
Condenser Air-cooled condenser fan motor and control
Shaded pole and split phase motors prohibited; use PSC or EMC motors; add condenser fan controllers
Cycling one-speed fan
Air-cooled condenser design approach
Floating head pressure controls or ambient subcooling
10°F (-12°C) to 15°F (-9°C) dependent on suction temperature
Lighting Lighting power density (W/sq.ft.)
0.6 W/sq.ft. (6.5 W/sq. meter)
0.6 W/sq.ft.(6.5 W/sq. meter)
Commercial Refrigerator and Freezers
Energy Use Limits na Use an Exceptional Calculation Method if attempting to take savings
Commercial Refrigerator and Freezers
Energy Use Limits na Use an Exceptional Calculation Method if attempting to take savings
tablE 4. Commercial kitchen ventilation prescriptive measures and baseline for energy cost budget
strategies Prescriptive Measure baseline
Kitchen hood control ASHRAE 90.1-2010 Section 6.5.7.1, except that Section 6.5.7.1.3 and Section 6.5.7.1.4 shall apply if the total kitchen exhaust airflow rate exceeds 2,000 cfm (960 L/s) (as opposed to 5,000 cfm (2,400 L/s) noted in the ASHRAE 90.1-2010 requirements)
ASHRAE 90.1-2010 Section 6.5.7.1 and Section G3.1.1 Exception (d) where applicable


![Six centuries of changing oceanic mercuryebmg.online/papers/ANTH-HG.pdf · Equatorial Atlantic Knorr 0.6°S, 20°W Jun 1996 Mason and Sullivan [1999] GEOTRACES GA02 13°S–0°S,](https://img.pdfslide.us/doc/110x75/5f465f039c74ba750a3f8fe4/six-centuries-of-changing-oceanic-equatorial-atlantic-knorr-06s-20w-jun-1996.jpg)