Embed Size (px)
Citation preview
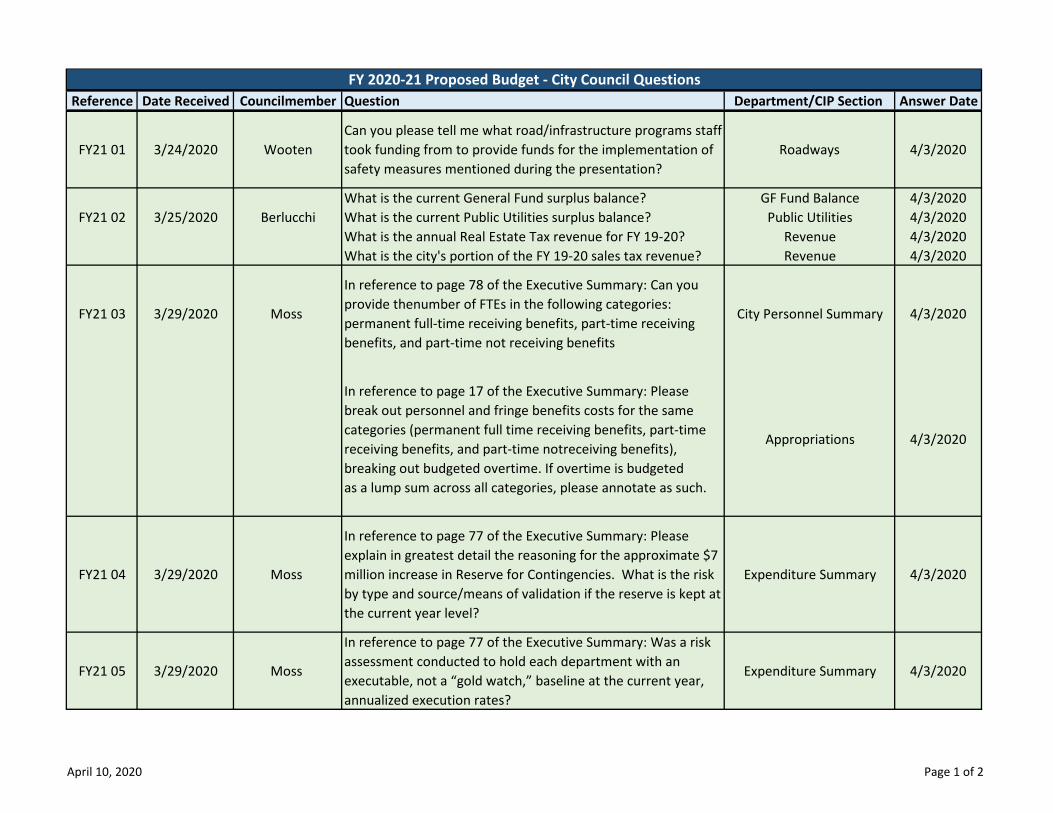
Reference Date Received Councilmember Question Department/CIP Section Answer Date
FY21 01 3/24/2020 WootenCan you please tell me what road/infrastructure programs staff took funding from to provide funds for the implementation of safety measures mentioned during the presentation?
Roadways 4/3/2020
What is the current General Fund surplus balance? GF Fund Balance 4/3/2020FY21 02 3/25/2020 Berlucchi What is the current Public Utilities surplus balance? Public Utilities 4/3/2020
What is the annual Real Estate Tax revenue for FY 19-20? Revenue 4/3/2020What is the city's portion of the FY 19-20 sales tax revenue? Revenue 4/3/2020
FY21 03 3/29/2020 Moss
In reference to page 78 of the Executive Summary: Can you provide thenumber of FTEs in the following categories: permanent full-time receiving benefits, part-time receiving benefits, and part-time not receiving benefits
City Personnel Summary 4/3/2020
In reference to page 17 of the Executive Summary: Please break out personnel and fringe benefits costs for the same categories (permanent full time receiving benefits, part-time receiving benefits, and part-time notreceiving benefits), breaking out budgeted overtime. If overtime is budgetedas a lump sum across all categories, please annotate as such.
Appropriations 4/3/2020
FY21 04 3/29/2020 Moss
In reference to page 77 of the Executive Summary: Please explain in greatest detail the reasoning for the approximate $7 million increase in Reserve for Contingencies. What is the risk by type and source/means of validation if the reserve is kept at the current year level?
Expenditure Summary 4/3/2020
FY21 05 3/29/2020 Moss
In reference to page 77 of the Executive Summary: Was a risk assessment conducted to hold each department with an executable, not a “gold watch,” baseline at the current year, annualized execution rates?
Expenditure Summary 4/3/2020
FY 2020-21 Proposed Budget - City Council Questions
April 10, 2020 Page 1 of 2
Reference Date Received Councilmember Question Department/CIP Section Answer DateFY 2020-21 Proposed Budget - City Council Questions
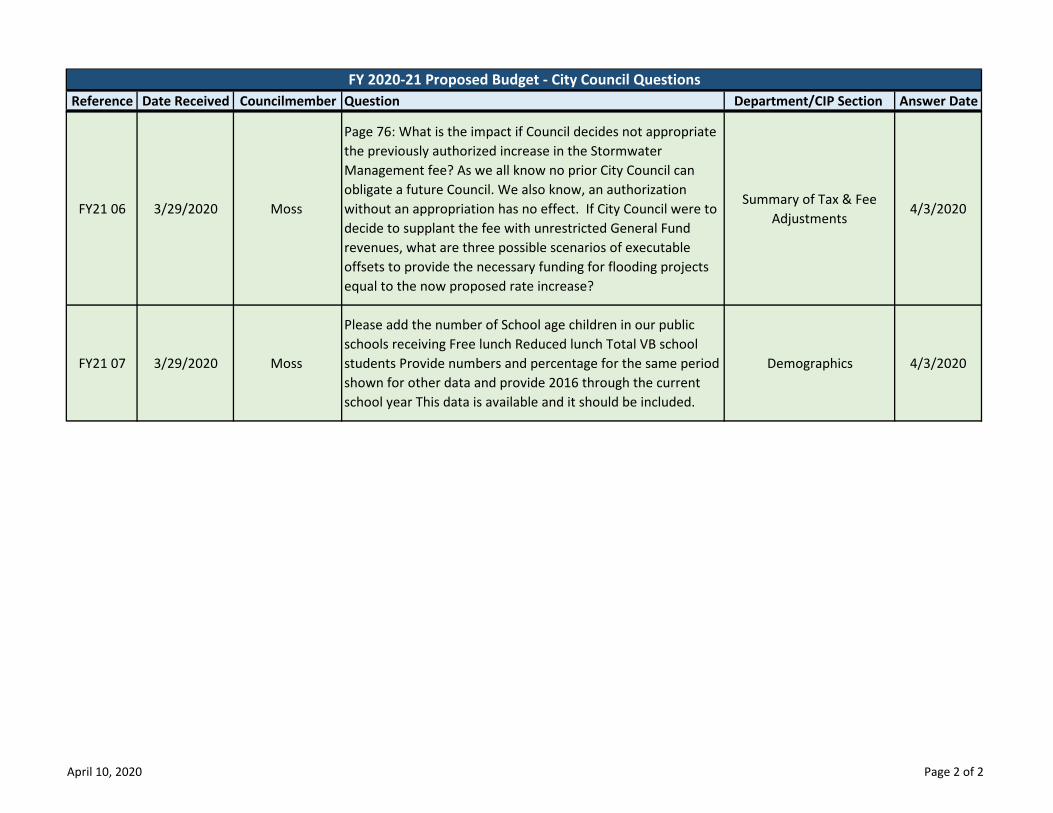
FY21 06 3/29/2020 Moss
Page 76: What is the impact if Council decides not appropriate the previously authorized increase in the Stormwater Management fee? As we all know no prior City Council can obligate a future Council. We also know, an authorization without an appropriation has no effect. If City Council were to decide to supplant the fee with unrestricted General Fund revenues, what are three possible scenarios of executable offsets to provide the necessary funding for flooding projects equal to the now proposed rate increase?
Summary of Tax & Fee Adjustments
4/3/2020
FY21 07 3/29/2020 Moss
Please add the number of School age children in our public schools receiving Free lunch Reduced lunch Total VB school students Provide numbers and percentage for the same period shown for other data and provide 2016 through the current school year This data is available and it should be included.
Demographics 4/3/2020
April 10, 2020 Page 2 of 2
FY 2020-2021 Virginia Beach Budget Response to Council Questions
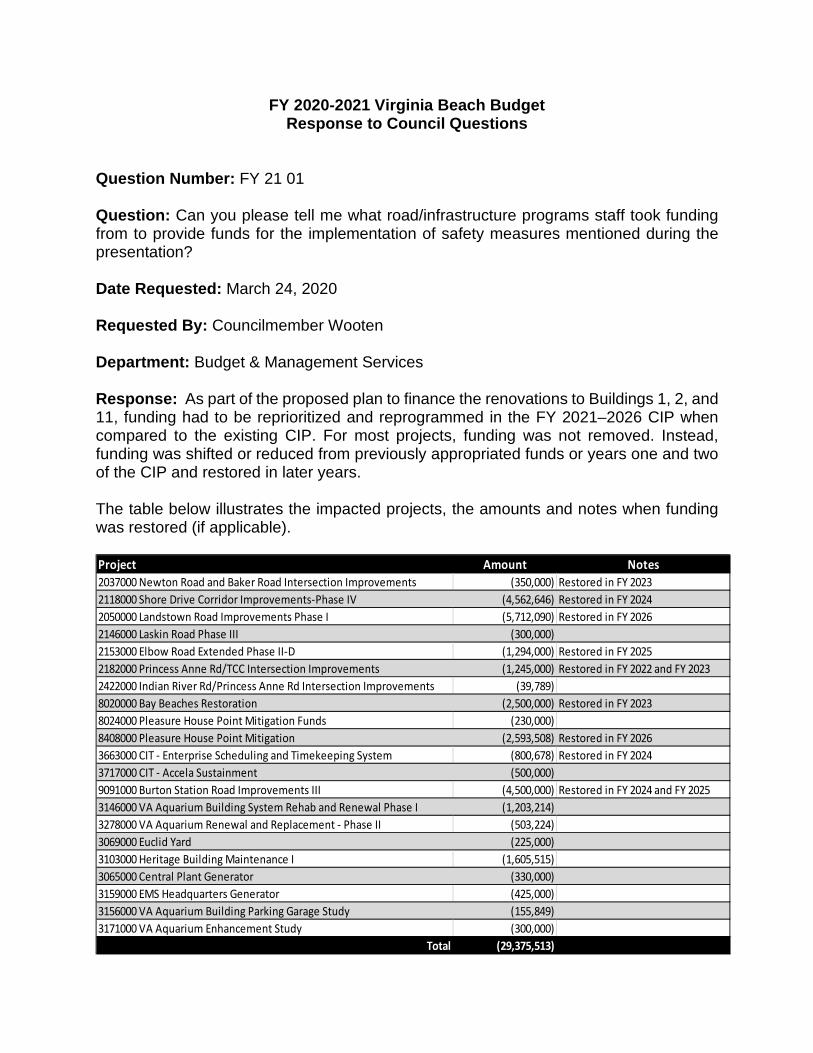
Question Number: FY 21 01 Question: Can you please tell me what road/infrastructure programs staff took funding from to provide funds for the implementation of safety measures mentioned during the presentation? Date Requested: March 24, 2020 Requested By: Councilmember Wooten Department: Budget & Management Services Response: As part of the proposed plan to finance the renovations to Buildings 1, 2, and 11, funding had to be reprioritized and reprogrammed in the FY 2021–2026 CIP when compared to the existing CIP. For most projects, funding was not removed. Instead, funding was shifted or reduced from previously appropriated funds or years one and two of the CIP and restored in later years. The table below illustrates the impacted projects, the amounts and notes when funding was restored (if applicable).
Project Amount Notes2037000 Newton Road and Baker Road Intersection Improvements (350,000) Restored in FY 20232118000 Shore Drive Corridor Improvements-Phase IV (4,562,646) Restored in FY 20242050000 Landstown Road Improvements Phase I (5,712,090) Restored in FY 20262146000 Laskin Road Phase III (300,000) 2153000 Elbow Road Extended Phase II-D (1,294,000) Restored in FY 20252182000 Princess Anne Rd/TCC Intersection Improvements (1,245,000) Restored in FY 2022 and FY 20232422000 Indian River Rd/Princess Anne Rd Intersection Improvements (39,789) 8020000 Bay Beaches Restoration (2,500,000) Restored in FY 20238024000 Pleasure House Point Mitigation Funds (230,000) 8408000 Pleasure House Point Mitigation (2,593,508) Restored in FY 20263663000 CIT - Enterprise Scheduling and Timekeeping System (800,678) Restored in FY 20243717000 CIT - Accela Sustainment (500,000) 9091000 Burton Station Road Improvements III (4,500,000) Restored in FY 2024 and FY 20253146000 VA Aquarium Building System Rehab and Renewal Phase I (1,203,214) 3278000 VA Aquarium Renewal and Replacement - Phase II (503,224) 3069000 Euclid Yard (225,000) 3103000 Heritage Building Maintenance I (1,605,515) 3065000 Central Plant Generator (330,000) 3159000 EMS Headquarters Generator (425,000) 3156000 VA Aquarium Building Parking Garage Study (155,849) 3171000 VA Aquarium Enhancement Study (300,000)
Total (29,375,513)

FY 2020-2021 Virginia Beach Budget Response to Council Questions
Question Number: FY 21 02 Question: 1) What is the current General Fund surplus balance? 2) What is the current Public Utilities surplus balance? 3) What is the annual Real Estate Tax revenue for FY 19-20? 4) What is the city's portion of the FY 19-20 sales tax revenue? Date Requested: March 24, 2020 Requested By: Councilmember Berlucchi Department: Budget & Management Services Response:
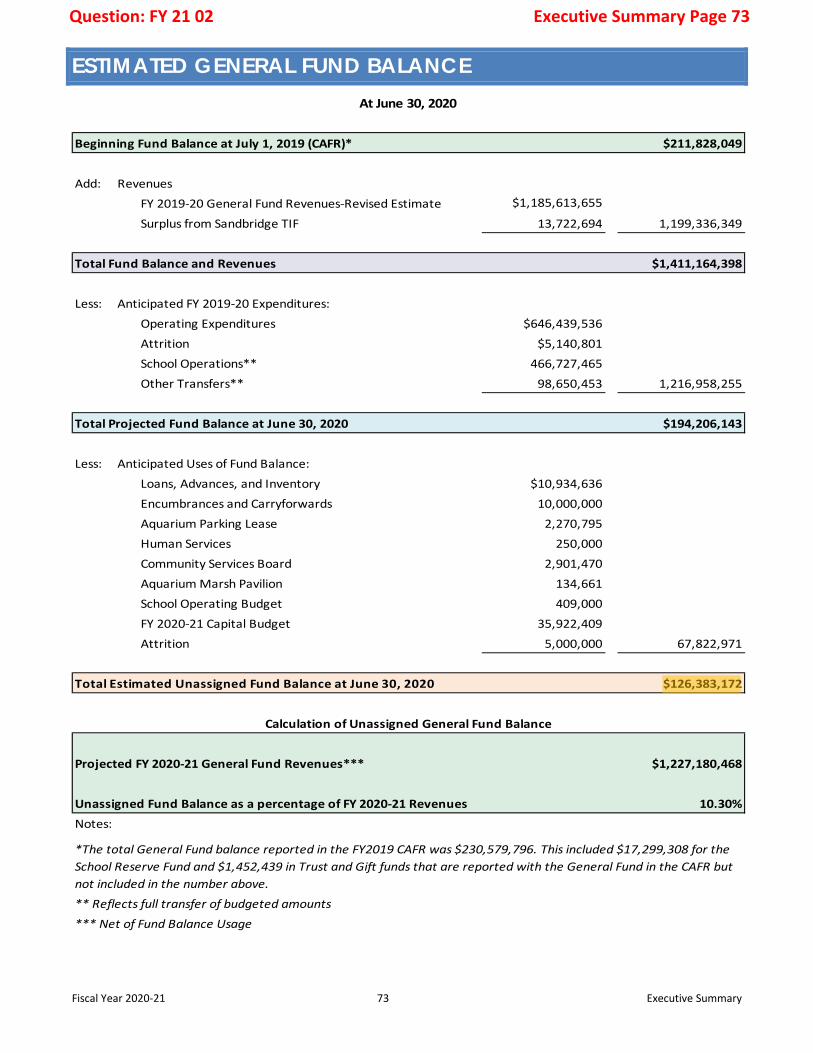
1) The projected Fund Balance of the General Fund on June 30 is $126,383,172, or 10.3% of FY 2020-21 estimated revenue. This figure can be seen on page 73 of the Executive Summary. City Council’s policy is that Fund Balance be maintained at 8% to 12% of the following year’s revenue. Please note that this projection was calculated before the COVID-19 crisis. For example, if the City was to lose an additional $10 million from the FY 2019-20 projections, the City’s Fund Balance would be 9.5%, or approximately $116 million. If the City was to lose an additional $28.3 million from our FY 2019-20 projections, the City would be at 8%, the minimum of our policy. The City Manager is trying to minimize these impacts through the initiation of a hiring freeze, purchasing restrictions, and various other measures.
2) The June 30, 2019 fund balance as reflected in the CAFR is $143,373,220. This total includes unspent appropriations in the Water and Sewer CIP. A breakdown of Public Utilities FY 2019-20 beginning undesignated fund balance is provided in the table below.
Fund Amount 541 Fund (CIP) $ 46,107,299 241 Fund (Operating) $ 97,265,921 Total Fund Balance $ 143,373,220
Public Utilities has not appropriated any of their operating fund balance to date in FY 2019-20. However, total Public Utilities undesignated fund balance at the end of FY 2019-20 will be impacted by any future use of fund balance, unspent appropriations, and over realized revenues in the current fiscal year.
Question: FY 21 02 Page 2 of 3
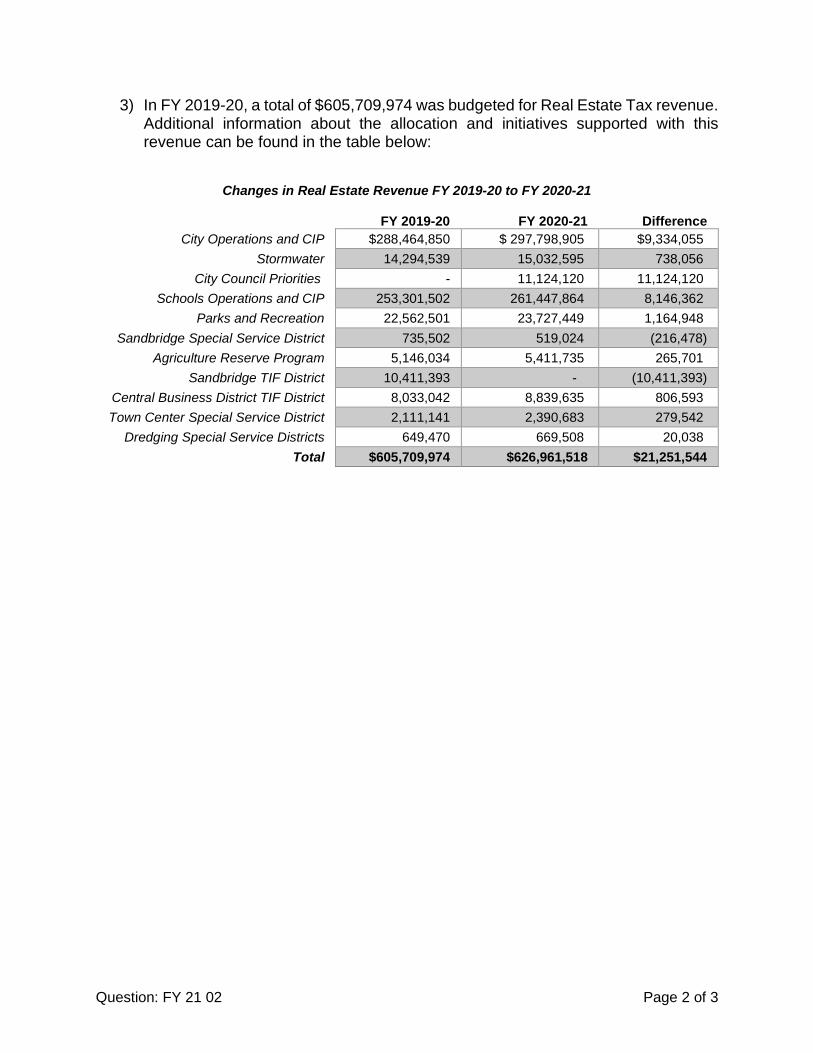
3) In FY 2019-20, a total of $605,709,974 was budgeted for Real Estate Tax revenue.Additional information about the allocation and initiatives supported with thisrevenue can be found in the table below:
Changes in Real Estate Revenue FY 2019-20 to FY 2020-21
FY 2019-20 FY 2020-21 Difference City Operations and CIP $288,464,850 $ 297,798,905 $9,334,055
Stormwater 14,294,539 15,032,595 738,056 City Council Priorities - 11,124,120 11,124,120
Schools Operations and CIP 253,301,502 261,447,864 8,146,362 Parks and Recreation 22,562,501 23,727,449 1,164,948
Sandbridge Special Service District 735,502 519,024 (216,478) Agriculture Reserve Program 5,146,034 5,411,735 265,701
Sandbridge TIF District 10,411,393 - (10,411,393) Central Business District TIF District 8,033,042 8,839,635 806,593 Town Center Special Service District 2,111,141 2,390,683 279,542
Dredging Special Service Districts 649,470 669,508 20,038 Total $605,709,974 $626,961,518 $21,251,544
Question: FY 21 02 Page 3 of 3
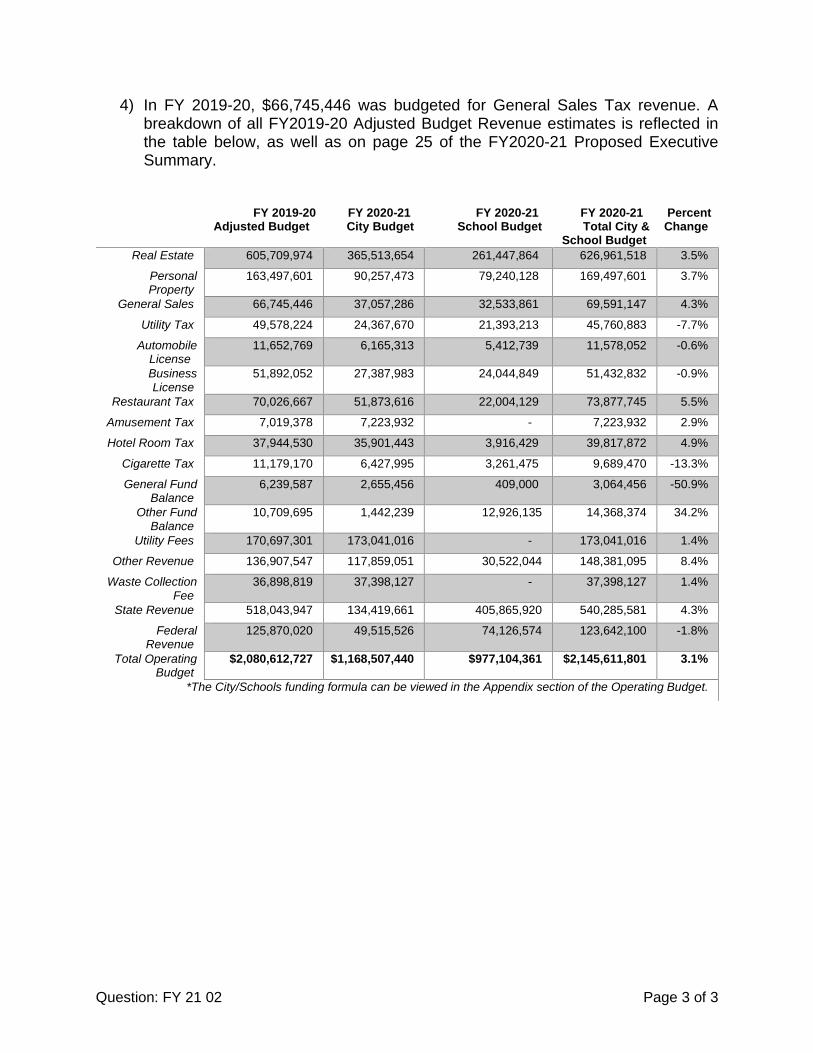
4) In FY 2019-20, $66,745,446 was budgeted for General Sales Tax revenue. Abreakdown of all FY2019-20 Adjusted Budget Revenue estimates is reflected inthe table below, as well as on page 25 of the FY2020-21 Proposed ExecutiveSummary.
FY 2019-20 Adjusted Budget
FY 2020-21 City Budget
FY 2020-21 School Budget
FY 2020-21 Total City &
School Budget
Percent Change
Real Estate 605,709,974 365,513,654 261,447,864 626,961,518 3.5%
Personal Property
163,497,601 90,257,473 79,240,128 169,497,601 3.7%
General Sales 66,745,446 37,057,286 32,533,861 69,591,147 4.3%
Utility Tax 49,578,224 24,367,670 21,393,213 45,760,883 -7.7%
Automobile License
11,652,769 6,165,313 5,412,739 11,578,052 -0.6%
Business License
51,892,052 27,387,983 24,044,849 51,432,832 -0.9%
Restaurant Tax 70,026,667 51,873,616 22,004,129 73,877,745 5.5%
Amusement Tax 7,019,378 7,223,932 - 7,223,932 2.9%
Hotel Room Tax 37,944,530 35,901,443 3,916,429 39,817,872 4.9%
Cigarette Tax 11,179,170 6,427,995 3,261,475 9,689,470 -13.3%
General Fund Balance
6,239,587 2,655,456 409,000 3,064,456 -50.9%
Other Fund Balance
10,709,695 1,442,239 12,926,135 14,368,374 34.2%
Utility Fees 170,697,301 173,041,016 - 173,041,016 1.4%
Other Revenue 136,907,547 117,859,051 30,522,044 148,381,095 8.4%
Waste Collection Fee
36,898,819 37,398,127 - 37,398,127 1.4%
State Revenue 518,043,947 134,419,661 405,865,920 540,285,581 4.3%
Federal Revenue
125,870,020 49,515,526 74,126,574 123,642,100 -1.8%
Total Operating Budget
$2,080,612,727 $1,168,507,440 $977,104,361 $2,145,611,801 3.1%
*The City/Schools funding formula can be viewed in the Appendix section of the Operating Budget.
Fiscal Year 2020-21 73 Executive Summary
ESTIMATED GENERAL FUND BALANCE
Beginning Fund Balance at July 1, 2019 (CAFR)* $211,828,049
Add: RevenuesFY 2019-20 General Fund Revenues-Revised Estimate $1,185,613,655
Surplus from Sandbridge TIF 13,722,694 1,199,336,349
Total Fund Balance and Revenues $1,411,164,398
Less: Anticipated FY 2019-20 Expenditures:Operating Expenditures $646,439,536Attrition $5,140,801School Operations** 466,727,465Other Transfers** 98,650,453 1,216,958,255
Total Projected Fund Balance at June 30, 2020 $194,206,143
Less: Anticipated Uses of Fund Balance:Loans, Advances, and Inventory $10,934,636Encumbrances and Carryforwards 10,000,000Aquarium Parking Lease 2,270,795Human Services 250,000Community Services Board 2,901,470Aquarium Marsh Pavilion 134,661School Operating Budget 409,000FY 2020-21 Capital Budget 35,922,409Attrition 5,000,000 67,822,971
Total Estimated Unassigned Fund Balance at June 30, 2020 $126,383,172
Projected FY 2020-21 General Fund Revenues*** $1,227,180,468
Unassigned Fund Balance as a percentage of FY 2020-21 Revenues 10.30%Notes:
** Reflects full transfer of budgeted amounts*** Net of Fund Balance Usage
At June 30, 2020
Calculation of Unassigned General Fund Balance
*The total General Fund balance reported in the FY2019 CAFR was $230,579,796. This included $17,299,308 for theSchool Reserve Fund and $1,452,439 in Trust and Gift funds that are reported with the General Fund in the CAFR butnot included in the number above.
Question: FY 21 02 Executive Summary Page 73
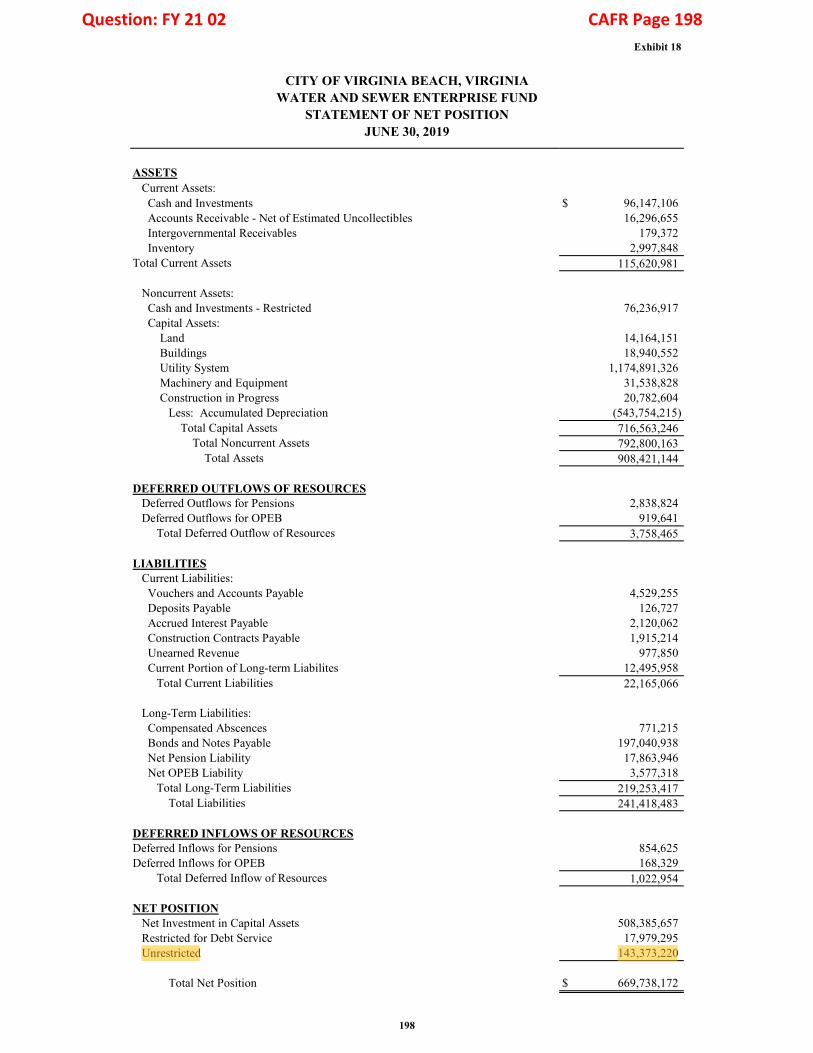
Exhibit 18
CITY OF VIRGINIA BEACH, VIRGINIAWATER AND SEWER ENTERPRISE FUND
STATEMENT OF NET POSITIONJUNE 30, 2019
ASSETS Current Assets:
Cash and Investments $ 96,147,106 Accounts Receivable - Net of Estimated Uncollectibles 16,296,655 Intergovernmental Receivables 179,372 Inventory 2,997,848
Total Current Assets 115,620,981
Noncurrent Assets: Cash and Investments - Restricted 76,236,917 Capital Assets:
Land 14,164,151 Buildings 18,940,552 Utility System 1,174,891,326 Machinery and Equipment 31,538,828 Construction in Progress 20,782,604
Less: Accumulated Depreciation (543,754,215)Total Capital Assets 716,563,246
Total Noncurrent Assets 792,800,163 Total Assets 908,421,144
DEFERRED OUTFLOWS OF RESOURCES Deferred Outflows for Pensions 2,838,824 Deferred Outflows for OPEB 919,641
Total Deferred Outflow of Resources 3,758,465
LIABILITIES Current Liabilities:
Vouchers and Accounts Payable 4,529,255 Deposits Payable 126,727 Accrued Interest Payable 2,120,062 Construction Contracts Payable 1,915,214 Unearned Revenue 977,850 Current Portion of Long-term Liabilites 12,495,958
Total Current Liabilities 22,165,066
Long-Term Liabilities: Compensated Abscences 771,215 Bonds and Notes Payable 197,040,938 Net Pension Liability 17,863,946 Net OPEB Liability 3,577,318
Total Long-Term Liabilities 219,253,417 Total Liabilities 241,418,483
DEFERRED INFLOWS OF RESOURCESDeferred Inflows for Pensions 854,625 Deferred Inflows for OPEB 168,329
Total Deferred Inflow of Resources 1,022,954
NET POSITION Net Investment in Capital Assets 508,385,657 Restricted for Debt Service 17,979,295 Unrestricted 143,373,220
Total Net Position $ 669,738,172
198
Question: FY 21 02 CAFR Page 198
Fiscal Year 2020-21 28 Executive Summary
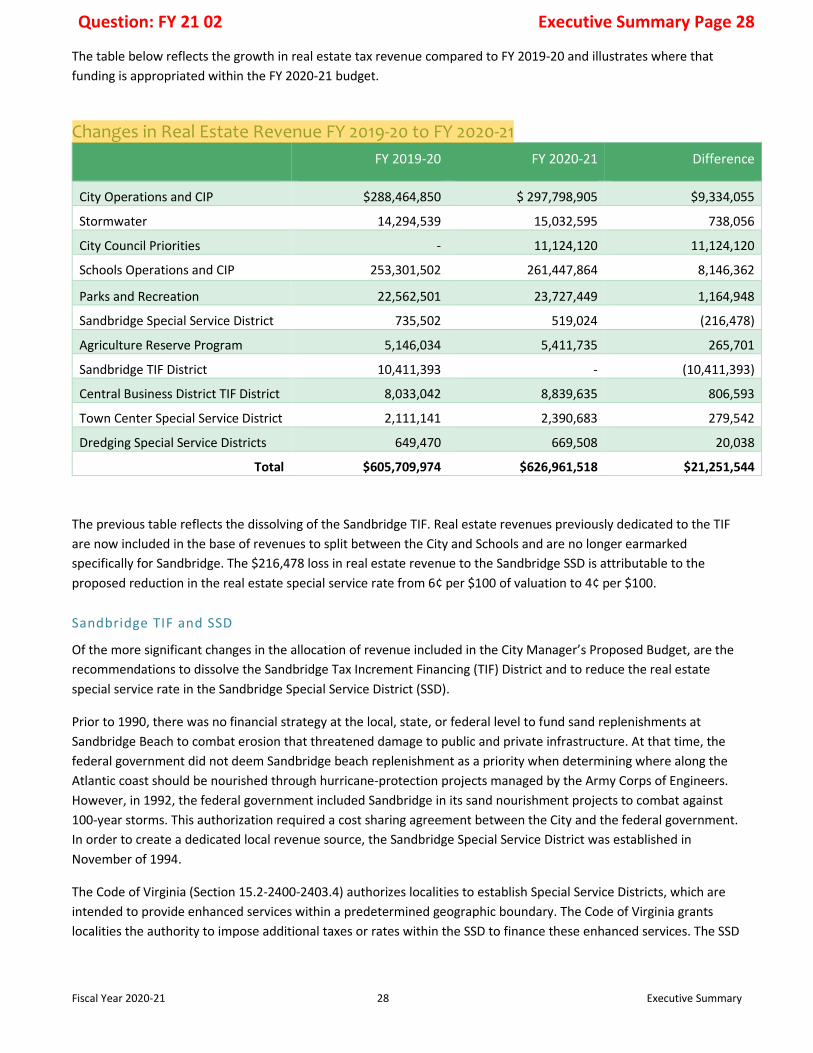
The table below reflects the growth in real estate tax revenue compared to FY 2019-20 and illustrates where that funding is appropriated within the FY 2020-21 budget.
Changes in Real Estate Revenue FY 2019-20 to FY 2020-21 FY 2019-20 FY 2020-21 Difference
City Operations and CIP $288,464,850 $ 297,798,905 $9,334,055
Stormwater 14,294,539 15,032,595 738,056
City Council Priorities - 11,124,120 11,124,120
Schools Operations and CIP 253,301,502 261,447,864 8,146,362
Parks and Recreation 22,562,501 23,727,449 1,164,948
Sandbridge Special Service District 735,502 519,024 (216,478)
Agriculture Reserve Program 5,146,034 5,411,735 265,701
Sandbridge TIF District 10,411,393 - (10,411,393)
Central Business District TIF District 8,033,042 8,839,635 806,593
Town Center Special Service District 2,111,141 2,390,683 279,542
Dredging Special Service Districts 649,470 669,508 20,038
Total $605,709,974 $626,961,518 $21,251,544
The previous table reflects the dissolving of the Sandbridge TIF. Real estate revenues previously dedicated to the TIF are now included in the base of revenues to split between the City and Schools and are no longer earmarked specifically for Sandbridge. The $216,478 loss in real estate revenue to the Sandbridge SSD is attributable to the proposed reduction in the real estate special service rate from 6¢ per $100 of valuation to 4¢ per $100.
Sandbridge TIF and SSD
Of the more significant changes in the allocation of revenue included in the City Manager’s Proposed Budget, are the recommendations to dissolve the Sandbridge Tax Increment Financing (TIF) District and to reduce the real estate special service rate in the Sandbridge Special Service District (SSD).
Prior to 1990, there was no financial strategy at the local, state, or federal level to fund sand replenishments at Sandbridge Beach to combat erosion that threatened damage to public and private infrastructure. At that time, the federal government did not deem Sandbridge beach replenishment as a priority when determining where along the Atlantic coast should be nourished through hurricane-protection projects managed by the Army Corps of Engineers. However, in 1992, the federal government included Sandbridge in its sand nourishment projects to combat against 100-year storms. This authorization required a cost sharing agreement between the City and the federal government.In order to create a dedicated local revenue source, the Sandbridge Special Service District was established inNovember of 1994.
The Code of Virginia (Section 15.2-2400-2403.4) authorizes localities to establish Special Service Districts, which are intended to provide enhanced services within a predetermined geographic boundary. The Code of Virginia grants localities the authority to impose additional taxes or rates within the SSD to finance these enhanced services. The SSD
Question: FY 21 02 Executive Summary Page 28
Fiscal Year 2020-21 74 Executive Summary
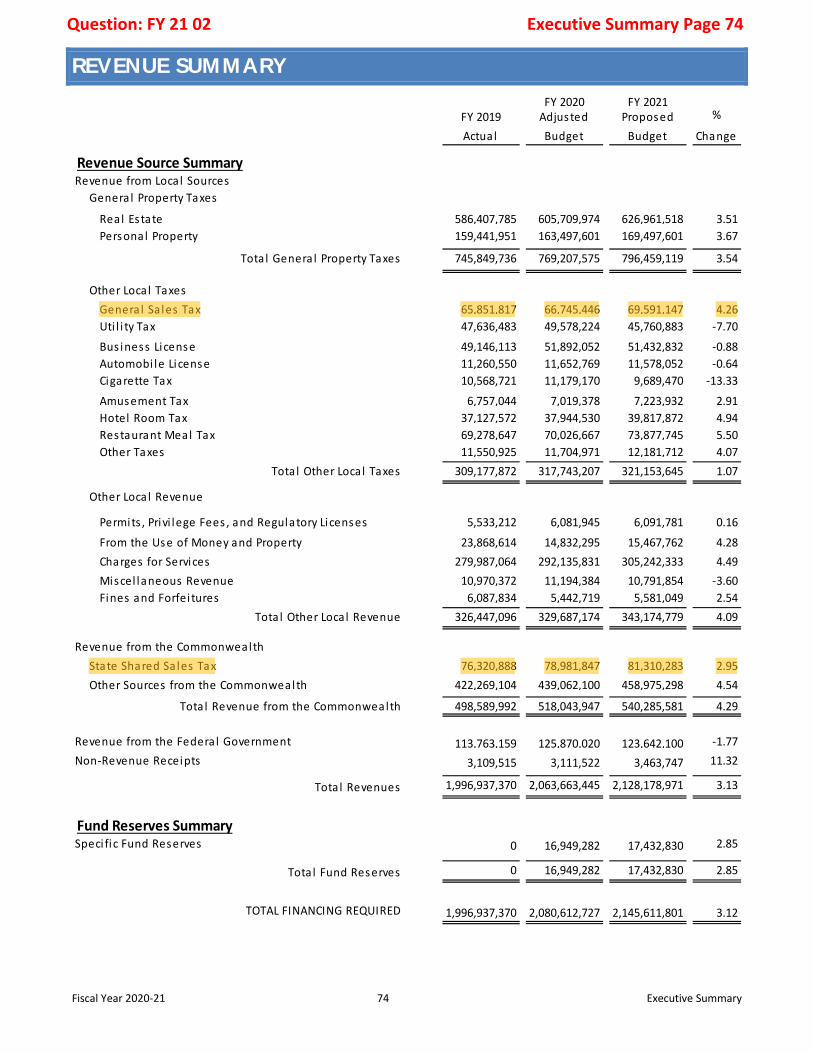
REVENUE SUMMARY
Actual Budget Budget Change
Real Es tate 586,407,785 605,709,974 626,961,518 3.51Personal Property 159,441,951 163,497,601 169,497,601 3.67
Genera l Sa les Tax 65,851,817 66,745,446 69,591,147 4.26Uti l i ty Tax 47,636,483 49,578,224 45,760,883 -7.70
Bus iness License 49,146,113 51,892,052 51,432,832 -0.88Automobi le License 11,260,550 11,652,769 11,578,052 -0.64Cigarette Tax 10,568,721 11,179,170 9,689,470 -13.33
Amusement Tax 6,757,044 7,019,378 7,223,932 2.91Hotel Room Tax 37,127,572 37,944,530 39,817,872 4.94Restaurant Meal Tax 69,278,647 70,026,667 73,877,745 5.50Other Taxes 11,550,925 11,704,971 12,181,712 4.07
309,177,872 317,743,207 321,153,645 1.07
Permits , Privi lege Fees , and Regulatory Licenses 5,533,212 6,081,945 6,091,781 0.16
From the Use of Money and Property 23,868,614 14,832,295 15,467,762 4.28Charges for Services 279,987,064 292,135,831 305,242,333 4.49Miscel laneous Revenue 10,970,372 11,194,384 10,791,854 -3.60Fines and Forfei tures 6,087,834 5,442,719 5,581,049 2.54
326,447,096 329,687,174 343,174,779 4.09
76,320,888 78,981,847 81,310,283 2.95422,269,104 439,062,100 458,975,298 4.54
498,589,992 518,043,947 540,285,581 4.29
1,996,937,370 2,080,612,727 2,145,611,801 3.12TOTAL FINANCING REQUIRED
0 16,949,282 17,432,830 2.85Tota l Fund Reserves
Fund Reserves SummarySpeci fic Fund Reserves 2.850 16,949,282 17,432,830
1,996,937,370 2,063,663,445 2,128,178,971 3.13Tota l Revenues
Non-Revenue Receipts 11.323,109,515 3,111,522 3,463,747
Revenue from the Federa l Government -1.77113,763,159 125,870,020 123,642,100
Revenue from the CommonwealthState Shared Sa les TaxOther Sources from the Commonwealth
Tota l Revenue from the Commonwealth
Other Loca l Revenue
Tota l Other Loca l Revenue
Other Loca l Taxes
Tota l Other Loca l Taxes
Revenue Source SummaryRevenue from Loca l Sources
Genera l Property Taxes
Tota l Genera l Property Taxes 745,849,736 769,207,575 796,459,119 3.54
FY 2020 FY 2021%FY 2019 Adjusted Proposed
Question: FY 21 02 Executive Summary Page 74
FY 2020-2021 Virginia Beach Budget Response to Council Questions
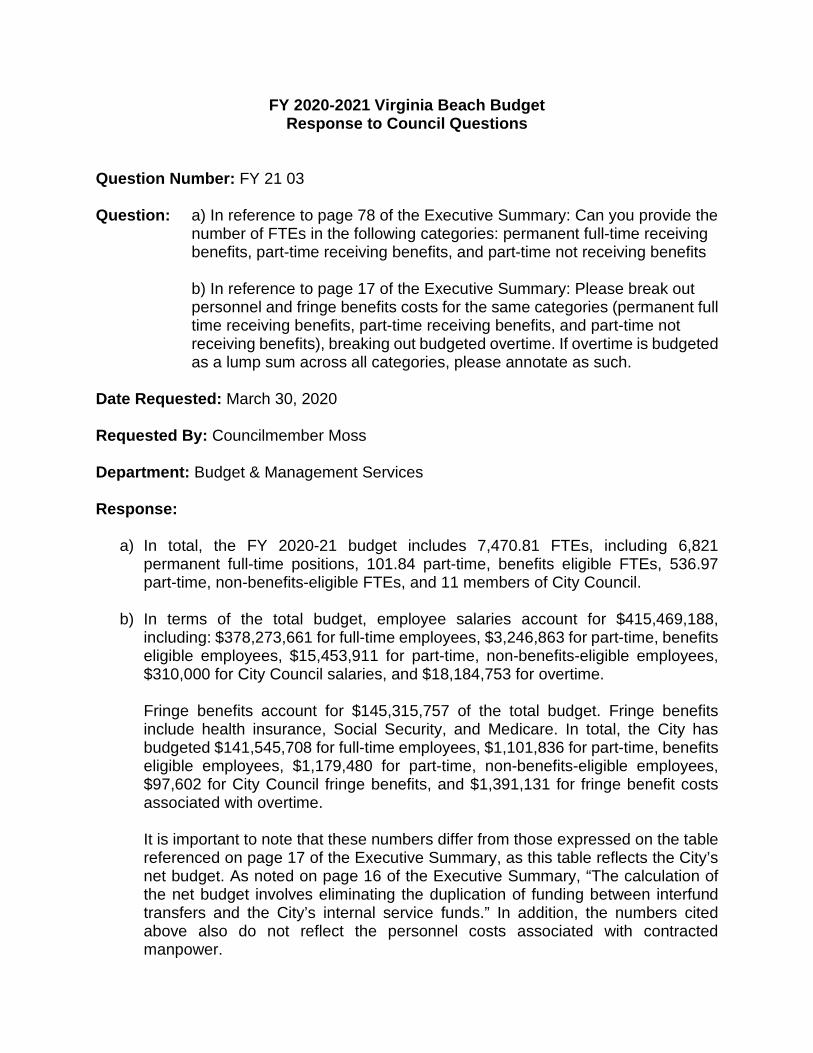
Question Number: FY 21 03
Question: a) In reference to page 78 of the Executive Summary: Can you provide the number of FTEs in the following categories: permanent full-time receiving benefits, part-time receiving benefits, and part-time not receiving benefits
b) In reference to page 17 of the Executive Summary: Please break outpersonnel and fringe benefits costs for the same categories (permanent fulltime receiving benefits, part-time receiving benefits, and part-time notreceiving benefits), breaking out budgeted overtime. If overtime is budgetedas a lump sum across all categories, please annotate as such.
Date Requested: March 30, 2020
Requested By: Councilmember Moss
Department: Budget & Management Services
Response:
a) In total, the FY 2020-21 budget includes 7,470.81 FTEs, including 6,821permanent full-time positions, 101.84 part-time, benefits eligible FTEs, 536.97part-time, non-benefits-eligible FTEs, and 11 members of City Council.
b) In terms of the total budget, employee salaries account for $415,469,188,including: $378,273,661 for full-time employees, $3,246,863 for part-time, benefitseligible employees, $15,453,911 for part-time, non-benefits-eligible employees,$310,000 for City Council salaries, and $18,184,753 for overtime.
Fringe benefits account for $145,315,757 of the total budget. Fringe benefitsinclude health insurance, Social Security, and Medicare. In total, the City hasbudgeted $141,545,708 for full-time employees, $1,101,836 for part-time, benefitseligible employees, $1,179,480 for part-time, non-benefits-eligible employees,$97,602 for City Council fringe benefits, and $1,391,131 for fringe benefit costsassociated with overtime.
It is important to note that these numbers differ from those expressed on the tablereferenced on page 17 of the Executive Summary, as this table reflects the City’snet budget. As noted on page 16 of the Executive Summary, “The calculation ofthe net budget involves eliminating the duplication of funding between interfundtransfers and the City’s internal service funds.” In addition, the numbers citedabove also do not reflect the personnel costs associated with contractedmanpower.

Question: FY 21 03 Page 2 of 2
Category FTE Count Salary Cost Fringe Benefit Cost Total Personnel Cost
Total Full-Time Employees 6821.00 $378,273,661 $141,545,708 $519,819,369
Total Part-Time - Benefits Eligible 101.84 $3,246,863 $1,101,836 $4,348,699
Total Part-Time - Not Benefits Eligible 536.97 $15,453,911 $1,179,480 $16,633,391
Total Overtime - Benefits Eligible 0.00 $17,985,894 $1,375,919 $19,361,813
Total Overtime - Not Benefits Eligible 0.00 $198,859 $15,212 $214,071
Total City Council Members 11.00 $310,000 $97,602 $407,602
Total Benefits Eligible Employees 6934.49 $381,830,524 $142,745,146 $524,575,670
Total Non-Benefits Eligible Employees 536.32 $15,453,911 $1,179,480 $16,633,391
TOTALS 7470.81 $415,469,188 $145,315,757 $560,784,945
FY 2020-2021 Virginia Beach Budget Response to Council Questions
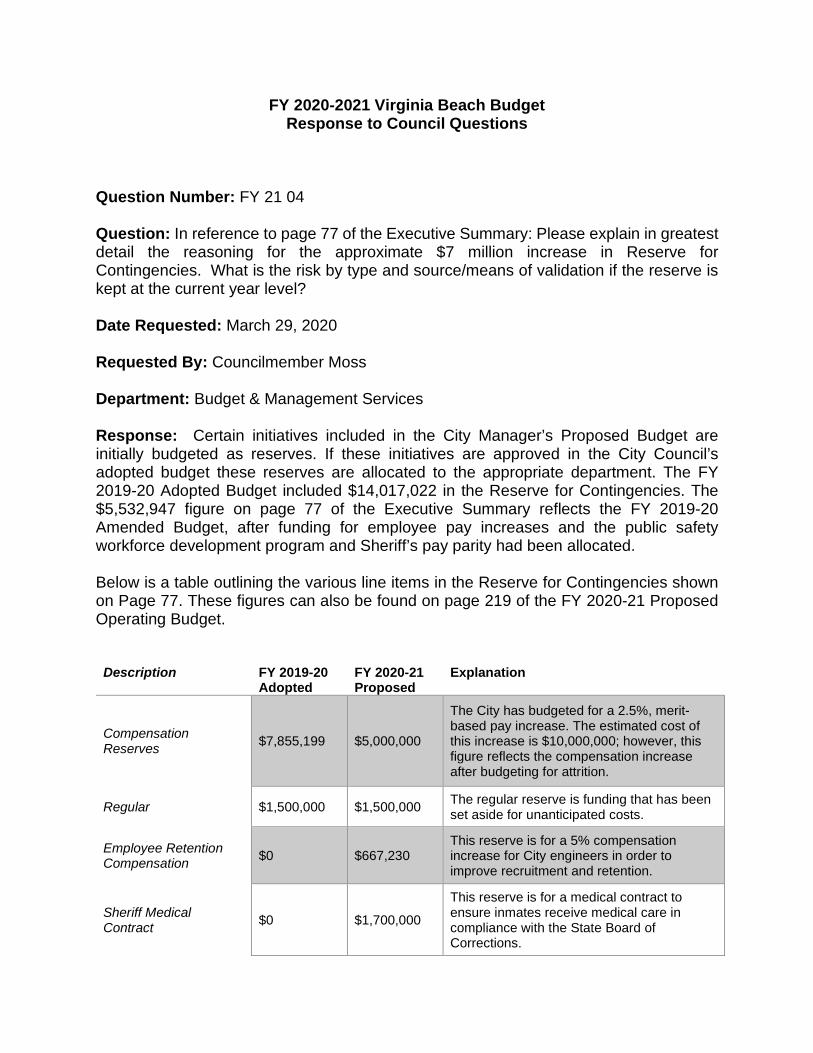
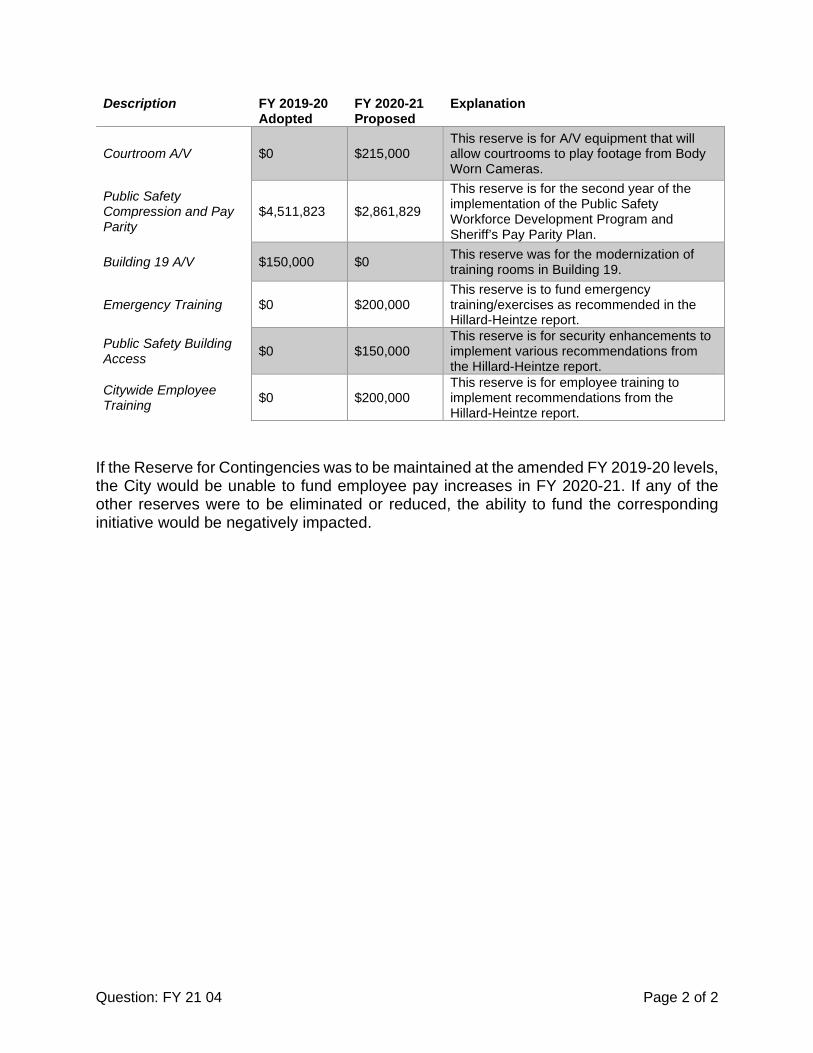
Question Number: FY 21 04 Question: In reference to page 77 of the Executive Summary: Please explain in greatest detail the reasoning for the approximate $7 million increase in Reserve for Contingencies. What is the risk by type and source/means of validation if the reserve is kept at the current year level? Date Requested: March 29, 2020 Requested By: Councilmember Moss Department: Budget & Management Services Response: Certain initiatives included in the City Manager’s Proposed Budget are initially budgeted as reserves. If these initiatives are approved in the City Council’s adopted budget these reserves are allocated to the appropriate department. The FY 2019-20 Adopted Budget included $14,017,022 in the Reserve for Contingencies. The $5,532,947 figure on page 77 of the Executive Summary reflects the FY 2019-20 Amended Budget, after funding for employee pay increases and the public safety workforce development program and Sheriff’s pay parity had been allocated. Below is a table outlining the various line items in the Reserve for Contingencies shown on Page 77. These figures can also be found on page 219 of the FY 2020-21 Proposed Operating Budget.
Description FY 2019-20 Adopted
FY 2020-21 Proposed
Explanation
Compensation Reserves $7,855,199 $5,000,000
The City has budgeted for a 2.5%, merit-based pay increase. The estimated cost of this increase is $10,000,000; however, this figure reflects the compensation increase after budgeting for attrition.
Regular $1,500,000 $1,500,000 The regular reserve is funding that has been set aside for unanticipated costs.
Employee Retention Compensation $0 $667,230
This reserve is for a 5% compensation increase for City engineers in order to improve recruitment and retention.
Sheriff Medical Contract $0 $1,700,000
This reserve is for a medical contract to ensure inmates receive medical care in compliance with the State Board of Corrections.
Question: FY 21 04 Page 2 of 2
Description FY 2019-20 Adopted
FY 2020-21 Proposed
Explanation
Courtroom A/V $0 $215,000 This reserve is for A/V equipment that will allow courtrooms to play footage from Body Worn Cameras.
Public Safety Compression and Pay Parity
$4,511,823 $2,861,829
This reserve is for the second year of the implementation of the Public Safety Workforce Development Program and Sheriff’s Pay Parity Plan.
Building 19 A/V $150,000 $0 This reserve was for the modernization of training rooms in Building 19.
Emergency Training $0 $200,000 This reserve is to fund emergency training/exercises as recommended in the Hillard-Heintze report.
Public Safety Building Access $0 $150,000
This reserve is for security enhancements to implement various recommendations from the Hillard-Heintze report.
Citywide Employee Training $0 $200,000
This reserve is for employee training to implement recommendations from the Hillard-Heintze report.
If the Reserve for Contingencies was to be maintained at the amended FY 2019-20 levels, the City would be unable to fund employee pay increases in FY 2020-21. If any of the other reserves were to be eliminated or reduced, the ability to fund the corresponding initiative would be negatively impacted.
FY 2020-2021 Virginia Beach Budget Response to Council Questions
Question Number: FY21 05 Question: In reference to page 77 of the Executive Summary: Was a risk assessment conducted to hold each department with an executable, not a “gold watch,” baseline at the current year, annualized execution rates? Date Requested: March 29, 2020 Requested By: Councilmember Moss Department: Budget & Management Services Response: As part of the City’s annual budget development process, each department’s projected General Fund salary/benefits and operating expenditure costs are estimated. The starting point for the projected operating expenditure accounts is the current year’s adopted budget; therefore, these accounts are not adjusted upwards for inflation or midyear cost increases. Depending on the estimated amount of General Fund revenue available to the City (assuming current tax rates and dedications), an overall percentage of estimated revenue as a proportion the projected baseline costs is calculated. The City’s Management Leadership Team (MLT) then reviews this calculation and sets a “target” rate for departments in the General Fund. For FY 2020-21, each department started the budget process with a baseline budget that was 98% of the projected requirement for FY 2020-21. Once budgets are submitted by departments, they are reviewed by Budget and Management Services staff for adherence to the established target rate. Throughout the process, each department’s operating account execution rate is carefully examined as requests for restoration of baseline funding and requests for new funding are considered by the MLT for inclusion in the Proposed Budget. It is not uncommon for departmental requests to be funded within current resources or for requests to be denied due to lower departmental execution of existing operating accounts.
FY 2020-2021 Virginia Beach Budget Response to Council Questions
Question Number: FY 21 06 Question: Page 76: What is the impact if Council decides not to appropriate the previously authorized increase in the Stormwater Management fee? As we all know no prior City Council can obligate a future Council. We also know, an authorization without an appropriation has no effect. If City Council were to decide to supplant the fee with unrestricted General Fund revenues, what are three possible scenarios of executable offsets to provide the necessary funding for flooding projects equal to the now proposed rate increase? Date Requested: March 29, 2020 Requested By: Councilmember Moss Department: Budget & Management Services / Public Works Response: In the FY 2019-20 Operating Budget, City Council approved a six-year, annual increase to the Stormwater Equivalent Residential Unit (ERU) fee. In FY 2020-21, the ERU is expected to increase from 49.3¢ daily, to 52.8¢, which will generate approximately $48.6 million, a $3.1 million increase from the current year. The revenue generated from the rate increase was entirely directed towards pay-as-you go in the Stormwater CIP. In order to reduce expenditures in the Stormwater fund in the amount of $3.1 million without reducing the amount provided to the CIP for flood control projects the following changes could be made:
1. Postpone the planned fall 2020 bond sale for the stormwater fund. This would equal $1.5 million in immediate savings but would later have to be addressed when the bonds are sold.
2. Reduce the fund’s reserves including the regular reserve for contingencies, the compensation reserves, and the engineer pay increase reserve. This would equal $720k in savings. In addition, the fund’s planned vehicle replacements in FY 2020-21 could be delayed one year, resulting in a $500,000 savings.
3. Reduce pay-as-you-go to the CIP fund in any amount and swap with bonds or fund balance as a funding source. Using additional debt will provide an immediate cash savings to the fund; however, the fund would have to account for future debt service when the bonds are issued. In FY 2020-21 stormwater pay-as-you- go is programmed at $25,591,818, fund balance is $1,500,000, and programmed bonds is $34,708,495.
Question: FY 21 06 Page 2 of 2
If City Council chose to suspend the ERU rate increases and not reduce the Stormwater Utility Fund’s Operating Budget or CIP, three possible scenarios are as follows:
1. Reduce the General Fund pay-as-you-go to non-Stormwater capital project(s) by $3.1 million and transfer to the Stormwater CIP. A full list of funded capital projects is included on pages 3-11 of the Capital Improvement Program document. Examples of projects with year one funding greater than $3.1 million include:
a. 3-315 Fire Apparatus IV- $3.2 million b. 3-714 Network Infrastructure Replacement III- $6.8 million c. 4-059 Southern Rivers Watershed Site Acquisition- $5.2 million
2. Postpone the hiring of additional water quality engineers and the stormwater
BMP maintenance crew to be funded by General Fund in FY 2020-21, and $1 million in associated new equipment to be funded by the stormwater fund. This equals a $1.5 million dollar savings between the two funds which could be redirected to the Stormwater CIP. The additional $1.6 million needed in the scenario could be funded through delayed or reduced non-Stormwater CIP projects.
3. Increase the use of fund balance as a one-time funding source to the Stormwater CIP from the General Fund, Agricultural Reserve Program, or Tourism Investment Program. This would not be sustainable long term, but could be used in one fiscal year, to backfill a delayed ERU rate increase.
Any changes to the CIP would have a “ripple through” effect on the operating budget, and no changes are made in isolation. For example, should the General Fund use additional fund balance, the unassigned fund balance as a percentage of next year’s revenues would decrease. In addition, increased use of bonds would increase future debt service payments. The fifteen-year Stormwater plan presented to Council in FY 2018-19 was predicated on the 3.5¢ rate increase through FY 2024-25.
FY 2020-21 Virginia Beach Budget Response to Council Questions
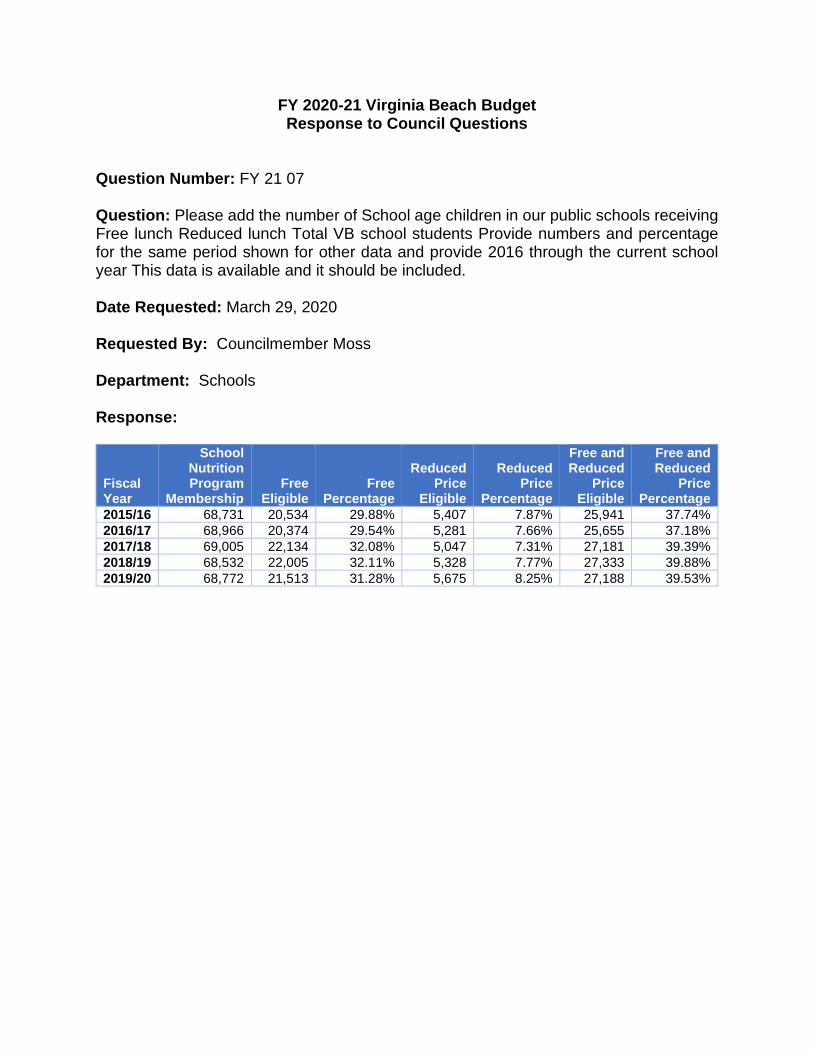
Question Number: FY 21 07 Question: Please add the number of School age children in our public schools receiving Free lunch Reduced lunch Total VB school students Provide numbers and percentage for the same period shown for other data and provide 2016 through the current school year This data is available and it should be included. Date Requested: March 29, 2020 Requested By: Councilmember Moss Department: Schools Response:
Fiscal Year
School Nutrition Program
Membership Free
Eligible Free
Percentage
Reduced Price
Eligible
Reduced Price
Percentage
Free and Reduced
Price Eligible
Free and Reduced
Price Percentage
2015/16 68,731 20,534 29.88% 5,407 7.87% 25,941 37.74% 2016/17 68,966 20,374 29.54% 5,281 7.66% 25,655 37.18% 2017/18 69,005 22,134 32.08% 5,047 7.31% 27,181 39.39% 2018/19 68,532 22,005 32.11% 5,328 7.77% 27,333 39.88% 2019/20 68,772 21,513 31.28% 5,675 8.25% 27,188 39.53%