Embed Size (px)
Citation preview
www.technopolis-group.com
July 2015
REF Accountability Review: Costs, benefits
and burden
Report by Technopolis to the four UK higher education funding bodies

REF 2014 Accountability Review: Costs, benefits and burden
technopolis |group|, July 2015
Kristine Farla
Paul Simmonds

i
Table of contents 1. Executive Summary 1 2. Introduction 4
2.1 This report 4 2.2 The Research Excellence Framework (REF) 4 2.3 Aims of the REF 2014 Accountability Review 5
3. The cost of REF 2014 6 3.1 The total cost of the exercise 6 3.2 Variation in costs over time 9 3.3 Variation in costs across HEIs 9 3.4 Limitations 10
4. A comparison of the REF and the RAE 12 4.1 Changes in REF arrangements as compared with RAE 2008 12 4.2 Comparison of REF 2014 costs with RAE 2008 15
5. REF cost drivers 18 5.1 Analysis of central costs 18 5.2 Analysis of costs at UOA level 19 5.3 Individual staff circumstances 21 5.4 Post-submission activity 22
6. Challenges of the REF submission 25 6.1 Management and coordination 25 6.2 Management information systems and institutional repositories 27 6.3 Mock REFs and external advisors 27
7. The benefits to HEIs of participating in the REF 29 7.1 The benefits of REF to HEIs 29 7.2 The benefits of REF as compared with those identified in RAE 2008 31
8. Lessons learned and recommendations 33 Appendix A Methodology 35 Appendix B Units of assessment 42 Appendix C Graphical presentation of sample analyses 43 Appendix D Definitions and assumptions 45 Appendix E Attributing costs to the REF 47

ii
Index of Figures Figure 1 Distribution of REF related costs over time (average of 18 HEIs) .................... 9 Figure 2 Total staff time spent preparing REF submissions, by sample HEI (staff weeks) ............................................................................................................................. 10 Figure 3 Changes from the RAE to the REF ................................................................... 13 Figure 4 REF 2014 vs RAE 2008, by REF element ........................................................ 14 Figure 5 REF cost drivers at the central level, distribution across HEIs ....................... 18 Figure 6 REF cost drivers at UOA level, distribution across HEIs ............................... 20 Figure 7 Challenges with post-submission/audit .......................................................... 22 Figure 8 Post-submission related to administrative matters, by HEI .......................... 23 Figure 9 Post-submission related to academic matters, by HEI ................................... 24 Figure 10 Challenges of the REF submission ................................................................ 26 Figure 11 Lessons learned ............................................................................................... 27 Figure 12 Benefits of the REF 2014 ............................................................................... 30 Figure 13 Sampling distribution of Category A staff FTE submitted ............................ 43 Figure 14 Sampling distribution by number of UOAs included in submission ............ 43 Figure 15 Sampling distribution by geographic region ................................................. 44 Figure 16 Proportion of central staff time/costs wholly attributable to REF, by HEI ... 47 Figure 17 Proportion of UOA review group and academic champion staff time/costs wholly attributable to REF, by HEI ............................................................................... 48 Figure 18 Proportion of support staff time/costs wholly attributable to REF, by HEI 48 Figure 19 Proportion of submitted academic staff time/costs wholly attributable to REF, by HEI ................................................................................................................... 49 Figure 20 Proportion of ‘not submitted’ eligible academic staff time/costs wholly attributable to REF, by HEI ........................................................................................... 49

iii
Index of Tables Table 1 REF 2014 cost estimates ...................................................................................... 6 Table 2 Total cost estimates by main cost element .......................................................... 7 Table 3 Breakdown of total estimated central management costs related to the REF (excluding costs of contracting external consultants and excluding costs related to impact assessment) ........................................................................................................... 8 Table 4 RAE and REF Accountability Reviews; major differences in approach ........... 15 Table 5 Comparison of the cost of the REF 2014 and the RAE 2008 (excluding impact assessment) ..................................................................................................................... 16 Table 6 Additional activities at the UOA level relevant to the REF ............................... 21 Table 7 Sample population ............................................................................................. 36 Table 8 Example: monetising labour time for a Professor ............................................ 38 Table 9 Convergence table for monetising labour time ................................................. 39 Table 10 UOAs in REF 2014 ........................................................................................... 42 Table 11 Assumptions used in data collection ................................................................ 45 Table 12 Definitions ........................................................................................................ 46

iv
Acknowledgements We are most grateful for the support received from Pro Vice Chancellors or their equivalents, REF Managers and other staff at the 20 universities and colleges that supported the data collection for the study. In addition, the study benefited greatly from the advice and comments of Dr Ian Carter, Director of Research and Enterprise at the University of Sussex. We also thank the HEFCE steering group for their critical reflections and the many data provided to the team to help contextualise the results.

1
1. Executive Summary
Introduction
This report presents the results of the REF 2014 Accountability Review, which has considered the costs, benefits and burden for HEIs of submitting to the Research Excellence Framework (REF). The review includes consideration of the new impact element of the REF, making use of RAND Europe’s parallel evaluation of the impact submission process published by HEFCE in late March 2015. It has sought to establish whether and where there has been any significant change compared with RAE 2008, as detailed in the report of the RAE Accountability Review (2009).1
The review entailed a comprehensive analysis of institutional costs for a carefully constructed sample population of 20 UK HEIs, covering all staff-related costs and related expenditure, both centrally and at the unit of assessment (UOA) level. The cost analysis was informed by a survey of REF Managers to gauge the relative importance of different costs and benefits as well as a series of interviews with Pro Vice Chancellors (PVCs) for Research, or their equivalents, to obtain a more strategic overview of the submission process.
Analysis of costs and cost drivers
The total cost to the UK of running REF 2014 is estimated to be £246M. That comprises around £232M in costs to the higher education (HE) community and around £14M in costs for the four UK higher education funding bodies.2 The cost to the HE community comprised around £212M for the submission process and around £19M for panellists’ time. The £212M cost of preparing the REF submissions comprises an element for preparing impact submissions,3 £55M, and an element for all other costs incurred by HEIs, £157M. This £212M may include double-counting, reflecting the challenge for sample HEIs in distinguishing additional REF-related costs from 'business as usual' (i.e. the underlying cost of managing research quality) and the difficulty to confidently separate the costs related to their impact submission from all REF-related costs. The £212M cost to the UK HE community overall yields a cost per submitted researcher of around £4K, which equates to close to 1% of the submitted researchers’ basic salary plus on-costs over a six-year period.
The REF assessed the outputs and impact of HEI research supported by many types of funders. In the context of £27bn total research income from public sources in the UK over a six-year period, the £246M total cost for REF 2014 is less than 1%. In the context of dual support, the total cost amounts to roughly 2.4% of the £10.2 billion in research funds expected to be distributed by the UK’s funding bodies in the six years, 2015-16 to 2020-21. This compares with an estimate of the annual cost to the UK HE community for peer review of grant applications of around £196M or around 6% of the funds distributed by the Research Councils.4
Comparing the cost of REF 2014 with that of RAE 2008 is not straightforward, given the introduction of a wholly new strand to evaluate the non-academic impact of research and the introduction of numerous refinements, some designed to simplify the submission process, others to improve its robustness and equity. Along with the introduction of impact, the strengthening of equality and diversity measures, in
1 PA Consulting (2009). RAE 2008 Accountability Review. 2 The four funding bodies are: the Higher Education Funding Council for England (HEFCE), the Scottish
Funding Council (SFC), the Higher Education Funding Council for Wales (HEFCW), and the Department for Employment and Learning (DEL), Northern Ireland.
3 RAND (2015). Preparing impact submissions for REF 2014: An evaluation. Approach and evidence. 4 Report of the Research Councils UK Efficiency and Effectiveness of Peer Review Project, October 2006.

2
relation to individual staff circumstances, has quite reasonably increased the total cost of submission for most HEIs. Several sample HEIs noted separately that the refinements in the REF submission process had resulted in a decrease in those aspects of their costs.
This review used a detailed and more comprehensive approach, attempting to identify a fuller set of costs to institutions. In order to fairly compare the cost of REF 2014 with the cost of RAE, we reassessed the cost estimate for the RAE 2008 exercise. Taking account of the difference in geographic coverage of the two Accountability Reviews excludes the cost of impact assessment, adjusts for macroeconomic changes and makes comparable on-cost assumptions. Using an adjusted estimate of the cost for RAE 2008 (£66M), we estimate that the cost of submitting to the last RAE was roughly 43% of the cost of submitting to the REF. We believe the more detailed and comprehensive approach used for the 2014 Accountability Review explains a substantial part of the difference in the estimated costs of REF 2014 and RAE 2008.
The REF 2014 Accountability Review highlighted the following:
• There is considerable variation in costs and drivers across HEIs. This is partly explained by differences in institutions’ size and the number of UOAs submitted, and also reflects differences in the scope and sophistication of institutional research information systems
• Several sample HEIs elected to run mock REFs in order to ensure they were able to make the strongest possible submissions, which was a significant cost. Not all HEIs chose to do so
• Most of the HEIs used external advisors, so-called ‘critical friends’, to help calibrate internal judgements and ensure the best submissions. Not all chose to do so, and where ‘critical friends’ were involved they were engaged in different ways and to varying degrees
• The main cost driver at both the central management level and the UOA level was the REF element on research outputs, which included time spent reviewing and negotiating the selection of staff and publications
• On average, less than 2% of institutions’ time spent was dedicated to post-submission and audit
• The improvements in the treatment of individual staff circumstances were welcomed by all HEIs, however, this was a disproportionately costly element of the overall process, and was considered cumbersome by several of the sample HEIs
Benefits
This Accountability Review included a review of the key benefits HEIs seek from participation in REF. Most PVCs and REF Managers reported several similar and important institution-level benefits:
• PVCs highlighted a major reputational dividend from participation in the REF
• PVCs and REF Managers find that submitting to the REF yields strategic intelligence about institutional and departmental performance, through external scrutiny and benchmarking, which complements ongoing performance management
• The impact element was wholly new for most and yielded tremendous insight into each institution’s wider social and economic achievements and was widely

3
welcomed as both a platform for marketing and internal learning (see also RAND, 2015)5
Other benefits identified include: the impetus to develop improved institutional research management systems, improved marketing and promotional material, improved awareness of equality and diversity issues, additional income secured as a result of the REF, improvements in student and staff recruitment, the launch of new strategic partnerships and the strengthening of links with other partners.
Recommendations
Several PVCs and REF Managers stressed the importance for the funding bodies (to continue) to recognise and reward excellence wherever it is found. Large research-intensive institutions generally perform most strongly in the REF but the REF also provides visibility to islands of excellence.
PVCs and REF Managers generally thought the REF 2014 guidance was good and complimented the central REF team (hosted at HEFCE) for their work in running a good process and their responsiveness to ad hoc queries; a number of recommendations were also made for future exercises. These included recommendations on increasing the transparency of evaluation criteria, a revision of definitions and (simplification of) conditions around personal circumstances, early career researchers, independent researchers and multiple-authorship. PVCs and REF Managers are genuinely supportive of the impact agenda, but some also recommended a revision to the impact model. Some additional suggestions were made to help lessen the administrative burden. At the same time, PVCs and REF Managers recommended maintaining consistency in the REF submission procedure.
5 RAND (2015). Preparing impact submissions for REF 2014: An evaluation. Approach and evidence.

4
2. Introduction
2.1 This report
This report presents the results of the REF 2014 Accountability Review, which has considered the costs, benefits and burden for HEIs of submitting to the Research Excellence Framework (REF). The review includes consideration of the new impact element of the REF, making use of RAND Europe’s parallel evaluation of the impact submission process published by HEFCE in late March 2015. It has sought to establish whether and where there has been any significant change compared with RAE 2008, as detailed in the report of the RAE Accountability Review (2009).6
Technopolis was commissioned to undertake the REF 2014 Accountability Review in November 2014, with work to commence in December 2014 immediately following the announcement of the REF results. It was commissioned at this point to ensure the currency and accuracy of the information gathered from HEIs and to contribute towards the policy development for future REF exercises.
The review entails a comprehensive analysis of institutional costs for a carefully constructed sample population of 20 UK HEIs, covering all staff related costs and related expenditure, both centrally and at the unit of assessment (UOA) level. However, this review does not include an estimate of non-time related burdens on staff, such as the stress on staff arising from whether they would be selected for the REF. The cost analysis was complemented by a survey of REF Managers to gauge the relative importance of different costs and benefits and a series of interviews with Pro Vice Chancellors for Research to obtain a more strategic overview of the submission process.
2.2 The Research Excellence Framework (REF)
The REF is the UK’s national system for assessing the quality of research in UK higher education institutions (HEIs). It is conducted jointly by the four UK higher education funding bodies, and is managed by the REF team on their behalf. The REF replaces the Research Assessment Exercise (RAE), which was last run in 2008.
The primary purpose of the REF is to produce assessment outcomes for each submission made by institutions, enabling the following uses:
• The funding bodies use the assessment outcomes to inform the selective allocation of their research funding to HEIs, with effect from 2015-16
• The assessment provides accountability for public investment in research and produces evidence of the benefits of this investment
• The assessment outcomes provide benchmarking information and establish reputational yardsticks
The REF is a process of expert review. Expert sub-panels for each of 36 UOAs carried out the assessment, working under the leadership and guidance of four main panels. Submissions to the exercise were completed in November 2013 and the results were published in December 2014.7 It is a large system, with more than 150 institutions submitting 191,950 research outputs, around 52,061 FTE staff and around 7,000 impact case studies.
The REF has developed through an evolutionary process, building on the experiences of the RAE 2008, which in turn built on feedback and lessons learned from each of the previous RAEs all the way back to the first exercise in 1986. With every successive
6 PA Consulting (2009). RAE 2008 Accountability Review. 7 Further information on the REF is available at: www.ref.ac.uk.

5
assessment exercise a balance has to be struck between continuity and development. Changes new to REF 2014 follow from extensive review and consultation, and have been adopted where it is judged they can bring demonstrable improvements which outweigh the cost of implementing them.
The cost and burden of the REF should be the minimum possible to deliver a robust and defensible process. Previous RAEs have been highly cost-effective given the value of public funds distributed through their outcomes (including the estimated cost to HEIs). For example, the funding bodies estimated the costs of the 2008 RAE in England to be some 0.5% of the value of public research funding that was subsequently allocated with reference to its results.
2.3 Aims of the REF 2014 Accountability Review
This report presents the findings of the Accountability Review organised around the aims and objectives of the review, which were to produce:
• An estimated total cost of the exercise to the sector as a baseline for assessing the impacts of changes from future REF arrangements and as a comparison with previous exercises
• An assessment of the activities that generate REF-related costs for institutions, presented in the context of those institutions’ normal ('business as usual') quality assurance and quality management arrangements for research
• An estimate of the proportion of the total time spent that is attributable to activity on individual staff circumstances for the REF
• An overview of what staff and other resources institutions have devoted to their REF returns
• A review of the key benefits HEIs seek from participation in REF, compared with those identified in RAE 2008

6
3. The cost of REF 2014
3.1 The total cost of the exercise
The total cost to the UK of running REF 2014 is estimated to be £246M (see Table 1). That comprises around £232M in costs to the higher education (HE) community and around £14M in costs for HEFCE and the other funding bodies (94%:6%). The cost to the HE community comprised around £212M for the submission process and around £19M for panellists (92%:8%). The £212M cost of preparing the REF submissions comprised around £157M for the costs for all elements of the submission other than the impact statements and impact case studies and £55M for the impact submission (74%:26%).
Table 1 REF 2014 cost estimates8
Cost item Estimated cost
Annualised over 6 years
1. Cost to funding bodies £14M £2M 2. Cost to HE community (panellists) £19M £3M 3. Cost to HE community (impact) £55M £9M 4. Cost to HE community (non-impact) £157M £26M 5. Cost to HE community (submission) [Item 3 + Item 4] £212M £35M
6. Cost to HE community (submission and panellists) [Item 2 + Item 5] £232M £39M
7. Total cost to UK (Item 1 + Item 6) £246M £41M
• The cost to the funding bodies of running the REF is around £14M.9 This comprises running costs of £4.1M and programme costs of £10.3M. Running costs include REF team staff costs in the HEFCE office. Programme costs are cash costs and include for example venue costs, secretariat fees, panel member fees and costs for the REF warehouse. The costs also include the impact pilot costs but exclude the bibliometric pilot costs.
• The cost to the UK HE community of panel members’ time is estimated at £19M (excluding panel members fees, which are included in the estimate of costs to the funding bodies). This cost excludes the time spent by impact assessors because, for the most, they were employed outside academia and therefore their cost estimate is outside the scope of this Review. We were not in a position to estimate the time spent by impact assessors but RAND have produced an estimate of time spent by these panellists, which could inform cost estimates of other studies.10
• The cost to the UK HE community of the REF impact assessment process is estimated at £55M overall.11 RAND estimate that the median cost per impact case study was around £7,500 and the median cost per impact template was around £4,500.
• The cost to the UK HE community of submitting to REF 2014 (excluding the impact assessment) is estimated at £157M.
The REF assessed the outputs and impact of HEI research supported by many types of funders. In the context of £27bn total research income from public sources in the UK
8 Total cost estimates are rounded to the nearest £M to avoid presenting a spurious degree of accuracy. 9 Information provided to Technopolis by HEFCE. 10 See Appendix A, ‘Scaling up costs’ for further detail. 11 RAND (2015). Preparing impact submissions for REF 2014: An evaluation. Approach and evidence.

7
over a six-year period,12 the £246M total cost for REF 2014 is less than 1%. The total amount of recurrent and capital research funding that is informed by the REF outcomes for the four funding bodies is £1,698M for the academic year 2015-16.13 Assuming that for the years 2015-16 to 2020-21 annual research funding remains at the same level, the £246M cost to the UK amounts to around 2.4% of the £10,188M14 in research funds disbursed. This compares with an estimate of the annual cost to the UK HE community for peer review of around £196M and around 6% of the funds distributed by the Research Councils (2005-6).15
Looked at from another perspective, the average cost per submitted researcher is estimated to amount to roughly £4K (see Table 2). £4K is close to 1% of the submitted researchers’ basic salary plus 30% on-costs over a six-year period. The three major cost elements are central management and coordination (21%), the UOA review groups (36%) and the cost of preparing the impact statements and case studies (26%).
Table 2 Total cost estimates by main cost element16
Cost elements Estimated cost
Annualised over 6 years
As a percentage
of total submission
cost Central management and coordination £44M £7M 20.7%
Other central costs, non-pay £2M <£1M 0.9% UOA review groups and academic champions £76M £13M 35.8%
UOA support staff £8M £1M 3.8% Submitted academic staff £17M £3M 7.9% Other eligible academic staff (not submitted) £4M £1M 1.9%
Other staff or consultants (‘critical friends’) £6M £1M 2.9%
Cost of efforts involved with deciding to not submit to given UOAs
<£1M <£1M 0.2%
Cost for impact statements and case studies (RAND 2015) £55M £9M 25.9%
Total cost (submission) £212M £35M - Average cost per Cat A staff submitted (55,766 staff) £4K £1K -
At the UOA level total costs amount to roughly £166M; £111M when excluding impact. Roughly 87% of the £111M costs can be attributed to UOA review groups and academic champions and to submitted and not submitted academic staff. Academic staff also
12 Research income from public sources in publicly-funded UK HEIs in 2013-14 was £4,513M. £27bn represents £4,513M multiplied by six years.
13 The £1,698M figure includes data from HEFCW capital funding figures for the year 2014/15. All other recurrent and capital data are for the year 2015/16.
14 The £10,188M research funding represents £1,698M multiplied by six years. 15 Report of the Research Councils UK Efficiency and Effectiveness of Peer Review Project, October 2006. 16 Total cost estimates are rounded to the nearest £M to avoid presenting a spurious degree of accuracy.
Average cost per Cat A staff submitted is rounded to the nearest £K. In order to maintain comparability with our total cost estimate, costs are weighted by the number of submitted Category A academics in our sample relative to the number of academics in the population (see the section on methodology and scaling up costs in the Appendix).

8
spent time at the central level overseeing the REF submission process, on deciding which UOAs to include/ exclude from the submission, and as ‘critical friends’.
Table 3 Breakdown of total estimated central management costs related to the REF (excluding costs of contracting external consultants and excluding costs related to impact assessment)17
Cost elements Estimated cost
Annualised over 6 years
As a percentage of total central cost
REF project management team: Senior-grade professional £13M £2M 27%
REF project management team: Middle-grade professional £10M £2M 21%
REF project management team: Junior-grade professional £4M £1M 8%
Staff time within other parts of central services (e.g. research services, academic registry, planning office, etc.)
£6M £1M 13%
ICT staff time £2M <£1M 4% HR staff time £1M <£1M 3% Senior academic staff (e.g. time spent by the members of the institutional REF steering committee in overseeing the process)
£8M £1M 18%
Other staff contributions £1M <£1M 2% Total central costs (staff time) £44M £7M 96% Cost of ICT system extensions or upgrades necessitated by REF, which would not have happened otherwise and which was not included in the REF budget
£1M <£1M 2%
Cost of new software purchases/licences necessitated by REF, which would not have happened otherwise and which was not included in the REF budget
£1M <£1M 2%
Other REF related expenditures <£1M <£1M 1% Total central costs (non-pay) £2M <£1M 4% Total central management costs £46M £8M -
Central costs (excluding the costs of contracting external consultants and excluding central costs related to impact assessment) comprise around £46M or 22% of the total £212M REF-related submission costs. Those central costs include a mixture of different cost items, a breakdown of which is presented in Table 3. Each cost element is shown as a financial value and as a share of the estimated central costs. The table also summarises staff costs (£44M) and non-pay costs (£2M), which comprise 96% and 4% of total central costs respectively. The median number of staff on the REF project management team was five staff members. On average, a REF project management team cost around £26M in staff time or around 56% of total central management costs for the REF. In addition, a substantial proportion of central costs (approximately 18%) relate to the work of senior academic staff as members of the
17 Total cost estimates are rounded to the nearest £M to avoid presenting a spurious degree of accuracy.
9
institutional REF steering committee overseeing the process. The median number of staff members that made a contribution here was 10; the number of staff members varies widely and is positively correlated to the number of UOAs included in each HEI’s submission.
3.2 Variation in costs over time
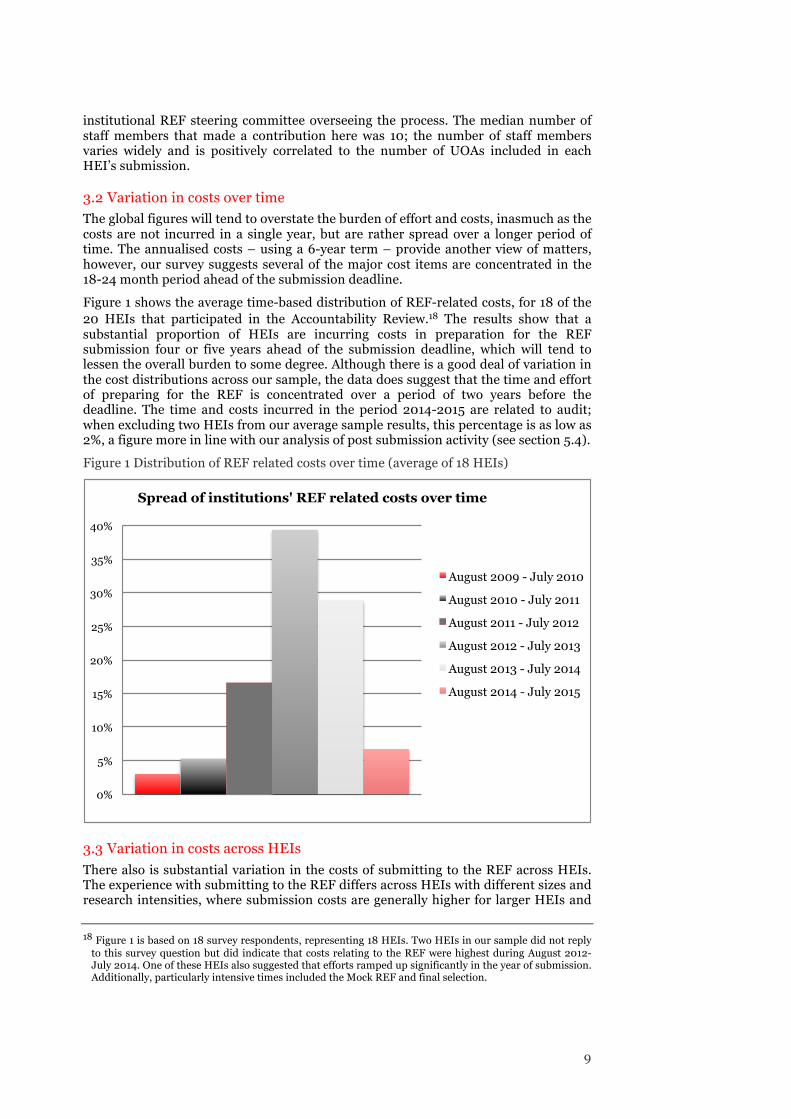
The global figures will tend to overstate the burden of effort and costs, inasmuch as the costs are not incurred in a single year, but are rather spread over a longer period of time. The annualised costs – using a 6-year term – provide another view of matters, however, our survey suggests several of the major cost items are concentrated in the 18-24 month period ahead of the submission deadline.
Figure 1 shows the average time-based distribution of REF-related costs, for 18 of the 20 HEIs that participated in the Accountability Review.18 The results show that a substantial proportion of HEIs are incurring costs in preparation for the REF submission four or five years ahead of the submission deadline, which will tend to lessen the overall burden to some degree. Although there is a good deal of variation in the cost distributions across our sample, the data does suggest that the time and effort of preparing for the REF is concentrated over a period of two years before the deadline. The time and costs incurred in the period 2014-2015 are related to audit; when excluding two HEIs from our average sample results, this percentage is as low as 2%, a figure more in line with our analysis of post submission activity (see section 5.4).
Figure 1 Distribution of REF related costs over time (average of 18 HEIs)
3.3 Variation in costs across HEIs
There also is substantial variation in the costs of submitting to the REF across HEIs. The experience with submitting to the REF differs across HEIs with different sizes and research intensities, where submission costs are generally higher for larger HEIs and
18 Figure 1 is based on 18 survey respondents, representing 18 HEIs. Two HEIs in our sample did not reply to this survey question but did indicate that costs relating to the REF were highest during August 2012-July 2014. One of these HEIs also suggested that efforts ramped up significantly in the year of submission. Additionally, particularly intensive times included the Mock REF and final selection.
0%
5%
10%
15%
20%
25%
30%
35%
40%
Spread of institutions' REF related costs over time
August 2009 - July 2010
August 2010 - July 2011
August 2011 - July 2012
August 2012 - July 2013
August 2013 - July 2014
August 2014 - July 2015

10
for more research-intensive HEIs. Both are related to the number of departments/UOAs involved in the submission, which also influences the variation in time spent across HEIs.
Figure 2 shows the total staff time, in number of staff weeks (1 week = 37.5 hours) that each of the 20 sample HEIs spent on preparing their REF submission, split between central and UOA levels. On average, (across HEIs) the time spent amounts to 985 weeks, however, some HEIs spent less than 100 weeks while others spent more than 2,500 on their submission. This variation does not simply reflect differences in institutional size. At some HEIs more than half of this total time is spent at the central level. At other HEIs central time spent is only a small fraction of the total time. Several of the smaller HEIs spent substantial time preparing the submission at the central level relative to the time spent at the UOA level. At such HEIs, central management bears a relatively larger cost. For example, one HEI submitted to only a few UOAs and our interviewee noted that most of the REF-related activity was managed centrally. On average, roughly a third of the total time spent on the REF is part of central costs.
Figure 2 Total staff time spent preparing REF submissions, by sample HEI (staff weeks)
3.4 Limitations
In order to produce a cost estimate of the REF we asked REF Managers to include only that fraction of their costs that was wholly attributable to REF, and would not otherwise have been incurred, i.e. the incremental costs. These cost items, for example, include fixed-term appointments to the REF team, made necessary by virtue of the extent of the required submissions and the critical importance for each HEI of achieving the best possible result.
The cost of the REF cited in this study remains an estimate. Our estimate is based on the input kindly provided by our interviewees and survey respondents, who in turn have had to make several assumptions and approximations. Overall, we find that attributing a cost to the REF is subject to several possible issues:
-
500
1,000
1,500
2,000
2,500
3,000
Total time: numbers of weeks spent preparing the REF submission, by HEI
Time spent at the UOA level Time spent at the central level

11
• In producing our cost estimate we have assumed that our sample of HEIs is representative of the population of 154 HEIs in the UK that submitted to the REF. Given the small sample size (20) and the high correlation between costs and size, we have scaled-up costs using the number of submitted researchers as a reference. Overall, our sample and method to scale-up may have resulted in an underestimation or an overestimation of costs.
• There is some difficulty with splitting costs between REF-related costs and normal ('business as usual') quality assurance and quality management arrangements for research. Sometimes, this is also related to the difference in ‘compliance costs’ and costs related to ‘overinvesting’ in the REF to help secure (an increase in) funding. As illustrated by the figures in Appendix E, some of the HEIs included in our sample may not have been able to fully isolate costs incurred that were wholly attributable to their REF submission from costs incurred as part of ‘business as usual’.
• There is some difficulty in separating the costs of the ‘impact’ submission from the ‘rest’ of the REF and several survey respondents state that they were unable to fully exclude the time spent on their impact submissions, especially as the impact case studies influenced staff selection decisions. On occasion, time spent on activities related to impact assessment was reported, e.g. in relation to impact pilots (see Section 5.1). Moreover, the cost analysis of the impact submission process conducted by RAND includes the cost of purchasing new databases and other IT investments some of which were relevant to the wider REF submission. Overall, running two cost analyses of what is often an integrated process may have caused some double counting and a slight overestimation in the total combined costs.
• Our estimations are based on the assumption that some of the time spent on the REF was spent working ‘overtime’ (see Appendix A). Although some of our interviewees and survey respondents noted that part of the submission was prepared working overtime, the proportion of overtime incurred is uncertain and this may have resulted in an underestimation or in an overestimation of costs.

12
4. A comparison of the REF and the RAE
4.1 Changes in REF arrangements as compared with RAE 2008
Comparing the cost of the REF 2014 with that of the RAE 2008 is not straightforward, given the introduction of a wholly new strand to evaluate the non-academic impact of research and the introduction of numerous refinements, some designed to simplify the submission process, others to improve its robustness and equity.
The main changes are listed below:
• Introduction of impact assessment
• Reduction in the number of UOAs, from 67 to 36
• Greater consistency in the assessment process across all UOAs
• Revision of definition of category A and C staff (and omission of category B and D staff)
• Use of citation information in certain sub-panels
• Omission of 'Esteem' as an element of the submission process and assessment
• Introduction of a template to support the presentation of the research environment and use of Higher Education Statistics Agency (HESA) data in the Environment statement
• Strengthened measures to promote equality and diversity
• Appointment of additional assessors for the assessment phase
• Outcomes of the assessment published in steps of 1% (and 0.1% for the sub-profiles)
• Additional guidance to institutions with respect to the submission process
Figure 3 illustrates the degree to which our survey respondents perceived that these changes influenced the cost of submission. Interviewees and survey respondents suggested REF was more costly than RAE mainly because of the inclusion of the strand to evaluate the non-academic impact of research. Impact assessment was judged by all interviewees to have been particularly challenging as this was the first time such an exercise had been attempted and institutions had to work hard to understand and master the requirements and, critically, evidence of impact had not been collected previously and do so retrospectively entailed substantial effort to identify and trace relevant material. As a result of the impact assessment exercise, we find that some HEIs have moved to implement new procedures whereby their staff will begin to record and report notable outcomes on an on-going basis, which may make it somewhat easier to substantiate impact case studies for future exercises.19
The strengthening of equality and diversity measures, e.g. information required in relation to individual staff circumstances (in particular the arrangements for submitting complex circumstances and early career researchers), likewise increased the cost of submission for most HEIs in our sample.
Overall, our findings evidence that the introduction of impact and the strengthened measures to promote equality and diversity appear to have increased the cost of submitting to the REF. However, there are also a number of changes from the RAE to
19 At the same time, according to RAND (2015), one-off costs are a small proportion of the total costs of the impact assessment.

13
the REF that may have resulted in a decrease in costs. Alternatively, one interviewee suggested that, other than the change in impact and special staff circumstances, there was no substantial difference in cost between the RAE and the REF. Another argued that there had been good continuity from RAE to REF.
There were mixed views as regards the changes made to the presentation of ‘research environment’ within the overall submission, with several contributors noting that the environment statement had become more important within the REF and therefore greater effort had to be devoted to collecting information and crucially drafting a persuasive statement. By contrast, others noted the reduction in effort required to compile the supporting evidence as a result of the decision to use standard HESA data, which was widely welcomed, although this data could possibly be organised in an even more systematic way.
Figure 3 Changes from the RAE to the REF
There were likewise mixed views on whether the introduction of a template was entirely positive. One interviewee argued that the environment template was a worthwhile improvement and simplification because it was more structured. While another interviewee suggested that the Environment template had become too prescriptive in its information requirements and should be redesigned allowing more flexibility to tell a story.
Similarly, there were differences in opinion as to the costs or benefits of the decision to allow the ‘flexible’ use of citation information by sub-panels, which meant that most HEIs felt obliged to consider bibliometrics in their decision making about which publications to submit. It takes more time to collect and analyse more data, and the use of metrics was not systematic, especially in disciplines where initial confusion existed around the use of either Google Scholar or Scopus.
The omission of 'Esteem' from the assessment process was generally welcomed and was noted as either decreasing the cost of submission or as having no effect. One reason why survey respondents indicated ‘no change in costs,’ is that Esteem was still addressed indirectly as part of the Environment Statement, via the ‘contribution to the
0% 20% 40% 60% 80% 100%
Inclusion of strand to evaluate the non-academic impact of research
Strengthened measures to promote equality and diversity
Appointment of additional assessors for the assessment phase
Outcomes of the assessment published in steps of 1%
Use of citation information in certain sub-panels
Additional guidance to institutions w.r.t. submission process
Introduction of a template to assess the research environment
Reduction in the number of UOAs, from 67 to 36
Greater consistency in the assessment process across all UOAs
Omission of 'Esteem' as an element of assessment
Revision of definition of Category A and C staff (omission of Category B and D staff)
To what extent are there institutional cost implications of each of the major changes made to REF2014, as compared with RAE2008?
Substantial increase in cost (more than 20%) Moderate increase in cost (less than 20%)
No impact on cost Moderate decrease in cost (less than 20%)
N/A

14
discipline’ section, which tended to have esteem-like content, and also as part of impact statement, even if this was not explicit. There were numerous suggestions to the effect that the impact statement should become part of the environment statement in future REFs, or otherwise omitted.
The reduction in the number of UOAs, from 67 to 36, to some extent led to a decrease in costs and this change was generally welcomed. This, administratively, produced a major benefit and made it easier to deal with disciplines in which the numbers of researchers are smaller at given HEIs. The downside of the restructuring is that the HEI received feedback at a higher level of aggregation and that the RAE scores of (groups of) departments lack comparability with the REF scores.
For some of these changes respondents noted that it was difficult to determine if the reduction of UOAs had any positive/negative impact on cost. This, for instance, also depends on the degree to which different schools and departments align naturally with a given UOA or require some level of internal negotiation as to which staff or research groups should be submitted to what UOA. This appears to affect larger institutions, as they touch more UOAs, and are more likely to have had to merge departments into single UOA submissions, where sub-panels did not expect multiples. Where sub-panels considered there was a case for multiple submissions in the UOA it made no real difference.
Additionally, respondents suggested that the following changes had an impact on cost:
• Production and operation of Code of Practice (moderate increase in costs)
• Requirements for evidence on staff contracts (moderate increase in costs)
• Requirements for evidence in case of multiple authorship (moderate increase in costs)
• Streamlining the electronic process (electronic libraries) made the work of the panels relatively easier (decrease in costs)
Figure 4 REF 2014 vs RAE 2008, by REF element
An alternative way to analyse the increase/decrease in cost of the REF relative to the RAE is to compare the perceptions of survey respondents on the REF elements: REF1a/b/c, REF2, REF4a/b/c, REF5. As illustrated in Figure 4, there is considerable variation in the responses. Several respondents suggested that changes to REF4a/b/c for preparing the environment data and REF2 for preparing the research outputs using bibliometrics has either no impact on costs, or decreased costs moderately. One interviewee noted that one simplification in submitting the research environment data was that there was no longer a need to cross-check supervision of students. In contrast, several respondents suggested that changes to REF1 and REF2 for preparing
0% 10% 20% 30% 40% 50% 60% 70% 80% 90% 100%
For submitting staff with special circumstances (REF1b)
For preparing the staff listings and research outputs (REF1, REF2)
For preparing the environment template (REF5)
For preparing research outputs using bibliometrics (REF2)
For preparing the environment data (REF4a/b/c)
To what extent did the REF affect institutional costs, relative to the RAE?
Substantial increase in cost (more than 20%) Moderate increase in cost (less than 20%)
No impact on cost Moderate decrease in cost (less than 20%)
Substantial decrease in cost (more than 20%)

15
staff listings and research output and REF1b for submitting staff with individual staff circumstances either had no impact on costs or increased costs. One HEI in particular noted that making the case for early career researchers (ECRs) and collating evidence of their independence was rather time consuming and costly.
One way to estimate the impact on costs related to the change in rules from the RAE to the REF is by comparing our cost estimates with those set out in the RAE Accountability Review. However, there are considerable differences in the approach between the RAE Accountability Review and this study, the REF Accountability Review (see Table 4) and the total cost estimations.
Table 4 RAE and REF Accountability Reviews; major differences in approach
2008 Accountability Review
2014 Accountability Review
Geographical coverage of study
England UK
On-costs (such as employer’s contributions to staff pensions and Employers’ National Insurance Contributions)
16% of annual salary 30% of annual salary
Coverage of REF/RAE related costs
Includes costs to HEIs and panel members
Excludes cost related to impact assessment (new REF component). Includes costs to panel members
Method • Interviews: 8 on-site visits and 12 telephone interviews with strategic, operational and research representatives
• Calculating the cost of accountability to the sector in the academic year 2007-2008 (see pp. 16 of the RAE Accountability Review, 2009)20
• Survey to 20 HEIs (in spreadsheet format) and follow-up via mail/telephone. 19 interviews: 2 on-site visits and 17 telephone interviews with Pro Vice Chancellors (PVCs) of research, directors of research, and/or research strategy and policy managers
• Calculating the cost of accountability to the sector covering the academic years 2009-2010 to 2014-2015
4.2 Comparison of REF 2014 costs with RAE 2008
In order to fairly compare the cost of the REF with the cost of the RAE, we have adopted an adjusted cost estimate for the 2008 exercise, taking into account the following:
1. The difference in geographic coverage
− Whereas the 2008 Accountability Review estimated the cost of the RAE for England, this study looks at the cost of the REF for the UK
20 It remains unclear to us what approach was used to produce an overall cost estimate of the RAE.
16
2. Major changes from the RAE to the REF, where possible
− Refrain from including the cost estimate of the impact assessment within the comparison. It is clear that the introduction of impact assessment substantially increased the cost to HEIs of preparing their submissions for the REF, as compared with the RAE
− Exclude the cost estimate of panellists to allow for a closer comparison of the other RAE and REF elements
3. Macroeconomic changes
− Inflate the RAE cost estimate for 2008 using GDP statistics (see RAND, 2015), to bring it in line with current prices
4. Difference in on-costs
− Whereas on-costs were defined as being 16% of annual salary in the RAE (reflecting employer pension contributions) they are assumed to be 30% of annual salary in this Accountability Review, encompassing both employer’s contributions to staff pensions and Employers’ National Insurance Contributions (ENICs)
As part of its evaluation of the impact submission process, RAND (2015) estimated the total cost of preparing full submissions to the REF using data from the RAE 2008 Accountability Review. Adjusting the PA Consulting Group cost estimate, using steps 1-3 above, RAND produced an adjusted cost estimate of £66M for the cost to the UK of the RAE 2008, in 2014 prices.
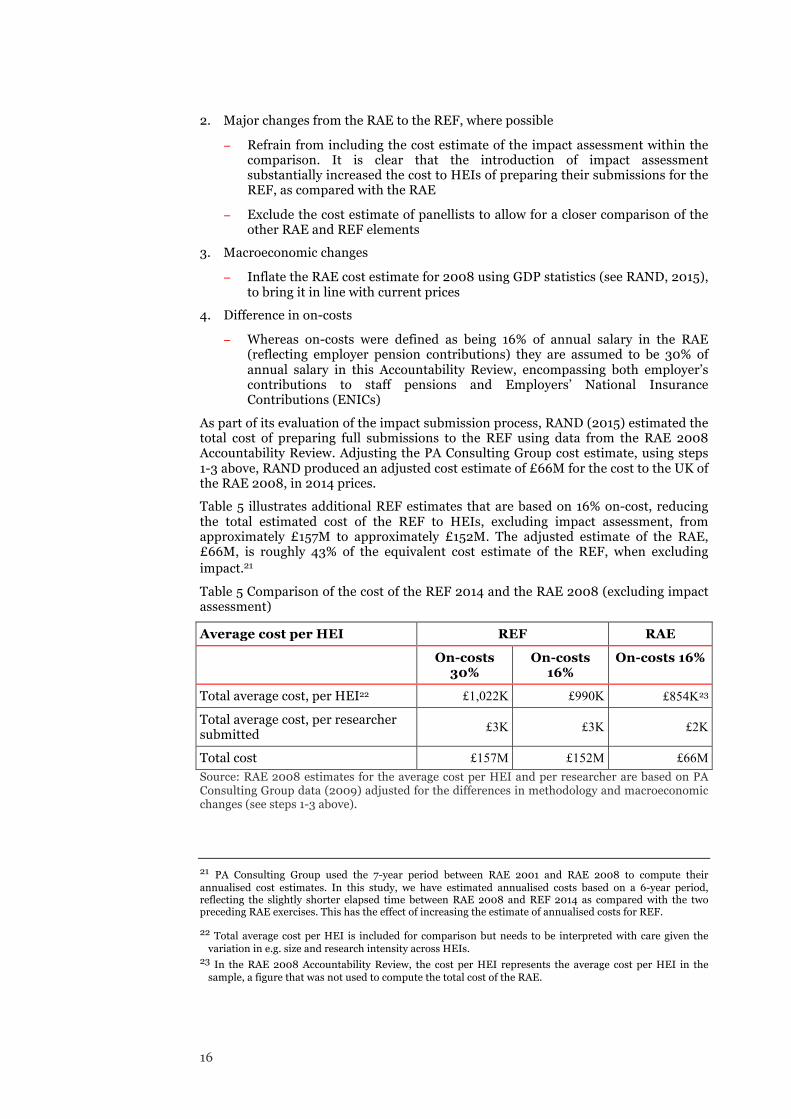
Table 5 illustrates additional REF estimates that are based on 16% on-cost, reducing the total estimated cost of the REF to HEIs, excluding impact assessment, from approximately £157M to approximately £152M. The adjusted estimate of the RAE, £66M, is roughly 43% of the equivalent cost estimate of the REF, when excluding impact.21
Table 5 Comparison of the cost of the REF 2014 and the RAE 2008 (excluding impact assessment)
Average cost per HEI REF RAE
On-costs 30%
On-costs 16%
On-costs 16%
Total average cost, per HEI22 £1,022K £990K £854K23
Total average cost, per researcher submitted
£3K £3K £2K
Total cost £157M £152M £66M Source: RAE 2008 estimates for the average cost per HEI and per researcher are based on PA Consulting Group data (2009) adjusted for the differences in methodology and macroeconomic changes (see steps 1-3 above).
21 PA Consulting Group used the 7-year period between RAE 2001 and RAE 2008 to compute their annualised cost estimates. In this study, we have estimated annualised costs based on a 6-year period, reflecting the slightly shorter elapsed time between RAE 2008 and REF 2014 as compared with the two preceding RAE exercises. This has the effect of increasing the estimate of annualised costs for REF.
22 Total average cost per HEI is included for comparison but needs to be interpreted with care given the variation in e.g. size and research intensity across HEIs.
23 In the RAE 2008 Accountability Review, the cost per HEI represents the average cost per HEI in the sample, a figure that was not used to compute the total cost of the RAE.

17
The increase in cost and the additional estimate for impact assessment (£55M) suggests that the REF is substantially more costly than the RAE. As already indicated above, the cost drivers include, amongst others, the change in rules around individual staff circumstances. When comparing some of the cost items of the RAE 2008 and the REF we additionally make the following observations:
• In line with our cost estimate of the REF, the biggest cost component of the RAE is preparing staff returns (validating publications and bibliographic information, writing submissions), which PA Consulting Group estimated to be roughly 57% of the total cost per HEI (when excluding the cost of RAE national panels and consultation). The estimated time spent on the research output element as a proportion of the total time spent on REF activities is 45% (excluding impact).
• Also roughly in line with our cost estimates, PA Consulting Group found that costs related to systems upgrades and software comprise a small proportion, about 2%, of the total cost to HEIs (excluding panellists). We estimate total non-pay central costs to amount to roughly 1% (excluding impact).
• For REF 2014, we estimated that close to 3% of the total cost to the HE community (excluding impact and panellists) was spent on ‘other staff/external consultants’, with the larger proportion of this cost spent in relation to ‘critical friends’. PA Consulting Group estimated the cost for external review was 1% of the total costs for submitting HEIs, excluding panellists.
• PA Consulting Group estimated the cost of panellists was roughly 9% of the total cost for HEIs. Our REF cost estimate of panellists as a proportion of the cost to the HE community (excluding impact, including panellists) likewise is roughly 9%. PA Consulting Group estimated the cost of RAE national panels and consultation to amount to roughly £56K per HEI. In comparison, we estimate the cost of panellists at £19M in total (excluding fees), which amounts to roughly £126K per HEI. Although this figure is based on the assumption of 30% on-costs and that of PA Consulting Group is likely to be based on an assumption of 16% on-costs, it is evident that our cost estimate is more than double that of the PA Consulting Group.
We believe that differences in the approach to the RAE 2008 Accountability Review, as compared with the current exercise, may have resulted in a conservative estimate. The RAE 2008 Accountability Review relied on bilateral discussions with RAE managers and did not use a detailed cost model as was developed for this exercise, which may have caused respondents to overlook particular cost drivers or to assume rather more consistent effort across UOAs. It is possible therefore that the costs associated with the RAE 2008 were underestimated. Our assessment methodology sought to be comprehensive and to broadly capture all categories of staff involved as well as all REF elements. For example, our UOA-level estimates include time spent by submitted and by non-submitted academic staff, as it was not unusual for non-submitted staff to be involved in discussions about the submission. We also tried to gauge the incremental cost of REF by asking the question from two different perspectives: firstly, HEIs were asked for an estimate of their REF-related costs and then they were asked to estimate the proportion of staff time attributable to the process. The figures in Appendix E provide an overview of a survey question asking REF Managers to indicate the proportion of staff time/costs that is wholly attributable to REF. Thus, reflecting on the time and costs entered throughout the questionnaire (following consultation with different staff), REF Managers are asked to indicate the proportion of time spent that would otherwise not have been incurred as part of normal oversight/research management procedures. Depending on the type of staff (central staff, UOA review group, support staff, submitted and non-submitted academic staff), several respondents suggested that a percentage — ranging from 2% to 100% — of the time spent was in fact part of ‘business as usual’. In particular, one respondent suggested that up to 80% of the submitted academic staff time and up to 100% of other eligible academic staff time was part of ‘business as usual’.
18
5. REF cost drivers
5.1 Analysis of central costs
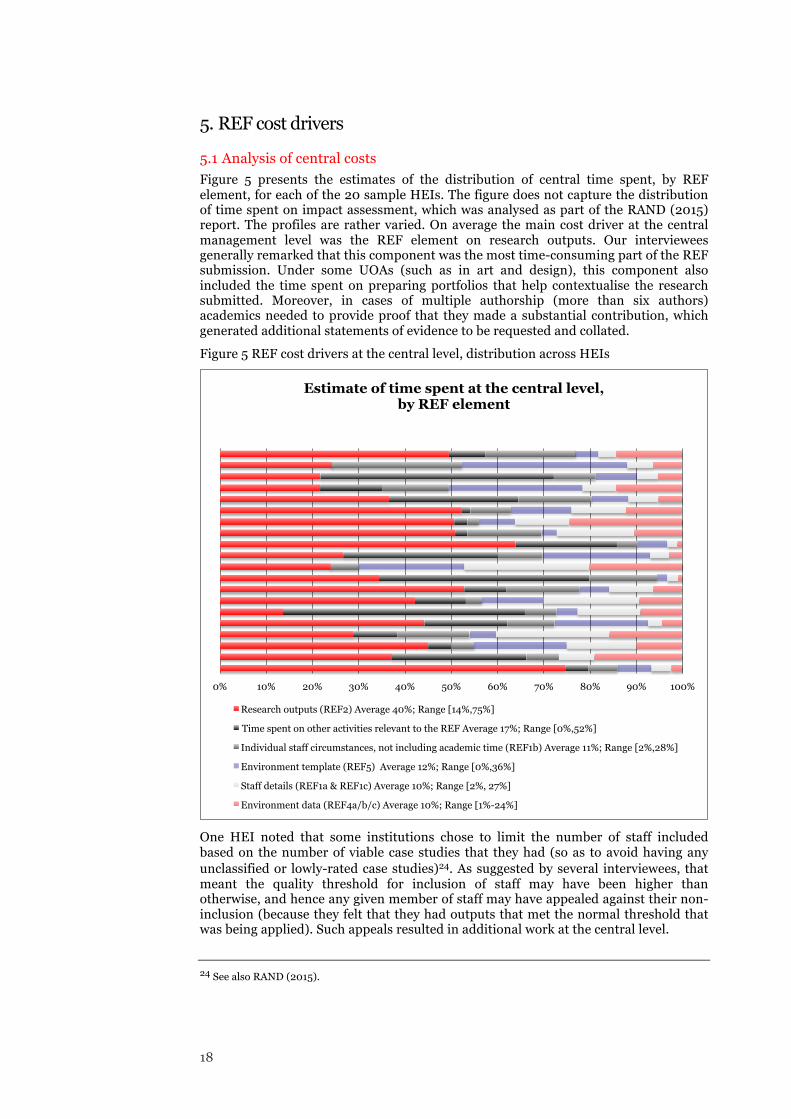
Figure 5 presents the estimates of the distribution of central time spent, by REF element, for each of the 20 sample HEIs. The figure does not capture the distribution of time spent on impact assessment, which was analysed as part of the RAND (2015) report. The profiles are rather varied. On average the main cost driver at the central management level was the REF element on research outputs. Our interviewees generally remarked that this component was the most time-consuming part of the REF submission. Under some UOAs (such as in art and design), this component also included the time spent on preparing portfolios that help contextualise the research submitted. Moreover, in cases of multiple authorship (more than six authors) academics needed to provide proof that they made a substantial contribution, which generated additional statements of evidence to be requested and collated.
Figure 5 REF cost drivers at the central level, distribution across HEIs
One HEI noted that some institutions chose to limit the number of staff included based on the number of viable case studies that they had (so as to avoid having any unclassified or lowly-rated case studies)24. As suggested by several interviewees, that meant the quality threshold for inclusion of staff may have been higher than otherwise, and hence any given member of staff may have appealed against their non-inclusion (because they felt that they had outputs that met the normal threshold that was being applied). Such appeals resulted in additional work at the central level.
24 See also RAND (2015).
0% 10% 20% 30% 40% 50% 60% 70% 80% 90% 100%
Estimate of time spent at the central level, by REF element
Research outputs (REF2) Average 40%; Range [14%,75%]
Time spent on other activities relevant to the REF Average 17%; Range [0%,52%]
Individual staff circumstances, not including academic time (REF1b) Average 11%; Range [2%,28%]
Environment template (REF5) Average 12%; Range [0%,36%]
Staff details (REF1a & REF1c) Average 10%; Range [2%, 27%]
Environment data (REF4a/b/c) Average 10%; Range [1%-24%]

19
The ‘environment template’ took on average (estimating across HEIs) about 12% of central management time, followed by ‘staff details’ (10% on average) and ‘environment data’ (10% on average). Individual staff circumstances took approximately 11% on average (see also section 5.3).
Several HEIs allocated considerable time (17% on average) to ‘other activities’ than those mentioned above. We asked respondents to specify those activities, and the long list included the following:
• Strategy development and planning, designing the process and materials, developing and running scenarios and different strategies for submission
• General communication, planning, coordination and liaison including sending out staff selection letters, promoting and communicating the REF to staff
• Training activities
• Coaching and mentoring of staff
• Attending external REF briefing meetings and events
• Website development
• Corresponding with external assessors and processing payments
• Writing the code of practice
• Setting up a development group/support office
• Confirming guidance with the REF team
• Negotiating staff allocation across UOAs, when interdisciplinary
• Participating in the bibliometrics or impact pilots (which arguably should not have been included as part of our data collection)
5.2 Analysis of costs at UOA level
Figure 6 presents the distribution of costs to UOAs, by REF element, for each of our sample HEIs. It shows that, on average, the largest proportion of time spent at the UOA level – by a very substantial margin – was spent on reviewing and negotiating the selection of staff and publications (55% on average across HEIs), and that, on average, UOAs spent least time working on ‘individual staff circumstances’. One HEI noted that the time spent on staff/publication selection includes time spent by academics on filling in career details and entering their publications for selection, and writing summaries. Some HEIs spent little or no time on anything other than research outputs at the UOA level, with even key elements of their submission (e.g. environment statements) being largely managed by the senior management team and REF coordinator.

20
Figure 6 REF cost drivers at UOA level, distribution across HEIs
Likewise, staff spent a considerable amount of time preparing the environment template (17% on average) and on validating and extending bibliographic records25 for submitted research outputs (12% on average). At the UOA level, relatively little time was spent preparing environment data and on preparing individual circumstances declarations. However, one HEI suggested that a number of (mostly professional) staff at the UOA level other than the individual academic spent time preparing information relating to individual circumstances. This work related to non-complex circumstances, and primarily related to gathering evidence and ascertaining the eligibility of staff for early career researcher status and verifying part time status – for example reviewing CVs and acquiring relevant job descriptions.
Roughly 11% of the time is spent on ‘other activities’ relevant to the REF. These activities are summarised in Table 6.
25 For some UOAs, each output had to have 100 words describing the value of the item. That took quite a lot of additional effort, albeit it only applied to Engineering and Computer Science.
0% 10% 20% 30% 40% 50% 60% 70% 80% 90% 100%
Estimate of time spent at the UOA level, by REF element
Time spent reviewing / negotiating selection of staff and publications Average 55%; Range [20%,100%]
Time spent preparing the environment template (REF5) Average 17%; Range [0%,49%]
Time spent on other activities relevant to the REF (other than REF academic panels) Average 11%; Range [0%,45%] Time spent validating / extending bibliographic records for submitted research outputs (REF2) Average 12%; Range [0%,45%] Time spent preparing environment data (REF4a/b/c) Average 5%; Range [0%,17%]
Time academic staff spent preparing special circumstances declarations (providing clarification and evidence) Average 1%; Range [0%,3%]
21
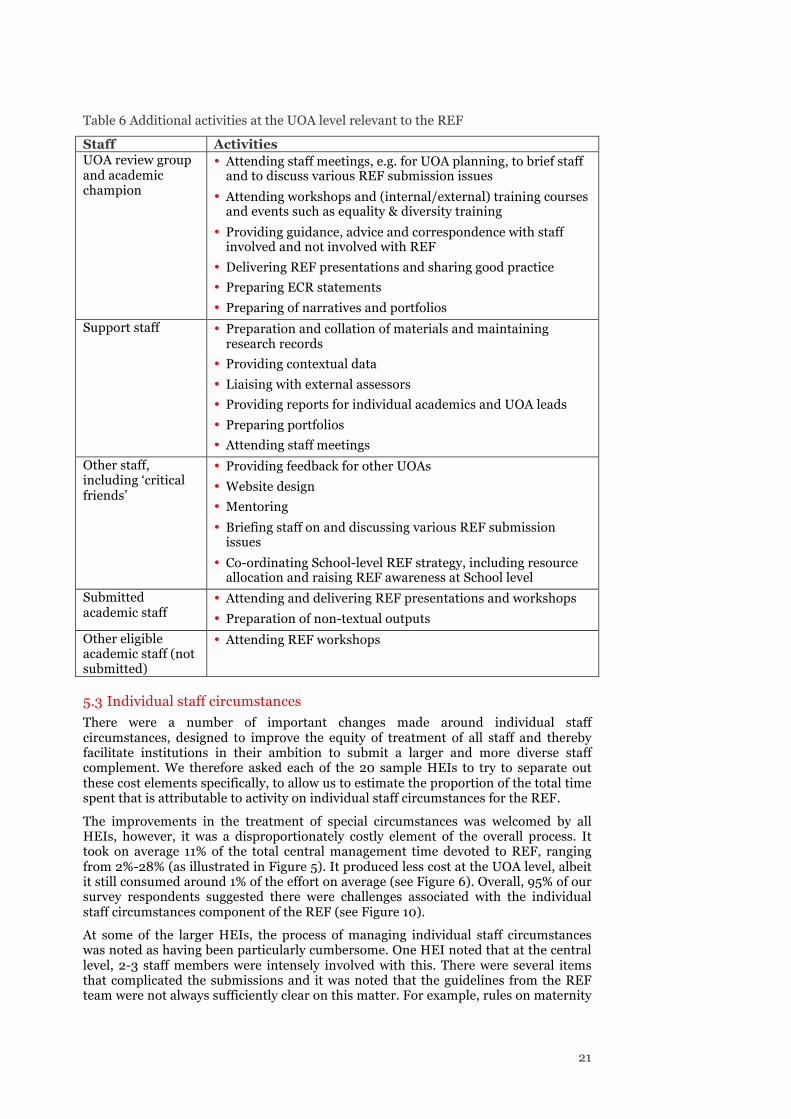
Table 6 Additional activities at the UOA level relevant to the REF
Staff Activities UOA review group and academic champion
• Attending staff meetings, e.g. for UOA planning, to brief staff and to discuss various REF submission issues
• Attending workshops and (internal/external) training courses and events such as equality & diversity training
• Providing guidance, advice and correspondence with staff involved and not involved with REF
• Delivering REF presentations and sharing good practice
• Preparing ECR statements
• Preparing of narratives and portfolios
Support staff • Preparation and collation of materials and maintaining research records
• Providing contextual data
• Liaising with external assessors
• Providing reports for individual academics and UOA leads
• Preparing portfolios
• Attending staff meetings
Other staff, including ‘critical friends’
• Providing feedback for other UOAs
• Website design
• Mentoring
• Briefing staff on and discussing various REF submission issues
• Co-ordinating School-level REF strategy, including resource allocation and raising REF awareness at School level
Submitted academic staff
• Attending and delivering REF presentations and workshops
• Preparation of non-textual outputs
Other eligible academic staff (not submitted)
• Attending REF workshops
5.3 Individual staff circumstances
There were a number of important changes made around individual staff circumstances, designed to improve the equity of treatment of all staff and thereby facilitate institutions in their ambition to submit a larger and more diverse staff complement. We therefore asked each of the 20 sample HEIs to try to separate out these cost elements specifically, to allow us to estimate the proportion of the total time spent that is attributable to activity on individual staff circumstances for the REF.
The improvements in the treatment of special circumstances was welcomed by all HEIs, however, it was a disproportionately costly element of the overall process. It took on average 11% of the total central management time devoted to REF, ranging from 2%-28% (as illustrated in Figure 5). It produced less cost at the UOA level, albeit it still consumed around 1% of the effort on average (see Figure 6). Overall, 95% of our survey respondents suggested there were challenges associated with the individual staff circumstances component of the REF (see Figure 10).
At some of the larger HEIs, the process of managing individual staff circumstances was noted as having been particularly cumbersome. One HEI noted that at the central level, 2-3 staff members were intensely involved with this. There were several items that complicated the submissions and it was noted that the guidelines from the REF team were not always sufficiently clear on this matter. For example, rules on maternity
22
leave were fixed only later on in the submission process, which was particularly problematic for institutions with a higher proportion of female researchers. Additionally, ECRs were allowed to submit a reduced number of outputs but they had to prove they were independent researchers. Collecting evidence to prove this was indeed the case was rather time consuming, and also attracted more than its fair share of attention from auditors. The situation was made more difficult as some interviewees considered the definition of ECRs as particularly unclear. Moreover, the guidelines on complex staff circumstances were identified as difficult to follow; additional clarification and FAQs supporting the original guidance were only provided during the course of the exercise. Also, it was noted that some staff, who would almost certainly have qualified for complex circumstances, chose not to declare their circumstances (possibly with the consequences of being excluded from the REF) because of the sensitivities around their situations, and that institutions invested time in arriving at this position.
5.4 Post-submission activity
All information provided by HEIs in their submissions needed to be verifiable, and the REF therefore ran a sample-based verification to check the accuracy of a selection of staff and case studies for each institution. The REF submission system was also set up to flag any discrepancies within different elements of an institution’s submission (internal validity) and, of course, sub-panels were able to raise queries as necessary.
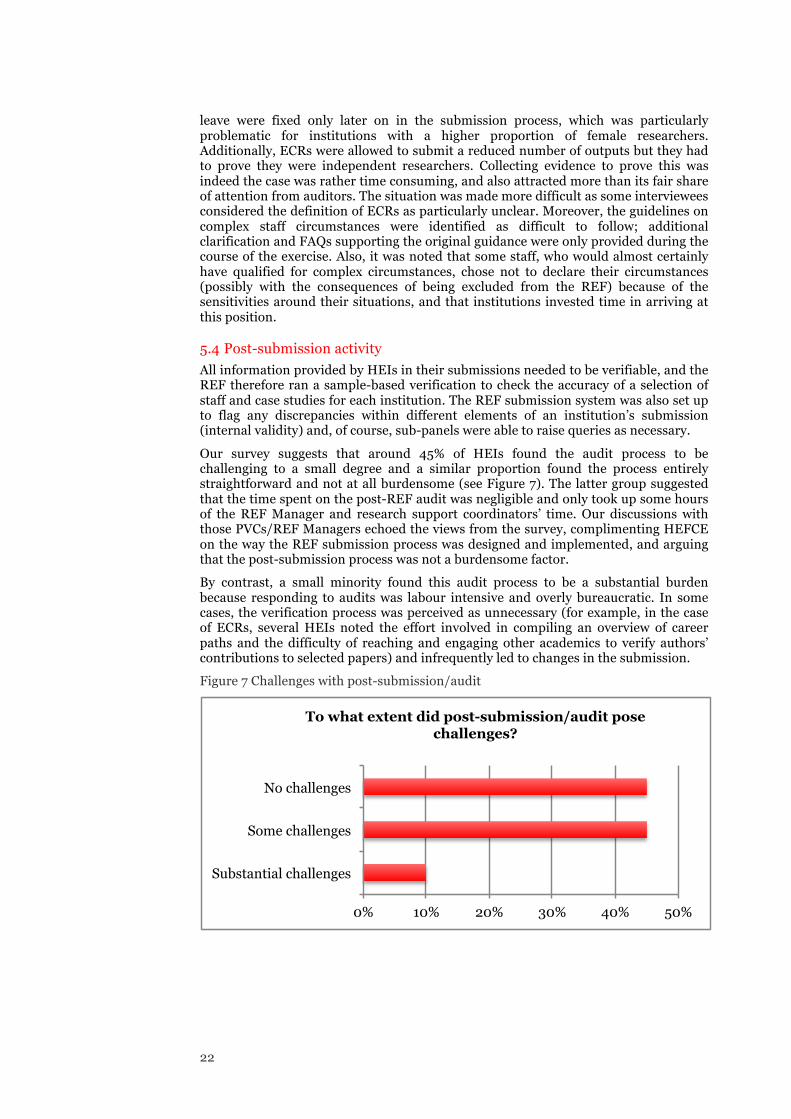
Our survey suggests that around 45% of HEIs found the audit process to be challenging to a small degree and a similar proportion found the process entirely straightforward and not at all burdensome (see Figure 7). The latter group suggested that the time spent on the post-REF audit was negligible and only took up some hours of the REF Manager and research support coordinators’ time. Our discussions with those PVCs/REF Managers echoed the views from the survey, complimenting HEFCE on the way the REF submission process was designed and implemented, and arguing that the post-submission process was not a burdensome factor.
By contrast, a small minority found this audit process to be a substantial burden because responding to audits was labour intensive and overly bureaucratic. In some cases, the verification process was perceived as unnecessary (for example, in the case of ECRs, several HEIs noted the effort involved in compiling an overview of career paths and the difficulty of reaching and engaging other academics to verify authors’ contributions to selected papers) and infrequently led to changes in the submission.
Figure 7 Challenges with post-submission/audit
0% 10% 20% 30% 40% 50%
Substantial challenges
Some challenges
No challenges
To what extent did post-submission/audit pose challenges?

23
On average, the total time spent on post-submission/audits amounts to 5.79 weeks (217 hours) at the central level. In comparison, the average time spent on preparing the REF submission is 985 weeks in total and 318 weeks at the central level; overall, less than 2% of time spent is dedicated to post-submission/audit.26
Figure 8 illustrates the variation of the proportion of central time spent on post-submission in relation to administrative matters. One survey respondent indicated no time was spent on the post-submission process, and therefore it is not included in the figure.27 Most of the post-submission/audit time was allocated to answering queries about individual staff circumstances, followed by research outputs and staff details.
Figure 8 Post-submission related to administrative matters, by HEI
Figure 9 illustrates the variation in the proportion of time spent on post-submission in relation to academic matters, which involved liaising with academic staff, primarily around issues to do with submitted outputs (the number of audits of case studies was very much lower in absolute terms). Eight of 20 survey respondents stated that no time was spent liaising with academic staff in order to deal with the audit and verification process, and thus these HEIs are not presented in the figure. As mentioned above, the engagement at the UOA/departmental level was often noted as negligible, because post-submission was generally managed centrally.
26 When computing the total number of audit questions (8,571) as a proportion of the audit questions of our sample (1,140 if unadjusted and 1,087.5 if adjusted for joint submissions) we find that our approach of scaling up underestimates the cost of post-submission/audit. Nevertheless, correcting for this underestimation would not have a substantial impact on our total cost estimate and we suspect that a correction would still conclude that less than 2% of the cost of submitting to the REF is related to post-submission/audit activity.
27 The interviewee suggested that the time spent on post-submission/audit was negligible.
0% 10% 20% 30% 40%
Proportion of central management time spent on post-submission (audit) related to administrative
questions Individual staff circumstances, not including academic time (REF1b) Research outputs (REF2)
Staff details (REF1a & REF1c)
Environment data (REF4a/b/c)
Environment template (REF5)
Time spent on other activities relevant to the REF

24
Figure 9 Post-submission related to academic matters, by HEI
0% 2% 4% 6% 8% 10%
Proportion of central management time spent on post-submission (audit) related to academic questions
Staff details (REF1a & REF1c)
Individual staff circumstances, not including academic time (REF1b)
Research outputs (REF2)
Environment data (REF4a/b/c)
Environment template (REF5)

25
6. Challenges of the REF submission
6.1 Management and coordination
Performance assessment, as set out in the REF, is in many ways part of the core business of managing a research institution. Nonetheless, submitting to the REF requires substantial investment, including at the central management level and, to some extent, also displaces ‘business as usual’.
Generally, all information and input to the REF is managed centrally, and all codes of practice are managed at the central level. In conversation with heads of departments, it is clear that central management also decides on which UOAs to include in the submission. Most often a REF project management team is responsible for initiating and preparing the REF submission, e.g. as part of a research and enterprise or planning office. At larger HEIs, this generally means that a PVC of Research chairs a REF project management group. Depending on the HEI’s organisational structure, the REF project management group liaises with senior academics, deans, heads of department, and/or members of central selection panels. For example, at one HEI three associate deans of research – responsible for different UOAs – sit on the REF board. The UOAs make a staff selection based on the output, which is then reviewed at a higher level. Another interviewee describes the process as being managed by a Research Leads Working Group, with a middle-grade staff member working substantially on coordination of the selection and submission process, with a Final Selection Panel of senior academics and university management overseeing this process.
Figure 10 suggests that for most of the HEIs, the time-line for preparing for the REF is challenging. One HEI noted that the administrative workload of preparing the REF submission was heavy, in part because the institution had no dedicated research office or manager at the UOA level and there was no opportunity to bring in additional external expertise to provide further guidance. At the central management level, for example, we were told the REF had caused some universities to skip their ‘regular’ review exercise, while others told us that the burden of REF falls most heavily on their senior academics and that this in turn can reduce the institution’s capacity to pursue other sources of research funding. In relation to this, some interviewees observed a dip in their institutions’ income from research councils, the EU RTD Framework Programme and even contract research in the year before the REF submission deadline.28 At the UOA level, the administrative preparatory work was often assumed by academics. For this reason also, preparing for the REF impinged on academic research time. To some extent, submissions were dependent on the goodwill of academics putting in time on top of their regular activities.
28 Despite a possible short-run dip in funding, in the long-run, QR funding may leverage other types of funding. See also the following study of English HEIs: Public and Corporate Economic Consultants (PACEC) & the Centre for Business Research, University of Cambridge (2014). A Review of QR Funding in English HEIs. Process and Impact.

26
Figure 10 Challenges of the REF submission
Some factors that shaped an institution’s differing experience of the REF submission process include organisational developments more generally. For example, one of the HEIs interviewed went through a merger in the year before finalising the REF submission; this resulted in having to align, amongst other things, the code of practice and pre-selected output. Further, some UOA submissions were joint submissions, which were more complex to prepare. Moreover, some of the more recently established HEIs and those that are going through a process of restructuring and shifting to a more research-intensive environment experienced relatively more difficulties in preparing the submission and providing evidence for impact when internal expertise is spread thinly across UOAs. Such institutions are still in the process of building a substantial track record of collaboration with third party institutions and organisations.
Maintaining consistency in the REF submission procedure is likely to have a positive effect on cost reductions. As illustrated by Figure 11, most of our respondents (65%) thought that if the next REF were to follow the same submission process the costs of preparing the submission would be moderately less. In comparison, Figure 10 shows that 80% of our respondents find that the changes to the REF system, in comparison to the RAE, generated challenges to prepare the submission. At the same time, several interviewees did comment that there was a good continuity from RAE to REF.
Figure 11 also highlights that 25% of our respondents found that if the next REF were to follow the same submission process the costs of preparing the submission would be higher. One respondent suggested: “we expect that costs in some areas would be reduced, however we would expect to invest more in other areas”. Another HEI suggested the following: the “submission to the next REF will include maximising upon quality, therefore we will need to seek external expertise reviews”. One interviewee remarked that one of the lessons learned from the REF was that preparation would need to start earlier, including the need to put in place systems to collect metrics and data; this is likely to have the effect of increasing the costs of preparation. Also, universities are already preparing for a submission that places more importance on open access and this is thought to have an impact on the cost of preparation.
0% 10% 20% 30% 40% 50% 60% 70%
Substantial challenges
Some challenges
No challenges
To what extent did parts of the submission process pose challenges?
The timetable
Changes to the system, compared with RAE2008
Individual staff circumstances

27
Figure 11 Lessons learned
Central management influences the degree to which preparing for the REF follows an efficient process. PVCs suggested that an HEI’s research strategy is aligned with submitting to the REF, albeit in varying degrees. HEIs with a strong pro-research strategy naturally place the REF higher on the agenda than HEIs where research and research funding is of relatively less importance. At the same time, we find that because HEIs more generally aim at high quality research, the REF does not solely drive HEIs.
6.2 Management information systems and institutional repositories
HEIs differ in the sophistication of their management information systems and institutional repositories and this has a considerable impact on REF preparation. Larger and more research-intensive HEIs will have advanced systems in place and the compatibility of information system components positively contributes to an efficient submission. At the time of the REF submission, several HEIs were in the process of restructuring their management information system and institutional repository or were looking to restructure and either purchase a commercial system or (further) develop and internally build their system. The cost of investing in a management information system and institutional repository is perceived as part of the institution’s wider strategy and compliance, although the REF often impacts the timing of such investment decisions. Some of the smaller HEIs have less advanced management information systems and institutional repositories in place. For such HEIs, investing in a sophisticated commercial system is arguable too costly and, at the same time, not imperative to providing strategic insight. The challenge experienced by institutions that rely on internally built systems was that there were only a few staff who had the know-how to manage their system. On a positive note, some interviewees referred to the REF Submission System and interface as well designed and ‘friendly’ and some smaller HEIs found that a paper-based/spreadsheet system was sufficient for the management side. One interviewee noted that although there is a core need for management information systems and repositories for HEIs, there are significant costs involved with the integration of the different systems and information and that this effort is made exclusively for the REF.
6.3 Mock REFs and external advisors
Several HEIs experienced submitting as particularly costly because preparing for the REF was organised as an iterative process. Some HEIs ran two or three formal mock REFs, with the final leading directly into the REF submission. Interviewees described
5%
20%
10% 65%
If the next REF were to follow the same submission process, would the lessons learned have any effect on the overall institutional cost?
Substantial increase in cost (more than 20%)
Moderate increase in cost (less than 20%)
No impact on cost
Moderate decrease in cost (less than 20%)

28
such process as involving several rounds of staff selection. In the case of three rounds of selection, the first round generally invited all staff to submit outputs as was set out in the code of practice. The second round invited a slightly a more limited selection of staff to submit outputs and the third round determined the final selection of staff and outputs. On the contrary, some HEIs did not commit to a lengthy process of preparation and did not include mock trials. However, some of such HEIs did submit internal drafts and offer peer review assessment. This feedback was in return used to improve the final submission.
Most of the sample HEIs used external advisors (‘critical friends’) in some degree to help assess the quality of selected outputs, using their distance and independence to calibrate the institution’s own judgements as to the quality of work and in particular those outputs that were thought to sit at boundary of two grades. The experts also allowed the institutions to access additional capacity more flexibly. External expertise was used to varying degrees: (1.) to evaluate the quality of outputs at all the UOAs submitted, (2.) to evaluate output at some UOAs and (3.) to calibrate the quality profiles following internal scoring of outputs. To some degree, the choice of approach also depended on the UOA/discipline. For each UOA included in the submission, HEIs may have relied on one or more external experts. One of the larger institutions in our sample made very much less use of external experts, feeling confident in their own quality assessment and existing research information systems, while having a very much larger pool of internal staff to draw upon where there were any anomalies.
One perspective is that (extensive) mock assessments and reliance on external experts do not improve the quality of research and for this reason it is not possible to polish a ‘poor submission’ in exchange for better marks. Also, it was suggested that despite the use of external experts, there were still surprises in the REF outcome of some UOAs. An alternative approach to prepare for the REF is to focus on creating awareness about the REF amongst academic staff and to encourage researchers to submit to higher impact journals (even though, as stated in paragraph 53 of the ‘panel criteria and working methods’,29 journal impact factors, rankings or the perceived standing of publishers are not to be used in assessing the quality of research outputs).
Some HEIs organised internal workshops for the REF management team and senior academic staff in order to support preparations around the environment and impact submission. At one HEI, these workshops included the presentation of the REF guidelines and outlined the differences relative to the RAE. At other HEIs, similar workshops were run but targeting the academic staff at the different UOAs.
29 REF 01.2012. Panel criteria and working methods.

29
7. The benefits to HEIs of participating in the REF
7.1 The benefits of REF to HEIs
As part of the Accountability Review, we undertook a review of the key benefits HEIs seek from participation in the REF through a series of high-level interviews with PVCs and their senior management teams. These strategic discussions also invited comparison with RAE 2008 and teased out any differences in perceived benefits of the new arrangements as compared with the old. The question of institutional benefits was also put to REF Managers through our institutional survey, using a closed question with a long list of possible benefits.
Most institutions reported several similar and important institution-level benefits. One interviewee stated that the benefits of the REF are enormous. At the highest level, for the UK as a whole, the REF can demonstrate areas where the quality of research is high and areas where the quality is increasing. This demonstration of excellence is pervasive in the international sphere.
All interviewees highlighted a major reputational dividend from participation in such a national assessment exercise. This is less about REF or RAE and more to do with the global visibility of the UK’s longstanding national assessment process, whereby the results (the good ones at least) are seen to raise an institution’s profile overall and to provide good evidence of specific areas of research excellence and other niche competencies. For less research-intensive institutions, the RAE and the REF also helps build the perceived value of research within the institution more broadly. The demonstration of excellence within the institutions supports the overall internal research agenda. Interestingly, amongst our sample of HEIs, there was a wide range in the degree to which the institutions depend on mainstream quality-related (QR) funding; in some cases QR funding is a large proportion of the HEI’s research budget and in other cases QR funding constitutes a relatively small part of total institutional research income. Notwithstanding these differences, in all cases, QR funding was identified as being critical to the institution’s research reputation and its development efforts. Even when the amount of QR funding was small, PVCs suggested that this source of funding would be allocated to continue to support existing and newfound excellence. In one particular example, it was thought that submitting to the REF under a given UOA helps build a case for acquiring accreditation.
Figure 12 illustrates the more specific types of benefits that our survey respondents identified. In addition to the items discussed below, impact, which was not formally part of this particular data collection exercise, was also widely welcomed.
The figure shows that all respondents find that submitting to the REF yields strategic intelligence to inform on institutional and departmental performance. Sometimes an HEI committed to a submission involving only a small number of staff, with the aim of gaining more insight into the developments within the discipline and relevant department. This type of benefit was noted as yielding substantial benefit in the larger HEIs where it led to changes in strategic organisation and activity. For example, one institution noted that the REF provided an opportunity to set external benchmarks for performance. The REF provided relatively less strategic insight for smaller institutions that already had a clear overview of the performance of departments. Similarly, the REF yielded relatively less strategic insight to the UK’s top HEIs, which for their internal benchmarking compare the institution’s position using an international perspective.
The REF results are used as a key input into a university’s five-year strategic management and/or research plan. REF was esteemed as a very good indicator of the past and a key performance indicator. Several interviewees suggested that the REF results helped identify core competencies, areas where more excellence was found

30
than previously expected and areas where less excellence was found than expected.30 Similarly, the impact element yielded tremendous insight into the performance of departments. Overall, PVCs suggested that this insight will be used to develop (new) people oriented strategy, the REF has an impact on how departments are assessed, possibly leading to mergers or new strategic directions, and/or will determine future REF submissions.
Figure 12 Benefits of the REF 2014
For institutions that aim to increase their wider research funding, this type of insight proved to be of crucial importance. At more research-intensive universities it was noted that the top researchers were in a good position to generate substantial funding; at institutions with a different emphasis on research this was not always the case and top researchers were not identified as top funding earners. Moreover, in conversation with PVCs, we found that the REF generates a culture of thinking more holistically across the elements of quality, environment and impact. In this respect, the REF process also helps the senior management team to understand the relative performance of their schools and departments, and even individual research groups, confirming or occasionally debunking the commonly held views of the institution itself. This process of verification was perhaps most illuminating as regards research impact, where institutions have had less data to work with historically and the stories of success were rather more anecdotal. To some extent, it is thought that the REF will place impact higher on the agenda of research and this will have a positive effect on individual researchers and ultimately may help generate more research that is important for wider society. The REF (and RAE) process is arguably more helpful to relatively smaller and less research-intensive HEIs than it is to the larger and more research-intensive institutions: the latter have the scale and systems to run sometimes quite thorough, institution-wide research assessment on an annual if not continuous basis. One interviewee mentioned that annual benchmarks of scientific excellence
30 Although the REF is a useful tool to identify excellence, it captures only a limited overview of the wider UK research landscape.
0% 20% 40% 60% 80% 100%
Strengthen links with other partners (e.g. business)
Launch new strategic partnerships
Improve staff recruitment and retention
Improve student recruitment
Secure additional research income
Improve equality and diversity of staff
Create improved marketing and promotional material
Develop institutional research management systems
Acquire intelligence to inform institutional strategy
Improve institutional oversight of departmental performance
To what extent has the REF helped to:
No benefit Some benefits Substantial benefits

31
were commissioned, using bibliometrics and citations, against their leading US counterparts, department by department.
Additional benefits identified include the following:
• Preparing for the REF helps the institution to market and promote their research agenda. On the one hand, the REF results feed into league tables. On the other hand, the material produced for the REF submission – abstracts, portfolios and impact case studies – are released and help promote the work of researchers.
• Several respondents stated that the REF helps attract international students and research staff. One interviewee suggested that REF has an impact on how PhD studentships are distributed.
• Investment in improved management information systems and repositories is likewise (usually) identified as a particular benefit. In the most basic sense, the REF reveals the overall need for a (more) advanced IT system/repository.
• The equality and diversity arrangements allow researchers with special staff circumstances to be recognised. The REF enabled inclusion of such researchers where it might not have previously happened. More generally, at some HEIs, the REF equality and diversity agenda had a wider impact. The REF helped improve circumstances related to the equality and diversity of staff, depending on the degree to which equality and diversity was already a core element of the institution. Via the equality and diversity component of the REF, institutions that had previously done relatively little to support staff with individual circumstances were able to recognise this proportion of the staff better and to identify mechanisms to provide improved support. The equality and diversity components also raised awareness amongst staff and this too was seen to yield substantial benefits on the working environment. At one HEI the equality and diversity policy was already well integrated into the institution’s code of practice prior to the REF, nevertheless, our interviewee suggested that the equality and diversity agenda was welcomed.
• Around half of our respondents identified that the REF helps secure additional income, for instance, by providing match funding. One perspective is that some respondents viewed that the REF does not directly help secure additional funding but instead that via improved marketing, attracting new students, etc. the REF indirectly helps secure additional funding.
• Close to half of our respondents suggested that the REF helps launch new partnerships and helps strengthen links with other (business) partners. In relation to this, one PVC suggested that, as a result of the UOA submission to the REF, companies had approached the relevant faculty.
7.2 The benefits of REF as compared with those identified in RAE 2008
The institutional benefits of REF 2014 were compared with the benefits identified by PA Consulting Group in the RAE 2008 Accountability Review.
One of the principal benefits identified in the RAE 2008 Accountability Review and in this study is that submitting to the RAE/REF is perceived to generate a reputational benefit to HEIs.
Our survey found that a majority of institutions had realised substantial benefits from participation in REF. Of particular note is the value of the impact assessment strand, which was not part of the RAE. We find that the REF positively contributes to institutional oversight and the development of an institution’s research strategy. Our data collection suggests that the REF often complements the internal research strategy of HEIs and feeds into strategic research planning. The RAE 2008 Accountability Review likewise suggests that the RAE was used, in part, for development purposes. However, quite differently, the RAE Accountability Review states that: “research strategies were only in place for a minority of the HEIs… very few institutions reported

32
that their strategy was linked to performance management and monitoring” (pp.24). The report also concludes that the RAE had influenced some HEIs that previously did not have an internal research management system to develop internal processes and influence research priorities. Altogether, we suspect that both the RAE and REF have substantially influenced the strategic management perspectives of UK HEIs and that, at least by the end of 2014, strategic planning and monitoring performance had become the norm. Several PVCs considered that the next challenge is better understanding impact and better aligning impact with other measures of research excellence.
The RAE 2008 Accountability Review noted that “the majority of the institutions… were still struggling to establish accurate, up-to-date research projects and publication databases” and “central management information systems were rarely able to easily capture… information necessary to track research outputs” (pp. 26). We also found that much has changed across the HE landscape. Although some HEIs in our sample noted difficulties with integrating different databases, usually HEIs had some sort of management system and repository in place. Currently, several HEIs are looking to further develop their management systems and repositories in line with wider open access policy.
Our review also revealed the perceived critical importance of the REF, and earlier national assessment exercises, to an institution’s brand, nationally and internationally, which was less prominent in the RAE Accountability Review. This suggests there is a changing appreciation of the key role of external accreditation (of research excellence) in creating or maintaining an institution’s reputation. We believe that this kind of formal endorsement is becoming more important as research becomes more international, and global competition for funds, research students and staff intensifies.

33
8. Lessons learned and recommendations
This final chapter presents an overview of the recommendations for future exercises provided by PVCs of Research and REF Managers as part of the data collection process. HEIs’ experiences with the REF also generated a range of ‘good practices’ with the following elements highlighted as being especially important: (1.) strategy and leadership, (2.) research quality and (3.) preparation.
Overall, HEIs feel that it is worth investing in preparing the best possible submissions to REF in order to ensure their research is fully recognised. For the smaller, less research-intensive HEIs, this is primarily about achieving the best results they can to support their brand and reputation; maximising their QR income is of course an objective, but is less critical where it is quite small in relative terms and in particular where other sources of research income are possibly very much more significant.
The degree to which it is necessary to invest in the REF submission varies, in particular when it comes to contracting external advisors to assess outputs. Some PVCs suggested that internal expertise should be the primary source to evaluate quality. And, similarly, there is a difference in opinion on the topic of running mock trials/iterations to prepare for the submission. In addition, the following items were suggested by some of our interviewees as good practice:
• Workshops supporting preparation of impact and environment statements, and coordination across UOAs
• Workshops providing support for UOA leaders and central coordination
• Consultants to help draft the case studies, check the language and ensure effective communication
• Clear communication within the HEI to prevent appeals, streamline preparations, share best practices. For example, clear communication on equality and diversity ensured that all academics recognised equal opportunity to submit
Throughout our data collection, interviewees stressed the importance for funding bodies to (continue to) recognise and reward excellence wherever it is found.31 Some interviewees mentioned that the REF overall favours large research-intensive institutions but also provides visibility to islands of excellence.
Although the PVCs and REF Managers interviewed generally thought the REF 2014 guidance was good and the central REF team was quick to respond to queries, a number of recommendations were made for future REF exercises:
• Some interviewees expressed concern over efforts made to optimally balance the volume and quality of research outputs, with the objective to realise the best possible REF outcome. Some interviewees suggested that there was a trade-off between impact and research excellence because the REF limited the submission of case studies to that sub-set which is underpinned by research of at least 2 star quality.32 In relation to this, some interviewees recommended a change and/or an increase in the transparency of the evaluation criteria to help discourage strategizing33
31 QR funding regulations differ across the UK funding bodies. Unlike funding distributed under HEFCE, HEFCW works with thresholds that exclude the weakest submissions from QR funding.
32 To a lesser degree, some interviewees viewed the focus on 3 star and 4 star output as discouraging the generation of regional impact when internationally recognised research is viewed as having a proportionately smaller regional impact.
33 Partly as a result of this strategizing, the REF submission only provides limited insight into the full research spectrum. A case can be made for a system that includes all research staff and/or does not limit the number of outputs to researchers. All things equal, this may contribute to the prevention of ‘game playing’

34
• Some interviewees recommended a revision of the impact model. Although PVCs and REF Managers are generally supportive of the impact agenda it was suggested that there needs to be a re-evaluation as to how impact should be captured. Some interviewees noted the difficulty in attributing impact to (excellence in) research.34 Also, different propositions were made on how to revise the impact model. For example, one PVC proposed that impact should not be evaluated jointly with research excellence and, using a different format, impact could be evaluated on a more frequent (annual) basis
• Some interviewees recommended setting REF requirements as early in the cycle as possible to help central management teams set up their coordination and data collection activities in a more timely manner, to ensure UOAs and staff are gathering/reporting the right data from the outset. Some interviewees suggested providing access to the online system earlier
• Some interviewees recommended improving definitions on research environment, explaining what is meant by a ‘good’ environment, e.g. with more fulsome guidance and examples of best practice across different UOAs
• Some interviewees recommended making examples of good practice (across UOAs) publicly available early in 2015, to enable HEIs to collect impact evidence more effectively in the run up to the next REF
Suggestions were made to help lessen the administrative burden:
• Some interviewees suggested merging the impact statement (REF3a) with the environment statement (REF5) to streamline the presentation of UOA policies and to avoid duplication
• Some interviewees suggested a revision of definitions and (simplification of) conditions around personal circumstances, early career researchers and independent researchers
• Some interviewees suggested a simplification of conditions around multiple-authorship. One interviewee remarked that, in the case of multiple authorship statements from lead/corresponding authors that a given researcher made a contribution does not prove that a contribution was made because of the associated conflict of interest
• Some interviewees suggested revising the census date so that grants received and PhDs completed e.g. six months before the census date (January 2008 in the REF) can be included in the submission. Also, submitting outputs (in October) before the end of the publication period (in December) complicated matters around publications that are published before the end of the year
by institutions that seek to submit an optimal balance between volume and quality. 34 One interviewee argued that perhaps the starting point of identifying impact should be society, rather
than research excellence: i.e. are any of the changes in society attributable to research? Moreover, it was suggested that the impact agenda does not necessarily capture the voice of beneficiaries.

35
Appendix A Methodology
A.1 Institutional surveys and interviews
The primary objective of this study is to estimate the cost of the REF. We build on the analysis conducted by RAND,35 which estimated the cost of preparing the research impact assessment.
Our primary data collection focuses on estimating all other costs related to preparing submissions to the REF. These costs were estimated using a survey that was sent to the REF Manager(s) at each of the 20 HEIs in our sample, which was completed in January and February 2015. In all cases the individual returns were discussed with REF Managers, as part of a series of clarifications and for our final verification. In addition, we interviewed Pro-Vice Chancellors for Research, or their equivalents, at 19 of the HEIs, in order to obtain a more qualitative and strategic view about costs and benefits.
A.2 Sampling strategy
We used a random sampling technique with replacement to select 20 HEIs from the total population of HEIs that made submissions to the REF 2014. We constructed a representative sample based on three criteria:
• Total number of Category A full time equivalent staff (FTE) included in each institution’s REF submission, to capture size and research intensity
• The number of UOAs included in an institution’s submission, also allowing for the possibility of multiple submissions to UOAs. This number was used as a proxy for institutional specialisation, as well as providing an indication of the size of the HEIs
• The location of each institution by home country (Northern Ireland, Scotland or Wales) or English region. This characteristic was used to ensure the sample had a good geographical distribution
A sample population was computed using an algorithm which generates a sample that is as representative as possible in terms of the above described selection criteria.36 Several sample replacements were made. First, in order to minimise survey fatigue, we excluded any the HEIs that had participated in the 2014 evaluation of the REF impact submission process (RAND), with one exception, University College London (UCL), because it is one of three HEIs with the largest number of submitted UOAs (35). Second, we wished to include a small number of the HEIs that were part of the RAE 2008 Accountability Review, in order to improve the read-across between the two exercises. The following five universities were part of the RAE 2008 Accountability Review and the REF 2014 Accountability Review:
• Bath Spa University
• Harper Adams University
• University of Hertfordshire
• King's College London
35 RAND (2015). Preparing impact submissions for REF 2014: An evaluation. Approach and evidence. 36 The algorithm used a two-sample Kolmogorov-Smirnov tests for the selection criteria “Size” and “Specialization” and Chi-square test for the categorical selection criteria “Geography” See Kontopantelis, E. 2013. A Greedy Algorithm for Representative Sampling: repsample in Stata. Journal of Statistical Software, Vol 55.

36
• London School of Hygiene & Tropical Medicine
Following the first draw, we made six sampling replacements.37 The final selection of HEIs is shown in Table 7.
Table 7 Sample population
Sample population
Bath Spa University University of Bolton
Glasgow School of Art University of Brighton
Harper Adams University University of Cumbria
King's College London University of Greenwich
London School of Hygiene & Tropical Medicine University of Hertfordshire
Newcastle University University of South Wales
Nottingham Trent University University of Ulster
Open University University of Westminster
Robert Gordon University University of Worcester
University College London University of York
The final sample was benchmarked against the total research funding that the HEIs are to receive for the academic year 2014-15 (following the initial allocation set out in the October 2014 funding announcement by HEFCE). This research-funding list included 132 HEIs. The final sample includes two universities in the top 10, by income: King’s College London and University College London. It also includes two additional universities in the top 20, by income: University of York and Newcastle University. And, an additional three HEIs in the top 50, by income: the Open University, University of Brighton and the London School of Hygiene and Tropical Medicine.
The sample also includes a range of HEIs with different characteristics: e.g. ranging from relatively new HEIs to more established HEIs and former polytechnics and Russell Group universities. The final sample also includes a range of HEIs that responded to few audit questions (i.e. less than 10) and a range of universities that responded to a large number of audit questions (the highest number of responses in our sample being 204).
Finally, we also compared the percentage point change in market share, contrasting the score of the HEIs on the RAE and the REF. The majority of HEIs in our sample lost some percentage point share relative to the RAE. A few HEIs scored equally well and a few HEIs’ percentage point change in market share is positive. Altogether, this
37 In order to replace one HEI with another without compromising the representativeness of our overall sample, we categorised all HEIs with reference to the sampling criteria. First, we group the HEI according to (1.) the number of UOA submissions based on the 25th, 50th and 75th population percentile thresholds, (2.) the headcount of category A staff submitted based on the 25th, 50th and 75th population percentile thresholds, and (3) according to geographic region. For example, we replaced one HEI with the University of Hertfordshire. Both the replaced HEI and the University of Hertfordshire are located in the East of England and sat in the 50th-75th percentile of UOA submissions and Category A headcount. Following five replacements, we find that there is a slight oversampling of specialised and smaller HEIs and a slight under sampling of larger HEIs. Therefore, we replaced another HEI with King’s College London, which also participated in the RAE 2008 Accountability Review. Both the replaced HEI and King’s College London are located in the administrative area of Greater London.

37
suggests that our sample of HEIs should not reflect an overly positive or negative view of the REF.
A.3 Survey
A.3.1 Data collected
The survey used a spreadsheet-based cost model to collect information on staff time and cash costs associated with preparing the REF submission. The survey covered two main components: central time and costs related to managing the REF submission process; and staff time and costs related to preparing the individual UOA submissions. The survey was directed to the REF Manager(s), to minimise any further burden on the academic staff. In most cases (and possibly in all cases), the central team liaised with senior colleagues in schools and departments in order to better estimate the scope of the activities involved in preparing the individual UOA submissions.
All 20 participants returned their completed surveys in good time. To ensure that the survey was completed to the highest standard possible, Technopolis sought to identify any outliers and followed-up with REF research managers to clarify any pending questions.
We fielded various queries about the survey from REF Managers, which were detailed points of clarification about the scope of a given function or grade of staff, which suggests the generic cost model was sufficiently robust and that the data collection process was conducted as intended. Moreover, the survey results, the cost and time spent on different REF components, were compared across UOAs and across HEIs to identify any obvious/possible anomalies, which would need to be checked back with the contributors. No significant outliers were identified.
Estimations of cash costs include the following:
• External support such as consultants and ‘critical friends’
• ICT system extensions or upgrades
• New software purchases or licences
• Other items in the REF budget
• Other REF related expenditure outside the REF budget
Estimates of academic and managerial input (time) were requested in hours. At the central level, we asked respondents to itemise staff time for the following groups:
• REF project management team
• HR department
• ICT department
• Other parts of central services (e.g. academic registry, planning office, etc.)
• Senior academic staff (e.g. time spent by the members of the institutional REF steering committee in overseeing the process)
• Other staff contributions
Respondents were also invited to estimate the proportion of time spent on REF by grade of staff: junior-grade professional staff (below lecturer equivalent), middle-grade professional staff (lecturer or senior lecturer equivalent) and senior-grade professional staff (professorial equivalent).
At the UOA level, we invited respondents to estimate staff time for the following groups:
• UOA review group and academic champion
• Administrative support staff

38
• Submitted academic staff
• Other eligible academic staff (not submitted)
• Member/assessor of the REF academic panels
• Other staff
Each HEI in our sample has allocated the overall proportion of time spent by submitted and non-submitted academic staff time into three categories: junior-grade academic (lecturer or researcher), middle-grade academic (principal/senior lecturer or senior researcher) and senior-grade academic (professor, senior leadership). Moreover, the time spent by the UOA review group and academic champion includes time from academic staff with different levels of seniority. Based on information provided by 10 HEIs in our sample we constructed an average breakdown for the sample population where 73% of the time spent is allocated to ‘Professors’, 11% of the time spent is allocated to ‘Senior Lecturers (pre 92 institution) or Principal Lecturers (post 92 institution)’, and 16% of the time spent is allocated to ‘Lecturers B (pre 92) or Senior Lecturers (post 92). The staff categories are summarised in Table 9.
A.3.2 Monetising time
In order to monetise the time spent on the REF we used data from the HESA staff record on annual salaries. These steps are also outlined in Table 8 using an example. First, we compute day-rates by dividing median full-time equivalent annual salary for each staff category by the number of full-time equivalent (FTE) annual working hours and working days.
We follow the approach of RAND38 and assume that a FTE post comprises 1950 work hours a year (7.5 hours per day, 37.5 hours a week and 260 days a year). This approach deviates from the Transparent Approach to Costing (TRAC) methodology, which HEIs generally use to cost their activities. However, the advantage is that this approach, to some degree, captures the ‘effective costs’ of submitting to the REF, reflecting the fact that quite a lot of preparatory work is carried out by professional and research staff as over-time, alongside their many other duties.
Having computed an hourly rate and a day rate using gross salary data, we then adjust the rates by adding on-costs for Employers’ National Insurance Contributions (ENICs) and employers’ contributions to staff pensions, which together we assume to be 30%.
Table 8 Example: monetising labour time for a Professor
Cost (£) Annual salary (median salary for professorial grade, 2012-13) £69,410 Equivalent hourly rate £35.59 Total cost based on gross salary (for 500 hours) £17,797 Total cost, including on-costs (for 500 hours) £23,137
38 RAND (2015). Preparing impact submissions for REF 2014: An evaluation. Approach and evidence.

39
Table 9 Convergence table for monetising labour time
Staff category description HESA job type grouping
Median salary of
non-clinical staff at UK
HEIs split by job category
(2012-13) • REF project management team: senior-grade
professional (professorial equivalent) Senior Management Team
£81,000
• REF project management team: middle-grade professional (lecturer or senior lecturer equivalent)
• Staff time within other parts of central services (e.g. research services, academic registry, planning office, etc.)
• HR staff time • ICT staff time • Library staff • Staff dealing with research output collation • Marketing and strategy officers
Professional occupations
£36,300
• REF project management team: junior-grade professional (below lecturer equivalent)
• Support staff at UOA level • Administrative staff on the equality and
diversity panel/complex circumstances panel
Administrative and secretarial occupations
£22,700
• Senior academic staff (e.g. time spent by the members of the institutional REF steering committee in overseeing the process)
Academic leadership♣
£64,000
• Submitted and not submitted academic staff: senior-grade academic (professor, senior leadership)
• REF academic panels: panel member/assessor • UOA review group and academic champion • Academic staff on Special Circumstances
committee and appeals committees • Senior academic staff on the equality and
diversity panel/complex circumstances panel
Professor £69,410
• UOA review group and academic champion Senior Lecturer (pre 92), Principal Lecturer (post 92)
£53,230
• Submitted and not submitted academic staff: middle-grade academic (principal/senior lecturer or senior researcher)
• UOA review group and academic champion
Lecturer B (pre 92), Senior Lecturer (post 92)♠
£44,610
• Submitted and not submitted academic staff: junior-grade academic (lecturer or researcher)
• UOA review group and academic champion
Lecturer A (pre 92), Lecturer (post 92)
£34,220

40
Staff category description HESA job type grouping
Median salary of
non-clinical staff at UK
HEIs split by job category
(2012-13) • Other staff time spent at the UOA level (‘critical
friends’ providing workshops/support to UOAs, website design, etc.)
Lecturer B (pre 92), Senior Lecturer (post 92)!
£44,610
♣The HESA job type ‘Academic leadership’ is chosen over that of ‘Professor’ to reflect the fact that not all senior academic staff are professors ♠The HESA job type ‘Lecturer B (pre 92), Senior Lecturer (post 92)’ is chosen over that of ‘Senior Lecturer (pre 92), Principal Lecturer (post 92)’ because some survey respondents included early career researchers as middle-grade academic staff. One HEI in our sample suggested one middle grade academic was also part of an independent panel dealing with complex circumstances !We apply a middle-range salary scale to reflect that this time spent may include that of a Professor, professional staff, and/or other administrative staff
A.3.3 Scaling up costs
In order to estimate the cost of REF to the UK HE community, we first aggregate all REF-related costs for the 20 HEIs in our sample, excluding the costs of panellists. This figure is used to compute an estimate of the average cost of REF for each submitted category A academic (8,931 in our sample). We scale up to the UK by multiplying the average cost per submitted academic for our sample by the total number of category A academics included in the REF (55,766).39 The cost estimates are presented in section 3.1.
We use an alternative approach to scale up the cost of panellists. Given our sample size (20 HEIs) and the concentration of panellists in the larger (research-intensive) HEIs in the sample, we judged it was more appropriate to scale up these costs using the population of panel members as a reference rather than the number of academics included in the REF.40 To arrive at a cost estimate of the time spent by panel members we first compute the average time spent per panel member (total time/number of panellists). Based on our survey we collected time estimates for 109 panel members.41 We find that, on average, panel members spent 533 hours, or 71 days, on panel duties: we monetised this time commitment by applying the median salary for a Professor, with 30% on-costs. Next, we compute the total cost of panellists by multiplying the cost per panellist in our sample by the total number of REF sub & main panel members, excluding impact assessors (934). Impact assessors are not included because, for the most, they were employed outside academia and therefore their cost estimate is outside the scope of this review. Because we collected data from HEIs, we were not in a position to estimate the time spent by impact assessors. However, RAND have produced an estimate of time spent by these panellists, which could inform cost
39 Our approach to scaling up the cost of REF is alike to that used in the REF 2008 Accountability Review. 40 Given our small sample size and the concentration of panellists in larger (research-intensive) HEIs, it
also seems more appropriate to account for the average time panellists spent rather than the average time spent across an HEI or the average time spent across UOAs.
41 There is considerable variation in the data. The nature of the individual HEI returns and accompanying comments suggests that the variation in the data is influenced by (1) the period of time panellists were active on a given panel, (2) the role of the panel members and (3) the reading material of panellists.

41
estimates of other studies. According to RAND42, the median amount of time spent by impact assessors on panel duties was 11 days.
Based on this approach, the total cost to the community of those panellists contributions amounts to around £23M. There was also a direct financial cost to the UK funding bodies that paid panel members’ fees, with a final budget of around £3.6M. We offset our estimated cost of panellists by £3.6M, which we include as part of the cost of the REF to funding bodies (estimated costs amount to £19M when rounded, see section 3.1).
A.4 Interviews
In order to gain a more in-depth understanding of the costs and benefits of the REF we interviewed PVCs of Research, directors of research, and/or research strategy and policy managers at 19 HEIs in our sample. The semi-structured interviews covered the following topics:
• The change from RAE to REF and the impact on cost/benefit
• The most burdensome/challenging part of the submission
• The management of the submission process
• The extent to which submitting to the REF generates strategic insight and other benefits
• The extent to which submitting to the REF is part of the HEI’s strategy
• Recommendations for future exercises
On the basis of the interviews, we have sought to contextualise the data collected in the survey.
42 RAND (2015). Assessing impact submissions for REF 2014: an evaluation.

42
Appendix B Units of assessment
Table 10 UOAs in REF 2014
Unit of Assessment (UOA)
HEI submissions made under main panel A
1 Clinical Medicine 2 Public Health, Health Services and Primary Care 3 Allied Health Professions, Dentistry, Nursing and Pharmacy 4 Psychology, Psychiatry and Neuroscience 5 Biological Sciences 6 Agriculture, Veterinary and Food Science
HEI submissions made under main panel B
7 Earth Systems and Environmental Sciences 8 Chemistry 9 Physics 10 Mathematical Sciences 11 Computer Science and Informatics
12 Aeronautical, Mechanical, Chemical and Manufacturing Engineering
13 Electrical and Electronic Engineering, Metallurgy and Materials
14 Civil and Construction Engineering 15 General Engineering
HEI submissions made under main panel C
16 Architecture, Built Environment and Planning 17 Geography, Environmental Studies and Archaeology 18 Economics and Econometrics 19 Business and Management Studies 20 Law 21 Politics and International Studies 22 Social Work and Social Policy 23 Sociology 24 Anthropology and Development Studies 25 Education 26 Sport and Exercise Sciences, Leisure and Tourism
HEI submissions made under main panel D
27 Area Studies 28 Modern Languages and Linguistics 29 English Language and Literature 30 History 31 Classics 32 Philosophy 33 Theology and Religious Studies 34 Art and Design: History, Practice and Theory 35 Music, Drama, Dance and Performing Arts
36 Communication, Cultural and Media Studies, Library and Information Management

43
Appendix C Graphical presentation of sample analyses
Figure 13 Sampling distribution of Category A staff FTE submitted
Figure 14 Sampling distribution by number of UOAs included in submission
020
4060
0 1000 2000 3000 0 1000 2000 3000
Remainder of population Sample
Perc
ent
Category A staff FTE submitted
010
2030
0 10 20 30 40 0 10 20 30 40
Remainder of population Sample
Perc
ent
Number of UOA included in submission

44
Figure 15 Sampling distribution by geographic region
Remainder of population Sample
East Midlands East of EnglandGreater London North EastNorth West Northern IrelandScotland South EastSouth West WalesWest Midlands Yorkshire and the Humber
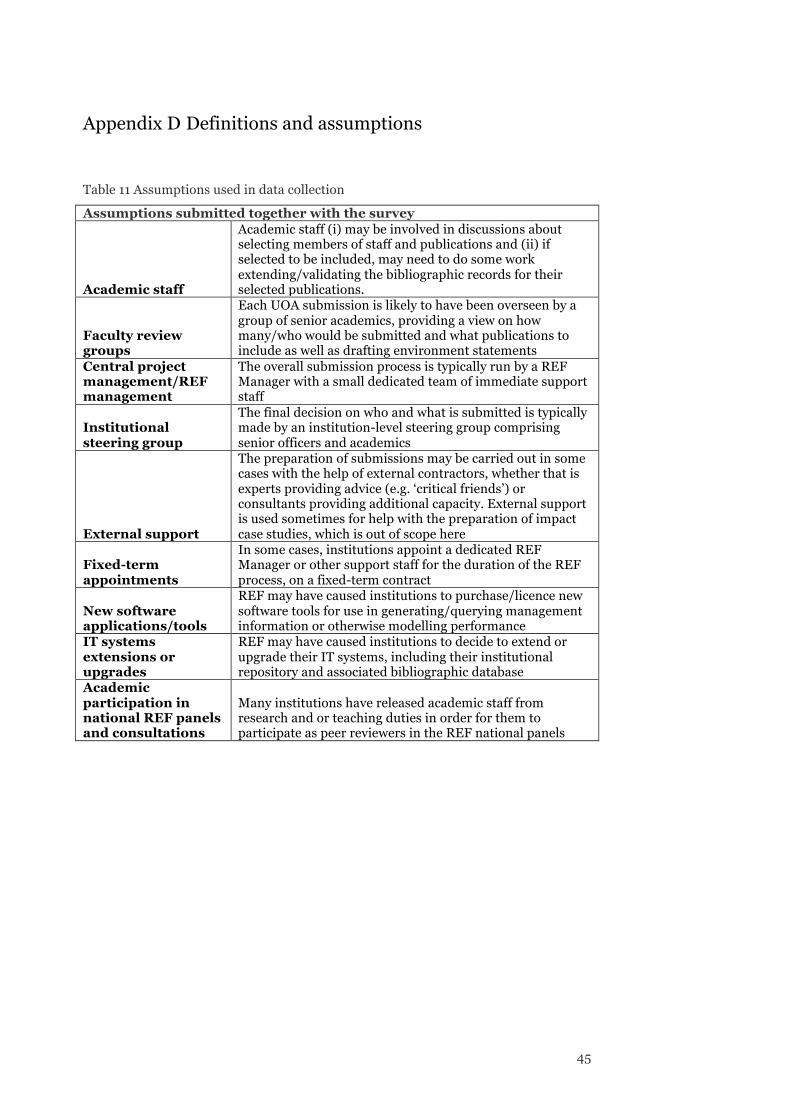
45
Appendix D Definitions and assumptions
Table 11 Assumptions used in data collection
Assumptions submitted together with the survey
Academic staff
Academic staff (i) may be involved in discussions about selecting members of staff and publications and (ii) if selected to be included, may need to do some work extending/validating the bibliographic records for their selected publications.
Faculty review groups
Each UOA submission is likely to have been overseen by a group of senior academics, providing a view on how many/who would be submitted and what publications to include as well as drafting environment statements
Central project management/REF management
The overall submission process is typically run by a REF Manager with a small dedicated team of immediate support staff
Institutional steering group
The final decision on who and what is submitted is typically made by an institution-level steering group comprising senior officers and academics
External support
The preparation of submissions may be carried out in some cases with the help of external contractors, whether that is experts providing advice (e.g. ‘critical friends’) or consultants providing additional capacity. External support is used sometimes for help with the preparation of impact case studies, which is out of scope here
Fixed-term appointments
In some cases, institutions appoint a dedicated REF Manager or other support staff for the duration of the REF process, on a fixed-term contract
New software applications/tools
REF may have caused institutions to purchase/licence new software tools for use in generating/querying management information or otherwise modelling performance
IT systems extensions or upgrades
REF may have caused institutions to decide to extend or upgrade their IT systems, including their institutional repository and associated bibliographic database
Academic participation in national REF panels and consultations
Many institutions have released academic staff from research and or teaching duties in order for them to participate as peer reviewers in the REF national panels

46
Table 12 Definitions
Definition
DEL Department for Employment and Learning (Northern Ireland)
ECR Early Career Researcher ENICs Employers’ National Insurance Contributions FTE Full-time equivalent HEFCE Higher Education Funding Council for England HEFCW Higher Education Funding Council for Wales HE Higher Education HEI Higher Education Institution HESA Higher Education Statistics Agency HR Human Resources IT Information Technology ICT Information and Communication Technology PVC Pro-Vice Chancellor QR Quality Related RAE Research Assessment Exercise REF Research Excellence Framework REF1a/b/c Staff details REF2 Research outputs REF3a/b Impact template and case studies REF4a/b/c Environment data REF5 Environment template SFC Scottish Funding Council TRAC Transparent Approach to Costing UOA Unit of Assessment

47
Appendix E Attributing costs to the REF
The figures below present the results of our survey question asking REF Managers of our sample HEIs to indicate the proportion of staff time/costs that is wholly attributable to REF. The figures present the results for the different types of staff. Blanks suggest that no costs/time spent was indicated as part of the survey for the specific staff category.
Figure 16 Proportion of central staff time/costs wholly attributable to REF, by HEI
0% 20% 40% 60% 80% 100%
HEI20 HEI19 HEI18 HEI17 HEI16 HEI15 HEI14 HEI13 HEI12 HEI11 HEI10 HEI9 HEI8 HEI7 HEI6 HEI5 HEI4 HEI3 HEI2 HEI1
Central staff costs/time atributable to the REF
Central staff costs/time 'business as usual'

48
Figure 17 Proportion of UOA review group and academic champion staff time/costs wholly attributable to REF, by HEI
Figure 18 Proportion of support staff time/costs wholly attributable to REF, by HEI
0% 20% 40% 60% 80% 100%
HEI20 HEI19 HEI18 HEI17 HEI16 HEI15 HEI14 HEI13 HEI12 HEI11 HEI10 HEI9 HEI8 HEI7 HEI6 HEI5 HEI4 HEI3 HEI2 HEI1
UOA review group and academic champion costs/time atributable to the REF UOA review group and academic champion costs/time 'business as usual'
0% 20% 40% 60% 80% 100%
HEI20 HEI19 HEI18 HEI17 HEI16 HEI15 HEI14 HEI13 HEI12 HEI11 HEI10 HEI9 HEI8 HEI7 HEI6 HEI5 HEI4 HEI3 HEI2 HEI1
Support staff costs/time atributable to the REF
Support staff costs/time 'business as usual'

49
Figure 19 Proportion of submitted academic staff time/costs wholly attributable to REF, by HEI
Figure 20 Proportion of ‘not submitted’ eligible academic staff time/costs wholly attributable to REF, by HEI
0% 20% 40% 60% 80% 100%
HEI20 HEI19 HEI18 HEI17 HEI16 HEI15 HEI14 HEI13 HEI12 HEI11 HEI10 HEI9 HEI8 HEI7 HEI6 HEI5 HEI4 HEI3 HEI2 HEI1
Submitted academic staff costs/time atributable to the REF
Submitted academic staff costs/time 'business as usual'
0% 20% 40% 60% 80% 100%
HEI20 HEI19 HEI18 HEI17 HEI16 HEI15 HEI14 HEI13 HEI12 HEI11 HEI10 HEI9 HEI8 HEI7 HEI6 HEI5 HEI4 HEI3 HEI2 HEI1
Other eligible academic staff (not submitted) costs/time atributable to the REF Other eligible academic staff (not submitted) costs/time 'business as usual'

technopolis |group| United Kingdom 3 Pavilion Buildings Brighton BN1 1EE United Kingdom T +44 1273 204320 E [email protected] www.technopolis-group.com
![ACCOUNTABILITY REPORT 2013 › ... › 01 › EDUCO-ACCOUNTABILITY-REPO… · Accountability report 2013 [3]](https://img.pdfslide.us/doc/110x75/5f03b5847e708231d40a62a8/accountability-report-2013-a-a-01-a-educo-accountability-repo-accountability.jpg)