Embed Size (px)
Citation preview
ORIGINAL PAPER
Redwood of the reef: growth and age of the giant barrel spongeXestospongia muta in the Florida Keys
S. E. McMurray Æ J. E. Blum Æ J. R. Pawlik
Received: 14 March 2008 / Accepted: 30 May 2008 / Published online: 20 June 2008
� Springer-Verlag 2008
Abstract The growth of animals in most taxa has long
been well described, but the phylum Porifera has remained
a notable exception. The giant barrel sponge Xestospongia
muta dominates Caribbean coral reef communities, where
it is an important spatial competitor, increases habitat
complexity, and filters seawater. It has been called the
‘redwood of the reef’ because of its size (often[1 m height
and diameter) and presumed long life, but very little is
known about its demography. Since 1997, we have estab-
lished and monitored 12 permanent 16 m diameter circular
transects on the reef slope off Key Largo, Florida, to study
this important species. Over a 4.5-year interval, we mea-
sured the volume of 104 tagged sponges using digital
images to determine growth rates of X. muta. Five models
were fit to the cubed root of initial and final volume esti-
mates to determine which best described growth.
Additional measurements of 33 sponges were taken over
6-month intervals to examine the relationship between the
spongocoel, or inner-osculum space, and sponge size, and
to examine short-term growth dynamics. Sponge volumes
ranged from 24.05 to 80,281.67 cm3. Growth was variable,
and specific growth rates decreased with increasing sponge
size. The mean specific growth rate was 0.52 ± 0.65 year-1,
but sponges grew as fast or slow as 404 or 2% year-1.
Negative growth rates occurred over short temporal scales
and growth varied seasonally, significantly faster during
the summer. No differences in specific growth rate were
found between transects at three different depths (15, 20,
30 m) or at two different reef sites. Spongocoel volume
was positively allometric with increasing sponge size and
scaling between the vertical and horizontal dimensions of
the sponge indicated that morphology changes from a
frustum of a cone to cylindrical as volume increases.
Growth of X. muta was best described by the general von
Bertalanffy and Tanaka growth curves. The largest sponge
within our transects (1.23 9 0.98 m height 9 diameter)
was estimated to be 127 years old. Although age extra-
polations for very large sponges are subject to more error,
the largest sponges on Caribbean reefs may be in excess of
2,300 years, placing X. muta among the longest-lived
animals on earth.
Introduction
Sponges are important components of coral reef ecosys-
tems (Diaz and Rutzler 2001). In the Caribbean, sponges
rival reef-building corals in diversity and abundance
(Targett and Schmahl 1984; Suchanek et al. 1985). They
filter large amounts of water (Reiswig 1971; Pile et al.
1997) and compete for space in the benthic community
(Suchanek et al. 1985; Engel and Pawlik 2005). Addi-
tionally, coral reef sponges serve as habitat for a large
number of other invertebrate taxa (e.g., Duffy 1992; Hen-
kel and Pawlik 2005) and host a diverse array of microbes
that may take part in primary production or nitrification
(Rutzler 1985; Diaz and Ward 1997).
Communicated by A. McLachlan.
S. E. McMurray � J. R. Pawlik (&)
Department of Biology and Marine Biology,
Center for Marine Science, University of North Carolina,
5600 Marvin K Moss Lane, Wilmington, NC 28409, USA
e-mail: [email protected]
J. E. Blum
Department of Mathematics and Statistics,
University of North Carolina, 601 South College Road,
Wilmington, NC 28403, USA
123
Mar Biol (2008) 155:159–171
DOI 10.1007/s00227-008-1014-z

Growth, form, and size influence the ecology and func-
tional significance of an organism in its community (Peters
1983; Werner and Gilliam 1984). In addition, the size of an
organism may explain patterns in life histories (Blueweiss
et al. 1978). Despite the importance of understanding
growth, size, and other demographic data, limited informa-
tion exists for sponges. Some studies have been conducted
on species that are encrusting (Elvin 1976; Ayling 1983;
Turon et al. 1998; Garrabou and Zabala 2001; Tanaka 2002),
rope-form (Wulff 1985) and tubular (Lesser 2006; Trussell
et al. 2006), but less is known about massive species (Rei-
swig 1973; Hoppe 1988). Studies of sponge growth rates
have been hindered by many difficulties: most species grow
slowly (Reiswig 1973) requiring long-term monitoring, they
have high inter- and intra-specific variation in morphology,
and they exhibit indeterminate growth (Sebens 1987). In
addition, growth rates of sponges may be highly variable
(e.g., Duckworth and Battershill 2001; Garrabou and Zabala
2001), many species do not tolerate or are too large for
manipulation, and there are no morphological or internal
structures that accrete regularly so as to indicate age.
The giant barrel sponge Xestospongia muta is a con-
spicuous and abundant member of reef communities
throughout the Caribbean, where it is an important com-
ponent of habitat heterogeneity (Humann 1992; Buettner
1996). Populations of this species occupy greater than 9%
of the available reef substrate in some regions (Zea 1993);
on the reefs off Key Largo, Florida, mean densities of
X. muta are *0.2 sponges m-2 (McMurray and Pawlik,
unpublished data), and the biomass of this species exceeds
that of any other benthic invertebrate. Individuals are often
very large, with heights and diameters in excess of 1 m,
and X. muta is believed to be long lived, with anecdotal
estimates ranging from 100 to [1,000 years old (Humann
1992; Gammill 1997), although little is known about the
growth of this species.
The purpose of this study was to measure growth rates
of X. muta by applying image-analysis measurement
techniques to repeated digital images of sponges in situ.
Measurements were conducted across different temporal
and spatial scales to identify patterns of sponge growth.
Scaling of sponge dimensions was assessed to examine
changes in sponge morphology with increased size. Growth
functions were fitted to measurement data to describe
sponge growth and obtain age estimates for this species.
Materials and methods
Study sites and monitoring
Growth of X. muta was studied at permanent 16 m-dia-
meter circular transects on Conch Reef [24056.996N;
80027.223W] and Pickles Reef [24059.272N; 80024.660W],
Key Largo, Florida, as part of a long-term monitoring
program begun in 1997. On Conch Reef, 3 transects were
established at 15, 20 and 30 m depth, and at Pickles Reef
(*6 km from Conch Reef), 3 transects were established at
15 m depth. Because of bottom-time limitations of
SCUBA-diving at depth, transects at 20 and 30 m at Conch
Reef were set-up using NOAA’s underwater habitat
‘‘Aquarius’’ as a base of operations. Subsequent twice-
yearly monitoring was undertaken by SCUBA diving from
surface vessels using compressed air or nitrox. Within each
transect, each sponge was mapped and given a unique
stainless steel tag attached with a plastic cable-tie to a
masonry nail driven into the limestone substratum next to
the base of the sponge. Sponges were surveyed and each
was photographed from above and in profile with a digital
camera in the spring and fall of each year from 2000 to
2007. Due to inclement weather and limitations presented
in the field, every sponge was not always photographed
during each field season. A slate was photographed in each
digital image, held parallel to the central axis of each
sponge in side images and parallel to the plane of the top of
the osculum in top images, displaying the unique tag
number of each sponge and a 16 cm scale marker. For the
purposes of this study, the spongocoel is defined as the
central cavity of X. muta.
Field measurements
Field measurements were performed on sponges in per-
manent transects on Conch and Pickles reefs to test the
accuracy of the digital image measurement technique (see
below), examine the relationship between sponge volume
and spongocoel volume, and determine if a seasonal pattern
of growth exists for X. muta. Initial measurements of 33
sponges were taken in May 2006 and these sponges were
revisited in November 2006 and May 2007. The 6 month
interval between May and November 2006 was considered
the summer season and the final 6 month interval was
considered the winter season. Sponge height, base cir-
cumference, and osculum diameter were measured with a
flexible plastic measuring tape (to ±1.0 mm). Volume was
calculated using the equation for the geometric model of a
frustum of a cone:
Vsponge ¼1
12ph od2 þ odð Þ bdð Þ þ bd2� �
; ð1Þ
where Vsponge = sponge volume (cm3); h = height (cm);
od = osculum diameter (cm); and bd = base diameter
(cm) (Fig. 1).
Equation 1 applies to the three most common mor-
phologies of X. muta: cylinder, frustum of a cone, and
inverse frustum of a cone. Additional measurements of
160 Mar Biol (2008) 155:159–171
123

spongocoel depth and inner diameter were performed and
spongocoel volume was calculated by applying the equa-
tion for the frustum of a cone:
Vspongocoel ¼1
12psd sb2 þ sbð Þ odð Þ þ od2� �
; ð2Þ
where Vspongocoel = spongocoel volume (cm3); sd = depth
of spongocoel (cm); sb = spongocoel base diameter (cm);
and od = osculum diameter (cm) (Fig. 1).
The relationship between spongocoel volume and
sponge volume was described by the allometric equation:
Vspongocoel ¼ aVbsponge: ð3Þ
Field data was loge-transformed so that the equation
becomes:
loge Vspongocoel ¼ loge aþ b loge Vsponge: ð4Þ
Linear regression was performed to determine the scaling
coefficient, a, and the scaling exponent, b of Eq. 4.
Because a predictive relationship was sought, ordinary
least squares regression (OLS) was used (Sokal and Rohlf
1995; Warton et al. 2006). A logarithmic correction factor
was applied to eliminate bias in the scaling coefficient
estimate resulting from the conversion from log to arith-
metic units (Baskerville 1971; Sprugel 1983). The actual
slope was tested against an isometric slope of b = 1 with a
t-test. Analysis of covariance (ANCOVA) was used to test
for differences between sampling periods with sponge
volume as the covariate and measurement period (May
2006, November 2006, May 2007) as a fixed factor.
Specific growth rates were calculated as:
G ¼ V2 � V1
V1
� 1
dt; ð5Þ
where G = specific growth rate (year-1); V1 = initial
volume (cm3); V2 = final volume (cm3); and t = time
(years). Spearman rank correlation was used to examine the
relationship between initial volume and specific growth
rate for each season. Differences in specific growth rates
between summer and winter seasons were tested with a
paired sample t-test.
Digital image measurements
A cross-sectional approach was employed to study growth
of X. muta. Size-increment data were obtained from digital
images taken in May 2001 and December 2005, a period
spanning 4.5 years. These timepoints were chosen because
they included the largest number of measurable sponges
with initial and final photographs compared to other field
seasons. A total of 104 sponges, representing a broad range
of sizes present in the population, were selected for study.
Sponges from both Conch and Pickles reefs and from all
three depths at Conch Reef were measured, but only
sponges with characteristic ‘‘barrel’’ morphologies that had
not experienced any obvious damage or tissue loss were
included.
Measurements of sponges from digital images were
made with UTHSCA Image Tool software. Measurements
of sponge height and base diameter were taken from side
images and two perpendicular measurements of osculum
diameter were taken from top images (to ±1.0 mm). For
the two osculum diameter measurements, the first diameter
was chosen as the longest possible diameter, with the
second perpendicular to the first. Volume was calculated by
applying Eq. 1 for a frustum of a cone (Fig. 1).
A paired-sample t-test was used to test for differences
between volume estimates from digital image measure-
ments and from field measurements, uncorrected for
spongocoel volume, for data from November 2006. As
digital image estimates assume a solid geometry and do not
account for the volume of the spongocoel, Eq. 3 was used
to obtain spongocoel volume estimates for sponges mea-
sured with digital image analysis. Spongocoel estimates
were then subtracted from original sponge volume
Fig. 1 Frustum of a cone
geometric approximation of
X. muta, side and top view.
Measurements used for digital
image analysis were: h sponge
height, bd base diameter,
od osculum diameter.
Additional measurements taken
in the field were: sd spongocoel
depth; sb spongocoel base
diameter
Mar Biol (2008) 155:159–171 161
123
estimates to correct for spongocoel volume. Specific
growth rates were calculated by applying Eq. 5. Spearman
rank correlation was used to examine the relationship
between initial volume and specific growth rate estimates
for digital image data, corrected for spongocoel volume.
A Walford (1946) plot was constructed with loge final
volume on the ordinate and loge initial volume on the
abscissa. Differences in growth between depths were tested
with a one-way ANCOVA with initial volume as the
covariate and depth (10, 20 and 30 m) as a fixed factor.
Differences in growth between Pickles and Conch reefs at
15 m depth were similarly tested with a one-way
ANCOVA. Following Trussell (1997), OLS regressions
were used because techniques for model II ANCOVA are
unavailable (Sokal and Rohlf 1995).
To examine the relationship between size and morpho-
logy, scaling relationships between height, base diameter,
and osculum diameter were determined. Relationships
between final and initial sizes of each dimension were
similarly determined. The geometric mean of initial and
final measurements was used in regressions between dif-
fering dimensions. Measurements were log10-transformed
and reduced-major-axis (RMA) regression was used
because of measurement error in the independent variable
(Ricker 1973). To test actual slope against an isometric
slope of b = 1, the T statistic and degrees of freedom were
calculated with equations from McArdle (1988).
Growth models
Five commonly used growth functions were fit to size-
increment data to determine which model best described
growth of X. muta: the general von Bertalanffy growth
formula (gVBGF) (von Bertalanffy 1938; Beverton and
Holt 1957; Pauly 1981), specialized von Bertalanffy
growth formula (sVBGF) (Richards 1959; Pauly 1981),
Gompertz (Gompertz 1825; Winsor 1932), Richards
(Richards 1959; Ebert 1980), and Tanaka (Tanaka 1982)
growth functions. Growth equations were obtained from
Brey (2001) and Tanaka (1982).
For brevity, only the Tanaka growth function will be
detailed below, as it best describes indeterminate growth.
For the following equations, S1 is the initial size (cm) and
S2 is the final size (cm) after time interval dt (4.5 years); St
is a continuous function of t (years) and S0 is size at time
zero.
The Tanaka function (Tanaka 1982):
S2 ¼ 1=f 0:5� �
ln 2Gþ 2 G2 þ fa� �0:5
� �þ d
where G ¼ E=4ð Þ � fa=Eð Þ þ f ; E ¼ e f 0:5ð Þ S1�dð Þð6Þ
Or
St¼ 1=f 0:5� �
ln 2f T�cð Þþ2 f 2 T�cð Þ2þfa� �0:5
� �þd
whereT¼ t=dt; c¼ a=Eð Þ� E=4fð Þ; E¼e f 0:5ð Þ S0�dð Þ
ð7Þ
is sigmoid with an initial period of slow growth, and a
period of exponential growth followed by growth that
slows but never reaches an asymptote. The biological
meanings associated with the parameters are: a = related
to maximum growth rate (&1/a0.5); c = age at which
growth is maximum; d = shifts size at which growth is
maximum; f = measure of the rate of change of the growth
rate (Tanaka 1982, 1988). The influence of each parameter
on the shape of the curve is demonstrated in Ebert et al.
(1999) and Ebert (1999).
The cube root of volume estimates, corrected for
spongocoel volume, was used as an average linear size to
model growth of X. muta. The difference equations of the
models were fitted to final and initial linear sizes on a
Walford plot by nonlinear regression (NLIN procedure
SAS).
The sum of squared error (SSE), coefficient of deter-
mination and Akaike (1973) information criterion (AIC)
were used to evaluate model fit. The AIC selects the most
parsimonious candidate model by evaluating the trade-off
between model bias that results from too few parameters
versus variance that results from too many (Burnham and
Anderson 2002). Therefore, AIC values can be used to
evaluate any differences between the 2- and 3-parameter
models that may otherwise be neglected through use of the
SSE as the sole fitting criteria. In model selection, the
model with the lowest SEE and AIC is sought. Because
sample size, n, was small with respect to the number of
model parameters, K, (n/K \ 40), the second-order cor-
rection, AICc was used (Burnham and Anderson 2002).
The model selection criteria AIC differences, Di, give a
measure of each model relative to the best model; and
Akaike weights, wi, are normalized relative likelihood
values which give the probability that a given model is the
best of the candidate models (Burnham and Anderson
2002).
Parameter estimates were used to produce size-at-age
curves using the integrated forms of the growth functions.
Growth functions were then cubed to obtain volume-at-age
plots. In contrast to the four determinate models, Tanaka
parameters described growth for 4.5 year intervals because
the time interval between initial and final sizes is not
included in the difference equation for this model. To
determine parameters for yearly growth, nonlinear regres-
sion was performed to refit the curve. The parameter t0 was
determined by solving each function at t = 0. The size of
the smallest sponge measured in the dataset was used as
162 Mar Biol (2008) 155:159–171
123
size at t = 0 for all curves. Analyses were conducted with
SPSS (vers. 14.0.0 for Windows, SPSS, Inc., Chicago, IL,
USA) and SAS (vers. 9.1.3 for Windows, SAS Institute
Inc., Cary, NC, USA) statistical software.
Results
Growth rates
Estimates of volume of individual X. muta from field
measurements did not significantly differ from estimates
using digital images (paired t-test; P = 0.26, t31 =
-1.16). Initial volume estimates from digital image
analysis, corrected for spongocoel volume, ranged from
24.05 to 80,281.67 cm3. There was a significant negative
correlation between specific growth rate and initial vol-
ume (rs = -0.798, P B 0.01). All sponges had positive
growth over the study interval and there was large vari-
ation in growth rates. The mean (±1 SD) specific growth
rate was 0.52 ± 0.65 year-1. Growth rates as fast as
4.04 year-1 and as slow as 0.02 year-1 were observed.
In terms of volume, sponges gained an average of
1,955.37 ± 2,221.09 cm3 year-1. ANCOVA analysis of
loge-transformed initial and final volume data indicated
that there was no significant effect of depth (F2,68 = 2.75,
P = 0.07) or reef location (F1,60 = 1.55, P = 0.22) on
growth rate. Although not significant, mean growth was
greater for sponges at 20 and 15 m depths compared to
sponges at 30 m.
The initial volumes of sponges measured in the field
ranged from 26.69 to 150,492.90 cm3. Specific growth rate
during the summer was negatively correlated with initial
volume (rs = -0.69, P B 0.01), but no significant corre-
lation was found between initial volume and specific
growth rate during winter (rs = -0.105, P = 0.56).
Growth over the entire year was significantly correlated
with initial volume, with rates decreasing with increasing
volume (rs = -0.67, P B 0.01). Sponges grew signifi-
cantly faster in summer compared to winter (paired t-test;
P = 0.001, t32 = 3.65). Mean (±1 SD) specific growth
rates during the summer and winter were 0.94 ± 1.20 and
0.14 ± 0.42 year-1, respectively. The mean specific
growth rate over the entire year was 1.15 ± 1.42 year-1. In
terms of volume, sponges gained an average of
4,195.53 ± 4,080.01 cm3 during summer compared to
1,472.40 ± 6,173.16 cm3 during winter. Growth was vari-
able and three sponges experienced negative growth in
summer while ten decreased in size over winter. When
these sponges were omitted from analyses, positive growth
rates remained significantly greater in the summer com-
pared to winter (paired t-test; P = 0.003, t19 = 3.37).
Spongocoel volume
Spongocoel volumes measured in the field ranged from 0.61
to 57,543.51 cm3 for sponges with non-corrected volumes
(i.e., uncorrected for spongocoel volume) of 27.31 and
223,529.96 cm3, respectively. There was no significant
effect of measurement period on the relationship between
spongocoel volume and non-corrected sponge volume
(ANCOVA; F2,98 = 0.793, P = 0.46). Data from all three
measurement periods were therefore pooled and used to
determine the parameters of the allometric equation (Eq. 3).
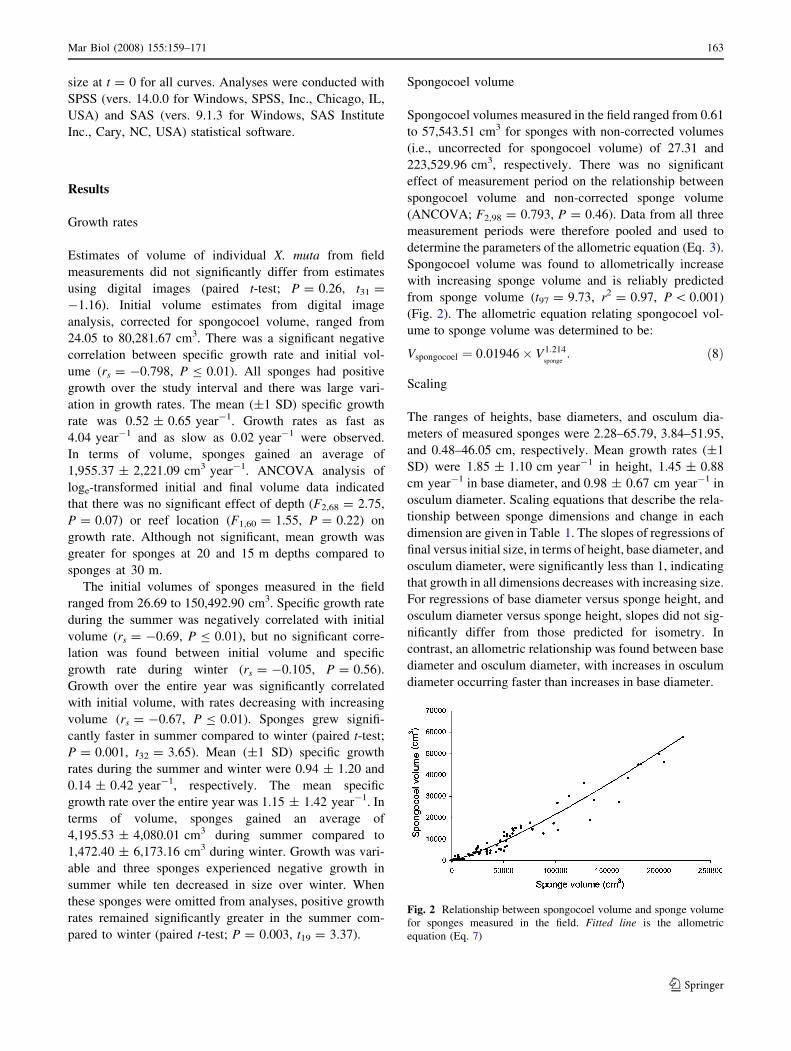
Spongocoel volume was found to allometrically increase
with increasing sponge volume and is reliably predicted
from sponge volume (t97 = 9.73, r2 = 0.97, P \ 0.001)
(Fig. 2). The allometric equation relating spongocoel vol-
ume to sponge volume was determined to be:
Vspongocoel ¼ 0:01946 � V1:214sponge
: ð8Þ
Scaling
The ranges of heights, base diameters, and osculum dia-
meters of measured sponges were 2.28–65.79, 3.84–51.95,
and 0.48–46.05 cm, respectively. Mean growth rates (±1
SD) were 1.85 ± 1.10 cm year-1 in height, 1.45 ± 0.88
cm year-1 in base diameter, and 0.98 ± 0.67 cm year-1 in
osculum diameter. Scaling equations that describe the rela-
tionship between sponge dimensions and change in each
dimension are given in Table 1. The slopes of regressions of
final versus initial size, in terms of height, base diameter, and
osculum diameter, were significantly less than 1, indicating
that growth in all dimensions decreases with increasing size.
For regressions of base diameter versus sponge height, and
osculum diameter versus sponge height, slopes did not sig-
nificantly differ from those predicted for isometry. In
contrast, an allometric relationship was found between base
diameter and osculum diameter, with increases in osculum
diameter occurring faster than increases in base diameter.
Fig. 2 Relationship between spongocoel volume and sponge volume
for sponges measured in the field. Fitted line is the allometric
equation (Eq. 7)
Mar Biol (2008) 155:159–171 163
123
Growth models
Because X. muta has a variety of morphologies (i.e., low
growth form with base diameter greater than height, high
growth form with base diameter less than height), no one
linear measurement best characterized sponge size. More-
over, the Tanaka growth model failed to converge when
modeling volumetric growth. Therefore, the cube root of
digital image volume estimates, corrected for spongocoel
volume, was used to model growth of X. muta. This mea-
surement of size is useful because it inherently accounts for
the spongocoel correction and morphology of the sponge.
Parameter estimates for each of the five growth models
are presented in Table 2. A number of fitting criteria were
used to assess the fit of the models (Table 3). The models,
in order of best fit are: gVBGF = Richards [ Tanaka [sVBGF [ Gompertz (Table 3). The Richards model con-
verged on the gVBGF as one of its special cases. Therefore
further mention of the gVBGF will refer to both models.
AICc values were in agreement with the SSE and did not
indicate substantial differences between the models. Ak-
aike weights revealed that there is a 22 and 21% chance,
respectively, of the gVBGF and Tanaka being the best of
the candidate models. Low Akaike weights are indicative
of the large variation in observed growth and inclusion of
poor models (e.g., sVBGF and Gompertz) in the set of
candidate models.
The gVBGF and Tanaka models were selected for fur-
ther analysis, as the best of the candidate models, based on
model fit. An evidence ratio, the ratio of Akaike weights,
indicates that the gVBGF is only 1.07 times more likely to
be the best model, given the set of candidate models. A
Walford plot of final and initial sizes with the fitted models
is presented in Fig. 3. Both models describe initial growth
that gradually increases to a maximum and slowly attenu-
ates with increasing size. Initial growth is slightly
overestimated and the models start to diverge at larger size
classes. The primary difference between the two models is
the description of growth for the largest size classes. A plot
of the two growth curves for both linear size and volume
(Fig. 4a, b) shows the same patterns observed in Fig. 3.
The gVBGF describes faster growth for larger individuals
and approaches an asymptotic size of 6,612.11 cm. The
Tanaka curve describes relatively constant growth rates for
larger size classes. Extrapolation of the Tanaka curve to
3,000 years shows slowly attenuating growth that never
reaches an asymptote (Fig. 4c). The age estimates obtained
from the gVBGF and Tanaka curves for the largest sponge
measured over the 4.5 year interval are 53 and 55 years,
respectively.
Discussion
Redwood of the reef?
Although X. muta is a dominant member of Caribbean
coral reef ecosystems, with average densities of
*0.2 individuals m-2 (McMurray and Pawlik, unpub-
lished data), and covering [9% of available hard
substratum on some reefs (Zea 1993), remarkably little is
known of its demography. This species has been anecdot-
ally reported to be long-lived (Humann 1992; Gammill
1997), but no measurement data related to age could be
found in the scientific literature. Using our data and the
Tanaka growth model, we can confirm the extreme lon-
gevity of X. muta, and can calculate ages of very large
specimens based on their dimensions. The largest sponge
Table 1 Reduced-major axis regression equations for scaling anal-
ysis of linear measurements of Xestospongia muta
Regression r2 df T
log base diameter (Y) versus log height (X)
log Y = 0.82 log X + 0.27 0.79*** 75 1.95NS
log osculum diameter (Y) versus log height (X)
log Y = 1.21 log X - 0.52 0.74*** 76 1.62NS
log base diameter (Y) versus log osculum diameter (X)
log Y = 0.68 log X + 0.61 0.85*** 73 4.40***
log heightt+Dt (Y) versus log heightt (X)
log Y = 0.80 log X + 0.42 0.88*** 72 2.94**
log base diametert+Dt (Y) versus log base diametert (X)
log Y = 0.74 log X + 0.47 0.88*** 72 3.73***
log osculum diametert+Dt (Y) versus log osculum diametert (X)
log Y = 0.72 log X + 0.47 0.89*** 72 4.35***
The T statistic was used to test actual slope against an isomeric slope
of b = 1 for each regression
*** P \ 0.001, **P \ 0.01, NS not significant
Table 2 Parameter estimates for growth functions fitted to cubed root of final and initial volumes; n = 104
gVBGF Richards Tanaka sVBGF Gompertz
S? = 66.1211 S? = 66.1213 a = 0.5548 S? = 138.3 S? = 52.4541
k = 0.0388 k = 0.0388 f = 0.00254 k = 0.0102 k = 0.0711
d = 1.8972 d = -1.8972 d = 68.9563
Function parameters were estimated by nonlinear regression (NLIN procedure SAS)
164 Mar Biol (2008) 155:159–171
123

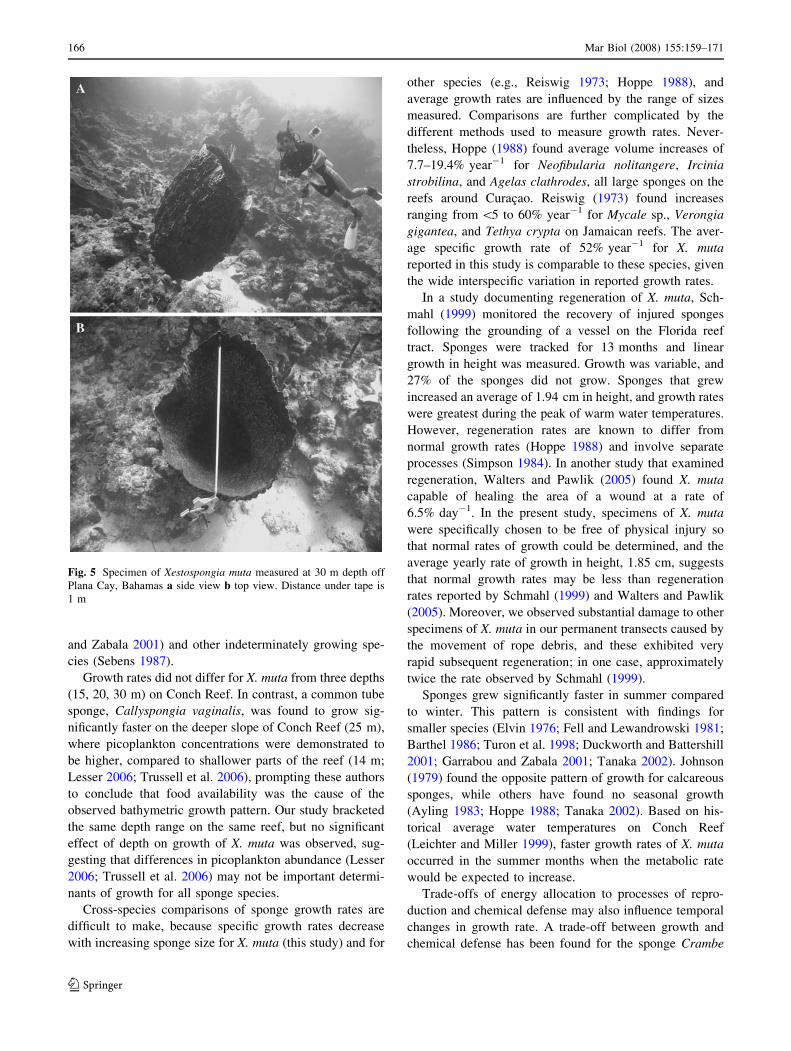
within our transects (1.23 m high, 0.98 m diameter) is
estimated to be 127 years old. In June 2007, we measured
two specimens of X. muta at 30 m depth off Plana Cay,
Bahamas [22036.441N, 73037.555W]: one was 170 cm in
height, 305 cm in base circumference, and 81.5 cm aver-
age osculum diameter, while the second was 140, 300 and
96.5 cm, respectively (Fig. 5). The volume estimates for
these sponges, corrected for spongocoel volume, were
662,147.30 and 632,912.80 cm3; and age estimates,
obtained from the Tanaka growth model, were 258 and
242 years, respectively. Size estimates of an even larger
specimen of X. muta from Curacao (photograph in Nagel-
kerken et al. 2000) provide an age estimate of
*2,300 years, although age estimates of sponges of this
size are rather significant extrapolations and may be subject
to more error than for smaller sponges. Nevertheless, this
estimate greatly surpasses the age of the oldest reported
individual (non-clonal) animal, the Ocean Quahog Arctica
islandica, at 374 years (Schone et al. 2005), and places it
on par with the oldest known redwood tree, Sequoia sem-
pervirens (*2,000 years old) in Humboldt Redwoods
State Park, California (HRIA 2006). Considering their
large size and great age, ‘‘redwood of the reef’’ is an apt
designation for X. muta.
Growth rates
Specific growth rates of X. muta were found to decrease
with increasing sponge volume. The same trend has been
observed for many sponge species (Reiswig 1973; Hoppe
1988; Leys and Lauzon 1998; Garrabou and Zabala 2001).
In contrast, Duckworth and Battershill (2001) found no
differences in growth rates among the range of size classes
studied. Wulff (1985) observed decreased growth rates
with increasing size in only one of three rope-form species.
It was hypothesized that relatively constant surface area to
volume ratios of rope-form species allow for less influence
of size on growth rates (Wulff 1985). For X. muta, physio-
logical or mechanical limits may constrain growth in larger
size classes while there may be a selective advantage for
relatively faster growth of small sponges. The observed
variability in growth rates is characteristic of sponges
(Reiswig 1973; Dayton et al. 1974; Fell and Lewandrowski
1981; Ayling 1983; Wulff 1985; Hoppe 1988; Leys and
Lauzon 1998; Duckworth and Battershill 2001; Garrabou
Table 3 Growth function fitting criteria
Model K r2 SSE AICc Di wi
gVBGF 3 0.935 689.3 202.7 0 0.2213
Richards 3 0.935 689.3 202.7 0 0.2213
Tanaka 3 0.935 690.2 202.8 0.1357 0.2068
sVBGF 2 0.933 705.2 203.1 0.2505 0.1952
Gompertz 2 0.933 708.3 203.5 0.7067 0.1554
K Number of parameters, r2 coefficient of determination, SSE sum of
squared error, AICC second order correction for the Akaike Infor-
mation Criterion, Di Akaike differences, wi Akaike weights
Fig. 3 Walford plot of initial size (St) and size 4.5 years later (St+4.5).
Plotted sizes are the cube root of volume estimates. Fitted lines are
the gVBGF and Tanaka function with parameters from Table 2
Fig. 4 gVBGF and Tanaka growth curves from parameter estimates
in Table 2. a Linear size as a function of time; b linear sizes from (a)
cubed for volume as a function of time; c same curve as (b) with time
expanded out to 3,000 years
Mar Biol (2008) 155:159–171 165
123
and Zabala 2001) and other indeterminately growing spe-
cies (Sebens 1987).
Growth rates did not differ for X. muta from three depths
(15, 20, 30 m) on Conch Reef. In contrast, a common tube
sponge, Callyspongia vaginalis, was found to grow sig-
nificantly faster on the deeper slope of Conch Reef (25 m),
where picoplankton concentrations were demonstrated to
be higher, compared to shallower parts of the reef (14 m;
Lesser 2006; Trussell et al. 2006), prompting these authors
to conclude that food availability was the cause of the
observed bathymetric growth pattern. Our study bracketed
the same depth range on the same reef, but no significant
effect of depth on growth of X. muta was observed, sug-
gesting that differences in picoplankton abundance (Lesser
2006; Trussell et al. 2006) may not be important determi-
nants of growth for all sponge species.
Cross-species comparisons of sponge growth rates are
difficult to make, because specific growth rates decrease
with increasing sponge size for X. muta (this study) and for
other species (e.g., Reiswig 1973; Hoppe 1988), and
average growth rates are influenced by the range of sizes
measured. Comparisons are further complicated by the
different methods used to measure growth rates. Never-
theless, Hoppe (1988) found average volume increases of
7.7–19.4% year-1 for Neofibularia nolitangere, Ircinia
strobilina, and Agelas clathrodes, all large sponges on the
reefs around Curacao. Reiswig (1973) found increases
ranging from \5 to 60% year-1 for Mycale sp., Verongia
gigantea, and Tethya crypta on Jamaican reefs. The aver-
age specific growth rate of 52% year-1 for X. muta
reported in this study is comparable to these species, given
the wide interspecific variation in reported growth rates.
In a study documenting regeneration of X. muta, Sch-
mahl (1999) monitored the recovery of injured sponges
following the grounding of a vessel on the Florida reef
tract. Sponges were tracked for 13 months and linear
growth in height was measured. Growth was variable, and
27% of the sponges did not grow. Sponges that grew
increased an average of 1.94 cm in height, and growth rates
were greatest during the peak of warm water temperatures.
However, regeneration rates are known to differ from
normal growth rates (Hoppe 1988) and involve separate
processes (Simpson 1984). In another study that examined
regeneration, Walters and Pawlik (2005) found X. muta
capable of healing the area of a wound at a rate of
6.5% day-1. In the present study, specimens of X. muta
were specifically chosen to be free of physical injury so
that normal rates of growth could be determined, and the
average yearly rate of growth in height, 1.85 cm, suggests
that normal growth rates may be less than regeneration
rates reported by Schmahl (1999) and Walters and Pawlik
(2005). Moreover, we observed substantial damage to other
specimens of X. muta in our permanent transects caused by
the movement of rope debris, and these exhibited very
rapid subsequent regeneration; in one case, approximately
twice the rate observed by Schmahl (1999).
Sponges grew significantly faster in summer compared
to winter. This pattern is consistent with findings for
smaller species (Elvin 1976; Fell and Lewandrowski 1981;
Barthel 1986; Turon et al. 1998; Duckworth and Battershill
2001; Garrabou and Zabala 2001; Tanaka 2002). Johnson
(1979) found the opposite pattern of growth for calcareous
sponges, while others have found no seasonal growth
(Ayling 1983; Hoppe 1988; Tanaka 2002). Based on his-
torical average water temperatures on Conch Reef
(Leichter and Miller 1999), faster growth rates of X. muta
occurred in the summer months when the metabolic rate
would be expected to increase.
Trade-offs of energy allocation to processes of repro-
duction and chemical defense may also influence temporal
changes in growth rate. A trade-off between growth and
chemical defense has been found for the sponge Crambe
Fig. 5 Specimen of Xestospongia muta measured at 30 m depth off
Plana Cay, Bahamas a side view b top view. Distance under tape is
1 m
166 Mar Biol (2008) 155:159–171
123

crambe in the Mediterranean (Turon et al. 1998), but a
relationship between growth and reproduction has yet to be
established. The chemical defense of X. muta is variable
and is not correlated to sponge size (Chanas and Pawlik
1997); however, no study has examined temporal patterns
of metabolite production in this species. Likewise, little is
known about reproduction of X. muta. The age of first
reproduction is unknown and little information exists on
the timing of reproduction. Spawning has been observed in
both spring and late summer (May 2004: Ritson-Williams
et al. 2005; May 2005: McMurray, personal observation;
and September 2007, O. Rutten, personal communication).
Recruitment has also been observed in the spring and fall
(Pawlik, unpublished data), suggesting that X. muta
reproduces at least twice yearly. Growth rates are expected
to decrease with increased reproduction if a trade-off in
energy allocation between these two processes exists.
Energy diverted from growth to gamete production may
occur over several months, which could explain lower
growth rates in the winter, prior to spawning in May.
However, not all sponges in the population spawn during
any one season (Pawlik, unpublished data), and some
spawn in the fall, so there is not a clear trade-off between
reproduction and growth.
Coral reef sponges may obtain food as picoplankton
from the water column (Lesser 2006), or derive it from
symbiotic algae (Frost and Williamson 1980; Hill 1996).
Picoplankton availability as a function of depth may
influence spatial differences in growth rates of some tube
sponges (Lesser 2006; Trussell et al. 2006) but a similar
relationship was not observed for X muta, and seasonal
picoplankton abundance on Conch Reef would not be
expected to vary sufficiently to explain seasonal differ-
ences in sponge growth. In a study of the growth of the
sponge Halichondria panacea, Barthel (1986) found that
temporal patterns were explained by water temperature and
not correlated with food. Seasonal variation in light levels
would be important if photoautotrophic cyanobacterial
symbionts provided nutrition to X. muta, as has been
demonstrated for other coral reef sponges (Wilkinson and
Cheshire 1988). While X. muta does harbor cyanobacteria,
available evidence suggests that they are commensals that
do not benefit the host sponge (Thacker 2005; Lopez-
Legentil et al. 2008).
Field measurements revealed variable growth of X. muta,
with shrinkage occurring for some sponges. It has been well
documented that sponge growth is highly plastic (Reiswig
1973; Barthel 1986; Turon et al. 1998; Garrabou and Zabala
2001), and shrinkage rates are also known to be lower than
rates of growth (Garrabou and Zabala 2001). Plasticity is a
common characteristic of indeterminate growth (Sebens
1987). The patterns of seasonal growth and short-term
shrinkage events highlight the influence that the temporal
scale of measurements has on observed growth rates. Field
measurements over half-year intervals revealed dynamic
growth processes, while the image-analysis technique, used
over a much longer time interval, integrated short-term
processes and provided smoothed growth rates.
Spongocoel volume
The spongocoel has been excluded in geometric volume
approximations of sponge size in previous studies of large
reef species (e.g., Reiswig 1973), and the present study is
the first to address scaling of the spongocoel with sponge
size. Spongocoel volume was positively allometric with
increasing sponge size, necessitating the correction of
geometric approximations for spongocoel volume across a
broad range of sponge size-classes. In the present study,
sponge volumes and growth rates would be overestimated
without correcting for this relationship. It is unclear why
larger sponges have a proportionally larger spongocoel, but
two important functions are likely responsible: water
pumping (Reiswig 1971) and reproduction (Ritson-
Williams et al. 2005). The spongocoel functions as the
excurrent site for water pumped through the sponge. The
relationship between pumping rates and spongocoel vol-
ume is unknown; however pumping rates are known to
increase proportionally with tissue volume (Reiswig 1975).
Increased spongocoel volume may aid pumping rates as
sponges grow larger, thus potentially reducing physio-
logical problems associated with large size (Schmidt-
Nielson 1974). The positive allometry between spongocoel
volume and sponge volume also increases the ratio of
surface area to sponge volume. The outer surface of a
sponge is covered with ostia for water intake, and subse-
quently, food capture, waste removal, and gas exchange
(Reiswig 1971). During reproduction, the spongocoel is the
excurrent site for gametes during spawning events (Ritson-
Williams et al. 2005). Reproductive output is expected to
increase with sponge size and this may require an
increasingly larger spongocoel, with a proportionally
greater surface area, as sponges grow larger.
Scaling
Scaling relationships between sponge dimensions charac-
terize the form of sponge growth (Schmidt-Nielson 1974).
The way in which an organism grows has many ecological
implications (Werner and Gilliam 1984). For example,
Hoppe (1988) found significantly faster vertical rates of
growth compared to horizontal for the sponge Ircinia
strobilina and attributed this difference as a strategy to
avoid competition. In the present study, growth in height,
base diameter, and osculum diameter were compared. Both
horizontal measures of base and osculum diameter
Mar Biol (2008) 155:159–171 167
123

increased at the same rate as vertical growth (height).
While a significant allometric relationship was not found
between these dimensions, examination of the slopes of the
regressions reveals a tendency for base diameter to increase
slower than height and for osculum diameter to increase
faster than height (Table 1). Osculum diameter was found
to widen significantly faster than base diameter. As X. muta
grows, its morphology changes from a frustum of a cone to
a cylinder, or barrel-shape, with osculum diameter equal or
larger than base diameter. There are, of course, exceptions
to this generality and growth form may be influenced by an
array of physical (e.g., water flow) and biological factors
(e.g., damage by fish or turtle grazing).
gVBGF and Tanaka growth models
Among all the growth models considered, the gVBGF and
Tanaka growth models were found to provide the best fit to
the data. The Walford plot of size-increment data (Fig. 3)
shows that, indicative of indeterminate growth, all sponges
were actively growing. Both curves fit the wide range of
size classes measured for the current study. The primary
difference in the fit of the two curves lies within the large
size-classes: the gVBGF extrapolates growth beyond the
largest measured sponge to approach an asymptote, while
the Tanaka describes slowly attenuating growth. Much
larger individuals of X. muta exist on Conch Reef, and
throughout the Caribbean, than those included in this study
(e.g., Nagelkerken et al. 2000). In fact, estimated volumes
for the largest individuals exceed the asymptote of all
asymptotic growth curves studied. The Tanaka curve does
not have an asymptote and is therefore the most relevant
model to describe growth of X. muta. The Tanaka function
has previously been used to describe growth of other
marine invertebrates, including sea urchins (Ebert et al.
1999; Rogers-Bennett et al. 2003) and molluscs (Tanaka
1988).
The growth curve determined for X. muta is conserva-
tive in several aspects. First, the volume used at time zero,
24.05 cm3, is an overestimation of true volume at settle-
ment. Measuring growth of recruits is imposed by the
limits of detection in the field. Recruits that are approxi-
mately 5 cm3 were frequently observed and larvae of
X. muta have been reported to be 0.1–0.2 mm in length
(Lindquist and Hay 1996). The growth of these earliest
stages is presently unknown and may occur over a sig-
nificant length of time. Because of their plastic nature, a
decoupling of sponge size and age may exist in some
cases. Sponges have the ability to lose large amounts of
volume and regenerate (Henry and Hart 2005). When
X. muta suffers partial mortality, a ring of multi-oscule
remnants may regenerate at the base of the sponge.
Through time, remnants have been observed to grow and
fuse with reduction in the number of osculae as the sponge
grows, although the resulting form is not typical. Should a
regenerated sponge grow sufficiently to restore single-
osculum morphology, the application of the Tanaka
growth curve to establish its age would result in an
underestimation.
Can the growth model derived herein be used to esti-
mate the age of specimens of X. muta at other locations in
the tropical and subtropical Western Atlantic? A definitive
answer awaits additional research, but our data indicate
little reason to believe otherwise. Physical and biological
parameters are remarkably similar on coral reefs through-
out the greater Caribbean (e.g., Goreau et al. 1993), which
may partially explain the consistency of the flora and fauna
over such a large biogeographic region. We detected no
differences in growth of X. muta as a function of depth,
despite differences in temperature and picoplankton
availability along this cline (Lesser 2006; Trussell et al.
2006). Seasonal cycles of temperature are common to
Caribbean reefs at all latitudes, with an offset of tempera-
ture between northern and southern reefs of only a few
degrees (Goreau et al. 1993). Further, there is no reason to
believe that growth rates of X. muta have changed over
decadal to millennial scales; our recent transect data show
population increases in X. muta over the past decade
(McMurray and Pawlik, unpublished data), suggesting that
sponges are generally healthy. Interestingly, it remains to
be seen whether growth and age may reliably be predicted
from our data for the closely related Indo-Pacific giant
barrel sponge, Xestospongia testudinaria, which occur at
similar sizes and densities on Australia’s Great Barrier
Reef (Fromont and Bergquist 1994).
Implications for conservation and management
The worldwide decline of coral reef ecosystems has
prompted many local restoration efforts (Jaap 2000; Precht
2006). Funding devoted to restoration can be substantial; for
example, one 1994 ship grounding on a coral reef resulted
in a $3.9 million remediation settlement (NOAA 1997).
Efforts typically focus on reattachment of reef-building
corals (e.g., Hudson et al. 2007), but based on our data,
greater emphasis should be placed on large coral reef
sponges. Future remediation settlements should take into
consideration the importance of barrel sponges to habitat
complexity, as well as their great age. In addition to damage
from vessel groundings, X. muta may be affected by the
cutting movements of chain, rope, or monofilament fishing
line, particularly as these items are dragged during storm
events (Schmahl 1999; Chiappone et al. 2002, 2005). After
these events, detached large sponges are commonly found,
still alive and intact, between reef spurs on sand or rubble
where they slowly erode under the action of oscillating
168 Mar Biol (2008) 155:159–171
123

currents. We have recently developed new techniques for
the reattachment of dislodged X. muta to the reef substratum
(McMurray and Pawlik 2008).
Perhaps greater than the threat of physical damage
affecting X. muta populations is the increasing evidence of
disease affecting large coral reef sponges (Webster 2007).
We recently described a syndrome ‘‘sponge orange band’’
(SOB), that usually results in the death of X. muta on which
it is observed (Cowart et al. 2006). In fact, the largest and
oldest sponge (*130 years) in our permanent transects
succumbed to this syndrome within 6 weeks in July 2005
(Cowart et al. 2006). The same syndrome was likely
responsible for the death of the very large sponge described
from Curacao by Nagelkerken et al. (2000), estimated at
*2,300 years old. We have observed that the number of
sponges affected by this syndrome is highly patchy within
sponge populations, and its intensity changes greatly from
year to year. It is not clear if this syndrome is a new
phenomenon, but if sponges in the population have an
equal probability of contracting it in any given year, the
likelihood that any individual sponge will survive to a great
age would diminish. If diseases of sponges similar to SOB
are becoming more prevalent (Webster 2007), we would
predict profound changes in the age structure of long-lived
coral reef sponges such as X. muta.
Acknowledgments This study was funded by grants to JRP from
the National Undersea Research Program at UNCW (NOAA
NA96RU-0260) and from the National Science Foundation, Biolog-
ical Oceanography Program (OCE-0095724, 0550468). Particular
thanks to Timothy Henkel, who designed the database for storing and
retrieving photographs and the staff of NOAA/NURC in Key Largo,
Florida, for logistical support. Assistance in the field was provided by
Alan Bright, Jonathan Cowart, Sebastian Engel, Nick Foster, James
Gavin, Timothy Henkel, Adam Jones, Sarah Kelly, Wai Leong,
Susanna Lopez-Legentil, Tse-Lynn Loh, Greg McFall, Shobu Odate,
Will O’Neal, David Swearingen, Kyle Walters, and Kristen Whalan.
References
Akaike H (1973) Information theory and an extension of the
maximum likelihood principle. In: Petrov BN, Csaki F (eds)
Proceedings of the 2nd international symposium on information
theory. Akademiai Kiado, Budapest, pp 267–281
Ayling AL (1983) Growth and regeneration rates in thinly encrusting
Demospongiae from temperate waters. Biol Bull 165:343–352.
doi:10.2307/1541200
Barthel D (1986) On the ecophysiology of the sponge Halichondriapanacea in Kiel Bight. I. Substrate specificity, growth and
reproduction. Mar Ecol Prog Ser 32:291–298. doi:10.3354/
meps032291
Baskerville GL (1971) Use of logarithmic regression in the estimation
of plant biomass. Can J Res 2:49–5. doi:10.1139/x72-009
von Bertalanffy L (1938) A quantitative theory of organic growth
(inquires on growth laws II). Hum Biol 10:181–213
Beverton RJH, Holt SJ (1957) On the dynamics of exploited fish
populations. Fisheries Investigations of the Ministry of Agricul-
ture and Fisheries, Food in Great Britain (2. Sea Fish), 19.
Fascimile reprint 1993, Fish and Fisheries Series, Number 11.
Chapman and Hall, London
Blueweiss L, Fox H, Kudzma V, Nakashima D, Peters R, Sams S
(1978) Relationships between body size and some life history
parameters. Oecologia 37:257–272. doi:10.1007/BF00344996
Brey T (2001) Population dynamics in benthic invertebrates. A virtual
handbook. Version 01.2. Alfred Wegener Institute for Polar and
Marine Research, Germany. http://www.awi-bremerhaven.de/
Benthic/Ecosystem/FoodWeb/Handbook/main.html. Accessed
26 March 2007
Buettner H (1996) Rubble mounds of sand tilefish Malacanthusplumieri (Bloch, 1787) and associated fishes in Colombia. Bull
Mar Sci 58:248–260
Burnham KP, Anderson DR (2002) Model selection and multimodel
inference: a practical information-theoretical approach. Springer,
New York
Chanas B, Pawlik JR (1997) Variability in the chemical defense of the
Caribbean reef sponge Xestospongia muta. In: Lessios HA,
Macintyre IG (eds) Proceedings of the 8th international coral
reef symposium, vol 2. Smithsonian Tropical Research Institute,
Balboa, pp 1363–1368
Chiappone M, White A, Swanson DW, Miller SL (2002) Occurrence
and biological impacts of fishing gear and other marine debris in
the Florida Keys. Mar Pollut Bull 44:597–604. doi:
10.1016/S0025-326X(01)00290-9
Chiappone M, Dienes H, Swanson DW, Miller SL (2005) Impacts of
lost fishing gear on coral reef sessile invertebrates in the Florida
Keys National Marine Sanctuary. Biol Conserv 121:221–230.
doi:10.1016/j.biocon.2004.04.023
Cowart JD, Henkel TP, McMurray SE, Pawlik JR (2006) Sponge
orange band (SOB): a pathogenic-like condition of the giant
barrel sponge Xestospongia muta. Coral Reefs 25:513. doi:
10.1007/s00338-006-0149-y
Dayton PK, Robilliard GA, Paine RT, Dayton LB (1974) Biological
accommodation in the benthic community at McMurdo Sound,
Antarctica. Ecol Monogr 44:105–128. doi:10.2307/1942321
Diaz MC, Rutzler K (2001) Sponges: an essential component of
Caribbean coral reefs. Bull Mar Sci 69:535–546
Diaz MC, Ward BB (1997) Sponge-mediated nitrification in tropical
benthic communities. Mar Ecol Prog Ser 156:97–107. doi:
10.3354/meps156097
Duckworth AR, Battershill CN (2001) Population dynamics and
chemical ecology of New Zealand Demospongiae Latrunculiasp. nov. and Polymastia croceus (Poecilosclerida: Latrunculii-
dae: Polymastiidae). N Z J Mar Freshw Res 35:935–949
Duffy JE (1992) Host use patterns and demography in a guild of
tropical sponge-dwelling shrimps. Mar Ecol Prog Ser 90:127–
138. doi:10.3354/meps090127
Ebert TA (1980) Estimating parameters in a flexible growth equation,
the Richards function. Can J Fish Aquat Sci 37:687–692. doi:
10.1139/f80-086
Ebert TA (1999) Plant and animal populations: methods in demog-
raphy. Academic Press, San Diego
Ebert TA, Dixon JD, Schroeter SC, Kalvass PE, Richmond NT,
Bradbury WA et al (1999) Growth and mortality of red sea
urchins Strongylocentrotus franciscanus across a latitudinal
gradient. Mar Ecol Prog Ser 190:189–209. doi:10.3354/
meps190189
Elvin DW (1976) Seasonal growth and reproduction of an intertidal
sponge Haliclona permollis (Bowerbank). Biol Bull 151:108–
125. doi:10.2307/1540709
Engel S, Pawlik JR (2005) Interactions among Florida sponges: I.
Reef habitats. Mar Ecol Prog Ser 303:133–144. doi:10.3354/
meps303133
Fell PE, Lewandrowski KB (1981) Population dynamics of the
estuarine sponge, Halichondria sp., within a New England
Mar Biol (2008) 155:159–171 169
123

eelgrass community. J Exp Mar Biol Ecol 55:49–63. doi:
10.1016/0022-0981(81)90092-7
Fromont J, Bergquist PR (1994) Reproductive biology of three sponge
species of the genus Xestospongia (Porifera: Demospongiae:
Petrosida) from the Great Barrier Reef. Coral Reefs 13:119–126.
doi:10.1007/BF00300772
Frost TM, Williamson CE (1980) In situ determination of the effect of
symbiotic algae on the growth of the fresh water sponge
Spongilla lacustris. Ecology 61:1361–1370. doi:10.2307/
1939045
Gammill ER (1997) Identification of coral reef sponges. Providence
Marine Publishing, Inc, Tampa
Garrabou J, Zabala M (2001) Growth dynamics in four Mediterranean
demosponges. Estuar Coast Shelf Sci 52:293–303. doi:10.1006/
ecss.2000.0699
Gompertz B (1825) On the nature of the function expressive of human
mortality, and on a new mode of determining the value of life
contingencies. Philos Trans R Soc Lond Ser B 115:513–585
Goreau TJ, Hayes RL, Clark JW, Basla DJ, Robertson CN (1993)
Elevated sea surface temperatures correlate with Caribbean coral
reef bleaching. In: Geyer RA (ed) A global warming forum:
scientific, economic and legal overview. CRC Press, Boca Raton,
pp 225–255
Henkel TP, Pawlik JR (2005) Habitat use by sponge-dwelling
brittlestars. Mar Biol (Berl) 146:301–313. doi:10.1007/s00227-
004-1448-x
Henry L-A, Hart M (2005) Regeneration from injury and resource
allocation in sponges and corals—a review. Int Rev Hydrobiol
90:125–158. doi:10.1002/iroh.200410759
Hill MS (1996) Symbiotic zooxanthellae enhance boring and growth
rates of the tropical sponge Anthosigmella varians forma
varians. Mar Biol (Berl) 125:649–654. doi:10.1007/
BF00349246
Hoppe WF (1988) Growth, regeneration and predation in three
species of large coral reef sponges. Mar Ecol Prog Ser 50:117–
125. doi:10.3354/meps050117
HRIA (2006) Coast Redwood. Humboldt Redwoods Interpretive
Association. http://www.humboldtredwoods.org/. Accessed 20
December 2007
Hudson JH, Anderson J, Franklin EC, Schittone J, Stratton A (2007)
M/V Wellwood coral reef restoration monitoring report, mon-
itoring events 2004–2006. Florida Keys National Marine
Sanctuary Monroe County, Florida. Marine Sanctuaries Conser-
vation Series NMSP-07-02. U.S. Department of Commerce,
National Oceanic and Atmospheric Administration, National
Marine Sanctuary Program, Silver Spring, 50pp
Humann P (1992) Reef creature identification. New World Pub,
Jacksonville
Jaap WC (2000) Coral reef restoration. Ecol Eng 15:345–364. doi:
10.1016/S0925-8574(00)00085-9
Johnson MF (1979) Recruitment, growth, mortality and seasonal
variations in the calcareous sponge Clathrina coriacea (Mont-
agu) and C. blanca (Miklucho-Maclay) from Santa Catalina
Island, California. In: Levi C, Boury-Esnault N (eds) Biologie
des Spongiaires. Colloques Internationaux du CNRS 291, Paris,
pp 325–334
Leichter JJ, Miller SL (1999) Predicting high frequency upwelling:
spatial and temporal patterns of temperature anomalies on a
Florida coral reef. Cont Shelf Res 19:911–928. doi:10.1016/
S0278-4343(99)00004-7
Lesser MP (2006) Benthic-pelagic coupling on coral reefs: feeding
and growth of Caribbean sponges. J Exp Mar Biol Ecol 328:277–
288. doi:10.1016/j.jembe.2005.07.010
Leys SP, Lauzon NRJ (1998) Hexactinellid sponge ecology: growth
rates and seasonality in deep water sponges. J Exp Mar Biol Ecol
230:111–129. doi:10.1016/S0022-0981(98)00088-4
Lindquist N, Hay ME (1996) Palatability and chemical defense of
marine invertebrate larvae. Ecol Monogr 66:431–450. doi:
10.2307/2963489
Lopez-Legentil S, Song B, McMurray SE, Pawlik JR (2008)
Bleaching and stress in coral reef ecosystems: hsp70 expression
by the giant barrel sponge Xestospongia muta. Mol Ecol
17:1840–1849
McArdle BH (1988) The structural relationship: regression in
biology. Can J Zool 66:2329–2339
McMurray SE, Pawlik JR (2008) A novel technique for the reattach-
ment of large coral reef sponges. Restoration Ecol (in press)
Nagelkerken I, Aerts L, Pors L (2000) Barrel sponge bows out. Reef
Encounter 28:14–15
NOAA (1997) NOAA gears up for reef restoration at Looe Key:
university agrees to $3.9 million settlement for damage in
Florida Keys Sanctuary. http://www.publicaffairs.noaa.gov/pr97/
nov97/noaa97-r423.html
Pauly D (1981) The relationships between gill surface area and
growth performance in fish: a generalization of von Bertalanffy’s
theory of growth. Meeresforsch 28:251–282
Peters RH (1983) The ecological implications of body size.
Cambridge University Press, Cambridge
Pile AJ, Patterson MR, Savarese M, Chernykh VI, Fialkov VA (1997)
Trophic effects of sponge feeding within Lake Baikal’s littoral
zone. 2. Sponge abundance, diet, feeding efficiency, and carbon
flux. Limnol Oceanogr 42:178–184
Precht WF (2006) Coral reef restoration handbook. CRC Press, Boca
Raton
Reiswig HM (1971) In situ pumping activities of tropical Demo-
spongiae. Mar Biol (Berl) 9:38–50. doi:10.1007/BF00348816
Reiswig HM (1973) Population dynamics of three Jamaican Demo-
spongiae. Bull Mar Sci 23:191–226
Reiswig HM (1975) The aquiferous systems of three marine
Demospongiae. J Morphol 145:493–502. doi:10.1002/jmor.
1051450407
Richards FJ (1959) A flexible growth function for empirical use.
J Exp Bot 10:290–300. doi:10.1093/jxb/10.2.290
Ricker WE (1973) Linear regressions in fishery research. J Fish Res
Board Can 30:409–434
Ritson-Williams R, Becerro MA, Paul VJ (2005) Spawning of the
giant barrel sponge Xestospongia muta in Belize. Coral Reefs
24:160. doi:10.1007/s00338-004-0460-4
Rogers-Bennett L, Rogers DW, Bennett WA, Ebert TA (2003)
Modeling red sea urchin (Strongylocentrotus franciscanus)
growth using six growth functions. Fish Bull (Wash DC)
101:614–626
Rutzler K (1985) Associations between Caribbean sponges and
photosynthetic organisms. In: Rutzler K (ed) New perspectives
in sponge biology. Smithsonian Institution Press, Washington
DC, pp 455–466
Schmahl GP (1999) Recovery and growth of the giant barrel sponge
(Xestospongia muta) following physical injury from a vessel
grounding in the Florida Keys. Mem Queensl Mus 44:532
Schmidt-Nielson K (1974) Scaling in biology: the consequences of
size. J Exp Zool 194:287–307. doi:10.1002/jez.1401940120
Schone BR, Fiebig J, Pfeiffer M, Gleb R, Hickson J, Johnson A et al
(2005) Climate records from a bivalved Methuselah (Arcticaislandica, Mollusca; Iceland). Palaeogeogr Palaeoclimatol Pal-
aeoecol 228:130–14. doi:10.1016/j.palaeo.2005.03.049
Sebens KP (1987) The ecology of indeterminate growth in animals.
Annu Rev Ecol Syst 18:371–407. doi:10.1146/annurev.es.
18.110187.002103
Simpson TL (1984) The cell biology of sponges. Springer, New York
Sokal RR, Rohlf FJ (1995) Biometry: the principles and practice of
statistics in biological research, 3rd edn. W. H. Freeman and Co,
New York
170 Mar Biol (2008) 155:159–171
123
Sprugel D (1983) Correcting for bias in log-transformed allometric
equations. Ecology 64:209–210. doi:10.2307/1937343
Suchanek TH, Carpenter RC, Witman JD, Harvell CD (1985)
Sponges as important space competitors in deep Caribbean coral
reef communities. In: Reaka ML (ed) The ecology of deep and
shallow coral reefs, symposia series for undersea research 3(1),
NOAA/NURP, Rockville, pp 55–59
Tanaka K (2002) Growth dynamics and mortality of the intertidal
encrusting sponge Halichondria okadai (Demospongiae, Halic-
hondrida). Mar Biol (Berl) 140:383–389. doi:10.1007/
s002270100703
Tanaka M (1982) A new growth curve which expresses infinitive
increase. Pub Amakusa Mar Biol Lab Kyushu Univ 6:167–177
Tanaka M (1988) Eco-physiological meaning of parameters of ALOG
growth curve. Pub Amakusa Mar Biol Lab Kyushu Univ 9:103–
106
Targett NM, Schmahl GP (1984) Chemical ecology and distribution
of sponges in the Salt River Canyon, St. Croix, U.S.V.I. NOAA
Tech Mem OAR NURP-1
Thacker R (2005) Impacts of shading on sponge-cyanobacteria
symbioses: a comparison between host-specific and generalist
associations. Integr Comp Biol 45:369–376. doi:10.1093/icb/
45.2.369
Trussell GC (1997) Phenotypic plasticity in the foot size of an
intertidal snail. Ecology 8:1033–1048
Trussell GC, Lesser MP, Patterson MR, Genovese SJ (2006) Depth-
specific differences in growth of the reef sponge Callyspongiavaginalis: role of bottom-up effects. Mar Ecol Prog Ser 323:149–
158. doi:10.3354/meps323149
Turon X, Tarjuelo I, Uriz MJ (1998) Growth dynamics and mortality
of the encrusting sponge Crambe crambe (Poecilosclerida) in
contrasting habitats: correlation with population structure and
investment in defence. Funct Ecol 12:631–639. doi:10.1046/
j.1365-2435.1998.00225.x
Walford LA (1946) A new graphic method of describing the growth
of animals. Biol Bull 90:141–147. doi:10.2307/1538217
Walters KD, Pawlik JR (2005) Is there a trade off between wound-
healing and chemical defenses among Caribbean reef sponges?
Integr Comp Biol 45:352–358. doi:10.1093/icb/45.2.352
Warton DI, Wright IJ, Falster DS, Westoby M (2006) Bivariate line-
fitting methods for allometry. Biol Rev Camb Philos Soc
81:259–291. doi:10.1017/S1464793106007007
Webster NS (2007) Sponge disease: a global threat? Environ
Microbiol 9:1363–1375. doi:10.1111/j.1462-2920.2007.01303.x
Werner EE, Gilliam JF (1984) The ontogenetic niche and species
interactions in size-structured populations. Annu Rev Ecol Syst
15:393–425. doi:10.1146/annurev.es.15.110184.002141
Wilkinson CR, Cheshire AC (1988) Growth rate of Jamaican coral
reef sponges after Hurricane Allen. Biol Bull 175:175–179. doi:
10.2307/1541905
Winsor CP (1932) The Gompertz curve as a new growth curve. Proc
Natl Acad Sci USA 18:1–8. doi:10.1073/pnas.18.1.1
Wulff JL (1985) Patterns and processes of size change in Caribbean
Demosponges of branching morphology. In: Rutzler K (ed) New
perspectives in sponge biology. Smithsonian Institution Press,
Washington, pp 425–435
Zea S (1993) Cover of sponges and other sessile organisms in rocky
and coral reef habitats of Santa Marta, Colombian Caribbean
Sea. Caribb J Sci 29:75–78
Mar Biol (2008) 155:159–171 171
123


![The Redwood gazette. (Redwood Falls, Minn.), 1925-06-17, [p ]. · 2019-10-27 · THE REDWOOD GAZETTE, REDWOOD FALLS, MINNESOTA The Redwood Gazette prints wedding an- nouncements or](https://img.pdfslide.us/doc/110x75/5fa04f2ead664330d06ddb4a/the-redwood-gazette-redwood-falls-minn-1925-06-17-p-2019-10-27-the.jpg)


![The Redwood gazette. (Redwood Falls, Minn.), 1921-10-05, [p ]](https://img.pdfslide.us/doc/110x75/61e75daafb034a33595cb385/the-redwood-gazette-redwood-falls-minn-1921-10-05-p-.jpg)


![The Redwood gazette. (Redwood Falls, Minn.), 1933-07-27, [p ]](https://img.pdfslide.us/doc/110x75/62986ea183583b25e317e403/the-redwood-gazette-redwood-falls-minn-1933-07-27-p-.jpg)


![The Redwood gazette. (Redwood Falls, Minn.), 1915-09-29, [p ]](https://img.pdfslide.us/doc/110x75/6173cad0f9943f0e6327a621/the-redwood-gazette-redwood-falls-minn-1915-09-29-p-.jpg)